Embed Size (px)
Citation preview

2017ANNUAL REPORT
SWINBURNE UNIVERSITY OF TECHNOLOGY
CELEBRATING 25 YEARS OF UNIVERSITY EDUCATION
1992 – 2017

Swinburne University of Technology
ANNUAL REPORT
Acknowledgement of Country
We respectfully acknowledge the Wurundjeri People, and their Elders past and present, who are the Traditional Owners of the land on which Swinburne’s Australian campuses are located in Melbourne’s east and outer–east.
We are honoured to recognise our connection to Wurundjeri Country, history, culture and spirituality through these locations, and strive to ensure that we operate in a manner that respects and honours the Elders and Ancestors of these lands.
We also acknowledge the Traditional Owners of lands across Australia, their Elders, Ancestors, cultures and heritage.
Contents
Vision, Strategy, Swinburne Behaviours, Commitment AR:2
From the Chancellor AR:4
From the Vice-Chancellor AR:6
About Swinburne AR:8Swinburne’s 25th Anniversary AR:10
University governance AR:16Council AR:16
Strategic plan and performance AR:192025 Strategic Plan AR:19Future-ready learners AR:20Research with impact AR:22Students and staff AR:24Sustainability and resource usage AR:26
Statutory reporting AR:27
Statutory and Finance Report SFR:1
Disclosure Index SFR:64

ABN 13 628 586 699CRICOS Provider 00111D
Hawthorn Campus
John Street Hawthorn Victoria 3122 Australia
PO Box 218 Hawthorn Victoria 3122 Australia
Telephone +61 3 9214 8000
Facsimile +61 3 9214 5454
www.swinburne.edu.au
Transmission Letter
14 March 2018
The Hon. Gayle Tierney MP Minister for Training and Skills Level 1 2 Treasury Place East Melbourne VIC 3002
Dear Minister,
In accordance with the requirements of regulations and financial reporting directions under the Financial Management Act 1994, I am pleased to submit for your information and presentation to Parliament the Swinburne University of Technology Annual Report for the year ending 31 December 2017.
The Swinburne University of Technology Council approved the Annual Report at its meeting on 14 March 2018.
Yours sincerely
Mr Graham Goldsmith Chancellor
2017 ANNUAL REPORT AR :1

VISION, STRATEGY, SWINBURNE BEHAVIOURS, COMMITMENT
VisionA world class university creating social and economic impact, through science, technology and innovation.
Strategy to 2025Swinburne continues to persevere in its commitment to not only provide, but transform education, through strong industry engagement, social inclusion, a desire to innovate and above all, a determination to create positive change. The 2025 Strategy will enable this through developing future-ready learners, creating research with impact and acting as an innovative enterprise.
Swinburne BehavioursStaff at Swinburne care about behaviours that build positive relationships: to communicate, listen and learn, collaborate, trust and act.
CommunicateSay it – have the conversation, respect each other’s differences, give meaningful feedback and share honestly and openly.
Listen and learnHear it, learn from it – learn from one another, actively listen to each other, resolve conflict and be innovative.
CollaborateShare it – work constructively together with a common purpose to achieve the University’s goals.
TrustTrust it – be open to and with others, act with fairness and respect, inspire positive expectations and communicate honestly.
ActDo it – have a strong sense of immediacy, take practical action and see it through.
SWINBURNE UNIVERSITY OF TECHNOLOGYAR :2

CommitmentSwinburne is a world-class university focused on creating impact. We are committed to transforming the future of education by giving students the knowledge, adaptability and experience they need to make a lasting impact on the workplace of tomorrow.
We create future-ready graduates by taking our students outside of the conventional classroom, introducing them to new and different ways of learning and thinking. It comes from hands-on experience, industry leaders, from the world around us, and from one another.
Our commitment to knowledge is driven by our research and focused on making real-world impact, transforming our global and local communities. As a trusted and respected world-class leader in research excellence, we are determined to make a real difference to the communities we serve.
We do all this by creating a space where ideas are made and the future is imagined, where the brave and the adventurous from local communities and from around the world are supported to push the boundaries of what is into what it can be.
This is our commitment to our students. Those in higher education, those undertaking pathways and vocational education, those who are just starting out or mastering their field.
No matter who they are or how they want to drive their future – we will help them fulfil their goals in a connected world.
2017 ANNUAL REPORT AR :3

The 2025 Strategic Plan introduced early in 2017 will lead Swinburne into the future with its focus on graduating students ready for the careers of the future, and on transformative research.
The technology-led approach to delivery of our strategy reflects that, as we celebrated our 25th year as a university in 2017, we are at heart a technology-driven education provider remaining true to our original purpose at inception 100 years ago as a technical college.
Swinburne has improved its position in the international rankings in 2017 and is now ranked among the world’s top 350 universities by the Academic Ranking of World Universities and in the top 150 under 50 by the Times Higher Education World University Rankings. This positions Swinburne in the top three per cent of universities worldwide.
We continue to build our research capabilities with the launch in 2017 of four research institutes, which facilitate multidisciplinary and interdisciplinary research collaboration. These institutes highlight Swinburne’s strengths across a broad range of fields, including health, design, engineering, science, mathematics, technology, social sciences and manufacturing. Our joint research centres across the globe continue to increase the strength, scale and reach of Swinburne’s research endeavours.
I am pleased to present Swinburne’s 2017 Annual Report on behalf of the Swinburne University Council.
The report provides an opportunity to reflect on Swinburne’s achievements for the year.
“Swinburne is ranked among the world’s top 350 universities by the Academic Ranking of World Universities and in the top 150 under 50 by the Times Higher Education World University Rankings. This positions Swinburne in the top three per cent of universities worldwide.”
FROM THE CHANCELLOR
SWINBURNE UNIVERSITY OF TECHNOLOGYAR :4

Internationally, Swinburne’s Sarawak campus continues to build on its reputation as a university of choice in South-East Asia. Our reputation was further cemented when we signed a Memorandum of Understanding with the State government of Sarawak in Malaysia to strengthen research collaboration in areas strategically aligned with the digital economy agenda. We expanded our international footprint with new research collaborations with universities in Israel and China and announced that Swinburne will deliver offshore PhDs in Hong Kong and China.
Financially, the University reported a net surplus of $104.0 million compared with $20.2 million in 2016. The increase was due to the sale of 30 per cent of the University’s 50 per cent holding in Online Education Services (OES) along with underlying student revenue growth of 7 per cent as a result of higher student load (equivalent full time student load – EFTSL). We also commenced a strategic investment program which will support us in our strategic path towards 2025 including campus infrastructure, digital technology and research, which together will transform the student experience, as well as leveraging our research capability for global outcomes.
Swinburne is a world-class university with a global reputation. Thanks to our commitment to industry involvement, throughout 2017 we have continued to produce highly skilled graduates who are confident, technically competent, and well prepared for their professions.
On behalf of Swinburne University Council, I would like to thank Vice-Chancellor Professor Linda Kristjanson AO and her Executive Team for their passion, hard work and dedication to Swinburne and its community.
We look forward to striving for continued success in 2018.
Graham Goldsmith Chancellor and Chair, University Council
FOURSwinburne research institutes launched in 2017
2017 ANNUAL REPORT AR :5

In March 2017, we introduced our 2025 Vision and Strategy, which will guide us through the following eight years and focuses on Future Ready Learners, Research with Impact and Innovative Enterprise.
Our people continued to lead the way, with two of our academics winning the prestigious national award for science, the Eureka Prize. Two Swinburne academics won a prominent national Education Technology Award for a mobile app developed to enable student learning. And two of our academics were recognised for exceptional teaching at Australia’s highest awards for university academics.
We continued our commitment to educating career-ready graduates with the launch of several new courses co-designed with our industry partners. These courses are part of a suite of Swinburne programs designed to help our students be among the most employable graduates in the country. These include our revolutionary Engineering Practice (Honours) Degree, offering an alternative to traditional teaching and assessment approaches in engineering, our Bachelor of Nursing program, where students will learn with both real-life and simulated patients, and our Bachelor of Sport and Exercise Science with its state of the art facilities.
Swinburne also re-asserted ourselves as a world leader in entrepreneurial education with the relaunch of the Australian Graduate School of Entrepreneurship and our renowned Master of Entrepreneurship and Innovation.
During the past year, Swinburne has become the fastest growing provider of online education in Australia, providing learning opportunities to students who would not otherwise have had the chance to undertake a tertiary education.
I am pleased to present Swinburne’s 2017 Annual Report. It has been a memorable year for the University as we mark a key milestone in our history.
In 2017, Swinburne celebrated its 25th year as a university and as I look back over our celebration year, I am incredibly proud of the many achievements of our university, our staff and, of course, our students.
FROM THE VICE‑CHANCELLOR
Swinburne has become the FASTEST GROWING PROVIDER OFONLINE EDUCATIONIN AUSTRALIA
SWINBURNE UNIVERSITY OF TECHNOLOGYAR :6

Among our achievements, our Swinburne students won seven awards
at the 2017 Melbourne International Flower and Garden Show.
Among our achievements in our Pathways and Vocational Education division in 2017 was forming our world-leading partnership with Siemens to provide apprenticeships in roles in Industry 4.0 manufacturing environments.
Supporting Research with Impact, we launched four of our five research institutes, cementing the pillars of Swinburne’s forward-looking research strategy. The Data Science Research Institute, Iverson Health Innovation Research Institute, Smart Cities Research Institute, and the Social Innovation Research Institute, launched in 2017, joined the Manufacturing Futures Research Institute, launched in 2016.
Indigenous knowledge and culture continue to be important to us at Swinburne. Our commitment to Aboriginal reconciliation education and training was further emphasised with the launch of our second Reconciliation Action Plan (RAP). The RAP was endorsed by Reconciliation Australia at ‘Elevate’ status. This is the highest endorsement possible and I am proud that Swinburne is the first university in Australia to achieve this level. We are now among only three per cent of organisations across the country to have our RAP attain ‘Elevate’ status.
And this year, Swinburne became the first university to be recognised by the Victorian Government for its outstanding contributions to the State’s multicultural community.
Thank you to all our energetic, passionate and talented staff for their dedication and commitment to our students and our ground-breaking research programs during 2017.
The year ahead will be an exciting time for Swinburne as we further implement our 2025 strategy towards a world-class university.
Professor Linda Kristjanson AO Vice-Chancellor and President
Swinburne became the first university to be recognised by the Victorian Government for its outstanding contributions to the State’s multicultural community.
2017 ANNUAL REPORT AR :7

ABOUT SWINBURNE
Swinburne University of Technology is a world-class university creating social and economic impact, through science, technology and innovation.
Swinburne’s close ties with industry provide students with opportunities for valuable workplace experiences during their studies. Industry representatives inform, shape and challenge the curriculum. We continue to lead the sector in our approach to work placements and industry links with the Swinburne Advantage program, offering a consistent and comprehensive Work-Integrated Learning program with more opportunities to be involved.
Research
Swinburne researchers have a reputation for high quality research with strengths in astronomy, physics, engineering, materials science, computer science and information technology, design and innovation, health sciences, neuroscience, and mental health.
Objectives and functions
The university’s objectives and functions are detailed in the Swinburne University of Technology Act 2010. The act is available at:
https://tinyurl.com/SwinAct
Our history
The Hon. George and Ethel Swinburne founded Swinburne more than 100 years ago as the Eastern Suburbs Technical College. Our first students enrolled in classes including woodwork, science and mathematics. In 1963, we led the way with one of the first industrybased learning programs and from the 1970s we offered degrees in engineering, accounting, chemistry and arts.
On 1 July 1992, by an Act of the Victorian Parliament, Swinburne gained university status. This was the beginning of a period of growth and innovation that continues today.
Our campuses
Swinburne has three campuses located in the eastern suburbs of Melbourne at Hawthorn, Croydon and Wantirna. The National Institute of Circus Arts is located in Prahran and we have a campus in Sarawak, Malaysia, connecting us to one of the most rapidly growing regions of the world.
We offer a range of qualifications online through Swinburne Online and Open Universities Australia. Swinburne Online began in 2012 through a successful joint venture partnership with Seek Ltd to create educational opportunities for students unable to study on campus.
Ratings and rankings
Swinburne has become one of the world’s leading universities. We rank among the world’s top 350 universities by the Academic Ranking of World Universities and in the top 150 under 50 by the Times Higher Education World University Rankings. This positions Swinburne in the top three per cent of universities worldwide. We also rank in the top 100 universities under 50 years old by the QS World University Rankings.
Teaching
As a dual-sector university, we have two main teaching areas: higher education, and pathways and vocational education. We offer courses in a broad range of disciplines, from apprenticeships to PhDs. These include arts and humanities, aviation, built environment and architecture, business, design, education, engineering, English language and study skills, film and television, games and animation, health sciences, occupational therapy, nursing, bio-medical sports science, psychology, information technology, law, media and communications, and science.
SWINBURNE UNIVERSITY OF TECHNOLOGYAR :8

On 1 July 1992, Swinburne gained
UNIVERSITY STATUS
Swinburne was founded more than 100 years ago as the Eastern Suburbs Technical College. Our first students enrolled in classes including woodwork, science and mathematics.
2017 ANNUAL REPORT AR :9

SWINBURNE’S 25TH ANNIVERSARY
In 2017, Swinburne marked an important milestone – our 25th anniversary as a university.
We take great pride in the knowledge that Swinburne first opened its doors in 1908 as Eastern Suburbs Technical College. On 1 July 1992, by an Act of Victorian Parliament, Swinburne gained university status.
Our 25th anniversary celebrations reflected on the many remarkable achievements of our alumni and staff, and the commitment of our wider community to supporting Swinburne.
The visionaries
Professor Michael GildingPro Vice-Chancellor, Faculty of Business and Law
Dr Andrew PetersLecturer in Indigenous Studies and Tourism
Professor Matthew BailesDirector, ARC Centre of Excellence for Gravitational Wave Discovery
Professor Baohua JiaResearch Leader, Centre for Micro-Photonics
The trailblazers
our peopleour achievementsour future
We shared the journeys of just some of the people – visionaries, trailblazers, connectors and challengers – who have helped to shape Swinburne. Their achievements, courage, determination and creativity demonstrate the unique stories and capabilities of the university.
We began our 25th anniversary festivities in July with staff events across three of our Melbourne campuses. We celebrated our international connections at our Sarawak campus, and at events with alumni and partners in Singapore and Malaysia.
A gala dinner, held in October, was attended by graduates from 1992. Attending were long-serving staff, donors, industry partners, former chancellors and vice-chancellors, and current and former members of Council.
Our 2017 Vice-Chancellor’s Awards recognised the work of many who are going above and beyond to create social and economic impact in the communities in which we serve.
ABOUT SWINBURNE
SWINBURNE UNIVERSITY OF TECHNOLOGYAR :10

We remembered the legacy of our visionaries, the people who helped to shape Swinburne’s growth from its days as a fledgling university to its status today as a world-class institution.
We raised our glasses to the trailblazers who have made ground-breaking discoveries in areas as distinct as astrophysics, biotechnology and chemistry, to neuropsychology, psychiatry and energy sustainability.
We uncovered and acknowledged the connectors among us who work tirelessly behind the scenes to weave a tapestry between our industry partners, our students, staff and alumni to build and strengthen diversity and expand our reach.
We saluted the challengers, those innovative individuals who have reimagined the boundaries of what is possible and forged new ground.
We thank our visionaries, our trailblazers, our connectors and our challengers for sharing their stories.
In December, we held our inaugural Presidents’ Forum, where we were joined by representatives from our partner institutions and government across Asia and the Middle East. Exploring what it means to be young, ambitious and innovative universities making a difference in the modern world, we also recognised the important role of partnerships and collaborations in Swinburne’s successes.
As we look to the next 25 years, we continue to persevere in our commitment to transform education supported by our vision for future-ready learners, research with impact and innovative enterprise.
swinburne.edu.au/about/our‑university/25‑years
Associate Professor Bruce McDonaldSenior Philanthropy Adviser, University Advancement
Professor Anita KocsisDirector, Design Factory Melbourne
Professor Enzo PalomboChair, Department of Chemistry and Biotechnology
The connectors
Sharon RiceExecutive Director, Major Projects PAVE
The challengers
2017 ANNUAL REPORT AR :11

ABOUT SWINBURNE
Deputy Vice Chancellor Academic
Professor Duncan Bentley
Deputy Vice Chancellor Pathways and Vocational Education (PAVE)
Mr David Coltman
Academic Strategy Implementation
Education and Quality
International
Faculty of Business and Law (PVC Professor Michael Gilding)
Swinburne Business School
Swinburne Law School
Faculty of Health, Arts and Design (PVC Professor Scott Thompson-Whiteside)
School of Arts, Social Sciences and Humanities
School of Design
School of Health Sciences
Faculty of Science, Engineering and Technology (PVC [Acting] Professor Sarah Maddison)
School of Engineering
School of Science
School of Software and Electrical Engineering
PVCs have a dotted reporting line to DVC–R&D for Research Performance
Business Design, Media and ICT
Foundations and Pathways
Health, Science and Community
Trades and Engineering Technology
PAVE Learning and Innovations
PAVE Major Projects
Graduate Research and Research Training
Research Quality
Research Performance and Development
Research Policy and Impact
Research Development, Innovation and Commercialisation
Research insitutes
Manufacturing Futures
Data Science
Iverson Health Innovation
Social Innovation
Smart Cities
Faculty of Engineering and Computing Science
Faculty of Business and Design
Faculty of Language and Communication
University Council
Vice-ChancellorProfessor Linda Kristjanson AO
Deputy Vice Chancellor Research and Development
Professor Aleksandar Subic
Deputy Vice Chancellor and CEO Sarawak
Professor John Wilson
Organisational chart
The organisation chart below represents Swinburne’s management, educational and research structure at 31 December 2017. Current versions of the organisational chart are available on Swinburne’s website
SWINBURNE UNIVERSITY OF TECHNOLOGYAR :12

Student engagement
Government relations
Collaborations and Partnerships
Multicultural engagement
Professional placements
Swinburne Professional
Swinburne Student Life
University Advancement
Internal communications
Organisational development
Workplace relations and health, safety and wellbeing
Marketing, recruitment and channel integration
Students and academic services
Media and external communications
Student admin and library services
Governance and Legal
Finance*
Information Technology
Strategy and Commercial
Facilities and Services
Business Analytics
* CFO has a dotted reporting line to the Vice‑Chancellor and President
Vice President Engagement
Ms Jane Ward
Vice President People and Culture
Ms Rita Cincotta
Vice President Students
Dr Andrew J Smith
Chief Operating Officer
Mr Andrew Field
2017 ANNUAL REPORT AR :13

Senior executives
Professor Linda Kristjanson AO, as the university’s Vice-Chancellor and President, guides the vision for Swinburne’s leadership in science, technology and innovation. Our executive team members are experts in education and their field of specialisation. They help Swinburne achieve its vision through their dedication to high-quality education, service and experience.
Deputy Vice‑Chancellor, Research and Development, Professor Aleksandar SubicFIEAus, FSAE FIEF, BEng (Mech) (Hons), MEngSci, PhD (University of Belgrade)
Pro Vice‑Chancellor, Faculty of Health, Arts and Design, Professor Scott Thompson‑WhitesideBA (Hons) (University of Bristol), MA (Middlesex University), PhD (Melbourne), MDIA
Deputy Vice‑Chancellor, Academic, Professor Duncan BentleyBA, LLB (University of Cape Town), LLM (University of London), LLM (Corporate & Commercial), PhD (Bond), FAAL, FCA, CTA, GAICD, Hon Fellow SAIT
Pro Vice‑Chancellor (acting), Faculty of Science, Engineering and Technology, Professor Sarah MaddisonBSc (Hons), PhD (Monash), FASA
Deputy Vice‑Chancellor and CEO Swinburne Sarawak (December), Professor John L WilsonBEng (Hons) (Monash), MSc (University of California), PhD (Melbourne), FIEAust, CPEng
Vice‑Chancellor and President, Professor Linda Kristjanson AOBN (Manitoba), MN (Research) (Manitoba), PhD (Arizona), FAICD, FTSE
Pro Vice‑Chancellor, Faculty of Business and Law, Professor Michael GildingBA (Hons) (ANU), PhD (Macquarie)
Deputy Vice‑Chancellor and CEO Swinburne Sarawak (January – November 2017), Professor Janet GregoryBA (Melbourne), BSocWk (La Trobe), MSocWk (La Trobe), PhD (SUT), GAICD, PFHEA
Vice‑President, People and Culture, Ms Rita CincottaBBusiness Arts (SUT), M Industrial & Employee Relations (Monash)
Deputy Vice‑Chancellor, PAVE, Mr David ColtmanMEd (Hons) (Massey University), MPA (Hons) (Victoria University of Wellington)
Chief Operating Officer, Mr Andrew Field BBus (Acct), BBus (Comp) (Philip Institute of Technology), FCPA
Chief Financial Officer, Ms Fiona SchuttBBus (Acct), MBA (Leadership) (RMIT), CPA (CPA Australia)
Vice‑President, Students, Dr Andrew J. SmithBSc (Hons), PhD (Melbourne), GradCert BA (SUT), GAICD
Vice‑President, Engagement, Ms Jane WardBA (Hons) (Monash), GAICD
ABOUT SWINBURNE
SWINBURNE UNIVERSITY OF TECHNOLOGYAR :14

Pro Vice-Chancellors
Swinburne’s Pro Vice-Chancellors lead the strategic areas of the university, including research, education and student advancement.
Pro Vice‑Chancellor, Student Engagement, Professor Glen BatesBCom BA (Hons), MA (ClinPsych), PhD MAPS (Melbourne)
Pro Vice‑Chancellor, Research Commercialisation, Professor Matthew CuthbertsonBSc (Hons) (UQ), PhD (UQ), M Intellectual Property Law (Melbourne), FTSE. FRACI, FAICD, FIML
Pro Vice‑Chancellor, Research Quality, Distinguished Professor Qing‑Long HanBSc (Shandong Normal University), MEng (East China University of Science and Technology), PhD (East China University of Science and Technology)
Pro Vice‑Chancellor, International Research Engagement and Development, Deputy Vice‑Chancellor and CEO Swinburne Sarawak (September–November 2017) (acting), Professor Ajay KapoorBTech (Mechanical Engineering) (BHU, India), MTech (Mechanical Engineering) (BHU, India), PhD (University of Cambridge)
Pro Vice‑Chancellor, International, Professor Monica KennedyBA (COMM), MEd Leadership, PhD, Grad Cert HE (Canberra)
Pro Vice‑Chancellor, Research Performance and Development, Professor Alan Kin‑tak LauBEng (Hons) (RMIT), MEng (RMIT), PhD (The Hong Kong Polytechnic University)
Pro Vice-Chancellors Academic and Student Engagement from left to right: Professor Chris Pilgrim, Professor Monica Kennedy, Professor Glen Bates and Professor John Wilson. Absent: Professor Janet Gregory.
Pro Vice-Chancellors Research standing from left to right: Professor Alan Lau, Professor Bernadine Van Gramberg and Professor Qing-Long Han. Sitting from left to right: Professor Ajay Kapoor, Professor Matthew Cuthbertson and Professor Beth Webster.
Pro Vice‑Chancellor, Education and Quality and Deputy Chair, Academic Senate, Professor Chris PilgrimBScEd (MCAE), GradDipAppSc (Comp Sci), MAppSc (Info Tech), PhD (SUT), GAICD, FACS
Pro Vice‑Chancellor, Graduate Research and Research Training, Professor Bernadine Van GrambergBSc (Hons) (Melbourne), LLB (VU), Grad Dip Dispute Resolution and Judicial Administration (Melbourne), Grad Dip Industrial Relations (Melbourne), Grad Dip Education and Training (VU), MSc (Melbourne), PhD (Monash)
Pro Vice‑Chancellor, Research Policy and Impact, Professor Beth WebsterBachelor of Economics (Hons) (Monash), Master of Economics (Monash), PhD (University of Cambridge)
Pro Vice‑Chancellor, Academic Strategy Implementation (January–November 2017), Professor John L WilsonBEng (Hons) (Monash), MSc (University of California), PhD (Melbourne), FIEAust, CPEng
2017 ANNUAL REPORT AR :15

Swinburne’s governance is overseen by:
Council: Council is the governing body of the university and is responsible for the general direction and superintendence of the university. The chancellor is the chair of Council. The primary responsibilities of Council and its powers and functions are listed in the Swinburne University of Technology Act 2010.
Council has three standing committees: the Resources Committee, the Executive and Remuneration Committee, and the Audit and Risk Committee.
Academic Senate: A primary responsibility of Council under the Act is to oversee and monitor the academic activities of Swinburne. To this end, the Act requires Council to establish an academic board. In this way, the Academic Senate stands as a statutory body with functions and powers relating to academic matters such as accreditation, quality and policy. The Academic Senate is the peak academic body within the university and was established by Council effective 1 January 2011.
The Vice-Chancellor: The Vice-Chancellor is the President and Chief Executive Officer of the university, generally responsible for the conduct of Swinburne’s affairs in all matters.
Directors and officers liability protection: During the reporting period, Swinburne maintained a Directors’ and Officers’ Liability Policy for Council members, senior officers and directors of its subsidiaries.
Council members: Standing left to right: Ms Renée Roberts, Mr David Singleton AM, Mr Alan Schwartz AM, Mr Andrew Dix, Ms Catherine Rojas. Sitting left to right: Mr Anthony Mackay AM (Deputy Chancellor), Mr Adnan Islam, Professor Linda Kristjanson AO (Vice‑Chancellor), Mr Graham Goldsmith (Chancellor), Ms Geraldine Farrell and Ms Vi Peterson. Absent: Professor Bernadine Van Gramberg and Ms Kirsten Mander.
UNIVERSITY GOVERNANCE
Council
The Council is the University’s governing body.
The Council’s annual business schedule addresses its responsibilities under the Act, the corporate governance standards auspiced by the Tertiary Education Quality and Standards Agency (TEQSA) and good practice codes such as the Voluntary Code of Best Practice for the Governance of Australian Universities.
The Council’s responsibilities include:
• approving the mission and strategic direction of the University
• appointing and monitoring the performance of the Vice-Chancellor as chief executive officer of the University
• overseeing and reviewing the management and performance of the University
• approving the University’s budget and business plan
• overseeing risk management across the University
• overseeing the academic activities of the University
• approving significant commercial activities and systems of control and accountability.
Compliance with responsibilities under legislation and codes
The 2017 review confirmed that the Council meets all of its obligations under relevant legislation and codes, including:
• Swinburne University of Technology Act 2010
• the governance and accountability standards specified by TEQSA
• the Voluntary Code for Best Practice in Governance of Australian Universities
• the Swinburne University Council Charter.
SWINBURNE UNIVERSITY OF TECHNOLOGYAR :16

Council members’ attendance at Council and committee meetings
Meetings Attended In 2017Council
(7 Meetings)
Audit and Risk Committee (4 Meetings)
Executive and Remuneration Committee
(1 Meeting)
Resources Committee (5 Meetings)
Mr Graham GOLDSMITH 7 4 1 5
Professor Linda KRISTJANSON AO 7 4 (in attendance) 1 5
Professor Bernadine VAN GRAMBERG 6 N/A N/A N/A
Ms Geraldine FARRELL 6 N/A 1 5
Ms Vi PETERSON 7 N/A N/A 5
Ms Kirsten MANDER 6 4 N/A N/A
Ms Renée ROBERTS 6 4 N/A 5
Mr Anthony MACKAY AM 6 N/A 1 4
Mr David SINGLETON AM 7 4 N/A N/A
Mr Andrew DIX 7 4 1 N/A
Mr Alan SCHWARTZ AM 6 N/A 1 N/A
Ms Catherine ROJAS 7 N/A N/A N/A
Mr Adnan ISLAM 6 N/A N/A N/A
Council Boards and Committees
Statutory Board of the University Committees of Council
Academic Senate(Chair: Professor Bernadine Van Gramberg)
Audit and Risk Committee Chair: Mr Andrew DixResources Committee Chair: Ms Geraldine FarrellExecutive and Remuneration Committee Chair: Chancellor, Mr Graham Goldsmith
Academic Regulation and Policy Committee Chair: Professor Scott Thompson-WhitesideAcademic Quality and Standards Committee Chair: Ms Sharon RiceAcademic Senate Steering Committee Chair: Professor Bernadine Van GrambergAcademic Senate Courses Committee Chair: Professor John Wilson (January–November Chair: Professor Chris Pilgrim (December)Research Policy and Quality Committee Chair: Professor Aleksandar Subic
Standing Committees
Council
2017 ANNUAL REPORT AR :17

SWINBURNE AT A GLANCE
Students Higher Education Vocational Education1
Student headcount/load 2015 2016 20172 2015 2016 2017
Total student headcount 37,910 39,550 42,147 21,523 18,114 16,322Accredited VET courses – – – 21,523 19,689 18,208Total student contact hours (SCH) – – – 5,064,134 5,213,755 5,180,460Total student load (EFTSL)3 23,567 24,320 26,280 7,034 7,241 7,195
By funding source (EFTSL) Government Funded 15,156 16,110 17,606 3,841 4,397 4,634Full fee-paying (domestic) 1,442 1,318 1,145 2,297 1,788 1,657International (onshore) 3,569 3,874 4,290 826 929 677International (offshore, excluding Sarawak) 336 395 447 70 127 227Sarawak (approximate) 3,064 2,623 2,792 – – –By level of course (EFTSL) Postgraduate research 744 719 788 – – –Postgraduate coursework 3,096 3,127 3,308 57 42 26Undergraduate4 19,727 20,345 22,071 – – –Associate Degree/Degree – – – 1Advanced Diploma/Diploma – – – 2,555 2,827 3,091Certificate – – – 3,268 3,158 3,028Other5 – 129 113 1,154 1,214 1,050By campus (EFTSL)6 Croydon – – – 1,315 1,208 1,116Hawthorn 13,653 13,834 14,506 2,754 3,158 3,100Melbourne CBD – – – 304 0 0Prahran 64 65 69 41 29 36Wantirna – – – 1,231 1,199 1,297Offshore (excluding Sarawak) – – – 70 127 227Sarawak, Malaysia 3,064 2,623 2,792 – – –Online and other7 6,786 7,798 8,913 1,319 1,520 1,419By gender (EFTSL) excluding short courses Female 11,366 11,828 12,991 3,100 3,234 3,212Male 12,201 12,486 13,277 3,934 4,004 3,979Unspecified – 6 12 – 3 4By Attendance headcount excluding short courses Full-Time8 22,720 22,762 24,873 2,894 3,425 3,372Part-Time 15,190 16,788 17,274 18,629 14,689 12,950
1 Includes pathways, vocational education, Industry Solutions, SOL and NICA.2 2017 preliminary data, final official data available in May 2018.3 EFTSL = Equivalent Full Time Student Load (student contact hours divided by 720).4 Includes sub-degrees, Bachelor Honours and Swinburne College Unilink Diploma.5 Includes ELICOS, VCE/VCAL and non-certificate enrolments.6 The load figures in Equivalent Full Time Student Load (EFTSL) include delivery offshore for accredited teaching through the nominated Faculty.7 Includes workplace, distance venues and online delivery.8 Full-time = an annual study load of 6 standard units or more, or a study load of 3 standard units or more over half a year.
Staff2017
Full time equivalent staff 2015 2016 2017 Female Male 15–24 25–34 35–44 45–54 55–64 65+
Higher Education: Teaching and Research 753 709 756 290 466 <5 121 217 214 149 52Higher Education: General Staff 205 199 240 157 83 <5 56 70 56 47 8Higher Education: Sessionals 188 202 217 86 131 10 86 43 39 25 14Vocational Education: Teaching 176 191 211 96 115 0 9 39 61 84 18Vocational Education: General Staff 67 67 72 55 17 <5 8 13 21 24 <5Vocational Education Teaching: Sessionals 170 167 156 77 79 <5 17 34 49 42 13Professional Staff 769 786 817 530 287 21 227 230 169 142 28NICA 30 25 20 8 12 0 <5 6 <5 5 <5SSAA 18 19 22 16 6 0 12 8 <5 0 0
University Total 2,376 2,365 2,511 1,315 1,196 40 539 660 615 518 139
NOTE: Swinburne employees have been correctly classified in the workforce data collections. Staff numbers are averaged over the year. Sarawak based staff and Swinburne Online staff are not included.
SWINBURNE UNIVERSITY OF TECHNOLOGYAR :18

STRATEGIC PLAN AND PERFORMANCE
2025 Strategic PlanWhen Swinburne opened its doors in 1908 it was with a simple premise in mind: to provide education to a section of society otherwise denied further education.
More than a century later, Swinburne remains committed to offering transformative education and research through strong industry engagement, social inclusion, a desire to innovate and, above all, a determination to create positive change.
To realise this vision, Swinburne builds its capability by investing in people, processes and systems.
Swinburne 2025 Strategic FrameworkA WORLD CLASS university creating social and economic impact through science, technology and innovation.
FUTURE READY LEARNERS Confident and enterprising learners who create social impact Learners prepared to find and solve complex problems Adaptive learners equipped for careers of the future Learners as global citizens
RESEARCH WITH IMPACT Transforming industries shaping lives and communities Driving innovation built on excellence in science and technology Global in action, presence and reputation
INNOVATIVE ENTERPRISEAgile, resilient and market responsive Flexible, state of the art spaces and infrastructureConnected with business, industry and community Sustainable, inclusive and diverse Globally capable
Helena PowierzaHelena enrolled in a Certificate IV of
Professional Writing and Editing to write a new chapter in her story.
2017 ANNUAL REPORT AR :19

FUTURE‑READY LEARNERS
Swinburne is committed to transforming the future of education by providing students with the knowledge, adaptability and experience they need to make a lasting impact on the workplace of tomorrow.
We aim to ensure our students enter the workforce with the confidence, education, skills and experience they need to succeed in a fast-changing world. We do this by focusing on student-centred learning and making sure the courses we offer provide our students with the skills, knowledge and capabilities to be industry-ready and make positive contributions to society.
Higher Education
A major achievement was the launch of a $40 million revamp of the university’s approach to learning and teaching. Building on the work undertaken to restructure and refresh our undergraduate and postgraduate courses in 2015 and 2016, our Transforming Learning Strategy fosters life-long employability skills for Swinburne graduates. We have co-created learning experiences with industry partners, including embedded work-integrated learning opportunities and global experiences.
Our partnerships in the Northern Territory continue to see us deliver programs in remote communities that are genuinely having an impact on lives. Closer to home, our work with migrant communities at our eastern campuses continues to be a cornerstone of our operations.
Swinburne relaunched its revitalised Australian Graduate School of Entrepreneurship (AGSE), re-establishing itself as a world leader in entrepreneurial education.
The Australian Nursing and Midwifery Accreditation Council and the Nursing and Midwifery Board of Australia both accredited the Bachelor Nursing degree. The first cohort of students will commence in the newly developed health precinct in 2018.
Four Swinburne students were among 120 of Australia’s brightest undergraduates awarded prestigious New Colombo Plan (NCP) scholarships by the federal government.
Associate Professor Simone Taffe and Adjunct Associate Professor Andrew Dodd both received Awards for Teaching in Excellence in their respective study areas of communication, design and journalism.
Communication Design graduate Sahra Martin was named Australian Graduate of the Year by the Design Institute of Australia. Ms Martin won the overall Madeline Lester Award of Excellence and was also awarded first prize in the Visual Communication Design category.
Oscar winner Adam Elliot became Swinburne’s Charles Herschell Industry Fellow for 2017. He shared his expert knowledge and extensive experience working within the global film and animation industries.
RoboCats, an all-girls team sponsored by the Swinburne Innovation Precinct, won the South Pacific regional of the FIRST Robotics Competition.
In May, Swinburne announced a four-year partnership agreement with the Richmond Football Club to pave the way for collaborations in research and industry placements, and to provide access to specialist facilities for relevant Swinburne students.The partnership further secures the ongoing work between Swinburne and the Korin Gamadji Institute (KGI), based at Richmond Football Club, to support initiatives and develop and evaluate Indigenous leadership opportunities for the next generation
STRATEGIC PLAN AND PERFORMANCE
SWINBURNE UNIVERSITY OF TECHNOLOGYAR :20

PAVE
Our PAVE partnerships with Siemens and the Ai Group demonstrated the ability to respond to industry needs, be agile, and, in this instance, be world leading. Through this collaboration, the first applied qualifications were developed and delivered that prepare students for paraprofessional roles in Industry 4.0 manufacturing environments.
Swinburne students won seven awards, including an Achievable Gardens Excellence Award at the 2017 Melbourne International Flower and Garden Show. 2017 was Swinburne’s sixteenth year competing in the Achievable Gardens category of the show.
NICA
National Institute of Circus Arts (NICA) students undertook international circus tours in Canada, Russia, and France.
NICA offered three internships in 2017 with Circus Oz, Circus Maxima and Mullum Circus Festival.
As part of a new exchange initiative, performance teacher and trainer Zebastian Hunter travelled to China to direct a student performance of the Beijing International Arts School.
NICA also had the opportunity to partner with Australia’s leading institute in dramatic arts training, the National Institute of Dramatic Arts (NIDA) in its the production of Eurydike + Orpheus in Sydney.
Sarawak
Swinburne Sarawak unveiled a new Centre for Digital Futures with the goal of bringing researchers from different disciplines under one roof to facilitate change.
During 2017, Swinburne Sarawak signed memorandums of agreement with key government departments and organisations to drive the development of research including a partnership with Sarawak Information Systems (SAINS) to develop and implement a digital platform to enhance the socio-economy of local rural communities. The RM2 million agreement focused on research and development in healthcare, digital transportation services and eco-tourism.
A proposal on combating climate from the Sarawak Faculty of Engineering, Computing and Science was among 12 winners of the Big Ideas Competition for Climate Change which promotes collaborative data-driven ideas for climate change monitoring.
Swinburne Sarawak also partnered with ACCA Malaysia to enable undergraduates to complete the ACCA professional qualification before they graduate through the ACCA Accelerate Programme.
Swinburne introduced an innovative Bachelor of Engineering Practice (Honours) degree to commence in 2018 that offers an alternative to the traditional teaching and assessment approaches in engineering.The new course was co-designed with multiple industry partners to ensure future graduates are well prepared to enter an existing company or create their own.
Quitch, a gamified learning app developed by Dr Grainne Oates and Professors Dan Hunter (pictured above, right), won the Education Technology Award at the 2017 Australian Financial Review Higher Education Awards. The app uses gamification principles and interactivity to connect students with their lecturers and engage them in their university study.
In the second half of 2017, Swinburne’s Expanding Global Capability Strategy set aside significant investment to grow the University’s international presence. The shift in focus will see Swinburne International contribute annual revenue of $48 million to the university in 2022, projected to exceed $50 million by 2025.
Swinburne is partnering with Qantas under a new pilot pathway program that will see aviation students eligible to enter the airline’s regional brand, QantasLink, as Turboprop First Officers. Under the Qantas Future Pilot Program, Bachelor of Aviation students will be mentored by experienced pilots during their degree.
2017 ANNUAL REPORT AR :21

At Swinburne, we are dedicated to delivering world-class research that creates both economic and social impact in collaboration with industry, business, community and other partners. Our research addresses issues that relate to contemporary societal challenges, as well as making deep intellectual contributions in fields that drive fundamental discoveries. Our research inspires and excites us, for example through our understanding of the universe and its origins.
The Minister for Education and Training, Simon Birmingham, launched the $31.3 million Australian Research Centre of Excellence for Gravitational Wave Discovery (OzGrav) at Swinburne. A new $4 million supercomputer based at Swinburne was chosen to help OzGrav search for gravitational waves.
Four new research institutes were launched: Data Science Research Institute, Iverson Health Innovation Research Institute, Smart Cities Research Institute and Social Innovation Research Institute. They join the Manufacturing Futures Research Institute as a suite of five institutes that foster interdisciplinary collaboration. The institutes link faculties, research centres and researchers with industry, business and community.
Swinburne launched its Centre for Mental Health with a focus on improving mental health through research, development, training, policy and the dissemination of health information.
RESEARCH WITH IMPACT
The centre will also look at the persisting mental health problems associated with high levels of disability.
Swinburne further cemented its reputation as a world leader in advanced manufacturing when it received a $135 million industrial software grant from engineering giant Siemens. The software grant will be used to digitalise Swinburne’s Factory of the Future, creating Australia’s first fully immersed Industry 4.0 facility.
Swinburne was awarded more than $1.3 million in funding by the National Housing Research Program for research into homelessness, homeownership, social housing and urban productivity.
in 2017 the Analysis and Policy Observatory (APO), celebrated 15 years as an open access knowledge hub and information service, as well as the award of a $1.36M infrastructure grant under the Australian Research Council Linkage Infrastructure and Equipment Scheme.
A world-first online service, ORBIT, designed by Swinburne researchers, was launched to help patients with bipolar disorder.
Swinburne announced the creation of the world’s first graphene certification centre as part of its revolutionary research into graphene and digital manufacturing processes.
Delegates from Swinburne’s partner institutions and government across Asia and the Middle East gathered at our Hawthorn campus for the inaugural Presidents’ Forum. The theme for the two-day event was ‘Shaping our futures: young, ambitious and innovative universities in the modern world’.
In December 2017, the Australian Government’s Cooperative Research Centres (CRC) Projects initiative announced $3.45 million of funding investment in a team of researchers from Swinburne led by Professor Bauhua Jia. In collaboration with Flinders University and industry leaders First Graphene and Kremford, the team will lead research and develop the Bolt Electricity Storage Technology (BEST) battery – a graphene oxide-based supercapacitor offering high performance and low-cost energy storage.
In April 2017, Minister for Corrections, Gayle Tierney officially opened the Catalyst Consortium at Swinburne’s Hawthorn campus, following $1.6 million state government funding. The consortium is conducting world-leading research into serious violent offending.
Engineers, Dr Robin Kalfat, Professor Riadh Al-Mahaidi, Dr Javad Hashemi and Mr Graeme Burnett, won the prestigious W H Warren medal awarded by Engineers Australia for a paper on multi-axis substructure testing.
STRATEGIC PLAN AND PERFORMANCE
SWINBURNE UNIVERSITY OF TECHNOLOGYAR :22

Researchers Professor Elena Ivanova and Professor Saulius Juodkazis won the prestigious 2017 UNSW Eureka Prize for Scientific Research.
Offshore PhDs will be offered in Hong Kong and China under a new agreement between Swinburne and the Hong Kong Productivity Council. The strategic Research Collaborative Agreement, signed with the Hong Kong Productivity Council (HKPC), will allow Swinburne to deliver offshore PhDs in collaboration with HKPC in Hong Kong and Shenzhen in China.
The Fire Station was redeveloped to create the Innovation Precinct, producing state-of-the-art facilities in a heritage-listed building. This building is a collaborative co-working and prototyping space, which is home to Design Factory Melbourne, a business incubator and acceleration program, an entrepreneur-in-residence, Intellectual Property (IP) clinic, and collaboration spaces.
Publications in quality research journals were up in 2017, notably in the journals indexed by Scopus (up 6 per cent to 1654 publications), while publishing in journals included in the Nature Index, and the Clarivate ‘Science Citation Index Expanded’ (SCI-EXP) and Social Sciences Citation Index (SSCI) listings continued to be strong.
Rankings
Swinburne continues to earn a reputation for high-impact, high-quality research. Our international reputation was enhanced by a strong performance in the research-based 2017 Academic Reputation World University (ARWU) rankings, where we improved by almost 100 ranking places (from 434 in 2016 to 337 in 2017), the highest improvement rate in Australia. In other international university ranking schemes based largely on research performance we also achieved our highest performance to date.
This included being ranked 55 in the world by the CWTS Leiden Ranking based on the proportion of our papers in the top 1 per cent for citation performance and top 420 by the Times Higher Education World University Rankings.
Swinburne was ranked in the top 300 universities in physical science by the Times Higher Education subject rankings. This is the first time it has been recognised in this category.
Higher Degree by Research 2013 2014 2015 2016 2017*
Students (EFTSL) 736 650 794 719 773Completions 141 131 141 132 154
Number of research publications 2013 2014 2015 2016 2017*
Scopus 1,202 1,384 1,261 1,561 1,654SCI-EXP 607 768 803 800 837SSCI 135 235 267 236 236
Research income ($ millions) 2013 2014 2015 2016 2017*
Category 1 (Australian Competitive Grants) 13.1 13.2 12.4 11.4 13.2Category 2-4 (Research contracts, tenders, philanthropy and co-operative research centre income)
9.5 9.7 12.4 14.1 17.0
Total research income (HERDC reported) 22.6 22.9 24.8 25.5 30.2
* Indicative result pending HRDC audit finalisation in June 2018.
2017 ANNUAL REPORT AR :23

STUDENTS AND STAFF
Learning and teaching
Swinburne maintains a strong commitment to quality student outcomes and teaching and learning experiences. The University continues to improve delivery of flexible and quality education that is student-focused, as exemplified in recent results in the following national performance indicators.
Swinburne’s student commencements and enrolments in higher education have continued to increase, attributable to our range of our study options and delivery modes available, including online. The positive trend for completions, particularly in the undergraduate space, has continued to increase year on year.
Diversity and Inclusion
Diversity and inclusion are important aspects of the culture at Swinburne and the university is committed to an environment where all staff and students feel welcomed, included and celebrated for their diversity.
The Workplace Gender Equality Agency (WGEA) recognised Swinburne as employer of choice for gender equality for the eighth consecutive year.
Swinburne was the first educational institution in Australia to launch its own Financial Inclusion Action Plan (FIAP) to support students of all different backgrounds and help them continue their studies. More than 300 students have received equity grants and scholarships as part of the program.
The FIAP aims to address financial exclusion by introducing initiatives that support students enduring financial hardship.
Swinburne is now amongst two per cent of organisations across Australia to have their Reconciliation Action Plan upgraded to ‘Elevate’ status. This RAP 2017–2019 is focused on seven key interrelated areas: governance, culture, Indigenous staff, Indigenous students, engagement, teaching and learning, and research.
Swinburne received a high commendation in the Business category at Victoria’s 2017 Multicultural Awards for Excellence held at Government House. Swinburne was recognised for having a culturally diverse staff and student body as well as being the first Australian university to commit to a Charter and Objectives of Cultural Diversity.
In August, NICA staff and students headed to Kintore in the Northern Territory to participate in the Red Dust Healthy Living Program. The program focuses on school-based health development. Working within schools, they offered teacher support in the classroom, conducted circus workshops and helped to build a garden in each school.
Close to 150 engineers, designers, developers and health professionals joined forces at Swinburne for the 2017 Tikkun Olam Makers (TOM) Makeathon, to help improve the lives of 12 Australians living with disabilities.
Workforce Inclusion Policy
Swinburne is working towards creating a balanced working environment where equal opportunity and diversity are valued. We have engaged with the Diversity Council of Australia to provide peak body expertise into the development of our Inclusion and Diversity Framework which will include a workforce inclusion policy and measurable targets.
Employment and Conduct Principles
Swinburne is committed to applying merit and equity principles when appointing staff. The selection processes ensure that applicants are assessed and evaluated fairly and equitably on the basis of the key selection criteria and other accountabilities without discrimination. Employees have been correctly classified in workforce data collections.
Employee Relations
Swinburne applied in November to the Fair Work Commission for approval of the new Swinburne University of Technology, Academic & General Staff Enterprise Agreement, and it is expected that the commission will deal with the application in 2018.
The new Swinburne University of Technology – Pathways and Vocational Education Enterprise Agreement 2017 was approved by The Fair Work Commission approved the agreement in December.
STRATEGIC PLAN AND PERFORMANCE
SWINBURNE UNIVERSITY OF TECHNOLOGYAR :24

Staff Engagement
Swinburne was the recipient of the Voice Award for the university with the most significant shift in Your Voice Staff Engagement Survey results for 2017. This award recognised significant improvements in areas such as recognition, research, community engagement, wellness and leadership.
Student Engagement
Swinburne Student Life (formerly The Swinburne Students Amenities) won the 2017 Campus Link National Award for most successful student engagement program. With goals of engendering belonging, creating connections, facilitating experiences and operating sustainably, Swinburne Student Life
coordinated over 82 student clubs and more than 15,000 hours of student volunteering. They also provided student support services, including advocacy, tax help, and legal services. For the first time, Swinburne students participated in the Indigenous University Games.
The first cohort of Welcome Scholarship students began at Swinburne in 2017.Welcome Scholarships were established in recognition of the hardships faced by people seeking asylum. We recognise that asylum seekers arriving in Australia experience significant displacement. Once settled many asylum seekers continue to encounter barriers to accessing education. Welcome Scholarships support study aspirations, increase self esteem, provide an immediate social and community network.
Health, Safety and Wellbeing
Swinburne is fully committed to the principles of occupational health, safety and wellbeing. In 2017 we continued to improve health, safety and wellbeing systems, processes and information which help prevent and minimise the impact of ill health and injury in the workplace.
A new health, safety and wellbeing strategy is under development for 2018–2020. This will improve our focus on enhancing wellbeing for the Swinburne community and promoting a psychologically safe and healthy workplace.
Occupational health and safety 2015 2016 2017
Incident/hazard reports received 273 208 2794
Incident/hazard reports (per 100 FTE) 11.5 8.8 13.64
Notifiable incidents 10 14 10Notifiable incidents (per 100 FTE) 0.4 0.6 0.5Number of lost time injuries 10 15 10Lost time injury frequency rate2 2.15 3.17 1.73Standard claims1, 2 11 11 174
Lost time standard claims1, 2 6 4 2Lost time standard claims (per 100 FTE) 1, 2 0.29 0.20 0.10Average cost per standard claim1, 2, 3 $12,314 $102,9365 $6,598Fatalities 0 0 0
1. Workers Compensation Insurer, Xchanging, supplied data for standardised claims, time lost claims and average costs per claim as at 30 June 2017, with data from 1 July–30 June for each period. Standardised claims are those that have exceeded the employer excess. A lost time standard claim is one with one or more days compensated by the Victorian Work Authority (VWA).
2. Excludes National Institute of Circus Arts and Swinburne Student Life data.3. Claim costs include payments to date plus an estimate of outstanding claims costs (further costs as calculated by the VWA’s statistical case estimate model).4. The number of incidents, hazards and claims received in 2017 has increased on the previous year. This may be attributed to an awareness campaign on the importance of
reporting injuries and hazards throughout 2017.5. Increase in average cost per standard claim for 2016 is due to high estimated future costs for 3 stress‑related claims.
2017 ANNUAL REPORT AR :25

SUSTAINABILITY AND RESOURCE USAGE
STRATEGIC PLAN AND PERFORMANCE
Sustainability database
A new sustainability database has been implemented to capture and house Swinburne’s energy consumption and report on carbon emissions. This database allows us to simplify the monitoring of energy use and more proactively investigate trends that appear out of the ordinary. This tool will enhance our ability to boost operational efficiencies and ultimately reduce carbon emissions.
Closed loop organic recycling
The Hawthorn campus has two closed loop organic recycling machines, which compost all food waste put into them within 24 hours. The SPS food retail outlets and the Wakefield Street student residences make use of the closed loop system. In 2017, these machines diverted approximately 100 kilograms of food waste from landfill per week.
Tri-generation in AMDC
The trigeneration plant in the Advanced Manufacturing and Design Centre (AMDC) was fully commisioned in 2017. Trigeneration is the production of electricity, heat and cooling in the one process. A gas-fired generator produces electricity and heat. The exhaust heat is used to produce chilled water and hot water for air-conditioning through an absorption chiller.
Swinburne’s energy consumption has decreased by 1 per cent from 2016 to 2017, primarily due to the continued roll-out of LED lights across all campuses.
Overall, consumption of energy per on campus equivalent full-time student load (EFTSL) in 2017 was 7.83GJ, which is 0.29GJ lower than 2016.
Resource usage 2013 2014 2015 2016 2017
Annual energy consumption (GJ/EFTSL)^ 7.07 7.55 8.33 8.12 7.05Annual water consumption (kl/EFTSL) 3.27 3.95 4.34 6.15 4.67Waste to landfill (m3) 9,425 9,296 7,819 7,545 8,368Staff travel – by air (M km) 2.47 3.35 3.17 3.32 3.27Staff travel – by road (M km) 0.07 0.05 0.02 0.02 0.02Paper use (reams) 40,824 38,048 21,495 24,791 24,243Paper use (reams/FTE) 17.2 17.8 9.0 9.7 9.7Carbon emissions (tCO2) N/A N/A N/A 53,308 40,290
^ EFTSL: equivalent full time student load
Responsible Investment
Swinburne’s commitment to its Responsible Investment Charter remains an ongoing priority and focus. Progress to date has seen divestment out of tobacco production, armaments and reduction in carbon emissions with our Australian and International equities portfolio. The next area of focus will be considering sustainability themed investments which would allow Swinburne to positively invest in climate solutions and divestment within the bond portfolio of tobacco production and armaments.
Environment
Swinburne continues to work towards the delivery of initiatives encompassing: asbestos removal from, or encapsulated within buildings, installation of energy efficient lighting, heating and cooling as well as installation of additional recycling stations.
Capital infrastructure developments
Significant refurbishments were undertaken at the Hawthorn Campus to provide contemporary postgraduate spaces, modernise residential rooms and apartments, as well as create state of the art nursing labs.
SWINBURNE UNIVERSITY OF TECHNOLOGYAR :26

Attestation on compliance with the ISO Risk Management Guideline
I, Linda Kristjanson AO, certify that Swinburne University of Technology has risk management processes in place consistent with the ISO 31000:2009, Risk management – Principles and guidelines and that an internal control system is in place that enables the executive to understand, manage and satisfactorily control risk exposures. The Audit and Risk Committee verifies this assurance and ensures that the risk profile of the University was critically reviewed within the past 12 months.
Professor Linda Kristjanson AO Vice-Chancellor and President Swinburne University of Technology
14 March 2018
Risk management
Under the Swinburne University of Technology Act 2010, Council maintains responsibility and oversight of the University’s Risk Management Policy and Framework through its Audit and Risk Committee.
The university bases its Risk Management Framework on the ISO 31000:2009, Risk management – Principles and guidelines which ensures continuous improvement in risk management practices, and applies the Victorian Government Risk Management Framework.
STATUTORY REPORTING
The Executive continues to monitor and manage the risk factors internal and external to the University environment with the support of its dedicated Risk Management and Incident Management teams and skilled Risk Network.
Focus continues to be placed on the risks that impact Swinburne’s 2025 strategic objectives, financial position, cyber exposure and business continuity planning, and on the organisation’s performance and sustainability, with robust processes in place to also identify and manage other key risks.
Swinburne’s Risk Management team assesses the effectiveness of our risk processes, systems and capability to ensure standards remain high, the risk management program continues to mature, and that risks impacting Swinburne continue to be identified, prioritised and actively managed.
2017 ANNUAL REPORT AR :27

Freedom of Information Act
During the period 1 January to 31 December 2017, Swinburne received the following applications under the Freedom of Information Act 1982:
Total requests 4Access granted in full 1Access granted in part 0Awaiting a decision 1Withdrawn or abandoned 2Exempt in full (Section 25A) 1Refused 1No documents identified 0Transferred to another agency 0Victorian Civil and Administrative Tribunal appeals
1
Fees and charges collected $27.90
The University has in place procedures to ensure it meets its obligations under the Freedom of Information Act. The University’s Freedom of Information Officer for 2017 was employed in the University Secretariat.
Carers’ Recognition Act 2012
Swinburne acknowledges the important contribution that people in care relationships make to our community.
In 2014, we launched our AccessAbility Action Plan 2015–2020 (AAP). The plan has a clear vision with goals, actions and responsibilities to complement its realisation. Implementing the AAP in Swinburne’s Australian campuses has enabled us to identify and change any practices that could be discriminatory or prevent carers and staff and students living with disability from learning and working with us.
In addition to flexible work arrangements, the Swinburne University of Technology, Academic and General Staff Enterprise Agreement 2015 provides certain leave provisions, such as carer’s leave and foster parent leave (parental leave), to support employees who assume carer responsibilities.
Protected Disclosures
Swinburne has a policy and process for making disclosures, and the management and investigation of disclosures under the Protected Disclosure Act 2012, are set out in our People, Culture and Integrity Policy, which is available at:
swinburne.edu.au/people‑culture‑policy
The Policy recognises Swinburne’s responsibilities under the legislation and the guidelines of the Independent Broad-based Anti-corruption Commission (IBAC).
An independent and confidential Swinburne Disclosure Hotline service was set up in 2013 to support our students and staff in the reporting of any suspected cases of fraud or corrupt conduct. The Swinburne Disclosure Hotline service is available at:
swinburne.stoplinereport.com
Building Act 1993
The University has policies and processes in place to ensure compliance with the building and maintenance provisions of the Building Act 1993 and can confirm that all building works are compliant. Energy Safe Victoria notified Swinburne of a potentially noncompliant electrical cable installed as part of a maintenance activity. We are working with the installation company to address the issue.
Report of Operations
The Swinburne Annual report 2017 was prepared in accordance with the Financial Reporting Directions issued by the Department of Treasury and Finance.
The financial statements of the university were reviewed and recommended by the Audit and Risk Committee prior to finalisation and submission.
National Competition Policy
Swinburne implements and complies with the National Competition Policy, including compliance with requirements of Competitive Neutrality: A Statement of Victorian Government Policy. Training is provided as required for staff involved in the development of contracts.
Costing and pricing models that incorporate competitive neutrality principles are available for use throughout the university.
Additional Information
Subject to the provisions of the Freedom of Information Act 1982, an individual may make a Freedom of Information request for the following information:
• a statement that declarations of pecuniary interests have been duly completed by all relevant officers
• details of shares held by a senior officer as a nominee or held beneficially in a statutory authority or subsidiary
• details of publications produced about the university and how these can be obtained
• details of changes in prices, fees, charges, rates and levies charged
• details of major external reviews• details of major research and
development activities• details of overseas visits undertaken,
including a summary of the objectives and outcomes of each visit
• details of major promotional, public relations and marketing activities undertaken to develop community awareness of the university and its services
• details of assessments and measures undertaken to improve the occupational health and safety of employees
• a general statement on industrial relations within the entity and details of time lost through industrial accidents and disputes
• a list of major committees sponsored by the university
• details of consultancies and contractors.
STATUTORY REPORTING
SWINBURNE UNIVERSITY OF TECHNOLOGYAR :28

Consultancies
Swinburne engaged a wide range of consultants to provide advisory services and information for business developments and to assist in the implementation of new systems.
Consultancies in excess of $100,000
In 2017, there were 9 consultancies where the total fees payable to the consultants was $100,000 or greater. The total expenditure incurred during 2017 in relation to these consultancies was $4,683,584 (excluding GST). Details of these individual consultancies can be viewed at:
swinburne.edu.au/annualreport
Consultancies less than $100,000
There were 36 consultancies where the total fees payable to the consultant was less than $100,000 each during 2017. The total expenditure incurred during the year in relation to these consultancies was $1,317,496 (excluding GST).
Statement on compulsory non-academic fees, subscriptions and charges
In October 2011, the Federal Government passed legislation to allow Australian universities to charge a Student Services and Amenities Fee (SSAF) to all higher education students from 2012.
All students are advised at the time of enrolment that their SSAF is intended to provide additional funding for the provision of important student services and amenities that may include health and welfare services, food, financial advice, accommodation assistance, advocacy, sport, cultural and recreational activities. Revenue from the fee was spent in accordance with the Higher Education Support Act 2003.
The fee charged is for a calendar year and is dependent on enrolment criteria. The maximum SSAF amount payable by a student in 2017 was $298. Eligible students can apply for the government loan scheme, SA-HELP, to defer their SSAF. More information is available at:
swinburne.edu.au/ssaf
Ex-gratia payments
To the best of our knowledge, there were no ex-gratia payments made by the university in 2017.
Summary of significant changes in financial position during 2017
There were no changes in Swinburne’s financial position during 2017.
Events subsequent to balance date which may have a significant effect on operations in subsequent years
There have been no events subsequent to balance date that could materially affect the financial position of the university.
2017 ANNUAL REPORT AR :29

Financial performance including key performance indicators
Summary of financial results (parent entity)
2013 2014 2015 2016 2017 $000 $000 $000 $000 $000
Net assets 760,826 777,843 928,946 943,064 1,064,362Operating surplus (deficit) 49,239 12,406 13,894 21,143 103,870Overseas students revenue 92,530 97,583 102,390 115,723 127,907Commonwealth government grants 156,031 160,558 171,824 177,009 195,904State government grants 35,466 22,961 20,585 21,436 29,868
Summary of financial results (consolidated entity)
2013 2014 2015 2016 2017 $000 $000 $000 $000 $000
Net assets 771,957 789,267 945,019 972,918 1,093,916Operating surplus (deficit) 49,961 12,556 15,349 20,190 104,037Overseas students revenue 93,627 97,612 102,451 115,797 128,039Commonwealth government grants 159,221 163,458 172,961 179,890 198,757State government grants 35,466 22,961 20,585 21,436 30,893
Financial key performance indicators (KPIs)
2013 2014 2015 2016 2017
Current ratio (current assets/current liabilities) 134.80% 126.80% 127.82% 89.87% 89.64%Exposure to long-term debt/liabilities (LT liabilities/total funds) 18.20% 17.80% 14.70% 13.88% 12.92%Retention of reserves (surplus (deficit)/total income) 9.50% 2.00% 2.70% 3.25% 13.91%
STATUTORY REPORTING
SWINBURNE UNIVERSITY OF TECHNOLOGYAR :30

STATUTORY AND FINANCE REPORT (SFR) 2017
Swinburne University of Technology
2017 ANNUAL REPORT SFR :1

STATEMENT BY THE CHANCELLOR, VICE‑CHANCELLOR AND PRINCIPAL ACCOUNTING OFFICER
SWINBURNE UNIVERSITY OF TECHNOLOGY
FINANCIAL REPORT FOR THE YEAR ENDED 31 DECEMBER 2017
STATEMENT BY CHANCELLOR, VICE-CHANCELLOR AND PRINCIPAL ACCOUNTING OFFICER
In accordance with the resolutions of the University Council dated 14 March 2018, the Chancellor, Vice-Chancellor and Principal Accounting Officer on behalf of the University Council, state that in our opinion:
1. The attached financial report presents fairly the financial position as at 31 December 2017 and the financial performance for the year ended 31 December 2017 of the University and the consolidated entity.
2. The attached financial report complies with Standing Direction 5.2 of the Victorian Minister of Finance under the Financial Management Act 1994, Australian Accounting Standards and Interpretations and other authoritative pronouncements of the Australian Accounting Standards Board (AASB) and the Australian Charities and Not-for-profits Commission Act 2012.
3. At the time of signing this statement there are reasonable grounds to believe that the University and the consolidated entity will be able to pay its debts as and when they become due.
4. Australian Government financial assistance during the reporting year was expended in accordance with the purposes for which it was provided.
At the date of signing this statement we are not aware of any circumstances that would render any particulars in the financial report either misleading or inaccurate.
G GOLDSMITH Chancellor
L KRISTJANSON AO Vice-Chancellor
F SCHUTT Principal Accounting Officer
Dated this 14th day of March 2018 Hawthorn
SWINBURNE UNIVERSITY OF TECHNOLOGYSFR :2

Independent Auditor’s Report To the Council of the Swinburne University of Technology
Opinion I have audited the consolidated financial report of the Swinburne University of Technology (the university) and its controlled entities (together the consolidated entity) which comprises the:
consolidated entity and university statements of financial position as at 31 December 2017
consolidated entity and university income statements for the year then ended consolidated entity and university statements of changes in equity for the year then
ended consolidated entity and university statements of cash flows for the year then ended notes to the financial statements, including a summary of significant accounting
policies statement by chancellor, vice chancellor and principle accounting officer.
In my opinion the financial report is in accordance with the financial reporting requirements of Part 7 of the Financial Management Act 1994 and Division 60 of the Australian Charities and Not-for-profits Commission Act 2012 including:
presenting fairly, in all material respects, the financial position of the university and the consolidated entity as at 31 December 2017 and their financial performance and cash flows for the year then ended
complying with Australian Accounting Standards and Division 60 of the Australian Charities and Not-for-profits Commission Regulations 2013.
Basis for Opinion
I have conducted my audit in accordance with the Audit Act 1994 which incorporates the Australian Auditing Standards. My responsibilities under the Act are further described in the Auditor’s Responsibilities for the Audit of the Financial Report section of my report.
My independence is established by the Constitution Act 1975. My staff and I are independent of the university and the consolidated entity in accordance with the auditor independence requirements of the Australian Charities and Not-for-profits Commission Act 2012 and the ethical requirements of the Accounting Professional and Ethical Standards Board’s APES 110 Code of Ethics for Professional Accountants (the Code) that are relevant to my audit of the financial report in Australia. My staff and I have also fulfilled our other ethical responsibilities in accordance with the Code.
I believe that the audit evidence I have obtained is sufficient and appropriate to provide a basis for my opinion.
VAGO – INDEPENDENT AUDITOR’S REPORT
2017 ANNUAL REPORT SFR :3

VAGO – INDEPENDENT AUDITOR’S REPORT
2
Council's responsibilities for the financial report
The Council of the university is responsible for the preparation and fair presentation of the financial report in accordance with Australian Accounting Standards, the Financial Management Act 1994 and the Australian Charities and Not-for-profits Commission Act 2012, and for such internal control as the Council determines is necessary to enable the preparation and fair presentation of a financial report that is free from material misstatement, whether due to fraud or error.
In preparing the financial report, the Council is responsible for assessing the university and the consolidated entity’s ability to continue as a going concern, disclosing, as applicable, matters related to going concern and using the going concern basis of accounting unless it is inappropriate to do so.
Auditor’s responsibilities for the audit of the financial report
As required by the Audit Act 1994, my responsibility is to express an opinion on the financial report based on the audit. My objectives for the audit are to obtain reasonable assurance about whether the financial report as a whole is free from material misstatement, whether due to fraud or error, and to issue an auditor’s report that includes my opinion. Reasonable assurance is a high level of assurance, but is not a guarantee that an audit conducted in accordance with the Australian Auditing Standards will always detect a material misstatement when it exists. Misstatements can arise from fraud or error and are considered material if, individually or in the aggregate, they could reasonably be expected to influence the economic decisions of users taken on the basis of this financial report.
As part of an audit in accordance with the Australian Auditing Standards, I exercise professional judgement and maintain professional scepticism throughout the audit. I also:
identify and assess the risks of material misstatement of the financial report, whether due to fraud or error, design and perform audit procedures responsive to those risks, and obtain audit evidence that is sufficient and appropriate to provide a basis for my opinion. The risk of not detecting a material misstatement resulting from fraud is higher than for one resulting from error, as fraud may involve collusion, forgery, intentional omissions, misrepresentations, or the override of internal control.
obtain an understanding of internal control relevant to the audit in order to design audit procedures that are appropriate in the circumstances, but not for the purpose of expressing an opinion on the effectiveness of the university and the consolidated entity’s internal control
evaluate the appropriateness of accounting policies used and the reasonableness of accounting estimates and related disclosures made by the Council
conclude on the appropriateness of the Council’s use of the going concern basis of accounting and, based on the audit evidence obtained, whether a material uncertainty exists related to events or conditions that may cast significant doubt on the university and the consolidated entity’s ability to continue as a going concern. If I conclude that a material uncertainty exists, I am required to draw attention in my auditor’s report to the related disclosures in the financial report or, if such disclosures are inadequate, to modify my opinion. My conclusions are based on the audit evidence obtained up to the date of my auditor’s report. However, future events or conditions may cause the university and the consolidated entity to cease to continue as a going concern.
SWINBURNE UNIVERSITY OF TECHNOLOGYSFR :4

3
Auditor’s responsibilities for the audit of the financial report (continued)
evaluate the overall presentation, structure and content of the financial report, including the disclosures, and whether the financial report represents the underlying transactions and events in a manner that achieves fair presentation
obtain sufficient appropriate audit evidence regarding the financial information of the entities and business activities within the university and the consolidated entity to express an opinion on the financial report. I am responsible for the direction, supervision and performance of the audit of the university and the consolidated entity. I remain solely responsible for my audit opinion.
I communicate with the Council regarding, among other matters, the planned scope and timing of the audit and significant audit findings, including any significant deficiencies in internal control that I identify during my audit.
I also provide the Council with a statement that I have complied with relevant ethical requirements regarding independence, and to communicate with them all relationships and other matters that may reasonably be thought to bear on my independence, and where applicable, related safeguards.
MELBOURNE 16 March 2018
Charlotte Jeffries as delegate for the Auditor-General of Victoria
2017 ANNUAL REPORT SFR :5
FINANCIAL REPORTING
Contents
Financial statements SFR:7Income statement SFR:7Statement of comprehensive income SFR:7Statement of financial position SFR:8Statement of changes in equity SFR:9Statement of cash flows SFR:10
About this report SFR:11Notes to the financial statements SFR:11
How we are funded SFR:12Australian government financial assistance SFR:12Fees and charges SFR:14Other revenue SFR:15
Where our funding is applied SFR:16Employee-related expenses SFR:16Other expenses SFR:18Cash flow information SFR:18
How our numbers are calculated SFR:19Financial assets SFR:19Financial liabilities SFR:23Non-financial assets SFR:25Non-financial liabilities SFR:32Fair value measurements SFR:33Reserves and retained earnings SFR:36
Risk SFR:37Critical accounting judgments SFR:37Financial risk management SFR:38
Group Structure SFR:42Subsidiaries SFR:42Interests in associates and joint operations SFR:43
Unrecognised items SFR:44Contingencies SFR:44Commitments SFR:45Events occurring after the balance date SFR:45
Other information SFR:46Key management personnel disclosures SFR:46Remuneration of auditors SFR:49Related parties SFR:49Defined benefit plans SFR:51Disaggregated information SFR:53Acquittal of Australian Government financial assistance SFR:57Other accounting policies SFR:59
Disclosure Index SFR:64
SWINBURNE UNIVERSITY OF TECHNOLOGYSFR :6

Income statement Consolidated Parent entity
2017 2016 2017 2016 Notes $000 $000 $000 $000
Income from continuing operations Australian Government financial assistance 1(b) 350,849 338,513 346,563 335,632State and local government financial assistance (non-capital) 1(c) 30,893 21,436 29,868 21,436HECS-HELP – Student payments 11,431 11,048 11,431 11,048Fees and charges 2(b) 196,656 179,095 192,266 171,424Other revenue 3(b) 44,459 42,419 44,064 41,502
Total revenue from continuing operations 634,288 592,511 624,192 581,042
Share of profit/(loss) on investments accounted for using the equity method 9(a) 7,776 13,140 7,776 13,140Gains on disposal of property, plant and equipment 1 39 1 37Realised gain on investments 105,719 15,027 105,719 14,997
Total income from continuing operations 747,784 620,717 737,688 609,216
Expenses from continuing operations Employee-related expenses 4(b) 343,367 299,960 337,405 294,111Depreciation and amortisation 9(c) & (d) 31,842 32,952 31,588 30,303Repairs and maintenance 12,499 12,309 12,340 12,197Bad debt expense 492 1,596 493 1,590Provision for Doubtful Debts 469 (1,597) 469 (1,597)Losses on disposal of property, plant and equipment 466 7 466 7Deferred superannuation expense 4(b) & 23(b) (275) 104 (275) 104Other expenses 5(b) 254,887 255,196 251,332 251,358
Total expenses from continuing operations 643,747 600,527 633,818 588,073
Net result for the year attributed to Swinburne University of Technology 104,037 20,190 103,870 21,143
The above income statement should be read in conjunction with the accompanying notes.
Statement of comprehensive income Consolidated Parent entity
2017 2016 2017 2016 Notes $000 $000 $000 $000
Net result for the year 104,037 20,190 103,870 21,143
Items that will be reclassified to the Income statement Gain/(Loss) on valuation of land and buildings 12(a) – 14,648 – 4Available-for-sale revaluation reserve – Valuation gain/(loss) taken to equity 12(a) 18,172 7,688 17,861 7,698– Transferred to Income statement 12(a) (1,210) (14,626) (1,210) (14,727)(Decrease)/Increase of Deferred government contribution for superannuation 23(b) 1,494 3,251 1,494 3,251(Decrease)/Increase of Deferred government contribution for superannuation 23(b) (1,494) (3,251) (1,494) (3,251)
Total comprehensive income attributable to Swinburne University of Technology 120,999 27,900 120,521 14,118
The above statement of comprehensive income should be read in conjunction with the accompanying notes.
FINANCIAL STATEMENTS
2017 ANNUAL REPORT SFR :7

Consolidated Parent entity
2017 2016 2017 2016 Notes $000 $000 $000 $000
Assets
Current assets Cash and cash equivalents 7(a) 41,138 33,190 18,484 26,287Receivables 7(b) 24,628 21,395 24,451 89,573Available-for-sale financial assets 7(c) 58,972 42,326 57,772 41,150Non-financial assets classified as held for sale 9(b) 7,790 7,790 7,790 7,790Other non-financial assets 9(f) 23,921 15,636 23,791 15,475
Total current assets 156,449 120,337 132,288 180,275
Non‑current assets Receivables 7(b) 126,676 128,079 126,676 128,079Investments accounted for using the equity method 9(a) 10,479 22,602 10,479 22,602Available-for-sale financial assets 7(c) 310,689 201,390 305,699 196,952Property, plant and equipment 9(c) 759,784 736,300 758,252 649,921Investment properties 9(e) 17,239 16,060 17,239 16,060Intangible assets 9(d) 28,457 17,125 28,457 17,083Other non-financial assets 9(f) 68 – 72 –
Total non‑current assets 1,253,392 1,121,556 1,246,874 1,030,697
Total assets 1,409,841 1,241,893 1,379,162 1,210,972
Liabilities
Current liabilities Trade and other payables 8(a) 79,559 67,811 79,032 67,190Provisions-employee entitlements 10(a) 56,034 52,794 55,634 52,245Other liabilities 10(b) 38,947 13,290 38,854 13,474
Total current liabilities 174,540 133,895 173,520 132,909
Non‑current liabilities Provisions-employee entitlements 10(a) 137,820 132,871 137,715 132,790Other liabilities 10(b) 3,565 2,209 3,565 2,209
Total non‑current liabilities 141,385 135,080 141,280 134,999
Total liabilities 315,925 268,975 314,800 267,908
Net assets 1,093,916 972,918 1,064,362 943,064
Equity Reserves 12 313,649 318,431 313,184 296,533Retained earnings 12 780,267 654,487 751,178 646,531
Total Equity 1,093,916 972,918 1,064,362 943,064
The above statement of financial position should be read in conjunction with the accompanying notes.
FINANCIAL STATEMENTS
Statement of financial position
SWINBURNE UNIVERSITY OF TECHNOLOGYSFR :8

Reserves Retained Total earnings
$000 $000 $000
Parent
Balance at 1 January 2016 303,558 625,388 928,946Net result for the year – 21,143 21,143Gain/(Loss) on revaluation of land and buildings 4 – 4Available-for-sale revaluation reserve – Valuation gain/(loss) taken to equity 7,698 – 7,698– Transferred to Income statement (14,727) – (14,727)
Balance at 31 December 2016 296,533 646,531 943,064
Balance at 1 January 2017 296,533 646,531 943,064Net result for the year – 103,870 103,870Transfer from Income statement – 777 777Available-for-sale revaluation reserve – Valuation gain/(loss) taken to equity 17,861 – 17,861– Transferred to Income statement (1,210) – (1,210)
Balance at 31 December 2017 313,184 751,178 1,064,362
The above statement of changes in equity should be read in conjunction with the accompanying notes.
Statement of changes in equity Reserves Retained Total earnings
$000 $000 $000
Consolidated
Balance at 1 January 2016 310,721 634,297 945,018Net result for the year – 20,190 20,190Gain/(Loss) on revaluation of land and buildings 14,648 – 14,648Available-for-sale revaluation reserve – Valuation gain/(loss) taken to equity 7,688 – 7,688– Transferred to Income statement (14,626) – (14,626)
Balance at 31 December 2016 318,431 654,487 972,918
Balance at 1 January 2017 318,431 654,487 972,918Net result for the year – 104,037 104,037Available-for-sale revaluation reserve – Valuation gain/(loss) taken to equity 18,172 – 18,172– Transferred to Income statement (1,210) – (1,210)Transfer from revaluation reserves to retained earnings (21,743) 21,743 –
Balance at 31 December 2017 313,649 780,267 1,093,916
2017 ANNUAL REPORT SFR :9

FINANCIAL STATEMENTS
Statement of cash flows Consolidated Parent entity
2017 2016 2017 2016 Notes $000 $000 $000 $000
Cash flows from operating activities Australian Government Grants received 25 359,526 346,425 355,240 343,544State Government Grants received 30,893 20,475 29,868 20,475HECS-HELP including OS 12,760 10,680 12,760 10,680Superannuation supplementation 25(h) 9,408 9,185 9,408 9,185Receipts from student fees and other customers (inclusive of GST) 249,577 230,419 245,026 226,663Dividends and distributions received 3 4,800 6,600 4,800 6,313Interest received 3(b) 1,190 2,673 1,137 1,129Payments to suppliers and employees (inclusive of GST) (627,575) (572,033) (617,576) (562,514)Goods and services tax recovered/(paid) 21,600 17,068 21,474 17,343
Net cash provided by (used in) operating activities 6 62,179 71,492 62,137 72,818
Cash flows from investing activities Proceeds from sale of property, plant and equipment 1 39 1 37Payment for property, plant and equipment (52,903) (13,149) (136,661) (13,003)Payment for investment property – (8,541) – (8,541)Repayments of loans from/(to) related parties – – 68,034 –Proceeds from sale of shares 119,609 – 119,609 –Payment for intangible assets (14,221) (619) (14,306) (619)Proceeds from Available-for-sale financial assets 4,939 179,178 4,928 174,085Payments for Available-for-sale financial assets (111,656) (255,445) (111,545) (250,002)Loans to related parties – subsidiaries – – – –
Net cash provided by/(used in) investing activities (54,231) (98,537) (69,940) (98,043)
Net increase/(decrease) in cash and cash equivalents 7,948 (27,045) (7,803) (25,225)Cash and cash equivalents at the beginning of the financial year 33,190 60,235 26,287 51,512Effects of exchange rate changes on cash and cash equivalents – – – –
Cash and cash equivalents at the end of the financial year 7(a) 41,138 33,190 18,484 26,287
Financing arrangements 8(b) 1,267 946 1,267 946
The above statement of cash flows should be read in conjunction with the accompanying notes.
SWINBURNE UNIVERSITY OF TECHNOLOGYSFR :10

Notes to the financial statements
Swinburne University of Technology (the University) is a not-for-profit public entity. This financial report covers the financial statements for the consolidated entity consisting of Swinburne University of Technology and its subsidiaries (the University) and Swinburne University of Technology as an individual entity.
This general purpose financial report has been prepared in accordance with Australian Accounting Standards and Interpretations and other authoritative pronouncements of the Australian Accounting Standards Board (AASB), the requirements of the Australian Government’s Department of Education and Training, other Victorian and Australian Government legislative requirements, the requirements of the Swinburne University of Technology Act 2010, the Victorian Financial Management Act 1994, and the Australian Charities and Not-for-profits Commission Act 2012.
ABOUT THIS REPORT
Historical cost convention
The financial report has been prepared on an accrual basis, under the historical cost convention, as modified by the revaluation of available-for-sale financial assets and certain classes of property, plant and equipment to fair value.
Comparative information
Certain amounts in the comparative information have been reclassified to conform with current period financial statement presentations.
2017 ANNUAL REPORT SFR :11

This section provides additional information about how the University is funded and the accounting policies that are relevant for an understanding of the items recognised in the financial statements.
Revenue is measured at the fair value of the consideration received or receivable. The University recognises revenue when the amount of revenue can be reliably measured; it is probable that future economic benefits will flow to the University; and specific criteria have been met for each of the University’s activities as described below. In some cases, the criteria may not be met until consideration is received because this is when the receipt becomes probable. The University bases its estimates on historical results, taking into consideration the type of customer, the type of transaction and the specifics of each arrangement.
The main sources of funding and the relevant notes are:
Note 1. Australian Government financial assistance
(a) Recognising revenue from Australian Government assistance
The University receives the following forms of Government assistance: Commonwealth Grants, HELP payments, Scholarships, Research and Other Revenue. Government assistance revenue is recognised at fair value where the University obtains control of the right to the revenue; it is probable that economic benefits will flow to the University; and it can be reliably measured.
HELP payments
Revenue from HELP is categorised into payments received from the Australian Government and those received directly from students. HELP payments received from students are disclosed in the Income statement.
Research
The Australian government issues research grants for specific research projects. Research grants from the government are recognised at their fair value where the University obtains control of the right to receive the grant; it is probable that economic benefits will flow to the University; and it can be reliably measured.
Note 1. Australian government financial assistance including HECS‑HELP, FEE‑HELP and other Australian government loan programs 12
Note 2. Fees and charges 14
Note 3. Other revenue 15
HOW WE ARE FUNDED
SWINBURNE UNIVERSITY OF TECHNOLOGYSFR :12

(b) Breakdown of Australian government assistance Consolidated Parent entity
2017 2016 2017 2016 Notes $000 $000 $000 $000
Australian Government grants 198,757 179,890 195,904 177,009HECS-HELP Australian Government payments 118,114 114,225 118,114 114,225FEE-HELP Payments 21,340 27,355 21,340 27,355VET-FEE HELP Payments 2,625 14,640 2,625 14,640VET Student Loan Program 7,049 – 7,049 –SA-HELP payments 2,964 2,403 1,531 2,403
Total Australian Government financial assistance 350,849 338,513 346,563 335,632
Breakdown of Australian Government Grants
(a) Commonwealth Grant Scheme and Other Grants 25(a) Commonwealth Grants Scheme 158,849 145,542 158,849 145,542Higher Education Participation Program 4,445 4,707 4,445 4,707Indigenous Student Success Program 304 262 304 262Promotion of Excellence in Learning and Teaching 70 130 70 130Disability Performance Funding 22 22 22 22
Total Commonwealth Grants Scheme and Other Grants 163,690 150,663 163,690 150,663
(b) Education – Research 25(c) Research Support Program* 6,806 6,663 6,806 6,663
Total Education – Research Grants 6,806 6,663 6,806 6,663
(c) Australian Research Council (ARC) Discovery 6,932 5,977 6,932 5,977Linkages 1,290 963 1,290 963Networks and Centres 4,717 640 4,717 640
Total ARC 12,939 7,580 12,939 7,580
(d) Scholarships 25(c) Research Training Program** 11,638 11,725 11,638 11,725
Total Scholarships 11,638 11,725 11,638 11,725
(e) Other Capital Funding Linkage Infrastructure, Equipment and Facilities grant 808 367 808 367
Total Other Capital Funding 808 367 808 367
(f) Other Australian Government financial assistance Non-capital 2,876 2,892 23 11
Total Other Australian Government Financial Assistance 2,876 2,892 23 11
Total Australian Government Grants 198,757 179,890 195,904 177,009
* Research Support Program has replaced Joint Research Engagement, JRE Engineering Cadetships, Research Block Grants and Sustainable Research Excellence in Universities in 2017.
** Research Training Program has replaced Australian Postgraduate Awards, International Postgraduate Research Scholarships and Research Training Scheme in 2017.
(c) Recognising revenue from State and Local Government assistance
State and Local Government financial assistance is recognised as revenue at the fair value of the consideration received when the University obtains control of the right to receive the grant; it is probable that economic benefits will flow to the University; and it can be reliably measured.
2017 ANNUAL REPORT SFR :13

HOW WE ARE FUNDED
Note 2. Fees and charges
(a) Recognition of fees and charges
Fees and charges are recorded at fair value and include amounts received or receivable in respect of course delivery and other non-course activities. Fees and charges relating to courses are recognised in line with teaching delivery. Where teaching has not been conducted, those amounts are held as income in advance. Fees and charges for non-course activities are recognised when the service is provided.
(b) Breakdown of fees and charges Consolidated Parent entity
2017 2016 2017 2016 Notes $000 $000 $000 $000
Course fees and charges Fee-paying overseas onshore students 122,117 100,893 121,985 100,819Continuing education 2,313 2,085 1,771 1,548Fee-paying domestic postgraduate students 2,176 661 2,176 661Fee-paying domestic undergraduate students 23,650 14,809 21,706 13,188Domestic fee for service 21,040 23,766 20,956 22,460Fee for Service – International Operations Onshore 5,300 14,904 5,300 14,904Fee for Service – International Operations Offshore 622 373 622 373Student Fees and Charges 2,839 5,861 2,839 5,861
Total course fees and charges 180,057 163,352 177,355 159,814
Other non-course fees and charges Student Services and Amenities Fees from students 25(i) 2,767 2,908 1,172 –Library fines 58 63 58 63Parking fees 1,705 1,707 1,705 1,707Rental charges 11,065 10,427 10,972 9,202International Students Health Care Charges 384 423 384 423Ceremonies 620 215 620 215
Total other fees and charges 16,599 15,743 14,911 11,610
Total fees and charges 196,656 179,095 192,266 171,424
SWINBURNE UNIVERSITY OF TECHNOLOGYSFR :14

Note 3. Other revenue
(a) Recognition of other revenue
Dividends
Dividends are recognised when they have been declared; it is probable that economic benefits will flow to the University; and it can be reliably measured.
Contract research
Contract research is recognised as revenue when the invoice has been issued to a client.
Realised gain on investment
A realised gain on investment is recognised as revenue when a sale contract has been signed; it is probable that the ecomonic benefits will flow to the University; and it can be reliably measured. Realised gain on investment is disclosed in the Income statement.
Other revenue
Other revenue that is the subject of an invoice to a client is recognised when the invoice is raised. Otherwise it is recognised when payment is received.
(b) Breakdown of other revenue Consolidated Parent entity
2017 2016 2017 2016 $000 $000 $000 $000
Other revenue Dividends and distributions 14,337 9,891 14,110 9,580Interest revenue 1,190 5,049 1,137 4,932Royalties and licences 3,207 3,625 3,111 3,324Consultancy 1,654 2,043 1,654 2,043Contract research 19,437 17,739 19,437 17,739Donations and bequests 1,707 898 1,707 898In-kind contributions 2 – 2 –Scholarships and prizes 696 1,902 611 1,711Other income 2,229 1,272 2,295 1,275
Total Other Revenue 44,459 42,419 44,064 41,502
2017 ANNUAL REPORT SFR :15

This section provides additional information about how the University’s funding is applied and the accounting policies that are relevant for an understanding of the items recognised in the financial statements.
The primary expenses incurred by the University in achieving its objectives and the relevant notes are:
Note 4. Employee-related expenses
(a) Recognition of employee-related expenses
Salaries
Expenditure for salaries is expensed as incurred.
Redundancy program
Redundancy payments are expensed in the period that they are agreed and communicated to the respective employee.
Payroll tax
Payroll tax is recognised and included in employee benefit costs when the employee benefits to which they relate are recognised.
Annual leave expense
Annual leave expense is calculated at the nominal value of expected payments to be made in respect of services provided by employees up to the reporting date. Where employees have significant annual leave balances, an estimate is made of the probability of leave to be taken within 12 months and beyond 12 months.
Annual leave provision
The provision for annual leave is calculated at the nominal value of expected payments to be made in relation to services provided by employees up to the reporting date. All annual leave is recognised as current. Where employees have significant annual leave balances, an estimate is made of the probability of leave to be taken within 12 months and beyond 12 months (Note 10a).
Long service leave expense
Long service leave is recognised and is measured as the present value of expected future payments to be made in respect of services provided by employees up to the reporting date.
Long service leave provision
The liability for long service leave is recognised and is measured as the present value of expected future payments to be made in relation to services provided by employees up to the reporting date. Long service leave is paid out on resignation, termination, and redundancy after seven years of service, and is available to be taken after 10 years of service.
Note 4. Employee‑related expenses 16
Note 5. Other expenses 18
Note 6. Cash flow information 18
WHERE OUR FUNDING IS APPLIED
SWINBURNE UNIVERSITY OF TECHNOLOGYSFR :16

The University determines that portion expected to be paid in the year, which is measured at nominal value. The remainder is measured at net present value. Consideration is given to expected future wage and salary levels, experience of employee departures and periods of service. Expected future payments are discounted using market yields at the reporting date on national government bonds with terms to maturity and currency that match, as closely as possible, the estimated future cash outflows. The current portion of the provision is determined as the value of long service leave of staff that have seven years or more of service entitlements outstanding with an unconditional right of settlement.
The University uses the Department of Treasury and Finance’s 2008 Long Service Leave Model to calculate the provision for Long Service Leave. Because the calculation of long service involves significant assumptions and estimates, it is considered a critical accounting judgement as outlined in Note 13(a).
Performance pay
Performance pay is recognised in employee entitlements when at least one of the following conditions is met:
• There are formal terms in the performance plan for determining the amount of the benefit;
• The amounts to be paid are determined before the time of completion of the financial report; or
• Past practice gives clear evidence of the amount of the obligation.
Termination Benefits
Termination benefits are payable when employment is terminated before the normal retirement date, or when an employee accepts voluntary redundancy in exchange for these benefits. The University recognises termination benefits when it is demonstrably committed to either terminating the employment of current employees according to a detailed plan or providing termination benefits as a result of an offer made to encourage voluntary redundancy. Benefits not expected to be settled wholly before 12 months after the end of the reporting period are discounted to present value.
(b) Breakdown of employee-related expenses Consolidated Parent entity
2017 2016 2017 2016 Notes $000 $000 $000 $000
Academic Salaries 143,765 132,923 141,717 130,889Redundancy program (373) 3,616 (373) 3,616Contribution to funded superannuation and pension schemes* 22,923 18,554 22,747 18,387Payroll tax 8,591 7,784 8,490 7,691Worker’s compensation 713 796 671 709Long service leave expense** 8,737 981 8,737 981Annual leave expense 6,694 6,205 6,694 6,205Parental leave expense 1,647 1,126 1,647 1,126Performance allowance expense 1,637 893 1,637 893
Total academic 194,334 172,878 191,967 170,497
Non-academic Salaries 112,808 95,372 109,985 92,558Redundancy program 2,652 4,581 2,652 4,581Contribution to funded superannuation and pension schemes* 17,511 14,037 17,157 13,736Payroll tax 5,990 5,186 5,808 5,026Worker’s compensation 314 296 265 278Long service leave expense** 1,668 911 1,631 871Annual leave expense 6,436 5,426 6,328 5,309Parental leave expense 1,221 393 1,196 376Performance allowance expense 433 880 416 879
Total non‑academic 149,033 127,082 145,438 123,614
Total employee related expenses 343,367 299,960 337,405 294,111
Deferred superannuation expense 23 (275) 104 (275) 104
Total employee related expenses, including deferred government employee benefits for superannuation 343,092 300,064 337,130 294,215
* Increase to contributions to funded superannuation and pension schemes were recognised during the 2017 reporting period as a result of adjustments to prior period calculations over the last 6 years which were considered immaterial to each of those financial periods.
** An increase to long service leave provisions was recognised during the 2017 reporting period as a result of adjustments in prior period calculations over the last 6 years which were considered immaterial to each of those financial periods.
2017 ANNUAL REPORT SFR :17

WHERE OUR FUNDING IS APPLIED
Note 5. Other expenses
(a) Recognition of other expenses
Other expenses are applied to the Income statement during the financial year in which they are incurred.
(b) Breakdown of other expenses Consolidated Parent entity
2017 2016 2017 2016 $000 $000 $000 $000
Scholarships, grants and prizes 31,464 26,600 31,347 26,561Non-Capitalised Equipment 20,780 21,024 20,643 20,953Advertising, marketing and promotional expenses 8,028 7,162 7,770 6,997Operating lease expense 7,221 4,590 7,051 4,441Travel and related staff development and training 14,785 13,378 14,380 13,002Professional service fees 42,650 32,315 41,813 31,168Contract teaching services 97,945 105,407 97,227 104,814Commissions 11,234 9,962 11,234 9,962Impaired assets – 7,167 – 7,167Discounts given 6,732 4,963 6,732 4,963Other expenses* 14,048 22,628 13,135 21,330
Total other expenses 254,887 255,196 251,332 251,358
* During the 2017 reporting period a provision was recognised for obligations to Centrelink resulting from matters related to reporting of prior period employee Reportable Employer Superannuation Contributions (RESC) and Fringe Benefits. Swinburne expects to settle the estimated liability of $7.5 million no later than twelve months from the end of the 2017 reporting period, subject to continued ongoing discussions with Centrelink and the ATO.
Note 6. Cash flow information
Reconciliation of net result to net cash from operating activities Consolidated Parent entity
2017 2016 2017 2016 Notes $000 $000 $000 $000
Net result for the period 104,037 20,190 103,870 21,143Depreciation and amortisation 9(c) & (d) 31,842 32,952 31,588 30,303Foreign exchange adjustment 22(d) (23) – (23) –Write-off of plant and equipment 466 3,121 466 3,121Employee provisions 3,101 – 3,097 –Write-off impaired library assets – 6,160 – 6,160Write-off impaired software assets – 1,006 – 1,006Discounts given – 4,963 – 4,963Bad debts expense 492 1,596 493 1,590Accrued audit fees – – (16) –Provision for doubtful debts 469 (1,597) 469 (1,597)Gain on revaluation of investment properties 7(c) (1,179) – (1,179) –Unrealised gain on non-financial assets classified as held for sale (1,210) – (1,210) –Realised gains on Investments – Sale of 30% share in Online Education Services (104,509) – (104,509) –Realised gains on Investments – Other – (15,027) – (14,997)Share of profit of associates and joint venture partnership not received as dividends or distributions (7,776) (13,140) (7,776) (13,140)Reinvestment of dividends and distributions (7,669) – (7,510) –
Change in operating assets and liabilities (Increase)/decrease in receivables (2,768) 9,963 (2,803) 13,085(Increase)/decrease in accrued income 3,849 25,951 3,849 25,678(Increase)/decrease in non–financial assets (791) (1,544) (817) (1,541)Increase/(decrease) in trade and other payables 38,760 (7,031) 38,933 (6,811)Increase/(decrease) in employee benefit provisions 5,088 3,929 5,215 3,855
Net cash provided by/(used in) operating activities 62,179 71,492 62,137 72,818
SWINBURNE UNIVERSITY OF TECHNOLOGYSFR :18

This section provides additional information about individual line items in the financial statements that are considered most relevant in the context of the University’s operations, including:
(a) Accounting policies that are relevant for an understanding of the items recognised in the financial statements; and
(b) Analysis and sub-total, including disaggregated information.
Note 7. Financial assets
The University categorises its financial assets as:
• Cash and cash equivalents• Receivables• Available-for-sale financial assets.
Management determines the classification of its financial assets at initial recognition and re-evaluates this designation at the end of each year.
Note 7. Financial assets 19
Note 8. Financial liabilities 23
Note 9. Non-financial assets 25
Note 10. Non-financial liabilities 32
Note 11. Fair value measurements 33
Note 12. Reserves and retained earnings 36
HOW OUR NUMBERS ARE CALCULATED
(a) Cash and cash equivalents
(i) Recognition of cash and cash equivalents
Cash and cash equivalents include cash on hand, deposits held at call with financial institutions, other short-term, highly liquid investments with original maturities of three months or less that are readily convertible to known amounts of cash and which are subject to an insignificant risk of changes in value, and bank overdrafts. Bank overdrafts are included within borrowings in current liabilities in the statement of financial position. Cash balances held between the parent entity and its controlled entities are accounted for as “Inter-company Cash”.
2017 ANNUAL REPORT SFR :19

(b) Receivables
(i) Recognition of receivables
Receivables are non-derivative financial assets with fixed or determinable payments that are not quoted in an active market. They arise when the University provides money, goods or services directly to a debtor with no intention of selling the receivable. They are included in current assets, except for those with maturities greater than 12 months after the balance date, which are classified as non-current assets. Receivables are recognised initially at fair value and subsequently measured at cost less provision for doubtful debts.
Current receivables consist of amounts owed to the University in relation to professional services and course fees. Payment for professional services is due within 30 days of the end of the month following the billing date. Student fees are normally due for payment prior to the census date. Non-current receivables include amounts due from corporations in which the University has an interest relating to start-up finances provided by the University.
HOW OUR NUMBERS ARE CALCULATED
Note 7. Financial assets (continued)
(ii) Breakdown of cash and cash equivalents Consolidated Parent entity
2017 2016 2017 2016 $000 $000 $000 $000
Cash and cash equivalents Cash at bank and on hand 41,138 33,190 38,542 30,415Inter-company cash* – – (20,058) (4,128)
Total cash assets 41,138 33,190 18,484 26,287
(a) Reconciliation to cash at the end of the year The above figures are reconciled to cash at the end of the year as shown in the statement of cash flows as follows:
Balance per statement of cash flows 41,138 33,190 18,484 26,287
(b) Cash at bank and on hand Interest bearing 39,098 32,128 36,502 29,353Non-Interest-bearing 2,040 1,062 2,040 1,062
41,138 33,190 38,542 30,415
* Inter‑company cash represents cash paid by the parent on behalf of the subsidiaries, as they do not have separate bank accounts.
Repayment of the receivable is the subject of contractual arrangements between the University and the party concerned. The nominal value less estimated credit adjustments of trade receivables and payables reflects their fair values.
(ii) Impairment of receivables
Collectability of trade receivables is reviewed on an ongoing basis. A provision for impairment is raised when doubt as to collection exists. Receivables that are known to be uncollectible are written off against the provision.
(iii) Deferred Government contribution for superannuation
An arrangement exists between the Australian Government and the Victorian State Government to meet, on an emerging cost basis, the unfunded liability for current or former employees of Swinburne University of Technology who are also members or beneficiaries of the Victorian State Superannuation Scheme.
This arrangement is evidenced by the Commonwealth’s State Grants (General Revenue) Amendment Act 1987, Higher Education Funding Act 1988 and subsequent amending legislation. Accordingly the unfunded liabilities have been recognised in the statement of financial position under Provisions – Employee Entitlements with a corresponding asset recognised under Receivables. The recognition of both the asset and the liability consequently does not affect the year end net asset position of Swinburne University of Technology and its controlled entities. The unfunded liabilities recorded in the statement of financial position under Provisions have been based on the valuation of net liabilities as at 31 December 2017 under AASB 119 as provided by the Government Superannuation Office, an operating division of the Victorian Emergency Services Superannuation Board.
SWINBURNE UNIVERSITY OF TECHNOLOGYSFR :20

(iv) Breakdown of Receivables Consolidated Parent entity
2017 2016 2017 2016 Notes $000 $000 $000 $000
Receivables
Current Debtors 21,711 17,942 21,530 86,114Less: Provision for impaired receivables (3,140) (2,672) (3,136) (2,666)
18,571 15,270 18,394 83,448
Deferred Government benefit for superannuation 23 6,057 6,125 6,057 6,125
Total current receivables 24,628 21,395 24,451 89,573
Non‑current Other receivables from associated companies 1,067 1,044 1,067 1,044
1,067 1,044 1,067 1,044
Deferred Government benefit for superannuation 23 125,609 127,035 125,609 127,035
Total non‑current receivables 126,676 128,079 126,676 128,079
Total receivables 151,304 149,474 151,127 217,652
Impaired receivables
The ageing of these receivables beyond 3 months is as follows: 3 to 6 months 492 339 492 339 Over 6 months 38 888 38 888
530 1,227 530 1,227
Movements in the provision for impaired receivables are as follows:
At 1 January (2,672) (3,823) (2,666) (3,823)Provision for impairment released/(recognised) during the year (1,108) 532 (1,108) 538Receivables written off during the year as uncollectible 640 619 640 619
(3,140) (2,672) (3,134) (2,666)
2017 ANNUAL REPORT SFR :21

HOW OUR NUMBERS ARE CALCULATED
Note 7. Financial assets (continued)
(c) Available-for-sale financial assets
Available-for-sale financial assets consist principally of unit trusts. They are included in non-current assets unless management intends to dispose of the asset within 12 months of the balance date.
(i) Listed securities
All listed securities are in the name of Swinburne University of Technology and/or its controlled entities. The listed securities are measured at their fair value of $344.75 million at 31 December 2017 (2016: $223.39 million). The fair value of available-for-sale securities is based on quoted market prices at the balance date. The quoted market price used for financial assets held by the University is the current bid price; the appropriate quoted market price for financial liabilities is the current ask price. The weighted average effective interest rate on the listed securities is 4.56% (2016: 5.86%).
(ii) Unlisted securities
Unlisted securities are untraded shares in venture operations being undertaken in conjunction with other Universities. These operations are essentially to develop intellectual property and/or training opportunities for participating Universities. The unlisted securities are measured at their fair value of $24.91 million at 31 December 2017 (2016: $20.33 million).
Unlisted equity securities are carried at fair value determined at a discount if it is a limited market. If the market is not active for unlisted securities, the University establishes fair value by providing for the temporary diminution in the value of the asset. All changes in the provision for diminution in value are taken through the Income statement unless there is a credit balance available in the asset revaluation reserve.
(iii) Recognition of available‑for‑sale financial assets
Purchases and sales of marketable equity assets are recognised on trade-date – the date on which the University commits to purchase or sell the asset. These financial assets are initially recognised at fair value plus transaction costs. Financial assets are derecognised when the rights to receive cash flows from the financial assets have expired and the University has substantially transferred all the risks and rewards of ownership.
(iv) Recognition of gains/losses associated with available‑for‑sale financial assets
Unrealised gains and losses arising from changes in the fair value of securities classified as available-for-sale are recognised in equity in the available-for-sale investment revaluation reserve. When securities classified as available-for-sale are sold or impaired, the accumulated fair value adjustments are included in the Income statement as gains and losses from investment securities.
(v) Impairment of available‑for‑sale financial assets
At each balance date, the University assesses whether there is objective evidence that a financial asset or group of financial assets is impaired. In the case of equity securities classified as available-for-sale, a significant or prolonged decline in the fair value of a security below its cost is considered in determining whether the security is impaired. The basis for impairment is a decline in the cost of 20% or greater over a minimum period of 9 months compared to the market value.
If any such evidence exists for available-for-sale financial assets, the cumulative loss (measured as the difference between the acquisition cost and the current fair value, less any impairment loss on that financial asset previously recognised in the Income statement) is removed from equity and recognised in the Income statement. Impairment losses recognised in the Income statement on equity instruments are not reversed through the Income statement.
SWINBURNE UNIVERSITY OF TECHNOLOGYSFR :22

(vi) Breakdown of available-for-sale financial assets Consolidated Parent entity
2017 2016 2017 2016 $000 $000 $000 $000
Available-for-sale financial assets
At beginning of year 243,716 122,610 238,102 119,078 Additions 112,712 297,670 112,448 291,053 Disposals (sale and redemption) (4,939) (184,352) (4,940) (179,827) Unrealised revaluation investments taken to available-for-sale revaluation reserve 18,172 7,788 17,861 7,798
At end of year 369,661 243,716 363,471 238,102
Current Listed securities Unit Trust 58,972 42,326 57,772 41,150
Current Available-for-sale financial assets 58,972 42,326 57,772 41,150
Non‑current Listed securities Unit Trust 285,781 181,062 280,396 176,124
285,781 181,062 280,396 176,124
Unlisted securities Unlisted securities in other organisations 21,920 17,738 22,370 18,188Provision for diminution of unlisted securities (1,592) (1,592) (1,542) (1,542)Revaluation adjustment taken to available-for-sale revaluation reserve 4,475 4,182 4,475 4,182Additions 105 – – –
24,908 20,328 25,303 20,828
Non-current Available-for-sale financial assets 310,689 201,390 305,699 196,952
Note 8. Financial liabilities
The University holds the following financial liabilities:
• Trade and other payables• Borrowings and financing arrangements
(a) Trade and other payables Consolidated Parent entity
2017 2016 2017 2016 Notes $000 $000 $000 $000
Current OS-HELP liability to Australian Government 25(g) 962 (368) 962 (368)Accrued salaries* 10,540 8,339 10,495 8,218Trade creditors** 68,057 59,840 67,575 59,340
79,559 67,811 79,032 67,190
Total Trade and other payables 79,559 67,811 79,032 67,190
* Increase to contributions to funded superannuation and pension schemes were recognised during the 2017 reporting period as a result of adjustments to prior period calculations over the last 6 years which were considered immaterial to each of those financial periods.
** During the 2017 reporting period a provision was recognised for obligations to Centrelink resulting from matters related to reporting of prior period employee Reportable Employer Superannuation Contributions (RESC) and Fringe Benefits. Swinburne expects to settle the estimated liability of $7.5 million no later than twelve months from the end of the 2017 reporting period, subject to continued ongoing discussions with Centrelink and the ATO.
These amounts represent liabilities for goods and services provided to the consolidated entity prior to the end of the financial year and which are unpaid. The amounts are unsecured and are usually paid by the end of the month following that in which they are invoiced.
2017 ANNUAL REPORT SFR :23

(iii) Recognition of borrowings
Borrowings are initially recognised at fair value, net of transaction costs incurred. Borrowings are subsequently measured at amortised cost. Any difference between the proceeds (net of transaction costs) and the redemption amount is recognised in the Income statement over the period of the borrowings using the effective interest method. Borrowings are classified as current liabilities unless the University has an unconditional right to defer settlement of the liability for at least 12 months after the balance date and does not expect to settle the liability for at least 12 months after the end of the reporting period.
(b) Borrowings and financing arrangements
(i) Loan facility
At 31 December 2017, the University does not have any assets pledged as security for a loan facility (2016: $nil).
(ii) Financial arrangements
The University had unrestricted access to the following lines of credit at balance date: Consolidated Parent entity
2017 2016 2017 2016 $000 $000 $000 $000
Credit standby arrangements
Total facilities Net Debt Set Off 30 30 30 30Bank Guarantee 500 500 500 500Online Direct Credit 3,600 3,250 3,600 3,250Bill – Either Fixed Rate or Floating Rate 28,000 28,000 28,000 28,000
Total facilities 32,130 31,780 32,130 31,780
Used at balance date Bank Guarantee 350 350 350 350Online Direct Credit 917 596 917 596
Total facilities used at balance date 1,267 946 1,267 946
Unused at balance date Net Debt Set Off 30 30 30 30Bank Guarantee 150 150 150 150Online Direct Credit 2,683 2,654 2,683 2,654Bill – Either Fixed Rate or Floating Rate 28,000 28,000 28,000 28,000
Total facilities unused at balance date 30,863 30,834 30,863 30,834
Bank loan facilities Total facilities 32,130 31,780 32,130 31,780Used at balance date 1,267 946 1,267 946
Unused at balance date 30,863 30,834 30,863 30,834
Note 8. Financial liabilities (continued)
HOW OUR NUMBERS ARE CALCULATED
SWINBURNE UNIVERSITY OF TECHNOLOGYSFR :24

Ownership Interest %
Name of associate entity Description 2017 2016
Swinburne Sarawak Holdings Sdn Bhd Investment in international campus in Sarawak, Malaysia to deliver Swinburne courses in business, design, engineering, IT and science. 25% 25%
Summarised financial information for individually material associate is set out below: Consolidated Parent entity
2017 2016 2017 2016 $000 $000 $000 $000
Financial Position Current assets 15,321 15,816 15,321 15,816Non-current assets 5,149 4,861 5,149 4,861
Total assets 20,470 20,677 20,470 20,677
Current liabilities 4,795 6,460 4,795 6,460Non-current liabilities 6,331 6,419 6,331 6,419
Total liabilities 11,126 12,879 11,126 12,879
Net assets 9,344 7,798 9,344 7,798
Share of jointly controlled entity’s net assets 1,636 1,250 1,636 1,250
Financial Performance Income 24,775 23,386 24,775 23,386Expenses 23,399 21,957 23,399 21,957
Net result 1,376 1,429 1,376 1,429
Share of associate entity’s net result 344 357 344 357
The financial year for Swinburne Sarawak Holdings Sdn Bhd ended 31 December 2017. An external auditor has been engaged to provide assurance over the company’s financial statements. As the financial statements and assurance will be completed in June 2018, an estimate has been used for the disclosure above.
Note 9. Non-financial assets
The University has the following classes of non-financial assets:
• Investments accounted for using the equity method• Non-financial assets classified as held-for-sale• Property, plant and equipment• Intangible assets• Investment properties• Other non-financial assets
(a) Investments accounted for using the equity method
(i) Investment in Swinburne Sarawak Holdings Sdn Bhd Consolidated Parent entity
2017 2016 2017 2016 $000 $000 $000 $000
Investment in Swinburne Sarawak Holdings Sdn Bhd 1,009 – 1,009 –
Total Investments 1,009 – 1,009 –
Reconciliation Share of net result for the year* 1,009 – 1,009 –
Balance at 31 December 1,009 – 1,009 –
* Share of net result for the year includes an adjustment for prior years. Share of net result for the current year is $344K.
2017 ANNUAL REPORT SFR :25

Ownership Interest %
Name of associate entity Description 2017 2016
Online Education Services (Swinburne Online) Agreement with Seek Ltd. to deliver online degrees designed to meet Australia’s educational needs. 20% 50%
During the year, the University disposed of a 30% interest in Online Education Services (Swinburne Online), reducing its continuing interest to 20%. The proceeds of the disposal were received in cash.
(ii) Investment in Online Education Services Consolidated Parent entity
2017 2016 2017 2016 $000 $000 $000 $000
Investment in Online Education Services 9,469 22,602 9,469 22,602
Total Investments 9,469 22,602 9,469 22,602
Reconciliation Balance at 1 January 22,602 15,402 22,602 15,402Additions/(Disposals) (15,100) – (15,100) –
Share of net result for the year 6,767 13,140 6,767 13,140Dividends received by the University (4,800) (5,940) (4,800) (5,940)
Balance at 31 December 9,469 22,602 9,469 22,602
Note 9. Non-financial assets (continued)
HOW OUR NUMBERS ARE CALCULATED
Summarised financial information for individually material associate is set out below: Consolidated Parent entity
2017 2016 2017 2016 $000 $000 $000 $000
Financial Position Current assets 74,362 72,647 74,362 72,647Non-current assets 8,788 6,175 8,788 6,175
Total assets 83,150 78,822 83,150 78,822
Current liabilities 33,550 32,508 33,550 32,508Non-current liabilities 2,254 1,110 2,254 1,110
Total liabilities 35,804 33,618 35,804 33,618
Net assets 47,346 45,204 47,346 45,204
Share of jointly controlled entity’s net assets 9,469 22,602 9,469 22,602
Financial Performance Income 113,061 108,277 113,061 108,277Expenses 86,919 81,998 86,919 81,998
Net result 26,142 26,279 26,142 26,279
Share of associate entity’s net result 6,767 13,140 6,767 13,140
Online Education Services’ financial year ends on 30 June. Consistent with the year ended 31 December 2017, an external auditor has been engaged to provide assurance over Online Education Services and transactions at 31 December 2017. For further information on the recognition and measurement criteria, refer to Note 16(a).
Contingent liabilities and capital commitments arising from the University’s interests in joint ventures are disclosed in Notes 17 and 18 respectively.
SWINBURNE UNIVERSITY OF TECHNOLOGYSFR :26

Consolidated Parent entity
2017 2016 2017 2016 $000 $000 $000 $000
Property held for sale 7,790 7,790 7,790 7,790
7,790 7,790 7,790 7,790
The University is in the process of selling the PA Building and carpark at the Prahran Campus, awaiting final approval from Stonnington Council. The sale is expected to occur in 2018; therefore the PA Building has been classified as held-for-sale at 31 December 2017.
(b) Non-financial assets classified as held-for-sale
This category of non-financial assets consists of land and buildings considered to be surplus to requirements and which are subject to disposal as a result of management intentions, announced publicly, to vacate and initiate an active search for a buyer to purchase the asset. The written-down-value of the land and buildings and any land and building reserves due to previous revaluations that are held in the Asset Revaluation Reserve are taken into account in determining the write-down of the individual asset.
(c) Property, plant and equipment
Construction Freehold Freehold Leasehold Plant & Library Other plant & in Progress Land Buildings Improvements Equipment1 Collections equipment2 Total Consolidated $000 $000 $000 $000 $000 $000 $000 $000
Balance at 1 January 2016 4,667 281,930 428,299 1,790 114,729 22,049 950 854,414Accumulated depreciation and impairment – – – (1,777) (91,474) (10,262) – (103,513)
Net book amount 4,667 281,930 428,299 13 23,255 11,787 950 750,901
Year ended 31 December 2016 Opening net book amount 4,667 281,930 428,299 13 23,255 11,787 950 750,901Revaluation – 14,343 303 – – – – 14,646Transfers in/out of construction in progress 4,872 – – – – – – 4,872Additions at cost – 201 4,851 – 5,357 2,735 – 13,144Write-offs (3,114) – – – – (6,160) – (9,274)Asset disposals – – – – (7) – – (7)Depreciation – – (16,633) (7) (11,574) (1,977) – (30,191)
Closing net book amount 6,425 296,474 416,820 6 17,031 6,385 950 744,091
At 31 December 2016 6,425 296,474 430,912 1,790 117,429 11,875 950 865,855Accumulated depreciation and impairment – – (14,092) (1,784) (100,398) (5,490) – (121,764)
Net book amount 6,425 296,474 416,820 6 17,031 6,385 950 744,091
Year ended 31 December 2017 Opening net book amount 6,425 296,474 416,820 6 17,031 6,385 950 744,091Transfers in/out of construction in progress 17,774 – – – – – – 17,774Transfers to PPE Held for Sale – (6,447) (1,343) – – – – (7,790)Additions at cost – – 10,254 317 23,106 1,450 2 35,129Write-offs – – – – (73) – (393) (466)Depreciation – – (16,603) (31) (9,974) (2,346) – (28,954)
Closing net book amount 24,199 290,027 409,128 292 30,090 5,489 559 759,784
At 31 December 2017 24,199 290,027 439,447 1,261 139,924 13,325 559 908,742Accumulated depreciation and impairment – – (30,319) (969) (109,834) (7,836) – (148,958)
Net book amount 24,199 290,027 409,128 292 30,090 5,489 559 759,784
1 Plant & equipment includes all operational assets.2 Other plant & equipment includes non-operational assets such as artwork.
2017 ANNUAL REPORT SFR :27

(c) Property, plant and equipment continued
Note 9. Non-financial assets (continued)
Construction Freehold Freehold Leasehold Plant & Library Other plant & in Progress Land Buildings Improvements Equipment1 Collections equipment2 Total Parent entity $000 $000 $000 $000 $000 $000 $000 $000
Balance at 1 January 2016 4,667 274,224 361,914 1,746 113,823 22,049 950 779,373Accumulated depreciation and impairment – – – (1,746) (90,694) (10,262) – (102,702)
Net book amount 4,667 274,224 361,914 – 23,129 11,787 950 676,671
Year ended 31 December 2016 Opening net book amount 4,667 274,224 361,914 – 23,129 11,787 950 676,671Revaluation – 69 (66) – – – – 3Transfers in/out of construction in progress 4,872 – – – – – – 4,872Additions at cost – 201 4,757 – 5,305 2,735 – 12,998Write-offs (3,114) – – – – (6,160) – (9,274)Asset disposals – – – – (7) – – (7)Depreciation – – (14,049) – (11,526) (1,977) – (27,552)
Closing net book amount 6,425 274,494 352,556 – 16,901 6,385 950 657,711
At 31 December 2016 6,425 274,494 366,602 – 116,486 11,875 950 776,832Accumulated depreciation and impairment – – (14,046) – (99,585) (5,490) – (119,121)
Net book amount 6,425 274,494 352,556 – 16,901 6,385 950 657,711
Year ended 31 December 2017 Opening net book amount 6,425 274,494 352,556 – 16,901 6,385 950 657,711Transfers in/out of construction in progress 17,774 – – – – – – 17,774Transfers to PPE Held for Sale – (6,447) (1,343) – – – – (7,790)Transfer due to liquidation of subsidiaries – 21,980 63,419 – – – – 85,399Additions – – 9,482 317 23,074 1,450 2 34,325Write-offs – – – – (73) – (393) (466)Depreciation – – (16,407) (26) (9,922) (2,346) – (28,701)
Closing net book amount 24,199 290,027 407,707 291 29,980 5,489 559 758,252
At 31 December 2017 24,199 290,027 437,783 1,217 138,971 13,325 559 906,081Accumulated depreciation and impairment – – (30,076) (926) (108,991) (7,836) – (147,829)
Net book amount 24,199 290,027 407,707 291 29,980 5,489 559 758,252
1 Plant & equipment includes all operational assets.2 Other plant & equipment includes non–operational assets such as artwork.
(i) Valuation of Land and Buildings
Land and buildings are shown at fair value, based on periodic, but at least triennial, valuations undertaken by the Valuer General of Victoria, less subsequent depreciation for buildings. Any accumulated depreciation at the date of revaluation is eliminated against the gross carrying amount of the asset, the net amount then restated to the revalued amount of the asset. The valuation of land and buildings is based on the highest and best use of the asset. The University considers a market participant’s use or purchase of the asset, to use it in a manner that would be the highest and best use. To arrive at fair value, the 31 December 2017 valuations for land and buildings were based on information provided
by the Valuer General of Victoria in an independent valuation. Note 11(d) outlines the information used in fair value measurements performed by the Valuer General of Victoria.
Increases in the net carrying value arising on revaluation of land and buildings are credited to the relevant asset revaluation reserve in equity. To the extent that the increase reverses a decrease previously recognised in the Income statement, the increase is first recognised in the Income statement. Decreases that reverse previous increases of the same asset class are first charged against the revaluation reserve directly in equity to the extent of the remaining reserve attributable to the asset; all other decreases are charged to the Income statement.
(ii) Valuation of other items of property, plant and equipment
All other assets within the property, plant and equipment category are stated at historical cost less depreciation. Historical cost includes expenditure that is directly attributable to the acquisition of the items. Subsequent costs are included in the asset’s carrying amount or recognised as a separate asset, only when it is probable that future economic benefits associated with the item will flow to the University and the cost of the item can be measured reliably.
HOW OUR NUMBERS ARE CALCULATED
SWINBURNE UNIVERSITY OF TECHNOLOGYSFR :28

(iii) Gains or losses on disposal of property, plant and equipment
Gains and losses on disposals are determined by comparing the proceeds with the carrying amount. These figures are included in the Income statement. When revalued assets are sold, it is University policy to transfer the amounts included in the relevant asset revaluation reserve relating to those assets to retained earnings.
(iv) Property owned by the Crown
The University is carrying property in its accounts where the title to the property is in the name of the Minister for Higher Education and Skills. The value of land and buildings attributed to the Crown, at independent valuation by the Valuer General of Victoria, now amounts to $183.6 million (2016: $179.6 million).
(v) Repairs and maintenance
Repairs and maintenance costs are recognised as expenses as incurred, except where they relate to the replacement of a significant component of an asset. In that case, the costs are capitalised and depreciated. Other routine operating maintenance, repair and minor renewal costs are also recognised as expenses, as incurred.
(vi) Depreciation and amortisation
Land and artwork are not depreciated. Leasehold improvements are reviewed annually and written off over the term of the lease or 10 years, whichever comes first. Depreciation on other assets is calculated using the straight line method to allocate their cost or revalued amounts, net of their residual values, over their estimated useful lives, as follows:
Asset class 2017 useful life 2016 useful life
Freehold Buildings 42 years 42 years
Leasehold Improvements 10 years 10 years
Plant and Equipment* 4 to 8 years 4 to 8 years
Library Collections 5 years 5 years
* The useful life of equipment is between 4 and 8 years.
The University incorporates different useful lives for the following items of plant:
Asset class Description 2017 useful life 2016 useful life
Structure/Shell/Building Fabric Inclusive of substructure, columns, floor, upper floors, 42 years 42 years staircases, roof, external walls and windows.
Site Engineering Services and central plant Inclusive of roads, footpaths, paved areas, boundary walls, 42 years 42 years covered ways, fencing, gates, outbuildings, landscaping improvements, external storm water drainage, external water supply, external gas, fire protection, electricity, communications and special services.
Fit out Inclusive of external doors, internal walls, ceilings, fitments 17 years 17 years (incl. wall and floor coverings), sanitary fixtures and special equipment.
Trunk Reticulated Building systems Inclusive of lifts, escalators, walkways, cranes, hoists etc., 25 years 25 years centralised energy and other.
The assets’ residual values and useful lives are reviewed, and adjusted if appropriate, at each balance date.
2017 ANNUAL REPORT SFR :29

HOW OUR NUMBERS ARE CALCULATED
Note 9. Non-financial assets (continued)
(i) Recognition of intangible assets
The University capitalises the costs of development activities or purchase of products related to the provision or enhancement of large core systems as intangible assets. Costs associated with maintaining software programs are recognised as an expense as incurred. Development costs that are directly attributable to the design, development and testing of identifiable software products controlled by the University are recognised as intangible assets when the following criteria are met:
• it is technically feasible to complete the software so that it will be available for use
• management intends to complete the software and use it
• there is an ability to use the software • it can be demonstrated how the
software will generate probable future economic benefits
• adequate technical, financial and other resources to complete the development and to use the software are available
• the expenditure attributable to the software during its development can be reliably measured.
The expenditure capitalised comprises all directly attributable costs, including costs of materials, services, direct labour and an appropriate proportion of overheads. Capitalised development costs are recorded as intangible assets and amortised from the point at which the asset is ready for use. The amortisation rate is set at 12.5% per annum on commencement of the core system but is subject to an annual impairment review conducted at the end of each financial year. Capitalised development expenditure is stated at cost less accumulated amortisation. Amortisation is calculated using the straight line method to allocate the cost over the period of the expected benefit.
(ii) Research and development
Research expenditure and development expenditure that do not meet the criteria in (i) above are recognised as an expense as incurred. Development costs previously recognised as an expense are not recognised as an asset in a subsequent period.
(iii) Website costs
Costs in relation to websites controlled by the University are expensed in the period in which they are incurred, unless the website is not solely or primarily used to promote and advertise the University’s own products and services. Generally, costs in relation to feasibility studies during the planning phase of a website, and ongoing costs of maintenance during the operating phase are also considered to be expenses.
(d) Intangible assets Development costs, software and licences
Consolidated Parent entity $000 $000
Balance at 1 January 2016Cost 23,695 23,613Accumulated amortisation and impairment (3,423) (3,392)
Net book amount 20,272 20,221
Year ended 31 December 2016 Opening net book amount 20,272 20,221Impairment (1,006) (1,006)Additions 620 619Amortisation (2,761) (2,751)
Closing net book amount 17,125 17,083
At 31 December 2016 Cost 23,312 23,226Accumulated amortisation and impairment (6,187) (6,143)
Net book amount 17,125 17,083
Year ended 31 December 2017 Opening net book amount 17,125 17,083Additions 14,219 14,220Transfers due to liquidation – 41Amortisation (2,887) (2,887)
Closing net book amount 28,457 28,457
At 31 December 2017 Cost 37,531 37,531Accumulated amortisation and impairment (9,074) (9,074)
Net book amount 28,457 28,457
SWINBURNE UNIVERSITY OF TECHNOLOGYSFR :30

(e) Investment properties Consolidated Parent entity
2017 2016 2017 2016 $000 $000 $000 $000
Opening balance at 1 January 16,060 7,500 16,060 7,500Additions at cost – 8,560 – 8,560Revaluation 1,179 – 1,179 –
Closing balance at 31 December 17,239 16,060 17,239 16,060
Amounts recognised in the Income statement for investment properties Rental income 602 285 602 285Direct operating expenses (26) – (26) –
Total recognised in the Income statement 576 285 576 285
(i) Recognition of investment properties
Investment properties represent properties held to earn rentals or for capital appreciation, or both. Investment properties exclude properties held to meet service delivery objectives of the entity. Investment properties are initially measured at cost. Costs incurred subsequent to initial acquisition are capitalised when it is probable that future economic benefits in excess of the originally assessed performance of the asset will flow to the entity. Subsequent to initial measurement at cost, investment properties are revalued to fair value with changes in the fair value recognised as other economic flows in the Income statement in the period that they arise. Fair values are determined based on a market comparable approach that reflects recent transaction prices for similar properties. A valuation was conducted by the Valuer-General in 2017.
Rental income from the leasing of investment properties is recognised in the Income statement on a straight line basis over the lease term.
Investment properties are measured at fair value with regard to the property’s highest and best use after due consideration is made for any legal, financial or physical restrictions imposed on the asset, or any public announcements or commitments made in relation to the intended use of the asset.
No non-current assets are pledged as security against the investment properties held by the University. No contractual obligations relate to the investment properties other than lease arrangements.
(ii) Leasing arrangements
The future minimum lease payments under non-cancellable operating leases are in aggregate and for each of the following periods:
Consolidated Parent entity
2017 2016 2017 2016 $000 $000 $000 $000
Lease agreements Within one year 3,434 3,472 3,434 3,472Later than one year but not later than five years 9,810 12,646 9,810 12,646Later than five years 2,677 2,791 2,677 2,791
Total 15,921 18,909 15,921 18,909
Note: the leasing arrangements relate to investment properties held by the University outlined above.
(f) Other non-financial assets Consolidated Parent entity
2017 2016 2017 2016 $000 $000 $000 $000
Current Prepayments and Deposits 10,884 10,163 10,850 10,102Accrued income 13,037 5,473 12,941 5,373
Total other current non-financial assets 23,921 15,636 23,791 15,475
Non-current Prepayments and Deposits 68 – 72 –
Total other non-current non-financial assets 68 – 72 –
Total other non-financial assets 23,989 15,636 23,863 15,475
2017 ANNUAL REPORT SFR :31
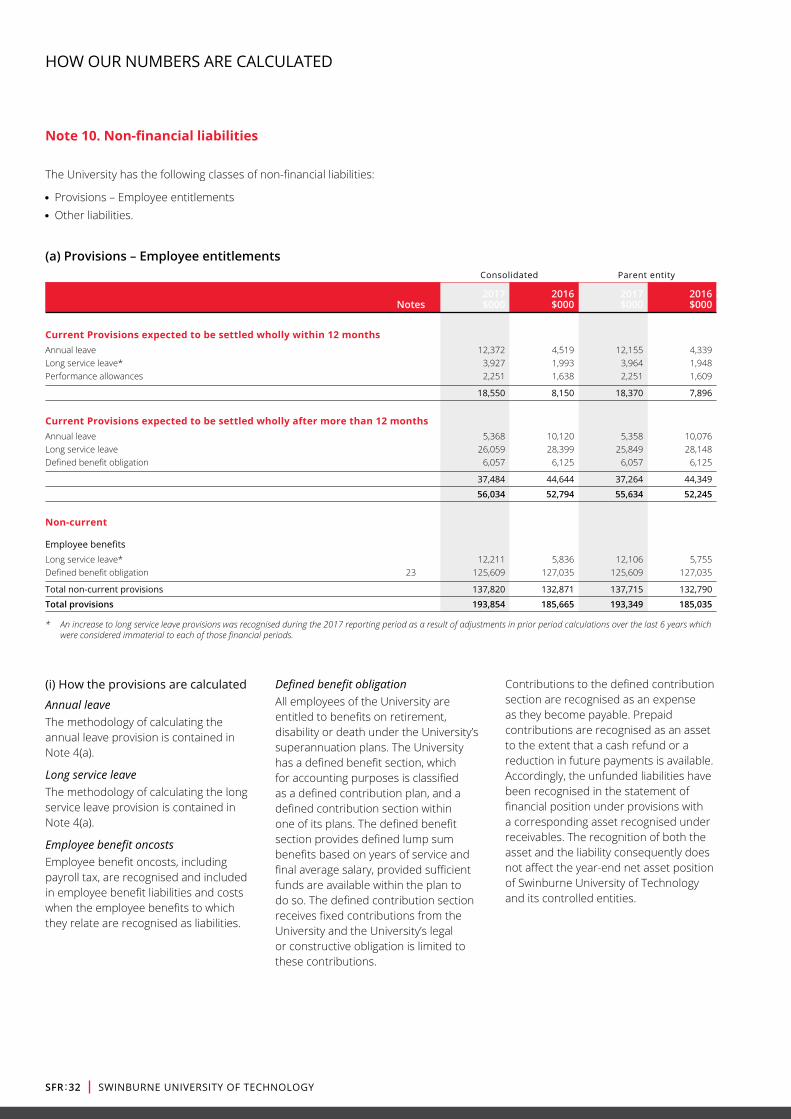
Note 10. Non-financial liabilities
The University has the following classes of non-financial liabilities:
• Provisions – Employee entitlements• Other liabilities.
(a) Provisions – Employee entitlements Consolidated Parent entity
2017 2016 2017 2016 Notes $000 $000 $000 $000
Current Provisions expected to be settled wholly within 12 months Annual leave 12,372 4,519 12,155 4,339 Long service leave* 3,927 1,993 3,964 1,948 Performance allowances 2,251 1,638 2,251 1,609
18,550 8,150 18,370 7,896
Current Provisions expected to be settled wholly after more than 12 months Annual leave 5,368 10,120 5,358 10,076 Long service leave 26,059 28,399 25,849 28,148 Defined benefit obligation 6,057 6,125 6,057 6,125
37,484 44,644 37,264 44,349
56,034 52,794 55,634 52,245
Non-current
Employee benefits Long service leave* 12,211 5,836 12,106 5,755Defined benefit obligation 23 125,609 127,035 125,609 127,035
Total non‑current provisions 137,820 132,871 137,715 132,790
Total provisions 193,854 185,665 193,349 185,035
* An increase to long service leave provisions was recognised during the 2017 reporting period as a result of adjustments in prior period calculations over the last 6 years which were considered immaterial to each of those financial periods.
(i) How the provisions are calculated
Annual leaveThe methodology of calculating the annual leave provision is contained in Note 4(a).
Long service leaveThe methodology of calculating the long service leave provision is contained in Note 4(a).
Employee benefit oncosts Employee benefit oncosts, including payroll tax, are recognised and included in employee benefit liabilities and costs when the employee benefits to which they relate are recognised as liabilities.
Defined benefit obligation All employees of the University are entitled to benefits on retirement, disability or death under the University’s superannuation plans. The University has a defined benefit section, which for accounting purposes is classified as a defined contribution plan, and a defined contribution section within one of its plans. The defined benefit section provides defined lump sum benefits based on years of service and final average salary, provided sufficient funds are available within the plan to do so. The defined contribution section receives fixed contributions from the University and the University’s legal or constructive obligation is limited to these contributions.
Contributions to the defined contribution section are recognised as an expense as they become payable. Prepaid contributions are recognised as an asset to the extent that a cash refund or a reduction in future payments is available. Accordingly, the unfunded liabilities have been recognised in the statement of financial position under provisions with a corresponding asset recognised under receivables. The recognition of both the asset and the liability consequently does not affect the year-end net asset position of Swinburne University of Technology and its controlled entities.
HOW OUR NUMBERS ARE CALCULATED
SWINBURNE UNIVERSITY OF TECHNOLOGYSFR :32

(b) Other liabilities Consolidated Parent entity
2017 2016 2017 2016 $000 $000 $000 $000
Current Income received in advance 38,947 13,126 38,854 12,957Australian Government unspent financial assistance – 164 – 164Loan from subsidiary – – – 353
Total current other liabilities 38,947 13,290 38,854 13,474
Non-current Income received in advance 3,565 2,209 3,565 2,209
Total non‑current other liabilities 3,565 2,209 3,565 2,209
Total other liabilities 42,512 15,499 42,419 15,683
Carrying Net Fair Carryiing Net Fair Amount Value Amount Value
2017 2017 2016 2016 Notes $000 $000 $000 $000
Non-traded financial assets Cash and cash equivalents 7(a) 41,138 41,138 33,190 33,190Receivables 7(b) 18,571 18,571 15,270 15,270
Non-traded financial assets 59,709 59,709 48,460 48,460
Traded investments Unit trust fixed interest 7(c) 344,753 344,753 223,388 223,388Unlisted securities 7(c) 24,908 24,908 20,328 20,328
Total non-financial assets 369,661 369,661 243,716 243,716
Total financial assets 429,370 429,370 292,176 292,176
Non-traded financial liabilities Trade and other payables 8(a) 79,559 79,559 67,811 67,811
Non-traded financial liabilities 79,559 79,559 67,811 67,811
Total financial liabilities 79,559 79,559 67,811 67,811
The University also measures assets and liabilities at fair value on a non-recurring basis as a result of the reclassification of assets as held for sale.
Note 11. Fair value measurements
(a) Fair value measurements
The University measures and recognises the following assets and liabilities at fair value on a recurring basis after initial recognition, and is estimated for measurement and disclosure purposes:
• Financial assets held at fair value through the profit or loss• Available-for-sale financial assets• Land and buildings• Investment properties.
Due to the short term nature of the current receivables and payables, their carrying value is assumed to approximate their fair value. Based on credit history, it is expected that the receivables and payables that are neither past due nor impaired will be received and paid when due.
The carrying amounts and aggregate net fair values of financial assets and liabilities at the balance date are:
2017 ANNUAL REPORT SFR :33

(b) Fair value hierarchy
The University categorises assets and liabilities measured at fair value into a hierarchy based on the level of inputs used in measurement.
• Level 1: quoted prices (unadjusted) in active markets for identical assets and liabilities.• Level 2: inputs other than quoted prices within Level 1 that are observable for the asset or liability either directly or indirectly.• Level 3: inputs for the asset or liability that are not based on observable market data (unobservable inputs).
The level in the fair value hierarchy is determined on the basis of the lowest level input that is significant to the fair value measurement in its entirety.
Recognising fair value measurements
Fair value measurements recognised in the statement of financial position are categorised into the following levels at 31 December 2017.
2017 Level 1 Level 2 Level 3 Notes $000 $000 $000 $000
Recurring fair value measurements
Financial assets Available-for-sale investments 7(c) 369,661 344,753 – 24,908
369,661 344,753 – 24,908
Non‑Financial Assets Land 9(c) 290,027 – – 290,027Building 9(c) 409,128 – – 409,128Investment Property 9(e) 17,239 – 17,239 –
716,394 – 17,239 699,155
Fair value measurements at 31 December 2016
2016 Level 1 Level 2 Level 3 Notes $000 $000 $000 $000
Recurring fair value measurements
Financial assets Available-for-sale investments 7(c) 243,716 223,388 – 20,328
243,716 223,388 – 20,328
Non‑Financial Assets Land 9(c) 296,474 – – 296,474Building 9(c) 416,820 – – 416,820Investment Property 9(e) 16,060 – 16,060 –
729,354 – 16,060 713,294
There were no transfers between Levels 1, 2 or 3 for recurring fair value measurements during the year.
The fair value of assets or liabilities traded in active markets (such as publicly traded derivatives, and trading and available-for-sale securities) is based on quoted market prices for identical assets or liabilities at the statement of financial position date (Level 1). This is the most representative of fair value in the circumstances.
Note 11. Fair value measurements (continued)
HOW OUR NUMBERS ARE CALCULATED
2017 Level 1 Level 2 Level 3 Notes $000 $000 $000 $000
Non-recurring fair value measurements Property held for sale 9(b) 7,790 – 7,790 –
Total non‑recurring fair value measurements 7,790 – 7,790 –
SWINBURNE UNIVERSITY OF TECHNOLOGYSFR :34

(c) Valuation techniques used to derive Level 2 and Level 3 fair values
(i) Recurring fair value measurements
The fair value of financial instruments that are not traded in an active market is determined using valuation techniques. These valuation techniques maximise the use of observable market data where it is available and rely as little as possible on entity-specific estimates. If all significant inputs required to fair-value an instrument are observable, the instrument is included in Level 2. If one or more of the significant inputs is not based on observable market data, the instrument is included in Level 3.
The University uses a variety of methods and makes assumptions that are based on market conditions existing at each balance date. Specific valuation techniques are used to value financial instruments.
• Quoted market prices or dealer quotes for similar instruments are used in calculating fair value.
• The fair value of interest rate swaps is calculated as the present value of the estimated future cash flows based on observable yield curves.
• The fair value of forward foreign exchange contracts is determined using forward exchange rates at the balance date.
• Other techniques, such as discounted cash flow analysis, are used to determine fair value for the remaining financial instruments.
• The fair value of the University’s property assets is estimated based on appraisals performed by independent, professionally qualified property valuers.
(d) Fair value measurements using significant unobservable inputs (level 3)
The following table is a reconciliation of level 3 items for the periods ended 31 December 2017 and 2016.
Fair value Historical Cost
Unlisted equity Leasehold Plant and Library Other Plant securities Land Buildings Improvements Equipment Collections & Equipment Total Level 3 Fair Value measurements 2017 $000 $000 $000 $000 $000 $000 $000 $000
Opening balance 20,328 296,474 416,820 6 17,031 6,385 950 757,994Acquisitions 105 – 10,254 317 23,106 1,450 2 35,234Recognised in the Income statement – – (16,603) (31) (10,047) (2,346) (393) (29,420)Recognised in other comprehensive income 4,475 – – – – – – 4,475Transfers to PPE Held for Sale – (6,447) (1,343) – – – – (7,790)
Closing Balance 24,908 290,027 409,128 292 30,090 5,489 559 760,493
Fair value Historical Cost
Unlisted equity Leasehold Plant and Library Other Plant securities Land Buildings Improvements Equipment Collections & Equipment Total Level 3 Fair Value measurements 2016 $000 $000 $000 $000 $000 $000 $000 $000
Opening balance 16,146 281,930 428,299 13 23,255 11,787 950 762,380Acquisitions – 201 4,851 – 5,357 2,735 – 13,144Disposals – – – – (7) – – (7)Recognised in the Income statement – – (16,633) (7) (11,574) (8,137) – (36,351)Recognised in other comprehensive income 4,182 14,343 303 – – – – 18,828
Closing Balance 20,328 296,474 416,820 6 17,031 6,385 950 757,994
2017 ANNUAL REPORT SFR :35

(i) Valuation inputs and relationships to fair value
The following table summarises the quantitative information about the significant unobservable inputs used in Level 3 fair value measurements. See (c) above for the valuation techniques adopted.
Description Valuation Technique Significant Unobservable inputs
Land Market approach Community Service Obligation (CSO) adjustment Cost per unit ($000)
Building (Structure/Shell/Building Fabric) Depreciated Replacement Cost Useful Life Cost per unit ($000)
Available-for-sale investments – Unlisted Securities Adjusted net assets A reasonable estimate of the fair value is determined by reference to the underlying net asset base of the investment.
Note 11. Fair value measurements (continued)
Note 12. Reserves and retained earnings
(a) Reserves
The University has asset revaluation reserves relating to land, buildings and available-for-sale investments. These reserves capture the movement in carrying value of these assets.
The physical assets revaluation surplus arises on the revaluation of infrastructure, land and buildings.
The financial assets available-for-sale revaluation surplus arises on the revaluation of available-for-sale financial assets. Where a revalued financial asset is sold, a portion of the revaluation surplus which relates to that financial asset is effectively realised, and is recognised in the Income statement. Where a revalued financial asset is impaired, that portion of the revaluation surplus which relates to that financial asset is recognised in the Income statement. Consolidated Parent entity
2017 2016 2017 2016 $000 $000 $000 $000
Asset Revaluation Reserve Land 237,035 258,409 237,035 237,035Buildings 35,254 35,624 35,190 35,190Available-for-sale investment 41,360 24,398 40,959 24,308
Total reserves 313,649 318,431 313,184 296,533
Asset revaluation reserve – Land Balance at beginning of year 258,409 244,065 237,035 236,965 Increment/(Decrement) on revaluation of land – 14,344 – 70 Transfer from revaluation reserves to retained earnings (21,374) – – –
Balance at end of year 237,035 258,409 237,035 237,035
Asset revaluation reserve – Buildings Balance at beginning of year 35,624 35,320 35,190 35,256 Increment/(Decrement) on revaluation of buildings – 304 – (66) Transfer from revaluation reserves to retained earnings (370) – – –
Balance at end of year 35,254 35,624 35,190 35,190
Available‑for‑sale investment reserve Balance at beginning of year 24,398 31,336 24,308 31,337 Realised gains transferred to the Income statement (1,210) (14,626) (1,210) (14,727) Unrealised increment/(Decrement) on valuation of investments 18,172 7,688 17,861 7,698
Balance at end of year 41,360 24,398 40,959 24,308 Total reserves 313,649 318,431 313,184 296,533
(b) Retained earningsRetained earnings at the beginning of the year 654,487 634,297 646,531 625,388Net operating result for the year 104,037 20,190 103,870 21,143Transfer from revaluation reserves to retained earnings 21,743 – – –Transfer from Income statement – – 777 –
Retained earnings at the end of the year 780,267 654,487 751,178 646,531
HOW OUR NUMBERS ARE CALCULATED
SWINBURNE UNIVERSITY OF TECHNOLOGYSFR :36
This section of the notes discusses the University’s exposure to various risks and shows how these could affect the University’s financial performance.
Note 13. Critical accounting judgments
(a) Critical judgements in applying accounting policies
The preparation of the financial report in conformity with Australian Accounting Standards requires the use of certain critical accounting estimates. It also requires management to exercise its judgement in the process of applying Swinburne University of Technology’s accounting policies. The areas involving a higher degree of judgement or complexity, or areas where assumptions and estimates are significant to the financial report, are the valuation of non-current assets (such as land and buildings), available-for-sale financial assets, provision for employee entitlements and superannuation. The University obtains external advice in the calculation of these estimates. The estimates and underlying assumptions are reviewed on an ongoing basis. Revisions to accounting estimates are recognised in the period in which the estimate is revised if the revision affects only that period; or in the period of the revision and future periods if the revision affects both current and future periods.
Note 13. Critical accounting judgments 37
Note 14. Financial risk management 38
RISK
(b) Key sources of estimation uncertainty
The key source of estimation uncertainty for the University is the fair value measurement of some of its assets and liabilities. Some of the assumptions used in determining the fair value of the relevant assets and liabilities have a significant risk of causing a material adjustment to the carrying amounts within the next financial year.
In estimating the fair value of an asset or a liability the University uses market-observable data to the extent it is available. Where Level 1 inputs are not available the University engages qualified valuers to undertake this task.
2017 ANNUAL REPORT SFR :37

Note 14. Financial risk management
The University’s activities expose it to a variety of financial risks that are overseen by the University Resources Committee. Financial Risk Management is carried out by a central treasury section within the Corporate Finance department of the University, which adheres to policies approved by the University Council.
Since August 2016, Mercer Investments (Australia) Limited has acted as manager of the University’s long-term investments in Equities and Fixed Interest Markets.
As part of the overall investment procedure, the investment strategy is reviewed annually in line with changes to the University’s cash flow requirements and anticipated market returns. The University’s corporate finance department has policies and procedures covering specific areas, such as cash management, investment of funds and the use of foreign exchange contracts. The University’s financial instruments consist mainly of deposits with banks and cash funds, a portfolio of managed funds, equity instruments, accounts receivable and payables.
Key financial risks and management’s strategy for managing them are outlined below.
Risk Description Strategy for management
Market risk
Interest rate risk The University’s exposure to market risk for changes in interest rates relates primarily to short-to medium-term investments.
The University manages the portfolio primarily by investing in a mixture of cash funds and benchmarks the portfolio for this category against the UBS Australian Bank Bill Index (for short-term investments) and the UBS Australian Composite Bond Index (for medium-term investments).
Equity market risk The University is exposed to equity securities price risk because of long-term investments held within the managed portfolio, which is further diversified by the spread of equity holdings.
This is managed primarily by benchmarking against S & P/ASX 300 Accumulation Index, MSCI World (ex Australia) Accumulation Index in AUD, and diversifying the portfolio across different asset classes including Australian Property and Infrastructure. The University also holds a portfolio of trust funds that is invested in Australian equities and benchmarked against the S & P/ASX 100 Price Index.
Foreign exchange risk The University purchases specialised equipment from overseas and is exposed to foreign exchange risk arising from various currency exposures.
To manage its foreign exchange risk the University has at specific times taken out forward exchange contracts on the placement of a commitment to purchase the equipment. The University also leases specialised equipment from overseas and reduces the risk by holding US dollars in a nominated bank account from which lease payments are made.
Credit risk
The exposure to credit risk at the balance date in relation to each class of financial asset is the carrying amount of those assets, net of any provisions for impairment as disclosed in the notes to the financial statements.
The consolidated entity does not have any material or significant credit risk exposure within the entity to any group of receivables.
Liquidity risk
The University’s objective is to maintain a high level of liquidity in order to fund the University Capital Management Plan and its expansion plans, to pursue the University’s growth in keeping with the Council-endorsed Vice Chancellor’s Vision Statement for the year 2020.
RISK
SWINBURNE UNIVERSITY OF TECHNOLOGYSFR :38

(a) Terms, conditions and accounting policies
Recognised financial instruments Notes Accounting policies Terms and conditions
(i) Financial assets
Cash and cash equivalents 7(a) Cash at bank is carried at the principal amount. Interest received on any bank balance is recognised as income when the bank account is credited. Interest receivable at the balance date is accounted for by crediting revenue and debiting accrued Income in the Statement of Financial Position.
Interest is paid in quarterly and half-yearly instalments, at the prevailing bank rate, based on the average credit balance in the bank account.
Receivables 7(b) Debtors are carried at the nominal amounts due less any provision for doubtful debts and impairment. A doubtful debts provision is made for amounts that are considered unlikely to be collectable, or are impaired.
Credit is allowed for a 30 day term from end of invoice month.
Shares in Corporations 7(c) Shares in corporations are carried at fair value. Dividends are recognised as income when received and changes in fair value are adjusted in the revaluation reserve in the Statement of Financial Position, provided there is a credit balance in the revaluation reserve. Decreases in fair value that exceed the balance in the revaluation reserve are recognised in the Income statement.
Shares in corporations are listed on Australian and International Stock Exchanges. Dividends are dependent on resolutions of the directors of the corporations concerned.
Unit Trusts 7(c) Managed Trust funds, listed equity securities and income securities are carried at fair value. Interest revenue is recognised when it is received and changes in fair value are adjusted in the Income statement provided no previous revaluation reserve balance exists. Interest receivable at the balance date is accounted for by crediting revenue and debiting accrued income in the Statement of Financial Position.
The portfolio is managed against agreed benchmarks for performance.
(ii) Financial liabilities
Trade and other payables 8(a) Payables are recognised for future amounts to be paid in respect of goods and services received, whether or not billed to the university.
Settlement of payables is normally effected 30 days after the end of the month the debt is incurred.
2017 ANNUAL REPORT SFR :39

(b) Interest rate risk exposures
The University’s exposure to interest rate risk and the effective weighted average interest rate by maturity period is set out in the following table. For interest rates applicable to each class of asset or liability refer to individual notes to the financial statements. Exposures arise predominantly from assets bearing variable interest rates, as the consolidated entity intends to hold assets to maturity in accordance with the investment policy. This policy is reviewed annually in line with changes to the University’s cash flow requirements and anticipated market returns.
The following table summarises the maturity of the consolidated entity’s financial assets and financial liabilities.
2017 Fixed interest maturing in
Average Variable 1 Year Over 1–5 More than Non‑interest Interest Rate Interest Rate or less Years 5 Years Bearing Total Notes % $000 $000 $000 $000 $000 $000
Financial assets Cash and cash equivalents 7(a) 2.30 39,098 – – – 2,040 41,138Receivables 7(b) – – – – 18,571 18,571Available-for-sale financial assets 7(c) – – – – 369,661 369,661
39,098 – – – 390,272 429,370
Weighted average interest rate 2.30%
Financial liabilities Trade and other payables 8(a) – – – – (79,559) (79,559)
– – – – (79,559) (79,559)
Net financial assets/(liabilities) 39,098 – – – 310,713 349,811
2016 Fixed interest maturing in
Average Variable 1 Year Over 1–5 More than Non‑interest Interest Rate Interest Rate or less Years 5 Years Bearing Total Notes % $000 $000 $000 $000 $000 $000
Financial assets Cash and cash equivalents 7(a) 2.33 32,128 – – – 1,062 33,190Receivables 7(b) – – – – 15,270 15,270Available-for-sale financial assets 7(c) – – – – 243,716 243,716
32,128 – – – 260,048 292,176
Weighted average interest rate 2.33%
Financial liabilities Trade and other payables 8(a) – – – – (67,811) (67,811)
– – – – (67,811) (67,811)
Net financial assets/(liabilities) 32,128 – – – 192,237 224,365
Note 14. Financial risk management (continued)
RISK
SWINBURNE UNIVERSITY OF TECHNOLOGYSFR :40

(c) Summarised sensitivity analysis
The following table summarises the sensitivity of the consolidated entity’s financial assets and financial liabilities to interest rate risk, foreign exchange risk and other price risk.
Interest rate risk Foreign exchange risk Other price risk -2% 2% -10% 10% -10% 10%
Carrying amount Result Equity Result Equity Result Equity Result Equity Result Equity Result Equity 31 December 2017 $000 $000 $000 $000 $000 $000 $000 $000 $000 $000 $000 $000 $000
Financial AssetsCash and cash equivalents 41,138 (782) (782) 782 782 (189) (189) 189 189 – – – –Receivables 18,571 – – – – – – – – – – – –Available-for-sale financial assets 369,661 (6,895) (6,895) 6,895 6,895 – – – – (34,475) (34,475) 34,475 34,475
Financial LiabilitiesTrade and other payables (79,559) – – – – – – – – – – – –
Total Increase/(Decrease) (7,677) (7,677) 7,677 7,677 (189) (189) 189 189 (34,475) (34,475) 34,475 34,475
Interest rate risk Foreign exchange risk Other price risk -2% 2% -10% 10% -10% 10%
Carrying amount Result Equity Result Equity Result Equity Result Equity Result Equity Result Equity 31 December 2016 $000 $000 $000 $000 $000 $000 $000 $000 $000 $000 $000 $000 $000
Financial AssetsCash and cash equivalents 33,190 (643) (643) 643 643 (89) (89) 89 89 – – – –Receivables 15,270 – – – – – – – – – – – –Available-for-sale financial assets 243,716 (4,468) (4,468) 4,468 4,468 – – – – (22,339) (22,339) 22,339 22,339
Financial LiabilitiesTrade and other payables (67,811) – – – – – – – – – – – –
Total Increase/(Decrease) (5,111) (5,111) 5,111 5,111 (89) (89) 89 89 (22,339) (22,339) 22,339 22,339
Note: Financial Liabilities are at fixed rates of interest over the life of the loan or lease.
2017 ANNUAL REPORT SFR :41

This section provides information that will help users understand how the University structure affects the financial position and performance of the University as a whole. In particular there is information about:
• Subsidiaries of the University• Interests in joint operations• Associates• Unconsolidated structured entities.
Note 15. Subsidiaries 42
Note 16. Interests in associates and joint operations 43
GROUP STRUCTURE
Note 15. Subsidiaries
The consolidated financial statements incorporate the assets, liabilities and results of the following subsidiaries.
Country of Class of Ownership Net Total Net incorporation shares Interest equity Revenue Result
2017 2016 2017 2016 2017 2016 2017 2016 % % $000 $000 $000 $000 $000 $000
Swinburne Limited Australia Ltd. By Guarantee 100 100 16,249 17,033 – 1,237 – (2,732) National Institute of Circus Arts Ltd Australia Ltd. By Guarantee 100 100 3,520 3,153 6,573 6,499 367 441Swinburne College Pty Ltd Australia Ordinary 100 100 347 341 – – – (7)Swinburne Ventures Limited Australia Ltd. By Guarantee 100 100 – – – – – – Swinburne Intellectual Property Trust Australia Unincorporated 100 100 1,453 1,726 107 1,388 (273) 1,237Swinburne Student AmenitiesAssociation Ltd Australia Ltd. By Guarantee 100 100 8,487 8,183 3,584 3,653 4 181
Total 30,056 30,436 10,264 12,777 98 (880)
The consolidated financial report incorporates the assets and liabilities of all subsidiaries controlled by Swinburne University of Technology as at 31 December 2017 and the financial results of all subsidiary entities for the year then ended. Swinburne University of Technology and its subsidiary entities together are referred to in this financial report as the University. Subsidiaries are all those entities (including structured entities) over which the University has control. Intercompany transactions, balances and unrealised gains on
transactions between Group companies are eliminated. Unrealised losses are also eliminated unless the transaction provides evidence of the impairment of the asset transferred. Accounting policies of subsidiaries have been changed where necessary to ensure consistency with the policies adopted by the University. Non-controlling interests in the results and equity of subsidiaries are shown separately in the consolidated statement of comprehensive income, statement of financial position and statement of changes in equity respectively, where such interests exist.
During the year, the University formally commenced activities to wind up, liquidate and deregister Swinburne Limited and Swinburne College Pty Ltd. As part of the voluntary liquidation, the assets and liabilities of the entities were transferred at fair value to the parent entity of the University and intercompany balances have been extinguished. The final distribution and appropriation of surplus assets will be recorded in the parent entity in 2018.
SWINBURNE UNIVERSITY OF TECHNOLOGYSFR :42
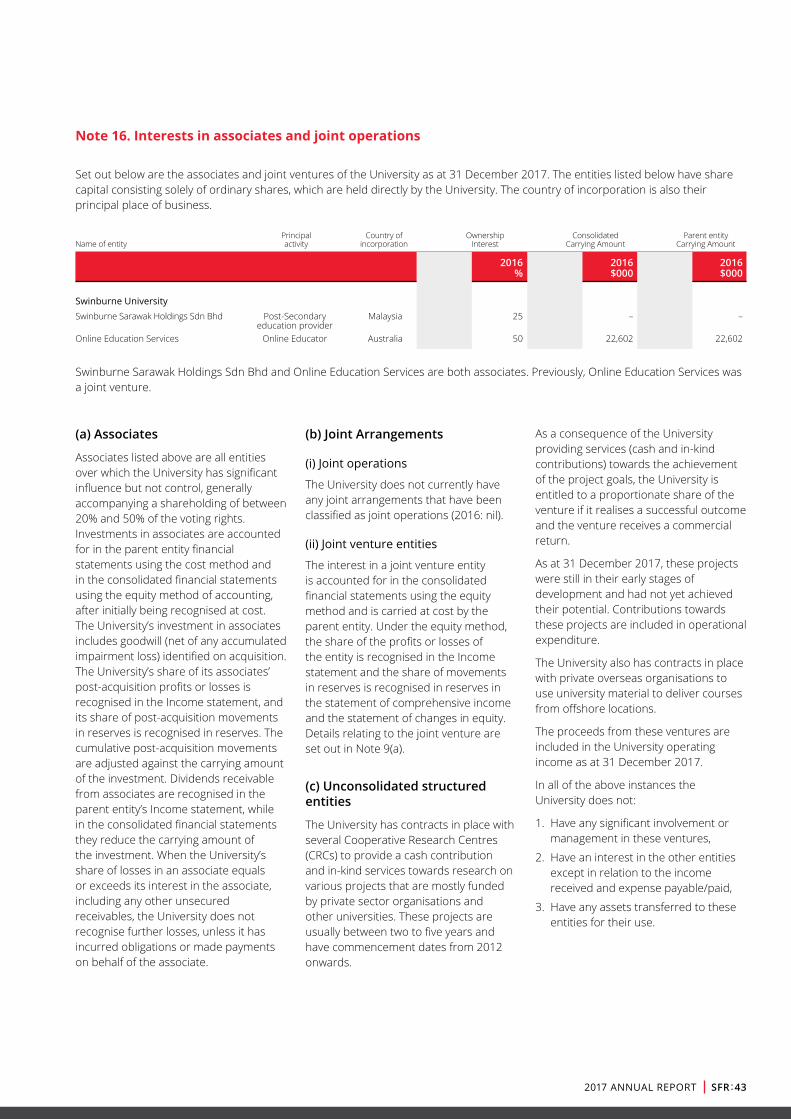
Note 16. Interests in associates and joint operations
Set out below are the associates and joint ventures of the University as at 31 December 2017. The entities listed below have share capital consisting solely of ordinary shares, which are held directly by the University. The country of incorporation is also their principal place of business.
Principal Country of Ownership Consolidated Parent entity Name of entity activity incorporation Interest Carrying Amount Carrying Amount
2017 2016 2017 2016 2017 2016 % % $000 $000 $000 $000
Swinburne University Swinburne Sarawak Holdings Sdn Bhd Post-Secondary Malaysia 25 25 1,009 – 1,009 – education providerOnline Education Services Online Educator Australia 20 50 9,469 22,602 9,469 22,602
Swinburne Sarawak Holdings Sdn Bhd and Online Education Services are both associates. Previously, Online Education Services was a joint venture.
(a) Associates
Associates listed above are all entities over which the University has significant influence but not control, generally accompanying a shareholding of between 20% and 50% of the voting rights. Investments in associates are accounted for in the parent entity financial statements using the cost method and in the consolidated financial statements using the equity method of accounting, after initially being recognised at cost. The University’s investment in associates includes goodwill (net of any accumulated impairment loss) identified on acquisition. The University’s share of its associates’ post-acquisition profits or losses is recognised in the Income statement, and its share of post-acquisition movements in reserves is recognised in reserves. The cumulative post-acquisition movements are adjusted against the carrying amount of the investment. Dividends receivable from associates are recognised in the parent entity’s Income statement, while in the consolidated financial statements they reduce the carrying amount of the investment. When the University’s share of losses in an associate equals or exceeds its interest in the associate, including any other unsecured receivables, the University does not recognise further losses, unless it has incurred obligations or made payments on behalf of the associate.
(b) Joint Arrangements
(i) Joint operations
The University does not currently have any joint arrangements that have been classified as joint operations (2016: nil).
(ii) Joint venture entities
The interest in a joint venture entity is accounted for in the consolidated financial statements using the equity method and is carried at cost by the parent entity. Under the equity method, the share of the profits or losses of the entity is recognised in the Income statement and the share of movements in reserves is recognised in reserves in the statement of comprehensive income and the statement of changes in equity. Details relating to the joint venture are set out in Note 9(a).
(c) Unconsolidated structured entities
The University has contracts in place with several Cooperative Research Centres (CRCs) to provide a cash contribution and in-kind services towards research on various projects that are mostly funded by private sector organisations and other universities. These projects are usually between two to five years and have commencement dates from 2012 onwards.
As a consequence of the University providing services (cash and in-kind contributions) towards the achievement of the project goals, the University is entitled to a proportionate share of the venture if it realises a successful outcome and the venture receives a commercial return.
As at 31 December 2017, these projects were still in their early stages of development and had not yet achieved their potential. Contributions towards these projects are included in operational expenditure.
The University also has contracts in place with private overseas organisations to use university material to deliver courses from offshore locations.
The proceeds from these ventures are included in the University operating income as at 31 December 2017.
In all of the above instances the University does not:
1. Have any significant involvement or management in these ventures,
2. Have an interest in the other entities except in relation to the income received and expense payable/paid,
3. Have any assets transferred to these entities for their use.
2017 ANNUAL REPORT SFR :43

This section of the notes provides information about items that are not recognised in the financial statements as they do not (yet) satisfy the recognition criteria.
Note 17. Contingencies 44
Note 18. Commitments 45
Note 19. Events occurring after the balance date 45
UNRECOGNISED ITEMS
Note 17. Contingencies
Contingent assets and liabilities are not recognised in the Statement of financial position, but are disclosed and, if quantifiable, are measured at nominal value. Contingent assets and liabilities are presented inclusive of the GST receivable or payable respectively.
(a) Contingent liabilities
A number of legal claims and exposures arise from the ordinary course of business, none of which are individually significant. Where it is not probable that the University will incur a liability, no amount has been included in these financial statements. Additionally, there are a number of legal claims or potential claims against the University, the outcome of which cannot be foreseen at present, and for which no amounts have been included.
(b) Contingent assets
The parent entity and consolidated entity have no contingent assets at 31 December 2017 (2016: nil).
SWINBURNE UNIVERSITY OF TECHNOLOGYSFR :44

Note 18. Commitments
Commitments include those operating, capital and other outsourcing commitments arising from non-cancellable contractual or statutory sources and are disclosed at their nominal value and inclusive of GST payable.
Note 19. Events occurring after the balance date
There has not arisen in the interval between the end of the financial year and the date of this report any item, transaction, or event of a material or unusual nature likely, in the opinion of the Council, to affect substantially the operations of the University, the result of those operations, or state of affairs of the University in subsequent financial years.
(a) Capital commitments
Capital expenditure contracted as at the reporting date but not recognised as a liability is as follows:
Consolidated Parent entity
2017 2016 2017 2016 $000 $000 $000 $000
Property, Plant and Equipment Payable: Within one year 4,976 921 4,976 921
Total property, plant and equipment 4,976 921 4,976 921
There are no capital commitments with regard to joint ventures or associates (2016: nil).
(b) Lease commitments
(i) Operating leases for Property and Equipment
Commitments for minimum lease payments in relation to non-cancellable operating leases are payable as follows:
Consolidated Parent entity
2017 2016 2017 2016 $000 $000 $000 $000
Within one year 3,956 553 3,956 394Later than one year but not later than five years 4,129 475 4,129 459Later than five years – – – –
Total commitments for minimum lease payments 8,085 1,028 8,085 853
Accounting treatment for operating leasesLeases in which a significant portion of the risks and rewards of ownership are retained by the lessor are classified as operating leases.
(ii) Finance Leases
There are no finance leases for 2017 (2016: nil).
(iii) Other expenditure commitments Consolidated Parent entity
2017 2016 2017 2016 $000 $000 $000 $000
Payable: Within one year 14,652 16,333 14,652 16,333Later than one year but not later than five years 13,038 13,196 13,038 13,196Later than five years 852 – 852 –
Total 28,542 29,529 28,542 29,529
2017 ANNUAL REPORT SFR :45

This section of the notes includes other information that must be disclosed to comply with the accounting standards and other pronouncements, but that is not immediately related to the individual line items in the financial statements.
Note 20. Key management personnel disclosures 46
Note 21. Remuneration of auditors 49
Note 22. Related parties 49
Note 23. Defined benefit plans 51
Note 24. Disaggregated information 53
Note 25. Acquittal of Australian Government financial assistance 57
Note 26. Other accounting policies 59
OTHER INFORMATION
(a) Names of responsible persons
For the purposes of the Financial Management Act 1994 (Vic), the Victorian Minister for Training and Skills and the University Council are responsible persons of the University.
The following persons held the position of Minister for Training and Skills during the year ended 31 December 2017:
• Hon. Gayle Tierney MLC, Minister for Training and Skills
Remuneration of the Minister for Training and Skills is disclosed in the financial report of the Department of Premier and Cabinet. Other relevant interests are declared in the Register of Members interests which are completed by each member of the Parliament.
Note 20. Key management personnel disclosures
The following persons were responsible persons of Swinburne University of Technology during the year:
• Mr G Goldsmith (Chancellor)• Professor L Kristjanson AO (Vice‑Chancellor)• Ms K Mander• Ms G Farrell• Ms V Peterson• Ms R Roberts• Mr A Mackay• Mr A Dix• Mr A Schwartz• Mr D Singleton• Ms C Rojas• Mr A Islam• Professor B Van Gramberg (appointed 1 January 2017)
SWINBURNE UNIVERSITY OF TECHNOLOGYSFR :46

(b) Remuneration of council members
Income paid or payable, or otherwise made available to Council Members by entities in the consolidated entity and related parties in connection with the management of affairs of the parent entity, is outlined below.
Consolidated Parent entity
2017 2016 2017 2016 Number Number Number Number
Nil to $9,999 2 2 2 2$10,000 to $19,999 – 1 – 1$30,000 to $39,999 9 7 9 7$70,000 to $79,999 1 – 1 –$90,000 to $99,999 – 1 – 1$250,000 to $259,999 – 1 – 1$910,000 to $919,999 – 1 – 1$950,000 to $959,999 1 – 1 –
Annualised Employee Equivalent (AEE) 13 13 13 13
Total Remuneration 1,339 1,526 1,339 1,526
Details of responsible persons and executives of controlled entities are disclosed in the respective financial statements of those entities.
Of the remuneration outlined in the tables above, $77,500 has been donated to charity by the following Council members:
• Mr G Goldsmith• Mr A Schwartz
(c) Remuneration of executive officers
Income paid or payable, or otherwise made available to Executive Officers by entities in the consolidated entity and related parties in connection with the management of affairs of the parent entity, is outlined below. Consolidated Parent entity
2017 2016 2017 2016 $000 $000 $000 $000
Short-term employee benefits 4,745 – 4,745 –Post-employment benefits 572 – 572 –Other long-term benefits 100 – 100 –
Total remuneration 5,417 – 5,417 –
Total number of executive officers 12 – 12 –
Total annualised employee equivalent (AEE) 12 – 12 –
No comparatives have been reported because remuneration in the prior year was determined in line with the basis and definition under FRD 21B.
The following person held office as a member of the University Council and as an executive officer of the University during the financial year:
• Professor L Kristjanson AO
To avoid duplication, Professor L Kristjanson AO’s remuneration has only been included in the above Council remuneration tables and not in the executive officer remuneration tables.
Consolidated Parent entity
2017 2016 2017 2016 $000 $000 $000 $000
Short-term employee benefits 5,923 – 5,923 –Post–employment benefits 716 – 716 –Other long–term benefits 117 – 117 –
Total remuneration 6,756 – 6,756 –
Total number of key management personnel 25 – 25 –
Total annualised employee equivalent (AEE) 13 – 13 –
(d) Key management personnel
Council members and executive officers are considered to be key management personnel for both the consolidated entity and parent entity.
2017 ANNUAL REPORT SFR :47

Note 20. Key management personnel disclosures (continued)
(d) Key management personnel (continued)
No comparatives have been reported because remuneration in the prior year was determined in line with the basis and definition under FRD 21B.
The following person held office as a member of the University Council and as an executive officer of the University during the financial year:
• Professor L Kristjanson AO
To avoid duplication, Professor L Kristjanson AO’s remuneration has only been included in the above Council remuneration tables and not in the executive officer remuneration tables.
(e) Related party transactions
The Responsible Persons listed in the table below hold positions in another entity that results in them having control or significant influence over the financial or operating policies of that entity. These entities transacted with the University in the reporting period on an arm’s-length basis in the ordinary course of business and on normal commercial terms and conditions.
Responsible Person External Position Held
2017 Received/(Paid) by
the University$’000
2016 Received/(Paid) by
the University$’000
Mr G Goldsmith Director of SEEK Ltd (73) 77Mr A Dix Chair of the Audit Committee of the City of Boroondara – Received by the University 19 44
Chair of the Audit Committee of the City of Boroondara – Paid by the University (28) (43)Chair of the Finance, Audit and Risk Committee of Western Leisure Services Pty Limited 11 –
Mr A Mackay Chair and Director of the Australian Council for Educational Research 3 –Director of Carey Baptist Grammar School – Received by the University 3 –Director of Carey Baptist Grammar School – Paid by the University (1) –
Mr D Singleton Board member of the Standards Australia 9 10Ms J Ward Board member of Aviation/Aerospace Australia (20) –
Board member of the South East Melbourne Manufacturers Alliance (2) –Mr A Schwartz Chairman on the Board of Directors of Philanthropy Australia (2) (6)Prof. L Kristjanson AO* Director of AARNet – (996)Prof. J Kyd** Director of the Australian Institute of Policy and Science – (11)
* Prof L Kristjanson AO is no longer a Director of AARNet in 2017. Therefore nil has been disclosed.** Prof J Kyd is no longer a Key Management Personnel at the University.
(f) Loans to key management personnel
There are no loans between the University and its key management personnel as at the reporting date.
OTHER INFORMATION
SWINBURNE UNIVERSITY OF TECHNOLOGYSFR :48
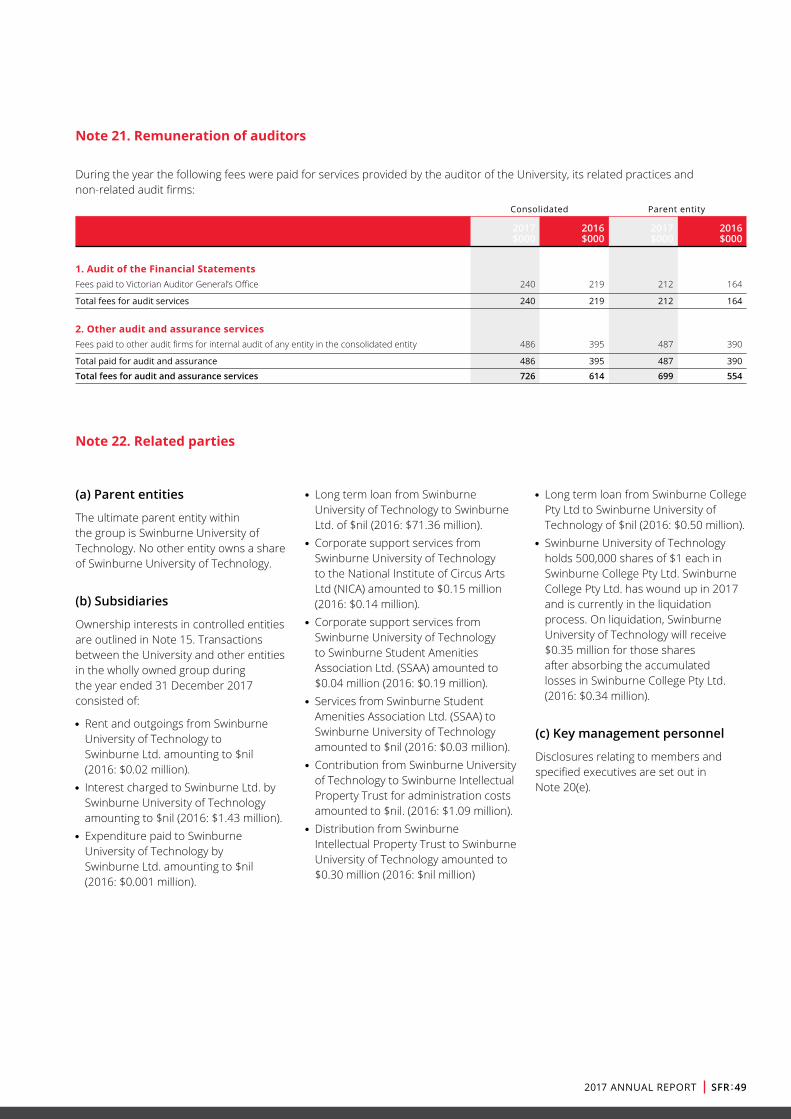
Note 21. Remuneration of auditors
During the year the following fees were paid for services provided by the auditor of the University, its related practices and non-related audit firms:
Consolidated Parent entity
2017 2016 2017 2016 $000 $000 $000 $000
1. Audit of the Financial Statements Fees paid to Victorian Auditor General’s Office 240 219 212 164
Total fees for audit services 240 219 212 164
2. Other audit and assurance services Fees paid to other audit firms for internal audit of any entity in the consolidated entity 486 395 487 390
Total paid for audit and assurance 486 395 487 390
Total fees for audit and assurance services 726 614 699 554
Note 22. Related parties
(a) Parent entities
The ultimate parent entity within the group is Swinburne University of Technology. No other entity owns a share of Swinburne University of Technology.
(b) Subsidiaries
Ownership interests in controlled entities are outlined in Note 15. Transactions between the University and other entities in the wholly owned group during the year ended 31 December 2017 consisted of:
• Rent and outgoings from Swinburne University of Technology to Swinburne Ltd. amounting to $nil (2016: $0.02 million).
• Interest charged to Swinburne Ltd. by Swinburne University of Technology amounting to $nil (2016: $1.43 million).
• Expenditure paid to Swinburne University of Technology by Swinburne Ltd. amounting to $nil (2016: $0.001 million).
• Long term loan from Swinburne University of Technology to Swinburne Ltd. of $nil (2016: $71.36 million).
• Corporate support services from Swinburne University of Technology to the National Institute of Circus Arts Ltd (NICA) amounted to $0.15 million (2016: $0.14 million).
• Corporate support services from Swinburne University of Technology to Swinburne Student Amenities Association Ltd. (SSAA) amounted to $0.04 million (2016: $0.19 million).
• Services from Swinburne Student Amenities Association Ltd. (SSAA) to Swinburne University of Technology amounted to $nil (2016: $0.03 million).
• Contribution from Swinburne University of Technology to Swinburne Intellectual Property Trust for administration costs amounted to $nil. (2016: $1.09 million).
• Distribution from Swinburne Intellectual Property Trust to Swinburne University of Technology amounted to $0.30 million (2016: $nil million)
• Long term loan from Swinburne College Pty Ltd to Swinburne University of Technology of $nil (2016: $0.50 million).
• Swinburne University of Technology holds 500,000 shares of $1 each in Swinburne College Pty Ltd. Swinburne College Pty Ltd. has wound up in 2017 and is currently in the liquidation process. On liquidation, Swinburne University of Technology will receive $0.35 million for those shares after absorbing the accumulated losses in Swinburne College Pty Ltd. (2016: $0.34 million).
(c) Key management personnel
Disclosures relating to members and specified executives are set out in Note 20(e).
2017 ANNUAL REPORT SFR :49

(d) Associates and joint ventures
Ownership of interests in associated and joint ventures are outlined in Note 15. Transactions between the University and its associates and joint ventures during the year ended 31 December 2017 consisted of:
Note 22. Related parties continued
Consolidated Parent entity
2017 2016 2017 2016 $000 $000 $000 $000
Income from transactions with associates and joint ventures Revenue from teaching services 97,085 103,657 97,085 103,657Library and licence fees 1,587 1,675 1,587 1,675Royalties 2,913 2,818 2,913 2,818Share of profit on investments accounted for using the equity method 7,258 13,140 7,258 13,140
108,843 121,290 108,843 121,290
Purchase of services from associates and joint ventures Contract teaching services 84,337 89,726 84,337 89,726Reimbursement of audit fees 57 35 57 35
84,394 89,761 84,394 89,761
The following balances are outstanding at the reporting date in relation to transactions with controlled and associated entities:
Consolidated Parent entity
2017 2016 2017 2016 $000 $000 $000 $000
Current receivables (goods, services and loans) Controlled entities – – – 71,504Non-current receivables (loans) Associated entities 1,067 1,044 1,067 1,044Current payable (goods, services and loans) Controlled entities – – 20,083 4,639Non-current payable (loans)
No provision for doubtful debts has been raised in relation to any outstanding balances, and no expense has been recognised in respect of bad or doubtful debts due from related parties.
There has been no receipt or payment of interest on outstanding balances with controlled entities or associated companies in 2017 (2016: $ nil).
OTHER INFORMATION
SWINBURNE UNIVERSITY OF TECHNOLOGYSFR :50

Note 23. Defined benefit plans
University employees are members of a range of superannuation schemes, which are divided into the following categories.
(a) Superannuation scheme for Australian universities
Swinburne University has a number of present staff who are members of the UniSuper Defined Benefit Division (DBD) and for whom defined benefits are payable on termination of employment. The Plan receives fixed contributions from the University, whereby the University's legal or constructive obligation is limited to these contributions.
UniSuper (The Scheme Trustee) has advised the University that it is a defined contribution plan under AASB 119.
Paragraph 25 of AASB 119 describes a defined contribution plan as a plan where the employer's legal or constructive obligation is limited to the amount that it agrees to contribute to the fund; and the actuarial risk (that benefits will be less than expected) and investment risk (that assets invested will be insufficient to meet expected benefits) fall on the employee.
Superannuation contributions are calculated in accordance with the award agreement and amounted to $33.19 million (2016: $29.28 million).
Superannuation contributions are also paid to employees who are members of numerous other funds and amounted to $3.32 million (2016: $2.85 million).
(i) Financial Position
As at 31 December 2017, the assets of the DBD in aggregate were estimated to be $2.80 million above vested benefits (2016: $2.25 million), after allowing for various reserves.
Vested benefits are not conditional upon continued membership (or any factor other than leaving the service of the participating institution) and include the value of indexed pensions being provided by the DBD. As at 31 December 2017, the assets of the DBD in aggregate were estimated to be $4.26 million above accrued benefits (2016: $3.76 million), after allowing for various reserves. The accrued benefits have been calculated as the present value of expected future benefit payments to members and indexed pensioners that arise from membership of UniSuper up to the reporting date. The vested benefit and accrued benefit liabilities were determined by the Fund’s actuary using the actuarial demographic assumptions outlined in their report on the actuarial investigation of the DBD as at 1 July 2017.
The financial assumptions used were:
Vested benefits Accrued benefits
2017 2016 2017 2016
Gross of tax investment return – DBD pensions 5.30% p.a. 5.30%p.a. 6.60% p.a. 6.90% p.a.Gross of tax investment return – commercial rate indexed pensions 2.90% p.a. 3.70% p.a. 2.90% p.a. 3.70% p.a.Net of tax investment return – non-pensioner members 4.70% p.a. 4.60% p.a. 5.80% p.a. 6.10% p.a.Consumer Price Index 2.00% p.a. 2.50% p.a. 2.00% p.a. 2.50% p.a.Inflationary salary increases long-term 3.00% p.a. 3.50% p.a. 3.00% p.a. 3.50% p.a.
* Assets have been included at their market value; that is, after allowing for realisation costs.
Clause 34 of the UniSuper Trust Deed was initiated following the 31 December 2008, 30 June 2011, 30 June 2012 and 30 June 2013 actuarial investigations. Following the end of the monitoring period commenced in relation to the 31 December 2008 actuarial investigation, the UniSuper Limited Board made a decision not to reduce accrued benefits but to reduce the rate at which benefits accrue with respect to the DBD membership after 1 January 2015.
Following the end of the monitoring period commenced in relation to the 30 June 2011 actuarial investigation, the Fund’s actuary advised that the Trustee is not required to take any further action under Clause 34 in relation to that monitoring period, and that monitoring period has now ceased.
2017 ANNUAL REPORT SFR :51

(b) State superannuation fund
(i) Higher education
Employer contributions are paid as costs emerge, that is, as employees become eligible for payment of the accrued benefits. Contributions paid by the University to the State Superannuation Fund are funded by Australian Government financial assistance, which is determined annually under the Higher Education Funding Act 1988. In 2017, contributions from the Australian Government were $9.42 million (2016: $9.19 million). No employer contributions were outstanding as at December 2017 (2016:$ nil).
Note 23. Defined benefit plans (continued)
(ii) Deferred government superannuation
Deferred benefits for superannuation relates to unfunded liabilities within the Victorian State Superannuation Fund. It includes liabilities for members’ benefits in excess of the fund's assets. The University complies with the Financial Reporting Directions and hence includes its share of unfunded superannuation liabilities in its financial statements. The amount attributable to the University has been assessed by the Government Superannuation Office as at 31 December 2017.
Under existing arrangements, the Australian Government provides funds
under the Higher Education Funding Act 1988 to cover pension payments and lump sums in respect of Higher Education employees paid by the University to the Victorian Government Superannuation Office. These arrangements have been in place for a number of years and it is reasonable to expect they will continue into the future.
Section14(1) of the States Grants (General Purposes) Act 1994 acknowledges the existence of a constructive obligation on the part of the Australian Government to continue funding universities for debts they incur in relation to emerging superannuation liabilities. The University has consequently brought to account an asset of sufficient value to offset the liability.
The following information has been provided by the Government Superannuation Office (GSO), which tabulates the net liability for the year ended 31 December 2017 in accordance with the requirements under AASB 119.
2017 2016 $000 $000
Accrued benefit liability 131,666 133,160Surplus/(deficiency) (131,666) (133,160)
Total liability (accrued benefits plus contributions tax) 131,666 133,160
Net assets/(liability) (131,666) (133,160)
2017 2016 State Super Fund State Super Fund Notes $000 $000
Present value of plan assets Present value obligation 10(a) 131,666 133,160
Reimbursement rights Opening value of reimbursement right 133,160 136,411Change in value (1,494) (3,251)
Closing value of reimbursement right 10(a) 131,666 133,160
Net liability Total liability in the balance sheet 10(a) 131,666 133,160
(131,666) (133,160)
Expense recognised Superannuation supplementation received 25(h) 9,408 9,411Pensions and lump sums paid 25(h) 9,133 9,515
Net expense recognised in the Income statement (275) 104
Actual returns Expected return on plan assets 8.00% 8.00%
(c) TAFE: (Now Pathways and Vocational Education [PAVE])
Since July 1994, the TAFE Division has been required to cover the employer's share of superannuation for employees who are members of the State Superannuation Scheme. In 2017, the cost amounted to $0.40 million (2016: $0.47 million).
OTHER INFORMATION
SWINBURNE UNIVERSITY OF TECHNOLOGYSFR :52

Note 24. Disaggregated information
(a) Industry – Parent Entity
Income statement
Higher Education PAVE
Parent Entity
Higher Education PAVE
Parent Entity
2017 $000
2017 $000
2017 $000
2016 $000
2016 $000
2016 $000
Income from continuing operationsAustralian Government financial assistance 324,900 21,663 346,563 311,039 24,593 335,632State and local government financial assistance 256 29,612 29,868 302 21,134 21,436HECS-HELP – Student payments 11,431 – 11,431 11,048 – 11,048Fees and charges 161,027 31,239 192,266 137,738 33,686 171,424Other revenue 43,708 356 44,064 41,250 252 41,502
Total revenue from continuing operations 541,322 82,870 624,192 501,377 79,665 581,042
Share of profit/(loss) on investments accounted for using the equity method
7,776 – 7,776 13,140 – 13,140
Gains on disposal of property, plant and equipment – 1 1 37 – 37Realised gain on investments 105,719 – 105,719 14,997 – 14,997
Total income from continuing operations 654,817 82,871 737,688 529,551 79,665 609,216
Expenses from continuing operationsEmployee-related expenses 294,359 43,046 337,405 257,373 36,738 294,111Depreciation and amortisation 28,323 3,265 31,588 26,963 3,340 30,303Repairs and maintenance 12,224 116 12,340 12,017 180 12,197Bad debt expense 541 (48) 493 624 966 1,590Provision for Doubtful Debts 639 (170) 469 (1,597) – (1,597)Losses on disposal of property, plant and equipment 466 – 466 7 – 7Deferred superannuation expense (275) – (275) 104 – 104Other expenses 243,924 7,408 251,332 217,269 34,089 251,358
Total expenses from continuing operations 580,201 53,617 633,818 512,760 75,313 588,073
Net result for the year 74,616 29,254 103,870 16,791 4,352 21,143
Statement of comprehensive income
Higher Education PAVE
Parent Entity
Higher Education PAVE
Parent Entity
2017 $000
2017 $000
2017 $000
2016 $000
2016 $000
2016 $000
Net result for the year 74,616 29,254 103,870 16,791 4,352 21,143
Items that may be reclassified to the Income statementGain/(Loss) on valuation of land and buildings – – – 4 – 4Available-for-sale revaluation reserve– Valuation gain/(loss) taken to equity 17,861 – 17,861 7,698 – 7,698– Transferred to Income statement (1,210) – (1,210) (14,727) – (14,727)(Decrease)/Increase Deferred government contribution for superannuation
1,494 – 1,494 3,251 – 3,251
(Decrease)/Increase Deferred government contribution for superannuation
(1,494) – (1,494) (3,251) – (3,251)
Total comprehensive income attributable to Swinburne University of Technology 91,267 29,254 120,521 9,766 4,352 14,118
2017 ANNUAL REPORT SFR :53

(b) Industry – Parent Entity
Statement of financial position
Higher Education PAVE
Parent Entity
Higher Education PAVE
Parent Entity
2017 $000
2017 $000
2017 $000
2016 $000
2016 $000
2016 $000
Assets
Current assetsCash and cash equivalents (52,973) 71,457 18,484 (16,299) 42,586 26,287Receivables 24,457 (6) 24,451 89,750 (177) 89,573Available-for-sale financial assets 57,772 – 57,772 41,150 – 41,150Non-financial assets classified as held for sale 7,790 – 7,790 7,790 – 7,790Other non-financial assets 21,982 1,809 23,791 14,340 1,135 15,475
Total current assets 59,028 73,260 132,288 136,731 43,544 180,275
Non‑current assetsReceivables 126,676 – 126,676 128,079 – 128,079Investments accounted for using the equity method 10,479 – 10,479 22,602 – 22,602Available-for-sale financial assets 305,699 – 305,699 196,952 – 196,952Property, plant and equipment 522,749 235,503 758,252 412,390 237,531 649,921Investment properties 17,239 – 17,239 16,060 – 16,060Intangible assets 28,457 – 28,457 17,083 – 17,083Other non-financial assets 72 – 72 – – –
Total non‑current assets 1,011,371 235,503 1,246,874 793,166 237,531 1,030,697
Total assets 1,070,399 308,763 1,379,162 929,897 281,075 1,210,972
Liabilities
Current liabilitiesTrade and other payables 77,395 1,637 79,032 64,110 3,080 67,190Provisions-employee entitlements 49,672 5,962 55,634 46,542 5,703 52,245Other liabilities 37,686 1,168 38,854 11,478 1,996 13,474
Total current liabilities 164,753 8,767 173,520 122,130 10,779 132,909
Non‑current liabilitiesProvisions – employee entitlements 136,797 918 137,715 132,328 462 132,790Other liabilities 3,565 – 3,565 2,209 – 2,209
Total non‑current liabilities 140,362 918 141,280 134,537 462 134,999
Total liabilities 305,115 9,685 314,800 256,667 11,241 267,908
Net assets 765,284 299,078 1,064,362 673,230 269,834 943,064
Equity
Reserves 172,172 141,012 313,184 155,521 141,012 296,533Retained earnings 593,112 158,066 751,178 517,709 128,822 646,531
Total equity 765,284 299,078 1,064,362 673,230 269,834 943,064
Note 24. Disaggregated information (continued)
OTHER INFORMATION
SWINBURNE UNIVERSITY OF TECHNOLOGYSFR :54

(c) Industry – Parent Entity
Statement of changes in equity
ReservesRetained earnings Total
$000 $000 $000
Higher Education
Balance at 1 January 2016 162,546 500,918 663,464Net result for the year – 16,791 16,791Gain/(Loss) on revaluation of land and buildings, net of tax 4 – 4Available-for-sale revaluation reserve– Valuation gain/(loss) taken to equity 7,698 – 7,698– Transferred to Income statement (14,727) – (14,727)
Balance at 1 January 2017 155,521 517,709 673,230Net result for the year – 74,616 74,616Transfer from Income statement – 777 777Available-for-sale revaluation reserve– Valuation gain/(loss) taken to equity 17,861 – 17,861– Transferred to Income statement (1,210) – (1,210)
Balance at 31 December 2017 172,172 593,102 765,274
PAVE
Balance at 1 January 2016 141,012 124,470 265,482Net result for the year – 4,352 4,352
Balance at 1 January 2017 141,012 128,822 269,834Net result for the year – 29,254 29,254
Balance at 31 December 2017 141,012 158,076 299,088
Parent Entity balance at 31 December 2017 313,184 751,178 1,064,362
2017 ANNUAL REPORT SFR :55

(d) Industry – Parent Entity
Statement of cash flows
Higher Education PAVE
Parent Entity
Higher Education PAVE
Parent Entity
2017 $000
2017 $000
2017 $000
2016 $000
2016 $000
2016 $000
Cash flows from operating activities
Australian Government Grants received 333,577 21,663 355,240 318,951 24,593 343,544State Government Grants received 256 29,612 29,868 354 20,121 20,475HECS-HELP including OS 12,760 – 12,760 10,680 – 10,680Superannuation Supplementation 9,408 – 9,408 9,185 – 9,185Receipts from student fees and other customers (inclusive of GST) 211,335 33,691 245,026 172,084 54,579 226,663Dividends received 4,800 – 4,800 6,313 – 6,313Interest received 1,137 – 1,137 1,129 – 1,129Payments to suppliers and employees (inclusive of GST) (565,547) (52,029) (617,576) (489,888) (72,626) (562,514)Goods and services tax recovered/(paid) 23,747 (2,273) 21,474 19,071 (1,728) 17,343
Net cash flow from operating activities 31,473 30,664 62,137 47,879 24,939 72,818
Cash Flow from investing activities
Proceeds from sale of property, plant and equipment – 1 1 37 – 37Payment for property, plant and equipment (135,415) (1,246) (136,661) (12,730) (273) (13,003)Payment for investment property – – – (8,541) – (8,541)Proceeds from sale of shares 119,609 – 119,609 – – –Repayment of loans from/(to) related parties 68,034 – 68,034 – – –Payment for intangible assets (14,306) – (14,306) (619) – (619)Proceeds from Available-for-sale financial assets 4,928 – 4,928 174,085 – 174,085Payments for Available-for-sale financial assets (110,997) (548) (111,545) (250,002) – (250,002)
Net cash flow from investing activities (68,147) (1,793) (69,940) (97,770) (273) (98,043)
Net increase/(decrease) in cash and cash equivalents (36,674) 28,871 (7,803) (49,891) 24,666 (25,225)Cash and cash equivalents at the beginning of the financial year (16,299) 42,586 26,287 33,592 17,920 51,512
Cash and cash equivalents at the end of the financial year (52,973) 71,457 18,484 (16,299) 42,586 26,287
Financing arrangements 783 – – 946 – –
Note 24. Disaggregated information (continued)
OTHER INFORMATION
SWINBURNE UNIVERSITY OF TECHNOLOGYSFR :56

Note 25. Acquittal of Australian Government financial assistance
(a) Acquittal of Australian Government financial assistance University only
Commonwealth Grants
Scheme
Indigenous Student Success
Program
Higher Education Participation
Program
Disability Performance
Funding
Promotion of Excellence in Learning
and Teaching Total
2017 $000
2016 $000
2017 $000
2016 $000
2017 $000
2016 $000
2017 $000
2016 $000
2017 $000
2016 $000
2017 $000
2016 $000
Financial assistance received in cash during the reporting period (total cash received from the Australian Government for the programs)
173,320 149,782 304 262 4,445 4,707 22 22 70 130 178,161 154,903
Net accrual adjustments/refunds (14,471) (4,240) – – – – – – – – (14,471) (4,240)
Revenue for the period 158,849 145,542 304 262 4,445 4,707 22 22 70 130 163,690 150,663
Surplus/(deficit) from the previous year
– – – – – 1,993 – – – – – 1,993
Total revenue including accrued revenue
158,849 145,542 304 262 4,445 6,700 22 22 70 130 163,690 152,656
Less expenses including accrual expenses
158,849 145,542 304 262 4,445 6,700 22 22 70 130 163,690 152,656
Surplus/(deficit) for reporting period
– – – – – – – – – – – –
(b) Higher Education Loan Programmes (excluding OS-HELP) University only
HECS-HELP (Australian Government
payments only) FEE-HELP VET FEE-HELP SA-HELP Total
2017 $000
2016 $000
2017 $000
2016 $000
2017 $000
2016 $000
2017 $000
2016 $000
2017 $000
2016 $000
Cash Payable/(Receivable) at the beginning of the year
2,626 10,530 1,771 (2,129) (157) (6,696) (232) (24) 4,008 1,681
Financial assistance received in cash during the reporting period
127,926 106,280 20,483 27,354 9,478 20,857 2,821 2,403 160,708 156,894
Cash available for the period 130,552 116,810 22,254 25,225 9,321 14,161 2,589 2,379 164,716 158,575
Revenue Earned 126,226 114,184 22,128 23,454 10,010 14,318 2,964 2,611 161,328 154,567
Cash Payable/(Receivable) at end of year
4,326 2,626 126 1,771 (689) (157) (375) (232) 3,388 4,008
(c) Department of Education and Training Research University only
Research Training Program
Research Support Program
Total
2017 $000
2016 $000
2017 $000
2016 $000
2017 $000
2016 $000
Financial assistance received in cash during the reporting period (total cash received from the Australian Government for the program)
11,638 11,725 6,806 6,663 18,444 18,388
Revenue for the period 11,638 11,725 6,806 6,663 18,444 18,388
Surplus/(deficit) from the previous year – – 99 47 99 47
Total revenue including accrued revenue 11,638 11,725 6,905 6,710 18,543 18,435
Less expenses including accrued expenses 11,638 11,725 6,905 6,611 18,543 18,336
Surplus/(deficit) for reporting period – – – 99 – 99
All funds received for Research Support Program and Research Training Program were fully expended in 2017.Research Support Program has replaced Joint Research Engagement, JRE Cadetships, Research Block Grants and Sustainable Research Excellence in Universities in 2017.Research Training Program has replaced Australian Postgraduate Awards, International Postgraduate Research Scholarships and Research Training Scheme in 2017.
2017 ANNUAL REPORT SFR :57

(d) Total Higher Education Provider Research Training Program expenditure
Total domestic students
Total overseas students
$000 $000
Research Training Program Fees offsets 75 1Research Training Program Stipends 11,446 116Research Training Program Allowances – –
Total for all types of support 11,521 117
(e) Other Capital Funding University only
Linkage Infrastructure, Equipment and Facilities
Grant Total
2017 $000
2016 $000
2017 $000
2016 $000
Financial assistance received in cash during the reporting period (total cash received from the Australian Government for the program) 808 367 808 367
Revenue for the period 808 367 808 367Surplus/(deficit) from the previous year 223 715 223 715
Total revenue including accrued revenue 1,031 1,082 1,031 1,082
Less expenses including accrued expenses 750 859 750 859
Surplus/(deficit) for reporting period 281 223 281 223
(f) Australia Research Council Grants University only
Discovery Linkages Networks and Centres Total
2017 $000
2016 $000
2017 $000
2016 $000
2017 $000
2016 $000
2017 $000
2016 $000
Financial assistance received in cash during the reporting period (total cash received from the Australian Government for the program) 6,932 5,976 1,290 963 4,717 640 12,939 7,579
Revenue for the period 6,932 5,976 1,290 963 4,717 640 12,939 7,579Surplus/(deficit) from the previous year 3,697 3,961 852 715 712 825 5,261 5,501
Total revenue including accrued revenue 10,629 9,937 2,142 1,678 5,429 1,465 18,200 13,080
Less expenses including accrued expenses 5,243 6,240 1,020 826 4,449 753 10,712 7,819
Surplus/(deficit) for reporting period 5,386 3,697 1,122 852 980 712 7,488 5,261
(g) OS-HELP University only
Notes2017 $000
2016 $000
Cash received during the reporting period 3,250 1,324Cash spent during the reporting period 1,920 1,886
Net cash for the period 1,330 (562)Cash surplus/(deficit) from the previous period (368) 194
Cash surplus/(deficit) for reporting period 8(a) 962 (368)
Note 25. Acquittal of Australian Government financial assistance (continued)
OTHER INFORMATION
SWINBURNE UNIVERSITY OF TECHNOLOGYSFR :58

(h) Higher Education Superannuation Program University only
Notes2017 $000
2016 $000
Cash received during the reporting period 9,408 9,185
Cash available 9,408 9,185Cash surplus/(deficit) from the previous period 6 232
Cash available for current period 9,414 9,417Contributions to specified defined benefit funds 23 9,133 9,411
Cash surplus/(deficit) for reporting period 281 6
(i) Student Services and Amenities Fee Consolidated entity only
Notes2017 $000
2016 $000
Unspent/(overspent) revenue from previous period – –SA-HELP revenue earned 1(b) 2,964 2,403Student Services Fees direct from Students 2(b) 2,767 2,908
Total revenue expendable in period 5,731 5,311Student Services expenses during period 5,731 5,311
Unspent/(overspent) Student Services Revenue – –
Note 26. Other accounting policies
(a) Foreign currency translation
(i) Functional and presentation currency
The financial report of each of the University’s entities is measured using the currency of the primary economic environment in which the entity operates (‘the functional currency’). The consolidated financial report is presented in Australian dollars, which is Swinburne University of Technology’s functional and presentation currency.
(ii) Transactions and balances
Foreign currency transactions are translated into the functional currency using the exchange rates prevailing at the dates of the transactions. Foreign exchange gains and losses resulting from the settlement of such transactions and from the translation at year-end using exchange rates of monetary assets and liabilities denominated in foreign currencies are recognised in the Income statement as either a net revenue or net expense.
(b) Impairment of assets
Assets that have an indefinite useful life are not subject to amortisation and are tested annually for impairment. Assets that are subject to depreciation or amortisation are reviewed for impairment whenever events or changes in circumstances indicate that the carrying amount may not be recoverable. An impairment loss is recognised for the amount by which the asset’s carrying amount exceeds its recoverable amount. The recoverable amount is the higher of an asset’s fair value less costs to sell, and value in use, being the written down value of the asset. For the purposes of assessing impairment, assets are grouped at the lowest levels for which there are separately identifiable cash flows (cash generating units).
(c) Goods and Services Tax (GST)
All items in the financial statements are stated exclusive of GST, except for receivables and payables, which are stated on a GST-inclusive basis. The net amount of GST recoverable from, or payable to, the Australian Taxation Office (ATO) is included with other receivables or payables in the Statement of Financial Position. Cash flows are presented on a gross basis. The GST components of cash flows arising from investing or financing activities which are recoverable from or payable to the ATO, are presented as operating cash flows.
(d) Rounding of amounts
Amounts in the financial statements have been rounded off in accordance with Class Order 2016/191 issued by the Australian Securities and Investment Commission (ASIC), relating to the ‘rounding off’ of amounts in the financial statements. Amounts have been rounded to the nearest thousand dollars.
(e) Income Tax
The University and its subsidiaries are exempt from income tax under Part 50.1 of the Income Tax Assessment Act 1997.
2017 ANNUAL REPORT SFR :59

(f) Australian Accounting Standards, Amendments and Interpretations issued but not yet effective
The AASB has issued new and amended Accounting Standards and Interpretations that have mandatory application dates for future reporting periods and which the University has decided not to early-adopt. A discussion of those future requirements and their impact on the University is as follows:
Standard/Interpretation
Summary Applicable for annual reporting periods beginning on
Impact on the University’s financial statements
AASB 9 Financial Instruments
The key changes include the simplified requirements for the classification and measurement of financial assets, a new hedging accounting model and a revised impairment loss model to recognise impairment losses earlier, as opposed to the current approach that recognises impairment only when incurred.
1 January 2018 The assessment has identified that the amendments are likely to result in earlier recognition of impairment losses and at more regular intervals.
While there will be no significant impact arising from AASB 9, there will be a change to the way financial instruments are disclosed.
AASB 2010-7 Amendments to Australian Accounting Standards arising from AASB 9 (December 2010)
The requirements for classifying and measuring financial liabilities were added to AASB 9. The existing requirements for the classification of financial liabilities and the ability to use the fair value option have been retained. However, where the fair value option is used for financial liabilities the change in fair value is accounted for as follows:
• The change in fair value attributable to changes in credit risk is presented in other comprehensive income (OCI), and
• Other fair value changes are presented in Income statement. If this approach creates or enlarges an accounting mismatch in the Income statement, the effect of the changes in credit risk are also presented in the Income statement.
1 January 2018 The assessment has identified that the financial impact of available-for-sale (AFS) assets will now be reported through other comprehensive income (OCI) and no longer recycled to the Income statement.
Changes in own credit risk in respect of liabilities designated at fair value through Income statement will now be presented within OCI.
Hedge accounting will be more closely aligned with common risk management practices, making it easier to have an effective hedge.
AASB 2014-1 Amendments to Australian Accounting Standards arising from AASB 9
Amends various AASs to reflect the AASB’s decision to defer the mandatory application date of AASB 9 to annual reporting periods beginning on or after 1 January 2018 as a consequence of Chapter 6 Hedge Accounting, and to amend reduced disclosure requirements.
1 January 2018 This amending standard will defer the application period of AASB 9 to the 2018 reporting period in accordance with the transition requirements.
AASB 2014-7 Amendments to Australian Accounting Standards arising from AASB 9
Amends various AASs to incorporate the consequential amendments arising from the issuance of AASB 9.
1 January 2018 The assessment has indicated that there will be no significant impact for the University.
AASB 15 Revenue from Contracts with Customers
The core principle of AASB 15 requires an entity to recognise revenue when the entity satisfies a performance obligation by transferring a promised good or service to a customer.
1 January 2018 The changes in revenue recognition requirements in AASB 15 may result in changes to the timing and amount of revenue recorded in the financial statements. The Standard will also require additional disclosures on service revenue and contract modifications.
Note 26. Other accounting policies (continued)
OTHER INFORMATION
SWINBURNE UNIVERSITY OF TECHNOLOGYSFR :60

Standard/Interpretation
Summary Applicable for annual reporting periods beginning on
Impact on the University’s financial statements
AASB 2014-5 Amendments to Australian Accounting Standards arising from AASB 15
Amends the measurement of trade receivables and the recognition of dividends.
Trade receivables that do not have a significant financing component are to be measured at their transaction price, at initial recognition.
Dividends are recognised in the profit and loss only when:
• the entity’s right to receive payment of the dividend is established;
• it is probable that the economic benefits associated with the dividend will flow to the entity; and
• the amount can be measured reliably.
1 January 2017, except amendments to AASB 9 (December 2009) and AASB 9 (December 2010) apply from 1 January 2018
The assessment has indicated that there will be no significant impact for the University.
AASB 2016-3 Amendments to Australian Accounting Standards arising from AASB 15
This Standard amends AASB 15 to clarify the requirements on identifying performance obligations, principal versus agent considerations and the timing of recognising revenue from granting a licence. The amendments require:
• A promise to transfer to a customer a good or service that is ‘distinct’ to be recognised as a separate performance obligation;
• For items purchased online, the entity is a principal if it obtains control of the good or service prior to transferring to the customer; and
• For licences identified as being distinct from other goods or services in a contract, entities need to determine whether the licence transfers to the customer over time (right to use) or at a point in time (right to access).
1 January 2018 The assessment has indicated that there will be no significant impact for the University, other than the impact identified for AASB 15 above.
AASB 2016-7 Amendments to Australian Accounting Standards arising from AASB 15
This Standard defers the mandatory effective date of AASB 15 for not-for-profit entities from 1 January 2018 to 1 January 2019.
1 January 2019 This amending standard will defer the application period of AASB 15 for not-for-profit entities to the 2019 reporting period.
AASB 16 Leases
The key changes introduced by AASB 16 include the recognition of most operating leases (which are currently not recognised) in the statement of financial position.
1 January 2019 The assessment has indicated that as most operating leases will come on the Statement of financial position, recognition of right-of-use assets and lease liabilities will cause net debt to increase.
Rather than expensing the lease payments, depreciation of right-of-use assets and interest on lease liabilities will be recognised in the Income statement with marginal impact on the operating surplus.
No change for lessors.
2017 ANNUAL REPORT SFR :61

Standard/Interpretation
Summary Applicable for annual reporting periods beginning on
Impact on the University’s financial statements
AASB 2016-4 Amendments to Australian Accounting Standards – Recoverable Amount of Non‑Cash‑Generating Specialised Assets of Not-for-Profit Entities
The standard amends AASB 136 Impairment of Assets to remove references to using depreciated replacement cost (DRC) as a measure of value in use for not-for-profit entities.
1 January 2017 The assessment has indicated that there is minimal impact. Given the specialised nature and restrictions of public sector assets, the existing use is presumed to be the highest and best use (HBU), hence current replacement cost under AASB 13 Fair Value Measurement is the same as the depreciated replacement cost concept under AASB 136.
AASB 1058 Income of Not‑for‑Profit Entities
This standard replaces AASB 1004 Contributions and establishes revenue recognition principles for transactions where the consideration to acquire an asset is significantly less than fair value to enable the not-for-profit entity to further its objectives.
1 January 2019 The assessment has indicated that revenue from capital grants that are provided under an enforceable agreement with sufficiently specific obligations, will now be deferred and recognised as performance obligations are satisfied. As a result, the timing recognition of revenue will change.
In addition to the new standards and amendments above, the AASB has issued a list of other amending standards that are not effective for the 2017 reporting period (as listed below). In general, these amending standards include editorial and reference changes that are expected to have insignificant impacts on public sector reporting.
• AASB 2016-1 Amendments to Australian Accounting Standards – Recognition of Deferred Tax Assets for Unrealised Losses [AASB 112]
• AASB 2016-2 Amendments to Australian Accounting Standards – Disclosure Initiative: Amendments to AASB 107• AASB 2016-5 Amendments to Australian Accounting Standards – Classification and Measurements of Share-based Payment
Transactions• AASB 2016-6 Amendments to Australian Accounting Standards – Applying AASB 9 Financial Instruments with AASB 4 Insurance
Contracts• AASB 2017-1 Amendments to Australian Accounting Standards – Transfers of Investment Property, Annual Improvements 2014–16
Cycle and Other Amendments• AASB 2017-2 Amendments to Australian Accounting Standards – Further Annual Improvements 2014–16 Cycle
Note 26. Other accounting policies (continued)
OTHER INFORMATION
SWINBURNE UNIVERSITY OF TECHNOLOGYSFR :62

This page intentionally left blank.
2017 ANNUAL REPORT SFR :63

Key to abbreviations:
FRD Financial Reporting Directions (as at 11 November 2017): Available at: http://www.dtf.vic.gov.au/Publications/Government‑Financial‑Management‑publications/
Financial‑Reporting‑Policy/Financial‑reporting‑directions‑and‑guidance
SD Standing Directions (as at 11 November 2017) Available at: http://www.dtf.vic.gov.au/Publications/Government‑Financial‑Management‑publications/
Financial‑Management‑Compliance‑Framework/Standing‑Directions‑of‑the‑Minister‑for‑Finance
Item No.
Source Reference
Summary of Reporting Requirement Annual Report Pages
Financial Report Pages
STANDING DIRECTIONS OF THE MINISTER FOR FINANCE
1 FRD 22H Report of Operations contains general information about the entity and its activities, highlights for reporting period and future initiatives and is prepared on a basis consistent with financial statements pursuant to the Financial Management Act 1994.
AR:1–30 SFR:2, 8
2 SD 5.2.1(a) Accountable Officer must implement and maintain a process to ensure the Annual Report is prepared in accordance with Financial Reporting Directions and Australian Accounting Standards
AR:1 SFR:2
3 SD 5.2.3 Report of Operations is signed and dated by the Chancellor or equivalent and includes the date of the Council Meeting at which Annual Report was approved.
AR:1 SFR:2
4 SD 5.2.2 Financial Statements are prepared in accordance with:– Australian Accounting Standards (AAS and Australian Accounting
Standards Board standards) and other mandatory professional reporting requirements;
– Financial Reporting Directions; and– Financial Management Act 1994.
SFR:2, 3–5, 59–62
5 SD 5.2.2(a) and FMA s 49
The financial statements must contain such information as required by the Minister and be prepared in a manner and form approved by the Minister. They must be signed and dated by the Accountable Officer, CFO (subject to 5.2.2) and a member of the Responsible Body, in a manner approved by the Minister, stating whether, in their opinion the financial statements:– Present fairly the financial transactions during reporting period and the
financial position at end of the period;– Have been prepared in accordance with applicable requirements in the
FMA, the Directions, the Financial Reporting Directions and Australian Accounting Standards;
– Were prepared in accordance with Standing Direction 4.2(c) and applicable Financial Reporting Directions; and
– Comply with applicable Australian Accounting Standards (AAS and Australian Accounting Standards Board standards) and other mandatory professional reporting requirements.
SFR:2
6 FRD 30D Financial statements are expressed in the nearest dollar except where the total assets, or revenue, or expenses of the institution are greater than:– $10,000,000, the amounts shown in the financial statements may be
expressed by reference to the nearest $1,000; and– $1,000,000,000, the amounts shown in the financial statements may be
expressed by reference to the nearest $100,000.
AR:5, 30 Throughout
7 SD 3.2.1.1(c) The financial statements were reviewed and recommended by the Audit Committee established by the Responsible Body, or Responsible Body prior to finalisation and submission.
AR:16
DISCLOSURE INDEX
SWINBURNE UNIVERSITY OF TECHNOLOGYSFR :64

Item No.
Source Reference
Summary of Reporting Requirement Annual Report Pages
Financial Report Pages
8 SD 3.7.1 Attestation on compliance with the Victorian Risk Management Framework. AR:27
9 FRD 03A Accounting for Dividends SFR:15
10 FRD 07B Early Adoption of Authoritative Accounting Pronouncements SFR:60
11 FRD 10A Disclosure Index SFR:64–66
12 FRD 11A Disclosure of Ex-gratia Payments AR:29
13 FRD 17B Long Service leave and annual leave for employees SFR:16–17, 32–33
14 FRD 21C Disclosures of Responsible Persons, Executive Officer and Other Personnel (contractors with significant management responsibilities) in the Financial Report
SFR:46–48
15 FRD 22H Consultants:Report of Operations must include a statement disclosing each of the following1. Total number of consultancies of $10,000 or more (excluding GST)2. Location (eg website) of where details of these consultancies over $10,000
have been made publicly available3. Total number of consultancies individually valued at less than $10,000 and the
total expenditure for the reporting periodAND for each consultancy more than $10,000, a schedule is to be published on the University website listing:– Consultant engaged– Brief summary of project– Total project fees approved (excluding GST)– Expenditure for reporting period (excluding GST)– Any future expenditure committed to the consultant for the project
AR:29
16 FRD 22H Manner of establishment and the relevant Minister AR:7 SFR:46
17 FRD 22H Purpose, functions, powers and duties linked to a summary of activities, programs and achievements
AR:8–26
18 FRD 22H Nature and range of services provided including communities served AR:8
19 FRD 22H Organisational structure and chart, including responsibilities AR:12–17
20 FRD 22H Names of Council members AR:17 SFR:46
21 FRD 22H Operational and budgetary objectives, performance against objectives and achievements
AR:18–26, 30
22 FRD 22H Occupational health and safety statement including performance indicators, and performance against those indicators. Reporting must be on the items listed at 6.10 (a) to (e) in the FRD
AR:25
23 FRD 22H Workforce data for current and previous reporting period, including a statement on employment and conduct principles, and that employees have been correctly classified in the workforce data collections
AR:18, 24
24 FRD 22H Summary of the financial results for the year including previous 4 year comparisons
AR:30
25 FRD 22H Significant changes in financial position during the year AR:5, 29 SFR:8
26 FRD 22H Key initiatives and projects, including significant changes in key initiatives and projects from previous years and expectations for the future
AR:4–30
27 FRD 22H Major changes or factors affecting performance AR:4–30 SFR:7–10
28 FRD 22H Discussion and analysis of operating results and financial results AR:30
29 FRD 22H Post-balance sheet date events likely to significantly affect subsequent reporting periods
AR:29 SFR:45
2017 ANNUAL REPORT SFR :65

Item No.
Source Reference
Summary of Reporting Requirement Annual Report Pages
Financial Report Pages
30 FRD 22H Where a university has a workforce inclusion policy, a measurable target and report on the progress towards the target should be included
AR:24
31 FRD 22H Schedule of any government advertising campaign in excess of $100,000 or greater (exclusive of GST) include list from (a) – (d) in the FRD
N/A N/A
32 FRD 22H Summary of application and operation of the Freedom of Information Act 1982 AR:28
33 FRD 22H Statement of compliance with building and maintenance provisions of the Building Act 1993
AR:28
34 FRD 22H Statement where applicable on the implementation and compliance with the National Competition Policy
AR:28
35 FRD 22H Summary of application and operation of the Protected Disclosure Act 2012 AR:28
36 FRD 22H Statement, to the extent applicable, on the application and operation of the Carers Recognition Act 2012 (Carers Act), and the actions that were taken during the year to comply with the Carers Act
AR:28
37 FRD 22H and 24C
Summary of Environmental Performance including a report on office based environmental impacts
AR:26
38 FRD 22H List of other information available on request from the Accountable Officer, and which must be retained by the Accountable Officer (refer to list at 6.19 (a) – (l) in the FRD)
AR:28
39 FRD 25C Victorian Industry Participation Policy in the Report of Operations N/A N/A
40 FRD 26B Accounting for VicFleet Motor Vehicle Lease Arrangements on or after 1 February 2004
N/A N/A
41 FRD 102A Inventories N/A N/A
42 FRD 103F Non-financial physical assets SFR:27–28, 59
43 FRD 105B Borrowing Costs SFR:24
44 FRD 106A Impairment of assets SFR:18, 22, 27–28, 59
45 FRD 107B Investment properties SFR:8, 10, 31, 54, 56
46 FRD 109A Intangible assets SFR:8, 10, 18, 30, 54, 56
47 FRD 110A Cash Flow Statements SFR:10, 18, 56
48 FRD 112D Defined benefit superannuation obligations SFR:20, 32, 51–52
49 FRD 113A Investments in Subsidiaries, Jointly Controlled Associates and Entities SFR:25–26
50 FRD 119A Transfers through contributed capital N/A N/A
51 FRD 120K Accounting and reporting pronouncements applicable to the reporting period SFR:59–62
52 ETRA, s. 3.2.8 Statement on compulsory non-academic fees, subscriptions and charges payable in 2017
AR:29 SFR:14, 59
53 PAEC Financial and other information relating to the university’s international operations
AR:8–30 SFR:14
54 University Commercial Activity Guidelines
– Summary of the university commercial activities– If the university has a controlled entity, include the accounts of that entity
in the university’s Annual Report
AR:8–30 SFR:25–26, 42–43
DISCLOSURE INDEX (CONTINUED)
SWINBURNE UNIVERSITY OF TECHNOLOGYSFR :66

Swinburne University of Technology
swinburne.edu.au
General Enquiries: +61 3 9214 8000
Postal Address: PO Box 218, Hawthorn Victoria 3122 Australia
Campuses
Hawthorn Campus John Street, Hawthorn Victoria 3122 Australia
Croydon Campus 12–50 Norton Road, Croydon Victoria 3136 Australia
Wantirna Campus 369 Stud Road, Wantirna Victoria 3152 Australia
National Institute of Circus Arts (NICA) Level 1 PC Building 39–59 Green Street, Prahran (Corner Green & Thomas Street) Victoria 3181 Australia
Sarawak Campus (Malaysia) Jalan Simpang Tiga 93350 Kuching, Sarawak, Malaysia
Online
The Annual Report is also available online at: swinburne.edu.au/about/strategy-initiatives/annual-report where an email link is provided for feedback.
twitter.com/swinburne
facebook.com/swinburneuniversityoftechnology
youtube.com/user/swinburne
instagram.com/swinburne
linkedin.com/school/swinburne-university-of-technology
Acknowledgements
The Strategy and Commercial, Media and External Communication, and Finance teams at Swinburne prepare the Annual Report.
The information in this report was correct at the time of printing (March 2018). The University reserves the right to alter or amend the material contained in this publication
ABN: 13 628 586 699 ISSN: 1477-8242 CRICOS provider code: 00111D
CONTACT US

2017ANNUAL REPORT
SWINBURNE UNIVERSITY OF TECHNOLOGY
CELEBRATING 25 YEARS OF UNIVERSITY EDUCATION
1992 – 2017