Embed Size (px)
Citation preview

R&D offshoring and home industry productivity
Working Paper 2/16
Gaétan de Rassenfosse and Russell Thomson
2016
1
R&Doffshoringandhomeindustryproductivity
GaétandeRassenfosse‡andRussellThomson†
Abstract
Offshoringresearchanddevelopment(R&D)commonlyinvokesconcernsregardingthelossof
highvaluejobsandahollowingoutoftechnologicalcapabilities,butitcanalsobenefitdomestic
firmsbyenablingthemtotapintotheglobaltechnologicalfrontier.WestudytheeffectofR&D
offshoringonindustrialproductivityinthehomecountryusingindustry-leveldatafor18OECD
countries over a 26-year period. Simultaneity is addressed by using foreign tax policy as an
instrumentforoffshoredR&D.OurresultsshowthatR&Doffshoringcontributespositivelyto
productivityinthehomecountry,irrespectiveofthehostcountrydestination.
JELclassifications:O25,O33,O47,L6
Keywords:R&Doffshoring,globalization,productivity,foreignR&D
‡ÉcolepolytechniquefédéraledeLausanne,CollegeofManagementofTechnology,ODY201.1,Station5,1015Lausanne,Switzerland.+41216930096,[email protected]†CenterforTransformativeInnovation,SwinburneUniversityofTechnology,Melbourne,Australia.+61392145873,[email protected]
2
Introduction
Thisarticleinvestigatestheimpactofresearchanddevelopment(R&D)offshoringonindustrial
productivity in the home country and considers factors which may condition the effect.
Globalisedtechnologysourcingisadefiningfeatureofinnovationsystemsinthe21stcentury.
By2008,US-ownedmanufacturingcompaniesperformednearly20percentoftheirtotalR&D
outside the United States (NSF 2010). The extent of R&D offshoring by several European
countries includingSwitzerland,SwedenandGermanyappearstobeevengreater(European
Commission 2012). The growth in R&D offshoring has long been regarded as a worrisome
developmentfortechnologicallyadvancednationsinlightofthecentralroleofR&Dindriving
productivity and economic growth (Mansfield et al. 1979; Lall 1979; Dunning 1994).
Governmentsareincreasingly inclinedtooffer inducementsinordertoensurethat ‘national’
firmsmaintainR&Dactivitiesintheirhistoricalhomecountry.
RecentevidencehasshownthatfirmscangenerateprivatebenefitsfromoffshoringR&D.
Bytappingintothegloballydisparatetechnologicalfrontierfirmscanenhancetheirproductivity
andmarketposition(Cantwell1995).Forinstance,Samsung’sR&DoutpostinSiliconValleyis
creditedwithplayingavitalroleinthecompany’seventualdominanceinSDRAMtechnologies
(Kim1997).Analysisoffirm-leveldataforfirmsbasedintheUKandGermanyhaveshownthat
offshoringR&DtotheUnitedStatesprovidesameanstotapintotechnologicalspilloversand
enhanceperformance(Griffithetal.2006;Harhoffetal.2012).
Notwithstandingtheevidenceregardingbenefitstotheoffshoringfirmsthemselves,the
overallimpactonthehomecountryisnotyetclear.TheimportantroleofSamsunginKorean
economicdevelopmentsuggeststhatimpactscanpotentiallybesubstantial,buttowhatextent
isthisexampleanexceptionratherthanarule?Ofconcernisthelossof‘scientist-to-scientist’
spillovers, which are thought to occur at the location in which R&D is performed. Equally
3
importantly,benefitsassociatedwithoffshoredR&Dareexpected tobedispersedacross the
company’sglobaloperations;thereisnoguaranteethatasubstantivesharewillbecapturedby
operations in the home country. Additionally, benefits may be muted in the case of home
countriesatthetechnologicalfrontierbecausetherelativetechnologicalcapacityofthehome
countrydeterminesscope for learning(SongandShin2008;Songetal.2011).Theextent to
whichbenefitsmayhingeonoffshoring toa frontiereconomyhasnotbeensubject todirect
empiricalscrutinythoughGriffithetal.(2006)noteinpassingthattheyareunabletoconfirma
positiveimpactfromoffshoringtocountriesotherthantotheUnitedStates.Thisiscausefor
concerntopolicymakersintheUnitedStates,whichisthehomecountrytofirmsengagedthe
mostinR&Doffshoring.
Westudy theeffectofR&Doffshoringon industrialproductivity in thehomecountry
usingnewpatent-basedindicatorsofR&Doffshoringlinkedto2-digitmanufacturingproduction
datafrom18OECDcountriesbetween1981and2007.Ourindustry-levelapproachprovidesa
globalandlong-termviewandavoidsmanyofthesamplingandselectionissuesinherentinfirm
level studies. It captures thenet effect on local industry taking into account spillover effects
which are an important component of the policy puzzle. After all,we expect firms to derive
privatebenefitfromtheirownoffshoringdecisions,atleastonaverage.
We also extend the literature by tackling the difficult issue of simultaneity between
productivityandoffshoring.Simultaneityarisesbecausehomecountrytechnologicalcapacity
determinestheexistenceofleadingmultinationalenterprises(MNEs)aswellastheircapacity
tomanageandbenefitfromgloballydispersedR&Dassets(Vernon1966;PatelandPavitt1988,
1991;LeBasandSierra2002;SongandShin2008;Songetal.2011).Toaddresstheissueof
simultaneityweusecountry-industryspecificmeasuresofR&Dtaxpolicyasaninstrumentfor
R&Doffshoringactivity.R&Dtaxpolicyprovidesapromisinginstrumentsinceforeigntaxpolicy
isexogenoustodomesticproductivity;itisdifficulttoimagineamechanismthroughwhichR&D
4
specific tax incentives intheUKwillaffect industrialproductivity intheUSAexceptviatheir
influenceonthedistributionofcompanyR&Dbetweenthetwocountries.R&Dtaxincentives
havebeenshowntohaveasignificantinfluenceonR&Dlocationdecisions(BloomandGriffith
2001;Wilson2009).TheresultsarerobusttoWealsoconsideraconventionalapplicationof
systemsGMM(BlundellandBond1998).
OurresultsshowthatR&Doffshoringcontributespositivelytoproductivityinthehome
country,irrespectiveofthehostcountrydestination.However,wereportevidencesuggesting
thatthebenefitshingeonthenatureofoffshoringactivities,withtechnology-seekingoffshored
R&D bringing the most benefits and market-seeking offshored R&D potentially reducing
productivity.
Theoreticalframework
InlightoftheongoinggrowthinR&Doffshoringitwouldbedifficulttoarguethatfirmsarenot
generatingprivatebenefits. Scholarshave long recognized that offshoringprovides a critical
mechanismtotap intothegloballydisparatetechnological frontier(Ronstadt1978;Cantwell
1995).Offshoringprovidesameansforfirmstoprocuretechnologiesnotnecessarilyavailable
inthehomemarket.Allthe25mostpatentintensiveUScompaniesengageperformsomeR&D
abroad–andeveryoneoftheacquirepatentsfromabroadintechnologyareasthattheydonot
acquirefromlocalR&D(derivedfromUSPTO).
OurresearchquestiondealswithnotjustthemagnitudeofbenefitsofR&Doffshoringbutalso
thedistributionofthosebenefits.BenefitsfromR&Dactivityaccruetotheinvestingfirmandcan
alsospillovertoneighboringfirms.Inthissectionwebeginbyconsideringeachoftheseinturn,
withaviewtoarticulatingthemechanismthroughwhichR&Doffshoringimpactsproductivity
inthehomecountry.Factorsthatmaymitigateorconditiontheeffectarethendiscussed.
5
Someofthevaluegeneratedbynewtechnologywillbecapturedbytheplantwherethe
technologyisimplemented;thismaybethecountryinwhichtheresearchwasconducted,inthe
firm’shome-base,or inathirdcountry inwhichthefirmhasproductionassets.Valueisalso
captured at other points along the firm’s value chain. The share of value captured by
manufacturingactivitiesperseinglobalvaluechainsistypicallylowandappearstobefalling
(BartlettandGhoshal2000;Ali-YrkköandRouvinen2015).Valuealsopermeatesupstreamand
downstreamglobalvaluechains,withalargeshareofvalueaddedcapturedbyoperationsinthe
homecountry, includingheadquarteroperationsaswellasnichehighvaluecontributions to
productionactivities(Ali-YrkköandRouvinen2015).
ItiswellunderstoodthatfirmsgenerallydonotcaptureallbenefitsassociatedwithR&D
investment.Benefitsalsospillovertoneighboringfirmsandthesespilloversalsocontributeto
thegeographicdistributionofbenefitsofoffshoredR&D.Spilloverscanariseatthreelociofthe
innovationprocess:invention,productionandownership.Thoseattheinventionstagearewell
understoodand involve the formaland informalexchangeof informationbetweenscientists.
Althoughthe literatureemphasises thatknowledgespilloversarehighly localised(Jaffeetal.
1993), spillovers from offshored R&D to other firms in the home country have also been
documented (Criscuolo 2009). Spillovers associated with the production processes where
technologiesareimplementedaresimilarlywellunderstood.Likeinternalisedbenefits,theyare
diffused along the production chain and work through interactions with suppliers,
demonstrationeffectsandengineeringandmanagementconsultancy.Firmsinthehomecountry
can benefit from the offshoring activities of their compatriots via demonstration effects or
through supply-chain-mediated technology upgrading (Porter 1990). Trade in intermediate
goods is alsoan important transmissionmechanism forproductivitygainsat theproduction
stage (Griliches1979). Finally, technologyowners in thehome countryholdmanagerial and
strategicinsightsthatcanbenefitlocalupstreamanddownstreamactors.
6
Not all R&D offshoring is expected to bring equal benefits to the home country. For
instance,R&Doffshoringthatisintendedprimarilytoadaptproductsforspecificlocalmarkets
(knownas‘market-seeking’R&D)isunlikelytogenerateextensivespilloverstothefirm’shome
country(cf.ArvanitisandHollenstein2011). Scope for learningcanalso influence firmlevel
benefits(SongandShin2008;Songetal.2011).Recentresearchhasemphasisedtheimportance
ofoffshoringR&DtotechnologicalleadersandtheUnitedStatesinparticular(Griffithetal.2006;
Harhoff et al. 2014). Although the United States is certainly a leader by many aggregate
measures, the existence of centers of excellence around specific technology areas and niche
technical and scientific skills in other parts of theworld scarcely requires argument. Global
technologystrategyprovidesamechanismforsourcingthebesttechnologyfromanincreasingly
globallydisparatefrontier.Ifinformedfirmsactrationallyinchoosingthelocationofoffshored
R&DweshouldexpectalloffshoredR&Dinvestmentstogeneratereturnscommensuratewith
theriskandcoststheyinvolve.
The distribution of firms’ ability to benefit from R&D offshoring gives rise to the
importantconsiderationofsimultaneitybetweenoffshoringandperformancewhichhas,todate,
largelyescapedthemodelingeffortofempiricaleconomists(Griffithetal.2006:1873).Leading
MNEs havemost to gain fromR&D offshoring because of their superior absorptive capacity
(SongandShin2008).Leadingfirmsalsopossessorganizationcapabilitiesthatallowthemto
managethecomplexprocessofR&Doffshoring,sothattheyarethemostlikelytoengageinthat
activity.InsightsfrommanagementstudiessimilarlysuggestthatR&Doffshoringistheprivilege
of the fittest (Patel and Vega 1999; Le Bas and Sierra 2002). We tackle the problem of
simultaneityusinginstrumentalvariableswhichisexplainedfurtherinthenextsection.
7
MeasuringhomeandoffshoredR&D
Ideallywewould observe industry levelR&Dexpenditures by country of funding (the firms
homebase)andcountryofperformance(thehostcountry).Unfortunately,statisticalagencies
donotcollectsuchdatasystematically.Weresorttopatentdata,whichprovideanindicatorof
bothhomeandoffshoredR&D(GuellecandvanPottlesberghe2001;OECD2009;Picci2010;
Thomson2013).HomeR&Discapturedwithpatentsthathavebothdomesticapplicantsand
inventors.ApatentthatderivesfromoffshoredR&Disapatentwithadomesticapplicantanda
foreigninventor.Theapplicant’saddressprovidesanindicatoroftheMNEshomecountryand
inventor’scountryofresidenceindicatestheMNEsoffshoringlocation.
Inmostcases,ownersofvaluabletechnologywantprotectionfromwould-beimitators
inmanycountries.Toachievethis,theymustfilepatentapplicationstotheintellectualproperty
officeineachcountrytheywantprotection.Patentsaregenerallyfiledinproductioncenters,
majormarkets,andthelocationofcompetitorfirms.Thefirstfilingprotectinganinventionis
calledaprioritypatentapplication.Subsequentapplicationsprotectingthesameinventionin
otherjurisdictionsarecalledsecondfilings.Onlyprioritypatentapplicationsareincludedinour
measuresincesecondfilingsarenotindicativeofadditionalR&Dactivity.
Themeasureofoffshoring is calculatedusing theuniverseof inventor-applicantpairs
(including ‘inventor countries’ that are not in the OECD). Multi-inventor or multi-applicant
patents that spanmore than one country are fractionally counted. The data come from the
EuropeanPatentOffice(EPO)WorldwidePatentStatisticalDatabase(PATSTAT).Thealgorithm
usedtoidentifypriorityfilingsandtofillinmissingdataonapplicantandinventorcountryof
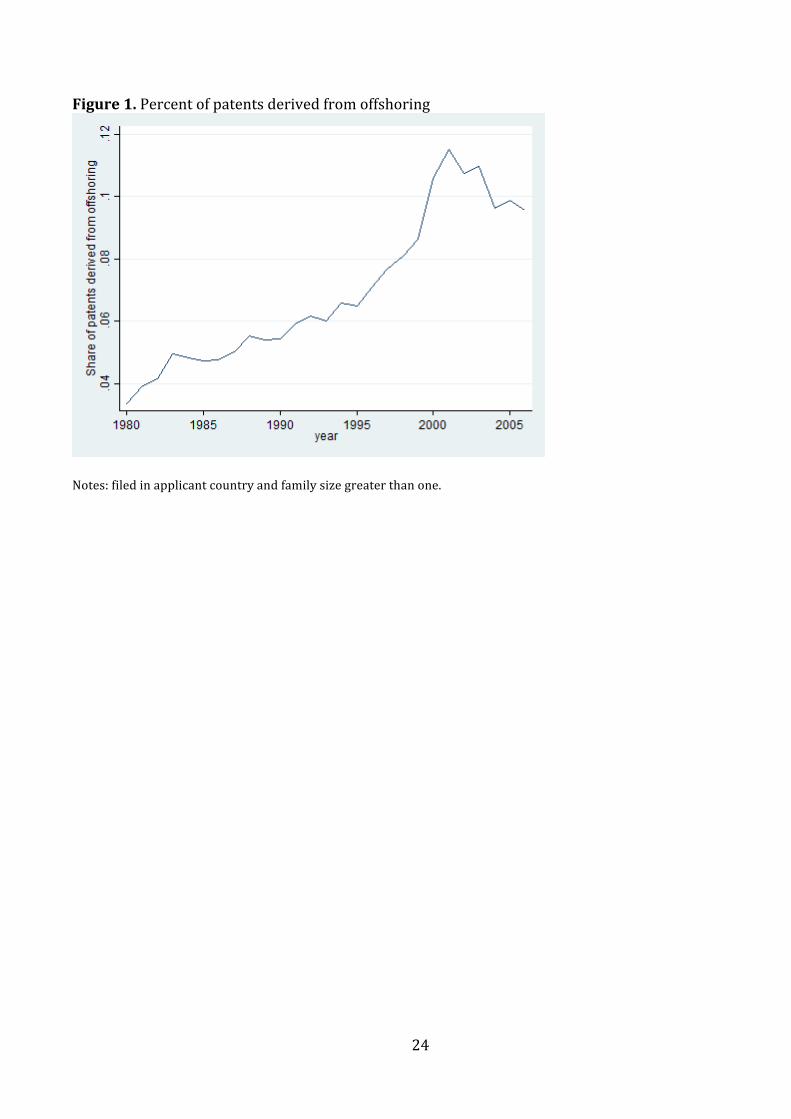
residence is discussed in de Rassenfosse et al. (2013). Figure 1 shows that the worldwide
8
proportionof‘offshoredpatents’hasgrown,from3percentintheearly1980stomorethan10
percentinthelate2000s.
[Figure1abouthere]
We allocate patents across industrial sectors using the International Patent
Classification (IPC)–industry concordance table developed by Schmoch et al. (2003).1 The
concordance table is derived from a complete enumeration of the patenting activity in
technology-based fieldsofmore than3,000 firmsthatareclassifiedby ISIC industrialsector.
Somemeasurementerrorisinevitableinsuchconcordanceprocedure,thoughweexpectthis
measurement error to be largely stable over time meaning it can be accommodated in the
econometricmodelinthesamemannerasothertimeinvariantheterogeneity.
Our patent data are unique because they provide a systematic, comprehensive and
globalview, thoughnaturally, theycapture thephenomenonof interestwithsomenoise.We
take a number of steps to increase confidence that our patent-based indicators are
representativeofR&Dactivities.Wediscusskeyaspectsnext.
Market-seekingR&Doffshoringisanticipatedtogeneratefewerbenefitstothefirms’
homecountry.Ouranalysis focuseson technology-seekingR&D,which is identifiedby those
patentswhicharefiledinthehomecountry.Wearguethatonecanusefilingbehaviortoidentify
technology- versus market-seeking R&D offshoring. Technology-seeking R&D is targeted at
developingnovel technologiesthatwillbeusedinthecompany’sglobaloperationssuchthat
therearestrongincentivestoseekprotectioninthehomecountry.Market-seekingoffshored
R&Disdirectedtowardsproducingatechnologyfor,oradaptingitto,thelocalmarket.Since
1TheIPCisahierarchicalpatentclassificationsystemusedinover100countriestoclassifythecontentofpatentsinthetechnologyareatowhichtheypertain.
9
technology generated via market-seeking R&D offshoring has relatively market-specific
usefulnessthereislimitedimpetusfortheinventingfirmtofileforpatentprotectioninthehome
country.2
By focusingonpatents thatare filed in thehome(applicant)countrywealso largely
avoidmeasurementerrorassociatedwith‘IPmigration’,whichiswheretheapplicantaddress
ischosenpurelyfortaxminimizationpurposes.Thereisnoincentiveforfirmstofileforpatent
protection in the Cayman Islands even if they allocates ownership to their Cayman Island
subsidiary for the purpose of taxminimization.3 Our sample avoidsmany of policies which
generatehighpoweredincentivestoundertakeIPmigration.Well-knowntaxhavenssuchasthe
CaymanIslandsarenotincludedinoursampleandtheperiodofanalysispre-datesthe‘patent
box’policiesimplementedintheNetherlands,Belgium,Luxembourg,andSpainafter2007.For
thecountries inoursample,aggregatepatternsofpatentassignmentarenotconsistentwith
whatwouldbepredictedbytaxminimization.Forexample,inlow-taxingIrelandmorepatents
inventedbyresidentsofIrelandareassignedtoforeignfirmsthanforeigninventedpatentsare
assigned to Irish affiliates—precisely the opposite of what tax minimizing behavior would
predict.Whileweseenostrongapriorireasontosuspectthatanymeasurementerrorarising
outofIPmigration,shoulditexist,shouldbesystematicallyrelatedtochangesinproductivityat
theindustrylevelweconsideraugmentedempiricalspecificationsinanefforttodirectlycontrol
forcorporateincometaxrateinthehomecountryaspartofourrobustnesschecking.
[Table1–abouthere]
2NotethatbyconstructionwefilteroutR&Dactivitiesthatareboth inventedbyandalsoassignedtoa foreignaffiliate.3Indeed,allocation/transferofownershipfortaxpurposesmainlytakestheformofintra-companytransferthatneedsnotbereportedtothepatentofficeinordertobeeffective.
10
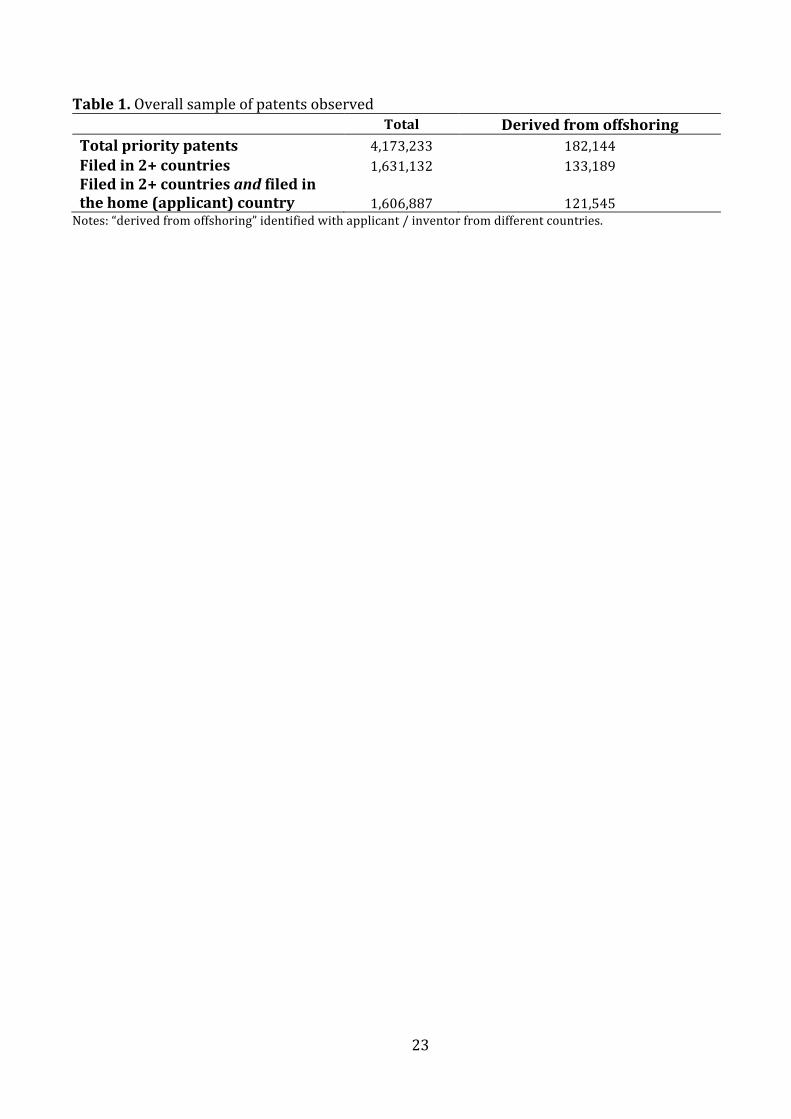
Table1showsthattherewerefourmillionprioritypatentapplicationsfiledworldwide
intheperiodbetween1980to2007,amongwhich182thousand(4percent)aretheresultof
R&Doffshoring.Restrictingthecount topatentapplications filed inat least two jurisdictions
(thusfilteringoutalargenumberoflow-valuepatents)leadstoaworldwidecountof1.6million
patentapplications,ofwhichapproximately8percentresultfromR&Doffshoring.
We validate our measure of offshored R&D by considering the relationship between
patentsassignedtoforeignentitiesandtheinternationalflowsof financeforthepurposesof
R&D. Data on bilateral R&D flows do not exist, however total R&D financed from abroad
aggregatedacrosspartnercountriesarecollectedbynationalstatisticsagenciesbywayoffirm
level survey (effectively aggregate R&D ‘onshoring’). The measure is expected to comprise
primarilytechnologyseekingR&Dactivities.ThecriteriaforrecordingR&Dbysourceoffunds
in theFrascatimanualstipulates that “theremustbeadirect transferof resources [and] the
transfermustbebothintendedandusedfortheperformanceofR&D”(OECD2002:114).Itdoes
notincludeforeignsourcedloansorothergeneralcapitalraisingorgeneraltransfersfromthe
parent firm. It alsodoesnot includeR&DperformedbyMNEaffiliatesand financed through
retainedearnings.
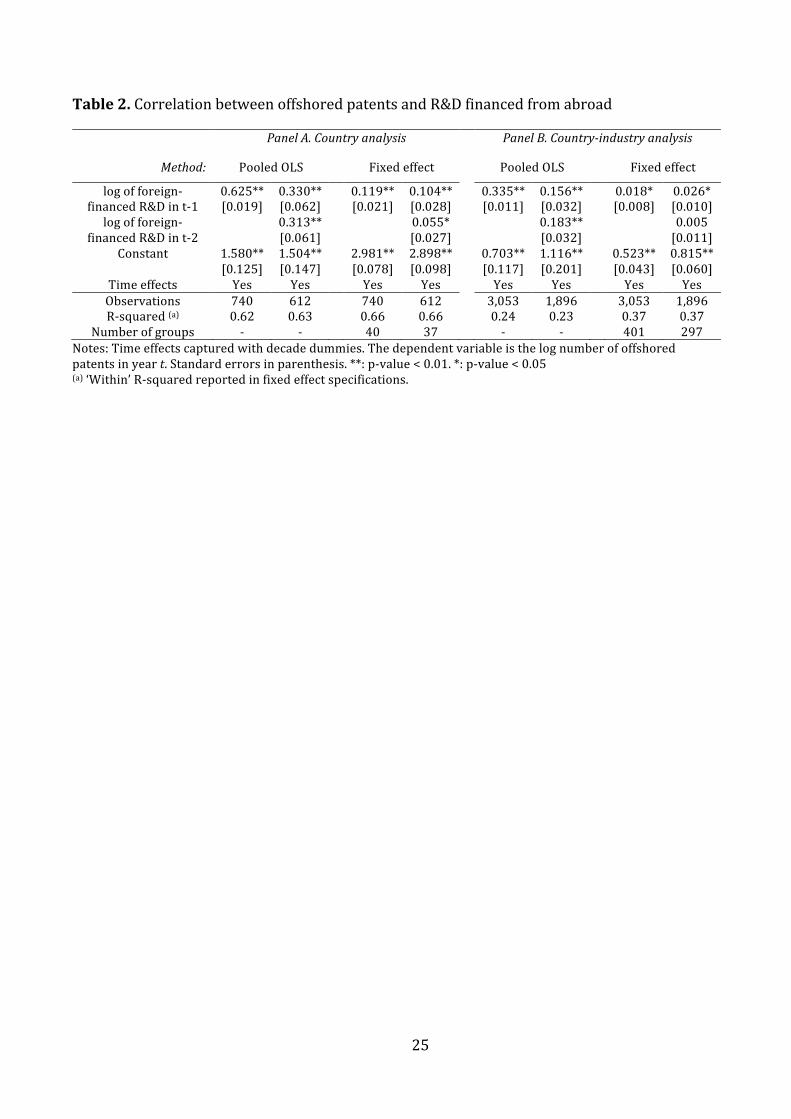
Table 2 reports a series of regression results aimed at testing this relationship. The
dependentvariableisthelaggedamountofR&Dfinancedfromabroad(inmillion2005USPPPs)
atthecountrylevelinpanelAandatthecountry-industrylevelinpanelB.Pooledcross-section
andfixedeffectestimatessuggestastrongrelationshipbetweenthepatent indicatorandthe
relevantR&Dflows,evenwhenaddingadditionallagstothespecification.Theresultsshowthat
theproductionofpatentswithforeignapplicantisstronglydeterminedbyforeignfinancedR&D.
TheyprovidefurtherconfidenceinthevalidityofourpatentbasedmeasureofoffshoredR&D.
[Table2–abouthere]
11
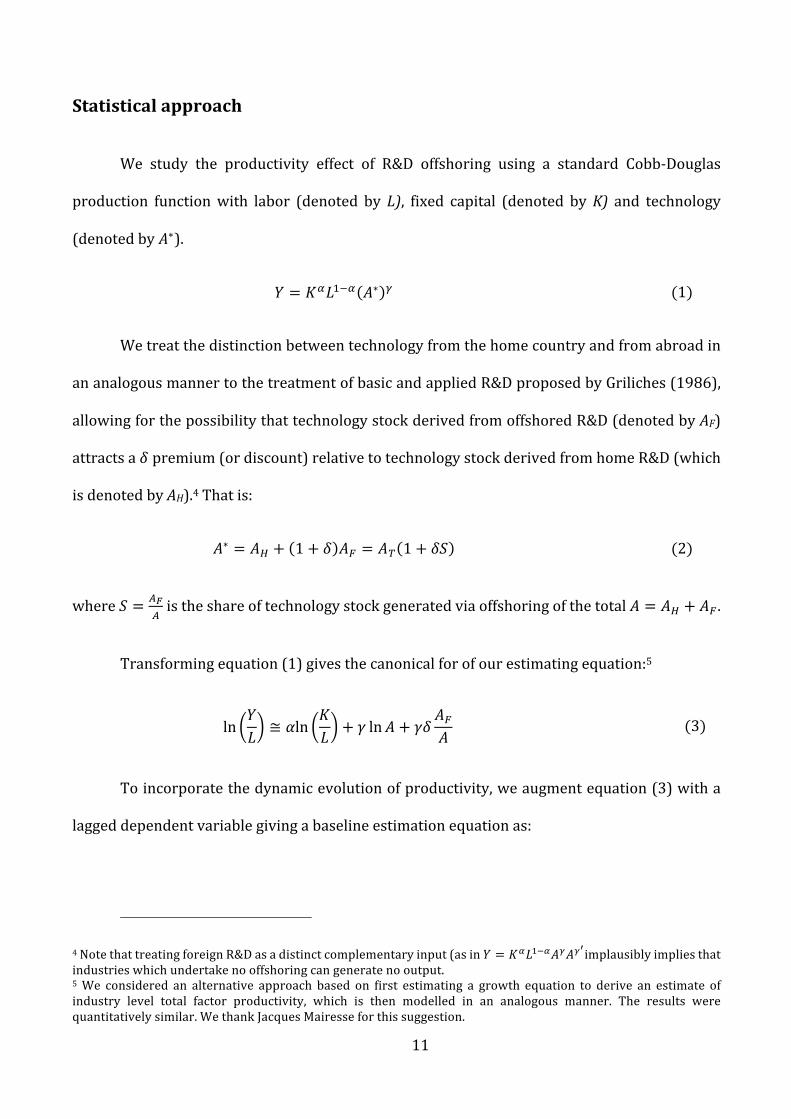
Statisticalapproach
We study the productivity effect of R&D offshoring using a standard Cobb-Douglas
production functionwith labor (denoted by L), fixed capital (denoted byK) and technology
(denotedbyD∗).
F = HIJKLI D∗ M (1)
Wetreatthedistinctionbetweentechnologyfromthehomecountryandfromabroadin
ananalogousmannertothetreatmentofbasicandappliedR&DproposedbyGriliches(1986),
allowingforthepossibilitythattechnologystockderivedfromoffshoredR&D(denotedbyAF)
attractsaPpremium(ordiscount)relativetotechnologystockderivedfromhomeR&D(which
isdenotedbyAH).4Thatis:
D∗ = DQ + 1 + P DS = DT 1 + PU (2)
whereU = VWV istheshareoftechnologystockgeneratedviaoffshoringofthetotalD = DQ + DS .
Transformingequation(1)givesthecanonicalforofourestimatingequation:5
ln FJ ≅ Yln H
J + Z lnD + ZP DSD (3)
Toincorporatethedynamicevolutionofproductivity,weaugmentequation(3)witha
laggeddependentvariablegivingabaselineestimationequationas:
4NotethattreatingforeignR&Dasadistinctcomplementaryinput(asinF = HIJKLIDMDM[implausiblyimpliesthatindustrieswhichundertakenooffshoringcangeneratenooutput.5We considered an alternative approach based on first estimating a growth equation to derive an estimate ofindustry level total factor productivity, which is then modelled in an analogous manner. The results werequantitativelysimilar.WethankJacquesMairesseforthissuggestion.
12
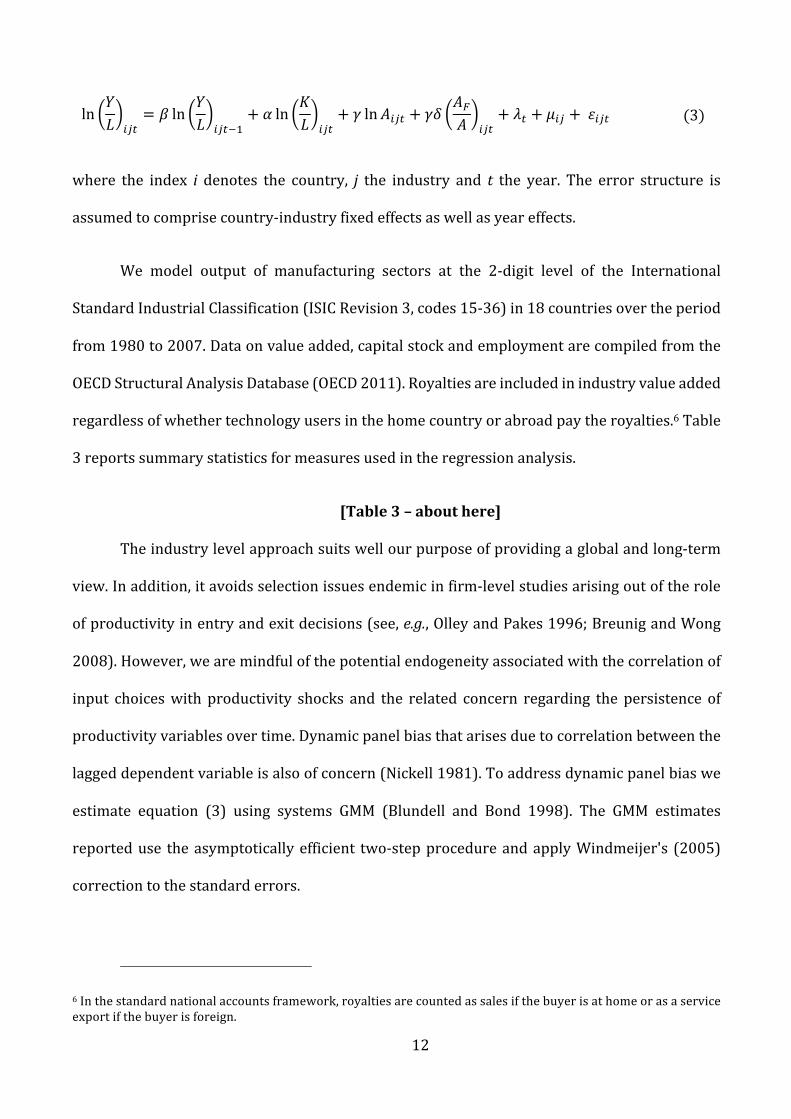
ln FJ \]^
= _ ln FJ \]^LK
+ Y ln HJ \]^
+ Z lnD\]^ + ZPDSD \]^
+ `^ + a\] +b\]^ (3)
where the index i denotes the country, j the industry and t the year. The error structure is
assumedtocomprisecountry-industryfixedeffectsaswellasyeareffects.
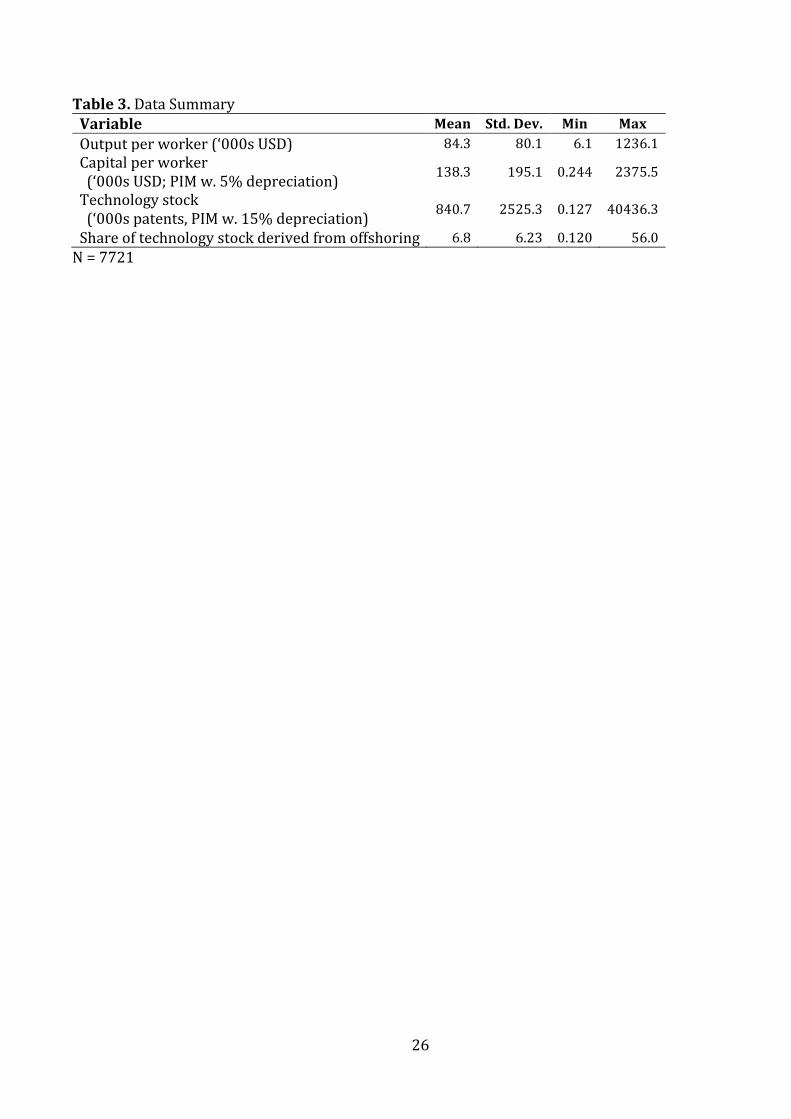
We model output of manufacturing sectors at the 2-digit level of the International
StandardIndustrialClassification(ISICRevision3,codes15-36)in18countriesovertheperiod
from1980to2007.Dataonvalueadded,capitalstockandemploymentarecompiledfromthe
OECDStructuralAnalysisDatabase(OECD2011).Royaltiesareincludedinindustryvalueadded
regardlessofwhethertechnologyusersinthehomecountryorabroadpaytheroyalties.6Table
3reportssummarystatisticsformeasuresusedintheregressionanalysis.
[Table3–abouthere]
Theindustrylevelapproachsuitswellourpurposeofprovidingaglobalandlong-term
view.Inaddition,itavoidsselectionissuesendemicinfirm-levelstudiesarisingoutoftherole
ofproductivityinentryandexitdecisions(see,e.g.,OlleyandPakes1996;BreunigandWong
2008).However,wearemindfulofthepotentialendogeneityassociatedwiththecorrelationof
input choiceswith productivity shocks and the related concern regarding the persistence of
productivityvariablesovertime.Dynamicpanelbiasthatarisesduetocorrelationbetweenthe
laggeddependentvariableisalsoofconcern(Nickell1981).Toaddressdynamicpanelbiaswe
estimate equation (3) using systems GMM (Blundell and Bond 1998). The GMM estimates
reporteduse theasymptoticallyefficient two-stepprocedureandapplyWindmeijer's (2005)
correctiontothestandarderrors.
6Inthestandardnationalaccountsframework,royaltiesarecountedassalesifthebuyerisathomeorasaserviceexportifthebuyerisforeign.
13
As already discussed, accounting for potential simultaneity between productivity and
R&D offshoring is fundamental to any attribution of causality. We consider a number of
approachestoaccommodatingthisissue.First,weconsideraninstrumentalvariableapproach
usingameasureofthetaxtreatmentofR&DinthehomecountryandinpotentialoffshoreR&D
hostcountries.Wealsoconsideramoreconventionalroutetodisentanglethecausalimpacts
usingsystemsGMMbyinstrumentingoffshoredshareoftechnologystockinamanneranalogous
totheautoregressiveterm.Weelaboratetheinstrumentalvariableapproachbelow.
Theappropriatenessandvalidityoftaxpolicyasaninstrumentiswellsupported.Thea
prioricasethatforeigntaxpolicyisexogenoustodomesticproductivityissound.Itisdifficultto
imagineamechanismthroughwhichR&DspecifictaxincentivesintheUKwillaffectindustrial
productivityintheUSAexceptviatheirinfluenceonthedistributionofcompanyR&Dbetween
thetwocountries.EvidencesuggestsR&Dtaxpolicyinfluencesfirms’R&Dlocationdecisions
(Hines1993;BloomandGriffith2001;Wilson2009).Weexpecttaxpolicytoprimarilyinfluence
the intensivemargin(ratherthanextensive) fortechnology-seekingtypeR&Doffshoring;we
arguethatthemarginthatisamenabletotheinfluenceoffiscalincentivesisofgreatestinterest
to policy. Validity of the instrument also requires independencewith the outcome variable,
namelyproductivity.
Data used tomeasure R&D tax policy are adapted from Thomson (forthcoming). The
measure isbasedonthestandardadaptationof Jorgenson’s(1963) ‘usercostofcapital’ first
proposedbyMcFetridgeandWarda(1983)andsubsequentlydevelopedbyBloometal.(2002),
Wilson (2009) and others. The measure, referred to as the ‘tax-price of R&D’, reflects the
breakeven benefit-cost ratio for a representative firms’ marginal R&D investment to be
profitableaftertaxtakingintoaccountanyreductionstocorporatetaxliabilitiesassociatedwith
eachdollarinvestedinR&D.Ourcountry-industryspecificpolicymeasureincorporatescross-
14
countryvariationintaxtreatmentofdifferentR&Dexpendituretypes(e.g.,laborandcapital)as
wellasinter-industryvariationinmixofexpendituresbytype.Tomeasuretheeffectivetaxprice
of offshored R&D for each countrywe use the average tax price across potential offshoring
locations (i.e., allothercountries in thesample).Taxpolicydataareonlyavailable forOECD
memberstatessonon-OECDcountriesarenotincludedinthiscalculation.Thislimitationhas
negligibleimpactonthemeasuredweightedaverageoffshoredtaxpriceasonlyasmallfraction
ofpatentsareattributedtoinventorswhoareresidentsofcountriesforwhichwedonothave
taxpriceinformation(seealsoKumar2001;Thomson2013).
Doesoffshoringaffecthomecountryproductivity?
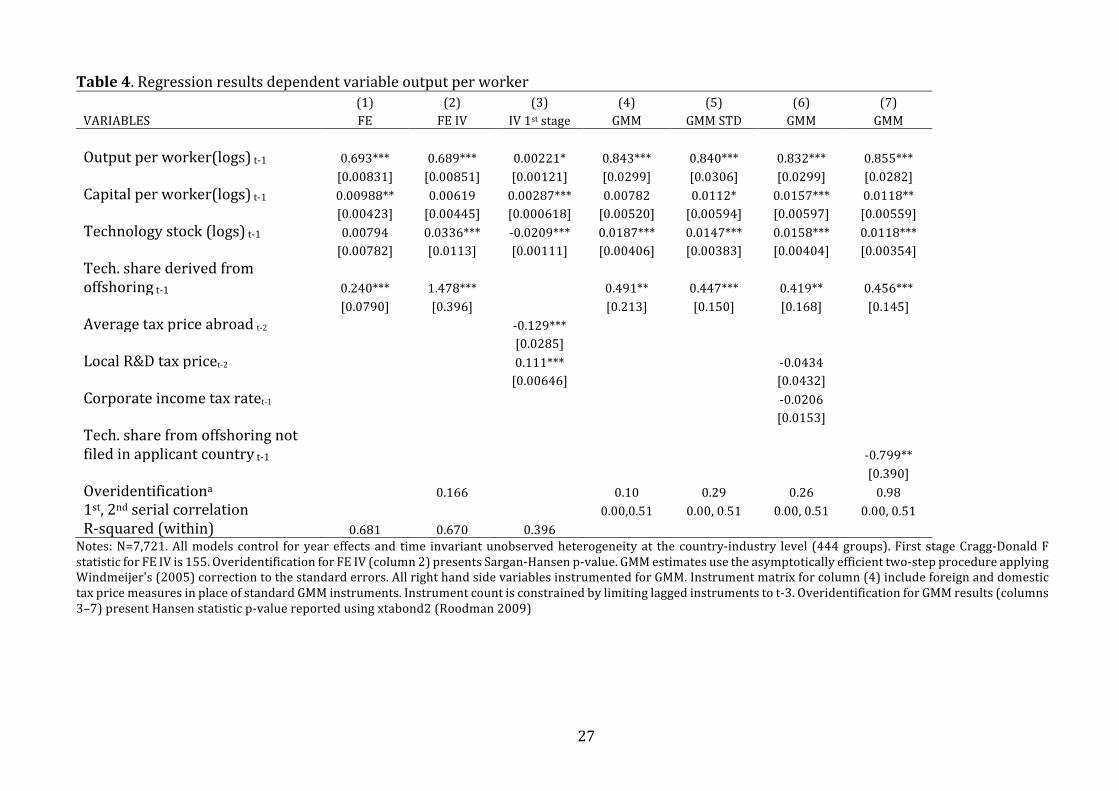
Table 4 depicts the main regression results. Column (1) presents a baseline fixed effects
estimate.Columns(2)and(3)showtheinstrumentalvariablemodel.Resultsofthefirststage
regression, which models the determinants of the share of technology stock derived from
offshoring,arepresentedincolumn(3)andareofconsiderableinterestintheirownright.These
resultsareconsistentwiththeviewthatthelocationofR&Disamenabletotheinfluenceoftax
subsidiesat themargin.The coefficientassociatedwith theaverageR&D taxpriceabroad is
negativeandsignificant,showingthatalowertaxpriceabroadiscorrelatedwithagreatershare
ofalltechnologystockbeingsourcedfromabroad.Correspondingly,domestic(homecountry)
taxpriceisfoundtobepositivelyrelatedtotheshareoftechnologysourcedfromabroad,which
impliesthatthehigherthelocaltaxpricethemoretechnologyissourcedfromoffshorelocations.
Thesecondstageresultsarepresentedincolumn(2).ADurbin-Wu-Hausmantestsupportsthe
theoretical prediction that offshoring is likely to be endogenous (p=0.001). The coefficient
associated with the offshoring share variable in the second stage equation is 1.478. These
15
estimatesmaybe affectedby the issuesofdynamicpanelbias and thepossibility that input
choice(physicalcapitalandtechnologystock)areendogenoustooutput.
Column(4)and(5)ofTable4presentGMMestimates.Bothcapitalstockperworkerand
technologystockperworkerareidentifiedviastandardsystemsGMMinstruments(differences
inthelevelequation,andlevelsinthedifferenceequation).Incolumn(5)theshareofpatent
stockgeneratedthroughoffshoringisalsoidentifiedusingthestandardsystemsGMMapproach.
Instrumentmatrixforcolumn(4)includesforeignanddomestictaxpricemeasuresinplaceof
standardGMMinstruments.Ascanbeseen, theresultsdonotvarygreatlybetween the two
identification approaches. The results suggest that as an industry increases the share of
technology generated via offshoring from the mean of around 10 percent to 20 percent,
productivitywillincreaseby4percent.TheimpliedpremiumassociatedwithoffshoredR&Dis
large,thoughreasonablycommensuratewithanticipatedadditionalcostsassociatedwithR&D
offshoringversusdomesticR&D.Ourfundamentalcontributionisfurnishingnewevidencethat
thehomecountry–notjustthefirm–canbenefitfromR&Doffshoring.
Column(6)reportsthefirstofourrobustnesscheckswherebyweaugmentthemodel
withbothcorporateincometaxrateandthelocalR&Dtaxprice.Thecoefficientsofinterestare
effectively unchanged which, we argue, provides further confidence that tax minimizing
intellectualpropertymigrationisnotundulyinfluencingourestimates.
[Table4abouthere]
WehavearguedpreviouslythatpatentsgeneratedviaoffshoredR&Dbutnotfiledinthe
homecountryarelikelytorepresentadaptive,market-seekingR&Dandarelesslikelytobenefit
thehomecountry.Empiricallytestingthispropositionismadecomplicatedbythefactthatthe
subsetofpatentsderivedfromoffshoringthatarefiledinthehomecountryarehighlycorrelated
withtotaloffshoring(correlationcoefficient0.94).Incolumn(7)wereportestimatesofamodel
that includes both the share of technology stock from technology-seeking type offshoring
16
(patents inventedabroadandalsofiled inthehomecountry)andthesharetechnologystock
from market-seeking type offshoring (patents invented abroad but not filed in the home
country). The coefficient associated with market-seeking R&D offshoring is negative and
significant.The estimate suggests thatmarket-seeking typeR&Doffshoring,which results in
patents that are not filed at home, may detract from home-base productivity. This finding
supports our conjecture that filing behavior provides a valuable indicator of whether the
technologybenefitshomecountryoperations.
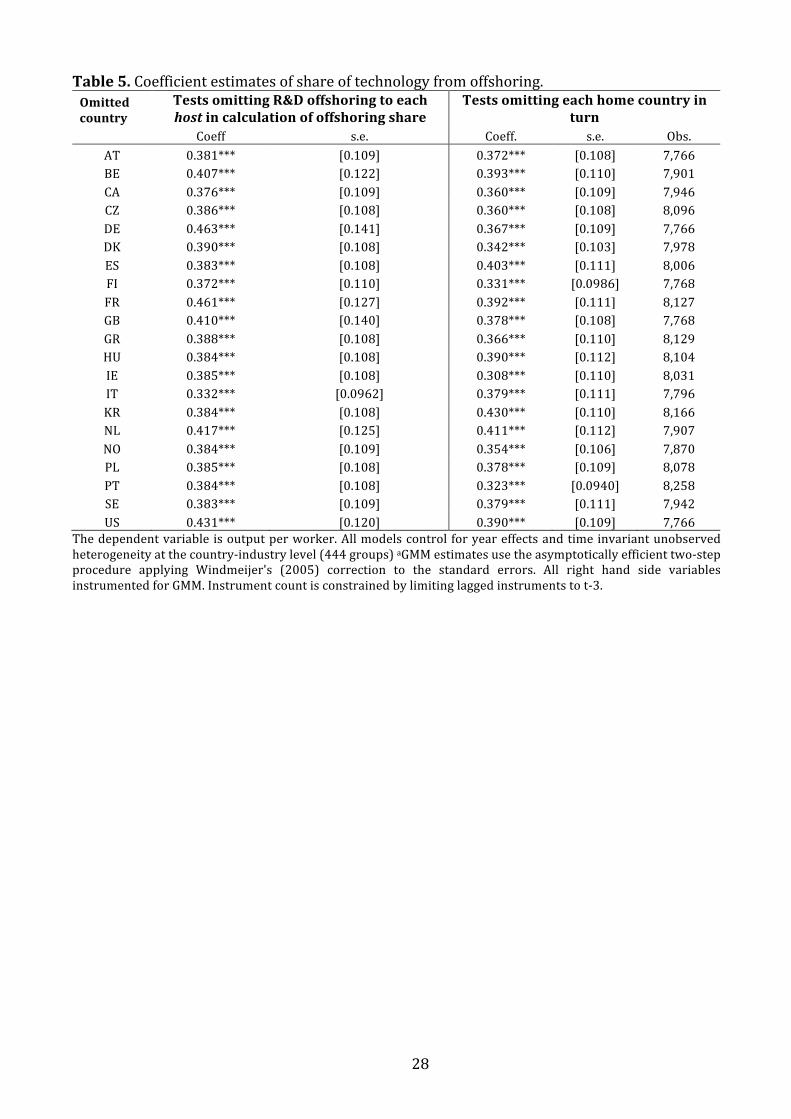
Animportantadvantageofourindustryleveldataistheexhaustiveandglobalnatureof
thesample.Itiswidelyconsideredthatfirms’benefitsfromoffshoringmaydependontheR&D
occurring ina frontiercountryorperhapsevenintheUnitedStatesspecifically.Thismaybe
cause for concern topolicymakers in theUnitedStates,which is thehomecountry to firms
engagedinthemostinR&Doffshoring.Usingourdata,weareabletotesttheextenttowhich
therelationshipbetweenoffshoringR&Dandhome-baseindustrialproductivitymaybedriven
byoffshoringtoanyspecificcountry.Toflushoutanyaboveaverageimpactofanyparticular
host country we re-estimate themodel 21 times, each time calculating a modified share of
technologystocksourcedfromoffshoringwithadifferenthostcountryomitted.Table5reports
estimatesofthecoefficientonshareoftechnologystockfromoffshoring,eachrowreflectinga
differentcountryomitted.Theseresultsshowthatnoonesinglecountryisdrivingtheestimated
parameter of interest. Put anotherway, in contrast toGriffith et al. (2006),we find nothing
‘special’aboutoffshoringtotheUnitedStates,conditionalontheoutputsoftheoffshoredR&D
beingfiledintheapplicantcountry(ourmeasureoftechnology-seekingR&Doffshoring).
[Table5abouthere]
WealsoconsideredthepossibilitythatatypicallylargebenefitsfromR&Doffshoringby
firms based in a specific home country may be driving the result. This may be the case if
17
absorptivecapacitythatiscrucialforestablishingoverallbenefitisdistributedunevenly.The
secondpanelofTable5presentsestimatesofthesamemodel,thistimesequentiallydroppinga
differenthomecountryforeachrow.Theestimatedcoefficientappearsquitestablegivingno
indicationthattheresulthingesonanyparticularcountry.Wealsoperformedsimilaranalysis
usingthefullsampleofcountriesbutdroppingoneindustryatatimeandfoundnoindication
thattheresultisovertlyinfluencedbytheoffshoringactivitiesofanysingleindustry.
Beforeofferingconcludingcommentsweconsidertheremaininglimitations.First,while
we provide a representative view of the average benefits reflecting the net impact on local
industry,includingbothprivateandspilloverbenefitsandlosses,theindustrylevelapproach
provides no new evidence on themechanism through which offshored R&D translates into
productivity improvements at home. These have been studied elsewhere and are
complementarytoourfinding(e.g.,Harhoffetal.2014).Directanalysisoftheextentofspillovers
wouldbeworthwhileandbestundertakenusingfirmleveldata.Second,weexpectthat,inpart,
ourresultreflectsahighercostofoffshoredR&D(thoughlowvaluepatentsarefilteredout).
Irrespective,ourresultsnewlyconfirmthatthehomecountry–notjustthefirm–benefitfrom
offshoringandindicatethatbenefitsarenotcontingentonthespecifichostlocations.Finally,we
arekeenlyawarethatanyinstrumentalvariableestimationisopentofundamentallyuntestable
criticismregardingtheveracityoftheassumptionofexogeneity.Wehavearguedthattheapriori
case that foreignR&D taxsubsidies isexogenous todomesticproductivity is soundand, this
appears tobeborneoutby standardoveridentification tests, notwithstanding their inherent
limitations.Weareperhapsmostreassuredbythefactthatresultappearsrobustacrosstwo
differentidentificationstrategies(IVandGMM).
18
Conclusion
ThepotentialforR&Doffshoringtoweakenthehomecountrytechnologicalcapabilitiesandthe
lossofproductivityspilloverscompromisinglong-termgrowthhasconcernedpolicymakersfor
alongtime.Wehaveinvestigatedthisconcernusingnewindustry-leveldataweemployedan
identification strategy which accommodates the potential simultaneity between industrial
performance and globalization Our results show that R&D offshoring can induce long-term
productivitybenefitsforhome-countryindustrialactorsatlarge.
WefindnoevidencethatbenefitsarerestrictedtofirmsoffshoringtotheUnitedStates—
oranyotherhostcountryinoursample.Thissupportstheviewthatfirmsthemselvesarebest
placedtochoosethelocationofR&Dwhichwillgeneratetechnologicaladvantageandequally
thatthegloballydispersedtechnologyfrontier isdifficulttocaptureusingaggregatenational
indicators.However,wefindthathomecountrybenefitshingeonthenatureofoffshoring.Our
resultsareconsistentwiththeargumentsmadebypreviousscholarsthatthebenefitsofmarket-
seekingR&Doffshoringwillprimarilyberestrictedtohostcountrymarkets.
OurresultshelptoreconciletraditionalfearsconcerningtheimpactofR&Doffshoringon
home economieswith the enduringly strong economic performance of those countriesmost
heavilyengaged in theactivity—theUnitedStatesandSwitzerlandareamong thehandfulof
OECDcountriesthatoffshoremoreR&Dthantheyhostwhichareallamongthemostproductive,
technologicallyadvancedeconomies (Thomson2013).Wehope that in this light, our results
might give pause for thought to policy makers who may otherwise be tempted to offer
inducementstocurboffshoring.
Naturally,moreresearchisneededinordertounderstandmoredetailedpatternsofthe
geographicaldistributionofbenefits,theextentofspilloverstootherfirmsinthehomecountry,
and the conditions underwhich benefitsmaybe enhanced. In this regard,wehope that the
19
methodologicalcontributionadvancedinthispapermaycontributetofutureworks.Specifically,
wehaveprovidedfirst-of-its-kindvalidationtestoftheuseofpatentdataasameasureofR&D
offshoring,makinguseoftheorigincountryofapplicantsandinventors.Moreover,theresults
suggestthatfilingpatternsprovideuseful informationaboutthegeographyofbenefitarising
frompatentedtechnologyand,morespeculatively,ameansofdistinguishingbetweenmarket-
seekingandtechnology-seekingR&Dactivities.Futurefirm-levelanalysisexploitinginformation
regardingfilingpatternscouldbeparticularlypromisinginelucidatingabetterunderstanding
aboutmultinationalenterprisetechnologystrategies.
20
References
Arvanitis,S.,&Hollenstein,H.(2011).HowdodifferentdriversofR&Dinvestmentinforeign
locationsaffectdomesticfirmperformance?AnanalysisbasedonSwisspanelmicrodata.
IndustrialandCorporateChange,20(2),605–640.
Bartlett,C.A.,&Ghoshal,S.(2000).Goingglobal:Lessonsfromlatemovers.HarvardBusiness
Review(March-April2000),132–142.
Ali-Yrkkö, J., & Rouvinen, P. (2015). Slicing up global value chains: amicro view. Journal of
Industry,CompetitionandTrade,15(1),69–85.
Bloom,N.,&Griffith,R.(2001).TheInternationalisationofUKR&D.FiscalStudies,22(3),337–
355.
Blundell,R.,&Bond,S.(1998).Initialconditionsandmomentrestrictionsindynamicpaneldata
models.JournalofEconometrics,87(1),115–143.
Breunig, R., & Wong, M. H. (2008). A richer understanding of Australia's productivity
performanceinthe1990s:Improvedestimatesbaseduponfirm-levelpaneldata.Economic
Record,84(265),157–176.
Criscuolo, P. (2009). Inter-firm reverse technology transfer: the home country effect ofR&D
internationalization.IndustrialandCorporateChange,18(5),869–899.
Cantwell,J.(1995).Theglobalisationoftechnology:whatremainsoftheproductcyclemodel?.
CambridgeJournalofEconomics,19(1),155–174.
deRassenfosse,G.,Dernis,H.,Guellec,D.,Picci,L.,&vanPottelsberghedelaPotterie,B.(2013).
Theworldwidecountofprioritypatents:Anew indicatorof inventiveactivity.Research
Policy,42(3),720–737.
Dunning, J.H. (1994).Multinational enterprisesand theglobalizationof innovatory capacity.
ResearchPolicy,23(1),67–88.
EuropeanCommission(2012).InternationalisationofbusinessinvestmentsinR&Dandanalysis
oftheireconomicimpact.EuropeanCommissiondocumentNo.EUR25195EN.
Griffith,R.,Harrison,R.,&VanReenen,J.(2006).Howspecialisthespecialrelationship?Using
the impactofUSR&DspilloversonUK firmsasa testof technologysourcing.American
EconomicReview,96(5),1859–1875.
Griliches, Z., 1979. Issues in assessing the contribution of research and development to
productivitygrowth.Thebelljournalofeconomics,pp.92-116.
21
Griliches, Z. (1986). Productivity, R&D, and basic research at the firm level in the 1970’s.
AmericanEconomicReview,76(1),141–154.
Guellec,D.,&vanPottelsberghedelaPotterie,B.(2001).Theinternationalisationoftechnology
analysedwithpatentdata.ResearchPolicy,30(8),1253–1266.
Harhoff,D.,Mueller,E.,&VanReenen,J.(2014).Whatarethechannelsfortechnologysourcing?
PaneldataevidencefromGermancompanies.JournalofEconomics&ManagementStrategy,
23(1),204–224.
Harhoff,D.,Scherer,F.M.,&Vopel,K.(2003).Citations,familysize,oppositionandthevalueof
patentrights.ResearchPolicy,32(8),1343–1363.
Hines, J. (1993). On the sensitivity of R&D to delicate tax changes: The behavior of U.S.
multinationals in the 1980s. In: A. Giovannini, R. Glenn Hubbard, and J Slemrod (eds),
StudiesinInternationalTaxation.Chicago:UniversityofChicagoPress.
Jaffe, A. B., Trajtenberg, M., & Henderson, R. (1993). Geographic localization of knowledge
spilloversasevidencedbypatentcitations.Quarterly JournalofEconomics,108(3),577–
598.
Kumar, N. (2001). Determinants of location of overseas R&D activity of multinational
enterprises:thecaseofUSandJapanesecorporations.ResearchPolicy,30(1),159–174.
Lall,S. (1979).The InternationalAllocationofResearchActivitybyUSMultinationals.Oxford
BulletinofEconomicsandStatistics,41(4),313–331.
LeBas,C.,&Sierra,C.(2002).‘Locationversushomecountryadvantages’inR&Dactivities:some
furtherresultsonmultinationals’locationalstrategies.Researchpolicy,31(4),589–609.
McFetridge,D.G.andJ.P.Warda(1983).CanadianR&DIncentives:TheirAdequacyandImpact,
CanadianTaxPaperNo.70.Toronto,CanadianTaxFoundation.
Mansfield,E.,Teece,D.,&Romeo,A.(1979).OverseasresearchanddevelopmentbyUS-based
firms.Economica,46(182),187–196.
Nickell,S.(1981).Biasesindynamicmodelswithfixedeffects.Econometrica,49(6),1417–1426.
NSF2010(http://www.nsf.gov/statistics/infbrief/nsf10322/)
OECD(2002).FrascatiManual2002–ProposedStandardPracticeforSurveysonResearchand
ExperimentalDevelopment.OECD:Paris,256pages.ISBN:9789264199033.
OECD(2009),Patentstatisticsmanual,Paris
OECD(2011),STANindicators,STAN:OECDStructuralAnalysisStatistics(database).
Olley, G. S., and A. Pakes. 1996. The dynamics of productivity in the telecommunicationsequipmentindustry.Econometrica64:1263–1297.
22
Patel, P., Pavitt, K., 1988. The international distribution and determinants of technological
activities.OxfordReviewofEconomicPolicy4,35–55.
Patel,P.,&Vega,M.(1999).Patternsofinternationalisationofcorporatetechnology:locationvs.
homecountryadvantages.ResearchPolicy,28(2),145–155.
Picci,L.(2010).Theinternationalizationofinventiveactivity:Agravitymodelusingpatentdata.
ResearchPolicy,39(8),1070–1081.
Porter,M.E.(1990),TheCompetitiveAdvantageofNations.NewYork,MacmillanInc.
Roodman,D. (2009).Howtodoxtabond2:An introduction todifferenceandsystemGMMin
Stata.StataJournal,9(1),86–136.
Schmoch,U.,Laville,F.,Patel,P.,&Frietsch,R.(2003).Linkingtechnologyareastoindustrial
sectors.FinalreporttotheEuropeanCommission-DGResearch.
Song, J., & Shin, J. (2008). The paradox of technological capabilities: a study of knowledge
sourcingfromhostcountriesofoverseasR&Doperations.JournalofInternationalBusiness
Studies,39(2),291–303.
Song,J.,Azakawa,K.,Chu,Y.,2011.Whatdeterminesknowledgesourcingfromhostlocationsof
overseas R&D operations? A study of global R&D activities of Japanese multinationals.
ResearchPolicy40,380–390.
Thomson,R.(2013).NationalscientificcapacityandR&Doffshoring.ResearchPolicy,42(2),517–
528.
Thomson, R., (forthcoming) The Effectiveness of R&D tax credits, Review of Economics and
Statistics,PostedOnlineNovember16,2015.
Vernon, R. (1966). International investment and international trade in the product cycle.
QuarterlyJournalofEconomics,80(2),190–207.
Wilson,D.J.(2009).Beggarthyneighbor?Thein-state,out-of-state,andaggregateeffectsofR&D
taxcredits.ReviewofEconomicsandStatistics,91(2),431–436.
Windmeijer,F.(2005).A finitesamplecorrectionforthevarianceof linearefficienttwo-stepGMMestimators.JournalofEconometrics,126(1),25–51.
23
Table1.Overallsampleofpatentsobserved Total DerivedfromoffshoringTotalprioritypatents 4,173,233 182,144Filedin2+countries 1,631,132 133,189Filedin2+countriesandfiledinthehome(applicant)country 1,606,887 121,545Notes:“derivedfromoffshoring”identifiedwithapplicant/inventorfromdifferentcountries.
24
Figure1.Percentofpatentsderivedfromoffshoring
Notes:filedinapplicantcountryandfamilysizegreaterthanone.
25
Table2.CorrelationbetweenoffshoredpatentsandR&Dfinancedfromabroad
PanelA.Countryanalysis PanelB.Country-industryanalysis
Method: PooledOLS Fixedeffect PooledOLS Fixedeffect
logofforeign-financedR&Dint-1
0.625**[0.019]
0.330**[0.062]
0.119**[0.021]
0.104**[0.028]
0.335**[0.011]
0.156**[0.032]
0.018*[0.008]
0.026*[0.010]
logofforeign-financedR&Dint-2
0.313**[0.061]
0.055*[0.027]
0.183**[0.032]
0.005[0.011]
Constant 1.580** 1.504** 2.981** 2.898** 0.703** 1.116** 0.523** 0.815** [0.125] [0.147] [0.078] [0.098] [0.117] [0.201] [0.043] [0.060]
Timeeffects Yes Yes Yes Yes Yes Yes Yes YesObservations 740 612 740 612 3,053 1,896 3,053 1,896R-squared(a) 0.62 0.63 0.66 0.66 0.24 0.23 0.37 0.37
Numberofgroups - - 40 37 - - 401 297Notes:Timeeffectscapturedwithdecadedummies.Thedependentvariableisthelognumberofoffshoredpatentsinyeart.Standarderrorsinparenthesis.**:p-value<0.01.*:p-value<0.05(a)‘Within’R-squaredreportedinfixedeffectspecifications.
26
Table3.DataSummaryVariable Mean Std.Dev. Min MaxOutputperworker(‘000sUSD) 84.3 80.1 6.1 1236.1Capitalperworker(‘000sUSD;PIMw.5%depreciation)
138.3 195.1 0.244 2375.5
Technologystock(‘000spatents,PIMw.15%depreciation)
840.7 2525.3 0.127 40436.3
Shareoftechnologystockderivedfromoffshoring 6.8 6.23 0.120 56.0
N=7721
27
Table4.Regressionresultsdependentvariableoutputperworker (1) (2) (3) (4) (5) (6) (7)VARIABLES FE FEIV IV1ststage GMM GMMSTD GMM GMM Outputperworker(logs)t-1 0.693*** 0.689*** 0.00221* 0.843*** 0.840*** 0.832*** 0.855*** [0.00831] [0.00851] [0.00121] [0.0299] [0.0306] [0.0299] [0.0282]Capitalperworker(logs)t-1 0.00988** 0.00619 0.00287*** 0.00782 0.0112* 0.0157*** 0.0118** [0.00423] [0.00445] [0.000618] [0.00520] [0.00594] [0.00597] [0.00559]Technologystock(logs)t-1 0.00794 0.0336*** -0.0209*** 0.0187*** 0.0147*** 0.0158*** 0.0118*** [0.00782] [0.0113] [0.00111] [0.00406] [0.00383] [0.00404] [0.00354]Tech.sharederivedfromoffshoringt-1 0.240*** 1.478*** 0.491** 0.447*** 0.419** 0.456*** [0.0790] [0.396] [0.213] [0.150] [0.168] [0.145]Averagetaxpriceabroadt-2 -0.129*** [0.0285] LocalR&Dtaxpricet-2 0.111*** -0.0434 [0.00646] [0.0432] Corporateincometaxratet-1 -0.0206 [0.0153] Tech.sharefromoffshoringnotfiledinapplicantcountryt-1 -0.799**
[0.390]Overidentificationa 0.166 0.10 0.29 0.26 0.981st,2ndserialcorrelation 0.00,0.51 0.00,0.51 0.00,0.51 0.00,0.51R-squared(within) 0.681 0.670 0.396 Notes:N=7,721.Allmodelscontrol foryeareffectsandtime invariantunobservedheterogeneityat thecountry-industry level (444groups).FirststageCragg-DonaldFstatisticforFEIVis155.OveridentificationforFEIV(column2)presentsSargan-Hansenp-value.GMMestimatesusetheasymptoticallyefficienttwo-stepprocedureapplyingWindmeijer's(2005)correctiontothestandarderrors.AllrighthandsidevariablesinstrumentedforGMM.Instrumentmatrixforcolumn(4)includeforeignanddomestictaxpricemeasuresinplaceofstandardGMMinstruments.Instrumentcountisconstrainedbylimitinglaggedinstrumentstot-3.OveridentificationforGMMresults(columns3–7)presentHansenstatisticp-valuereportedusingxtabond2(Roodman2009)
28
Table5.Coefficientestimatesofshareoftechnologyfromoffshoring.Omittedcountry
TestsomittingR&Doffshoringtoeachhostincalculationofoffshoringshare
Testsomittingeachhomecountryinturn
Coeff s.e. Coeff. s.e. Obs.AT 0.381*** [0.109] 0.372*** [0.108] 7,766BE 0.407*** [0.122] 0.393*** [0.110] 7,901CA 0.376*** [0.109] 0.360*** [0.109] 7,946CZ 0.386*** [0.108] 0.360*** [0.108] 8,096DE 0.463*** [0.141] 0.367*** [0.109] 7,766DK 0.390*** [0.108] 0.342*** [0.103] 7,978ES 0.383*** [0.108] 0.403*** [0.111] 8,006FI 0.372*** [0.110] 0.331*** [0.0986] 7,768FR 0.461*** [0.127] 0.392*** [0.111] 8,127GB 0.410*** [0.140] 0.378*** [0.108] 7,768GR 0.388*** [0.108] 0.366*** [0.110] 8,129HU 0.384*** [0.108] 0.390*** [0.112] 8,104IE 0.385*** [0.108] 0.308*** [0.110] 8,031IT 0.332*** [0.0962] 0.379*** [0.111] 7,796KR 0.384*** [0.108] 0.430*** [0.110] 8,166NL 0.417*** [0.125] 0.411*** [0.112] 7,907NO 0.384*** [0.109] 0.354*** [0.106] 7,870PL 0.385*** [0.108] 0.378*** [0.109] 8,078PT 0.384*** [0.108] 0.323*** [0.0940] 8,258SE 0.383*** [0.109] 0.379*** [0.111] 7,942US 0.431*** [0.120] 0.390*** [0.109] 7,766
Thedependentvariableisoutputperworker.Allmodelscontrol foryeareffectsandtimeinvariantunobservedheterogeneityatthecountry-industrylevel(444groups)aGMMestimatesusetheasymptoticallyefficienttwo-stepprocedure applying Windmeijer's (2005) correction to the standard errors. All right hand side variablesinstrumentedforGMM.Instrumentcountisconstrainedbylimitinglaggedinstrumentstot-3.