Embed Size (px)
Citation preview

SIRIS Report 2012–2016 Page 1
SIRIS Report 2012–2016Annual Report of the Swiss National Joint Registry, Hip and Knee
Swiss National Joint Registry
Hip and knee replacement results
SIRIS Report 2012–2016
Annual Report of the Swiss National Joint Registry, Hip and Knee
SIRIS – Foundation for Quality Assurance in Implant Surgery
swiss orthopaedics – Swiss Society of Orthopaedics and Traumatology
ANQ – National Association for the Development of Quality in Swiss Hospitals and Clinics
SwissRDL – Medical Registries and Data Linkage, Institute of Social and Preventive Medicine,
University of Bern
Page 4 SIRIS Report 2012–2016
Preface
Implant registry – what is it for?
More than ever before, it has become an impera-
tive of our time to measure quality and outcome in
modern health-care systems as the costs are rising
continuously and regulative measures based on evi-
dence are in demand.
To make the quality assessment as objective as
possible and a base of comparison for different tre-
atment modalities, registries are one of the tools to
allow a standardized evaluation of a large number of
patients. Ideally, such registry platforms are run by
independent institutions like University institutes,
since many currently available databases contain
clinical data which are individually programmed and
are based on a wide variety of validated and non-va-
lidated measurement tools, which make the data
comparison difficult or impossible. Compulsory cen-
tralized registries run and evaluated by experts with
an academic research background are a solution to
this problem.
By collecting information about both standard (com-
parator) and more innovative medical methods in
the registry, it is possible to make an objective as-
sessment of the results.

SIRIS Report 2012–2016 Page 5
Increase in content
The SIRIS implant registry is developing very well.
The content of the second SIRIS report 2012–2016
proved to be even more informative than the previ-
ous report. Additional analyses have enhanced the
registry data and show a nuanced picture of the hip
and knee implants conducted to date.
This positive development is largely thanks to the
focused dedication of the team of writers headed by
Prof. Pierre Hoffmeyer and Prof. Anne Lübbeke-Wolff.
Prof. Martin Beck, expert for hip implants, and Dr.
Bernhard Christen, expert for knee implants, were
added to the existing team, and provided substanti-
al support in creating the report.
The annual report’s increase in content in turn in-
creases the importance of the implant registry. The
professional association swiss orthopedics (SO) is
promoting the active use of SIRIS data by its mem-
bers, and the registry will be a major topic at the an-
nual SO conference in June 2018. The ANQ would like
to thank the team of writers, the SIRIS foundation
and the professional association for their valuable
support.
Thomas Straubhaar
President of the National Association for the
Development of Quality in Swiss Hospitals and
Clinics (ANQ)
Furthermore, an implant registry is also an early war-
ning system to recognize implants that are rejected
as a result of production or design faults. As this is
a very rare occurrence due to the quality of modern
implants, it can usually only be recognized, by me-
ans of a long-term analysis of large numbers and
may finally lead to the removal of the implant from
the market.
Together with its partners, SIRIS has reached an im-
pressive level of performance within a fairly short
space of time and delivers data that may help to
make meaningful decisions in the future Swiss he-
alth-care environment which are supported by evi-
dence and a broad consensus of all involved players.
It is the intention of all involved parties to constantly
improve this data collection and evaluation, therefo-
re registries are part of a dynamic process and not
static data collectors.
This and the recent recommendations of the Swiss
Academy of Science concerning medical registry
should encourage other medical disciplines to final-
ly establish equivalent registries instead of reinven-
ting the wheel.
Prof. Max Aebi
President of the Foundation for Quality Assurance
in Implant Surgery, SIRIS – Swiss National Implant
Registry, Hip and Knee
Page 6 SIRIS Report 2012–2016
Synopsis
IntroductionSince the start of the Swiss National Joint Registry
(SIRIS) in September 2012, 86’830 total hip arthro-
plasties, including primary and revision operations,
have been recorded. The numbers oscillate between
19’120 procedures in 2013 and 20’731 in 2016. Re-
visions represent 12.1% of all total hip arthroplasty
procedures.
Regarding knee arthroplasties, 75’467 entries have
been reported since September 2012. The number
of interventions increased from 16’519 primary and
revision operations performed in 2013 to 18’693 in
2016. The revision burden over the entire period was
9.8%.
Total hip arthroplasty With regard to primary total hip arthroplasty, 52%
were performed in women, two-thirds of interven-
tions occurred in patients aged over 65 years (the
mean age of the entire cohort being 68 years), and
24% of patients were obese.
In 2016, for total hips with primary osteoarthritis,
the anterior approach was used in 43% of cases,
while the antero-lateral approach was used in 33%
of cases, lateral in 8% and the posterior approach in
15% of cases. In patients with osteoarthritis, 86%
of the primary total hip arthroplasties used were un-
cemented.
For all revisions of hip arthroplasties, the main
causes were aseptic loosening of the femoral and/
or acetabular component (41%), infection (18%), pe-
riprosthetic fracture (15%) and dislocation (12%). In
22% of cases the revision included the exchange of
both the acetabular and femoral component.
Since 2012, 1.9% of patients with primary total hip
arthroplasty have had revisions performed within
12 months. It is interesting to note that the main
cause for these early revisions was periprosthetic
fractures followed by infection and dislocation.
SIRIS Report 2012–2016 Page 7
Synopsis
Hemiarthroplasty of the hip Hemiarthroplasties of the hip concern fractures of
the femoral neck or, more rarely, intertrochanteric
fractures. Compared to the 86’830 total hip arthro-
plasties implanted between 2012 and 2016, the
number of hemiarthroplasties was much lower, ac-
counting for 8’776 interventions. It is important to
note that the patients receiving these implants were
much older (a mean age of 84 years) and frailer, many
having underlying conditions such as osteoporosis
and sarcopenia.
In contrast to the recipients of total hip arthropla-
sties, the proportion of obese patients was low (8%
compared to 24%). Women constituted 72% of the
recipients, and the operation generally followed a
low-energy fall or traumatic event.
Knee arthroplastyWith regard to primary arthroplasties of the knee,
61% occurred in women, 69% of the interventions
were performed in patients aged over 65 years (com-
pared to the mean age of the entire cohort of 69.2 ye-
ars), and 39% of patients were obese. Primary oste-
oarthritis was the main diagnosis in 88% of cases in
2016, and 35% of patients had had previous surgery,
with arthroscopic exploration and meniscectomy ac-
counting for 34% of all previous interventions. Twen-
ty-four percent of the interventions were reported as
being computer assisted or using patient-specific
instrumentation. In more than 75% of procedures,
an all-cemented component fixation was reported in
2016. Patellar components were used only in one in
four cases.
Primary unicompartimental prostheses accounted
for 9’709 cases between 2012 and 2016, constitu-
ting 14.3% of primary knee arthroplasties. Of the
total number of operations, 51% were performed
in women and the mean age at surgery was 65 ye-
ars. Thirty-one percent of the patients were obese.
Primary osteoarthritis was the diagnosis in 92% of
cases. The data show that 40% of the patients had
had previous surgery, with knee arthroscopy and
meniscectomy accounting for 46% of the total. Of
these operations, 87% were medial, 6% were lateral
and 7% patellofemoral component replacements. In
more than 80% of cases an all-cemented component
fixation was used.
Among all revision knee arthroplasties, patella
problems were the leading cause for revision with
21.8%, followed by loosening of the tibial compo-
nent in 20.2%, and infection in 18% of the cases.
In 34.2% both tibial and femoral side were revised.
Since 2012, 2.0% of patients with primary total knee
arthroplasty have been revised within 24 months.
Patella problems constituted the main reason for an
early revision, followed by infection and pain.
Strong commitmentThe 2016 SIRIS report represents a collaborative
data collection effort involving all the institutional
partners of SIRIS, and including the surgeons and
operating teams in 156 clinics and hospital services.
Streamlining, improving and optimizing the data col-
lection is a work in progress involving expert groups
and all stakeholders, including the industrial part-
ners.
Overall, the response rate of the hospitals and clinics
for sending data has been remarkable. Although the
registry officially only started in 2012, it has already
enjoyed a response rate of over 96% of the involved
institutions.
This demonstrates not only the strong commitment
to the project by the surgeons and their teams both
in public and private institutions, but also the high
quality of the organization, coaching, and data col-
lection of the SIRIS team. The report provides factual
information on the state of hip and knee replace-
ments in Switzerland and presents a wealth of new
information. The report also offers important and
verifiable information that the health-care commu-
nity, third-party payers, and health-care regulators
will find useful.

Page 8 SIRIS Report 2012–2016
Acknowledgements
SIRIS Scientific Advisory Board
Prof. Pierre Hoffmeyer, MD
Emeritus Professor, University of Geneva
Prof. Anne Lübbeke-Wolff, MD, DSc
SIRIS Scientific Advisory Board leader,
Author of the scientific SIRIS-Report,
Epidemiologist, Lead Geneva Arthroplasty Registry,
Division of Orthopaedic Surgery and Traumatology,
Geneva University Hospitals
Prof. Martin Beck, MD
Surgeon in Chief, Orthopaedic division
Canton Hospital of Lucerne,
swiss orthopaedics, Hip Expert Group
Author of the scientific SIRIS-Report
Dr. Bernhard Christen, MD, M.H.A.
Christenortho AG, swiss orthopaedics,
Knee Expert Group
Author of the scientific SIRIS-Report
SIRIS Report 2012–2016 Page 9
SIRIS Expert Group
Prof. Claudio Dora, MD
Schulthess Clinic, Zurich, Senior Consultant Hip
Surgery, SIRIS Board Member
Regula Heller, MNSc, MPH
Chair Akutsomatik ANQ
Lead and moderation SIRIS Expert Group
Peter Liniger
Johnson & Johnson AG, SIRIS Board Member
Andreas Mischler
conidea GmbH, SIRIS Administration Lead
Jasmin Vonlanthen
User support for SIRIS Hip and Knee, SwissRDL,
ISPM, University of Berne
Dr. Peter Wahl, MD
Staff surgeon, Division of Orthopaedics and
Traumatology, Cantonal Hospital Winterthur
Dr. Christian Westerhoff, MD
Chief Clinical Officer Hirslanden,
Member QA Akutsomatik ANQ
SwissRDL, ISPM, University of Bern
Adrian Spörri, PhD, MPH
Head of SwissRDL, Statistical Analysis,
Data Linkage and Research, SIRIS Expert Group
Fabio Giudici, MSc
Statistical Analysis and Research
Partner associations of SIRIS
ANQ
National Association for the Development of Quality
in Swiss Hospitals and Clinics, [email protected]
Hplus
Association of the Hospitals of Switzerland
Swiss Medtech
Association of the Swiss Medtech Industry
santésuisse
Association of Swiss Medical Insurers
swiss orthopaedics
Swiss Society of Orthopaedics and Traumatology
All information in this report was composed with
the utmost care. If any changes or modifications are
made after publication, these will be published
on our website www.siris-implant.ch, where you can
also download the SIRIS Report 2012–2016.
Foundation for quality assurance
in implant surgery – SIRIS
c/o Conidea GmbH, 3604 Thun
[email protected], www.siris-implant.ch

SIRIS Report 2012–2016 Page 11
Contents
Preface 4
Synopsis 6
Acknowledgements 8
Definitions 12
1 Introduction 14
1.1 Purpose of the registry 14
1.2 Organization of the registry 15
2 Methods 16
2.1 Maintenance and hosting of the registry 16
2.2 Definitions 16
2.3 Data quality and completeness 17
2.4 Coverage 17
3 Commentary on the SIRIS report 2012–2016 19
4 Overview of SIRIS 20
5 Hip arthroplasty 23
5.1 Primary total hip arthroplasty 23
5.2 Revision of total hip arthroplasty 30
5.3 First revision of primary total hip arthroplasty 34
6 Hemiarthroplasty of the hip 39
6.1 Primary hemiarthroplasty 39
6.2 Conversion of hemiarthroplasty to total hip arthroplasty 43
7 Knee arthroplasty 45
7.1 Primary total knee arthroplasty 45
7.2 Primary partial knee arthroplasty 50
7.3 Revision of knee arthroplasty 55
7.4 First revision of a primary total knee arthroplasty 59
7.5 First revision of a primary partial knee arthroplasty 63
8 Participating hospitals 65

Page 12 SIRIS Report 2012–2016
Definitions
Acetabular component The part of a hip prosthesis that is
implanted into the acetabulum – the socket part of a ball and
socket joint
Arthrodesis A procedure in which a natural joint is fused
together
Arthrofibrosis Rigidity of the joint as a consequence of
connective tissue adhesion
Arthrotomy The opening of a joint during surgery
Articulation The two surfaces that move together
(articulate) in a total joint replacement
ASA score The scoring system of the American Society of
Anaesthesiologists (ASA) for grading the overall
physical condition of the patient, as follows:
I: fit and healthy; II: mild disease, not incapacitating;
III: incapacitating systemic disease; IV: life-threatening
disease
Benchmark Comparing the performance at a specific
hospital to the mean performances of hospitals throughout
Switzerland helps hospitals to learn from each other
Bilaterality Replacing the same joint on both sides of the
body (typically both hips or knees) by means of a prosthesis
within a specific period
Body Mass Index <18.5: underweight;
18.5–24.9: normal weight; 25–29.9: overweight;
30–34.9: obese class I; 35–39.9: obese class II;
>40: obese class III
Case mix Term used to describe variation in the population,
relating to factors such as diagnosis, patient age, gender and
health condition
Cement Material (polymethyl methacrylate) used to fix joint
replacements to bone
Charnley score Clinical classification system –
A: one joint affected; B1: both joints affected;
B2: contralateral joint with a prosthesis; C: several joints
affected or a chronic disease that affects quality of life
Competing risks survival analysis Method to calculate
survival taking into account various outcomes, in this case
revision and death
Cumulative incidence The combined incidences over a
specific period of an event (such as the revision of a
prosthesis or death of a patient)
Cumulative revision percentage Combined revision
percentage over a specific period
Femoral component Part of a hip or knee prosthesis that is
implanted into the femur (thigh bone) of the patient
Girdlestone Hip revision procedure in which the hip joint or
hip prosthesis is removed and no new prosthesis is
implanted (often because of a bacterial infection)
Hybrid fixation Fixation of a prosthesis in which one of
the two parts of a prosthesis is cemented and the other one
uncemented
Head component Part of a hip prosthesis that is implanted
on top of the femoral component of a hip
prosthesis and moves inside the acetabular component or
the cup of the hip joint
Inlay (insert) Intermediate component (inner layer),
made of polyethylene, which is placed in the acetabular
component
Kaplan-Meier survival analysis Method to calculate
survival, in which only one end point is possible, in this case
revision
Knee insert Intermediate component (inner layer), made of
polyethylene, which is placed in the tibial component of a
knee prosthesis
Lateral collateral ligament Lateral (outer) knee ligament
Malalignment Strain on a part of the body due to an
abnormal position of a joint component with respect to
other components
Meniscectomy Meniscus removal
SIRIS Report 2012–2016 Page 13
Metallosis Deposition of metal debris in soft tissues of the
body
Osteoarthritis Disease of the joint in which the cartilage is
damaged/destroyed, and the underlying bone altered
Osteochondral bone defect Defect of the joint surface in
which both cartilage and the underlying bone are affected
Osteonecrosis Cellular death of bone tissue
Osteosynthesis Securing broken bone parts together with
plates, pins and/or screws
Osteotomy Incision of the bone in order to correct its
position, to shorten or lengthen it
Patellar component Part of a knee prosthesis that is
implanted on the inner side of the knee cap
Patellofemoral prosthesis Two-piece knee prosthesis that
provides a prosthetic (knee) articulation surface between
the patella and trochlea (furrow) of the thigh bone (femur)
Primary prosthesis The first time (primary) a prosthesis is
implanted to replace the original joint
PROMs Patient Reported Outcome Measures
Resurfacing hip arthroplasty
Hip prosthesis in which the cup (acetabulum) is replaced
and a metal cap is implanted on top of the femoral head
Reverse hybrid fixation hip prosthesis
Fixation of a hip or knee prosthesis in which the proximal
component is cemented and the distal component is
uncemented
Revision arthroplasty Any exchange (insertion,
replacement and/or removal) of one or more components of
the prosthesis
Revision burden Ratio of revision procedures to all (pri-
mary and revision) arthroplasty procedures
Sarcopenia The degenerative loss of skeletal muscle mass
and strength associated with aging.
Synovectomy Removal of inflamed mucosa in a joint
Tibial component Part of a knee or ankle prosthesis that is
inserted in the tibia (shin bone) of a patient
Total joint arthroplasty Arthroplasty in which the entire joint
of a patient is replaced
Unicompartimental knee arthroplasty Resurfacing of half
the knee (either inner or outer side) by a prosthesis
Abbreviations
ASA American Society of Anaesthesiologists
BMI Body Mass Index
CI Confidence Interval
CRF Content Report Form
PROMs Patient Reported Outcome Measures
SD Standard Deviation
THA Total Hip Arthroplasty
TKA Total Knee Arthroplasty
UKA Unicompartmental Knee Arthroplasty

Page 14 SIRIS Report 2012–2016
1. Introduction
1.1 Purpose of the registry
The Swiss National Implant Registry, Hip and Knee
(Schweizerisches Implantat Register – Registre
Suisse des Implants; SIRIS) was formally introduced
and started the registration in September 2012. Par-
ticipation in the activity of SIRIS became compulso-
ry for all hospitals and clinics performing knee and
hip arthroplasties and that had signed the National
Quality agreement of ANQ, i.e. practically all Swiss
hospitals and clinics.
SIRIS is a national registry whose goal it is to help
oversee the safety and effectiveness of the various
implanted arthroplasties and to detect as early as
possible potential problems related to inferior im-
plant performance. For the industrial partners, SI-
RIS should serve as a post-marketing surveillance
instrument so as to allow the industry to track the
performance of their implants over the long term.
Moreover, each hospital and each surgeon can com-
pare their own data with the complete dataset and
evaluate their results against the overall results
found in the registry. The aim is to use the knowled-
ge gained from the data collected by SIRIS to impro-
ve the quality of care in Swiss hospitals and clinics.
The mission of a national joint registry needs to be
clearly defined so that all stakeholders and parti-
cipants strive towards a common goal. This also
influences the granularity of the information con-
tained in the registry as this will be quite a different
requirement for each of the involved partners. The
fact that a multi-partner association was needed
to get SIRIS off the ground and flying signified that
more than one point of view had to be taken into
consideration if success were to be achieved.
Although all the motivations pertaining to the signi-
ficance of registries apply to all the partners invol-
ved, each partner tends to focus more on a particular
aspect.
Patients expect their implant to provide them with a
long lasting, pain-free result. The operation must be
adapted to their level of activity and should be tissue
sparing and complication-free, followed by rapid
rehabilitation. The registry data should be presen-
ted in such a way as to be readily comprehensible,
allowing patients to distinguish between fact and
fiction in the «jungle» of orthopaedic arthroplasty
implants.
Surgeons are primarily concerned with avoiding sur-
gical complications and shortcomings in their indi-
vidual patients. The implants must be impeccable
in their manufacture, versatile and avoid problems
such as early loosening, particle disease, breaka-
ge, dislocation, infection, stiffness, or chronic pain.
A long, problem-free implant life with a minimum
amount of wear of the bearing surfaces is the ulti-
mate goal. The registry should identify in a relatively
short time frame the problematic implants as well
as the reliable ones. Surgeons are essentially mo-
tivated by their own individual clinical results to
enter proper and complete information into the data
collection system with minimal interference in their
daily activities. Surgeons will also want to bench-
mark their own results as compared to the overall
results for each implant, technique, and patient or
disease category. A moot question is the public avai-
lability of information at the individual surgeon le-
vel. This may lead to bias entering into the system by
encouraging some surgeon groups to avoid complex
or complication-prone patients, who are then left to
seek treatment in publicly funded institutions.
The industry’s main focus is on manufacturing and
sales. Designing and providing a first-rate, pro-
blem-free implant system is its primary goal. Pro-
gress and technical innovation are also powerful
motivators for an industry dedicated to providing
high-performance implants. The registry is seen as
an essential tool for post-market surveillance and

SIRIS Report 2012–2016 Page 15
Invoicing SIRIS-contributions
SIRIS Trust CompanyCollecting sales figures in the industry, invoicing clinics
Scientific Advisory Board Scientific evaluationInterpreting resultsFurther development of contentReports, studies, publications
Clinic
Ensuring registration, paying SIRIS contributions
SIRIS Foundation Board
Overall responsibility
SIRIS Office
Management, coordination, communication and administration
SwissRDL/ISPM / UniBern Registration/IT/hosting/training for clinics/audits/statistics/analysis/epidemiology/support for Scientific Advisory Board
1.2 Organisation of the registry
clinical control that justifies improvements in ma-
terials, design, and concepts. The down-side is that
overregulation may hinder efforts at innovation,
thereby missing opportunities to create better and
safer products.
Hospitals aim to provide excellent and safe care, at a
reasonable cost, to a large number of patients. Hos-
pitals want to avoid the expenditures and hazards re-
lated to implant systems of uncertain reliability and
value. The registry is perceived as a quality control
instrument, not only of the implants used, but of the
whole chain of its clinical organization, ranging from
the preoperative consultation, to the procedures in
the operating room and to the post-operative follow-
up. Hospitals, being health-care-providing institu-
tions in today’s competitive environment, are also
very keen to uphold their reputation and a registry is
an invaluable tool for this purpose.
Insurers and third-party payers want minimal delays
and waiting times for employed patients, short hos-
pitalization times, no expensive re-admissions for
complications, and a quick return to work. Insurers
are very cost-conscious when it comes to implant
pricing, medical honorarium, and hospital bills.
The insurers’wish is to provide equal benefits for all
their clients within the budget available to them. The
registry is therefore perceived as an instrument for
quality control of surgeons and institutions and also
a cost-control tool.
The government is concerned with the welfare of
the whole population. It therefore needs data on
the overall surgical activity for public health pur-
poses, for needs assessments, and for planning
the macroeconomic policies related to health care.
Government agencies are keen to ensure that the in-
stitutions under their supervision provide high-qua-
lity and complication-free health care to the overall
population. The agencies will also have an interest
in benchmarking hospitals and in keeping insuran-
ce and third-party payer costs down to a minimum.
Health agencies also play an important role in su-
pervising implant systems as they seek to guaran-
tee that the industrial specifications of nationally
manufactured and imported implants are safe and
reliable for public usage.

Page 16 SIRIS Report 2012–2016
2. Methods
2.1 Maintenance and hosting of the registry
The Swiss National Implant Registry, Hip and Knee
(SIRIS) is hosted and maintained by SwissRDL at the
Institute for Social and Preventive Medicine ISPM,
University of Bern. A dedicated team consisting of a
project manager, data management specialists, sta-
tistician and an epidemiologist is responsible for the
management and maintenance, technical support
and reporting and analyses of the registry. A data
monitor oversees the data entry at the hospitals and
supports and trains the collaborators at the partici-
pating hospital services to ensure the smooth and
efficient conduct of the registry.
SIRIS data are collected on the online documentati-
on platform MEMdoc (accessible on www.siris- doc.
ch). Clinical data on primary and revision operations
as well as implant data are recorded. The current
used version of the SIRIS forms for data entry can be
downloaded from www.siris-implant.ch. Most par-
ticipating hospital services use the online interface
when documenting their operations, while a small
minority sends completed paper forms to SwissRDL
for processing. As a third data entry method, two
large services send data exports from their hospital
information system via web service client to Swiss-
RDL.
Implants are entered into SIRIS by scanning the bar
codes of the implant tags in the operation room in
most participating facilities. It is also possible to
enter the information manually via the web interfa-
ce.
The clinical data of the SIRIS registry is stored on de-
dicated servers at the University of Bern. SwissRDL
is able to leverage the IT infrastructure of the ISPM
and the data protection resources of the University.
The ISPM IT team is responsible of roughly 30 phy-
sical servers and 120 virtual servers. The clinical
data of SIRIS is stored physically separated from the
patient identifying information (e.g. medical record
number, name and date of birth), which is stored on a
specific module server. The identifying information
is encrypted into a salted hash code, which allows to
identify patients who receive the revision of the pri-
mary implantation at a different health facility. This
is needed for the calculation of revision rates and for
the constant follow-up of the implants.
SwissRDL data protection was audited recently to
ensure compliance with current standards. The me-
thodology of splitting the clinical from the patient
identifying information was reviewed and approved
by data protection delegates (from the canton of
Bern and from the Federal Authority). Patients must
provide written informed consent before data are
entered into SIRIS. They have the right to withdraw,
to see what is stored and to have their data deleted
completely.
2.2 Definitions
Revision: A revision procedure is a secondary surgi-
cal procedure of a patient’s hip or knee joint whereby
the complete primary implant or parts thereof are re-
placed by new components.
Reoperation: All other secondary procedures, where
no components of the primary implantation are re-
moved, are reoperations.
Revision burden: One measure commonly used to
estimate the quality of arthroplasty surgery in a he-
alth-care system is the revision burden, defined as
the ratio of revision procedures to all (primary and
revision) arthroplasty procedures. In this report, we
calculated the revision burden separately for total
hip arthroplasties, hemiarthroplasties of the hip
and total knee arthroplasties.
SIRIS Report 2012–2016 Page 17
Kernel density estimation: The simplest form of
non-parametric density estimation is the histogram.
It is helpful to depict the frequency of a variable
using bins (= widths of the bars). One of the draw-
backs is that we can’t show several histograms in
one graph without messing up the bars. A solution
is using non-parametric kernel density estimation.
The underlying kernel can be Gaussian. Kernel den-
sity estimations are used to show the density (=de-
gree of compactness; on y-axis) of a variable (e.g.
age; on x-axis) for different subgroups (e.g. BMI) in
one simple graph.
Hospital service volumes: In the tables depicting
the case mix of arthroplasty populations, four cate-
gories of hospital service volume (<100, 100–199,
200–299, 300+ procedures per year) were used.
The calculation of the annual volume was performed
separately for hip and knee surgeries, using the
average of all (primary and revision) procedures
recorded in each hospital service in 2013–2016.
2.3 Data quality and completeness
Data for this report were exported from the database
on November 1st 2017. The consistency and comple-
teness of SIRIS data is checked through systematic
software-generated validation tests of received
data and a rollback in case of errors. This means
that data entered in the registry is checked both for
completeness and plausibility. For example, when a
case of developmental hip dysplasia is entered, the
system automatically checks that subsequent items
on the questionnaire relevant for this pathology are
completed and plausible. Error messages are dis-
played if the system detects missing or implausible
information, and only fully completed forms can be
saved and submitted to the central database.
It is not possible to distinguish between a revision of
a total and an unicompartmental knee arthroplasty
when the primary arthroplasty was performed be-
fore September 2012 (except when the conversion
from unicompartmental to TKA was indicated as rea-
son for revision). The same applies to hemiarthro-
plasties of the hip.
Two case report form (CRF) versions have been used
in SIRIS. The first version was used between 2012
and 2014. Since January 2015, an updated versi-
on has been used. It includes some changes in the
definition of existing variables (particularly for the
arthroplasty of the knee), and some new variables
were added, most notably the body mass index (BMI)
and the morbidity state (ASA). The latter allows the
answer “unknown”, which was inconsistently used
across hospital service-providers, including one
service reporting unknown ASA status in almost all
cases. Close monitoring of the hospitals will be set
in place to reduce missing values, for example for
BMI and ASA.
2.4 Coverage
To estimate the coverage of SIRIS, we compared the
annual numbers of cases reported in the registry
with those available in the Swiss hospital dischar-
ge master file of the Federal Statistical Office (FSO).
This encompasses a complete survey of all annual
hospital discharges in Switzerland. Each entry re-
presents a hospital discharge of a person residing
in Switzerland and includes information about so-
cio-demographic patient characteristics, diagnosis
and treatment.
In the Swiss hospital discharge master file, cases
of an arthroplasty surgery are identified using the
CHOP treatment classification of the FSO, which is

Page 18 SIRIS Report 2012–2016
an ICD-9-CM-based treatment classification. For pri-
mary THA we used 81.51.1, for hip revision surgery
81.52.2, 81.52.4 and 81.52.5. For the knees we used
for the primary TKA 81.54.21, 81.54.22, 81.54.23,
81.54.25 and for knee revision surgery 81.54.31,
81.54.32, 81.54.33, 81.54.35 and 81.54.4.
The overall coverage of SIRIS was 90.1% percent in
2015, and 89.4% percent in 2016 for THA and 88.0%
in 2015 and 87.8% in 2016 for TKA. Note that diffe-
rent sources of information have been used for this
estimation and the case definition for FSO and SIRIS
are not identical.
SIRIS Report 2012–2016 Page 19
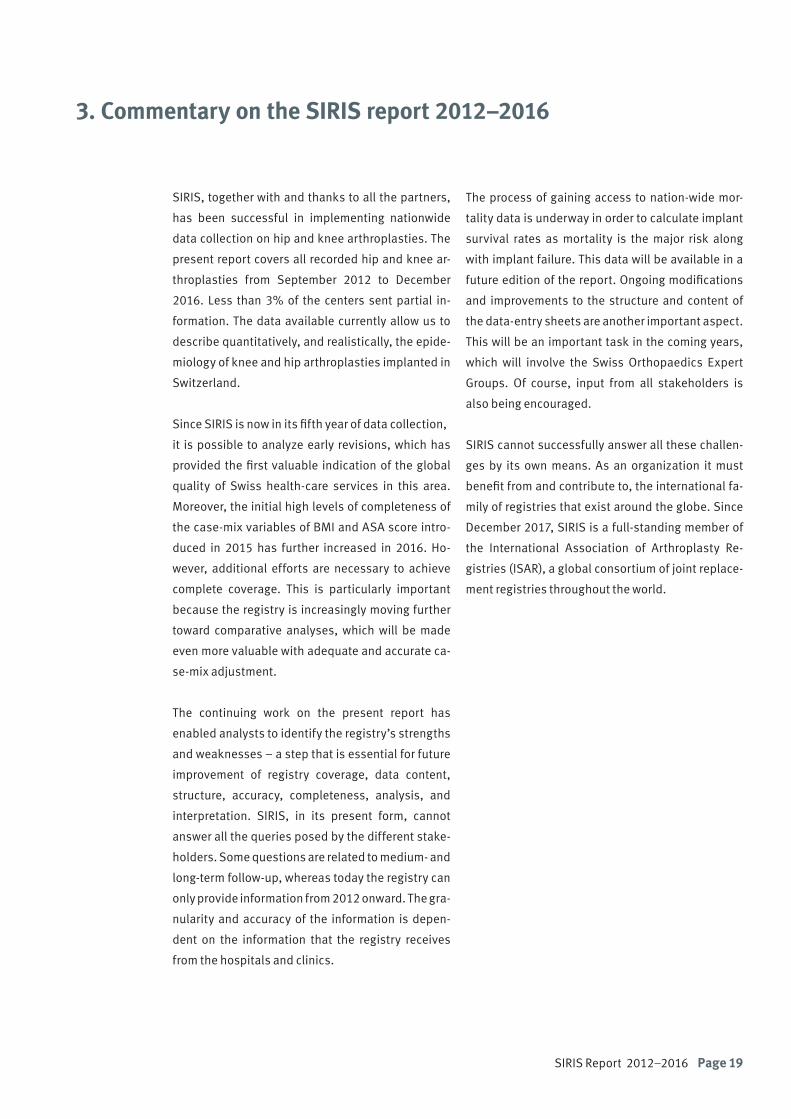
3. Commentary on the SIRIS report 2012–2016
SIRIS, together with and thanks to all the partners,
has been successful in implementing nationwide
data collection on hip and knee arthroplasties. The
present report covers all recorded hip and knee ar-
throplasties from September 2012 to December
2016. Less than 3% of the centers sent partial in-
formation. The data available currently allow us to
describe quantitatively, and realistically, the epide-
miology of knee and hip arthroplasties implanted in
Switzerland.
Since SIRIS is now in its fifth year of data collection,
it is possible to analyze early revisions, which has
provided the first valuable indication of the global
quality of Swiss health-care services in this area.
Moreover, the initial high levels of completeness of
the case-mix variables of BMI and ASA score intro-
duced in 2015 has further increased in 2016. Ho-
wever, additional efforts are necessary to achieve
complete coverage. This is particularly important
because the registry is increasingly moving further
toward comparative analyses, which will be made
even more valuable with adequate and accurate ca-
se-mix adjustment.
The continuing work on the present report has
enabled analysts to identify the registry’s strengths
and weaknesses – a step that is essential for future
improvement of registry coverage, data content,
structure, accuracy, completeness, analysis, and
interpretation. SIRIS, in its present form, cannot
answer all the queries posed by the different stake-
holders. Some questions are related to medium- and
long-term follow-up, whereas today the registry can
only provide information from 2012 onward. The gra-
nularity and accuracy of the information is depen-
dent on the information that the registry receives
from the hospitals and clinics.
The process of gaining access to nation-wide mor-
tality data is underway in order to calculate implant
survival rates as mortality is the major risk along
with implant failure. This data will be available in a
future edition of the report. Ongoing modifications
and improvements to the structure and content of
the data-entry sheets are another important aspect.
This will be an important task in the coming years,
which will involve the Swiss Orthopaedics Expert
Groups. Of course, input from all stakeholders is
also being encouraged.
SIRIS cannot successfully answer all these challen-
ges by its own means. As an organization it must
benefit from and contribute to, the international fa-
mily of registries that exist around the globe. Since
December 2017, SIRIS is a full-standing member of
the International Association of Arthroplasty Re-
gistries (ISAR), a global consortium of joint replace-
ment registries throughout the world.

Page 20 SIRIS Report 2012–2016
4. Overview of SIRIS
Year Primary total
Revision total
Total
2012 6652 863 7515
2013 16888 2234 19122
2014 17155 2463 19618
2015 17359 2485 19844
2016 18232 2499 20731
All 76286 10544 86830
Table 1 Total hip arthroplasty Overall number of documented operations
Table 3
Total and partial knee arthroplastyOverall number of documented operations
Year Primary total
Primary partial
Revision Total
2012 4731 852 529 6112
2013 12927 2147 1464 16538
2014 13263 2091 1605 16959
2015 13153 2278 1734 17165
2016 14265 2341 2087 18693
All 58339 9709 7419 75467
Table 2
Hemiarthroplasty of the hip Overall number of documented operations
Year Primary hemi-
arthroplasty
Conversion to total hip
arthroplasty
Total
2012 639 37 676
2013 1927 54 1981
2014 2039 54 2093
2015 1964 60 2024
2016 1958 44 2002
All 8527 249 8776
Figure 1 Distribution of age at surgery for total hip arthroplasty and hemiarthroplasty of the hipAll documented operations
Age at surgery
Den
sity
20 30 40 50 60 70 80 90 100 1100.00
0.01
0.02
0.03
0.04
0.05 Primary THA
Revision THA
Primary Hemi
Figure 2
Distribution of age at surgery by total and partial knee arthroplastyAll documented operations
Age at surgery
Den
sity
20 30 40 50 60 70 80 90 100 1100.00
0.01
0.02
0.03
0.04
0.05 Primary TKA
Revision TKA
Primary UKA

SIRIS Report 2012–2016 Page 21
Table 4
Number of participating hospital services (N) and maximum number of procedures per service per year (Max N)
2012 2013 2014 2015 2016
Primary total hip arthroplasty N services 130 151 150 152 158
Max N procedures per service 384 743 741 719 819
Revision of total hip arthroplasty N services 98 131 132 139 144
Max N procedures per service 100 234 241 146 149
Primary hemiarthroplasty of the hip N services 101 126 129 134 128
Max N procedures per service 44 102 103 91 112
Conversion of hemiarthroplasty of the hip N services 24 37 39 41 32
Max N procedures per service 4 5 4 5 3
Primary arthroplasty of the knee N services 127 147 149 151 150
Max N procedures per service 437 864 878 944 889
Primary unicompartmental knee arthroplasty N services 89 117 123 125 129
Max N procedures per service 90 183 179 171 170
Revision arthroplasty of the knee N services 88 123 127 126 131
Max N procedures per service 51 112 121 100 122
Table 5
Number of hospital services and number of procedures according to hospital service volume2012–2016
<25 25–49 50–99 100–199 200–299 300+
Primary total hip
arthroplasty
N services 38 28 35 47 13 11
N procedures 1325 3649 10289 26592 13159 21272
Primary knee
arthroplasty
N services 45 27 38 33 15 5
N procedures 1857 4034 10900 17577 14079 9892
Page 22 SIRIS Report 2012–2016
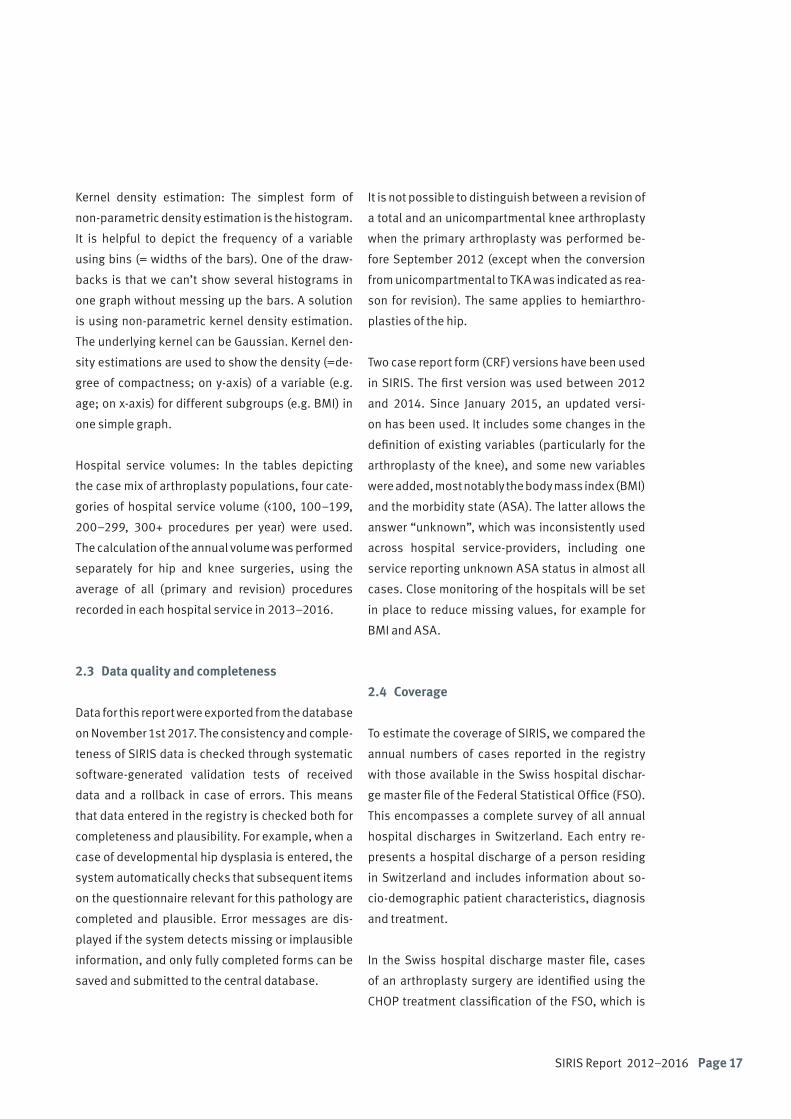
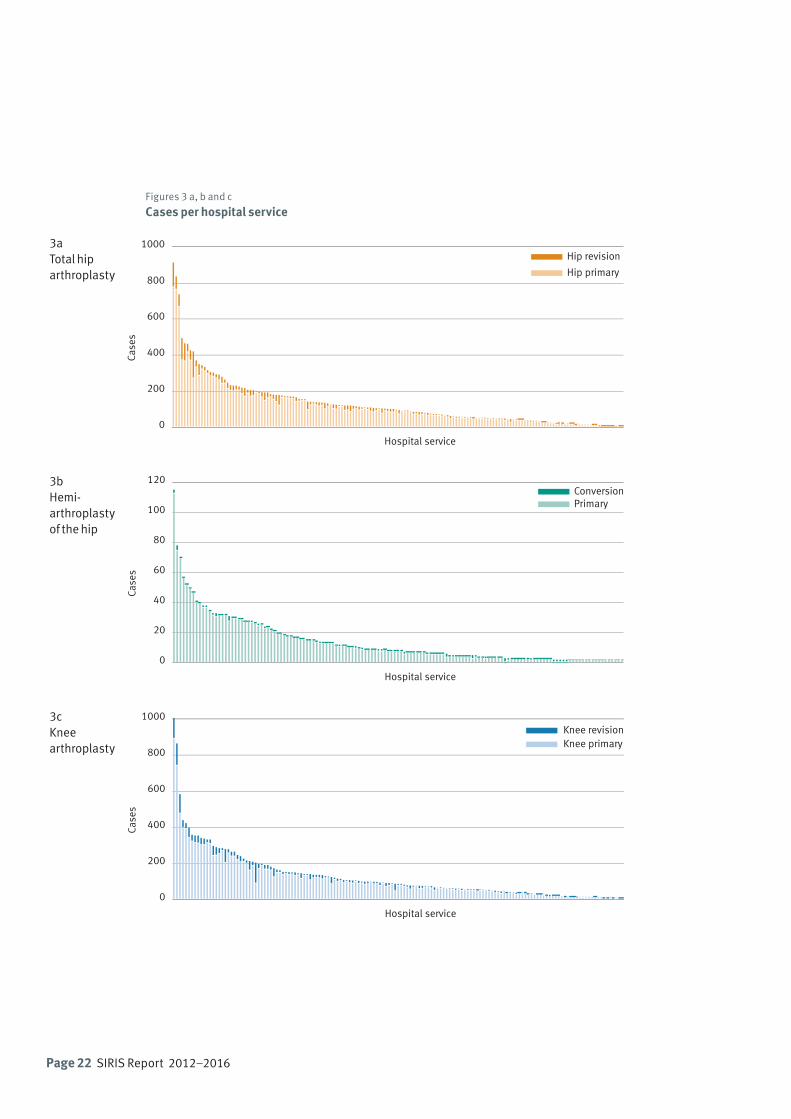
Figures 3 a, b and c
Cases per hospital service
3aTotal hiparthroplasty
3bHemi-arthroplastyof the hip
3cKnee arthroplasty
0
200
400
600
800
1000
Case
s
Hospital service
Hip revision
Hip primary
0
200
400
600
800
1000
Case
s
Hospital service
Knee revisionKnee primary
0
20
40
60
80
100
120
Case
s
Hospital service
ConversionPrimary
SIRIS Report 2012–2016 Page 23
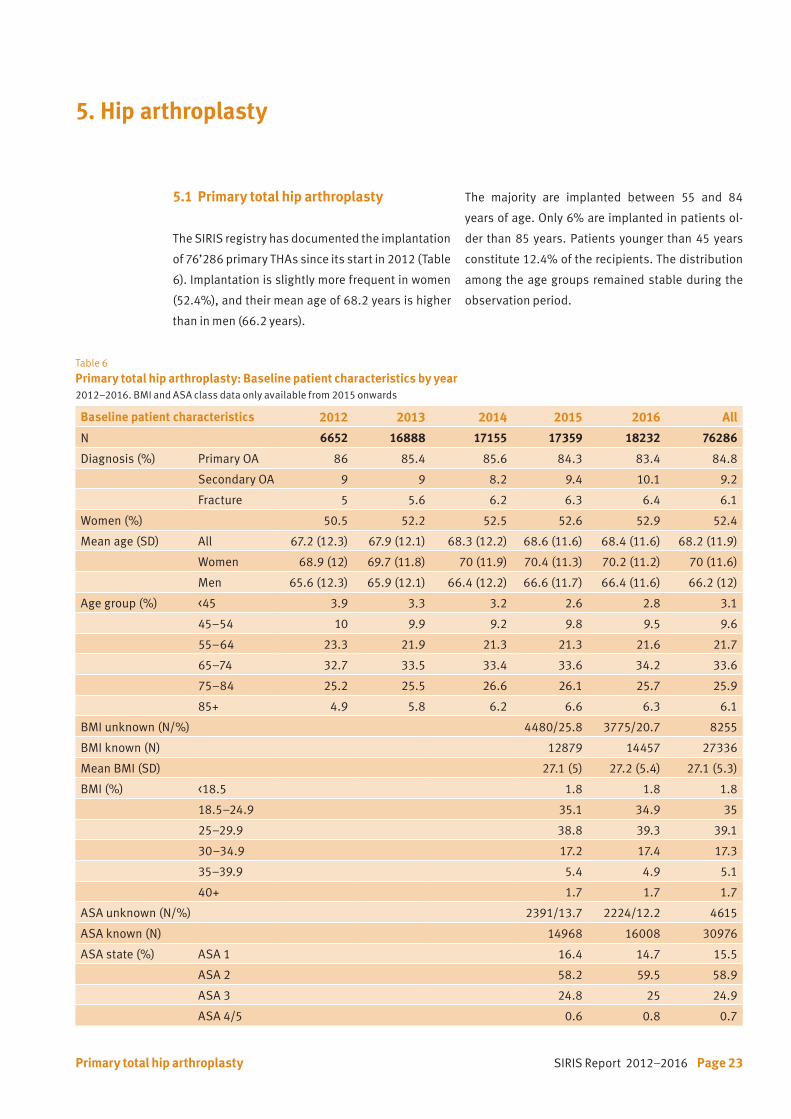
5.1 Primary total hip arthroplasty
The SIRIS registry has documented the implantation
of 76’286 primary THAs since its start in 2012 (Table
6). Implantation is slightly more frequent in women
(52.4%), and their mean age of 68.2 years is higher
than in men (66.2 years).
5. Hip arthroplasty
The majority are implanted between 55 and 84
years of age. Only 6% are implanted in patients ol-
der than 85 years. Patients younger than 45 years
constitute 12.4% of the recipients. The distribution
among the age groups remained stable during the
observation period.
Table 6
Primary total hip arthroplasty: Baseline patient characteristics by year2012–2016. BMI and ASA class data only available from 2015 onwards
Baseline patient characteristics 2012 2013 2014 2015 2016 All
N 6652 16888 17155 17359 18232 76286
Diagnosis (%) Primary OA 86 85.4 85.6 84.3 83.4 84.8
Secondary OA 9 9 8.2 9.4 10.1 9.2
Fracture 5 5.6 6.2 6.3 6.4 6.1
Women (%) 50.5 52.2 52.5 52.6 52.9 52.4
Mean age (SD) All 67.2 (12.3) 67.9 (12.1) 68.3 (12.2) 68.6 (11.6) 68.4 (11.6) 68.2 (11.9)
Women 68.9 (12) 69.7 (11.8) 70 (11.9) 70.4 (11.3) 70.2 (11.2) 70 (11.6)
Men 65.6 (12.3) 65.9 (12.1) 66.4 (12.2) 66.6 (11.7) 66.4 (11.6) 66.2 (12)
Age group (%) <45 3.9 3.3 3.2 2.6 2.8 3.1
45–54 10 9.9 9.2 9.8 9.5 9.6
55–64 23.3 21.9 21.3 21.3 21.6 21.7
65–74 32.7 33.5 33.4 33.6 34.2 33.6
75–84 25.2 25.5 26.6 26.1 25.7 25.9
85+ 4.9 5.8 6.2 6.6 6.3 6.1
BMI unknown (N/%) 4480/25.8 3775/20.7 8255
BMI known (N) 12879 14457 27336
Mean BMI (SD) 27.1 (5) 27.2 (5.4) 27.1 (5.3)
BMI (%) <18.5 1.8 1.8 1.8
18.5–24.9 35.1 34.9 35
25–29.9 38.8 39.3 39.1
30–34.9 17.2 17.4 17.3
35–39.9 5.4 4.9 5.1
40+ 1.7 1.7 1.7
ASA unknown (N/%) 2391/13.7 2224/12.2 4615
ASA known (N) 14968 16008 30976
ASA state (%) ASA 1 16.4 14.7 15.5
ASA 2 58.2 59.5 58.9
ASA 3 24.8 25 24.9
ASA 4/5 0.6 0.8 0.7
Primary total hip arthroplasty
Page 24 SIRIS Report 2012–2016
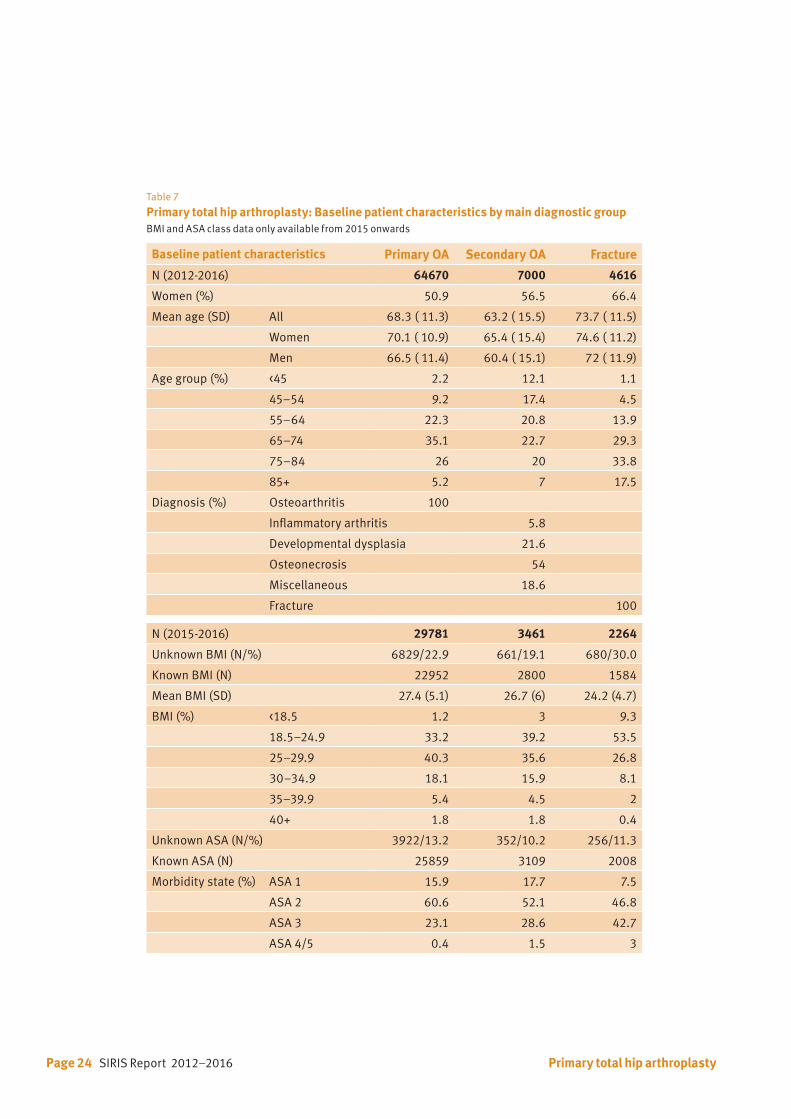
Table 7 Primary total hip arthroplasty: Baseline patient characteristics by main diagnostic groupBMI and ASA class data only available from 2015 onwards
Baseline patient characteristics Primary OA Secondary OA Fracture
N (2012-2016) 64670 7000 4616
Women (%) 50.9 56.5 66.4
Mean age (SD) All 68.3 ( 11.3) 63.2 ( 15.5) 73.7 ( 11.5)
Women 70.1 ( 10.9) 65.4 ( 15.4) 74.6 ( 11.2)
Men 66.5 ( 11.4) 60.4 ( 15.1) 72 ( 11.9)
Age group (%) <45 2.2 12.1 1.1
45–54 9.2 17.4 4.5
55–64 22.3 20.8 13.9
65–74 35.1 22.7 29.3
75–84 26 20 33.8
85+ 5.2 7 17.5
Diagnosis (%) Osteoarthritis 100
Inflammatory arthritis 5.8
Developmental dysplasia 21.6
Osteonecrosis 54
Miscellaneous 18.6
Fracture 100
N (2015-2016) 29781 3461 2264
Unknown BMI (N/%) 6829/22.9 661/19.1 680/30.0
Known BMI (N) 22952 2800 1584
Mean BMI (SD) 27.4 (5.1) 26.7 (6) 24.2 (4.7)
BMI (%) <18.5 1.2 3 9.3
18.5–24.9 33.2 39.2 53.5
25–29.9 40.3 35.6 26.8
30–34.9 18.1 15.9 8.1
35–39.9 5.4 4.5 2
40+ 1.8 1.8 0.4
Unknown ASA (N/%) 3922/13.2 352/10.2 256/11.3
Known ASA (N) 25859 3109 2008
Morbidity state (%) ASA 1 15.9 17.7 7.5
ASA 2 60.6 52.1 46.8
ASA 3 23.1 28.6 42.7
ASA 4/5 0.4 1.5 3
Primary total hip arthroplasty

SIRIS Report 2012–2016 Page 25
The BMI and morbidity state (ASA class) results are
recorded since 2015. However, data for BMI is mis-
sing in 23% and for ASA class in 12% of cases, due to
incomplete data reporting. The mean BMI was 27.1
kg/m2. Of the total number of interventions, 39%
were performed in overweight patients and 24% in
obese patients. Obesity is more frequent in younger
patients. Increasing BMI of the patient was associ-
ated with younger age at surgery (Figure 4). The ma-
jority of procedures are performed on healthy indi-
viduals; 25% of the implantations are performed in
ASA class ≥3.
With regard to the main diagnostic groups (Table
7), women are older and more frequently treated for
fractures. Overall, 80% of the patients treated for a
fracture are older than 65 years and 50% of the pa-
tients are older than 75 years. There is also a much
higher proportion of patients in the fracture group
belonging to ASA class ≥3.
Figure 4
Primary total hip arthroplasty: BMI in relation to age (Kernel density estimation)(Primary and secondary osteoarthritis patients only)
Age at surgery 20 30 40 50 60 70 80 90 100 110
0.01
0.02
0.03
0.04
Den
sity
BMI
<18.5
18.5–24.9
25–29.9
30–34.9
35–39.9
40+
Primary total hip arthroplasty
Page 26 SIRIS Report 2012–2016
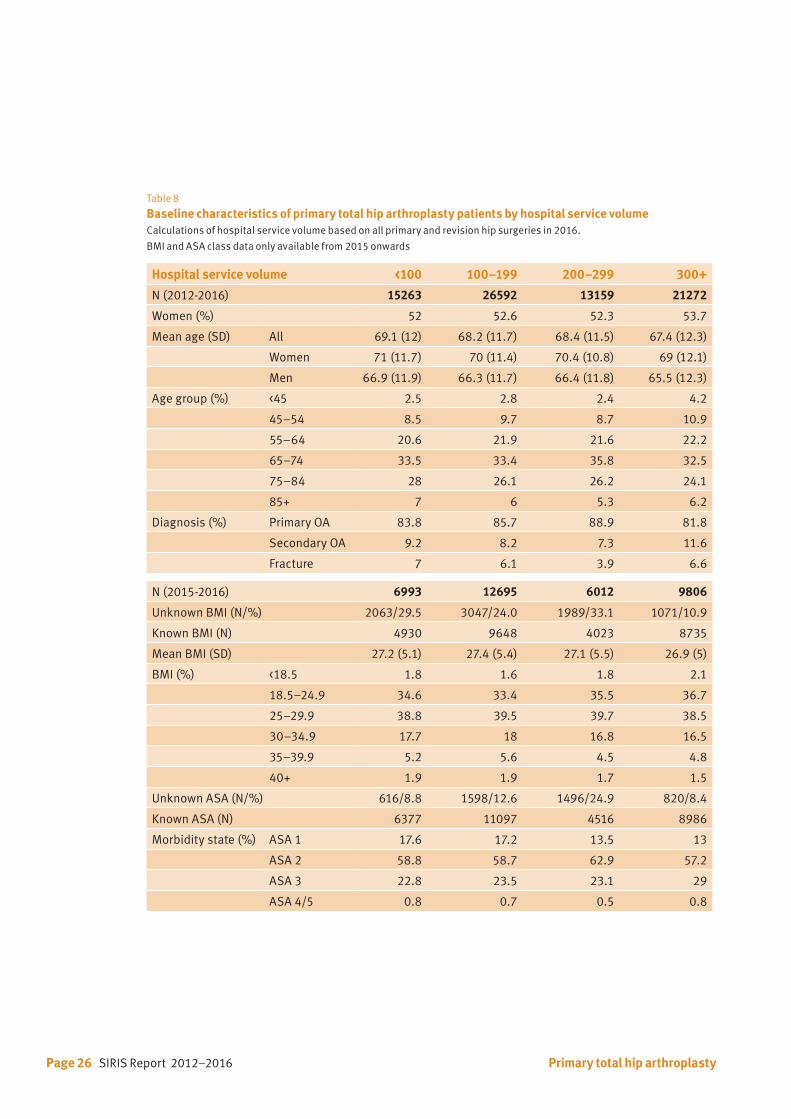
Table 8
Baseline characteristics of primary total hip arthroplasty patients by hospital service volumeCalculations of hospital service volume based on all primary and revision hip surgeries in 2016.
BMI and ASA class data only available from 2015 onwards
Hospital service volume <100 100–199 200–299 300+
N (2012-2016) 15263 26592 13159 21272
Women (%) 52 52.6 52.3 53.7
Mean age (SD) All 69.1 (12) 68.2 (11.7) 68.4 (11.5) 67.4 (12.3)
Women 71 (11.7) 70 (11.4) 70.4 (10.8) 69 (12.1)
Men 66.9 (11.9) 66.3 (11.7) 66.4 (11.8) 65.5 (12.3)
Age group (%) <45 2.5 2.8 2.4 4.2
45–54 8.5 9.7 8.7 10.9
55–64 20.6 21.9 21.6 22.2
65–74 33.5 33.4 35.8 32.5
75–84 28 26.1 26.2 24.1
85+ 7 6 5.3 6.2
Diagnosis (%) Primary OA 83.8 85.7 88.9 81.8
Secondary OA 9.2 8.2 7.3 11.6
Fracture 7 6.1 3.9 6.6
N (2015-2016) 6993 12695 6012 9806
Unknown BMI (N/%) 2063/29.5 3047/24.0 1989/33.1 1071/10.9
Known BMI (N) 4930 9648 4023 8735
Mean BMI (SD) 27.2 (5.1) 27.4 (5.4) 27.1 (5.5) 26.9 (5)
BMI (%) <18.5 1.8 1.6 1.8 2.1
18.5–24.9 34.6 33.4 35.5 36.7
25–29.9 38.8 39.5 39.7 38.5
30–34.9 17.7 18 16.8 16.5
35–39.9 5.2 5.6 4.5 4.8
40+ 1.9 1.9 1.7 1.5
Unknown ASA (N/%) 616/8.8 1598/12.6 1496/24.9 820/8.4
Known ASA (N) 6377 11097 4516 8986
Morbidity state (%) ASA 1 17.6 17.2 13.5 13
ASA 2 58.8 58.7 62.9 57.2
ASA 3 22.8 23.5 23.1 29
ASA 4/5 0.8 0.7 0.5 0.8
Primary total hip arthroplasty

SIRIS Report 2012–2016 Page 27
Total hip arthroplasties constituted 99.9% of all
procedures (Table 9). During the registration peri-
od, only 62 hip resurfacing procedures were docu-
mented. The surgical approach is documented since
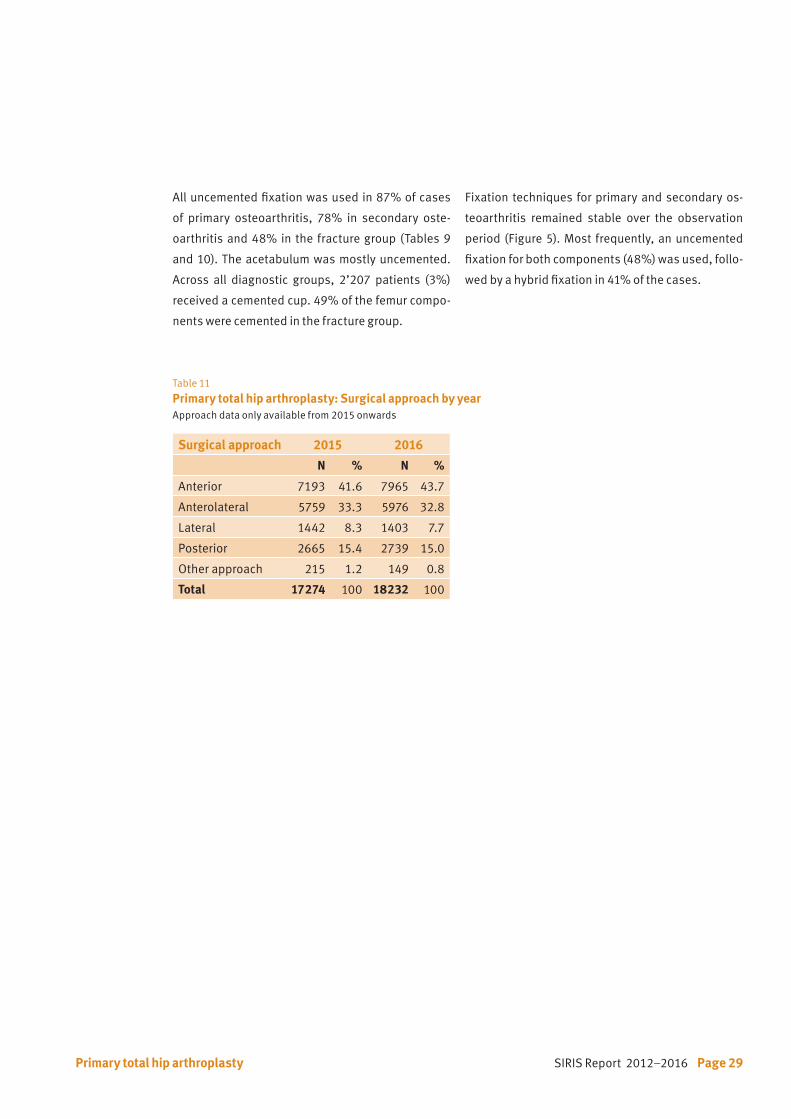
2015 (Tables 9 and 11).
Overall, the anterior approach (DAA) was the most
commonly used approach (43%), followed by the
anterolateral approach used in 34% of cases, the
posterior approach in 15%, and the lateral approach
was used in less than 10% of the interventions. The
anterior approach gained popularity and increased
from 41.6% in 2015 to 43.7% in 2016.
Table 9 Primary total hip arthroplasty: Surgery characteristics by main diagnostic groupApproach data only available from 2015 onwards
Surgery characteristics Primary OA Secondary OA Fracture
N % N % N %
Previous surgery None 5607 80.1 4040 87.5
Internal fixation femur 694 9.9 127 2.8
Osteotomy femur 384 5.5 396 8.6
Internal fixation acetabulum 281 4.0 37 0.8
Osteotomy pelvis 41 0.6 38 0.8
Arthrodesis 123 1.8 6 0.1
Other previous surgery 4 0.1 3 0.1
Intervention Total hip replacement 64622 99.9 6993 99.9 4609 99.8
Hip resurfacing 48 0.1 7 0.1 7 0.2
Approach Anterior 12774 42.9 1432 41.4 952 42.0
Anterolateral 10017 33.6 1141 33.0 609 26.9
Posterior 4492 15.1 534 15.4 378 16.7
Lateral 2278 7.6 285 8.2 282 12.4
Other approach 249 0.8 70 2.0 45 2.0
Fixation All uncemented 55921 86.5 5464 78.1 2222 48.1
Hybrid* 7371 11.4 1006 14.4 1767 38.3
All cemented 841 1.3 303 4.3 450 9.7
Reverse hybrid** 387 0.6 127 1.8 99 2.1
Reinforcement ring, femur uncemented
81 0.1 42 0.6 31 0.7
Reinforcement ring, femur cemented
69 0.1 58 0.8 47 1.0
* acetabulum uncemented, femur cemented
** acetabulum cemented, femur uncemented
Primary total hip arthroplasty

Page 28 SIRIS Report 2012–2016
Tables 10 a, b, c and Figures 5 a, b, c
Primary total hip arthroplasty: Component fixation methods by diagnostic group by year
Total numbers per year Percentage per yearTable/Figure a Primary osteoarthritis
Table/Figure b Secondary osteoarthritis
Table/Figure c Fracture
0
20
40
60
80
100
120
0
20
40
60
80
100
120
reinforcement ring, femur uncem
reinforcement ring, femur cem
reverse hybrid
hybrid
all uncemented
all cemented
0
20
40
60
80
100
120
reinforcement ring, femur uncem
reinforcement ring, femur cem
reverse hybrid
hybrid
all uncemented
all cemented
2012 2013 2014 2015 2016
2012 2013 2014 2015 2016
2012 2013 2014 2015 2016
2012 2013 2014 2015 2016
8 10 19 22 22
13 16 16 10 14
32 91 104 86 74
682 1686 1613 1692 1698
4923 12454 12726 12595 13223
64 165 205 228 179
5722 14422 14683 14633 15210
2012 2013 2014 2015 2016
9 13 5 8 7
8 16 9 12 13
9 24 28 33 33
89 233 210 213 261
463 1174 1091 1297 1439
21 62 57 69 94
599 1522 1400 1632 1847
2012 2013 2014 2015 2016
3 7 2 10 9
3 10 7 17 10
11 25 22 24 17
127 347 422 431 440
160 476 520 489 577
27 79 99 123 122
331 944 1072 1094 1175
Reinforcement ringfemur uncemented
Reinforcement ringfemur cemented
Reverse hybrid
Hybrid
All uncemented
All cemented
Total
0
20
40
60
80
100
120
Reinforcement ring, femur uncemented
Reinforcement ring, femur cemented
Reverse hybrid
Hybrid
All uncemented
All cemented2012 2013 2014 2015 20160
20
40
60
80
100
120
Reinforcement ring, femur uncemented
Reinforcement ring, femur cemented
Reverse hybrid
Hybrid
All uncemented
All cemented2012 2013 2014 2015 20160
20
40
60
80
100
120
Reinforcement ring, femur uncemented
Reinforcement ring, femur cemented
Reverse hybrid
Hybrid
All uncemented
All cemented2012 2013 2014 2015 2016
Primary total hip arthroplasty
SIRIS Report 2012–2016 Page 29
All uncemented fixation was used in 87% of cases
of primary osteoarthritis, 78% in secondary oste-
oarthritis and 48% in the fracture group (Tables 9
and 10). The acetabulum was mostly uncemented.
Across all diagnostic groups, 2’207 patients (3%)
received a cemented cup. 49% of the femur compo-
nents were cemented in the fracture group.
Surgical approach 2015 2016
N % N %
Anterior 7193 41.6 7965 43.7
Anterolateral 5759 33.3 5976 32.8
Lateral 1442 8.3 1403 7.7
Posterior 2665 15.4 2739 15.0
Other approach 215 1.2 149 0.8
Total 17274 100 18232 100
Table 11
Primary total hip arthroplasty: Surgical approach by yearApproach data only available from 2015 onwards
Fixation techniques for primary and secondary os-
teoarthritis remained stable over the observation
period (Figure 5). Most frequently, an uncemented
fixation for both components (48%) was used, follo-
wed by a hybrid fixation in 41% of the cases.
Primary total hip arthroplasty
Page 30 SIRIS Report 2012–2016
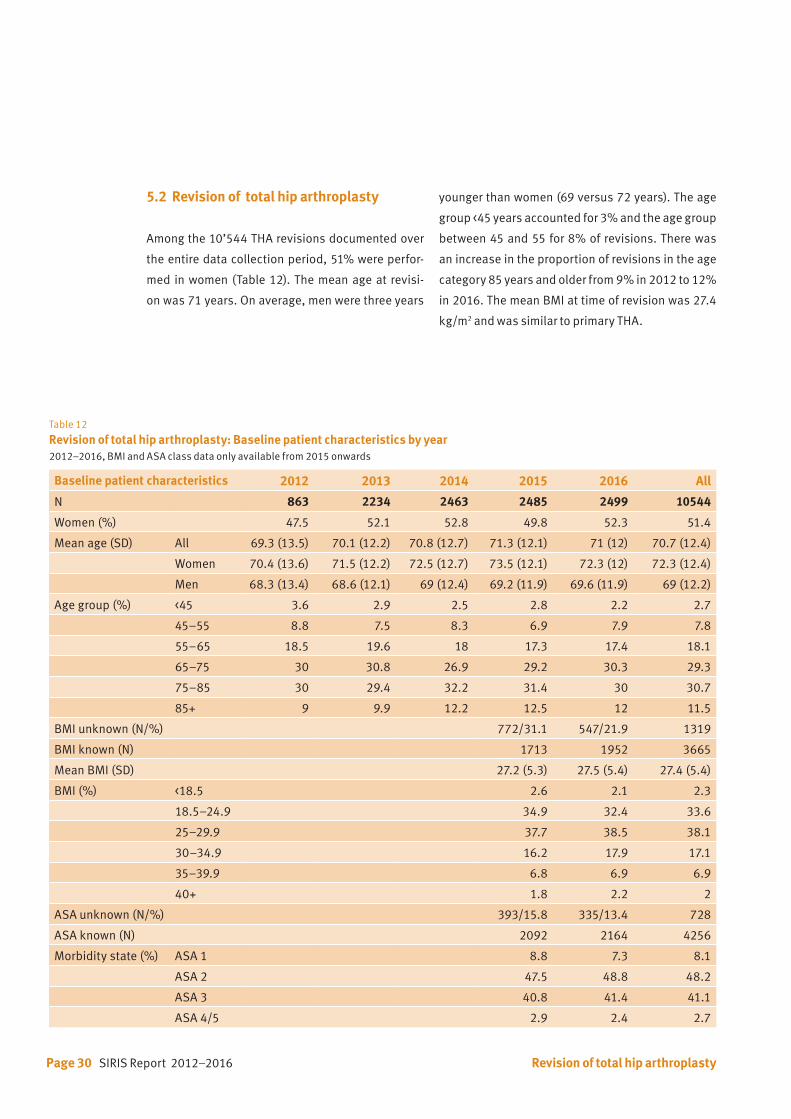
Table 12
Revision of total hip arthroplasty: Baseline patient characteristics by year2012–2016, BMI and ASA class data only available from 2015 onwards
Baseline patient characteristics 2012 2013 2014 2015 2016 All
N 863 2234 2463 2485 2499 10544
Women (%) 47.5 52.1 52.8 49.8 52.3 51.4
Mean age (SD) All 69.3 (13.5) 70.1 (12.2) 70.8 (12.7) 71.3 (12.1) 71 (12) 70.7 (12.4)
Women 70.4 (13.6) 71.5 (12.2) 72.5 (12.7) 73.5 (12.1) 72.3 (12) 72.3 (12.4)
Men 68.3 (13.4) 68.6 (12.1) 69 (12.4) 69.2 (11.9) 69.6 (11.9) 69 (12.2)
Age group (%) <45 3.6 2.9 2.5 2.8 2.2 2.7
45–55 8.8 7.5 8.3 6.9 7.9 7.8
55–65 18.5 19.6 18 17.3 17.4 18.1
65–75 30 30.8 26.9 29.2 30.3 29.3
75–85 30 29.4 32.2 31.4 30 30.7
85+ 9 9.9 12.2 12.5 12 11.5
BMI unknown (N/%) 772/31.1 547/21.9 1319
BMI known (N) 1713 1952 3665
Mean BMI (SD) 27.2 (5.3) 27.5 (5.4) 27.4 (5.4)
BMI (%) <18.5 2.6 2.1 2.3
18.5–24.9 34.9 32.4 33.6
25–29.9 37.7 38.5 38.1
30–34.9 16.2 17.9 17.1
35–39.9 6.8 6.9 6.9
40+ 1.8 2.2 2
ASA unknown (N/%) 393/15.8 335/13.4 728
ASA known (N) 2092 2164 4256
Morbidity state (%) ASA 1 8.8 7.3 8.1
ASA 2 47.5 48.8 48.2
ASA 3 40.8 41.4 41.1
ASA 4/5 2.9 2.4 2.7
5.2 Revision of total hip arthroplasty
Among the 10’544 THA revisions documented over
the entire data collection period, 51% were perfor-
med in women (Table 12). The mean age at revisi-
on was 71 years. On average, men were three years
younger than women (69 versus 72 years). The age
group <45 years accounted for 3% and the age group
between 45 and 55 for 8% of revisions. There was
an increase in the proportion of revisions in the age
category 85 years and older from 9% in 2012 to 12%
in 2016. The mean BMI at time of revision was 27.4
kg/m2 and was similar to primary THA.
Revision of total hip arthroplasty

SIRIS Report 2012–2016 Page 31
Table 13 Reason for revision of primary total hip arthroplasty Multiple reasons are possible per patient. The reasons for revisions categories as listed below are only available from 2015 onwards.
Reason for revision 2015–2016
N %
Loosening femoral 1067 21.6
Loosening acetabular 936 18.9
Infection 890 18.0
Periprosthetic fracture 734 14.9
Dislocation 576 11.7
Wear 288 5.8
Metallosis 244 4.9
Acetabular osteolysis 182 3.7
Femoral osteolysis 167 3.4
Position/Orientation of cup 159 3.2
Trochanter pathology 110 2.2
Status after spacer 103 2.1
Implant failure/breakage 100 2.0
Blood ion level 98 2.0
Position/Orientation of stem 90 1.8
Impingement 82 1.7
Acetabular protrusion 54 1.1
Squeaking 33 0.7
Other 1142 23.1
Total 2015–2016 7055 142.8
While data on the type of revision has been availa-
ble since the start of the registry in 2012, the current
listing of the reasons for revisions and the informa-
tion on approach have only been recorded since
2015. Aseptic loosening of the femoral component
was the most common reason for revision, followed
by aseptic loosening of the acetabular component,
infection, periprosthetic fracture, and dislocation
(Table 13).
Revision of total hip arthroplasty
Page 32 SIRIS Report 2012–2016
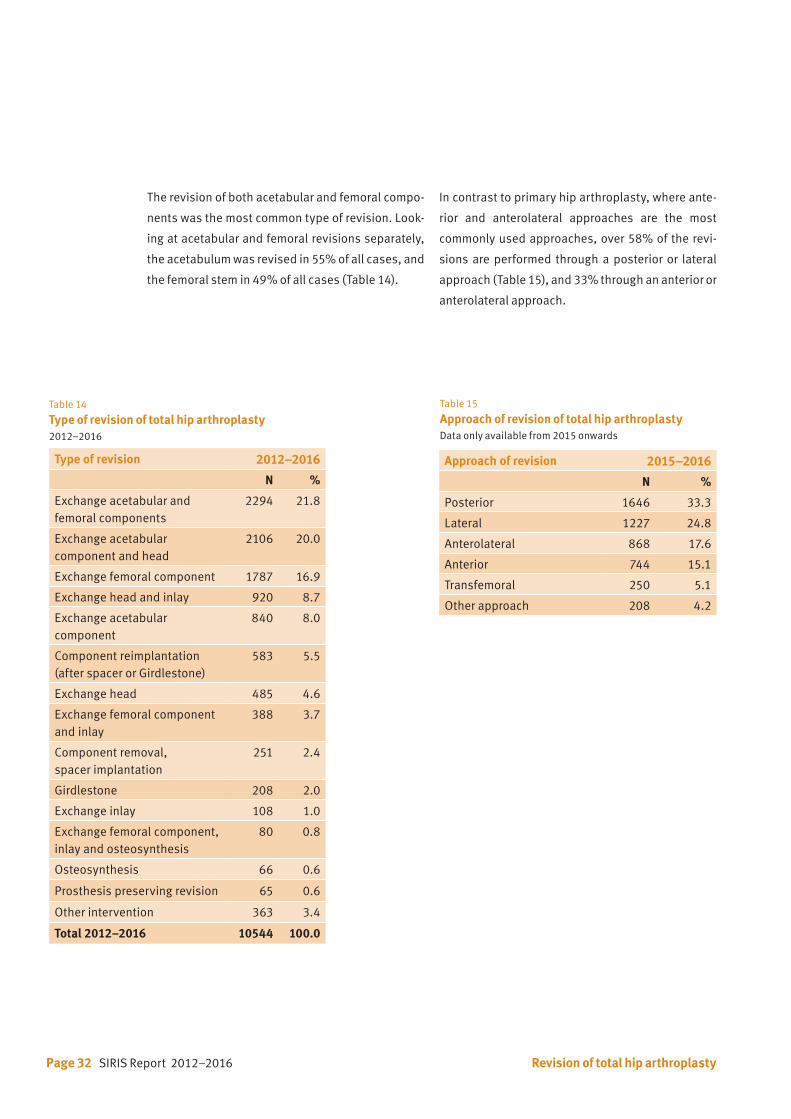
The revision of both acetabular and femoral compo-
nents was the most common type of revision. Look-
ing at acetabular and femoral revisions separately,
the acetabulum was revised in 55% of all cases, and
the femoral stem in 49% of all cases (Table 14).
In contrast to primary hip arthroplasty, where ante-
rior and anterolateral approaches are the most
commonly used approaches, over 58% of the revi-
sions are performed through a posterior or lateral
approach (Table 15), and 33% through an anterior or
anterolateral approach.
Table 15
Approach of revision of total hip arthroplastyData only available from 2015 onwards
Approach of revision 2015–2016
N %
Posterior 1646 33.3
Lateral 1227 24.8
Anterolateral 868 17.6
Anterior 744 15.1
Transfemoral 250 5.1
Other approach 208 4.2
Revision of total hip arthroplasty
Table 14 Type of revision of total hip arthroplasty2012–2016
Type of revision 2012–2016
N %
Exchange acetabular and femoral components
2294 21.8
Exchange acetabular component and head
2106 20.0
Exchange femoral component 1787 16.9
Exchange head and inlay 920 8.7
Exchange acetabular component
840 8.0
Component reimplantation (after spacer or Girdlestone)
583 5.5
Exchange head 485 4.6
Exchange femoral component and inlay
388 3.7
Component removal, spacer implantation
251 2.4
Girdlestone 208 2.0
Exchange inlay 108 1.0
Exchange femoral component, inlay and osteosynthesis
80 0.8
Osteosynthesis 66 0.6
Prosthesis preserving revision 65 0.6
Other intervention 363 3.4
Total 2012–2016 10544 100.0
SIRIS Report 2012–2016 Page 33
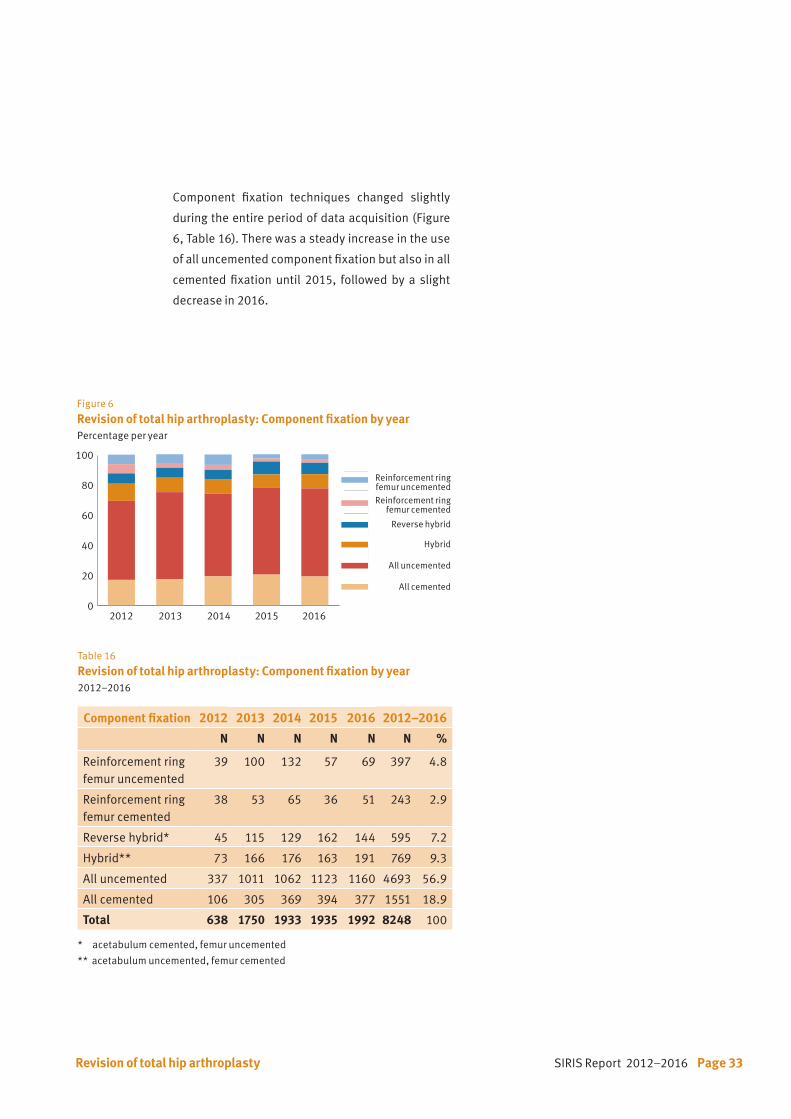
Table 16 Revision of total hip arthroplasty: Component fixation by year2012–2016
Component fixation 2012 2013 2014 2015 2016 2012–2016
N N N N N N %
Reinforcement ringfemur uncemented
39 100 132 57 69 397 4.8
Reinforcement ringfemur cemented
38 53 65 36 51 243 2.9
Reverse hybrid* 45 115 129 162 144 595 7.2
Hybrid** 73 166 176 163 191 769 9.3
All uncemented 337 1011 1062 1123 1160 4693 56.9
All cemented 106 305 369 394 377 1551 18.9
Total 638 1750 1933 1935 1992 8248 100
* acetabulum cemented, femur uncemented
** acetabulum uncemented, femur cemented
Figure 6
Revision of total hip arthroplasty: Component fixation by yearPercentage per year
0
20
40
60
80
100
120
Reinforcement ring, femur uncemented
Reinforcement ring, femur cemented
Reverse hybrid
Hybrid
All uncemented
All cemented2012 2013 2014 2015 2016
Reinforcement ringfemur uncemented
Reinforcement ringfemur cemented
Reverse hybrid
Hybrid
All uncemented
All cemented0
20
40
60
80
100
120
Reinforcement ring, femur uncemented
Reinforcement ring, femur cemented
Reverse hybrid
Hybrid
All uncemented
All cemented2012 2013 2014 2015 20160
20
40
60
80
100
120
Reinforcement ring, femur uncemented
Reinforcement ring, femur cemented
Reverse hybrid
Hybrid
All uncemented
All cemented2012 2013 2014 2015 20160
20
40
60
80
100
120
Reinforcement ring, femur uncemented
Reinforcement ring, femur cemented
Reverse hybrid
Hybrid
All uncemented
All cemented2012 2013 2014 2015 2016
Revision of total hip arthroplasty
Component fixation techniques changed slightly
during the entire period of data acquisition (Figure
6, Table 16). There was a steady increase in the use
of all uncemented component fixation but also in all
cemented fixation until 2015, followed by a slight
decrease in 2016.
Page 34 SIRIS Report 2012–2016
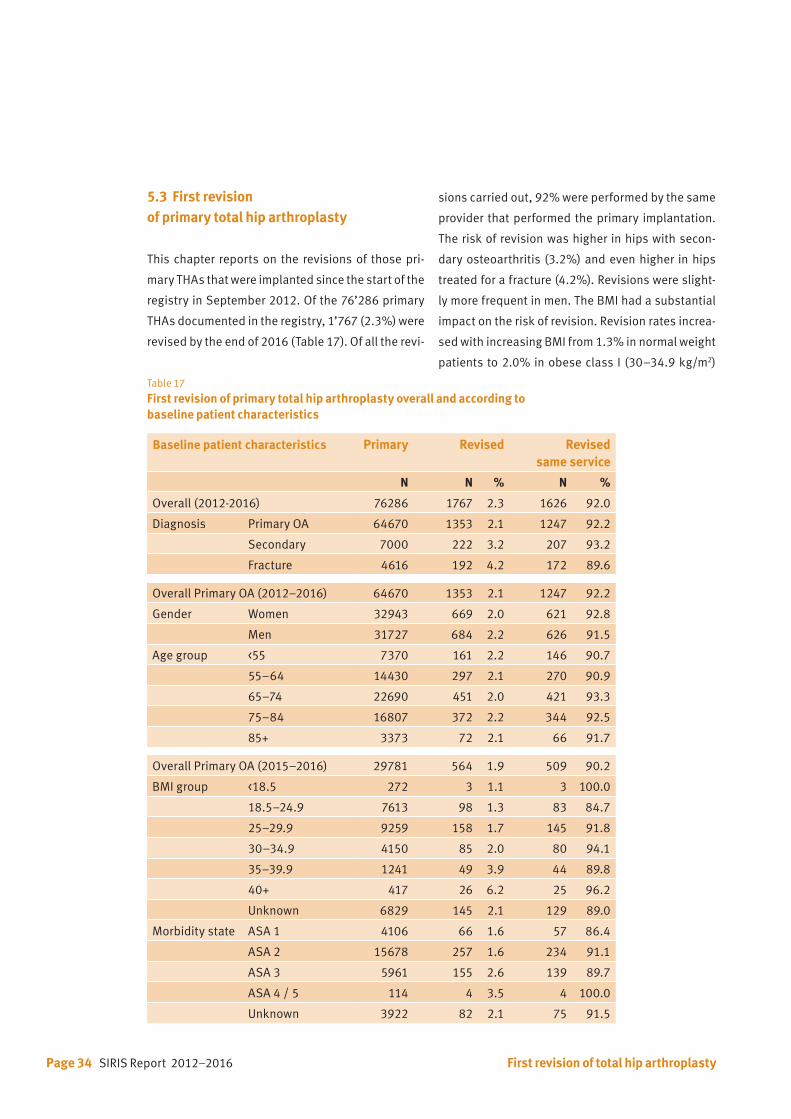
Table 17 First revision of primary total hip arthroplasty overall and according to baseline patient characteristics
Baseline patient characteristics Primary Revised Revised same service
N N % N %
Overall (2012-2016) 76286 1767 2.3 1626 92.0
Diagnosis Primary OA 64670 1353 2.1 1247 92.2
Secondary 7000 222 3.2 207 93.2
Fracture 4616 192 4.2 172 89.6
Overall Primary OA (2012–2016) 64670 1353 2.1 1247 92.2
Gender Women 32943 669 2.0 621 92.8
Men 31727 684 2.2 626 91.5
Age group <55 7370 161 2.2 146 90.7
55–64 14430 297 2.1 270 90.9
65–74 22690 451 2.0 421 93.3
75–84 16807 372 2.2 344 92.5
85+ 3373 72 2.1 66 91.7
Overall Primary OA (2015–2016) 29781 564 1.9 509 90.2
BMI group <18.5 272 3 1.1 3 100.0
18.5–24.9 7613 98 1.3 83 84.7
25–29.9 9259 158 1.7 145 91.8
30–34.9 4150 85 2.0 80 94.1
35–39.9 1241 49 3.9 44 89.8
40+ 417 26 6.2 25 96.2
Unknown 6829 145 2.1 129 89.0
Morbidity state ASA 1 4106 66 1.6 57 86.4
ASA 2 15678 257 1.6 234 91.1
ASA 3 5961 155 2.6 139 89.7
ASA 4 / 5 114 4 3.5 4 100.0
Unknown 3922 82 2.1 75 91.5
5.3 First revision of primary total hip arthroplasty
This chapter reports on the revisions of those pri-
mary THAs that were implanted since the start of the
registry in September 2012. Of the 76’286 primary
THAs documented in the registry, 1’767 (2.3%) were
revised by the end of 2016 (Table 17). Of all the revi-
sions carried out, 92% were performed by the same
provider that performed the primary implantation.
The risk of revision was higher in hips with secon-
dary osteoarthritis (3.2%) and even higher in hips
treated for a fracture (4.2%). Revisions were slight-
ly more frequent in men. The BMI had a substantial
impact on the risk of revision. Revision rates increa-
sed with increasing BMI from 1.3% in normal weight
patients to 2.0% in obese class I (30–34.9 kg/m2)
First revision of total hip arthroplasty
SIRIS Report 2012–2016 Page 35
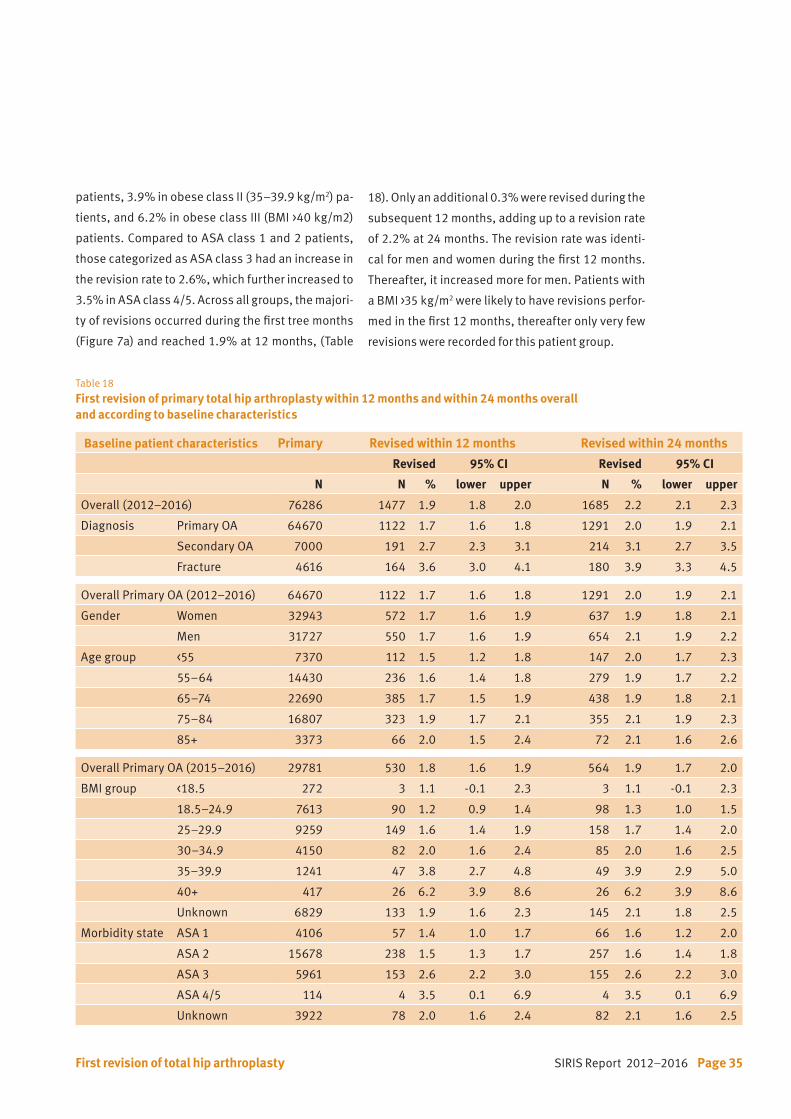
Table 18 First revision of primary total hip arthroplasty within 12 months and within 24 months overall and according to baseline characteristics
Baseline patient characteristics Primary Revised within 12 months Revised within 24 months
Revised 95% CI Revised 95% CI
N N % lower upper N % lower upper
Overall (2012–2016) 76286 1477 1.9 1.8 2.0 1685 2.2 2.1 2.3
Diagnosis Primary OA 64670 1122 1.7 1.6 1.8 1291 2.0 1.9 2.1
Secondary OA 7000 191 2.7 2.3 3.1 214 3.1 2.7 3.5
Fracture 4616 164 3.6 3.0 4.1 180 3.9 3.3 4.5
Overall Primary OA (2012–2016) 64670 1122 1.7 1.6 1.8 1291 2.0 1.9 2.1
Gender Women 32943 572 1.7 1.6 1.9 637 1.9 1.8 2.1
Men 31727 550 1.7 1.6 1.9 654 2.1 1.9 2.2
Age group <55 7370 112 1.5 1.2 1.8 147 2.0 1.7 2.3
55–64 14430 236 1.6 1.4 1.8 279 1.9 1.7 2.2
65–74 22690 385 1.7 1.5 1.9 438 1.9 1.8 2.1
75–84 16807 323 1.9 1.7 2.1 355 2.1 1.9 2.3
85+ 3373 66 2.0 1.5 2.4 72 2.1 1.6 2.6
Overall Primary OA (2015–2016) 29781 530 1.8 1.6 1.9 564 1.9 1.7 2.0
BMI group <18.5 272 3 1.1 -0.1 2.3 3 1.1 -0.1 2.3
18.5–24.9 7613 90 1.2 0.9 1.4 98 1.3 1.0 1.5
25–29.9 9259 149 1.6 1.4 1.9 158 1.7 1.4 2.0
30–34.9 4150 82 2.0 1.6 2.4 85 2.0 1.6 2.5
35–39.9 1241 47 3.8 2.7 4.8 49 3.9 2.9 5.0
40+ 417 26 6.2 3.9 8.6 26 6.2 3.9 8.6
Unknown 6829 133 1.9 1.6 2.3 145 2.1 1.8 2.5
Morbidity state ASA 1 4106 57 1.4 1.0 1.7 66 1.6 1.2 2.0
ASA 2 15678 238 1.5 1.3 1.7 257 1.6 1.4 1.8
ASA 3 5961 153 2.6 2.2 3.0 155 2.6 2.2 3.0
ASA 4/5 114 4 3.5 0.1 6.9 4 3.5 0.1 6.9
Unknown 3922 78 2.0 1.6 2.4 82 2.1 1.6 2.5
patients, 3.9% in obese class II (35–39.9 kg/m2) pa-
tients, and 6.2% in obese class III (BMI >40 kg/m2)
patients. Compared to ASA class 1 and 2 patients,
those categorized as ASA class 3 had an increase in
the revision rate to 2.6%, which further increased to
3.5% in ASA class 4/5. Across all groups, the majori-
ty of revisions occurred during the first tree months
(Figure 7a) and reached 1.9% at 12 months, (Table
18). Only an additional 0.3% were revised during the
subsequent 12 months, adding up to a revision rate
of 2.2% at 24 months. The revision rate was identi-
cal for men and women during the first 12 months.
Thereafter, it increased more for men. Patients with
a BMI >35 kg/m2 were likely to have revisions perfor-
med in the first 12 months, thereafter only very few
revisions were recorded for this patient group.
First revision of total hip arthroplasty
Page 36 SIRIS Report 2012–2016
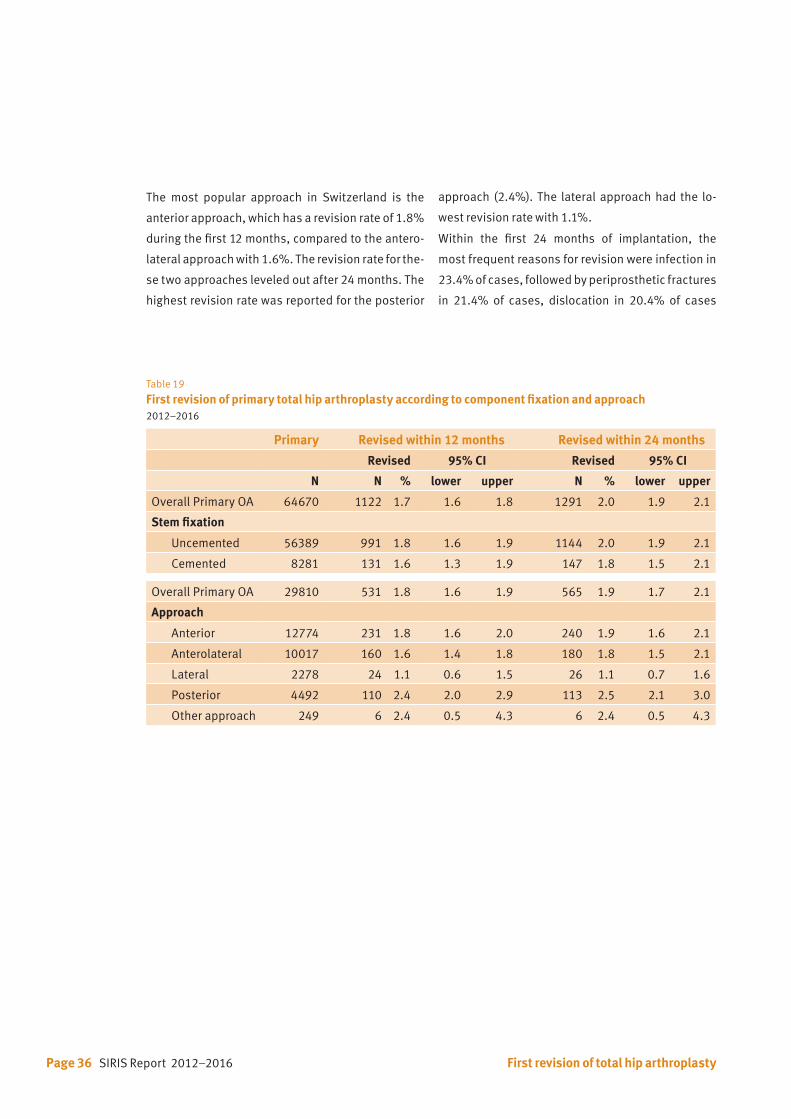
The most popular approach in Switzerland is the
anterior approach, which has a revision rate of 1.8%
during the first 12 months, compared to the antero-
lateral approach with 1.6%. The revision rate for the-
se two approaches leveled out after 24 months. The
highest revision rate was reported for the posterior
approach (2.4%). The lateral approach had the lo-
west revision rate with 1.1%.
Within the first 24 months of implantation, the
most frequent reasons for revision were infection in
23.4% of cases, followed by periprosthetic fractures
in 21.4% of cases, dislocation in 20.4% of cases
Table 19 First revision of primary total hip arthroplasty according to component fixation and approach2012–2016
Primary Revised within 12 months Revised within 24 months
Revised 95% CI Revised 95% CI
N N % lower upper N % lower upper
Overall Primary OA 64670 1122 1.7 1.6 1.8 1291 2.0 1.9 2.1
Stem fixation
Uncemented 56389 991 1.8 1.6 1.9 1144 2.0 1.9 2.1
Cemented 8281 131 1.6 1.3 1.9 147 1.8 1.5 2.1
Overall Primary OA 29810 531 1.8 1.6 1.9 565 1.9 1.7 2.1
Approach
Anterior 12774 231 1.8 1.6 2.0 240 1.9 1.6 2.1
Anterolateral 10017 160 1.6 1.4 1.8 180 1.8 1.5 2.1
Lateral 2278 24 1.1 0.6 1.5 26 1.1 0.7 1.6
Posterior 4492 110 2.4 2.0 2.9 113 2.5 2.1 3.0
Other approach 249 6 2.4 0.5 4.3 6 2.4 0.5 4.3
First revision of total hip arthroplasty
SIRIS Report 2012–2016 Page 37
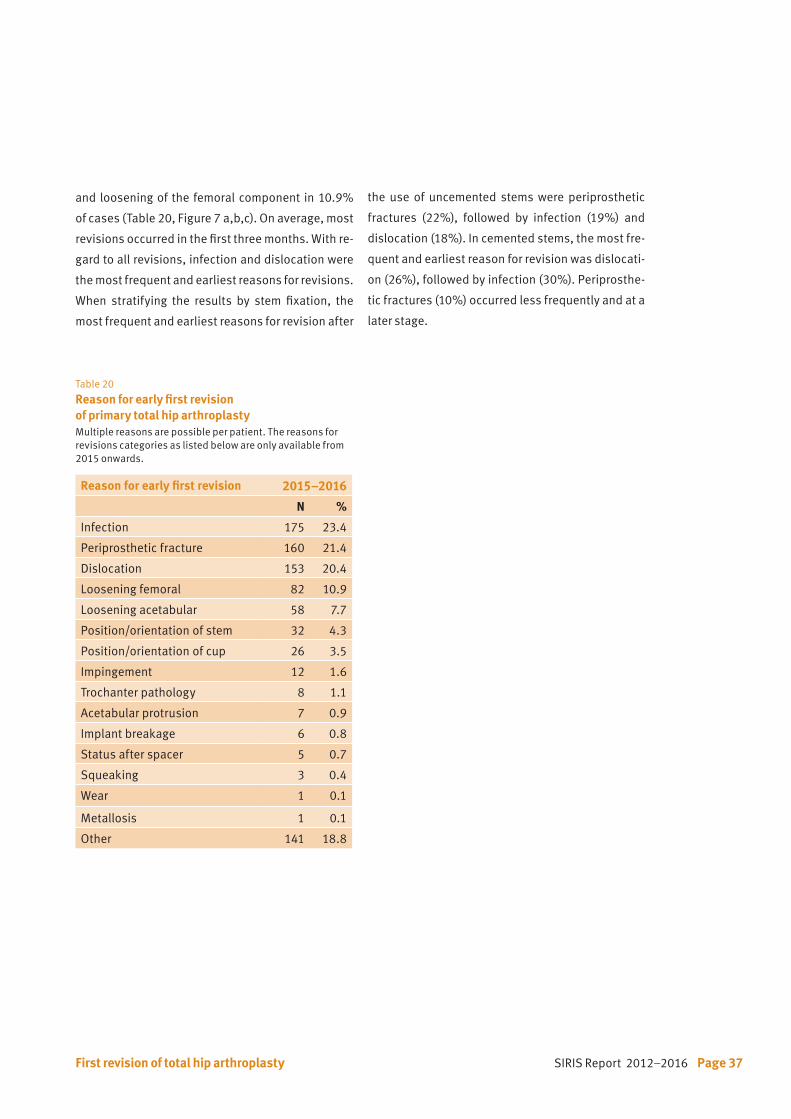
and loosening of the femoral component in 10.9%
of cases (Table 20, Figure 7 a,b,c). On average, most
revisions occurred in the first three months. With re-
gard to all revisions, infection and dislocation were
the most frequent and earliest reasons for revisions.
When stratifying the results by stem fixation, the
most frequent and earliest reasons for revision after
the use of uncemented stems were periprosthetic
fractures (22%), followed by infection (19%) and
dislocation (18%). In cemented stems, the most fre-
quent and earliest reason for revision was dislocati-
on (26%), followed by infection (30%). Periprosthe-
tic fractures (10%) occurred less frequently and at a
later stage.
Table 20 Reason for early first revision of primary total hip arthroplasty Multiple reasons are possible per patient. The reasons for revisions categories as listed below are only available from 2015 onwards.
Reason for early first revision 2015–2016
N %
Infection 175 23.4
Periprosthetic fracture 160 21.4
Dislocation 153 20.4
Loosening femoral 82 10.9
Loosening acetabular 58 7.7
Position/orientation of stem 32 4.3
Position/orientation of cup 26 3.5
Impingement 12 1.6
Trochanter pathology 8 1.1
Acetabular protrusion 7 0.9
Implant breakage 6 0.8
Status after spacer 5 0.7
Squeaking 3 0.4
Wear 1 0.1
Metallosis 1 0.1
Other 141 18.8
First revision of total hip arthroplasty

Page 38 SIRIS Report 2012–2016
0.1
0.2
0.3
0.4
0.5
0.6
Den
sity
Time to revision in months0 3 6 9 12 15 18 21 24 27 30 33 36 39 42 45 48
0.1
0.2
0.3
0.4
0.5
0.6
Den
sity
Time to revision in months0 3 6 9 12 15 18 21 24 27 30 33 36 39 42 45 48
Figure 7 a, b and c
Reason for early first revision by time interval since primary total hip arthroplasty
Figure a
All revisions
(N= 1767)
Figure b
Revisionsfemur cemented only
(N= 310)
Figure c
Revisionsfemur uncemented only
(N= 1457)
N Median (IQR)
Dislocation 352 1.1 (0.4; 3.0)
Periprosthetic fracture 376 1.4 (0.7; 4.2)
Infection 365 0.7 (0.3; 1.6)
Aseptic loosening 167 5.1 (0.9; 14)
Other 446 3.5 (0.5; 10)
N Median (IQR)
Dislocation 83 1.1 (0.5; 2.0)
Periprosthetic fracture 33 2.0 (1.1; 3.4)
Infection 92 1.2 (0.6; 4.3)
Aseptic loosening 32 2.4 (0.7; 15)
Other 77 0.6 (0.4; 4.0)
0.1
0.2
0.3
0.4
0.5
0.6
Den
sity
Time to revision in months0 3 6 9 12 15 18 21 24 27 30 33 36 39 42 45 48
N Median (IQR)
Dislocation 269 1.2 (0.4; 3.3)
Periprosthetic fracture 332 0.6 (0.3; 1.4)
Infection 284 1.4 (0.7; 4.2)
Aseptic loosening 135 5.3 (1.1; 13)
Other 369 4.0 (0.8; 12)
First revision of total hip arthroplasty
SIRIS Report 2012–2016 Page 39
6. Hemiarthroplasty of the hip
6.1 Primary hemiarthroplasty of the hip
Patients with a femoral neck fracture that is treated
with a hemiarthroplasty are a special group of pa-
tients, with much lower functional needs and ex-
pected life span than patients undergoing THA. For
this reason the data of this cohort of patients is re-
corded and analyzed in this separate chapter of the
SIRIS report.
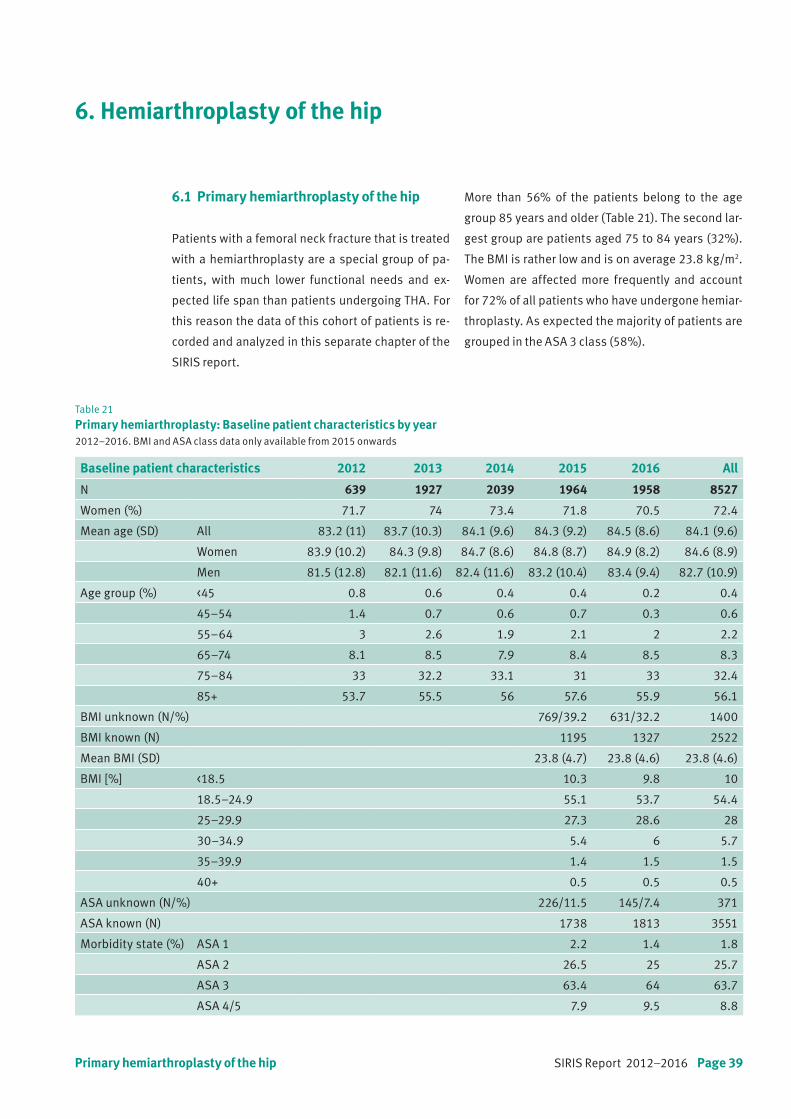
Table 21 Primary hemiarthroplasty: Baseline patient characteristics by year2012–2016. BMI and ASA class data only available from 2015 onwards
Baseline patient characteristics 2012 2013 2014 2015 2016 All
N 639 1927 2039 1964 1958 8527
Women (%) 71.7 74 73.4 71.8 70.5 72.4
Mean age (SD) All 83.2 (11) 83.7 (10.3) 84.1 (9.6) 84.3 (9.2) 84.5 (8.6) 84.1 (9.6)
Women 83.9 (10.2) 84.3 (9.8) 84.7 (8.6) 84.8 (8.7) 84.9 (8.2) 84.6 (8.9)
Men 81.5 (12.8) 82.1 (11.6) 82.4 (11.6) 83.2 (10.4) 83.4 (9.4) 82.7 (10.9)
Age group (%) <45 0.8 0.6 0.4 0.4 0.2 0.4
45–54 1.4 0.7 0.6 0.7 0.3 0.6
55–64 3 2.6 1.9 2.1 2 2.2
65–74 8.1 8.5 7.9 8.4 8.5 8.3
75–84 33 32.2 33.1 31 33 32.4
85+ 53.7 55.5 56 57.6 55.9 56.1
BMI unknown (N/%) 769/39.2 631/32.2 1400
BMI known (N) 1195 1327 2522
Mean BMI (SD) 23.8 (4.7) 23.8 (4.6) 23.8 (4.6)
BMI [%] <18.5 10.3 9.8 10
18.5–24.9 55.1 53.7 54.4
25–29.9 27.3 28.6 28
30–34.9 5.4 6 5.7
35–39.9 1.4 1.5 1.5
40+ 0.5 0.5 0.5
ASA unknown (N/%) 226/11.5 145/7.4 371
ASA known (N) 1738 1813 3551
Morbidity state (%) ASA 1 2.2 1.4 1.8
ASA 2 26.5 25 25.7
ASA 3 63.4 64 63.7
ASA 4/5 7.9 9.5 8.8
More than 56% of the patients belong to the age
group 85 years and older (Table 21). The second lar-
gest group are patients aged 75 to 84 years (32%).
The BMI is rather low and is on average 23.8 kg/m2.
Women are affected more frequently and account
for 72% of all patients who have undergone hemiar-
throplasty. As expected the majority of patients are
grouped in the ASA 3 class (58%).
Primary hemiarthroplasty of the hip

Page 40 SIRIS Report 2012–2016
Table 22 Baseline patient characteristics of primary hemiarthroplasty patientsCalculation of hospital services were based on all THA and hemiarthroplasty primary and revision hip surgeries in 2016. BMI data are only available from 2015 onwards
Hospital service volume <100 100–199 200–299 300+
N (2012–2016) 3497 2824 794 1412
Women (%) 73.4 72.2 71.4 70.5
Mean age (SD) All 83.8 (9.7) 83.7 (9.7) 83.6 (10.5) 85.6 (8.3)
Women 84.3 (9.2) 84.3 (8.9) 84.4 (9.7) 86.1 (7.7)
Men 82.4 (10.9) 82.4 (11.3) 81.7 (12.1) 84.4 (9.4)
Age group (%) <45 0.5 0.4 0.6 0.2
45–54 0.4 0.9 0.8 0.6
55–64 2.2 2.3 3.1 1.4
65–74 9.2 8.7 8.4 5.3
75–84 33.6 33.5 31 28
85+ 54.2 54.2 56 64.4
N (2015-2016) 1610 1331 312 645
Unknown BMI (N/%) 640/39.8 475/35.7 149/47.8 112/17.4
Known BMI (N) 970 856 163 533
Mean BMI (SD) 24 (4.9) 23.8 (4.6) 23.6 (3.9) 23.4 (4.4)
BMI [%] <18.5 9.2 10 10.4 11.4
18.5–24.9 53.9 53.4 49.1 58.3
25–29.9 28.7 28.6 35 23.6
30–34.9 5.8 6 4.9 5.3
35–39.9 1.8 1.6 0.6 0.9
40+ 0.7 0.4 0.4
Unknown ASA (N/%) 98/6.1 168/12.6 33/10.6 48/7.4
Known ASA (N) 1512 1163 279 597
Morbidity state (%) ASA 1 2.2 1.5 1.4 1.5
ASA 2 26.9 27.3 23.7 20.9
ASA 3 63.4 61.7 64.2 68.3
ASA 4/5 7.6 9.5 10.8 9.2
Primary hemiarthroplasty of the hip

SIRIS Report 2012–2016 Page 41
Table 23
Surgery characteristics of primary hemiarthroplastyApproach data are only available from 2015 onwards
Surgery characteristics N %
Previous surgery None 8209 96.3
Internal fixation femur 141 1.7
Osteotomy femur 18 0.2
Osteotomy pelvis 3 0.0
Arthrodesis 3 0.0
Internal fixation acetabulum 1 0.0
Other previous surgery 155 1.8
Intervention Femoral head prosthesis 6253 73.3
Bipolar prosthesis 2254 26.4
Hemi-surface replacement 20 0.2
Approach Anterior 1186 30.4
Anterolateral 1145 29.4
Lateral 796 20.4
Posterior 698 17.9
Other approach 75 1.9
Stem fixation Cemented 7090 83.2
Uncemented 1437 16.9
More than one third of patients (37%) are treated
in hospitals performing fewer than 100 hip repla-
cement surgeries per year and one fourth (27%) in
hospitals treating between 100 and 199 patients per
year (Table 22). High-volume hospitals each provide
treatment for 18% of the cases.
Primary hemiarthroplasty of the hip

Page 42 SIRIS Report 2012–2016
Table24
Conversion of hemiarthroplasty: Baseline patient characteristics by year2012–2016. BMI and ASA class data are only available from 2015 onwards
Baseline patient characteristics 2012 2013 2014 2015 2016 All
N 37 54 54 60 44 249
Women (%) 78.4 70.4 74.1 75 70.5 73.5
Mean age (SD) All 79.9 (7.1) 78.4 (11.5) 75.6 (12.2) 74.6 (10.9) 75.3 (11.3) 76.6 (11)
Women 79.2 (7.7) 80.2 (10.9) 78.5 (7.9) 75.5 (10.5) 76.3 (11) 77.9 (9.8)
Men 82.5 (3.1) 74.1 (12.1) 67.2 (17.7) 71.7 (11.9) 72.9 (12.3) 72.9 (13.2)
Age group (%) <45 1.9 3.7 2.3 1.6
45–55 3.7 1.9 6.7 2.3 3.2
55–65 5.4 5.6 7.4 10 9.1 7.6
65–75 18.9 16.7 24.1 21.7 27.3 21.7
75–85 51.4 38.9 42.6 40 43.2 42.6
85+ 24.3 33.3 20.4 21.7 15.9 23.3
BMI unknown (N/%) 10/16.7 3/6.8 13
BMI known (N) 50 41 91
Mean BMI (SD) 24.2 (3.9) 25.1 (4.7) 24.6 (4.3)
BMI (%) <18.5 4 4.9 4.4
18.5–24.9 56 48.8 52.7
25–29.9 32 31.7 31.9
30–34.9 8 9.8 8.8
35–39.9 4.9 0 2.2
ASA unknown (N/%) 3/5.0 5/11.4 8
ASA known (N) 57 39 96
Morbidity state (%) ASA 1 3.5 5.1 4.2
ASA 2 54.4 48.7 52.1
ASA 3 42.1 43.6 42.7
ASA 4/5 2.6 0 1
Conversion of hemiarthroplasty to total hip arthroplasty
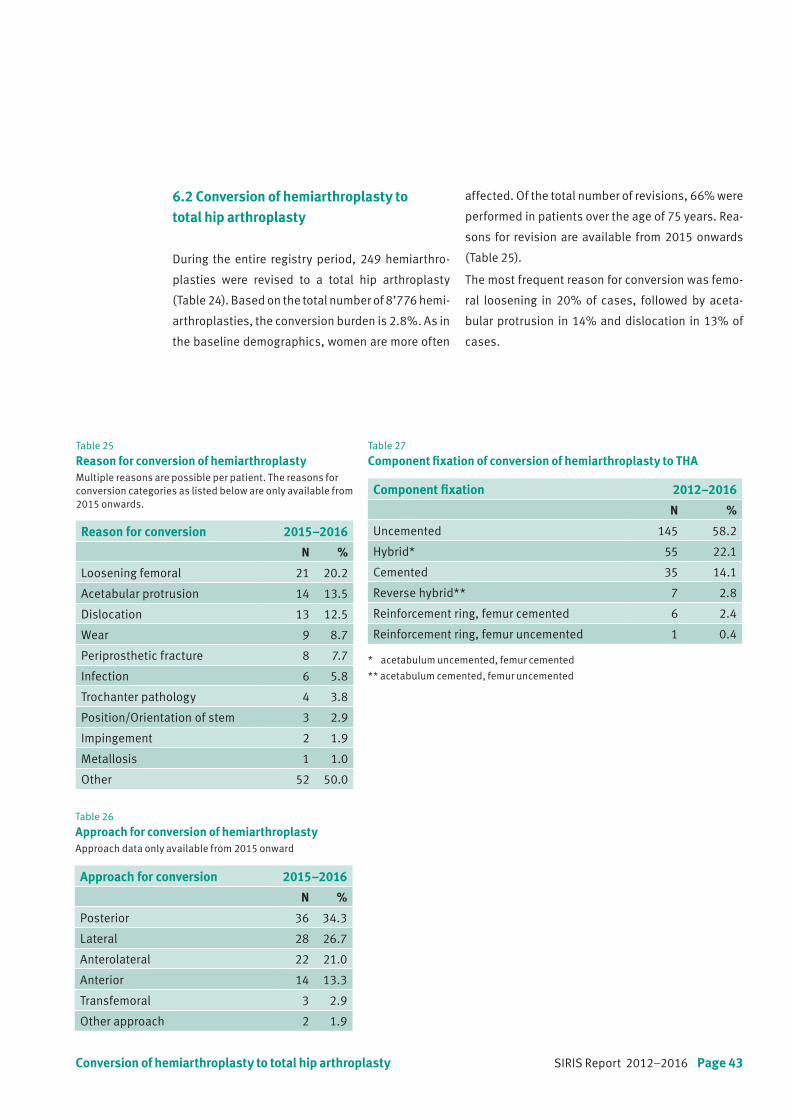
SIRIS Report 2012–2016 Page 43
6.2 Conversion of hemiarthroplasty to total hip arthroplasty
During the entire registry period, 249 hemiarthro-
plasties were revised to a total hip arthroplasty
(Table 24). Based on the total number of 8’776 hemi-
arthroplasties, the conversion burden is 2.8%. As in
the baseline demographics, women are more often
Table 26
Approach for conversion of hemiarthroplastyApproach data only available from 2015 onward
Table 27 Component fixation of conversion of hemiarthroplasty to THA
Table 25 Reason for conversion of hemiarthroplastyMultiple reasons are possible per patient. The reasons for conversion categories as listed below are only available from 2015 onwards.
Reason for conversion 2015–2016
N %
Loosening femoral 21 20.2
Acetabular protrusion 14 13.5
Dislocation 13 12.5
Wear 9 8.7
Periprosthetic fracture 8 7.7
Infection 6 5.8
Trochanter pathology 4 3.8
Position/Orientation of stem 3 2.9
Impingement 2 1.9
Metallosis 1 1.0
Other 52 50.0
Approach for conversion 2015–2016
N %
Posterior 36 34.3
Lateral 28 26.7
Anterolateral 22 21.0
Anterior 14 13.3
Transfemoral 3 2.9
Other approach 2 1.9
Component fixation 2012–2016
N %
Uncemented 145 58.2
Hybrid* 55 22.1
Cemented 35 14.1
Reverse hybrid** 7 2.8
Reinforcement ring, femur cemented 6 2.4
Reinforcement ring, femur uncemented 1 0.4
* acetabulum uncemented, femur cemented
** acetabulum cemented, femur uncemented
affected. Of the total number of revisions, 66% were
performed in patients over the age of 75 years. Rea-
sons for revision are available from 2015 onwards
(Table 25).
The most frequent reason for conversion was femo-
ral loosening in 20% of cases, followed by aceta-
bular protrusion in 14% and dislocation in 13% of
cases.
Conversion of hemiarthroplasty to total hip arthroplasty

SIRIS Report 2012–2016 Page 45
7. Knee arthroplasty
7.1 Primary total knee arthroplasty
Among the 58’339 primary TKAs documented over
the past five years, 61% were performed in women
(Table 28, see next page). The mean age of 69 years
at surgery was constant during the documented pe-
riod. In the age group 55–64 years, 23.3% of TKAs
were performed and 36.9% in patients aged bet-
ween 65 and 74 years.
The number of TKAs in younger patients (younger
than 45 and in the age group 45–54 years old) and
patients older than 85 years has remained consi-
stently low over the past 5 years.
Age at surgery 20 30 40 50 60 70 80 90 100 110
0.01
0.02
0.03
0.04
Den
sity
BMI
<18.5
18.5–24.9
25–29.9
30–34.9
35–39.9
40+
Figure 8 Primary total knee arthroplasty: BMI according to age
Morbidity state (ASA classification) and body mass
index (BMI) were only recorded from 2015. The pro-
portion of missing BMIs decreased from 24.8% in
2015 to 20.5% in 2016 and needs to be further im-
proved. Among those with a known value, the mean
BMI was 29.4 kg/m2. Obese patients (BMI ≥ 30 kg/
m2) constituted 39.2% of the total knee arthroplasty
patients in Switzerland. The age, at which total knee
arthroplasty was undertaken, decreased with in-
creasing BMI category (Figure 8).
Patients receiving a TKA had an ASA classification 1
or 2 in 72.7% of the cases. In 10.7%, the morbidity
state was not specified. This proportion was some-
what lower than in 2015 and further reductions
needs to be achieved.
Primary total knee arthroplasty

Page 46 SIRIS Report 2012–2016
Table 28
Primary total knee arthroplasty: Baseline patient characteristics by yearBMI and ASA class data areonly available from 2015 onwards
Baseline patient characteristics 2012 2013 2014 2015 2016 All
N 4731 12927 13263 13153 14265 58339
Diagnosis (%) Primary OA 95.9 96.4 96.7 88 88.3 92.5
Secondary OA 4.1 3.6 3.3 12 11.7 7.5
Inflammatory origin 1.1 0.9 0.9 1.2 1.1 1
Fracture 0.6 0.4 0.5 2.3 2 1.3
Lesion of ligament 4.7 5.1 2.3
Infection 0.2 0.2 0.1
Osteonecrosis 1.8 1.7 1.4 2.2 1.8 1.8
Other 0.6 0.6 0.5 1.4 1.4 1
Women (%) 59.4 61.1 60.7 61.3 61.2 60.9
Mean age (SD) All 68.8 (10.4) 69.2 (10.7) 69.2 (10.4) 69.4 (10) 69.3 (9.7) 69.2 (10.2)
Women 69.5 (10.4) 70 (10.6) 69.8 (10.7) 70.1 (10) 70 (9.7) 69.9 (10.2)
Men 67.7 (10.3) 67.9 (10.6) 68.2 (10) 68.3 (9.8) 68.3 (9.6) 68.2 (10)
Age group (%) <45 1.1 1.2 0.9 0.7 0.6 0.9
45–54 7 6.4 6.5 6.6 6.6 6.6
55–64 24 23 23.2 23.4 23.5 23.3
65–74 36.5 36.3 37 36.7 37.4 36.9
75–84 27.3 28.4 28 28 27.7 27.9
85+ 4.1 4.7 4.4 4.6 4.2 4.4
BMI unknown (N/%) 3258/24.8 2886/20.2 6144
BMI known (N) 9895 11379 21274
Mean BMI (SD) 29.4 (6.1) 29.5 (5.6) 29.4 (5.9)
BMI (%) <18.5 0.5 0.4 0.4
18.5–24.9 21.1 21.1 21.1
25–29.9 39.6 38.9 39.2
30–34.9 24.2 24.5 24.4
35–39.9 10.1 10.5 10.3
40+ 4.5 4.6 4.5
ASA unknown (N/%) 1701/12.9 1541/10.8 3242
ASA known (N) 11452 12724 24176
Morbidity state (%) ASA 1 11.8 9.7 10.7
ASA 2 61.5 62.5 62
ASA 3 26.4 27.4 26.9
ASA 4/5 0.3 0.3 0.3
Primary total knee arthroplasty
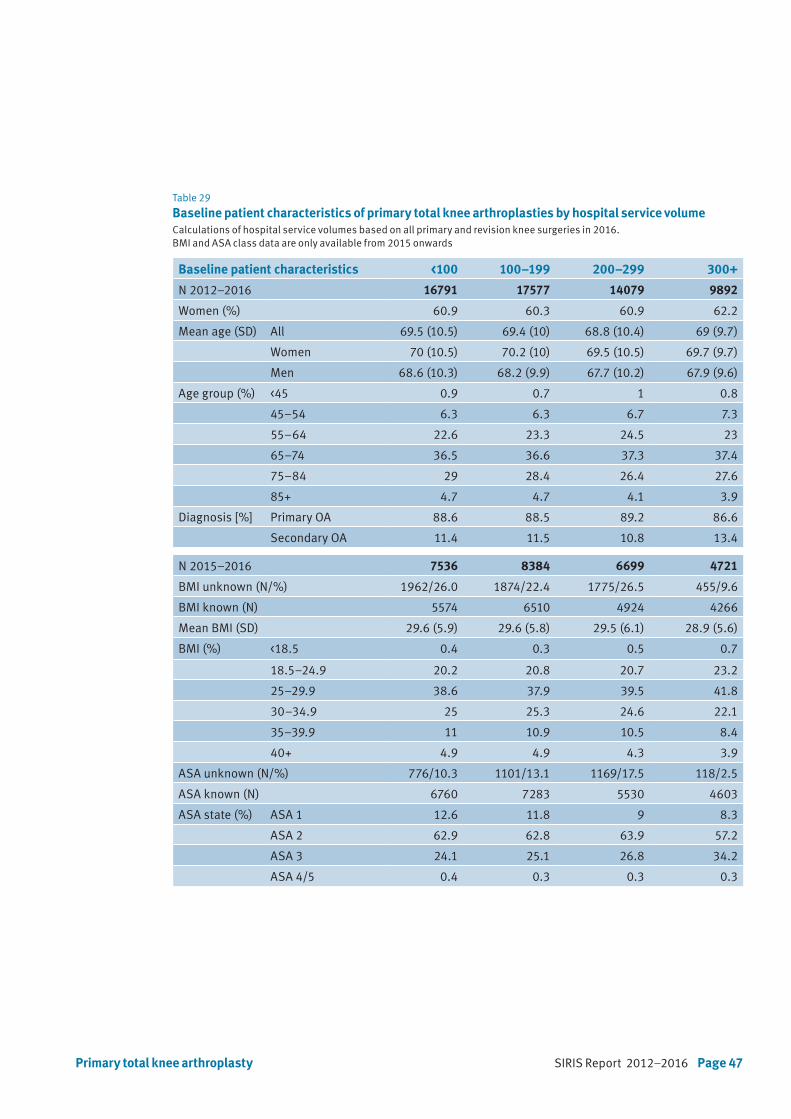
SIRIS Report 2012–2016 Page 47
Table 29 Baseline patient characteristics of primary total knee arthroplasties by hospital service volume Calculations of hospital service volumes based on all primary and revision knee surgeries in 2016. BMI and ASA class data are only available from 2015 onwards
Baseline patient characteristics <100 100–199 200–299 300+
N 2012–2016 16791 17577 14079 9892
Women (%) 60.9 60.3 60.9 62.2
Mean age (SD) All 69.5 (10.5) 69.4 (10) 68.8 (10.4) 69 (9.7)
Women 70 (10.5) 70.2 (10) 69.5 (10.5) 69.7 (9.7)
Men 68.6 (10.3) 68.2 (9.9) 67.7 (10.2) 67.9 (9.6)
Age group (%) <45 0.9 0.7 1 0.8
45–54 6.3 6.3 6.7 7.3
55–64 22.6 23.3 24.5 23
65–74 36.5 36.6 37.3 37.4
75–84 29 28.4 26.4 27.6
85+ 4.7 4.7 4.1 3.9
Diagnosis [%] Primary OA 88.6 88.5 89.2 86.6
Secondary OA 11.4 11.5 10.8 13.4
N 2015–2016 7536 8384 6699 4721
BMI unknown (N/%) 1962/26.0 1874/22.4 1775/26.5 455/9.6
BMI known (N) 5574 6510 4924 4266
Mean BMI (SD) 29.6 (5.9) 29.6 (5.8) 29.5 (6.1) 28.9 (5.6)
BMI (%) <18.5 0.4 0.3 0.5 0.7
18.5–24.9 20.2 20.8 20.7 23.2
25–29.9 38.6 37.9 39.5 41.8
30–34.9 25 25.3 24.6 22.1
35–39.9 11 10.9 10.5 8.4
40+ 4.9 4.9 4.3 3.9
ASA unknown (N/%) 776/10.3 1101/13.1 1169/17.5 118/2.5
ASA known (N) 6760 7283 5530 4603
ASA state (%) ASA 1 12.6 11.8 9 8.3
ASA 2 62.9 62.8 63.9 57.2
ASA 3 24.1 25.1 26.8 34.2
ASA 4/5 0.4 0.3 0.3 0.3
Primary total knee arthroplasty
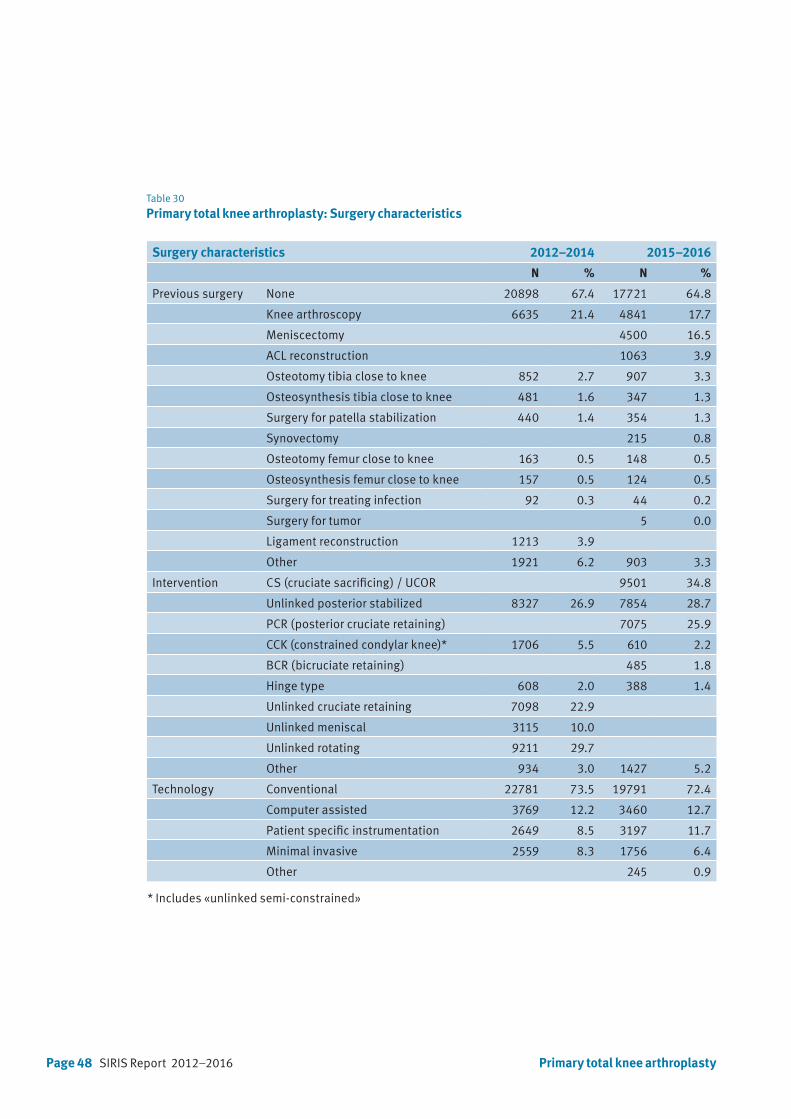
Page 48 SIRIS Report 2012–2016
Table 30
Primary total knee arthroplasty: Surgery characteristics
Surgery characteristics 2012–2014 2015–2016
N % N %
Previous surgery None 20898 67.4 17721 64.8
Knee arthroscopy 6635 21.4 4841 17.7
Meniscectomy 4500 16.5
ACL reconstruction 1063 3.9
Osteotomy tibia close to knee 852 2.7 907 3.3
Osteosynthesis tibia close to knee 481 1.6 347 1.3
Surgery for patella stabilization 440 1.4 354 1.3
Synovectomy 215 0.8
Osteotomy femur close to knee 163 0.5 148 0.5
Osteosynthesis femur close to knee 157 0.5 124 0.5
Surgery for treating infection 92 0.3 44 0.2
Surgery for tumor 5 0.0
Ligament reconstruction 1213 3.9
Other 1921 6.2 903 3.3
Intervention CS (cruciate sacrificing) / UCOR 9501 34.8
Unlinked posterior stabilized 8327 26.9 7854 28.7
PCR (posterior cruciate retaining) 7075 25.9
CCK (constrained condylar knee)* 1706 5.5 610 2.2
BCR (bicruciate retaining) 485 1.8
Hinge type 608 2.0 388 1.4
Unlinked cruciate retaining 7098 22.9
Unlinked meniscal 3115 10.0
Unlinked rotating 9211 29.7
Other 934 3.0 1427 5.2
Technology Conventional 22781 73.5 19791 72.4
Computer assisted 3769 12.2 3460 12.7
Patient specific instrumentation 2649 8.5 3197 11.7
Minimal invasive 2559 8.3 1756 6.4
Other 245 0.9
* Includes «unlinked semi-constrained»
Primary total knee arthroplasty
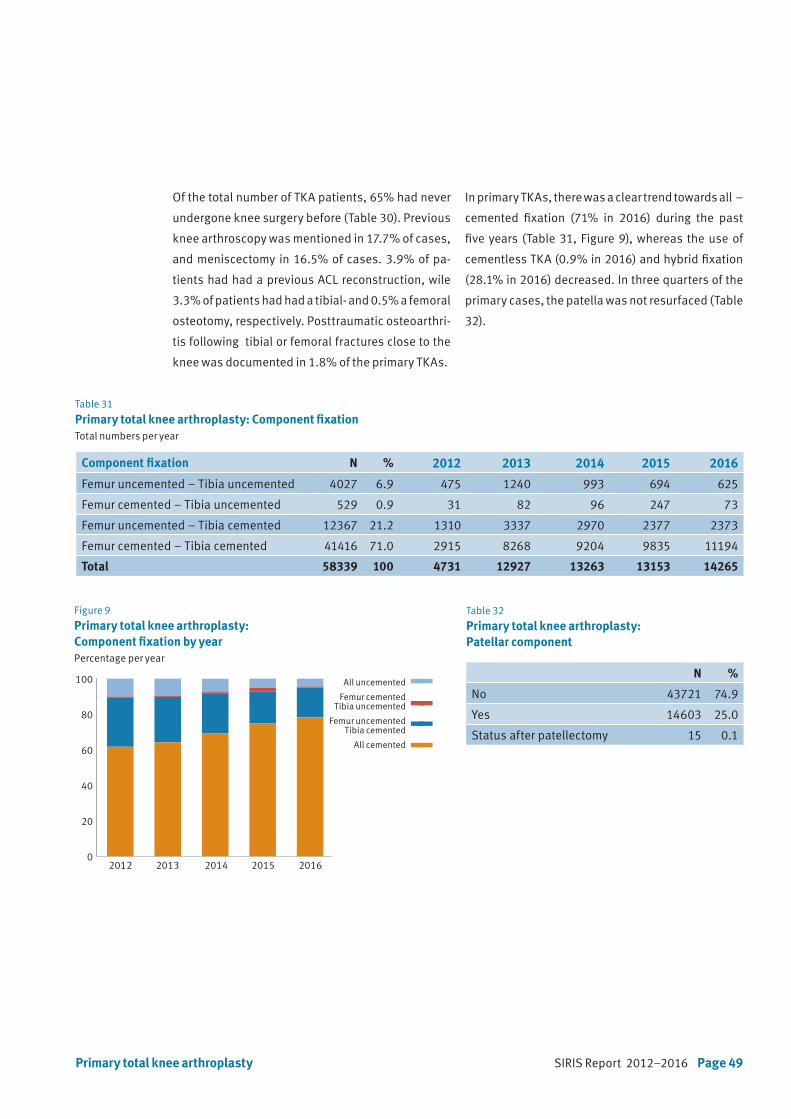
SIRIS Report 2012–2016 Page 49
Of the total number of TKA patients, 65% had never
undergone knee surgery before (Table 30). Previous
knee arthroscopy was mentioned in 17.7% of cases,
and meniscectomy in 16.5% of cases. 3.9% of pa-
tients had had a previous ACL reconstruction, wile
3.3% of patients had had a tibial- and 0.5% a femoral
osteotomy, respectively. Posttraumatic osteoarthri-
tis following tibial or femoral fractures close to the
knee was documented in 1.8% of the primary TKAs.
In primary TKAs, there was a clear trend towards all –
cemented fixation (71% in 2016) during the past
five years (Table 31, Figure 9), whereas the use of
cementless TKA (0.9% in 2016) and hybrid fixation
(28.1% in 2016) decreased. In three quarters of the
primary cases, the patella was not resurfaced (Table
32).
Table 31
Primary total knee arthroplasty: Component fixationTotal numbers per year
Table 32
Primary total knee arthroplasty: Patellar component
Figure 9
Primary total knee arthroplasty: Component fixation by yearPercentage per year
Component fixation N % 2012 2013 2014 2015 2016
Femur uncemented – Tibia uncemented 4027 6.9 475 1240 993 694 625
Femur cemented – Tibia uncemented 529 0.9 31 82 96 247 73
Femur uncemented – Tibia cemented 12367 21.2 1310 3337 2970 2377 2373
Femur cemented – Tibia cemented 41416 71.0 2915 8268 9204 9835 11194
Total 58339 100 4731 12927 13263 13153 14265
N %
No 43721 74.9
Yes 14603 25.0
Status after patellectomy 15 0.1
2012 2013 2014 2015 20160
20
40
60
80
100
all uncemented
femur cement, tibia no cement
femur no cement, tibia cement
all cemented
2012 2013 2014 2015 20160
3000
6000
9000
12000
15000
All uncemented
Femur cementedTibia uncemented
Femur uncemented Tibia cemented
All cemented
2012 2013 2014 2015 20160
3000
6000
9000
12000
15000
All uncemented
Femur cementedTibia uncemented
Femur uncemented Tibia cemented
All cemented
All uncemented
Femur cementedTibia uncemented
Femur uncementedTibia cemented
All cemented
Primary total knee arthroplasty
Page 50 SIRIS Report 2012–2016
7.2 Primary partial knee arthroplasty
Of all primary knee arthroplasties, 14.3% were par-
tial knee replacements (Table 3). The proportion has
remained constant over the past five years and is
with over 14% the highest in the international com-
munity, including the United Kingdom (about 9% in
2015).
Of the total number of procedures, 51% were perfor-
med in women. Mean age at surgery was almost 65
years (Table 33). In the younger age groups partial
knee replacement was performed in 2% of patients
younger than 45 years and 13.8% in the group bet-
ween 45 to 54 years old. Elderly patients constituted
18% of the partial knee replacements performed –
16% belonged to the group aged 75–84 years and
2.1% to the group aged 85 years and older. The mean
BMI was 28.3 kg/m2 in the partial knee replacement
group. The BMI was not recorded in 26.5% of cases.
Of the total number of patients, 86% had an ASA
classification of 1 or 2. In 11.2% of patients the mor-
bidity state was not recorded.
In total, 80% of partial knee replacements were per-
formed in hospitals that carry out more than 100 in-
terventions per year (Table 34).
Primary partial knee arthroplasty
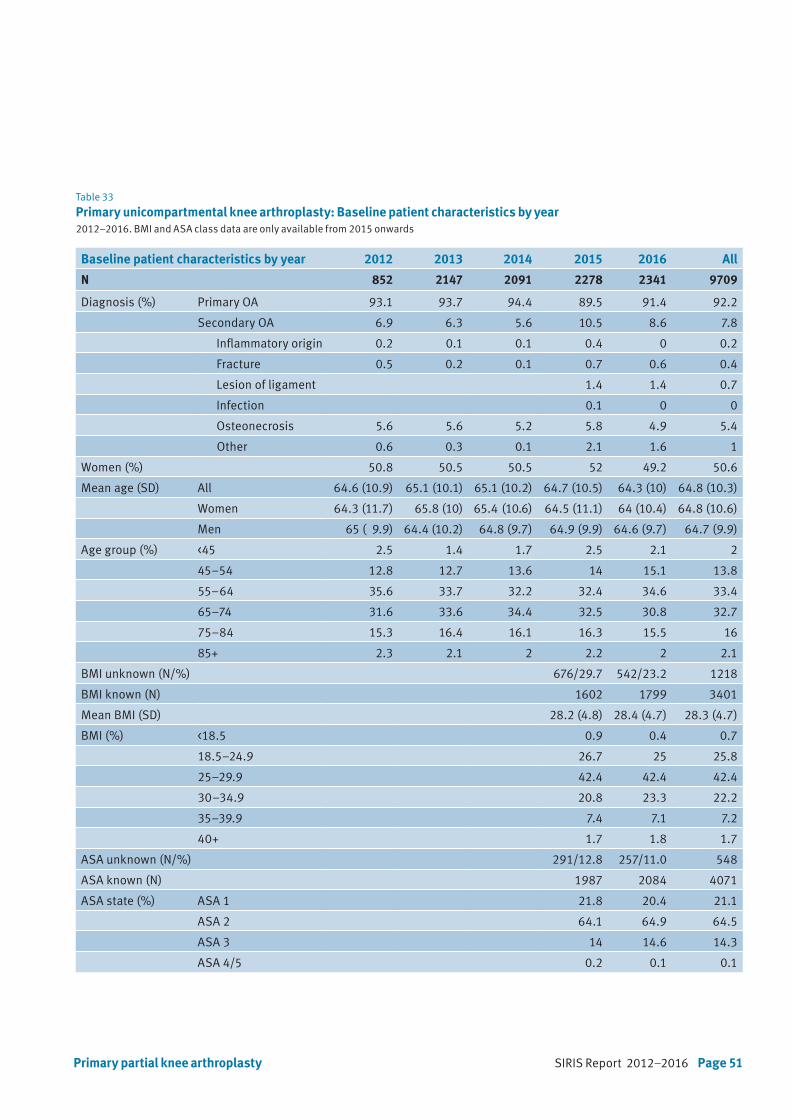
SIRIS Report 2012–2016 Page 51Primary partial knee arthroplasty
Table 33
Primary unicompartmental knee arthroplasty: Baseline patient characteristics by year2012–2016. BMI and ASA class data are only available from 2015 onwards
Baseline patient characteristics by year 2012 2013 2014 2015 2016 All
N 852 2147 2091 2278 2341 9709
Diagnosis (%) Primary OA 93.1 93.7 94.4 89.5 91.4 92.2
Secondary OA 6.9 6.3 5.6 10.5 8.6 7.8
Inflammatory origin 0.2 0.1 0.1 0.4 0 0.2
Fracture 0.5 0.2 0.1 0.7 0.6 0.4
Lesion of ligament 1.4 1.4 0.7
Infection 0.1 0 0
Osteonecrosis 5.6 5.6 5.2 5.8 4.9 5.4
Other 0.6 0.3 0.1 2.1 1.6 1
Women (%) 50.8 50.5 50.5 52 49.2 50.6
Mean age (SD) All 64.6 (10.9) 65.1 (10.1) 65.1 (10.2) 64.7 (10.5) 64.3 (10) 64.8 (10.3)
Women 64.3 (11.7) 65.8 (10) 65.4 (10.6) 64.5 (11.1) 64 (10.4) 64.8 (10.6)
Men 65 ( 9.9) 64.4 (10.2) 64.8 (9.7) 64.9 (9.9) 64.6 (9.7) 64.7 (9.9)
Age group (%) <45 2.5 1.4 1.7 2.5 2.1 2
45–54 12.8 12.7 13.6 14 15.1 13.8
55–64 35.6 33.7 32.2 32.4 34.6 33.4
65–74 31.6 33.6 34.4 32.5 30.8 32.7
75–84 15.3 16.4 16.1 16.3 15.5 16
85+ 2.3 2.1 2 2.2 2 2.1
BMI unknown (N/%) 676/29.7 542/23.2 1218
BMI known (N) 1602 1799 3401
Mean BMI (SD) 28.2 (4.8) 28.4 (4.7) 28.3 (4.7)
BMI (%) <18.5 0.9 0.4 0.7
18.5–24.9 26.7 25 25.8
25–29.9 42.4 42.4 42.4
30–34.9 20.8 23.3 22.2
35–39.9 7.4 7.1 7.2
40+ 1.7 1.8 1.7
ASA unknown (N/%) 291/12.8 257/11.0 548
ASA known (N) 1987 2084 4071
ASA state (%) ASA 1 21.8 20.4 21.1
ASA 2 64.1 64.9 64.5
ASA 3 14 14.6 14.3
ASA 4/5 0.2 0.1 0.1
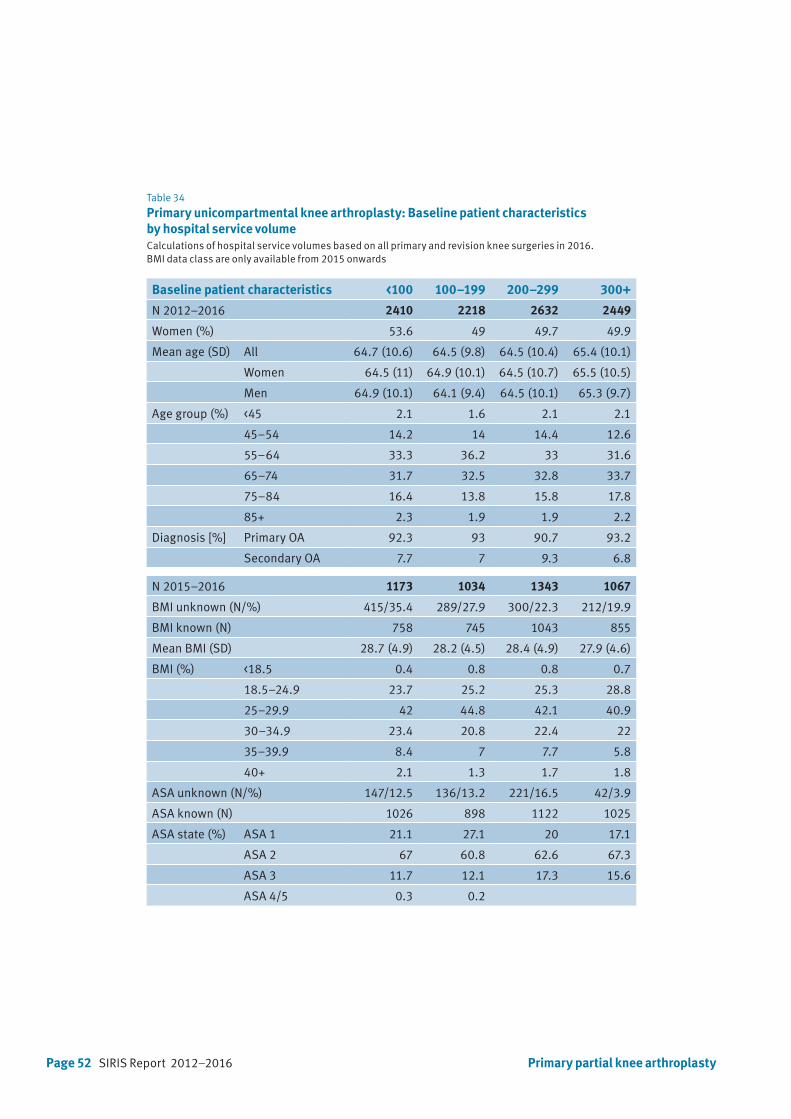
Page 52 SIRIS Report 2012–2016
Table 34
Primary unicompartmental knee arthroplasty: Baseline patient characteristics by hospital service volumeCalculations of hospital service volumes based on all primary and revision knee surgeries in 2016. BMI data class are only available from 2015 onwards
Baseline patient characteristics <100 100–199 200–299 300+
N 2012–2016 2410 2218 2632 2449
Women (%) 53.6 49 49.7 49.9
Mean age (SD) All 64.7 (10.6) 64.5 (9.8) 64.5 (10.4) 65.4 (10.1)
Women 64.5 (11) 64.9 (10.1) 64.5 (10.7) 65.5 (10.5)
Men 64.9 (10.1) 64.1 (9.4) 64.5 (10.1) 65.3 (9.7)
Age group (%) <45 2.1 1.6 2.1 2.1
45–54 14.2 14 14.4 12.6
55–64 33.3 36.2 33 31.6
65–74 31.7 32.5 32.8 33.7
75–84 16.4 13.8 15.8 17.8
85+ 2.3 1.9 1.9 2.2
Diagnosis [%] Primary OA 92.3 93 90.7 93.2
Secondary OA 7.7 7 9.3 6.8
N 2015–2016 1173 1034 1343 1067
BMI unknown (N/%) 415/35.4 289/27.9 300/22.3 212/19.9
BMI known (N) 758 745 1043 855
Mean BMI (SD) 28.7 (4.9) 28.2 (4.5) 28.4 (4.9) 27.9 (4.6)
BMI (%) <18.5 0.4 0.8 0.8 0.7
18.5–24.9 23.7 25.2 25.3 28.8
25–29.9 42 44.8 42.1 40.9
30–34.9 23.4 20.8 22.4 22
35–39.9 8.4 7 7.7 5.8
40+ 2.1 1.3 1.7 1.8
ASA unknown (N/%) 147/12.5 136/13.2 221/16.5 42/3.9
ASA known (N) 1026 898 1122 1025
ASA state (%) ASA 1 21.1 27.1 20 17.1
ASA 2 67 60.8 62.6 67.3
ASA 3 11.7 12.1 17.3 15.6
ASA 4/5 0.3 0.2
Primary partial knee arthroplasty
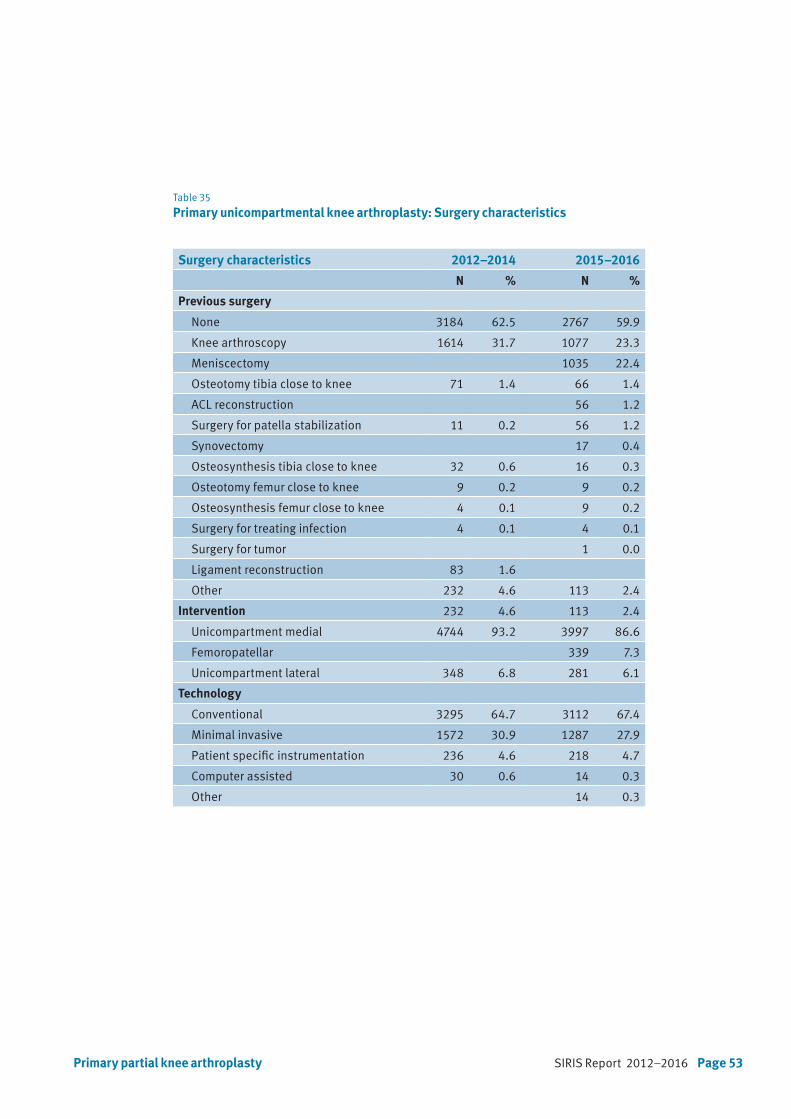
SIRIS Report 2012–2016 Page 53Primary partial knee arthroplasty
Table 35
Primary unicompartmental knee arthroplasty: Surgery characteristics
Surgery characteristics 2012–2014 2015–2016
N % N %
Previous surgery
None 3184 62.5 2767 59.9
Knee arthroscopy 1614 31.7 1077 23.3
Meniscectomy 1035 22.4
Osteotomy tibia close to knee 71 1.4 66 1.4
ACL reconstruction 56 1.2
Surgery for patella stabilization 11 0.2 56 1.2
Synovectomy 17 0.4
Osteosynthesis tibia close to knee 32 0.6 16 0.3
Osteotomy femur close to knee 9 0.2 9 0.2
Osteosynthesis femur close to knee 4 0.1 9 0.2
Surgery for treating infection 4 0.1 4 0.1
Surgery for tumor 1 0.0
Ligament reconstruction 83 1.6
Other 232 4.6 113 2.4
Intervention 232 4.6 113 2.4
Unicompartment medial 4744 93.2 3997 86.6
Femoropatellar 339 7.3
Unicompartment lateral 348 6.8 281 6.1
Technology
Conventional 3295 64.7 3112 67.4
Minimal invasive 1572 30.9 1287 27.9
Patient specific instrumentation 236 4.6 218 4.7
Computer assisted 30 0.6 14 0.3
Other 14 0.3

Page 54 SIRIS Report 2012–2016
Table 36
Primary unicompartmental knee arthroplasty: Component fixationTotal numbers by year
Figure 10
Primary unicompartmental knee arthroplasty: Component fixation by yearPercentage by year
2012 2013 2014 2015 20160
20
40
60
80
100
All uncemented
Femur cementedTibia uncemented
Femur uncemented Tibia cemented
All cemented
2012 2013 2014 2015 20160
3000
6000
9000
12000
15000
All uncemented
Femur cementedTibia uncemented
Femur uncemented Tibia cemented
All cemented
2012 2013 2014 2015 20160
3000
6000
9000
12000
15000
All uncemented
Femur cementedTibia uncemented
Femur uncemented Tibia cemented
All cemented
All uncemented
Femur cementedTibia uncemented
Femur uncementedTibia cemented
All cemented
Component fixation N % 2012 2013 2014 2015 2016
Femur uncemented – Tibia uncemented 700 7.5 24 72 90 193 321
Femur cemented – Tibia uncemented 37 0.4 2 9 9 7 10
Femur uncemented – Tibia cemented 105 1.1 6 28 39 15 17
Femur cemented – Tibia cemented 8528 91.0 820 2038 1953 1897 1820
Total 9370 100 852 2147 2091 2112 2168
Almost 60% of the patients had not undergone any
form of surgery before partial knee replacement sur-
gery, 23.3% had had previous arthroscopy of the
knee, 22.4% a meniscectomy, 1.2% previous ACL
reconstruction, and 1.4% had undergone an osteo-
tomy close to the knee (Table 35).
Medial unicompartmental replacement was perfor-
med in 86.6% of cases, lateral in 6.1% of cases, and
patello-femoral replacement in 7.3% of cases.
Over the past 5 years the use of cementless fixati-
on has continually increased from 2.8% in 2012 to
14.8% in 2016. Hybrid fixation was used in 1.1% of
cases. In total, 91% of partial knee replacements
were fully cemented (Table 36, Figure 10).
Primary partial knee arthroplasty

SIRIS Report 2012–2016 Page 55
Table 37
Revision knee arthroplasty: Baseline patient characteristics by year2012–2015, BMI and ASA class data only available from 2015 onwards
Baseline patient characteristics 2012 2013 2014 2015 2016 All
N 529 1464 1605 1734 2087 7419
Women (%) 59.5 60.9 57.4 58.8 59 59
Mean age (SD) All 68.5 (9.9) 68.2 (10.7) 67.5 (11.4) 68.3 (10.9) 68.5 (10.4) 68.2 (10.8)
Women 69.2 (10.1) 68.6 (11.1) 68.2 (12) 68.8 (11) 69.3 (10.5) 68.8 (11)
Men 67.5 (9.5) 67.5 (10.1) 66.7 (10.5) 67.7 (10.6) 67.3 (10.3) 67.3 (10.3)
Age group (%) <45 0.8 1.6 2.1 1.6 1.2 1.5
45–54 7.2 8 9.1 8.6 7.8 8.2
55–64 25 25.1 25.9 24.8 25.8 25.4
65–74 38.9 35.8 34 35.1 35.9 35.5
75–84 25.1 25.3 24.2 25 23.8 24.5
85+ 3 4.2 4.7 5 5.5 4.8
BMI unknown (N/%) 484/27.9 590/28.3 1074
BMI known (N) 1250 1497 2747
Mean BMI (SD) 29.4 (5.7) 29.8 (7.2) 29.6 (6.6)
BMI (%) <18.5 0.9 1.1 1
18.5–24.9 22.2 18.5 20.2
25–29.9 36.2 38 37.2
30–34.9 25.8 26.4 26.1
35–39.9 10.8 11.2 11
40+ 4.1 4.9 4.5
ASA unknown (N/%) 260/15.0 281/13.5 541
ASA known (N) 1474 1806 3280
ASA state (%) ASA 1 9.2 7.8 8.4
ASA 2 53.1 54.4 53.8
ASA 3 36.5 36.3 36.4
ASA 4/5 1.3 1.5 1.4
7.3 Revision of knee arthroplasty
Of the 74’567 knee arthroplasty procedures recor-
ded in SIRIS between September 2012 and Decem-
ber 2016, 7’419 were revisions of total or partial
knee arthroplasties. This corresponds to a revision
burden of 9.9% (Table 3). Of those revisions, 59%
were performed in women. Mean age at revision sur-
gery was 68.2 years (Table 37). Similar to primary
total knee arthroplasty, revision was infrequent in
younger and older patients (1.5% in patients youn-
ger than 45 years old; 8.2% in the age group 45–54
years; 4.8% in patients older than 85 years, respec-
tively). The mean BMI was at 29.6 kg/m2. The propor-
tion of missing data was 29.6%. The morbidity state
was rated ASA class 1 or 2 in 62.2% of cases where
this information was provided. In 13.5% of cases
morbidity state was not recorded.
Revision of knee arthroplasty
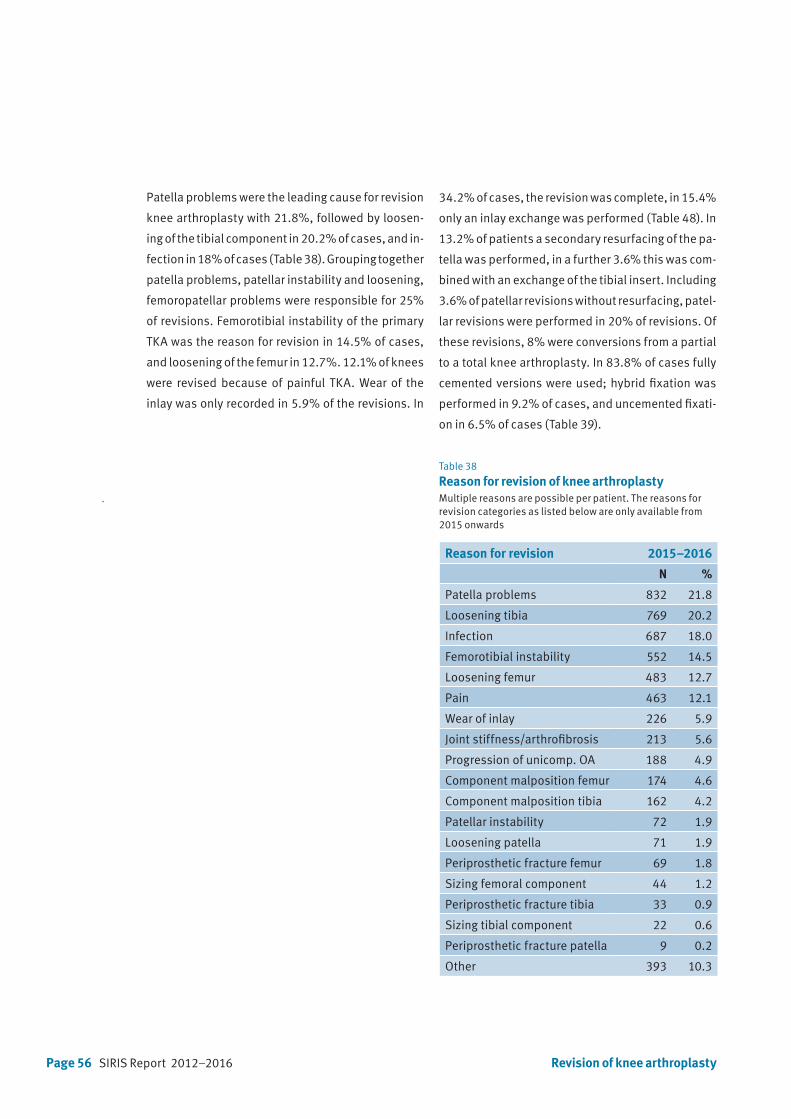
Page 56 SIRIS Report 2012–2016
Patella problems were the leading cause for revision
knee arthroplasty with 21.8%, followed by loosen-
ing of the tibial component in 20.2% of cases, and in-
fection in 18% of cases (Table 38). Grouping together
patella problems, patellar instability and loosening,
femoropatellar problems were responsible for 25%
of revisions. Femorotibial instability of the primary
TKA was the reason for revision in 14.5% of cases,
and loosening of the femur in 12.7%. 12.1% of knees
were revised because of painful TKA. Wear of the
inlay was only recorded in 5.9% of the revisions. In
Table 38
Reason for revision of knee arthroplastyMultiple reasons are possible per patient. The reasons for revision categories as listed below are only available from 2015 onwards
Reason for revision 2015–2016
N %
Patella problems 832 21.8
Loosening tibia 769 20.2
Infection 687 18.0
Femorotibial instability 552 14.5
Loosening femur 483 12.7
Pain 463 12.1
Wear of inlay 226 5.9
Joint stiffness/arthrofibrosis 213 5.6
Progression of unicomp. OA 188 4.9
Component malposition femur 174 4.6
Component malposition tibia 162 4.2
Patellar instability 72 1.9
Loosening patella 71 1.9
Periprosthetic fracture femur 69 1.8
Sizing femoral component 44 1.2
Periprosthetic fracture tibia 33 0.9
Sizing tibial component 22 0.6
Periprosthetic fracture patella 9 0.2
Other 393 10.3
34.2% of cases, the revision was complete, in 15.4%
only an inlay exchange was performed (Table 48). In
13.2% of patients a secondary resurfacing of the pa-
tella was performed, in a further 3.6% this was com-
bined with an exchange of the tibial insert. Including
3.6% of patellar revisions without resurfacing, patel-
lar revisions were performed in 20% of revisions. Of
these revisions, 8% were conversions from a partial
to a total knee arthroplasty. In 83.8% of cases fully
cemented versions were used; hybrid fixation was
performed in 9.2% of cases, and uncemented fixati-
on in 6.5% of cases (Table 39).
Revision of knee arthroplasty

SIRIS Report 2012–2016 Page 57
Surgery characteristics 2012–2014 2015–2016
Intervention type N % N %
Complete revision 1724 47.8 1302 34.2
Exchange of PE 502 13.9 588 15.4
Subsequent patella replacement 353 9.8 505 13.2
Conversion from unicompartimental to TKA 304 8.0
Tibial revision 261 7.2 221 5.8
Reimplantation of prosthesis 190 5.3 213 5.6
Subsequent patella prosthesis with exchange of PE 137 3.6
Patella revision 189 5.2 122 3.2
Component removal with spacer implantation 124 3.4 118 3.1
Femoral revision 103 2.9 97 2.5
Prosthesis preserving revision 37 1.0
Component removal without spacer implantation 16 0.4
Osteosynthesis 16 0.4
Arthrodesis 1 0.0 8 0.2
Other 160 4.4 128 3.4
Type of arthroplasty
Unlinked posterior stabilised 896 27.0 537 25.1
Hinge type 520 15.7 366 17.1
CS (cruciate sacrificing) / UCOR 312 14.6
CCK constrained condylar knee* 519 15.6 597 27.9
PCR (posterior cruciate retaining) 188 8.8
Unicompartment medial 74 2.2 27 1.3
BCR (bicruciate retaining) 20 0.9
Patellofemoral 6 0.3
Unicompartment lateral 6 0.2
Unlinked rotating 541 16.3
Unlinked cruciate retaining 368 11.1
Unlinked meniscal 187 5.6
Other 211 6.4 87 4.1
Technology 3043 84.4 3205 84.1
Conventional 113 3.1 133 3.5
Computer assisted 152 4.2 129 3.4
Minimal invasive 31 0.9 52 1.4
Patient specific instrumentation 15 0.4
Other 14 0.4
Table 39
Surgery characteristics of revision of knee arthroplasty
* Includes «unlinked semi-constrained»
Revision of knee arthroplasty
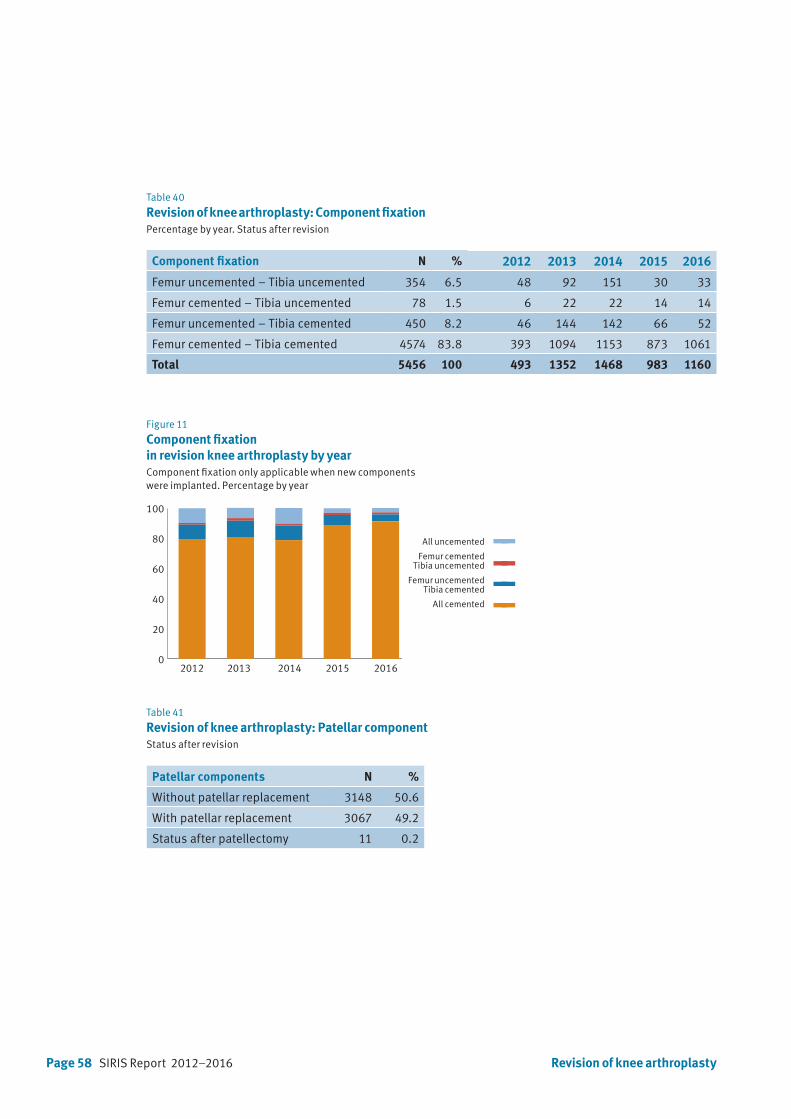
Page 58 SIRIS Report 2012–2016 Revision of knee arthroplasty
Table 40
Revision of knee arthroplasty: Component fixationPercentage by year. Status after revision
Figure 11
Component fixation in revision knee arthroplasty by yearComponent fixation only applicable when new componentswere implanted. Percentage by year
Table 41
Revision of knee arthroplasty: Patellar componentStatus after revision
Patellar components N %
Without patellar replacement 3148 50.6
With patellar replacement 3067 49.2
Status after patellectomy 11 0.2
2012 2013 2014 2015 20160
20
40
60
80
100 All uncemented
Femur cementedTibia uncemented
Femur uncementedTibia cemented
All cemented
2012 2013 2014 2015 20160
3000
6000
9000
12000
15000
All uncemented
Femur cementedTibia uncemented
Femur uncemented Tibia cemented
All cemented
2012 2013 2014 2015 20160
3000
6000
9000
12000
15000
All uncemented
Femur cementedTibia uncemented
Femur uncemented Tibia cemented
All cemented
All uncemented
Femur cementedTibia uncemented
Femur uncementedTibia cemented
All cemented
Component fixation N % 2012 2013 2014 2015 2016
Femur uncemented – Tibia uncemented 354 6.5 48 92 151 30 33
Femur cemented – Tibia uncemented 78 1.5 6 22 22 14 14
Femur uncemented – Tibia cemented 450 8.2 46 144 142 66 52
Femur cemented – Tibia cemented 4574 83.8 393 1094 1153 873 1061
Total 5456 100 493 1352 1468 983 1160

SIRIS Report 2012–2016 Page 59
Table 42
First revision of primary total knee arthroplasty: Baseline patient characteristics
Baseline patient characteristics Primary Revised Revised in same service
N N % N %
Overall 2012–2016 58339 1327 2.3 1168 88.0
Diagnosis Primary OA 53977 1241 2.3 1096 88.3
Secondary OA 4362 86 2.0 72 83.7
Overall Primary OA 2012–2016 53977 1241 2.3 1097 88.4
Gender Women 33243 728 2.2 648 89.0
Men 20734 513 2.5 448 87.3
Age group <55 3606 138 3.8 124 89.9
55–64 12343 371 3.0 314 84.6
65–74 20246 426 2.1 384 90.1
75–84 15378 273 1.8 244 89.4
85+ 2404 33 1.4 30 90.9
Overall primary OA (2015–2016) 24092 382 1.6 326 85.3
BMI group <18.5 75 0 0.0 0
18.5–24.9 3770 58 1.5 45 77.6
25–29.9 7281 119 1.6 106 89.1
30–34.9 4612 70 1.5 59 84.3
35–39.9 2027 35 1.7 32 91.4
40+ 902 17 1.9 14 82.4
BMI unknown 5425 83 1.5 70 84.3
ASA state ASA 1 2143 41 1.9 34 82.9
ASA 2 13210 187 1.4 162 86.6
ASA 3 5810 114 2.0 99 86.8
ASA 4/5 73 3 4.1 3 100.0
ASA unknown 2856 37 1.3 28 75.7
7.4 First revision of a primary total knee arthroplasty
Documented since 2012. Table 42 includes all first
revisions of primary TKAs registered since the im-
plementation of the registry in September 2012.
Overall, 1’327 of the 58’339 primary TKAs had to be
revised, corresponding to a 2-year revision rate of
2.3%. These revisions were performed to 88% at the
same institution as the primary implantation.
712 primary TKAs (61.1%) were revised within the
first year after the index surgery, 453 TKAs (38.9%)
during the second year, resulting in 1’165 revisions
First revision of primary total knee arthroplasty
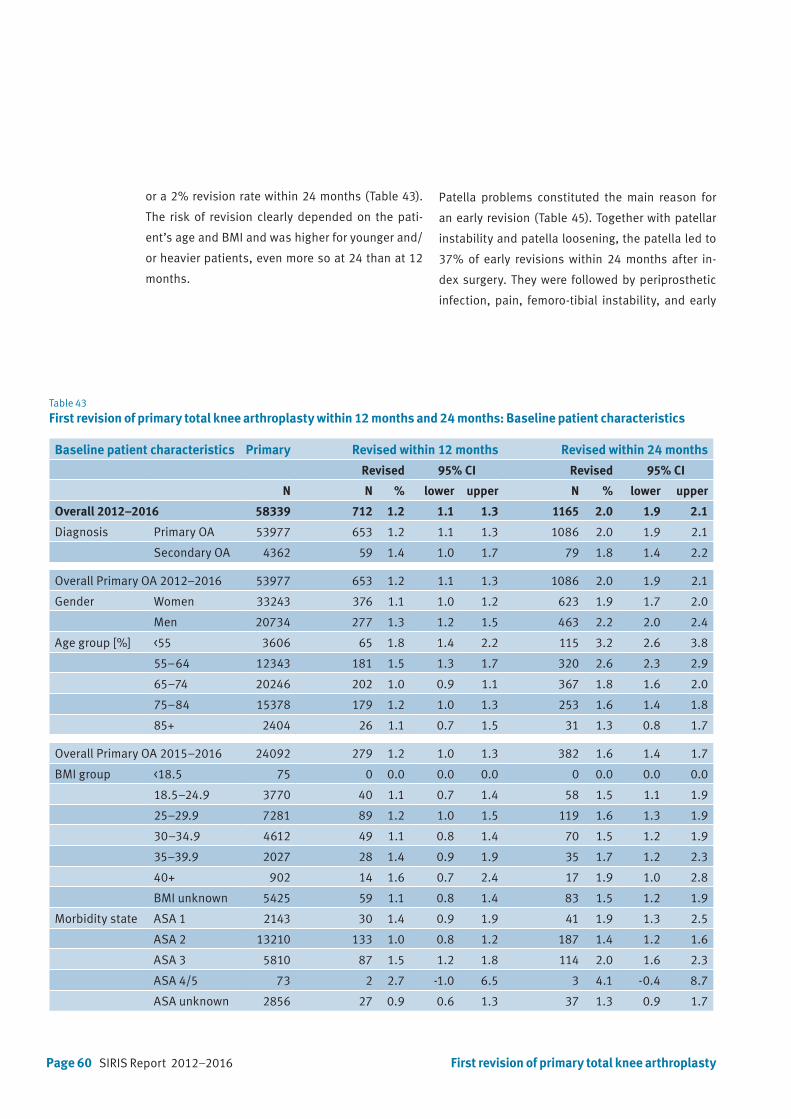
Page 60 SIRIS Report 2012–2016
Table 43
First revision of primary total knee arthroplasty within 12 months and 24 months: Baseline patient characteristics
Baseline patient characteristics Primary Revised within 12 months Revised within 24 months
Revised 95% CI Revised 95% CI
N N % lower upper N % lower upper
Overall 2012–2016 58339 712 1.2 1.1 1.3 1165 2.0 1.9 2.1
Diagnosis Primary OA 53977 653 1.2 1.1 1.3 1086 2.0 1.9 2.1
Secondary OA 4362 59 1.4 1.0 1.7 79 1.8 1.4 2.2
Overall Primary OA 2012–2016 53977 653 1.2 1.1 1.3 1086 2.0 1.9 2.1
Gender Women 33243 376 1.1 1.0 1.2 623 1.9 1.7 2.0
Men 20734 277 1.3 1.2 1.5 463 2.2 2.0 2.4
Age group [%] <55 3606 65 1.8 1.4 2.2 115 3.2 2.6 3.8
55–64 12343 181 1.5 1.3 1.7 320 2.6 2.3 2.9
65–74 20246 202 1.0 0.9 1.1 367 1.8 1.6 2.0
75–84 15378 179 1.2 1.0 1.3 253 1.6 1.4 1.8
85+ 2404 26 1.1 0.7 1.5 31 1.3 0.8 1.7
Overall Primary OA 2015–2016 24092 279 1.2 1.0 1.3 382 1.6 1.4 1.7
BMI group <18.5 75 0 0.0 0.0 0.0 0 0.0 0.0 0.0
18.5–24.9 3770 40 1.1 0.7 1.4 58 1.5 1.1 1.9
25–29.9 7281 89 1.2 1.0 1.5 119 1.6 1.3 1.9
30–34.9 4612 49 1.1 0.8 1.4 70 1.5 1.2 1.9
35–39.9 2027 28 1.4 0.9 1.9 35 1.7 1.2 2.3
40+ 902 14 1.6 0.7 2.4 17 1.9 1.0 2.8
BMI unknown 5425 59 1.1 0.8 1.4 83 1.5 1.2 1.9
Morbidity state ASA 1 2143 30 1.4 0.9 1.9 41 1.9 1.3 2.5
ASA 2 13210 133 1.0 0.8 1.2 187 1.4 1.2 1.6
ASA 3 5810 87 1.5 1.2 1.8 114 2.0 1.6 2.3
ASA 4/5 73 2 2.7 -1.0 6.5 3 4.1 -0.4 8.7
ASA unknown 2856 27 0.9 0.6 1.3 37 1.3 0.9 1.7
or a 2% revision rate within 24 months (Table 43).
The risk of revision clearly depended on the pati-
ent’s age and BMI and was higher for younger and/
or heavier patients, even more so at 24 than at 12
months.
Patella problems constituted the main reason for
an early revision (Table 45). Together with patellar
instability and patella loosening, the patella led to
37% of early revisions within 24 months after in-
dex surgery. They were followed by periprosthetic
infection, pain, femoro-tibial instability, and early
First revision of primary total knee arthroplasty

SIRIS Report 2012–2016 Page 61First revision of primary total knee arthroplasty
Table 44
First revision of primary total knee arthroplasty within 12 months and 24 months overall and according to component fixation
Component fixation Primary TKA Revised within 12 months Revised within 24 months
Revised 95% CI Revised 95% CI
N N % lower upper N % lower upper
Overall 53977 653 1.2 1.1 1.3 1086 2.0 1.9 2.1
Component fixation
Femur and tibia cemented 38092 462 1.2 1.1 1.3 751 2.0 1.8 2.1
Femur and tibia uncemented 3808 52 1.4 1.0 1.7 93 2.4 2.0 2.9
Femur cemented, tibia uncemented 475 11 2.3 1.0 3.7 16 3.4 1.7 5.0
Femur uncemented, tibia cemented 11602 128 1.1 0.9 1.3 226 1.9 1.7 2.2
Patellar replacement
With patellar replacement 13489 145 1.1 0.9 1.2 215 1.6 1.4 1.8
Without patellar replacement 40477 508 1.3 1.1 1.4 871 2.2 2.0 2.3
Status after patellectomy 11 0 0 0 0 0 0 0 0
Table 45
Reason for early first revision of primary total knee arthroplastyMultiple reasons are possible per patient. The reasons for revision categories as listed below only are available from 2015 onwards
Reason for early first revision 2015–2016
N %
Patella problems 288 33.7
Infection 143 16.7
Pain 114 13.3
Femorotibial instability 110 12.9
Loosening tibia 91 10.6
Joint stiffness/arthrofibrosis 68 8.0
Loosening femur 27 3.2
Patellar instability 23 2.7
Component malposition tibia 22 2.6
Component malposition femur 19 2.2
Wear of inlay 11 1.3
Loosening patella 8 0.9
Sizing femoral component 8 0.9
Progression of unicomp. OA 7 0.8
Periprosthetic fracture femur 6 0.7
Periprosthetic fracture tibia 5 0.6
Periprosthetic fracture patella 5 0.6
Sizing tibial component 3 0.4
Other 111 13.0
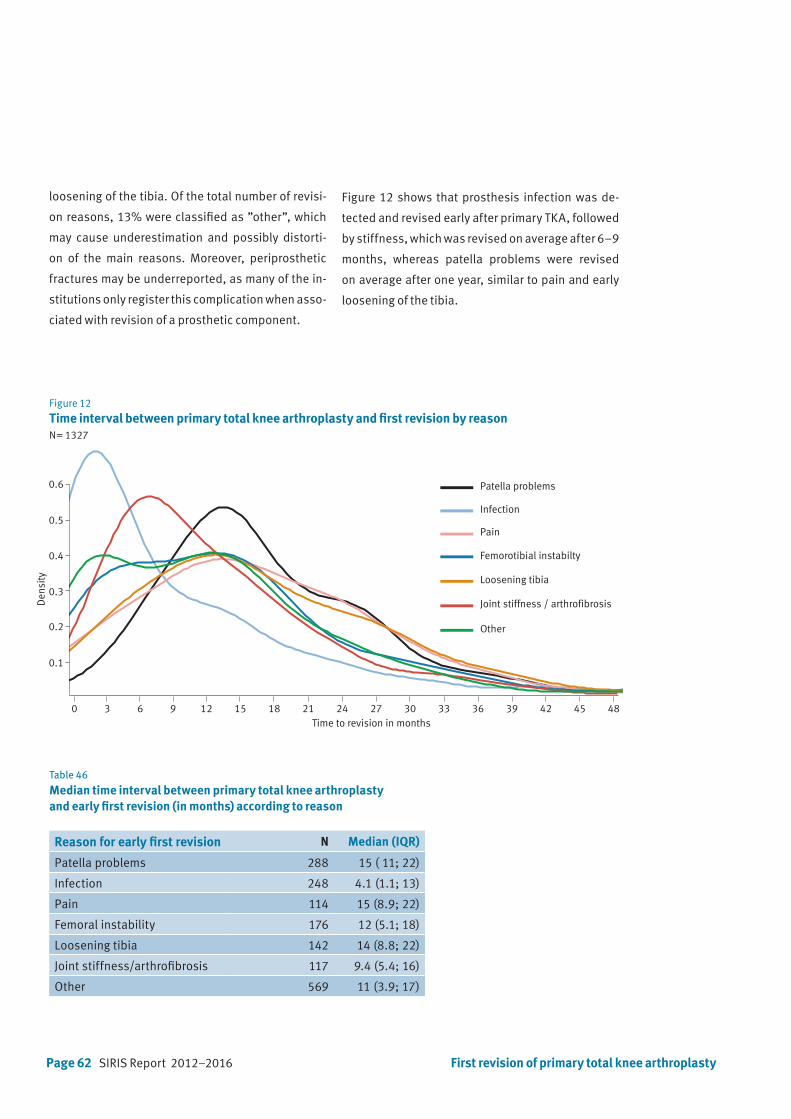
Page 62 SIRIS Report 2012–2016 First revision of primary total knee arthroplasty
Table 46
Median time interval between primary total knee arthroplasty and early first revision (in months) according to reason
Reason for early first revision N Median (IQR)
Patella problems 288 15 ( 11; 22)
Infection 248 4.1 (1.1; 13)
Pain 114 15 (8.9; 22)
Femoral instability 176 12 (5.1; 18)
Loosening tibia 142 14 (8.8; 22)
Joint stiffness/arthrofibrosis 117 9.4 (5.4; 16)
Other 569 11 (3.9; 17)
loosening of the tibia. Of the total number of revisi-
on reasons, 13% were classified as ”other”, which
may cause underestimation and possibly distorti-
on of the main reasons. Moreover, periprosthetic
fractures may be underreported, as many of the in-
stitutions only register this complication when asso-
ciated with revision of a prosthetic component.
Figure 12
Time interval between primary total knee arthroplasty and first revision by reasonN= 1327
Time to revision in months0 3 6 9 12 15 18 21 24 27 30 33 36 39 42 45 48
0.1
0.2
0.3
0.4
0.5
0.6
Den
sity
Patella problems
Infection
Pain
Femorotibial instabilty
Loosening tibia
Joint stiffness / arthrofibrosis
Other
Figure 12 shows that prosthesis infection was de-
tected and revised early after primary TKA, followed
by stiffness, which was revised on average after 6–9
months, whereas patella problems were revised
on average after one year, similar to pain and early
loosening of the tibia.
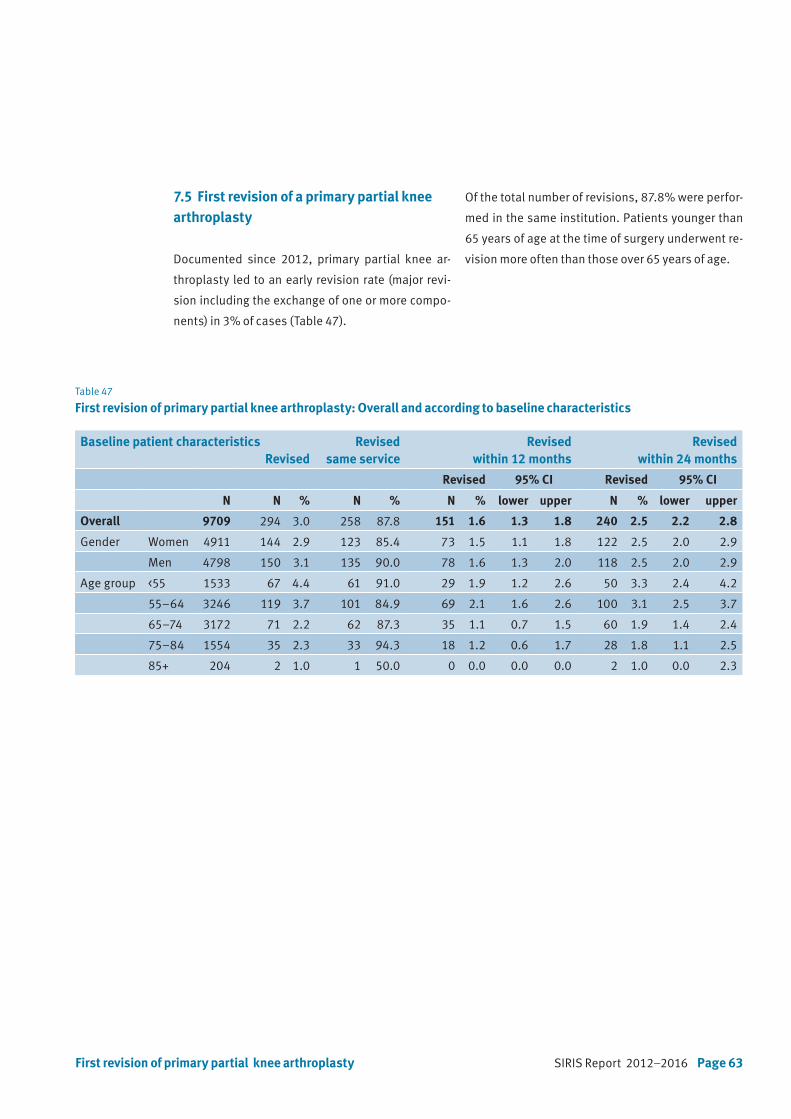
SIRIS Report 2012–2016 Page 63First revision of primary partial knee arthroplasty
Table 47
First revision of primary partial knee arthroplasty: Overall and according to baseline characteristics
7.5 First revision of a primary partial knee arthroplasty
Documented since 2012, primary partial knee ar-
throplasty led to an early revision rate (major revi-
sion including the exchange of one or more compo-
nents) in 3% of cases (Table 47).
Baseline patient characteristicsRevised
Revised same service
Revised within 12 months
Revised within 24 months
Revised 95% CI Revised 95% CI
N N % N % N % lower upper N % lower upper
Overall 9709 294 3.0 258 87.8 151 1.6 1.3 1.8 240 2.5 2.2 2.8
Gender Women 4911 144 2.9 123 85.4 73 1.5 1.1 1.8 122 2.5 2.0 2.9
Men 4798 150 3.1 135 90.0 78 1.6 1.3 2.0 118 2.5 2.0 2.9
Age group <55 1533 67 4.4 61 91.0 29 1.9 1.2 2.6 50 3.3 2.4 4.2
55–64 3246 119 3.7 101 84.9 69 2.1 1.6 2.6 100 3.1 2.5 3.7
65–74 3172 71 2.2 62 87.3 35 1.1 0.7 1.5 60 1.9 1.4 2.4
75–84 1554 35 2.3 33 94.3 18 1.2 0.6 1.7 28 1.8 1.1 2.5
85+ 204 2 1.0 1 50.0 0 0.0 0.0 0.0 2 1.0 0.0 2.3
Of the total number of revisions, 87.8% were perfor-
med in the same institution. Patients younger than
65 years of age at the time of surgery underwent re-
vision more often than those over 65 years of age.

Page 64 SIRIS Report 2012–2016 First revision of primary partial knee arthroplasty
Table 48
Reason for first revision of partial knee arthroplastyMultiple reasons are possible per patient. The reasons for revision categories as listed below are only available from 2015 onwards.
2015–2016
N %
Loosening tibia 54 30.9
Pain 33 18.9
Loosening femur 28 16
Progression of unicomp. OA 24 13.7
Infection 15 8.6
Femorotibial instability 13 7.4
Patella problems 8 4.6
Periprosthetic fracture tibia 6 3.4
Wear of inlay 6 3.4
Component malposition tibia 6 3.4
Joint stiffness/Arthrofibrosis 3 1.7
Loosening patella 2 1.1
Component malposition femur 1 0.6
Sizing tibial component 1 0.6
Sizing femoral component 1 0.6
Other 28 16
Early loosening of the tibia and the femur were re-
sponsible for 47% of the revisions within 24 months
after index surgery (Table 48). Pain was the second
most common reason for revision in 18.9% of cases.
Compared to total knee arthroplasty, revision for
prosthetic infection was less common in partial
knee arthroplasty (8.6% versus 16.7%).
SIRIS Report 2012–2016 Page 65
8. Participating hospitals
Asana Gruppe AG, Spital Menziken
Asana Gruppe, Spital Leuggern
Berit Klinik, Speicher
Center da Sandà, Engiadina Bassa CSEB, Scuol
Centre Hospitalier Universitaire Vaudois CHUV, Lausanne
CIC Groupe Santé SA, Clinique CIC Riviera Centre, Clarens
CIC Groupe Santé SA, Valais, Saxon
Clinica Luganese SA, Lugano
Clinica Santa Chiara SA, Locarno
Clinique de la Source, Lausanne
Clinique des Grangettes SA, Chêne-Bougeries
Clinique Générale Beaulieu, Genève
EHC, Hôpital de Morges
eHnv, Hôpital St-Loup, Pompaples
eHnv, Hôpital Yverdon-les-Bains
EOC, Ospedale regionale di Bellinzona (San Giovanni)
EOC, Ospedale regionale di Locarno (La Carità)
EOC, Ospedale regionale di Lugano (Civico e Italiano)
EOC, Ospedale regionale di Mendrisio (Beata Vergine)
Flury Stiftung, Spital Schiers
Gesundheitszentrum Fricktal AG, Spital Laufenburg
Gesundheitszentrum Fricktal AG, Spital Rheinfelden
Groupement Hospitalier de l’Ouest Lémanique GHOL, Nyon
GZO AG Spital Wetzikon
Hirslanden AndreasKlinik Cham, Zug
Hirslanden Bern AG, Klinik Beau-Site, Bern
Hirslanden Bern AG, Klinik Permanence, Bern
Hirslanden Bern AG, Klinik Salem, Bern
Hirslanden Clinique La Colline SA, Genève
Hirslanden Klinik Aarau
Hirslanden Klinik am Rosenberg, Heiden
Hirslanden Klinik Belair, Schaffhausen
Hirslanden Klinik im Park, Zürich
Hirslanden Klinik St. Anna AG, Luzern
Hirslanden Klinik St. Anna AG, Meggen
Hirslanden Klinik Stephanshorn, St. Gallen
Hirslanden Lausanne SA, Clinique Bois-Cerf, Lausanne
Hirslanden Klinik Birshof AG, Münchenstein
Hôpital du Jura bernois SA, Site de Moutier
Hôpital du Jura bernois SA, Site de Saint-Imier
Hôpital du Jura, Site de Delémont
Hôpital du Pays-d’Enhaut, Château-d‘Oex
Hôpital du Valais (RSV), Martigny (no Data until now)
Hôpital du Valais (RSV), Sion (no Data until now)
Hôpital du Valais SZO, Spital Brig
Hôpital du Valais SZO, Spital Visp
Hôpital fribourgeois HFR, Hôpital cantonal, Fribourg
Hôpital fribourgeois HFR, Site de Riaz
Hôpital fribourgeois HFR, Site de Tafers
Hôpital intercantonal de la Broye HIB, Payerne
Hôpital neuchâtelois HNE, Site de la Chaux-de-Fonds
Hôpital neuchâtelois HNE, Site de Pourtalès, Neuchâtel
Hôpital Riviera Chablais, Site de Monthey
Hôpital Riviera Chablais, Site de Montreux
Hôpital Riviera Chablais, Site de Vevey
Hôpitaux Universitaires de Genève (HUG)
Insel Gruppe AG, Inselspital, Bern
Inselgruppe AG, Spital Aarberg
Inselgruppe AG, Spital Münsingen
Inselgruppe AG, Spital Riggisberg
Inselgruppe AG, Spital Tiefenau, Bern
Kantonales Spital und Pflegeheim Appenzell
Kantonsspital Aarau AG
Kantonsspital Baden AG
Kantonsspital Baselland, Standort Bruderholz
Kantonsspital Baselland, Standort Laufen
Kantonsspital Baselland, Standort Liestal
Kantonsspital Glarus AG
Kantonsspital Graubünden, Chur
Kantonsspital Nidwalden, Stans
Kantonsspital Obwalden, Sarnen
Kantonsspital St. Gallen, Spital Flawil
Kantonsspital St. Gallen, Spital Rorschach
Kantonsspital St. Gallen, Standort St. Gallen
Kantonsspital Uri, Altdorf
Kantonsspital Winterthur
Klinik Gut, Fläsch
Klinik Gut, St. Moritz
Klinik Hirslanden Zürich
Klinik Hohmad, Thun
Klinik Pyramide am See AG, Zürich
Klinik Seeschau AG, Kreuzlingen

Page 66 SIRIS Report 2012–2016
Klinik Siloah AG, Gümligen
Klinik St.Georg Goldach AG
La Tour Réseau de Soins SA, Hôpital de la Tour, Meyrin
Lindenhofgruppe, Klinik Sonnenhof, Bern
Lindenhofgruppe, Lindenhofspital Bern
Luzerner Kantonsspital LUKS, Luzern
Luzerner Kantonsspital LUKS, Sursee
Luzerner Kantonsspital LUKS, Wolhusen
Merian Iselin Klinik, Basel
Nouvelle Clinique Vert-Pré SA, Conches-Genève
Praxisklinik Rennbahn AG, Muttenz
Hirslanden Klinik Linde AG, Biel
Regionalspital Surselva AG, Ilanz
Réseau Santé Balcon du Jura RSBJ, St. Croix
Rosenklinik, Rapperswil
Schulthess Klinik, Zürich
See-Spital, Horgen
See-Spital, Kilchberg
SMN SA, Clinica Ars Medica, Gravesano
SMN SA, Clinique de Genolier
SMN SA, Clinique de Montchoisi, Lausanne
SMN SA, Clinique de Valère, Sion
SMN SA, Clinique Générale Ste-Anne SA, Fribourg
SMN SA, Clinique Montbrillant, La Chaux-de-Fonds
SMN SA, Hôpital de la Providence, Neuchâtel
SMN SA, Klinik Villa im Park AG, Rothrist
SMN SA, Privatklinik Bethanien, Zürich
SMN SA, Privatklinik Lindberg, Winterthur
SMN SA, Privatklinik Obach AG, Solothurn
Solothurner Spitäler AG, Bürgerspital Solothurn
Solothurner Spitäler AG, Kantonsspital Olten
Solothurner Spitäler AG, Spital Dornach
Spital Affoltern, Affoltern a. A.
Spital Bülach
Spital Davos AG
Spital Einsiedeln
Spital Emmental AG, Burgdorf
Spital Emmental AG, Langnau
Spital Lachen AG
Spital Limmattal, Schlieren
Spital Linth, Uznach
Spital Männedorf AG
Spital Muri
Spital Oberengadin, Samedan
Spital Schwyz
Spital STS AG, Spital Thun
Spital Thurgau AG, Kantonsspital Frauenfeld
Spital Thurgau AG, Kantonsspital Münsterlingen
Spital Thusis
Spital Uster
Spital Zofingen
Spital Zollikerberg
Spitäler fmi AG, Spital Frutigen
Spitäler fmi AG, Spital Interlaken
Spitäler Schaffhausen. Kantonsspital
Spitalregion Fürstenland Toggenburg, Spital Wattwil
Spitalregion Fürstenland Toggenburg, Spital Wil
Spitalregion Rheintal Werdenberg Sarganserland,
Spital Grabs
Spitalregion Rheintal Werdenberg Sarganserland,
Spital Walenstad
Spitalregion Rheintal, Werdenberg, Sarganserland,
Spital Altstätten
Spitalverbund Appenzell Ausserrhoden, Heiden
Spitalverbund Appenzell Ausserrhoden, Herisau
Spitalzentrum Biel AG
SRO AG, Spital Langenthal
St. Claraspital AG, Basel
Stadtspital Triemli, Zürich
Stadtspital Waid, Zürich
Universitätsklinik Balgrist, Zürich
Universitätsspital Basel USB
UniversitätsSpital Zürich
Zuger Kantonsspital AG, Baar

Page 68 SIRIS Report 2012–2016
Foundation for quality assurance
in implant surgery – SIRIS
c/o conidea GmbHWaldheimstrasse 223604 Thun


![Materials - Surfaces - Manufacturing - eCM · The 2013 [MEET THE EXPERT] Implants is dedicated to ex-perts and persons interested in the field of active and pas-sive implants. The](https://img.pdfslide.net/doc/110x75/5bab2d2009d3f296258d8e6b/materials-surfaces-manufacturing-the-2013-meet-the-expert-implants-is.jpg)