Embed Size (px)
Citation preview
COUNTRY PROFILE 2000
SwitzerlandThis Country Profile is a reference tool, which providesanalysis of historical political, infrastructural and economictrends. It is revised and updated annually. The EIU’s CountryReports analyse current trends and provide a two-yearforecast
The full publishing schedule for Country Profiles is nowavailable on our website at http://www.eiu.com/schedule
The Economist Intelligence Unit15 Regent St, London SW1Y 4LRUnited Kingdom

The Economist Intelligence UnitThe Economist Intelligence Unit is a specialist publisher serving companies establishing and managingoperations across national borders. For over 50 years it has been a source of information on businessdevelopments, economic and political trends, government regulations and corporate practice worldwide.
The EIU delivers its information in four ways: through our digital portfolio, where our latest analysis isupdated daily; through printed subscription products ranging from newsletters to annual referenceworks; through research reports; and by organising conferences and roundtables. The firm is a memberof The Economist Group.
LondonThe Economist Intelligence Unit15 Regent StLondonSW1Y 4LRUnited KingdomTel: (44.20) 7830 1000Fax: (44.20) 7499 9767E-mail: [email protected]
New YorkThe Economist Intelligence UnitThe Economist Building111 West 57th StreetNew YorkNY 10019, USTel: (1.212) 554 0600Fax: (1.212) 586 1181/2E-mail: [email protected]
Hong KongThe Economist Intelligence Unit25/F, Dah Sing Financial Centre108 Gloucester RoadWanchaiHong KongTel: (852) 2802 7288Fax: (852) 2802 7638E-mail: [email protected]
Website: http://www.eiu.com
Electronic deliveryThis publication can be viewed by subscribing online at http://store.eiu.com/brdes.html
Reports are also available in various other electronic formats, such as CD-ROM, Lotus Notes, on-linedatabases and as direct feeds to corporate intranets. For further information, please contact your nearestEconomist Intelligence Unit office
London: Jan Frost Tel: (44.20) 7830 1183 Fax: (44.20) 7830 1023New York: Alexander Bateman Tel: (1.212) 554 0643 Fax: (1.212) 586 1181Hong Kong: Amy Ha Tel: (852) 2802 7288/2585 3888 Fax: (852) 2802 7720/7638
Copyright© 2000 The Economist Intelligence Unit Limited. All rights reserved. Neither this publication norany part of it may be reproduced, stored in a retrieval system, or transmitted in any form or by anymeans, electronic, mechanical, photocopying, recording or otherwise, without the prior permissionof The Economist Intelligence Unit Limited.
All information in this report is verified to the best of the author's and the publisher's ability. However,the EIU does not accept responsibility for any loss arising from reliance on it.
ISSN 0269-6010
Symbols for tables“n/a” means not available; “–” means not applicable
Printed and distributed by Redhouse Press Ltd, Unit 151, Dartford Trade Park, Dartford, Kent DA1 1QB, UK
EIU Country Profile 2000 © The Economist Intelligence Unit Limited 2000
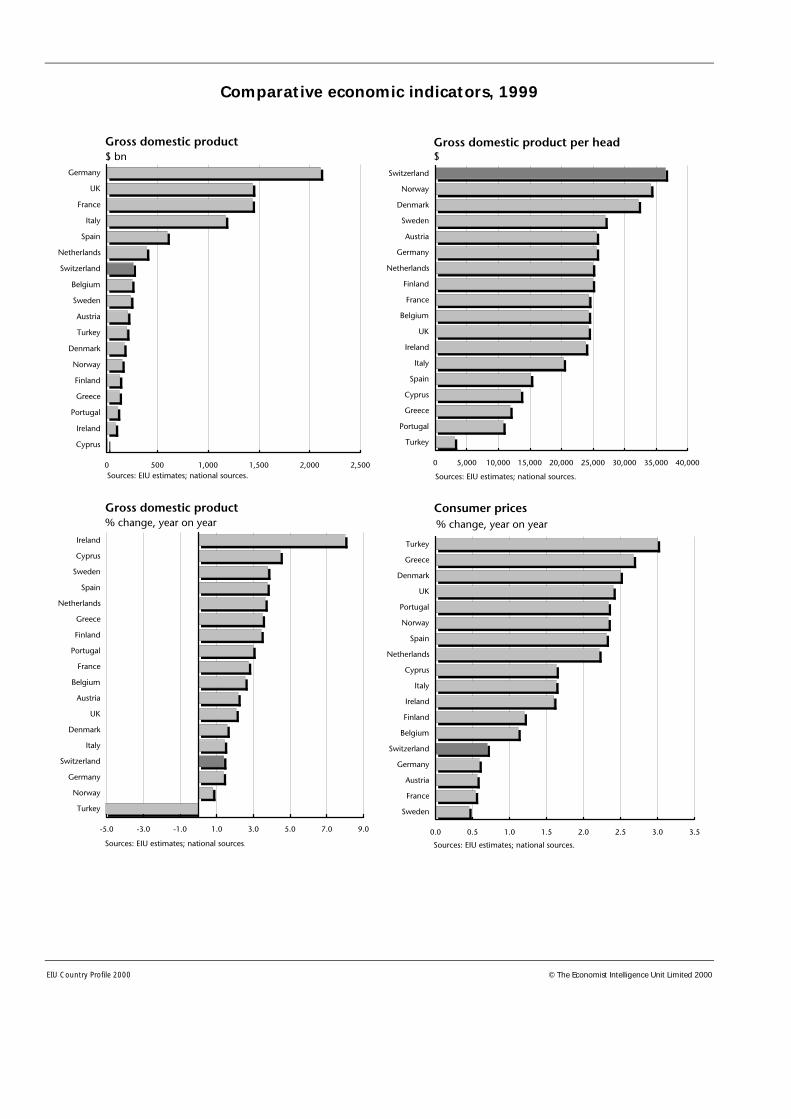
Comparative economic indicators, 1999
1
EIU Country Profile 2000 © The Economist Intelligence Unit Limited 2000
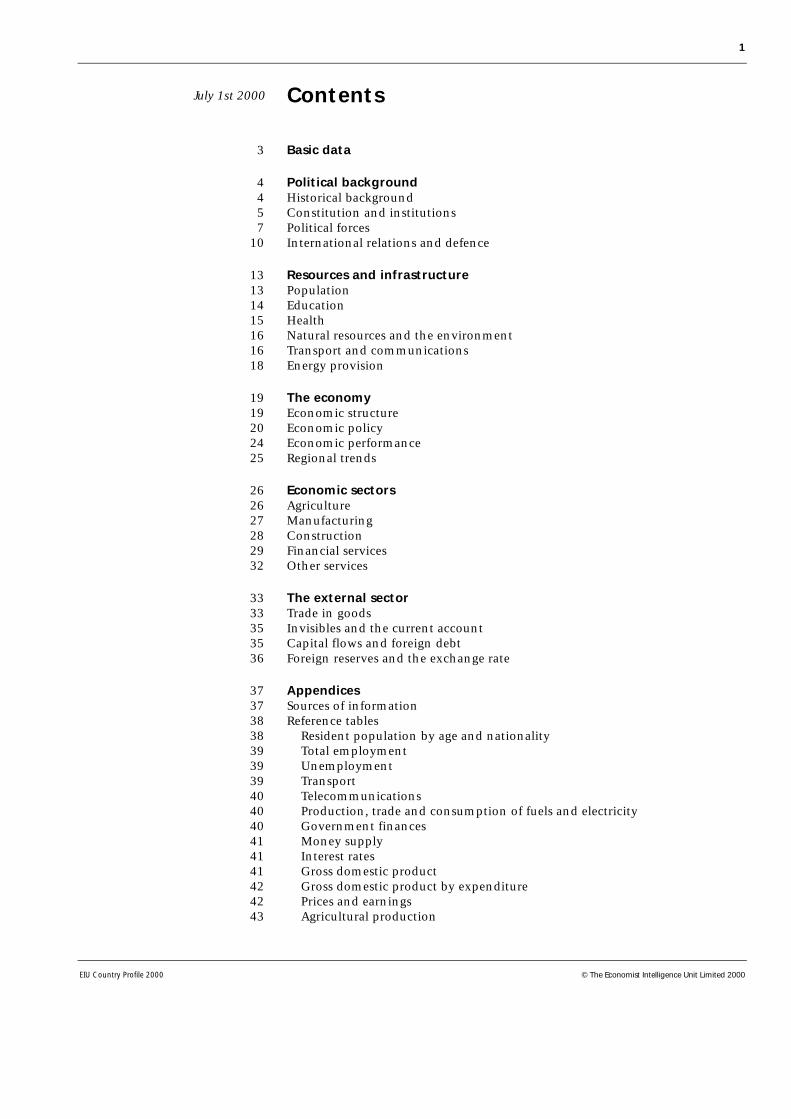
Contents
3 Basic data
4 Political background4 Historical background5 Constitution and institutions7 Political forces
10 International relations and defence
13 Resources and infrastructure13 Population14 Education15 Health16 Natural resources and the environment16 Transport and communications18 Energy provision
19 The economy19 Economic structure20 Economic policy24 Economic performance25 Regional trends
26 Economic sectors26 Agriculture27 Manufacturing28 Construction29 Financial services32 Other services
33 The external sector33 Trade in goods35 Invisibles and the current account35 Capital flows and foreign debt36 Foreign reserves and the exchange rate
37 Appendices37 Sources of information38 Reference tables38 Resident population by age and nationality39 Total employment39 Unemployment39 Transport40 Telecommunications40 Production, trade and consumption of fuels and electricity40 Government finances41 Money supply41 Interest rates41 Gross domestic product42 Gross domestic product by expenditure42 Prices and earnings43 Agricultural production
July 1st 2000

2
EIU Country Profile 2000 © The Economist Intelligence Unit Limited 2000
43 Industrial production44 Construction44 Swiss Stock Exchange44 Retail trade turnover44 Tourism receipts45 Composition of trade45 Main trading partners46 Direction and composition of trade, 199848 Balance of payments, IMF series48 Balance of payments, national estimates49 Foreign reserves49 Exchange rates
Switzerland 3
© The Economist Intelligence Unit Limited 2000 EIU Country Profile 2000
Switzerland
Basic data
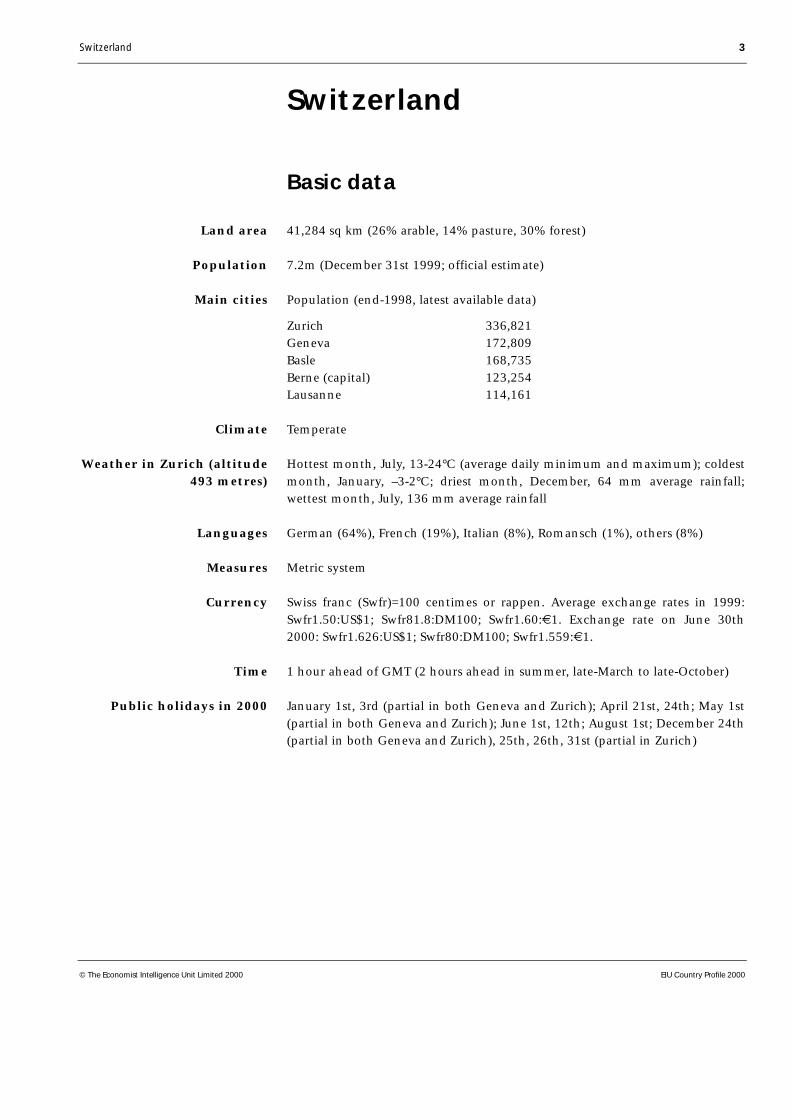
41,284 sq km (26% arable, 14% pasture, 30% forest)
7.2m (December 31st 1999; official estimate)
Population (end-1998, latest available data)
Zurich 336,821Geneva 172,809Basle 168,735Berne (capital) 123,254Lausanne 114,161
Temperate
Hottest month, July, 13-24°C (average daily minimum and maximum); coldestmonth, January, –3-2°C; driest month, December, 64 mm average rainfall;wettest month, July, 136 mm average rainfall
German (64%), French (19%), Italian (8%), Romansch (1%), others (8%)
Metric system
Swiss franc (Swfr)=100 centimes or rappen. Average exchange rates in 1999:Swfr1.50:US$1; Swfr81.8:DM100; Swfr1.60:€1. Exchange rate on June 30th2000: Swfr1.626:US$1; Swfr80:DM100; Swfr1.559:€1.
1 hour ahead of GMT (2 hours ahead in summer, late-March to late-October)
January 1st, 3rd (partial in both Geneva and Zurich); April 21st, 24th; May 1st(partial in both Geneva and Zurich); June 1st, 12th; August 1st; December 24th(partial in both Geneva and Zurich), 25th, 26th, 31st (partial in Zurich)
Land area
Population
Main cities
Climate
Weather in Zurich (altitude493 metres)
Languages
Measures
Currency
Time
Public holidays in 2000
4 Switzerland
EIU Country Profile 2000 © The Economist Intelligence Unit Limited 2000
Political background
Switzerland is a federal state and a parliamentary democracy with strong directdemocratic elements. The federal government has been run since 1959 by afour-party coalition comprising the Radical Democratic Party (RDP), theChristian Democratic Party (CDP), the Swiss People’s Party (PP) and the SocialDemocratic Party (SDP). In the 1999 parliamentary election the coalitionpartners won three-quarters of the seats in the lower house and theparliamentary representation of the PP was strengthened significantly.
Historical background
The current Swiss Confederation (Confoederatio Helvetica, CH), consisting of26 semi-autonomous cantons and half-cantons, evolved from a pact betweenthe people of three valley communities in 1291, while the modern federal statewas created in 1848. Legend has it that the founding pact of the free peasantsof Uri, Schwyz and Unterwalden was a pledge to aid each other in endingHabsburg dominion. By shooting at the emperor’s bailiff, William Tell gave thesignal for the expulsion of the oppressors. In reality the so-called Rütli Oath,named after the meadow beside Lake Lucerne where it was sworn, was analliance to preserve the peasants’ traditional autonomy under Habsburg rule.
As time went by, more valleys and towns joined the alliance, committingthemselves to mutual assistance, peaceful settlement of disputes and a rejectionof foreign judges. Their co-existence was founded on the principles of localautonomy and federalism, which still underpin the present Swiss constitution.By the end of the 14th century the confederation was on the way to being anindependent state, based on equality between political entities, whatever theirsize and economic strength. This is reflected today in the composition of theupper parliamentary chamber.
The Rütli Oath followed the opening of the Gotthard Pass across the Alps inthe 1230s. The pass rapidly became an important north-south link acrossEurope, embroiling the valley communities in European power politics. Warsof conquest by the independent members of the confederation during the 15thcentury were abruptly terminated by a heavy defeat by the French at the battleof Marignano in northern Italy in 1515. Thereafter, a peace treaty with Franceand a pact to supply mercenaries kept the Swiss out of foreign wars. The con-federation made its first formal declaration of armed neutrality in 1647 duringthe 30 years’ war (1618-48). Switzerland’s status of permanent armed neutralitywas later enshrined in international law at the Congress of Vienna in 1815.
The confederation survived two centuries of civil war between Catholics andProtestants that followed the Protestant Reformation in the 16th century, aswell as an invasion by Napoleon Bonaparte in the winter of 1797-98 designedto secure the mountain routes to Italy. In 1848, after a brief civil war in 1847,the Swiss opted for economic unity and a federal political structure. From aconfederation of independent states, Switzerland became a modern federal
Foundation ofconfederation in 1291
Civil war and invasiondespite pledge of neutrality
Switzerland 5
© The Economist Intelligence Unit Limited 2000 EIU Country Profile 2000
state. Many elements of the 1848 constitution still survive, although theformalised system of direct democracy (see below) first appeared in a revisedconstitution of 1874.
Switzerland industrialised rapidly in the 19th century and by 1850 wasconsidered the second most industrialised country in Europe after GreatBritain. The period between the first world war (1914-18) and the second worldwar (1939-45) was marked by labour unrest, including a general strike in 1918.In 1937 employers and trade unions made a pact of industrial peace, whichcontinues to govern workplace relations. Switzerland derived important eco-nomic benefits from remaining outside the two world wars, an experience thatstrengthened the country’s isolationist political tendencies.
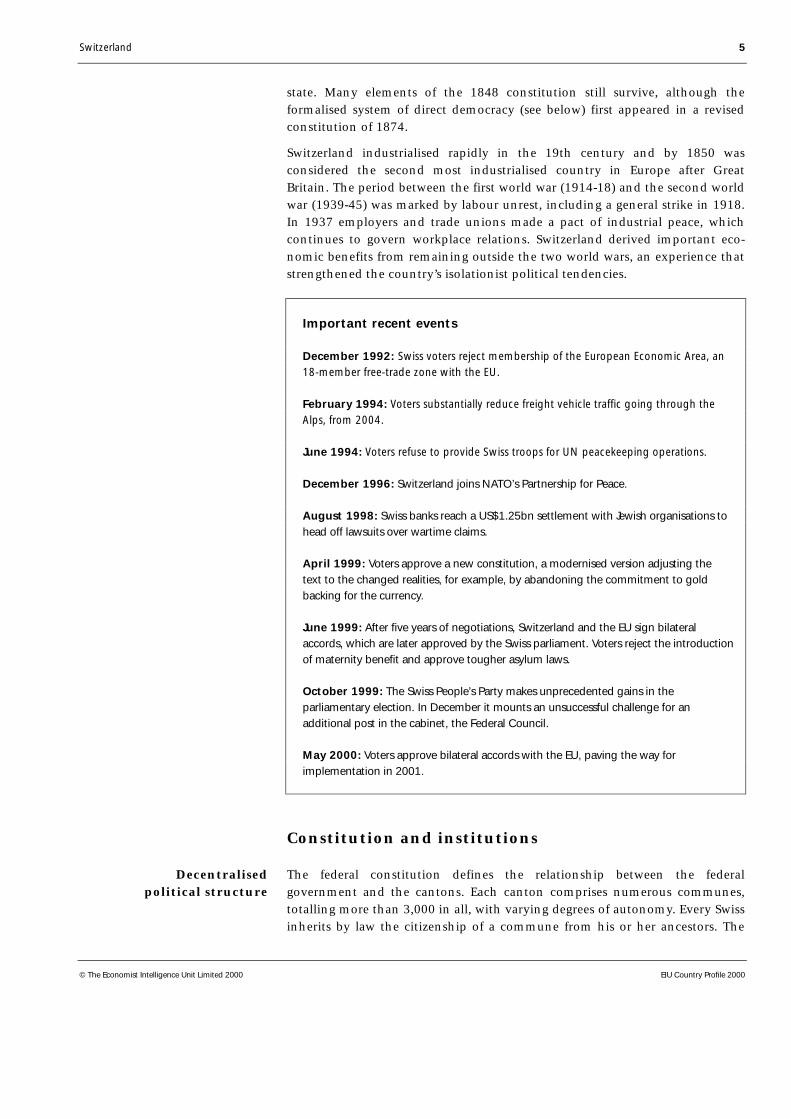
Important recent events
December 1992: Swiss voters reject membership of the European Economic Area, an18-member free-trade zone with the EU.
February 1994: Voters substantially reduce freight vehicle traffic going through theAlps, from 2004.
June 1994: Voters refuse to provide Swiss troops for UN peacekeeping operations.
December 1996: Switzerland joins NATO’s Partnership for Peace.
August 1998: Swiss banks reach a US$1.25bn settlement with Jewish organisations tohead off lawsuits over wartime claims.
April 1999: Voters approve a new constitution, a modernised version adjusting thetext to the changed realities, for example, by abandoning the commitment to goldbacking for the currency.
June 1999: After five years of negotiations, Switzerland and the EU sign bilateralaccords, which are later approved by the Swiss parliament. Voters reject the introductionof maternity benefit and approve tougher asylum laws.
October 1999: The Swiss People’s Party makes unprecedented gains in theparliamentary election. In December it mounts an unsuccessful challenge for anadditional post in the cabinet, the Federal Council.
May 2000: Voters approve bilateral accords with the EU, paving the way forimplementation in 2001.
Constitution and institutions
The federal constitution defines the relationship between the federalgovernment and the cantons. Each canton comprises numerous communes,totalling more than 3,000 in all, with varying degrees of autonomy. Every Swissinherits by law the citizenship of a commune from his or her ancestors. The
Decentralisedpolitical structure

6 Switzerland
EIU Country Profile 2000 © The Economist Intelligence Unit Limited 2000
federation guarantees Switzerland’s independence, maintains peace and orderat home, protects the freedom and rights of the individual, and promotes thecommon welfare. The federal government is responsible for foreign policy,defence, pensions, post, telecommunications, railways and currency. Every-thing that is not specifically in the hands of the federal government is theresponsibility of the cantons, including education, utilities, roads (exceptnational highways), hospitals and most of the judiciary. Fiscal powers ofcantons and communes are also far-reaching, while the powers of the federalgovernment to levy taxes are relatively restricted.
Government at both the federal and cantonal level is divided into independentlegislative, executive and judicial functions. At the federal level, the authoritiesare the Bundesversammlung/Assemblée fédérale (Federal Assembly), theBundesrat/Conseil fédéral (Federal Council) and the Bundesgericht/Tribunalfédéral (Federal Court). The federal executive and legislature are weak com-pared with other European countries, because many functions rest with thecantons and because of the extensive direct democratic rights of the electorate.
Forms of direct democracy in Switzerland
• An initiative enables the people to propose changes to the federal or cantonalconstitutions and to cantonal and communal legislation. On the federal level, a proposalbacked by the signatures of 100,000 voters must be put to the whole electorate and isaccepted if approved by a majority of those voting and by a majority of cantons.
• A referendum allows the Swiss people to vote on legislative and constitutionalchanges. Any law passed by both houses may be submitted to a referendum if requiredby eight cantons or 50,000 registered voters. A referendum is mandatory forconstitutional changes and some international agreements.
The number of initiatives and referendums has increased greatly in recent years, with anaverage of three votes on about ten separate issues annually at the federal level alone.But voter turnout has declined and rarely exceeds one-third to one-half of those eligible.In early 1999 parliament postponed discussion of government proposals to increase, by50,000, the number of signatures required for referendums and initiatives. The planfaced resistance particularly from the Swiss People’s Party (PP), but even if approvedeventually, it would not significantly reduce the inhibiting effect of referendums on Swissforeign policy and domestic politics. More fundamental would be the restraints imposedon direct democracy if Switzerland were to join the EU, as voters would not have theright to overturn European law or policy.
The Federal Assembly (parliament) has two chambers, the National Council(lower house) and the Council of States (upper house), elected every four years.The National Council, with 200 members, is elected by proportional repre-sentation in most cantons. The Council of States comprises two representativesfrom each of the 20 full cantons and one representative from each of the sixhalf-cantons. For a proposal to be passed, a majority in each chamber ofparliament has to approve it. Party affiliation is not strictly enforced.
Federal institutions

Switzerland 7
© The Economist Intelligence Unit Limited 2000 EIU Country Profile 2000
The Federal Council is the executive authority. Each of its seven members is thehead of a department or ministry. One member of the Federal Council iselected in rotation as president for one year, mainly for representative pur-poses. The federal councillors are elected individually by, but not necessarilyfrom, parliament for a renewable term of four years.
Since 1959 the Federal Council has been made up of two representatives eachfrom the RDP, the CDP and the SDP, and one representative from the PP. Thisallocation is supposed to maintain a geographic and linguistic balance betweenthe German, French and Italian-speaking regions. The federal councillors makeimportant decisions jointly and must accept collective responsibility for thesedecisions, notwithstanding individual party policy.
Responsibility for the judiciary lies mainly with the cantons, while the FederalCourt in Lausanne, composed of 30 judges elected by the Federal Assembly fora renewable six-year term, is the only major judiciary institution on the federallevel. It is the final court of appeal for the application of federal law, ensuringthat the same federal statutes are not interpreted differently across cantons.Cantonal courts and the Federal Court have the right to examine whethercantonal laws breach the federal constitution and to annul them. However, asimilar procedure for the examination of federal law does not exist.
The federal ministries
Ministry Minister
Defence & sport Adolf Ogia (PP)Economic affairs (incl agriculture, employment & industry) Pascal Couchepin (RDP)Finance Kaspar Villiger (RDP)Foreign affairs Joseph Deiss (CDP)Home affairs (incl social security, science & culture) Ruth Dreifuss (SDP)Justice & police (incl refugees) Ruth Metzler (CDP)Environment, transport, energy & communications Moritz Leuenberger (SDP)
a Current holder of the one-year rotating federal presidency.
Political forces
A two-party system, with the Liberals in government and the Conservativesplaying the role of the opposition, existed at the beginning of the federation,but a number of parties developed out of factions of the Liberal Party, and in1891 the Conservatives joined the Liberals in government. This “bourgeois”coalition ruled until 1943, when the two parties were joined for the first timeby the Social Democrats. Most of the political parties are organised on acantonal basis, with a fairly weak national structure. Aside from theirparliamentary representation, the parties are consulted, along with otherinterest groups, on all proposed federal legislation. However, the role of partyorganisations in policymaking is limited.
The judicial system
8 Switzerland
EIU Country Profile 2000 © The Economist Intelligence Unit Limited 2000
The Radical Democratic Party (RDP) inherited the mantle of the LiberalParty, the leading political party from 1848 to 1900. A centre-right party with aliberal stance on economic policy, it is close to business circles. The Radicalsback EU membership in the long term.
The Christian Democratic Party (CDP) developed from the originalConservative opposition and remains strong in the traditionally Catholicfrancophone cantons. The CDP’s political platform tends to be conservativeand paternalistic, and favours a more active foreign policy, includingparticipation in a collective European security structure and EU membership.
The Social Democratic Party (SDP), another offshoot of the Liberal Party,is a socialist party embracing a fairly wide spectrum of left-leaning views. Policydemands include a reduction in military spending, EU membership andexpanding the welfare state.
The Swiss People’s Party (PP) also derives from the old Liberal Party, andthis origin is still noticeable for the moderate wing of the party. However, themore radical faction with its populist, nationalistic, right-wing platform is nowthe dominant force in the party, and its anti-welfare, anti-EU and anti-UNposition has enabled the PP to draw voters from radical right-wing parties out-side the federal coalition. The PP has a strong base among farmers and smallbusinesses in German-speaking areas.
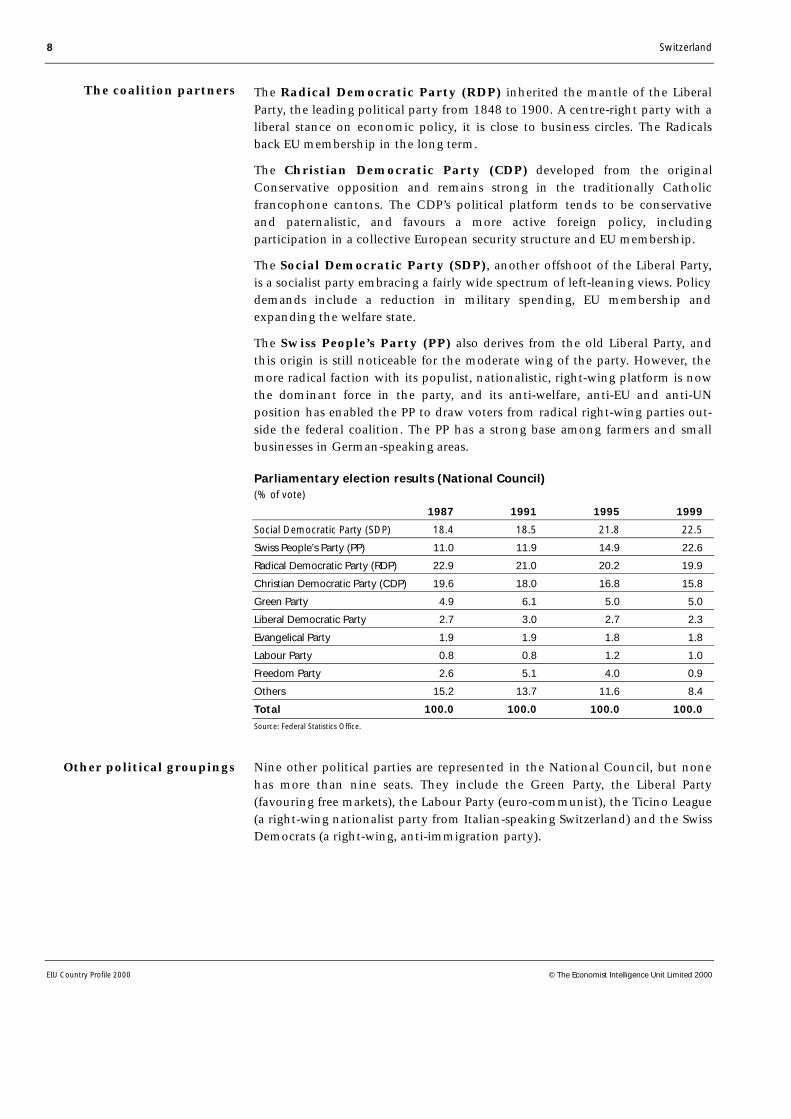
Parliamentary election results (National Council)(% of vote)
1987 1991 1995 1999
Social Democratic Party (SDP) 18.4 18.5 21.8 22.5
Swiss People’s Party (PP) 11.0 11.9 14.9 22.6
Radical Democratic Party (RDP) 22.9 21.0 20.2 19.9
Christian Democratic Party (CDP) 19.6 18.0 16.8 15.8
Green Party 4.9 6.1 5.0 5.0
Liberal Democratic Party 2.7 3.0 2.7 2.3
Evangelical Party 1.9 1.9 1.8 1.8
Labour Party 0.8 0.8 1.2 1.0
Freedom Party 2.6 5.1 4.0 0.9
Others 15.2 13.7 11.6 8.4
Total 100.0 100.0 100.0 100.0
Source: Federal Statistics Office.
Nine other political parties are represented in the National Council, but nonehas more than nine seats. They include the Green Party, the Liberal Party(favouring free markets), the Labour Party (euro-communist), the Ticino League(a right-wing nationalist party from Italian-speaking Switzerland) and the SwissDemocrats (a right-wing, anti-immigration party).
The coalition partners
Other political groupings

Switzerland 9
© The Economist Intelligence Unit Limited 2000 EIU Country Profile 2000
Main political figures
Christoph Blocher (PP): Switzerland’s most prominent Eurosceptic and isolationist,leading the PP’s cantonal organisation in Zurich and representing the party in theNational Council. A charismatic politician and successful industrialist, he has strengthenedthe more radical wing of the PP.
Christiane Brunner (SDP): Unconventional trade union leader and women’s rightsactivist, rejected by Parliament as SDP candidate for the Federal Council in 1993 after astrong personal campaign against her. Now one of Geneva’s representatives in theCouncil of States and a popular figure within the country’s largest party, representing itsleft wing. She has announced her plan to stand for party leader at the party congress inOctober 2000.
Pascal Couchepin (RDP): Elected to the Federal Council in March 1998. Formermayor of Martigny in the canton of Valais. Firm supporter of economic liberalisation andderegulation, so that he is in frequent conflict with the SDP and received the lowestsupport of all Federal Councillors at the government’s re-election in December 1999.
Joseph Deiss (CDP): Foreign minister since March 1999. Bilingual (French/German)economics professor from Fribourg University. Has set UN membership as a target.
Ruth Dreifuss (SDP): Interior minister since 1993 and, in 1999, the first woman tohold the rotating Swiss presidency. A former trade unionist, she was the first personfrom Switzerland’s tiny Jewish community to be elected to the Federal Council.Ostensibly from Geneva (to qualify as a francophone) but actually born in German-speaking Aargau. Dealing with the politically sensitive issues of social security andpensions reform.
Moritz Leuenberger (SDP): Head of environment, transport, communications andenergy ministry, elected in 1995. A German-speaker who came to prominence in 1989,when he chaired a parliamentary commission investigating secret files held by the policeon over 900,000 Swiss and foreign residents.
Ruth Metzler (CDP): Elected in March 1999, taking over the justice and policeministry from Arnold Koller as Switzerland’s youngest-ever minister. A lawyer fromGerman-speaking Appenzell-Innerrhoden, Switzerland’s smallest (half-) canton, sheplaces particular emphasis on asylum policy.
Adolf Ogi (PP): Former director of the Swiss Skiing Association, transport minister in1988-95 and now defence minister. Popular German-speaking pro-European with verydifferent views from his fellow PP member, Mr Blocher. In charge of reformingSwitzerland’s army and seeking to have more Swiss troops engaged in internationalpeacekeeping.
Franz Steinegger (RDP): As party president, Mr Steinegger, a lawyer from canton Uri,is regarded as a key figure in determining whether the RDP will move to the right in anattempt to regain its position as the largest conservative party.
Kaspar Villiger (RDP): German-speaker from Lucerne, defence minister in 1989-95and now finance minister with the task of balancing the budget.
10 Switzerland
EIU Country Profile 2000 © The Economist Intelligence Unit Limited 2000
International relations and defence
Situated in the heart of Europe, Switzerland inevitably has close economic tieswith the EU, by far its most important trading partner, but political links withthe EU have developed only gradually. Large parts of the population fear thatjoining the union would reduce their cherished direct-democratic rights andlead to a sharp inflow of foreigners.
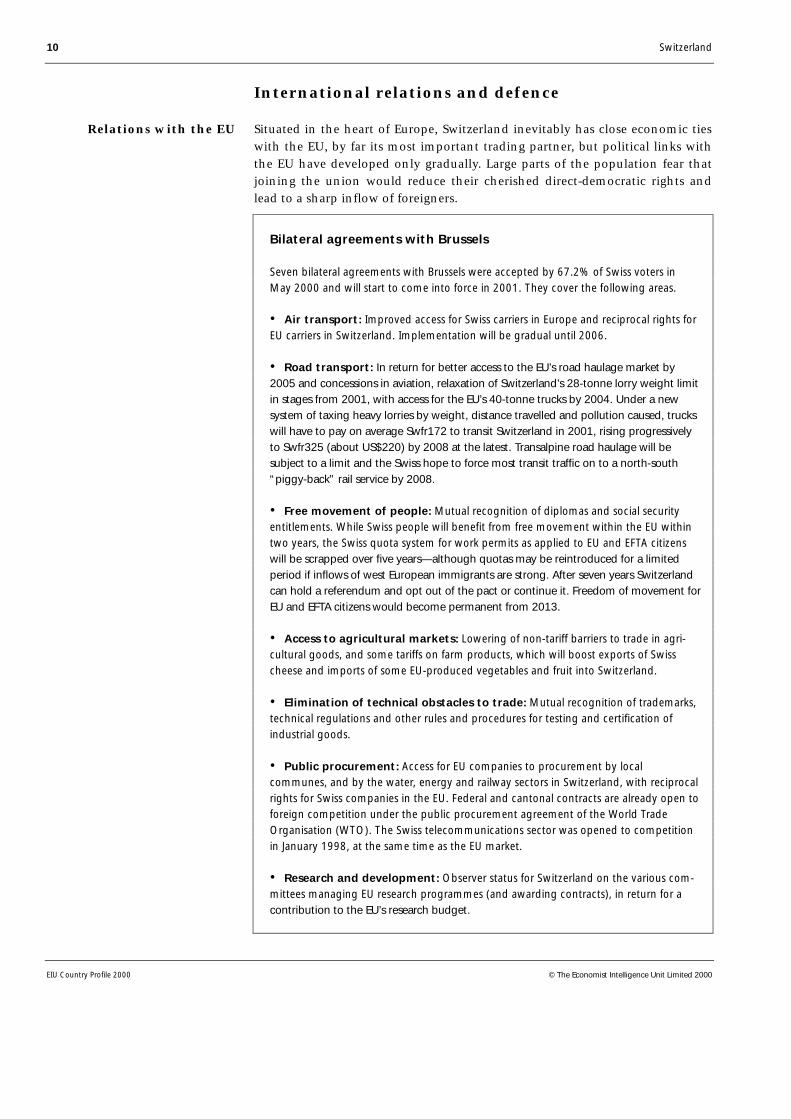
Bilateral agreements with Brussels
Seven bilateral agreements with Brussels were accepted by 67.2% of Swiss voters inMay 2000 and will start to come into force in 2001. They cover the following areas.
• Air transport: Improved access for Swiss carriers in Europe and reciprocal rights forEU carriers in Switzerland. Implementation will be gradual until 2006.
• Road transport: In return for better access to the EU’s road haulage market by2005 and concessions in aviation, relaxation of Switzerland’s 28-tonne lorry weight limitin stages from 2001, with access for the EU’s 40-tonne trucks by 2004. Under a newsystem of taxing heavy lorries by weight, distance travelled and pollution caused, truckswill have to pay on average Swfr172 to transit Switzerland in 2001, rising progressivelyto Swfr325 (about US$220) by 2008 at the latest. Transalpine road haulage will besubject to a limit and the Swiss hope to force most transit traffic on to a north-south“piggy-back” rail service by 2008.
• Free movement of people: Mutual recognition of diplomas and social securityentitlements. While Swiss people will benefit from free movement within the EU withintwo years, the Swiss quota system for work permits as applied to EU and EFTA citizenswill be scrapped over five years—although quotas may be reintroduced for a limitedperiod if inflows of west European immigrants are strong. After seven years Switzerlandcan hold a referendum and opt out of the pact or continue it. Freedom of movement forEU and EFTA citizens would become permanent from 2013.
• Access to agricultural markets: Lowering of non-tariff barriers to trade in agri-cultural goods, and some tariffs on farm products, which will boost exports of Swisscheese and imports of some EU-produced vegetables and fruit into Switzerland.
• Elimination of technical obstacles to trade: Mutual recognition of trademarks,technical regulations and other rules and procedures for testing and certification ofindustrial goods.
• Public procurement: Access for EU companies to procurement by localcommunes, and by the water, energy and railway sectors in Switzerland, with reciprocalrights for Swiss companies in the EU. Federal and cantonal contracts are already open toforeign competition under the public procurement agreement of the World TradeOrganisation (WTO). The Swiss telecommunications sector was opened to competitionin January 1998, at the same time as the EU market.
• Research and development: Observer status for Switzerland on the various com-mittees managing EU research programmes (and awarding contracts), in return for acontribution to the EU’s research budget.
Relations with the EU
Switzerland 11
© The Economist Intelligence Unit Limited 2000 EIU Country Profile 2000
A member of the European Free-Trade Association (EFTA), Switzerland has hada free-trade agreement with the European Economic Community (EEC, nowEU) since 1972, and there are over 100 other agreements with Brussels onpractical issues such as rules of origin and tackling customs fraud. In May 1992the Federal Council submitted an application for membership, but theaccession process was halted after Swiss voters narrowly rejected Switzerland’sproposed accession to the European Economic Area (EEA), which allows non-EU members to participate in the European single market, in December 1992.
Following parliamentary approval and a referendum in May 2000, a newpackage of bilateral accords with the EU (see box) will start to be implementedin 2001, reducing the country’s economic isolation. The government claimsthey could add Swfr8bn (US$5.2bn), or 2%, to Swiss GDP over a decade.Although the agreements have eliminated many of the economic disadvant-ages of remaining outside of the EU, the government has maintained that EUmembership is “a long-term strategic objective”. It is ruling out any formalmoves in that direction for the duration of the 1999-2003 legislature, hopingthat over time public opinion will warm to the idea of EU accession. However,a people’s initiative demanding the instant reactivation of Switzerland’sapplication for EU membership, filed in 1996 and due to be put to areferendum no later than 2001, leaves European policy very much at the centreof public debates.
Although Switzerland is host to, and participates in, a number of UN agencies,it is not a member of the organisation and only has observer status in the UNGeneral Assembly. In 1992 it became a member of the IMF and the WorldBank, after approval by voters in a referendum, and it is a full member of theOECD, the Council of Europe, the Organisation for Security and Co-operationin Europe (OSCE), the World Trade Organisation (WTO) and EFTA. The FederalCouncil is reactivating a campaign to join the UN, which is likely to lead to areferendum on UN membership in 2002 after three-quarters of Swiss votersrejected a similar attempt in 1986. Although the government believes publicopinion has shifted since the end of the cold war, it faces strong oppositionfrom critics, notably in the Swiss People’s Party, who argue that UNmembership is incompatible with neutrality.
In August 1998 the two big Swiss banks—Union Bank of Switzerland (UBS) andCredit Suisse—agreed to pay US$1.25bn to settle the dispute with Jewishorganisations over Switzerland’s treatment of gold looted by the Nazis duringthe second world war and the assets of Jewish victims of the Holocaust. Thedeal removes all claims against other Swiss banks, industry, the Swiss govern-ment and the Swiss National Bank, as well as financial sanctions imposed orthreatened by US state and local financial officials. After its conclusive forensicaudit (which banks claim has cost them up to Swfr1bn) the Volcker com-mission recommended publication of the details of 26,000 accounts with aprobable relationship to victims of the Holocaust, although the total numberwith a “probable or possible” relationship was estimated at 45,000-50,000.
Swiss and other European insurance companies are on the way to settling out-standing claims from the wartime era under the aegis of the International
Nazi gold and Jewish assets
Other international bodies
12 Switzerland
EIU Country Profile 2000 © The Economist Intelligence Unit Limited 2000
Commission on Holocaust Era Insurance Claims, which in February 2000launched its campaign to find surviving claimants. Other initiatives under-taken by the Swiss government to uncover the truth and return assets to theirrightful owners are drawing to a close. The settlement of Nazi era claims hasbeen a priority for the Swiss government, as Swiss entanglement in and allegedbenefits from the Holocaust have severely tarnished the reputation of thecountry. However, plans to set up a Solidarity Foundation, a cornerstone of thegovernment’s strategy to secure full international rehabilitation forSwitzerland’s wartime role, are still struggling for political approval.
Since 1945 Switzerland has stayed politically aloof within western Europedespite stronger economic ties. However, the end of the cold war in 1989 hasprompted a heated and durable debate on the role of Swiss neutrality. Thegovernment favours a relaxed interpretation of neutrality (constrained only bya policy of non-involvement in foreign wars), giving it a freer hand in inter-national dealings.
However, the Swiss people have been wary of abandoning traditional notionsof neutrality. Many still believe that Switzerland should minimise its involve-ment in foreign affairs, and in June 1994 voters refused a proposal to providetroops for UN peacekeeping operations. Although Switzerland joined NATO’sPartnership for Peace in December 1996, this decision was not subject to areferendum. The partnership aims to promote closer military ties betweenNATO members and outside countries. Switzerland also provides unarmedmilitary observers for some UN operations (including Bosnia, Korea and theMiddle East). Government proposals to use troops for a wider range of peace-keeping missions—and to arm soldiers serving abroad—remain highlycontroversial.
A government-sponsored commission on Switzerland’s future defence needs(the Brunner commission) in its report published in 1998 argued the case for ashift towards a more professional army and more international engagement tomeet the major external threats now facing Switzerland—notably organisedcrime, terrorism and arms proliferation. Following broadly along these lines,the government presented its framework for the reform of the armed forces inJune 2000. The plans include a reduction of the army personnel from 385,000in 1999 to 100,000-120,000, of which 80,000 would be in the reserve, whilethe number of professional soldiers would be raised to not more than 8,000,from 3,500 in 1999. Military service will remain compulsory for all Swiss menin good health, but the age at which reserve duties end, currently 42, will belowered to about 30-32.
Defence expenditure has been falling steadily over the 1990s—the 2000 budgetallocates Swfr4.8bn to defence, compared with over Swfr6bn in 1990. In 1999defence spending amounted to Swfr5bn, equivalent to 11% of centralgovernment (confederation) spending and about 1.4% of GDP. However, thetrue figure, which includes the cost to firms of employees away on compulsoryarmy training (estimated by the defence ministry at Swfr7.5bn), is far higher.Even on official figures, Switzerland spends more per head on defence than anyother non-nuclear European country except Norway. Switzerland also has a
Neutrality and defence
Switzerland 13
© The Economist Intelligence Unit Limited 2000 EIU Country Profile 2000
comprehensive civil defence system that requires each commune to establish alocal civil defence organisation and to provide for sufficient nuclear shelters forthe entire population.
Military forces, 1999
Army/air forceProfessional soldiers 3,500Reserves 385,000Total 388,500
Source: International Institute for Strategic Studies, The Military Balance 1999/2000.
Resources and infrastructure
Population
Like other European countries, Switzerland has an ageing population, with adeclining birth rate and rising life expectancy (which, at 82 years for womenand 76 years for men, is among the highest in the world for both sexes).Population growth therefore has mainly been driven by immigration, andforeign workers make up around one-fifth of the total labour force—the secondhighest proportion in western Europe after Luxembourg. During the 1990simmigration fell from a net inflow of 56,600 in 1990 at the height of the lasteconomic boom to a net outflow of 2,600 in 1997, but it then recovered to anet inflow of 10,700 in 1998 and 23,400 in 1999.
Switzerland’s foreign population increased by 159,000 between 1990 and 1999to 1,404,400. In earlier decades economic factors were the primary drivingforce of immigration, but in the 1990s family reasons became increasinglyimportant. In 1999 foreign families following immigrants already inSwitzerland and immigrants moving to join their Swiss spouses accounted for45% of total immigration, while labour market factors made up only 21.9%.(Historical data on population are given in Reference table 1.)
The large number of foreigners in Switzerland is partially attributable to thecountry’s strict naturalisation rules, although some relaxation took place in1992, allowing double citizenship and easing restrictions on spouses of Swisscitizens. Naturalisation was a major reason for the increase in the number ofSwiss citizens by 127,700 to 5,756,000 in 1990-99, but half of those categorisedas foreigners have lived in Switzerland for more than 15 years or were bornthere. More than 70% of the foreign population has permanent resident status,which entitles them to virtually all the benefits of living in Switzerland exceptthe right to vote.
Italians are the largest single group of foreign nationals, although their share inthe foreign population halved from over 50% in 1975 to 25% in 1998. Citizensof the former Yugoslavia, whose numbers increased sharply during the 1990s,are now the second largest group with a 24% share.
Immigration has drivenpopulation growth
Low naturalisation rate

14 Switzerland
EIU Country Profile 2000 © The Economist Intelligence Unit Limited 2000
The federal government imposes quotas on the numbers of annual andseasonal work permits that can be issued by the cantons. During the 1990sSwitzerland operated a “three circles” policy, which gave preference to EU andEuropean Free-Trade Association (EFTA) citizens, followed by citizens ofcountries with a tradition of sending workers to Switzerland (such as formerYugoslavia). Other countries were classified in the third circle. This policy,criticised as racist, has given way to one that gives EU and EFTA citizens, whomake up 60% of foreigners in Switzerland, priority over all other nationalities.They can earn permanent resident status after five years of work with anannual permit. Moreover, restrictions on EU citizens will be further reduced asa result of the bilateral agreements with the EU, which include an accord onthe free movement of persons. Switzerland has committed itself to abolishingquotas for EU citizens five years after the bilateral agreements come into forcein 2001.
Although Switzerland is generally a relatively tolerant place, every so oftenright-wing groups launch initiatives to restrict immigration. Until now theseinitiatives have remained unsuccessful, but the government has neverthelessacted to tighten asylum procedures following a surge in asylum seekers, whosenumbers reached a record 46,000 in 1999 in the wake of the Kosovo crisis. At171,000, Switzerland now has more asylum seekers in relation to its populationthan any other European country, and last year it spent around US$1bn ontheir care.
Resident population by age and nationality, 1999a
(‘000)
Age group 0-19 1,66120-39 2,09240-64 2,31365+ 1,095
Total 7,160 Swiss 5,756 Foreign 1,404
a Preliminary; year-end.
Source: Federal Statistics Office.
Education
The cantons are responsible for primary and secondary schooling, which iscompulsory between the ages of seven and 16. Over 80% of the working-agepopulation has completed upper secondary education, the third highest pro-portion in the OECD. This attests to the high skills level of the workforce.
There are two federal polytechnics in addition to eight cantonal universitiesand seven regional colleges of higher education offering tertiary degree-levelvocational training. Switzerland has one of the lowest proportions of universitygraduates of any OECD country, at 8%, but many young people study fortertiary professional qualifications that in some countries would count as
Immigration policy favoursEU and EFTA citizens
Asylum procedures havebeen tightened

Switzerland 15
© The Economist Intelligence Unit Limited 2000 EIU Country Profile 2000
university degrees. Taking into account all tertiary qualifications, Swiss attain-ment at 23% of the working-age population is around the OECD average.There nevertheless continues to be an imbalance between qualifications gainedby men and by women. In 1998 one-third of men aged 25-34 had tertiaryqualifications compared with 15% of women, and the disparity increaseswith age.
Switzerland gives its children a solid basic education, with a strong emphasison vocational training in schools, colleges and traditional apprenticeships. Inaddition, at any time about one-third of the workforce is following some kindof continuing education or training. Schools are generally well-funded, whileSwiss teachers’ salaries are among the highest in the industrialised world. Notsurprisingly, the quality of education is high, as international comparisons ofattainment confirm. In the tertiary sector Switzerland can boast some world-class faculties, but there continues to be wasteful duplication between cantons.Moreover, while the universities themselves are publicly funded, studentsreceive little help with subsistence costs. As in many other European countries,there is a high drop-out rate from tertiary education, with about a quarter ofstudents failing to complete their studies.
Health
The healthcare system in Switzerland is based on private provision, whichsupplies high-quality but expensive services. In 1996 private medical insurancewas made compulsory for all Swiss residents, with new rules requiringinsurance companies to charge the same adult premium for basic treatment,regardless of sex, age or state of health. Premiums, which vary by canton andcompany, have since risen sharply (by 20-25% in 1996, 12% in 1997 and 5% in1998) and their cost has become an important political issue, despite subsidiesfor the less well-off. The new insurance rules were accompanied by measures tocut the escalating costs of health services, especially hospital charges and theprice of medicines. However, these measures have had only a small impact onpremiums, which—after a 3.4% increase in 1999—are predicted to rise byabout 4% in 2000.
At 10.1% of GDP, health spending is high by OECD and European standards,surpassed only by Germany (10.5%) and the US (14.2%). In terms of spendingper head, Switzerland comes top of the European league, at US$2,574 perperson in 1997 (measured in US dollars at purchasing power parity). Spendingper person has nearly doubled since 1985, reflecting a rapid rise in costs. Forbasic health insurance, premiums cover 71% of pay-outs, contributions frompublic authorities about 14% and direct payments by patients about 13%.However, including the payment of insurance premiums, households fundedtwo-thirds of their own health treatment in 1996.

16 Switzerland
EIU Country Profile 2000 © The Economist Intelligence Unit Limited 2000
Natural resources and the environment
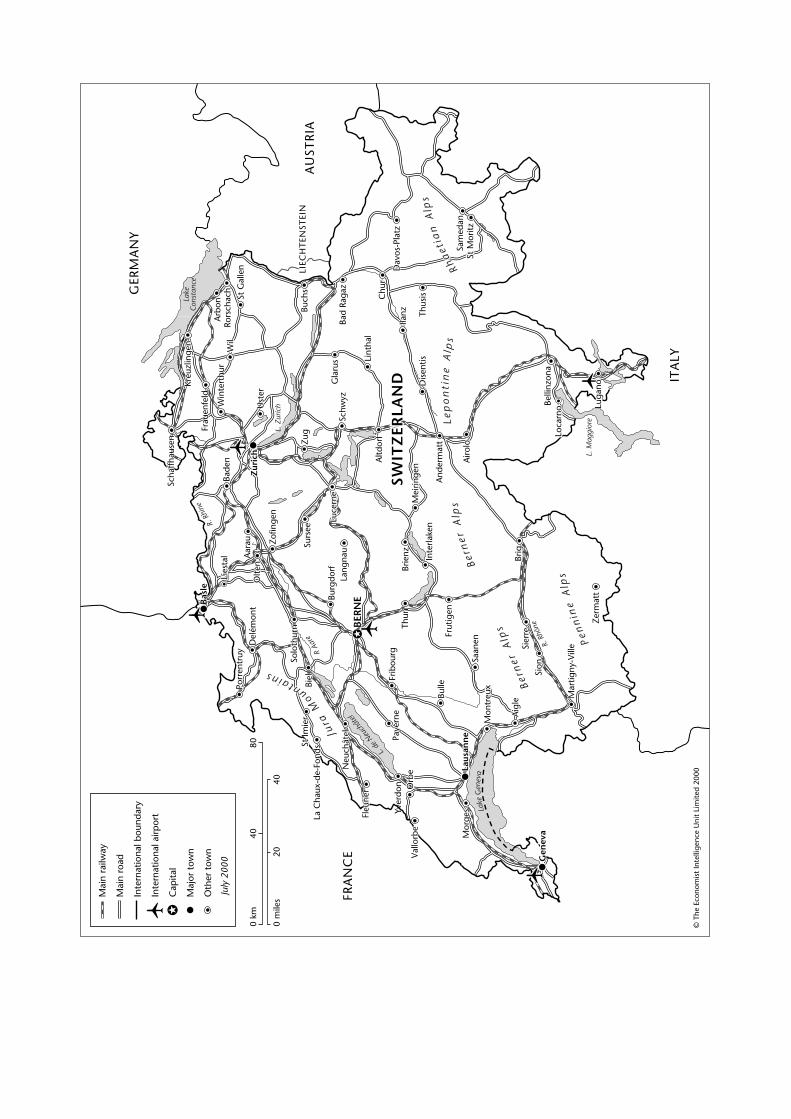
More than half of Switzerland is covered by the Alpine massif, while the Juramountains form a spine along its northern flank. The main industrial centresand the most productive farms are concentrated in the long strip of relativelylow-lying land that runs from Geneva in the west through Zurich to St Gallenin the east. The Rhone and Rhine rivers rise in the Swiss Alps, and Basle on theRhine is an important river port. Otherwise waterways are not used forcommercial traffic. Switzerland’s many lakes, of which Lake Geneva is thebiggest, support small-scale fishing and a wide variety of leisure activities.
Switzerland’s highest peak is Monte Rosa (4,634 metres) while its best-knownAlpine landmark, the Matterhorn near Zermatt, is 4,478 metres high. The Alpsprovide hydroelectricity, Switzerland’s only energy resource. The country hasno minerals or other deposits to speak of, and much of its farmland is on fairlybarren uplands. Of Switzerland’s total land area of 41,284 sq km, 30% iscovered by forest and woods, 40% is farmed, 6% is built upon and 26% isunproductive. In practice, this means that much of Switzerland remainsunspoilt by development and retains its picture-postcard prettiness.
Transport and communications
Switzerland has excellent domestic and international communications, with a1,500-km well developed motorway and a trunk road network that links themajor cities. However, in the wake of the 1994 constitutional amendmentcommitting the country to protect the Alpine environment and to reduce roadtransit freight traffic massively by 2004, the federal government decided not toexpand the road capacity of the four principal transalpine crossings: theGotthard, Saint-Bernard, Simplon and Great-Saint-Bernard routes.
Although the rate of car ownership is one of the highest in the world, with onecar for every two people, the Swiss make extensive use of the 5,000-km railwaynetwork, which runs with legendary precision. In 1995, 13% of person-kmtravelled were by rail, double the proportion in France or Germany. Despite adownward trend in market share, the difference in the transport of goods iseven more marked, with 39% of tonne-km carried by rail in Switzerland in1995, compared with 23% in France and 20% in Germany. (For transport datasee Reference table 4.)
The Swiss Federal Railways, which are heavily subsidised by the federal govern-ment and the cantons to the tune of over Swfr1.2bn (US$800m) a year, are inthe process of restructuring, but privatisation is not yet on the horizon. Sincethe start of the 1990s the workforce has shrunk by 7,500 to 28,300, and morejobs are scheduled to go in the next few years. In 1997 the federal railways splittheir operations into two divisions, infrastructure and transport, paving theway for a more market-oriented approach, and following a Swfr12bn debtwrite-off by the federal government, the railways ceased to be part of the federaladministration. They are now a state-owned limited company with much morefreedom to act as a commercial business in the wider European market.
Road and rail system ishighly developed
Rail and roadtransport policy
Switzerland 17
© The Economist Intelligence Unit Limited 2000 EIU Country Profile 2000
To accommodate EU demands to allow cargo transit through Switzerland whilerespecting the constitutional commitment to the protection of the Alpineenvironment, Switzerland has a long-term policy of shifting freight traffic fromroad to rail. Switzerland pledged to undertake a massive transalpine rail tunnelproject (known by its German acronym as NEAT) to accommodate risingnorth-south transit freight traffic. The two new tunnels to be constructedunder the Gotthard massif and the Lötschberg represent a Swfr30bn invest-ment for Switzerland over 20 years, to be financed mostly by higher taxes andcharges. The Lötschberg tunnel in western Switzerland is expected to open in2006 and the Gotthard about six years later.
In addition to enhancing rail transport capacities, the reduction of Alpinetransit traffic, decided in the 1994 referendum, is being implemented througha non-discriminatory system of charging heavy lorries. This was an importantelement in its bilateral negotiations with the EU. The new charging system isexpected to raise eight times as much revenue as current lorry taxes, and a highproportion of the Swfr1.5bn annual revenue will go towards financing NEAT.The government is also considering extra subsidies to the railways ofSwfr100m-200m a year to make the cost of rail freight more attractive incomparison with that of road transport.
Switzerland has two main civil airports, at Zurich and Geneva, with smallerairports at Basle, Lugano and Berne, the capital. Zurich, which is the hub forintercontinental flights of the national airline, Swissair, is suffering from severecapacity constraints because of the persistent refusal of local people to approveexpansion plans, although the partial privatisation of the airport later in 2000will help realise plans to double its capacity within four years. Swissair, whichis 20% publicly owned, receives no state subsidies but has been granted amonopoly until 2008 on routes it exploited as of July 1998. Other Swisscompanies may operate routes that Swissair does not serve and will be able tocompete with Swissair on all routes from 2008. Swissair is facing greatercompetition, with two UK-based budget airlines, EasyJet and Go, offeringflights to Switzerland.
Switzerland has the densest telephone network per head in the world and isranked in the world’s top ten for revenue from international calls. By mid-1999there were over 1m Internet users in Switzerland and about 12% of Swisshouseholds had Internet connections, on a par with the UK and Germanyalthough well below the Nordic countries and the US.
The Swiss post, telegraph and telecommunications monopoly, PTT, was splitinto two separate public corporations for post and telecoms in 1997, ahead oftelecoms liberalisation on January 1st 1998. The state telecoms operator,Swisscom, was partly privatised and freed from government control to operateas a commercial business in late 1998, and market liberalisation, timed to keepSwitzerland in line with its EU neighbours, is gradually bringing down theprice of high-quality but expensive Swiss telecoms services.
Swisscom is obliged to give competitors access to its fixed-line network on“fair” interconnection terms, and the Swiss telecoms regulatory authority is
Civil aviation
Telecommunications

18 Switzerland
EIU Country Profile 2000 © The Economist Intelligence Unit Limited 2000
considering plans to allow private operators direct access to homes andbusinesses using advanced radio technology. By 1999 Switzerland had over 100private operators, most of them offering specialist services to businesses.However, two private consortiums are competing with Swisscom on a fullrange of services, using their own fixed-line telecoms networks as well as linerental. In early 1999 Swisscom also lost its former monopoly on mobiletelephone services and now faces competition from various licensed privateoperators. (See Reference table 5 for historical data on telecommunications.)
Energy provision
Switzerland has large resources of hydroelectric power, but they are almost fullyexploited. In 1998 hydroelectric power supplied 56.3% of Swiss electricityproduction of 60.9bn kwh, while the country’s five nuclear power stationsprovided 40%. Conventional thermal stations made up the balance of 3.7%.Switzerland also imports electricity, mostly from French nuclear power plants.
Energy balance, 1999(m tonnes oil equivalent)
Elec-Oil Gas Coal tricity Other Total
Primary supplyProduction 0.0 0.0 0.0 14.8 1.3 16.1Imports 13.7 2.4 0.1 4.8 0.0 21.0Exports –0.5 0.0 0.0 –7.1 0.0 –7.6Stock change 0.0 0.0 0.0 0.0 0.0 0.0Total 13.2 2.4 0.1 12.5 1.3 29.5
Processing & transformationLosses & transfers –5.3 –0.2 0.0 –13.0 –0.3 –18.8Transformation output 5.2 0.0 0.0 4.8 0.0 10.0
Final consumptionTransport fuels 6.7 0.0 0.0 0.2 0.0 6.9Industrial fuels 0.8 0.9 0.1 1.5 0.4 3.7Residential etc 5.0 1.3 0.0 2.7 0.6 9.6Non-energy uses 0.5 0.0 0.0 0.0 0.0 0.5Total 13.0 2.2 0.1 4.4 1.0 20.7
Source: Energy Data Associates.
Between 1990 and 1998 energy consumption rose by 7.8%, twice as fast asGDP. However, this was partly as a result of a jump in energy consumption inthe very cold winter of 1998, which rose by 2.7% for the year as a whole.Energy consumption growth slipped back to 1.7% in 1999, in line with growthin GDP. In a referendum in 1990 the Swiss voted for a ten-year moratorium onthe construction of nuclear power plants, but against a proposal to abandonnuclear power altogether. The government is negotiating closure dates for thefive existing stations, which came on-stream between 1969 and 1984, and hasno plans to build new ones. (For national energy data, see Reference table 6.)
Switzerland’s electricity sector is highly fragmented, with more than 1,000small producers and distributors of hydroelectricity in the mountain cantons.However, 60% of the market is controlled by two main groups. An alliance of
Reliance on hydroelectricand nuclear power
Electricity liberalisationstarting in 2001
Switzerland 19
© The Economist Intelligence Unit Limited 2000 EIU Country Profile 2000
three Swiss energy companies, known as West, in which Electricité de Francehas an interest, supplies the western half of Switzerland, while Electrowatt, inwhich two German electricity companies have a stake, covers the eastern half.The government plans to liberalise Switzerland’s electricity sector in stagesover six years from 2001—catching up with and then overtaking the EU’sliberalisation plans. As a consequence, prices to industrial customers, currentlythe most expensive in Europe, will be cut, but many of the small high-costelectricity companies are expected to merge or disappear. Some will, however,be helped to amortise loss-making investments with the proceeds of an energytax, also due to be introduced in 2001.
The economy
Economic structure
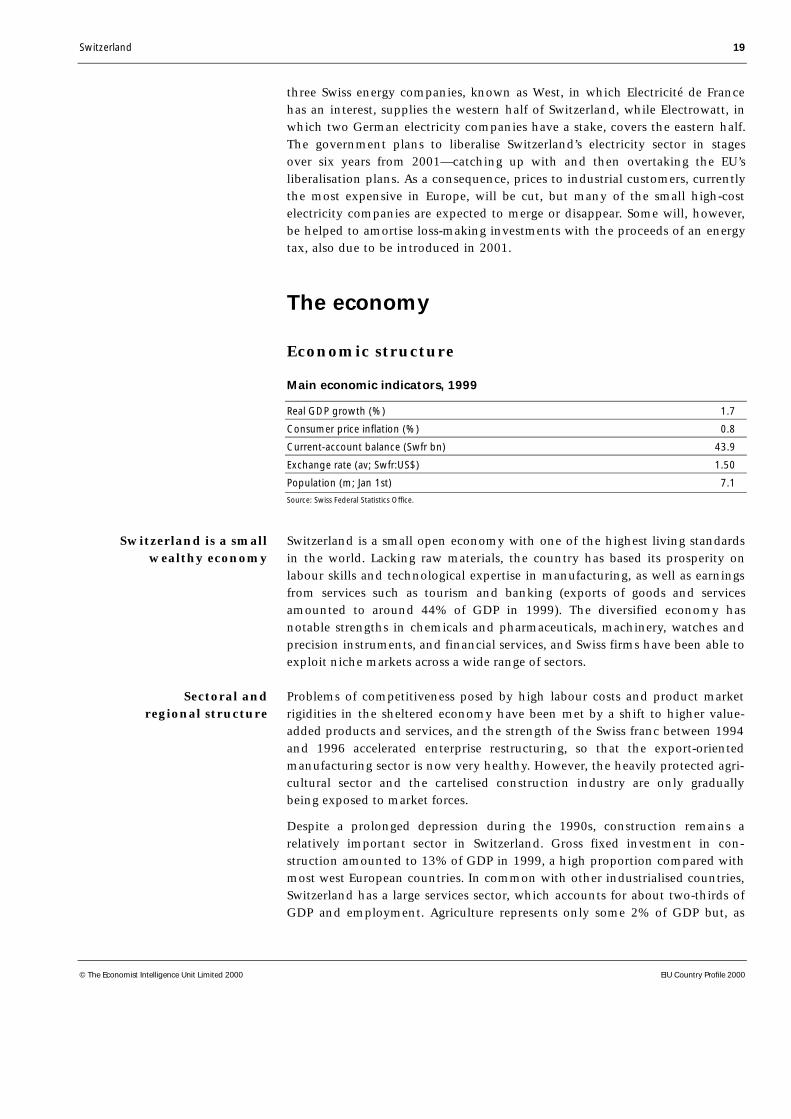
Main economic indicators, 1999
Real GDP growth (%) 1.7
Consumer price inflation (%) 0.8
Current-account balance (Swfr bn) 43.9
Exchange rate (av; Swfr:US$) 1.50
Population (m; Jan 1st) 7.1
Source: Swiss Federal Statistics Office.
Switzerland is a small open economy with one of the highest living standardsin the world. Lacking raw materials, the country has based its prosperity onlabour skills and technological expertise in manufacturing, as well as earningsfrom services such as tourism and banking (exports of goods and servicesamounted to around 44% of GDP in 1999). The diversified economy hasnotable strengths in chemicals and pharmaceuticals, machinery, watches andprecision instruments, and financial services, and Swiss firms have been able toexploit niche markets across a wide range of sectors.
Problems of competitiveness posed by high labour costs and product marketrigidities in the sheltered economy have been met by a shift to higher value-added products and services, and the strength of the Swiss franc between 1994and 1996 accelerated enterprise restructuring, so that the export-orientedmanufacturing sector is now very healthy. However, the heavily protected agri-cultural sector and the cartelised construction industry are only graduallybeing exposed to market forces.
Despite a prolonged depression during the 1990s, construction remains arelatively important sector in Switzerland. Gross fixed investment in con-struction amounted to 13% of GDP in 1999, a high proportion compared withmost west European countries. In common with other industrialised countries,Switzerland has a large services sector, which accounts for about two-thirds ofGDP and employment. Agriculture represents only some 2% of GDP but, as
Switzerland is a smallwealthy economy
Sectoral andregional structure
20 Switzerland
EIU Country Profile 2000 © The Economist Intelligence Unit Limited 2000
elsewhere in Europe, farmers remain a potent political force and the linkedissues of farming and the environment are the subject of lively public debate.
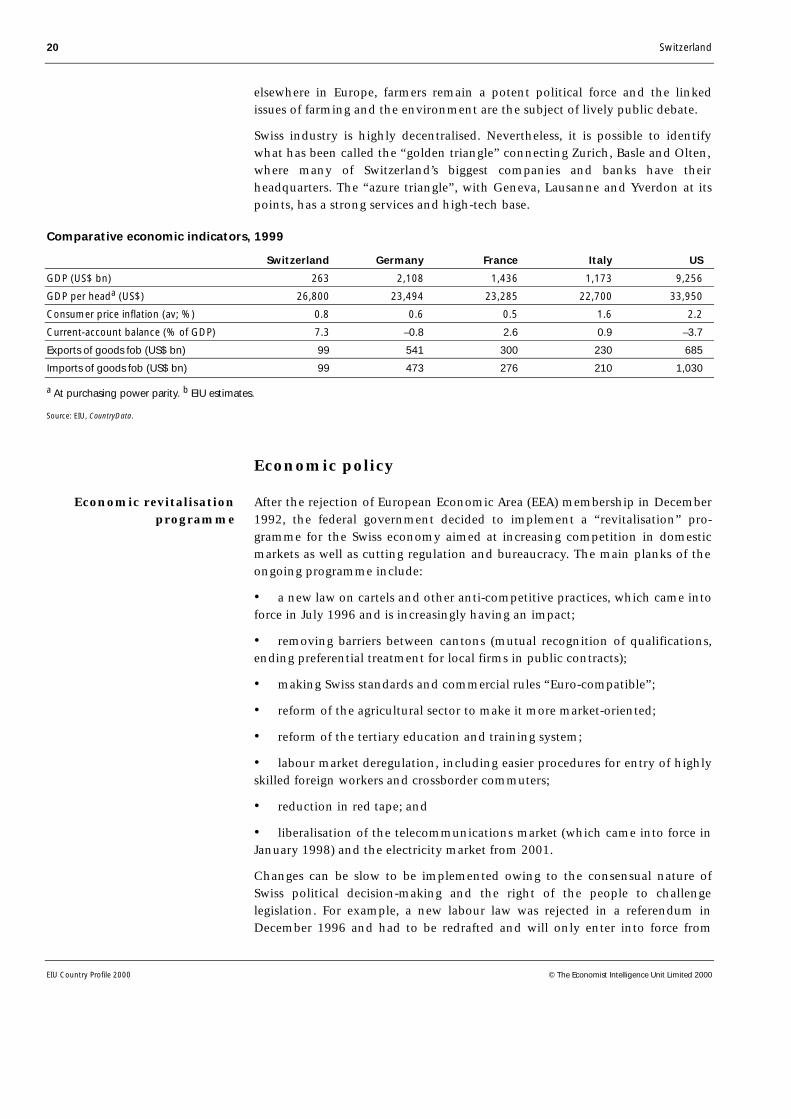
Swiss industry is highly decentralised. Nevertheless, it is possible to identifywhat has been called the “golden triangle” connecting Zurich, Basle and Olten,where many of Switzerland’s biggest companies and banks have theirheadquarters. The “azure triangle”, with Geneva, Lausanne and Yverdon at itspoints, has a strong services and high-tech base.
Comparative economic indicators, 1999
Switzerland Germany France Italy US
GDP (US$ bn) 263 2,108 1,436 1,173 9,256
GDP per heada (US$) 26,800 23,494 23,285 22,700 33,950
Consumer price inflation (av; %) 0.8 0.6 0.5 1.6 2.2
Current-account balance (% of GDP) 7.3 –0.8 2.6 0.9 –3.7
Exports of goods fob (US$ bn) 99 541 300 230 685
Imports of goods fob (US$ bn) 99 473 276 210 1,030
a At purchasing power parity. b EIU estimates.
Source: EIU, CountryData.
Economic policy
After the rejection of European Economic Area (EEA) membership in December1992, the federal government decided to implement a “revitalisation” pro-gramme for the Swiss economy aimed at increasing competition in domesticmarkets as well as cutting regulation and bureaucracy. The main planks of theongoing programme include:
• a new law on cartels and other anti-competitive practices, which came intoforce in July 1996 and is increasingly having an impact;
• removing barriers between cantons (mutual recognition of qualifications,ending preferential treatment for local firms in public contracts);
• making Swiss standards and commercial rules “Euro-compatible”;
• reform of the agricultural sector to make it more market-oriented;
• reform of the tertiary education and training system;
• labour market deregulation, including easier procedures for entry of highlyskilled foreign workers and crossborder commuters;
• reduction in red tape; and
• liberalisation of the telecommunications market (which came into force inJanuary 1998) and the electricity market from 2001.
Changes can be slow to be implemented owing to the consensual nature ofSwiss political decision-making and the right of the people to challengelegislation. For example, a new labour law was rejected in a referendum inDecember 1996 and had to be redrafted and will only enter into force from
Economic revitalisationprogramme

Switzerland 21
© The Economist Intelligence Unit Limited 2000 EIU Country Profile 2000
August 1st 2000. Meanwhile, objections to the government’s proposals forliberalising the electricity market during the consultation stage forced arethink, pushing back the timetable from 1999 to 2001 at the earliest.
The leverage of the federal government to conduct macroeconomic policy isrelatively limited. Monetary policy is in the hands of the Swiss National Bank(SNB, the independent central bank), whose prime concern is a low and stablerate of inflation. Responsibility for taxation is shared with the cantons, and thefederal government’s share of general government tax revenue is the lowest inthe OECD. Although there is a constitutional obligation for all levels of govern-ment to take the cyclical situation into account when formulating budgetaryplans, fiscal policy is not an important element of stabilisation policy, and thetendency of cantons and communes to aim for balanced budgets has oftenimplied a pro-cyclical stance of discretionary policy. The complicated taxsystem, with considerable delays between tax accrual and tax payment, alsomeans that automatic stabilisers are relatively weak, although some progresshas been made in reducing the time lag.
The difficulty of getting tax increases approved by the electorate and sub-stantial tax competition between cantons have resulted in a comparatively lowlevel of overall taxes by European standards. Revenue from taxes and con-tributions to the public social security system amounted to 34% of GDP in1997, compared with an (unweighted) average of 42% for EU countries. Tosome extent, the difference can be explained by the fact that provisions for themandatory private pension insurance schemes, the backbone of the pensioninsurance system, are not included in the figure, although they are heavilyregulated. However, given that the pension entitlements acquired are directlylinked to the contributions paid, it is fair to interpret the contributions more assavings than as taxes.
Public deficits and debt rose rapidly during the early 1990s, partly owing toeconomic stagnation and the resulting increase in unemployment, whichdampened tax receipts and led to rising expenditure, but the trend has nowbeen reversed (see Reference table 7 for historical data on governmentfinances). In June 1998 the electorate approved an amendment of the con-stitution committing the federal authorities to achieve a balanced budget,defined as a deficit of not more than 2% of federal government expenditure, by2001. To fulfil this objective, the government introduced a fiscal consolidationpackage, mainly through a reduction of transfers to the cantons, a reduction ofmilitary spending and changes in the social insurance system.
Partially as a result of the austerity measures but also the improving economicsituation, the federal budget deficit amounted to only Swfr2.7bn (US$1.8bn),or 0.7% of GDP in 1999. This was well below the budgeted Swfr3.9bn (1% ofGDP), thanks to a better outcome in both revenue and expenditure, despite thefact that real GDP growth of 1.7% was below the 2% on which the federalbudget was based. Total public debt (including local governments) has morethan doubled since 1990 and peaked in 1998 at 53.3% before falling to 52.1%in 1999, steering clear of the Maastricht reference value (no more than 60% ofGDP) for entry into the EU’s economic and monetary union.
Federal government hasfew economic policy levers
Public finances recoveredfrom earlier deterioration
22 Switzerland
EIU Country Profile 2000 © The Economist Intelligence Unit Limited 2000
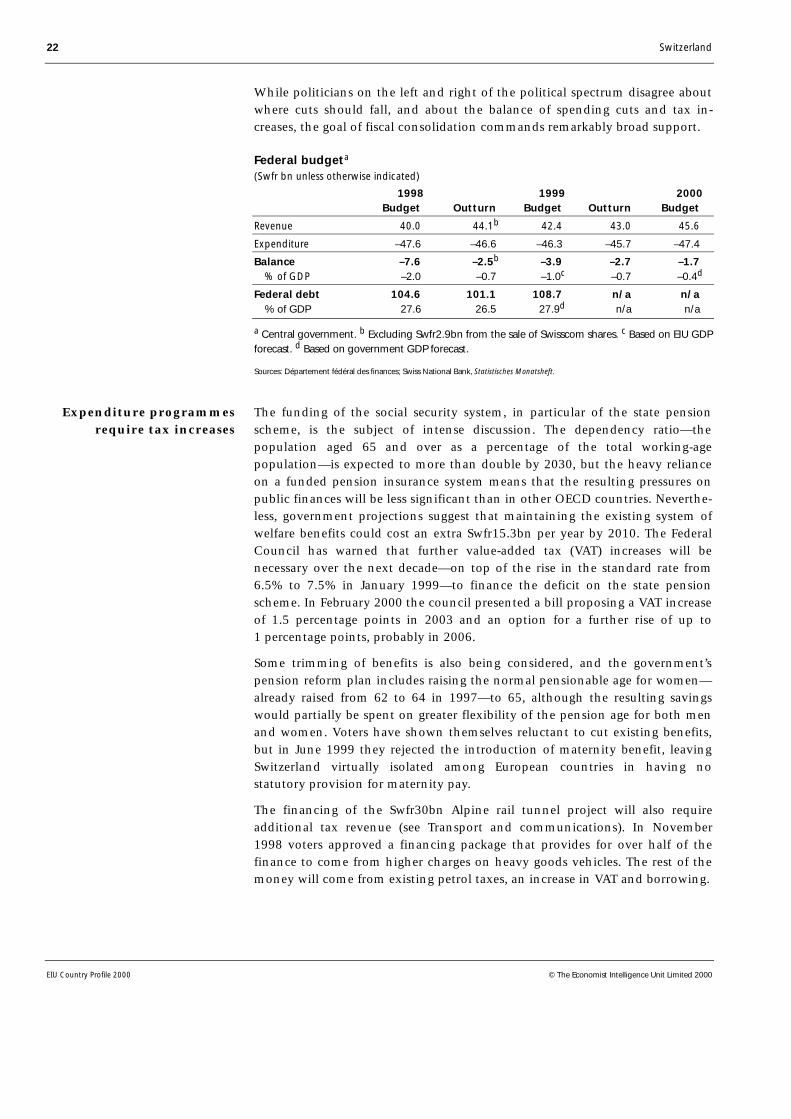
While politicians on the left and right of the political spectrum disagree aboutwhere cuts should fall, and about the balance of spending cuts and tax in-creases, the goal of fiscal consolidation commands remarkably broad support.
Federal budgeta
(Swfr bn unless otherwise indicated)
1998 1999 2000Budget Outturn Budget Outturn Budget
Revenue 40.0 44.1b 42.4 43.0 45.6
Expenditure –47.6 –46.6 –46.3 –45.7 –47.4
Balance –7.6 –2.5b –3.9 –2.7 –1.7 % of GDP –2.0 –0.7 –1.0c –0.7 –0.4d
Federal debt 104.6 101.1 108.7 n/a n/a % of GDP 27.6 26.5 27.9d n/a n/a
a Central government. b Excluding Swfr2.9bn from the sale of Swisscom shares. c Based on EIU GDPforecast. d Based on government GDP forecast.
Sources: Département fédéral des finances; Swiss National Bank, Statistisches Monatsheft.
The funding of the social security system, in particular of the state pensionscheme, is the subject of intense discussion. The dependency ratio—thepopulation aged 65 and over as a percentage of the total working-agepopulation—is expected to more than double by 2030, but the heavy relianceon a funded pension insurance system means that the resulting pressures onpublic finances will be less significant than in other OECD countries. Neverthe-less, government projections suggest that maintaining the existing system ofwelfare benefits could cost an extra Swfr15.3bn per year by 2010. The FederalCouncil has warned that further value-added tax (VAT) increases will benecessary over the next decade—on top of the rise in the standard rate from6.5% to 7.5% in January 1999—to finance the deficit on the state pensionscheme. In February 2000 the council presented a bill proposing a VAT increaseof 1.5 percentage points in 2003 and an option for a further rise of up to1 percentage points, probably in 2006.
Some trimming of benefits is also being considered, and the government’spension reform plan includes raising the normal pensionable age for women—already raised from 62 to 64 in 1997—to 65, although the resulting savingswould partially be spent on greater flexibility of the pension age for both menand women. Voters have shown themselves reluctant to cut existing benefits,but in June 1999 they rejected the introduction of maternity benefit, leavingSwitzerland virtually isolated among European countries in having nostatutory provision for maternity pay.
The financing of the Swfr30bn Alpine rail tunnel project will also requireadditional tax revenue (see Transport and communications). In November1998 voters approved a financing package that provides for over half of thefinance to come from higher charges on heavy goods vehicles. The rest of themoney will come from existing petrol taxes, an increase in VAT and borrowing.
Expenditure programmesrequire tax increases

Switzerland 23
© The Economist Intelligence Unit Limited 2000 EIU Country Profile 2000
When the economy was in recession during the first half of the 1990s, theSNB, which has independent responsibility for monetary policy, was widelycriticised for running an overly restrictive monetary policy designed to restoreprice stability. In 1995 the fragile economic recovery under way was hit by theSwiss franc’s strength—a consequence of US dollar weakness and concernsabout the credibility of the future of the euro which prompted large capitalinflows from strong-currency countries, notably Germany, and the SNB reactedby easing its monetary policy. It has maintained this generous stanceuntil it started to tighten it in the second half of 1999, bringing it closer to aneutral level.
The SNB has for some time indicated a shift away from its traditional focus onmoney supply growth, which has become erratic in recent years, and inDecember 1999 it announced major changes of its monetary policy instru-ments, fully abandoning its money supply target and moving closer to a directinflation target. Its goal is to keep inflation below 2%, therefore using the samedefinition of price stability as the European Central Bank. The SNB also startedto use the three-month London interbank offered rate (Libor) for Swiss francs asits reference rate, setting target rates to indicate its monetary policy stance.
Influential economic groupings
Within the federal government, responsibility for economic policy is split between theMinistry of Economic Affairs (economic analyses and forecasts for government use,regional, agricultural and employment policies) and the Ministry of Finance (taxationand fiscal policy).
The Swiss National Bank (SNB, the independent central bank) is responsible formonetary policy. A three-person governing board decides about monetary policy. About60% of the bank’s capital stock is held by cantons, cantonal banks and public agencies.
The Swiss Employers’ Association is the main representative employers’ organisation,but it is overshadowed on economic matters by the Swiss Union of Commerce andIndustry (Vorort), with which it is discussing a merger. The Swiss Farmers’ Union, whichis close to the People’s Party, represents most Swiss farmers, but the Union of SwissProducers is active in French-speaking areas.
The Swiss Trade Union Federation is the largest of several trade union groupings,with 395,420 members, and has links to the Social Democratic Party. The Federation ofPublic Employees has 163,790 members, and the Federation of Staff Associations(white-collar employees) has 120,150 members.
During the first year after the introduction of the euro the Swiss francremained relatively stable against the new currency, at a rate of aroundSwfr1.60:€1. This has given rise to speculation that the SNB is actuallytargeting the exchange rate but the synchrony of the business cycle in the eurozone and in Switzerland is likely to have been the real reason behind thestability. Following the SNB’s decision to raise interest rates sharply in March
SNB shifting monetarypolicy to neutral stance
Revamp of monetarypolicy instruments
Consequences of EMU forthe Swiss franc
24 Switzerland
EIU Country Profile 2000 © The Economist Intelligence Unit Limited 2000
the Swiss franc appreciated moderately against the euro, further supporting theview, explicitly expressed by the bank’s board members, that the SNB is atpresent not overly concerned about the possibility of an appreciation againstthe euro. Over the longer-term horizon, however, Switzerland’s economic andfinancial links with euro countries will keep volatility between the Swiss francand the euro limited, and a gradual convergence of interest rates towardssingle-currency levels also appears likely. (Historical data on interest rates areshown in Reference table 9.)
Economic performance
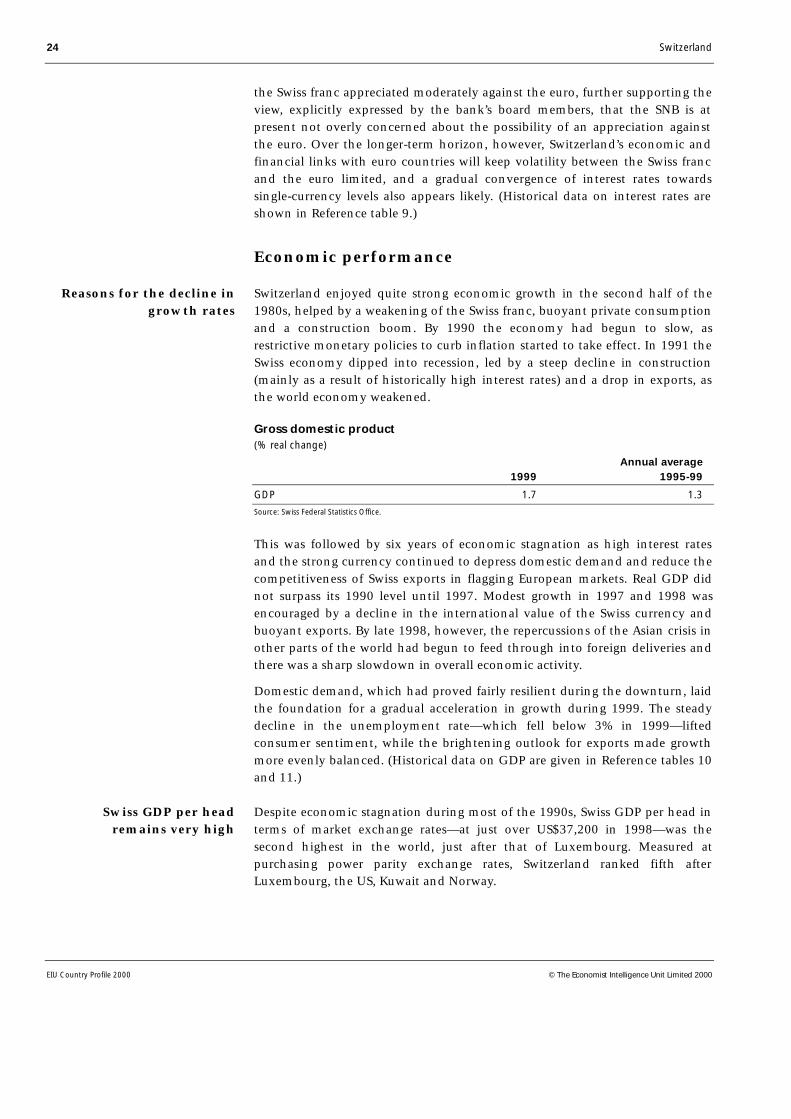
Switzerland enjoyed quite strong economic growth in the second half of the1980s, helped by a weakening of the Swiss franc, buoyant private consumptionand a construction boom. By 1990 the economy had begun to slow, asrestrictive monetary policies to curb inflation started to take effect. In 1991 theSwiss economy dipped into recession, led by a steep decline in construction(mainly as a result of historically high interest rates) and a drop in exports, asthe world economy weakened.
Gross domestic product(% real change)
Annual average1999 1995-99
GDP 1.7 1.3
Source: Swiss Federal Statistics Office.
This was followed by six years of economic stagnation as high interest ratesand the strong currency continued to depress domestic demand and reduce thecompetitiveness of Swiss exports in flagging European markets. Real GDP didnot surpass its 1990 level until 1997. Modest growth in 1997 and 1998 wasencouraged by a decline in the international value of the Swiss currency andbuoyant exports. By late 1998, however, the repercussions of the Asian crisis inother parts of the world had begun to feed through into foreign deliveries andthere was a sharp slowdown in overall economic activity.
Domestic demand, which had proved fairly resilient during the downturn, laidthe foundation for a gradual acceleration in growth during 1999. The steadydecline in the unemployment rate—which fell below 3% in 1999—liftedconsumer sentiment, while the brightening outlook for exports made growthmore evenly balanced. (Historical data on GDP are given in Reference tables 10and 11.)
Despite economic stagnation during most of the 1990s, Swiss GDP per head interms of market exchange rates—at just over US$37,200 in 1998—was thesecond highest in the world, just after that of Luxembourg. Measured atpurchasing power parity exchange rates, Switzerland ranked fifth afterLuxembourg, the US, Kuwait and Norway.
Reasons for the decline ingrowth rates
Swiss GDP per headremains very high
Switzerland 25
© The Economist Intelligence Unit Limited 2000 EIU Country Profile 2000
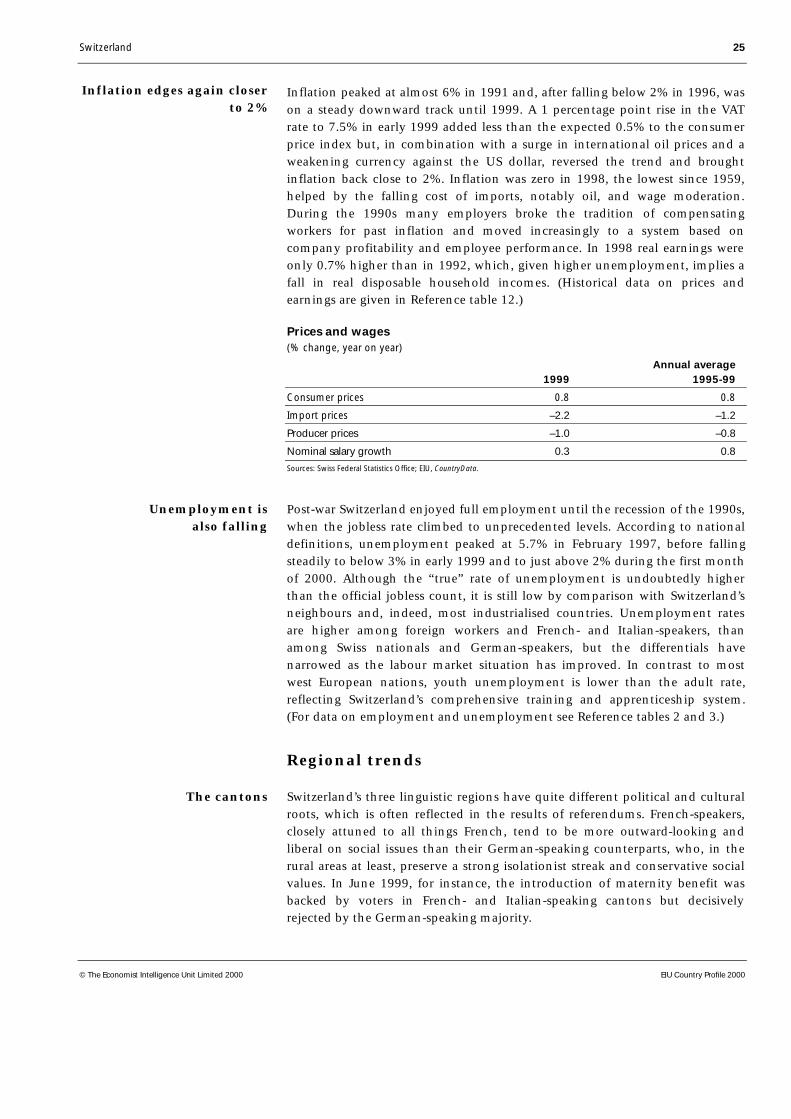
Inflation peaked at almost 6% in 1991 and, after falling below 2% in 1996, wason a steady downward track until 1999. A 1 percentage point rise in the VATrate to 7.5% in early 1999 added less than the expected 0.5% to the consumerprice index but, in combination with a surge in international oil prices and aweakening currency against the US dollar, reversed the trend and broughtinflation back close to 2%. Inflation was zero in 1998, the lowest since 1959,helped by the falling cost of imports, notably oil, and wage moderation.During the 1990s many employers broke the tradition of compensatingworkers for past inflation and moved increasingly to a system based oncompany profitability and employee performance. In 1998 real earnings wereonly 0.7% higher than in 1992, which, given higher unemployment, implies afall in real disposable household incomes. (Historical data on prices andearnings are given in Reference table 12.)
Prices and wages(% change, year on year)
Annual average1999 1995-99
Consumer prices 0.8 0.8
Import prices –2.2 –1.2
Producer prices –1.0 –0.8
Nominal salary growth 0.3 0.8
Sources: Swiss Federal Statistics Office; EIU, CountryData.
Post-war Switzerland enjoyed full employment until the recession of the 1990s,when the jobless rate climbed to unprecedented levels. According to nationaldefinitions, unemployment peaked at 5.7% in February 1997, before fallingsteadily to below 3% in early 1999 and to just above 2% during the first monthof 2000. Although the “true” rate of unemployment is undoubtedly higherthan the official jobless count, it is still low by comparison with Switzerland’sneighbours and, indeed, most industrialised countries. Unemployment ratesare higher among foreign workers and French- and Italian-speakers, thanamong Swiss nationals and German-speakers, but the differentials havenarrowed as the labour market situation has improved. In contrast to mostwest European nations, youth unemployment is lower than the adult rate,reflecting Switzerland’s comprehensive training and apprenticeship system.(For data on employment and unemployment see Reference tables 2 and 3.)
Regional trends
Switzerland’s three linguistic regions have quite different political and culturalroots, which is often reflected in the results of referendums. French-speakers,closely attuned to all things French, tend to be more outward-looking andliberal on social issues than their German-speaking counterparts, who, in therural areas at least, preserve a strong isolationist streak and conservative socialvalues. In June 1999, for instance, the introduction of maternity benefit wasbacked by voters in French- and Italian-speaking cantons but decisivelyrejected by the German-speaking majority.
Inflation edges again closerto 2%
Unemployment isalso falling
The cantons
26 Switzerland
EIU Country Profile 2000 © The Economist Intelligence Unit Limited 2000
Switzerland’s cantons also have distinct economic identities, a remnant fromtheir long history as separate states. Some, such as Geneva, publish their owneconomic accounts including foreign trade figures. The cantons vary widely insize, economic importance and wealth. In terms of income per head, Zug,famous for its low taxes, topped the league in 1997 at Swfr68,320 (US$47,100),compared with the Swiss average of Swfr44,500, according to national sources.Basle (Swfr65,704) and Zurich (Swfr56,048) came next. Local authorities derivethe bulk of their income from direct taxes, which vary significantly by cantonand commune.
Switzerland operates a regional policy that allows economically disadvantagedcantons to offer special tax breaks and other investment incentives. In 1999the government presented detailed proposals to reform the revenue-sharingsystem between central government and the cantons instituted 40 years ago. Ithopes for efficiency savings of up to 20% of the Swfr13bn now exchangedbetween the two levels of government, mainly by rationalising the allocationof responsibilities between them. In some areas, such as higher education andwaste disposal, the cantons will be obliged to co-operate with each other toavoid wasteful duplication and free-riding.
Economic sectors
Agriculture
Domestic agricultural products supply on average nearly 60% of domestic foodconsumption. Switzerland exports very little by way of agricultural products,with the notable exception of cheese. Milk is by far the most importantagricultural product, accounting for one-third of total agricultural output,followed by pig and cattle production. (Historical data on agriculturalproduction are given in Reference table 13.) Half of Switzerland’s cheeseproduction is exported, 80% of this to the EU. Dairy and stock-raisingprevail in the mountain regions, while crops (grain, grapes, fruit andvegetables) are chiefly grown in the lowlands. In 1997 forest and woodlandcovered 1.2m ha (12,126m sq km or around 30% of the total land area), ofwhich one-quarter was privately owned. Swiss forests are protected by a generalban on the destruction of woodland and obligatory replanting of trees toreplace legal felling.
About 4% of the Swiss labour force is employed in agriculture, compared with5% in France and 2% in the UK. The number of farms decreased by 18% to76,412 during 1990-98, with an even sharper decline in the number of smallpart-time farms, which accounted for some 30% of the total. This was acontinuation of the downward trend noted in previous decades, and policychanges in recent years are likely to lead to a further decline.
Swiss agricultural policy until the beginning of the 1990s was structured longbroadly similar lines as the common agricultural policy of the EU. However,the desire to protect the Alpine environment, concerns about the high level ofconsumer prices for agricultural products and pressure for change from GATT

Switzerland 27
© The Economist Intelligence Unit Limited 2000 EIU Country Profile 2000
(now World Trade Organisation, WTO) world trade negotiations have inducedsome important changes. Reforms entailing a shift away from price supporttowards direct payments to farmers came into effect at the beginning of 1993and 1999.
However, import restrictions, which in 1999 accounted for some 60% of totalsupport to farmers, have not been affected significantly by the reforms.Progress in this field is only about to result from the bilateral agreement onagricultural trade with the EU, due to come into effect in 2001, stipulating theprogressive liberalisation of trade in some major agricultural products such ascheese until 2005. Overall producer support, through payments from thegovernment or transfers from consumers to producers, stood at 70% ofproducer income for 1997-99, substantially above the OECD average of 40%.The cost to taxpayers and consumers of total support measures in the agri-cultural sector over the same period was 2.4% of GDP, considerably below thelevel of 3.8% for the average of 1986-88.
Agricultural policy(annual averages)
1986-88 1997-99
Total value of production (Swfr m) 9,482 7,610
Producer support (% of farming income) 73 70
Producer support (Swfr m) 7,921 7,265 of which: market price support (Swfr m) 6,500 4,511 payments based on area/animal numbers (Swfr m) 494 1,228
Total agricultural policy transfers (Swfr m) 9,797 9,100 (% of GDP) 3.8 2.4
Source: OECD, Agricultural policy in OECD countries.
Manufacturing
The Swiss manufacturing industry is highly specialised, producing mostly shortruns of a wide variety of high-quality goods. For a small country, Switzerlandboasts a surprisingly large number of world-class multinational companies,notably in the food, pharmaceuticals and engineering sectors. However, largecompanies now produce the bulk of their output outside Switzerland, and thevast majority of Swiss manufacturing companies are small, employing 10-100people. The machinery and metals sectors accounted for nearly 30% of totalmanufacturing employment of 715,000 in 1998. (For historical data onindustrial production see Reference table 14.)
Manufacturing employment peaked at 880,600 in 1990 but was hit hard by thesubsequent recession. Nevertheless, despite the generally strong Swiss francand a high cost base, Swiss companies have by and large been remarkablysuccessful at maintaining their share of overseas markets and turning in goodfinancial results. The strong franc has given companies a constant spur to cutcosts, produce innovative products and shift towards high-quality products,where price is only one of several considerations for the purchaser. Banks havesupported the restructuring of industries in trouble, rather than simply letting
28 Switzerland
EIU Country Profile 2000 © The Economist Intelligence Unit Limited 2000
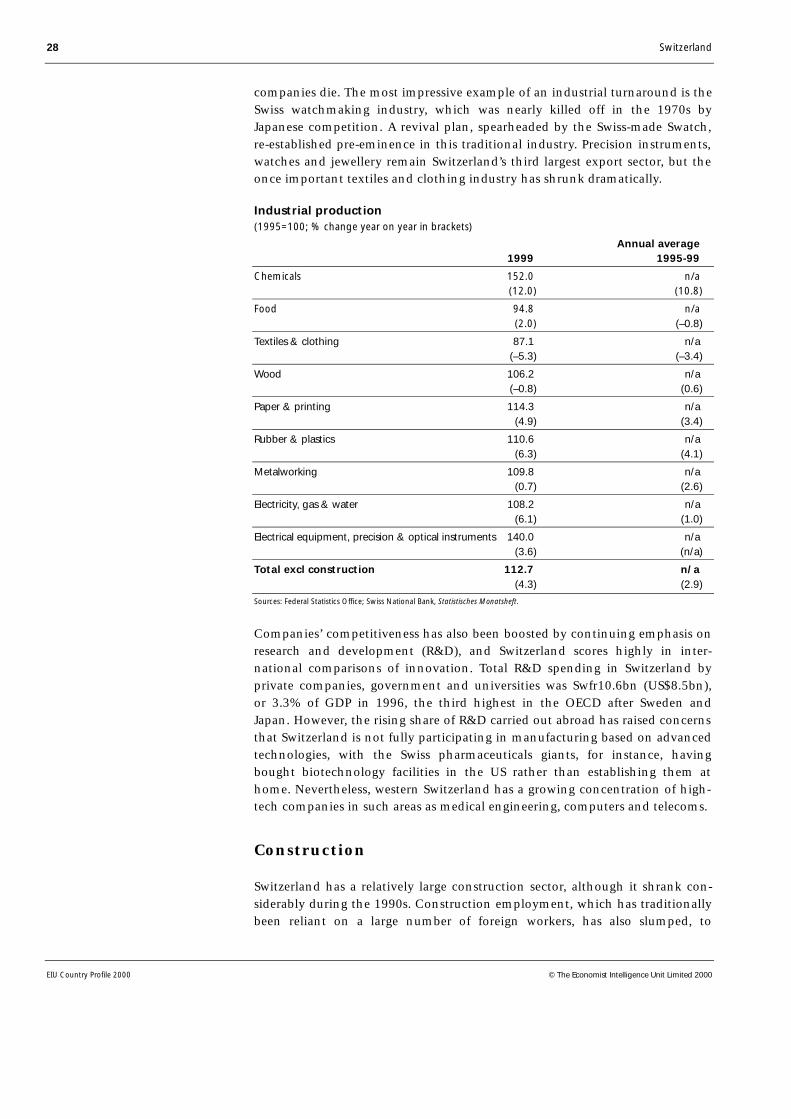
companies die. The most impressive example of an industrial turnaround is theSwiss watchmaking industry, which was nearly killed off in the 1970s byJapanese competition. A revival plan, spearheaded by the Swiss-made Swatch,re-established pre-eminence in this traditional industry. Precision instruments,watches and jewellery remain Switzerland’s third largest export sector, but theonce important textiles and clothing industry has shrunk dramatically.
Industrial production(1995=100; % change year on year in brackets)
Annual average 1999 1995-99
Chemicals 152.0 n/a (12.0) (10.8)
Food 94.8 n/a (2.0) (–0.8)
Textiles & clothing 87.1 n/a (–5.3) (–3.4)
Wood 106.2 n/a (–0.8) (0.6)
Paper & printing 114.3 n/a (4.9) (3.4)
Rubber & plastics 110.6 n/a (6.3) (4.1)
Metalworking 109.8 n/a (0.7) (2.6)
Electricity, gas & water 108.2 n/a (6.1) (1.0)
Electrical equipment, precision & optical instruments 140.0 n/a (3.6) (n/a)
Total excl construction 112.7 n/a (4.3) (2.9)
Sources: Federal Statistics Office; Swiss National Bank, Statistisches Monatsheft.
Companies’ competitiveness has also been boosted by continuing emphasis onresearch and development (R&D), and Switzerland scores highly in inter-national comparisons of innovation. Total R&D spending in Switzerland byprivate companies, government and universities was Swfr10.6bn (US$8.5bn),or 3.3% of GDP in 1996, the third highest in the OECD after Sweden andJapan. However, the rising share of R&D carried out abroad has raised concernsthat Switzerland is not fully participating in manufacturing based on advancedtechnologies, with the Swiss pharmaceuticals giants, for instance, havingbought biotechnology facilities in the US rather than establishing them athome. Nevertheless, western Switzerland has a growing concentration of high-tech companies in such areas as medical engineering, computers and telecoms.
Construction
Switzerland has a relatively large construction sector, although it shrank con-siderably during the 1990s. Construction employment, which has traditionallybeen reliant on a large number of foreign workers, has also slumped, to
Switzerland 29
© The Economist Intelligence Unit Limited 2000 EIU Country Profile 2000
297,000 in 1998 from 327,000 five years earlier. Fluctuations in constructionactivity, strongly influenced by interest-rate changes, have been critical indetermining the course of the Swiss economy, fuelling rapid growth in the1980s and then leading the country into recession in the early 1990s. Most ofthe fluctuations have been borne by the private sector, in both the house-building and the commercial and industrial sectors. Much building, includingresidential, is commissioned by property companies as rental investments. Thevacancy rate for private homes, at 1.8% in 1998, was the highest since the1970s, and a large overhang of empty business property is also deterringnew construction. (Historical data on construction are given in Referencetable 15.)
High prices and lack of fiscal incentives mean that fewer than one-third ofSwiss people own their own homes, which is among the lowest proportions inEurope. The federal government provides some financial assistance for theconstruction of low-cost housing, but such housing is nevertheless in shortsupply. Construction costs are up to one-third higher than the OECD average,largely because of Switzerland’s demanding building standards, bureaucraticred tape, a fragmented artisan industry and, at least until recently, weakcompetitive pressures. In particular, public procurement contracts have oftengone to local firms instead of being allocated by competitive tender. However,this is changing under pressure from the federal government.
Infrastructure investment has been less volatile than other construction, butspending has been restrained during the 1990s as public authorities have triedto curb budget deficits. Switzerland nevertheless builds its infrastructure tohigh standards and maintains it with care. Investment spending accounted fornearly 13% of federal outlays in 1998 but the ratio declined to 11% in the1999 budget although increasing slightly in absolute terms. The budgetforesees a further decline of the ratio to 10.9% in 2000. Ongoingconstruction projects include plans to complete the missing five sections ofthe motorway network and improve the railway system (see Transport andcommunications).
Financial services
The financial services industry is one of Switzerland’s largest employers and animportant exporter. Swiss banks and insurance companies are active abroadand feature among the world’s leaders. Swiss banks, with their reputation forfinancial solidity, are pre-eminent in global asset management, managing someSwfr3.5trn (US$2.3trn) at the end of 1999, of which more than half was forforeign customers. The domestic banking scene has, however, undergonesweeping structural changes in the 1990s, with many small local banks closingor merging and the large banks rationalising their Swiss retail networks whileexpanding overseas operations.
The banking sector
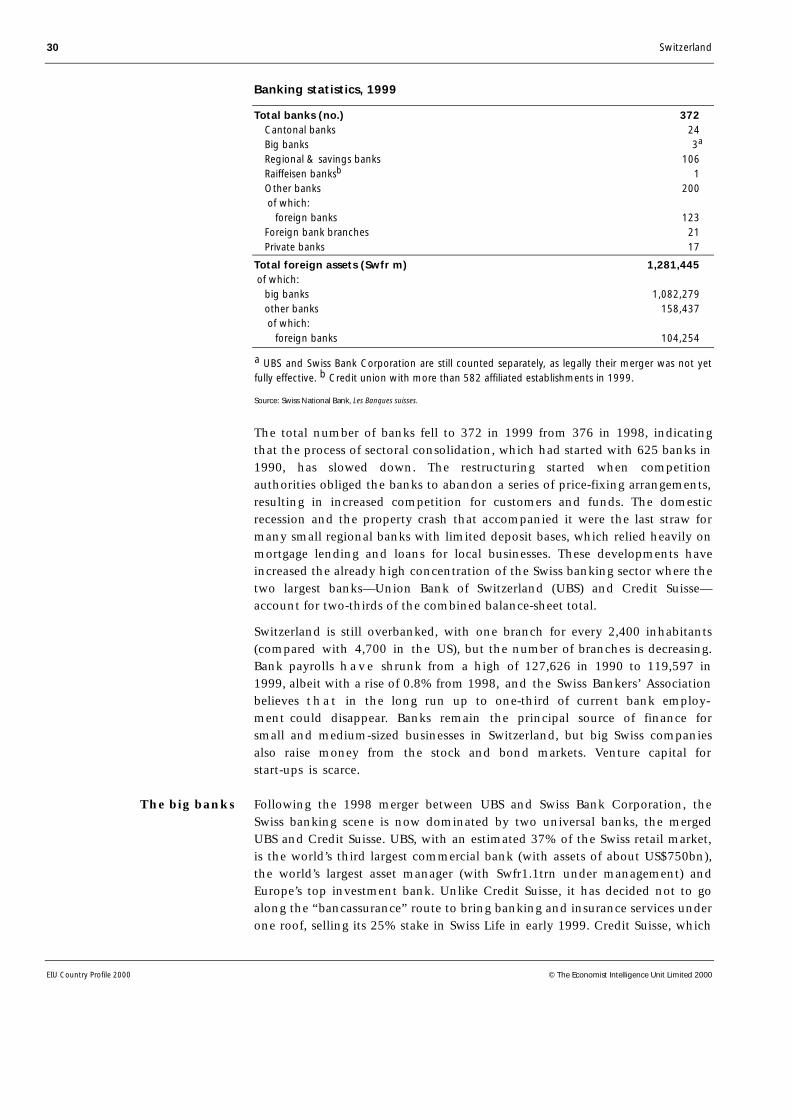
30 Switzerland
EIU Country Profile 2000 © The Economist Intelligence Unit Limited 2000
Banking statistics, 1999
Total banks (no.) 372 Cantonal banks 24 Big banks 3a
Regional & savings banks 106 Raiffeisen banksb 1 Other banks 200 of which: foreign banks 123 Foreign bank branches 21 Private banks 17
Total foreign assets (Swfr m) 1,281,445 of which: big banks 1,082,279 other banks 158,437 of which: foreign banks 104,254
a UBS and Swiss Bank Corporation are still counted separately, as legally their merger was not yetfully effective. b Credit union with more than 582 affiliated establishments in 1999.
Source: Swiss National Bank, Les Banques suisses.
The total number of banks fell to 372 in 1999 from 376 in 1998, indicatingthat the process of sectoral consolidation, which had started with 625 banks in1990, has slowed down. The restructuring started when competitionauthorities obliged the banks to abandon a series of price-fixing arrangements,resulting in increased competition for customers and funds. The domesticrecession and the property crash that accompanied it were the last straw formany small regional banks with limited deposit bases, which relied heavily onmortgage lending and loans for local businesses. These developments haveincreased the already high concentration of the Swiss banking sector where thetwo largest banks—Union Bank of Switzerland (UBS) and Credit Suisse—account for two-thirds of the combined balance-sheet total.
Switzerland is still overbanked, with one branch for every 2,400 inhabitants(compared with 4,700 in the US), but the number of branches is decreasing.Bank payrolls have shrunk from a high of 127,626 in 1990 to 119,597 in1999, albeit with a rise of 0.8% from 1998, and the Swiss Bankers’ Associationbelieves tha t in the long run up to one-third of current bank employ-ment could disappear. Banks remain the principal source of finance forsmall and medium-sized businesses in Switzerland, but big Swiss companiesalso raise money from the stock and bond markets. Venture capital forstart-ups is scarce.
Following the 1998 merger between UBS and Swiss Bank Corporation, theSwiss banking scene is now dominated by two universal banks, the mergedUBS and Credit Suisse. UBS, with an estimated 37% of the Swiss retail market,is the world’s third largest commercial bank (with assets of about US$750bn),the world’s largest asset manager (with Swfr1.1trn under management) andEurope’s top investment bank. Unlike Credit Suisse, it has decided not to goalong the “bancassurance” route to bring banking and insurance services underone roof, selling its 25% stake in Swiss Life in early 1999. Credit Suisse, which
The big banks

Switzerland 31
© The Economist Intelligence Unit Limited 2000 EIU Country Profile 2000
bought Winterthur Insurance, one of Switzerland’s biggest insurers, in 1997 isamong the world’s top ten financial services firms.
The 24 cantonal banks under the control of cantonal governments account forover one-quarter of domestic banking business. Two small cantonal banks wereprivatised in 1995 and 1996, while under a new banking law approved byparliament in 1999 cantons will no longer have to guarantee the banks’operations (although they must hold a capital and voting stake of at least30%). Bigger cantonal banks, such as those in Zurich, Vaud and Geneva, haveimportant asset management businesses as well as being involved in supplyingcredit to locally based customers.
Regional banks specialise in mortgage lending and credits for small businesses.Since 1994 most of the country’s regional banks have been linked in acommon holding company providing back-office operations and other servicesto members in a bid to cut costs. However, their numbers are dwindling swiftly,having fallen by one-third over the past five years.
The 128 foreign banks make up one-third of banks active in Switzerland. Incontrast to domestic banks, their numbers have risen over the past decade, buttheir business is increasingly focused on asset management, mostly of fundsfrom abroad.
The Swiss people are among the most heavily insured in the world.Nevertheless, Swiss insurers now rely on foreign business for 60% of theirpremium income. The insurance sector has been steadily deregulated duringthe 1990s. One of the last sets of controls was scrapped in 1996, when thefixed-tariff regime for third-party vehicle insurance was abolished.
Switzerland has no restrictions on international capital flows, and curbs on bondmarket issues by foreign banks have been relaxed. The open-outcry stockexchanges in Zurich, Geneva and Basle closed in August 1996, when a nationalelectronic stock exchange (EBS) for all securities trading began operating, the firstin the world to combine clearing, settlement and regulatory supervision withtransaction activities.
In 1999 the Swiss stock exchange signed up its first “remote” members andopened a new market for small growth stocks. The Zurich-based exchange alsoplans a cross-trading alliance with the Paris and Milan bourses and is taking partin plans by six exchanges to establish a single trading platform for Europe’s top300 companies. Meanwhile, the Eurex derivatives exchange, formed by a mergerin September 1998 between the Swiss Options and Financial Futures Exchangeand Germany’s Terminbörse, has become the world’s largest, overtaking theChicago Board of Trade with which it now plans an alliance.
Overall stockmarket turnover, including shares, bonds and options, amountedto Swfr1.08trn in 1999, compared with Swfr1.29trn in 1998. The ten largestSwiss companies account for 80% of market capitalisation of the SwissPerformance Index, the most widely quoted share price index. Of the 3,621shares and bonds quoted at the end of March 2000, 1,572—over 40%—were
Cantonal banks
Regional banks
The insurance sector
The stockmarket
Foreign banks
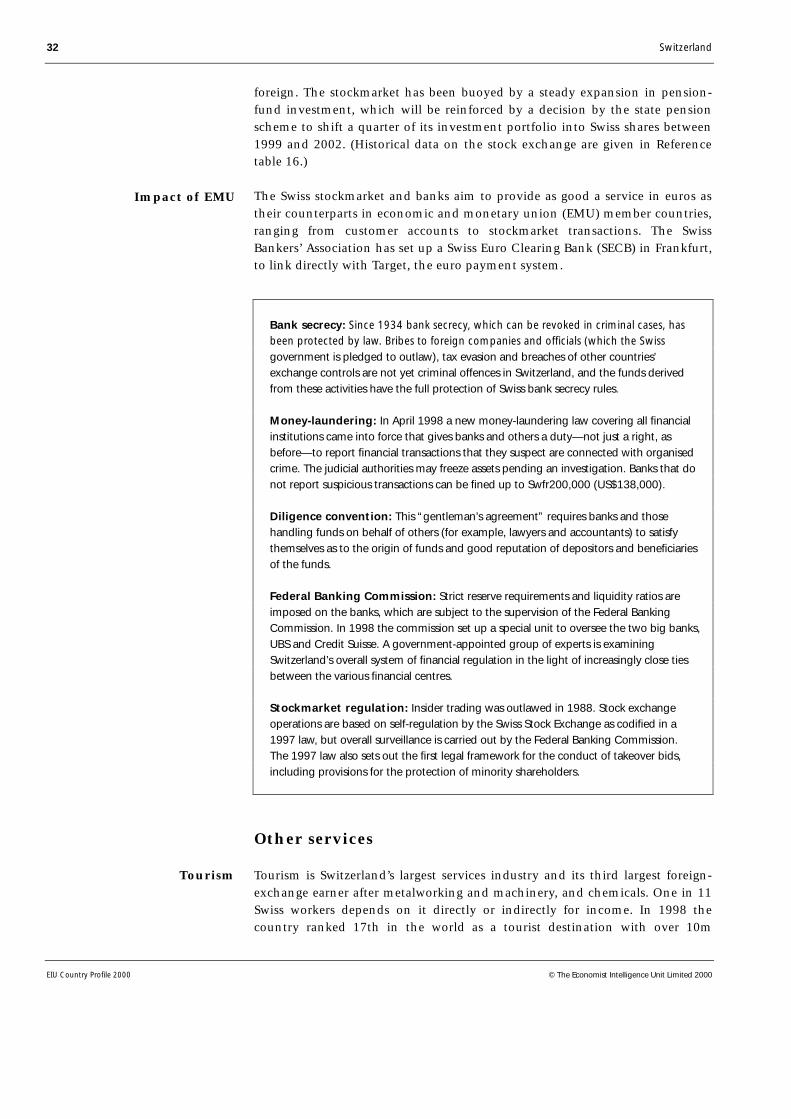
32 Switzerland
EIU Country Profile 2000 © The Economist Intelligence Unit Limited 2000
foreign. The stockmarket has been buoyed by a steady expansion in pension-fund investment, which will be reinforced by a decision by the state pensionscheme to shift a quarter of its investment portfolio into Swiss shares between1999 and 2002. (Historical data on the stock exchange are given in Referencetable 16.)
The Swiss stockmarket and banks aim to provide as good a service in euros astheir counterparts in economic and monetary union (EMU) member countries,ranging from customer accounts to stockmarket transactions. The SwissBankers’ Association has set up a Swiss Euro Clearing Bank (SECB) in Frankfurt,to link directly with Target, the euro payment system.
Bank secrecy: Since 1934 bank secrecy, which can be revoked in criminal cases, hasbeen protected by law. Bribes to foreign companies and officials (which the Swissgovernment is pledged to outlaw), tax evasion and breaches of other countries’exchange controls are not yet criminal offences in Switzerland, and the funds derivedfrom these activities have the full protection of Swiss bank secrecy rules.
Money-laundering: In April 1998 a new money-laundering law covering all financialinstitutions came into force that gives banks and others a duty—not just a right, asbefore—to report financial transactions that they suspect are connected with organisedcrime. The judicial authorities may freeze assets pending an investigation. Banks that donot report suspicious transactions can be fined up to Swfr200,000 (US$138,000).
Diligence convention: This “gentleman’s agreement” requires banks and thosehandling funds on behalf of others (for example, lawyers and accountants) to satisfythemselves as to the origin of funds and good reputation of depositors and beneficiariesof the funds.
Federal Banking Commission: Strict reserve requirements and liquidity ratios areimposed on the banks, which are subject to the supervision of the Federal BankingCommission. In 1998 the commission set up a special unit to oversee the two big banks,UBS and Credit Suisse. A government-appointed group of experts is examiningSwitzerland’s overall system of financial regulation in the light of increasingly close tiesbetween the various financial centres.
Stockmarket regulation: Insider trading was outlawed in 1988. Stock exchangeoperations are based on self-regulation by the Swiss Stock Exchange as codified in a1997 law, but overall surveillance is carried out by the Federal Banking Commission.The 1997 law also sets out the first legal framework for the conduct of takeover bids,including provisions for the protection of minority shareholders.
Other services
Tourism is Switzerland’s largest services industry and its third largest foreign-exchange earner after metalworking and machinery, and chemicals. One in 11Swiss workers depends on it directly or indirectly for income. In 1998 thecountry ranked 17th in the world as a tourist destination with over 10m
Impact of EMU
Tourism
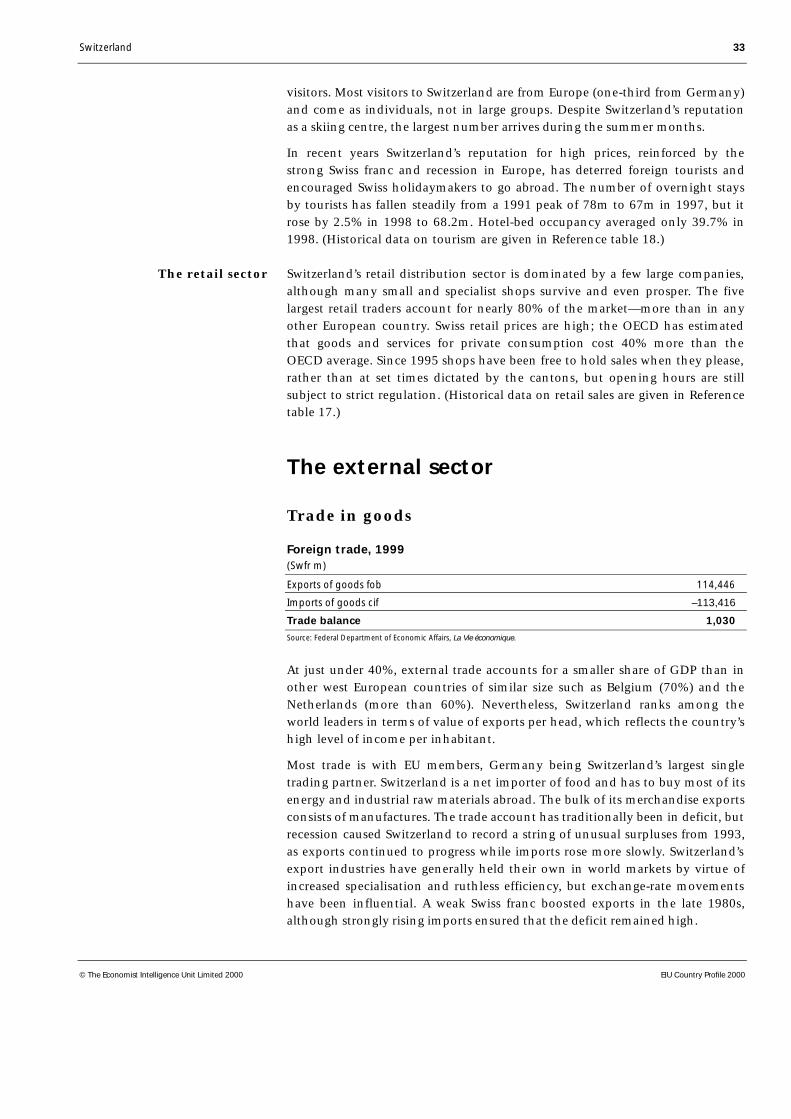
Switzerland 33
© The Economist Intelligence Unit Limited 2000 EIU Country Profile 2000
visitors. Most visitors to Switzerland are from Europe (one-third from Germany)and come as individuals, not in large groups. Despite Switzerland’s reputationas a skiing centre, the largest number arrives during the summer months.
In recent years Switzerland’s reputation for high prices, reinforced by thestrong Swiss franc and recession in Europe, has deterred foreign tourists andencouraged Swiss holidaymakers to go abroad. The number of overnight staysby tourists has fallen steadily from a 1991 peak of 78m to 67m in 1997, but itrose by 2.5% in 1998 to 68.2m. Hotel-bed occupancy averaged only 39.7% in1998. (Historical data on tourism are given in Reference table 18.)
Switzerland’s retail distribution sector is dominated by a few large companies,although many small and specialist shops survive and even prosper. The fivelargest retail traders account for nearly 80% of the market—more than in anyother European country. Swiss retail prices are high; the OECD has estimatedthat goods and services for private consumption cost 40% more than theOECD average. Since 1995 shops have been free to hold sales when they please,rather than at set times dictated by the cantons, but opening hours are stillsubject to strict regulation. (Historical data on retail sales are given in Referencetable 17.)
The external sector
Trade in goods
Foreign trade, 1999(Swfr m)
Exports of goods fob 114,446
Imports of goods cif –113,416
Trade balance 1,030
Source: Federal Department of Economic Affairs, La Vie économique.
At just under 40%, external trade accounts for a smaller share of GDP than inother west European countries of similar size such as Belgium (70%) and theNetherlands (more than 60%). Nevertheless, Switzerland ranks among theworld leaders in terms of value of exports per head, which reflects the country’shigh level of income per inhabitant.
Most trade is with EU members, Germany being Switzerland’s largest singletrading partner. Switzerland is a net importer of food and has to buy most of itsenergy and industrial raw materials abroad. The bulk of its merchandise exportsconsists of manufactures. The trade account has traditionally been in deficit, butrecession caused Switzerland to record a string of unusual surpluses from 1993,as exports continued to progress while imports rose more slowly. Switzerland’sexport industries have generally held their own in world markets by virtue ofincreased specialisation and ruthless efficiency, but exchange-rate movementshave been influential. A weak Swiss franc boosted exports in the late 1980s,although strongly rising imports ensured that the deficit remained high.
The retail sector
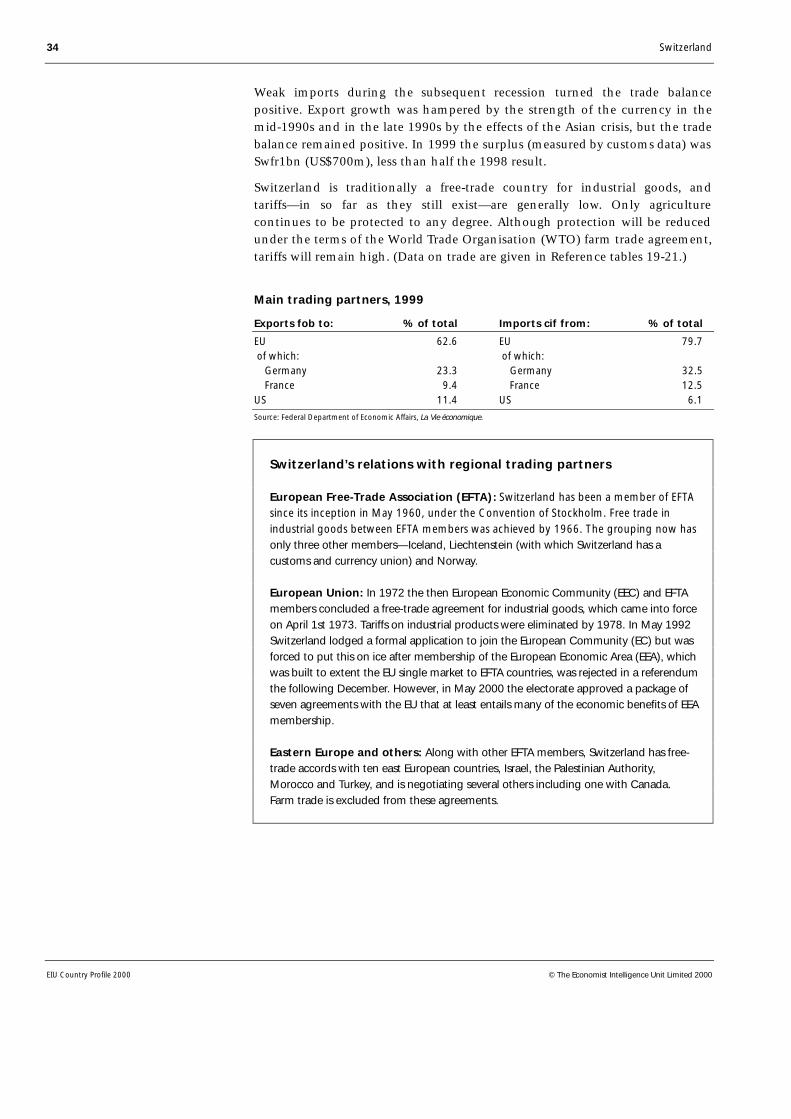
34 Switzerland
EIU Country Profile 2000 © The Economist Intelligence Unit Limited 2000
Weak imports during the subsequent recession turned the trade balancepositive. Export growth was hampered by the strength of the currency in themid-1990s and in the late 1990s by the effects of the Asian crisis, but the tradebalance remained positive. In 1999 the surplus (measured by customs data) wasSwfr1bn (US$700m), less than half the 1998 result.
Switzerland is traditionally a free-trade country for industrial goods, andtariffs—in so far as they still exist—are generally low. Only agriculturecontinues to be protected to any degree. Although protection will be reducedunder the terms of the World Trade Organisation (WTO) farm trade agreement,tariffs will remain high. (Data on trade are given in Reference tables 19-21.)
Main trading partners, 1999
Exports fob to: % of total Imports cif from: % of total
EU 62.6 EU 79.7 of which: of which: Germany 23.3 Germany 32.5 France 9.4 France 12.5US 11.4 US 6.1
Source: Federal Department of Economic Affairs, La Vie économique.
Switzerland’s relations with regional trading partners
European Free-Trade Association (EFTA): Switzerland has been a member of EFTAsince its inception in May 1960, under the Convention of Stockholm. Free trade inindustrial goods between EFTA members was achieved by 1966. The grouping now hasonly three other members—Iceland, Liechtenstein (with which Switzerland has acustoms and currency union) and Norway.
European Union: In 1972 the then European Economic Community (EEC) and EFTAmembers concluded a free-trade agreement for industrial goods, which came into forceon April 1st 1973. Tariffs on industrial products were eliminated by 1978. In May 1992Switzerland lodged a formal application to join the European Community (EC) but wasforced to put this on ice after membership of the European Economic Area (EEA), whichwas built to extent the EU single market to EFTA countries, was rejected in a referendumthe following December. However, in May 2000 the electorate approved a package ofseven agreements with the EU that at least entails many of the economic benefits of EEAmembership.
Eastern Europe and others: Along with other EFTA members, Switzerland has free-trade accords with ten east European countries, Israel, the Palestinian Authority,Morocco and Turkey, and is negotiating several others including one with Canada.Farm trade is excluded from these agreements.

Switzerland 35
© The Economist Intelligence Unit Limited 2000 EIU Country Profile 2000
Invisibles and the current account
Although Switzerland has tended to run a deficit on the merchandise account,the current account of the balance of payments has been in surplus since 1966,with the single exception of 1980. The actual current-account surplus isprobably larger than recorded, since a proportion of the errors and omissionsitem could be allocated to current earnings. In 1999 the current accountboasted a record surplus of Swfr43.9bn, equivalent to 11.3% of GDP, one of thehighest proportions in the industrialised world. (For IMF and national balance-of-payments data, see Reference tables 22 and 23.)
Net earnings from banking and insurance activities have been substantial, witha considerable improvement recorded during the 1990s, more than fullyoffsetting the deterioration of the tourism balance. However, the bulk of thecurrent-account surplus can be ascribed to the balance of income frominvestment. The substantial surplus in this component is mainly attributable tothe substantial net foreign assets, but the low yield of Swiss assets relative tocomparable foreign investments has been an important factor. The labourincome balance is, however, in structural deficit owing to large outwardtransfers by foreign workers.
Current account, 1999(Swfr m)
Current-account balance 43,927 of which: services balance 21,316 income balance 28,152
Source: Swiss National Bank, Statistisches Monatsheft.
Capital flows and foreign debt
As befits a country running a huge current-account surplus, the Swiss investheavily overseas. Surpluses were initially used mainly for the purchase offoreign shares and bonds, but in the late 1980s direct investments began to risestrongly as Swiss companies began to expand production operations abroad.Some 1.6m workers are employed in overseas subsidiaries of Swiss companies,which made direct foreign investments worth Swfr26.9bn in 1999. The totalstock of Swiss direct investments abroad reached Swfr249.9bn at the end of lastyear. Switzerland’s attraction as a host for inward investment has waned duringthe 1990s, mainly because of high production costs resulting in low rates ofreturns by international standards, and uncertainty about Switzerland’s futureoutside the EEA.
Inflows of foreign direct investment (FDI) into Switzerland turned negative in1993 for the first time since the statistical record began in 1984, influencedboth by the rejection of EEA accession in December 1992 and by the cyclicalweakness. Inflows have recovered since then, with an average of Swfr6.4bn peryear in 1995-99, but remained well below the levels recorded in the 1980s.Swiss skills and labour force docility (strikes are virtually unknown) are
36 Switzerland
EIU Country Profile 2000 © The Economist Intelligence Unit Limited 2000
nevertheless attracting a number of high-tech firms in such areas as medicalengineering and advanced electronics, where quality of output is all-important.
Foreign reserves and the exchange rate
Reserves are comfortable and Switzerland appears to have little interest inincreasing them (see Reference table 24). A change in the constitutionapproved in April 1999 to remove gold backing for the currency has permittedthe Swiss National Bank (SNB, the central bank) to sell 1,300 tonnes of gold,equivalent to half its gold reserves, over a period of years from 2000, and itstarted selling them in May 2000.
The bank has used market intervention and interest rates to curb excessivecurrency volatility, but the close economic links with the EU have also reducedfluctuations. Except in periods of exceptional instability on the internationalcurrency markets, when the flight of investors to safe haven currencies led toan appreciation of the franc, the Swiss currency has tended to follow move-ments in the D-mark, and now the euro, against other currencies, notably theUS dollar. The bank, which once saw the habitual strength of the currency as away of achieving its price stability objective, has in recent years taken decisiveaction to prevent significant appreciation of the franc against the D-mark.
The close links to Germany and the EMU as a whole, and the resulting cyclicalsynchronisation, have also contributed to a stabilisation of the Swiss francagainst the D-mark and the euro. (For historical data on exchange rates seeReference table 25.)
However, the SNB is aware of the danger of making the Swiss francindistinguishable from the euro. This would risk lifting interest rates towardsthe levels prevailing in the euro area and of importing inflation during periodsof pronounced euro weakness. The appreciation of the Swiss franc followingthe relatively aggressive interest rate hike in March 2000 therefore did not raiseany concern of the SNB and indeed had been presented as desirable.
Switzerland 37
© The Economist Intelligence Unit Limited 2000 EIU Country Profile 2000
Appendices
Sources of information
Federal Customs Administration, Statistique du commerce extérieur de la Suisse(monthly), Berne
Federal Department of Economic Affairs, La Vie économique (monthly), Berne
Federal Energy Office, Swiss Global Energy Statistics (annual), Berne
Federal Finance Administration, Finances publiques en Suisse (annual), Berne
Federal Finance Administration, Les finances de la Confédération en bref, Berne
Federal Office of Agriculture
Gotthard Bank, Foreign Banks in Switzerland (annual), Lugano
Oberzolldirektion (Directorate-general of Swiss Customs)
Société pour le développement de l’économie suisse, Miroir statistique de laSuisse (annual), Geneva
Swisscom, formerly Swiss Telecom, Facts and Figures (annual), Berne
Swiss Farmers’ Union, Landwirtschaftliche Monatszahlen (monthly), Brugg
Swiss Federal Statistics Office, La Balance touristique en Suisse de 1998, Berne
Swiss Federal Statistics Office, Comptes nationaux de la Suisse (annual), Berne
Swiss Federal Statistics Office, Statistical Yearbook of Switzerland, Berne
Swiss Federal Statistics Office, Statistique de l’emploi et de la population activeoccupée (quarterly), Berne
Swiss Federal Statistics Office, Statistique de la production et de la valeur ajoutée(annual), Berne
Swiss National Bank, Les Banques suisses (annual), Zurich
Swiss National Bank, Statistisches Monatsheft (monthly bulletin), Zurich
Swiss Stock Exchange, Annual Report, Monthly Report and Factbook, Zurich
Swiss Tourism Federation, Swiss Tourism in Figures (annual), Berne
International Institute for Strategic Studies, The Military Balance (annual)
International Monetary Fund, International Financial Statistics (monthly)
OECD, Agricultural Policy in OECD Countries, Paris
OECD, Economic Survey of Switzerland (annual), Paris
OECD, Quarterly National Accounts, Paris
UN Food and Agriculture Organisation, Production Yearbook
National statistical sources
International sources

38 Switzerland
EIU Country Profile 2000 © The Economist Intelligence Unit Limited 2000
Energy Data Associates, Bishops Walk House, 19-23 High Street, Pinner,Middlesex, HA5 5PJ
Aldo Albert Benini, Modern Switzerland: A Volume in the Comparative SocietiesSeries, McGraw Hill, New York, 1998
Aubrey Diem, Switzerland: Land, People, Economy, Aljon Print-Craft, Ontario,1986
Dieter Fahrni, An Outline History of Switzerland: From the Origins to the PresentDay, Pro Helvetia, Zurich, 1992
Jonathan Steinberg, Why Switzerland? Cambridge University Press, Cambridge,1996
Michael Butler (Ed.): The Making of Modern Switzerland, 1848-1998, St. Martin’sPress, New York, 2000.
Richard Wildblood, What Makes Switzerland Democratic? Quacks Books, York,1993
The Swiss government: http://www.admin.ch
The Swiss parliament: http://www.parlament.ch
The Swiss National Bank: http://www.snb.ch
The Swiss Federal Statistics Office: http://www.statistik.admin.ch
Reference tables
Reference table 1
Resident population by age and nationality(‘000; annual average)
1995 1996 1997 1998 1999
Age group 0-19 1,647 1,653 1,655 1,658 1,660 20-39 2,173 2,151 2,127 2,107 2,092 40-64 2,198 2,222 2,248 2,279 2,313 65+ 1,044 1,055 1,067 1,078 1,095 Total 7,062 7,081 7,096 7,123 7,160 Swiss 5,699 5,711 5,721 5,740 5,756 Foreign 1,364 1,367 1,375 1,384 1,404
Source: Federal Statistics Office.
Select bibliography andwebsites
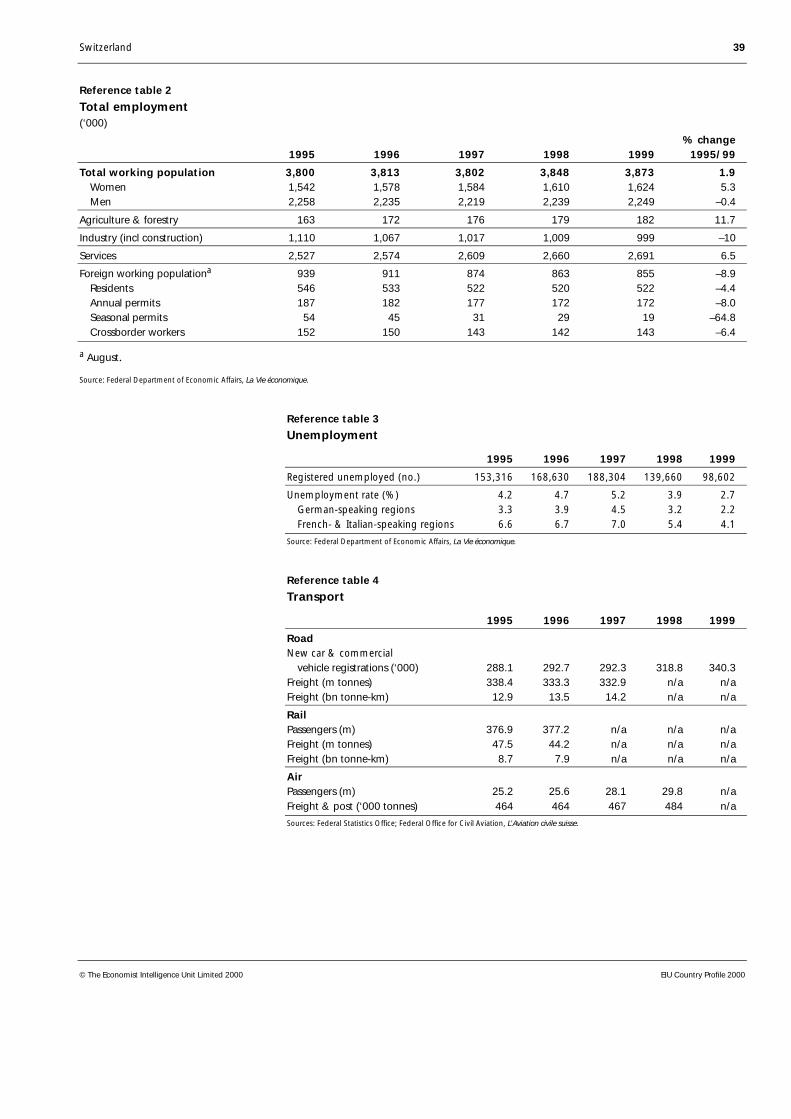
Switzerland 39
© The Economist Intelligence Unit Limited 2000 EIU Country Profile 2000
Reference table 2
Total employment(‘000)
% change1995 1996 1997 1998 1999 1995/99
Total working population 3,800 3,813 3,802 3,848 3,873 1.9 Women 1,542 1,578 1,584 1,610 1,624 5.3 Men 2,258 2,235 2,219 2,239 2,249 –0.4
Agriculture & forestry 163 172 176 179 182 11.7
Industry (incl construction) 1,110 1,067 1,017 1,009 999 –10
Services 2,527 2,574 2,609 2,660 2,691 6.5
Foreign working populationa 939 911 874 863 855 –8.9 Residents 546 533 522 520 522 –4.4 Annual permits 187 182 177 172 172 –8.0 Seasonal permits 54 45 31 29 19 –64.8 Crossborder workers 152 150 143 142 143 –6.4
a August.
Source: Federal Department of Economic Affairs, La Vie économique.
Reference table 3
Unemployment
1995 1996 1997 1998 1999
Registered unemployed (no.) 153,316 168,630 188,304 139,660 98,602
Unemployment rate (%) 4.2 4.7 5.2 3.9 2.7 German-speaking regions 3.3 3.9 4.5 3.2 2.2 French- & Italian-speaking regions 6.6 6.7 7.0 5.4 4.1
Source: Federal Department of Economic Affairs, La Vie économique.
Reference table 4
Transport
1995 1996 1997 1998 1999
RoadNew car & commercial vehicle registrations (‘000) 288.1 292.7 292.3 318.8 340.3Freight (m tonnes) 338.4 333.3 332.9 n/a n/aFreight (bn tonne-km) 12.9 13.5 14.2 n/a n/a
RailPassengers (m) 376.9 377.2 n/a n/a n/aFreight (m tonnes) 47.5 44.2 n/a n/a n/aFreight (bn tonne-km) 8.7 7.9 n/a n/a n/a
AirPassengers (m) 25.2 25.6 28.1 29.8 n/aFreight & post (‘000 tonnes) 464 464 467 484 n/a
Sources: Federal Statistics Office; Federal Office for Civil Aviation, L’Aviation civile suisse.
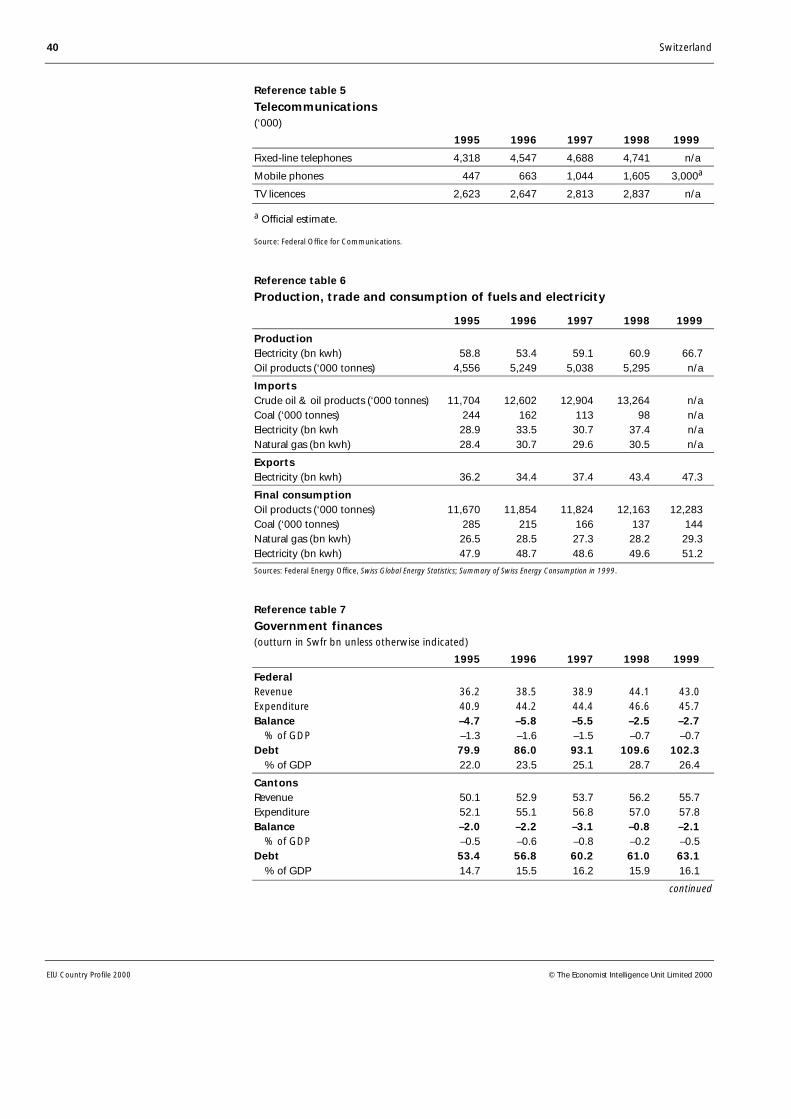
40 Switzerland
EIU Country Profile 2000 © The Economist Intelligence Unit Limited 2000
Reference table 5
Telecommunications(‘000)
1995 1996 1997 1998 1999
Fixed-line telephones 4,318 4,547 4,688 4,741 n/a
Mobile phones 447 663 1,044 1,605 3,000a
TV licences 2,623 2,647 2,813 2,837 n/a
a Official estimate.
Source: Federal Office for Communications.
Reference table 6
Production, trade and consumption of fuels and electricity
1995 1996 1997 1998 1999
ProductionElectricity (bn kwh) 58.8 53.4 59.1 60.9 66.7Oil products (‘000 tonnes) 4,556 5,249 5,038 5,295 n/a
ImportsCrude oil & oil products (‘000 tonnes) 11,704 12,602 12,904 13,264 n/aCoal (‘000 tonnes) 244 162 113 98 n/aElectricity (bn kwh 28.9 33.5 30.7 37.4 n/aNatural gas (bn kwh) 28.4 30.7 29.6 30.5 n/a
ExportsElectricity (bn kwh) 36.2 34.4 37.4 43.4 47.3
Final consumptionOil products (‘000 tonnes) 11,670 11,854 11,824 12,163 12,283Coal (‘000 tonnes) 285 215 166 137 144Natural gas (bn kwh) 26.5 28.5 27.3 28.2 29.3Electricity (bn kwh) 47.9 48.7 48.6 49.6 51.2
Sources: Federal Energy Office, Swiss Global Energy Statistics; Summary of Swiss Energy Consumption in 1999.
Reference table 7
Government finances(outturn in Swfr bn unless otherwise indicated)
1995 1996 1997 1998 1999
FederalRevenue 36.2 38.5 38.9 44.1 43.0 Expenditure 40.9 44.2 44.4 46.6 45.7 Balance –4.7 –5.8 –5.5 –2.5 –2.7 % of GDP –1.3 –1.6 –1.5 –0.7 –0.7 Debt 79.9 86.0 93.1 109.6 102.3 % of GDP 22.0 23.5 25.1 28.7 26.4
CantonsRevenue 50.1 52.9 53.7 56.2 55.7 Expenditure 52.1 55.1 56.8 57.0 57.8 Balance –2.0 –2.2 –3.1 –0.8 –2.1 % of GDP –0.5 –0.6 –0.8 –0.2 –0.5 Debt 53.4 56.8 60.2 61.0 63.1 % of GDP 14.7 15.5 16.2 15.9 16.1
continued
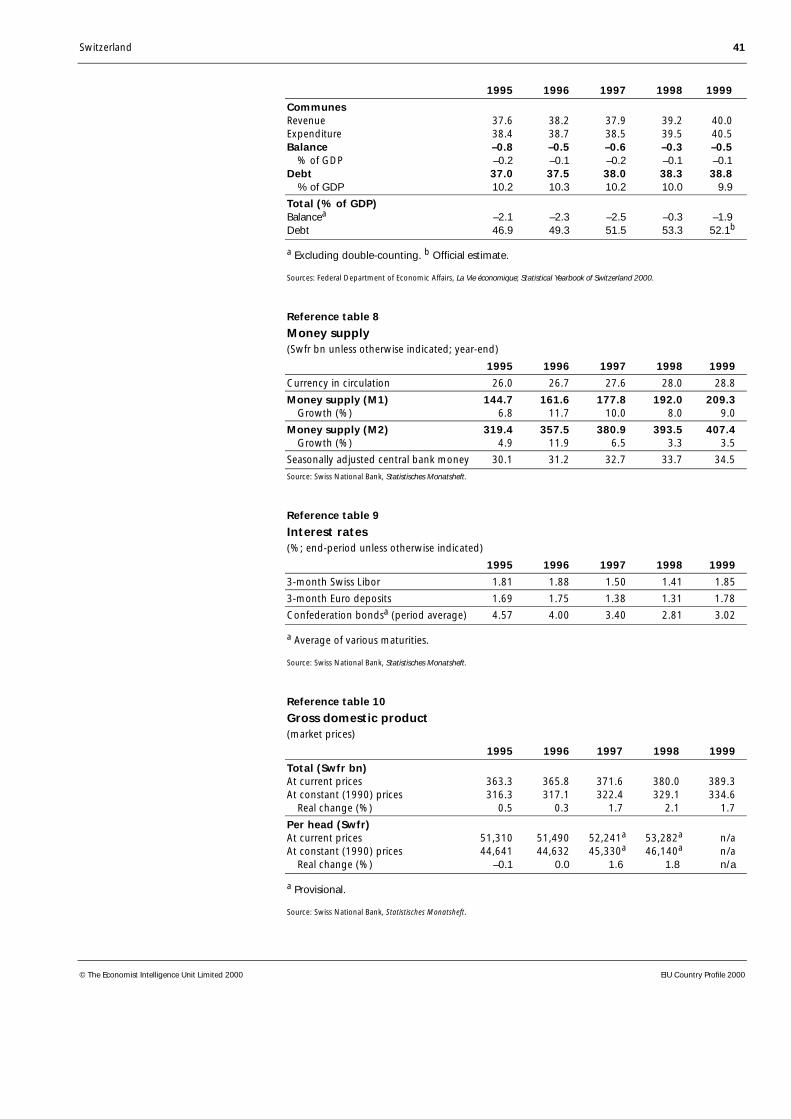
Switzerland 41
© The Economist Intelligence Unit Limited 2000 EIU Country Profile 2000
1995 1996 1997 1998 1999
CommunesRevenue 37.6 38.2 37.9 39.2 40.0 Expenditure 38.4 38.7 38.5 39.5 40.5 Balance –0.8 –0.5 –0.6 –0.3 –0.5 % of GDP –0.2 –0.1 –0.2 –0.1 –0.1 Debt 37.0 37.5 38.0 38.3 38.8 % of GDP 10.2 10.3 10.2 10.0 9.9
Total (% of GDP)Balancea –2.1 –2.3 –2.5 –0.3 –1.9 Debt 46.9 49.3 51.5 53.3 52.1b
a Excluding double-counting. b Official estimate.
Sources: Federal Department of Economic Affairs, La Vie économique; Statistical Yearbook of Switzerland 2000.
Reference table 8
Money supply(Swfr bn unless otherwise indicated; year-end)
1995 1996 1997 1998 1999
Currency in circulation 26.0 26.7 27.6 28.0 28.8
Money supply (M1) 144.7 161.6 177.8 192.0 209.3 Growth (%) 6.8 11.7 10.0 8.0 9.0
Money supply (M2) 319.4 357.5 380.9 393.5 407.4 Growth (%) 4.9 11.9 6.5 3.3 3.5
Seasonally adjusted central bank money 30.1 31.2 32.7 33.7 34.5
Source: Swiss National Bank, Statistisches Monatsheft.
Reference table 9
Interest rates(%; end-period unless otherwise indicated)
1995 1996 1997 1998 1999
3-month Swiss Libor 1.81 1.88 1.50 1.41 1.85
3-month Euro deposits 1.69 1.75 1.38 1.31 1.78
Confederation bondsa (period average) 4.57 4.00 3.40 2.81 3.02
a Average of various maturities.
Source: Swiss National Bank, Statistisches Monatsheft.
Reference table 10
Gross domestic product(market prices)
1995 1996 1997 1998 1999
Total (Swfr bn)At current prices 363.3 365.8 371.6 380.0 389.3At constant (1990) prices 316.3 317.1 322.4 329.1 334.6 Real change (%) 0.5 0.3 1.7 2.1 1.7
Per head (Swfr)At current prices 51,310 51,490 52,241a 53,282a n/aAt constant (1990) prices 44,641 44,632 45,330a 46,140a n/a Real change (%) –0.1 0.0 1.6 1.8 n/a
a Provisional.
Source: Swiss National Bank, Statistisches Monatsheft.
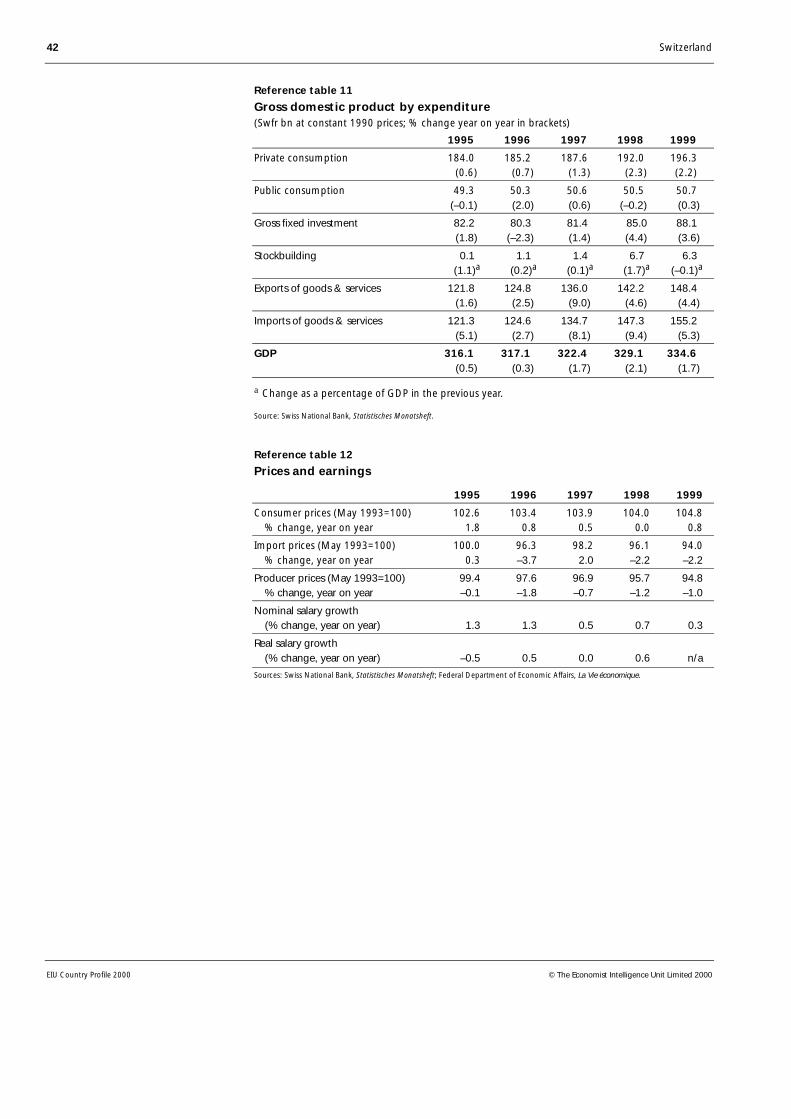
42 Switzerland
EIU Country Profile 2000 © The Economist Intelligence Unit Limited 2000
Reference table 11
Gross domestic product by expenditure(Swfr bn at constant 1990 prices; % change year on year in brackets)
1995 1996 1997 1998 1999
Private consumption 184.0 185.2 187.6 192.0 196.3 (0.6) (0.7) (1.3) (2.3) (2.2)
Public consumption 49.3 50.3 50.6 50.5 50.7 (–0.1) (2.0) (0.6) (–0.2) (0.3)
Gross fixed investment 82.2 80.3 81.4 85.0 88.1 (1.8) (–2.3) (1.4) (4.4) (3.6)
Stockbuilding 0.1 1.1 1.4 6.7 6.3 (1.1)a (0.2)a (0.1)a (1.7)a (–0.1)a
Exports of goods & services 121.8 124.8 136.0 142.2 148.4 (1.6) (2.5) (9.0) (4.6) (4.4)
Imports of goods & services 121.3 124.6 134.7 147.3 155.2 (5.1) (2.7) (8.1) (9.4) (5.3)
GDP 316.1 317.1 322.4 329.1 334.6 (0.5) (0.3) (1.7) (2.1) (1.7)
a Change as a percentage of GDP in the previous year.
Source: Swiss National Bank, Statistisches Monatsheft.
Reference table 12
Prices and earnings
1995 1996 1997 1998 1999
Consumer prices (May 1993=100) 102.6 103.4 103.9 104.0 104.8 % change, year on year 1.8 0.8 0.5 0.0 0.8
Import prices (May 1993=100) 100.0 96.3 98.2 96.1 94.0 % change, year on year 0.3 –3.7 2.0 –2.2 –2.2
Producer prices (May 1993=100) 99.4 97.6 96.9 95.7 94.8 % change, year on year –0.1 –1.8 –0.7 –1.2 –1.0
Nominal salary growth (% change, year on year) 1.3 1.3 0.5 0.7 0.3
Real salary growth (% change, year on year) –0.5 0.5 0.0 0.6 n/a
Sources: Swiss National Bank, Statistisches Monatsheft; Federal Department of Economic Affairs, La Vie économique.
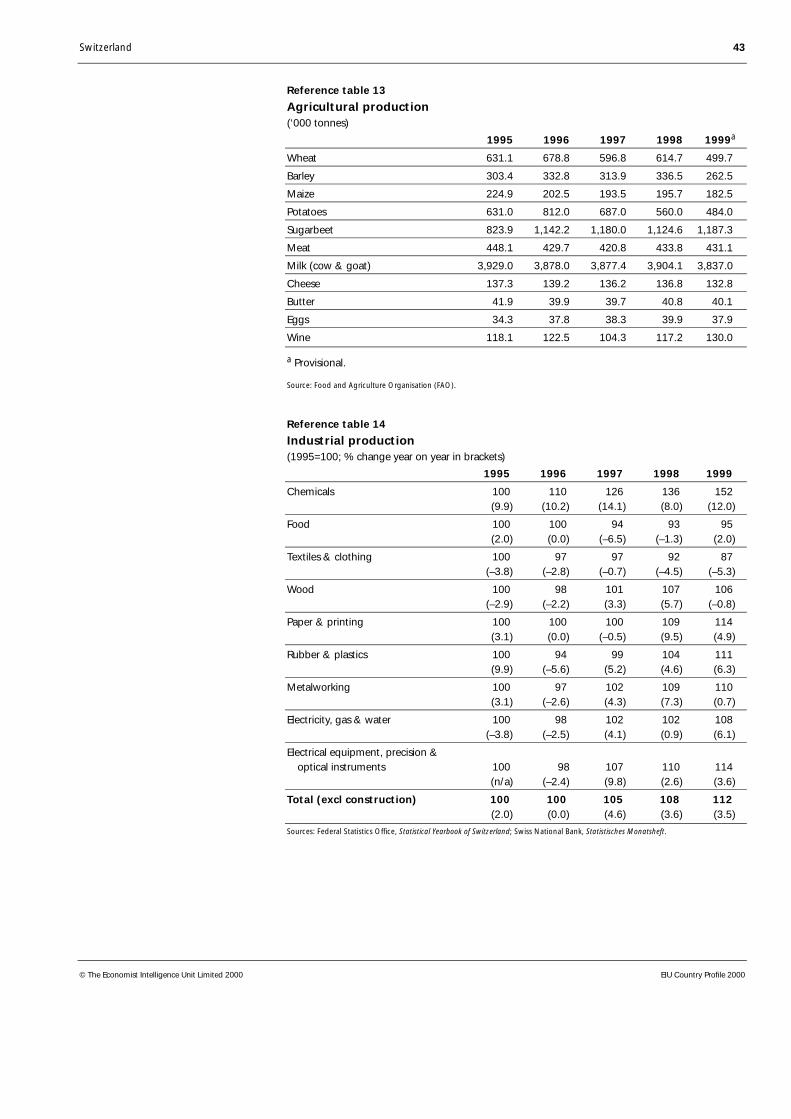
Switzerland 43
© The Economist Intelligence Unit Limited 2000 EIU Country Profile 2000
Reference table 13
Agricultural production(‘000 tonnes)
1995 1996 1997 1998 1999a
Wheat 631.1 678.8 596.8 614.7 499.7
Barley 303.4 332.8 313.9 336.5 262.5
Maize 224.9 202.5 193.5 195.7 182.5
Potatoes 631.0 812.0 687.0 560.0 484.0
Sugarbeet 823.9 1,142.2 1,180.0 1,124.6 1,187.3
Meat 448.1 429.7 420.8 433.8 431.1
Milk (cow & goat) 3,929.0 3,878.0 3,877.4 3,904.1 3,837.0
Cheese 137.3 139.2 136.2 136.8 132.8
Butter 41.9 39.9 39.7 40.8 40.1
Eggs 34.3 37.8 38.3 39.9 37.9
Wine 118.1 122.5 104.3 117.2 130.0
a Provisional.
Source: Food and Agriculture Organisation (FAO).
Reference table 14
Industrial production(1995=100; % change year on year in brackets)
1995 1996 1997 1998 1999
Chemicals 100 110 126 136 152 (9.9) (10.2) (14.1) (8.0) (12.0)
Food 100 100 94 93 95 (2.0) (0.0) (–6.5) (–1.3) (2.0)
Textiles & clothing 100 97 97 92 87 (–3.8) (–2.8) (–0.7) (–4.5) (–5.3)
Wood 100 98 101 107 106 (–2.9) (–2.2) (3.3) (5.7) (–0.8)
Paper & printing 100 100 100 109 114 (3.1) (0.0) (–0.5) (9.5) (4.9)
Rubber & plastics 100 94 99 104 111 (9.9) (–5.6) (5.2) (4.6) (6.3)
Metalworking 100 97 102 109 110 (3.1) (–2.6) (4.3) (7.3) (0.7)
Electricity, gas & water 100 98 102 102 108 (–3.8) (–2.5) (4.1) (0.9) (6.1)
Electrical equipment, precision & optical instruments 100 98 107 110 114
(n/a) (–2.4) (9.8) (2.6) (3.6)
Total (excl construction) 100 100 105 108 112 (2.0) (0.0) (4.6) (3.6) (3.5)
Sources: Federal Statistics Office, Statistical Yearbook of Switzerland; Swiss National Bank, Statistisches Monatsheft.
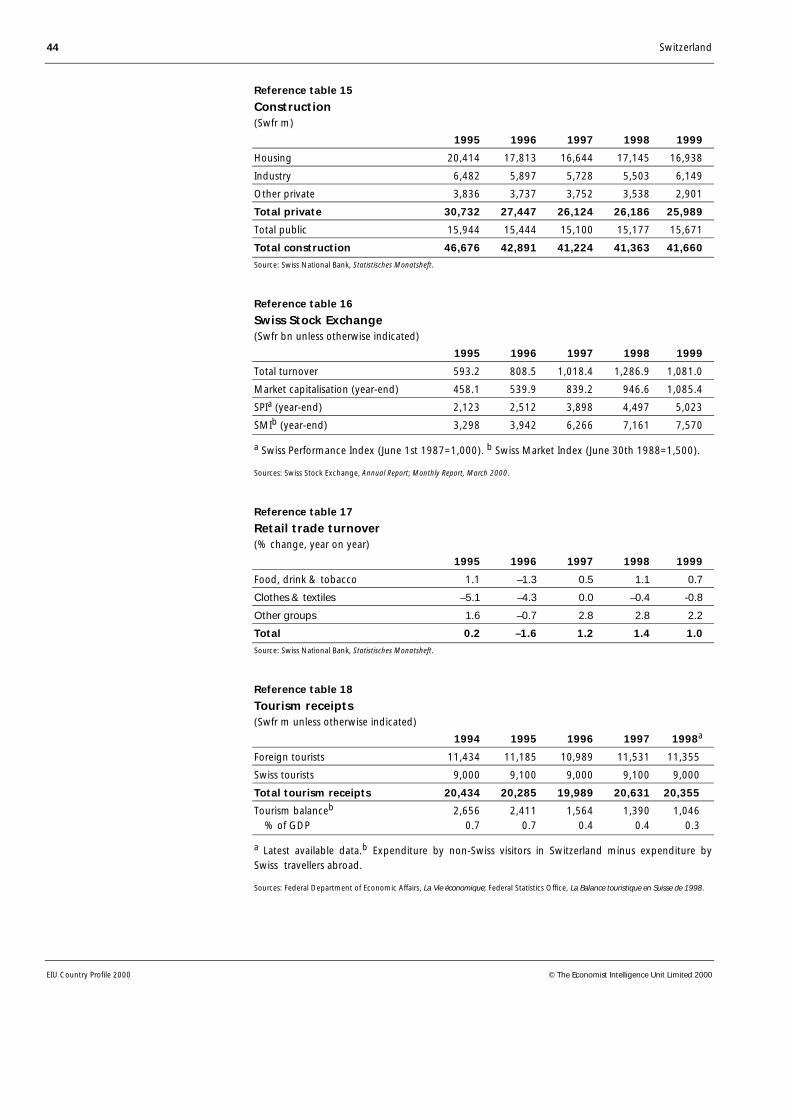
44 Switzerland
EIU Country Profile 2000 © The Economist Intelligence Unit Limited 2000
Reference table 15
Construction(Swfr m)
1995 1996 1997 1998 1999
Housing 20,414 17,813 16,644 17,145 16,938
Industry 6,482 5,897 5,728 5,503 6,149
Other private 3,836 3,737 3,752 3,538 2,901
Total private 30,732 27,447 26,124 26,186 25,989
Total public 15,944 15,444 15,100 15,177 15,671
Total construction 46,676 42,891 41,224 41,363 41,660
Source: Swiss National Bank, Statistisches Monatsheft.
Reference table 16
Swiss Stock Exchange(Swfr bn unless otherwise indicated)
1995 1996 1997 1998 1999
Total turnover 593.2 808.5 1,018.4 1,286.9 1,081.0
Market capitalisation (year-end) 458.1 539.9 839.2 946.6 1,085.4
SPIa (year-end) 2,123 2,512 3,898 4,497 5,023
SMIb (year-end) 3,298 3,942 6,266 7,161 7,570
a Swiss Performance Index (June 1st 1987=1,000). b Swiss Market Index (June 30th 1988=1,500).
Sources: Swiss Stock Exchange, Annual Report; Monthly Report, March 2000.
Reference table 17
Retail trade turnover(% change, year on year)
1995 1996 1997 1998 1999
Food, drink & tobacco 1.1 –1.3 0.5 1.1 0.7
Clothes & textiles –5.1 –4.3 0.0 –0.4 -0.8
Other groups 1.6 –0.7 2.8 2.8 2.2
Total 0.2 –1.6 1.2 1.4 1.0
Source: Swiss National Bank, Statistisches Monatsheft.
Reference table 18
Tourism receipts(Swfr m unless otherwise indicated)
1994 1995 1996 1997 1998a
Foreign tourists 11,434 11,185 10,989 11,531 11,355
Swiss tourists 9,000 9,100 9,000 9,100 9,000
Total tourism receipts 20,434 20,285 19,989 20,631 20,355
Tourism balanceb 2,656 2,411 1,564 1,390 1,046 % of GDP 0.7 0.7 0.4 0.4 0.3
a Latest available data.b Expenditure by non-Swiss visitors in Switzerland minus expenditure bySwiss travellers abroad.
Sources: Federal Department of Economic Affairs, La Vie économique; Federal Statistics Office, La Balance touristique en Suisse de 1998.

Switzerland 45
© The Economist Intelligence Unit Limited 2000 EIU Country Profile 2000
Reference table 19
Composition of trade(Swfr m)
1995 1996 1997 1998 1999
Exports fobAgricultural produce 3,535 3,511 3,818 3,807 4,014Fuel & energy 88 112 257 228 262Textiles, clothing & shoes 3,953 3,672 3,933 3,969 3,787Paper 2,527 2,476 2,828 3,011 3,205Leather, rubber & plastics 2,868 2,711 2,979 3,168 3,362Chemicals 23,586 25,954 29,647 31,302 33,991Construction materials 734 705 781 787 799Metals & metal manufactures 8,346 8,189 9,067 9,557 9,471Machines 27,396 28,047 30,882 31,922 32,642Vehicles 1,936 2,444 2,525 2,801 3,159Watches, jewellery & precision instruments 14,945 14,681 16,712 16,725 17,732Total incl others 92,012 94,174 105,133 109,113 114,446
Imports cifAgricultural produce 8,070 8,284 8,887 9,259 9,560Fuel & energy 2,656 3,352 4,888 3,363 3,514Textiles, clothing & shoes 7,918 7,837 8,420 8,604 8,521Paper 4,175 4,040 4,235 4,429 4,594Leather, rubber & plastics 3,638 3,462 3.707 3,856 3,973Chemicals 12,982 13,520 16,793 17,797 19,322Construction materials 2,012 1,976 2,028 2,122 2,164Metals & metal manufactures 8,912 8,042 8,944 9,517 9,108Machines 20,474 20,749 23,083 24,657 26,966Vehicles 10,600 11,200 11,324 12,283 14,422Watches, jewellery & precision instruments 5,597 5,761 6,845 6,818 6,849Total incl others 90,776 91,967 103,088 106,866 113,416
Source: Federal Department of Economic Affairs, La Vie économique.
Reference table 20
Main trading partners(Swfr m; % of total in brackets)
1995 1996 1997 1998 1999
Exports fob to:Germany 22,561 21,969 24,143 25,793 26,617
(24.5) (23.3) (23.0) (23.6) (23.3)France 8,907 8,864 9,658 10,489 10,714
(9.7) (9.4) (9.2) (9.6) (9.4)US 7,747 8,426 10,319 11,097 13,033
(8.4) (9.0) (9.8) (10.2) (11.4)Italy 7,171 7,252 8,030 8,545 9,103
(7.8) (7.7) (7.6) (7.8) (8.0)UK 4,748 5,349 5,797 6,210 6,159
(5.2) (5.7) (5.5) (5.7) (5.4)Japan 3,551 3,837 4,011 3,847 4,089
(3.9) (4.1) (3.8) (3.5) (3.6)EU 57,605 57,865 63,865 69,094 71,621
(62.6) (61.4) (60.7) (63.3) (62.6)Total incl others 92,012 94,174 105,133 109,113 114,446
continued
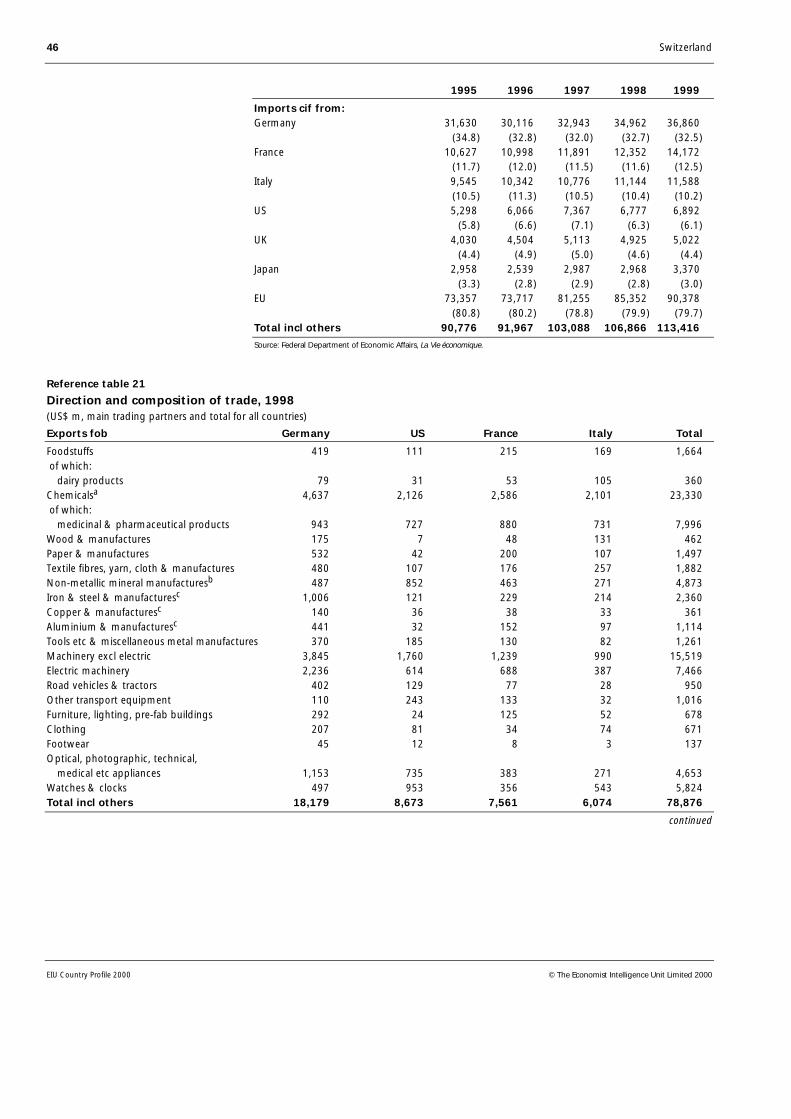
46 Switzerland
EIU Country Profile 2000 © The Economist Intelligence Unit Limited 2000
1995 1996 1997 1998 1999
Imports cif from:Germany 31,630 30,116 32,943 34,962 36,860
(34.8) (32.8) (32.0) (32.7) (32.5)France 10,627 10,998 11,891 12,352 14,172
(11.7) (12.0) (11.5) (11.6) (12.5)Italy 9,545 10,342 10,776 11,144 11,588
(10.5) (11.3) (10.5) (10.4) (10.2)US 5,298 6,066 7,367 6,777 6,892
(5.8) (6.6) (7.1) (6.3) (6.1)UK 4,030 4,504 5,113 4,925 5,022
(4.4) (4.9) (5.0) (4.6) (4.4)Japan 2,958 2,539 2,987 2,968 3,370
(3.3) (2.8) (2.9) (2.8) (3.0)EU 73,357 73,717 81,255 85,352 90,378
(80.8) (80.2) (78.8) (79.9) (79.7)Total incl others 90,776 91,967 103,088 106,866 113,416
Source: Federal Department of Economic Affairs, La Vie économique.
Reference table 21
Direction and composition of trade, 1998(US$ m, main trading partners and total for all countries)
Exports fob Germany US France Italy Total
Foodstuffs 419 111 215 169 1,664 of which: dairy products 79 31 53 105 360Chemicalsa 4,637 2,126 2,586 2,101 23,330 of which: medicinal & pharmaceutical products 943 727 880 731 7,996Wood & manufactures 175 7 48 131 462Paper & manufactures 532 42 200 107 1,497Textile fibres, yarn, cloth & manufactures 480 107 176 257 1,882Non-metallic mineral manufacturesb 487 852 463 271 4,873Iron & steel & manufacturesc 1,006 121 229 214 2,360Copper & manufacturesc 140 36 38 33 361Aluminium & manufacturesc 441 32 152 97 1,114Tools etc & miscellaneous metal manufactures 370 185 130 82 1,261Machinery excl electric 3,845 1,760 1,239 990 15,519Electric machinery 2,236 614 688 387 7,466Road vehicles & tractors 402 129 77 28 950Other transport equipment 110 243 133 32 1,016Furniture, lighting, pre-fab buildings 292 24 125 52 678Clothing 207 81 34 74 671Footwear 45 12 8 3 137Optical, photographic, technical, medical etc appliances 1,153 735 383 271 4,653Watches & clocks 497 953 356 543 5,824Total incl others 18,179 8,673 7,561 6,074 78,876
continued
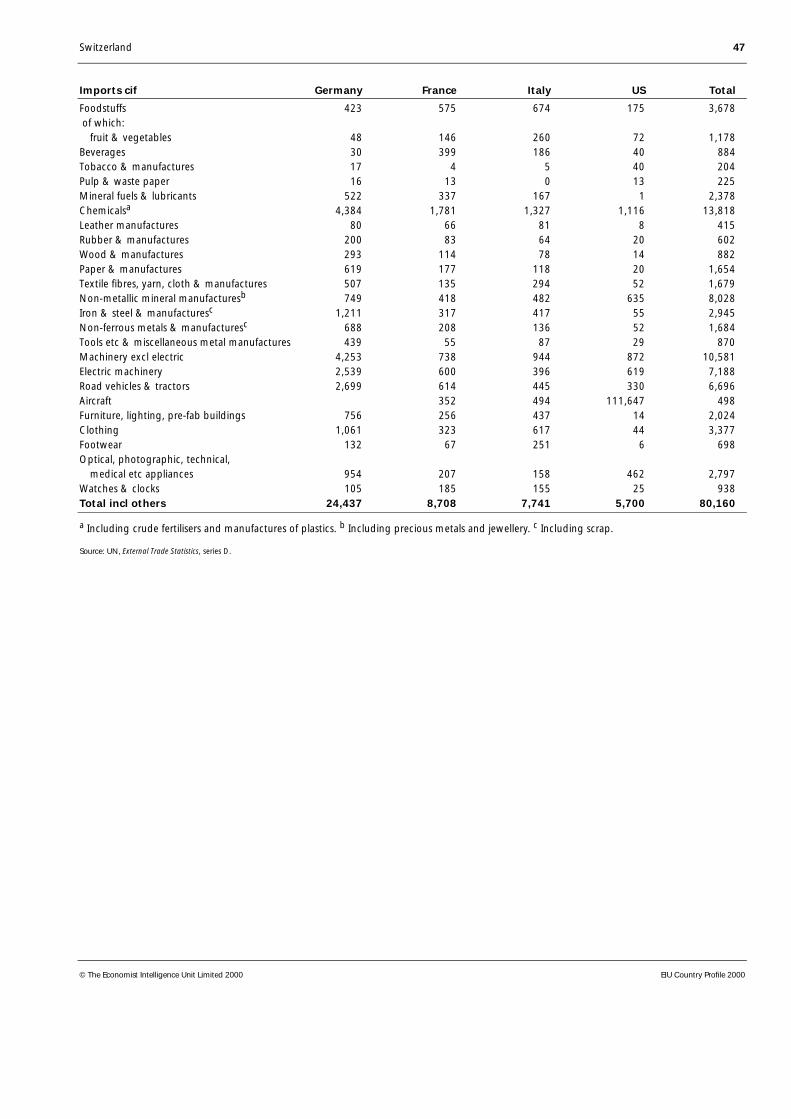
Switzerland 47
© The Economist Intelligence Unit Limited 2000 EIU Country Profile 2000
Imports cif Germany France Italy US Total
Foodstuffs 423 575 674 175 3,678 of which: fruit & vegetables 48 146 260 72 1,178Beverages 30 399 186 40 884Tobacco & manufactures 17 4 5 40 204Pulp & waste paper 16 13 0 13 225Mineral fuels & lubricants 522 337 167 1 2,378Chemicalsa 4,384 1,781 1,327 1,116 13,818Leather manufactures 80 66 81 8 415Rubber & manufactures 200 83 64 20 602Wood & manufactures 293 114 78 14 882Paper & manufactures 619 177 118 20 1,654Textile fibres, yarn, cloth & manufactures 507 135 294 52 1,679Non-metallic mineral manufacturesb 749 418 482 635 8,028Iron & steel & manufacturesc 1,211 317 417 55 2,945Non-ferrous metals & manufacturesc 688 208 136 52 1,684Tools etc & miscellaneous metal manufactures 439 55 87 29 870Machinery excl electric 4,253 738 944 872 10,581Electric machinery 2,539 600 396 619 7,188Road vehicles & tractors 2,699 614 445 330 6,696Aircraft 352 494 111,647 498Furniture, lighting, pre-fab buildings 756 256 437 14 2,024Clothing 1,061 323 617 44 3,377Footwear 132 67 251 6 698Optical, photographic, technical, medical etc appliances 954 207 158 462 2,797Watches & clocks 105 185 155 25 938Total incl others 24,437 8,708 7,741 5,700 80,160
a Including crude fertilisers and manufactures of plastics. b Including precious metals and jewellery. c Including scrap.
Source: UN, External Trade Statistics, series D.

48 Switzerland
EIU Country Profile 2000 © The Economist Intelligence Unit Limited 2000
Reference table 22
Balance of payments, IMF series(US$ m)
1994 1995 1996 1997 1998a
Goods: exports fob 82.63 97.14 95.54 95.04 93.86
Goods: imports fob –79.30 –93.92 –93.29 –92.25 –92.87
Trade balance 3.33 3.22 2.25 2.79 0.99
Services: credit 22.62 26.03 26.25 25.30 26.68
Services: debit –12.97 –15.24 –15.91 –14.29 –15.41
Income: credit 26.75 31.58 33.00 35.07 43.72
Income: debit –18.93 –19.78 –20.38 –18.51 –27.70
Current transfers: credit 2.53 3.00 2.96 2.63 2.79
Current transfers: debit –5.95 –7.24 –6.95 –6.03 –6.52
Current-account balance 17.37 21.56 21.22 26.96 24.55
Direct investment in Switzerland 4.10 3.60 4.37 5.69 5.49
Direct investment abroad –10.79 –12.21 –16.15 –18.01 –14.23
Inward portfolio investment (incl bonds) 0.91 4.96 12.90 9.03 10.25
Outward portfolio investment –19.06 –8.86 –22.40 –20.96 –14.81
Other investment assets –31.09 –0.74 –70.80 –54.17 –59.72
Other investment liabilities 39.32 0.20 64.67 51.72 43.32
Financial balance –16.60 –13.04 –27.41 –26.69 –29.70
Capital account nie credit 0 0 0 0 0
Capital account nie debit –0.15 –0.13 –0.12 –0.08 –0.30
Capital account nie balance –0.15 –0.13 –0.12 –0.08 –0.30
Net errors & omissions 0.44 –8.34 9.06 1.97 6.35
Overall balance 1.06 0.05 2.75 2.16 0.90
Financing (– indicates inflow)Movement of reserves –1.06 –0.05 –2.75 –2.16 0.90
a Latest available data.
Source: IMF, International Financial Statistics.
Reference table 23
Balance of payments, national estimates(Swfr m)
1995 1996 1997 1998 1999
Goods: exports fob 99,847 102,171 114,215 118,350 124,845
Goods: imports fob –98,807 –101,024 –114,669 –120,565 –125,014
Trade balance 1,040 1,147 –454 –2,216 –169
Services: credit 30,776 32,445 36,723 38,685 41,621
Services: debit –15,565 –17,084 –17,787 –19,657 –20,305
Income: credit 37,336 40,784 50,890 63,386 66,486
Income: debit –23,387 –25,193 –26,843 –40,163 –38,334
Current transfers: credit 3,542 3,659 3,810 4,041 4,423
Current transfers: debit –8,557 –8,590 –8,746 –9,457 –9,795
Current-account balance 25,184 27,168 37,593 34,618 43,927
Source: Swiss National Bank, Statistisches Monatsheft.
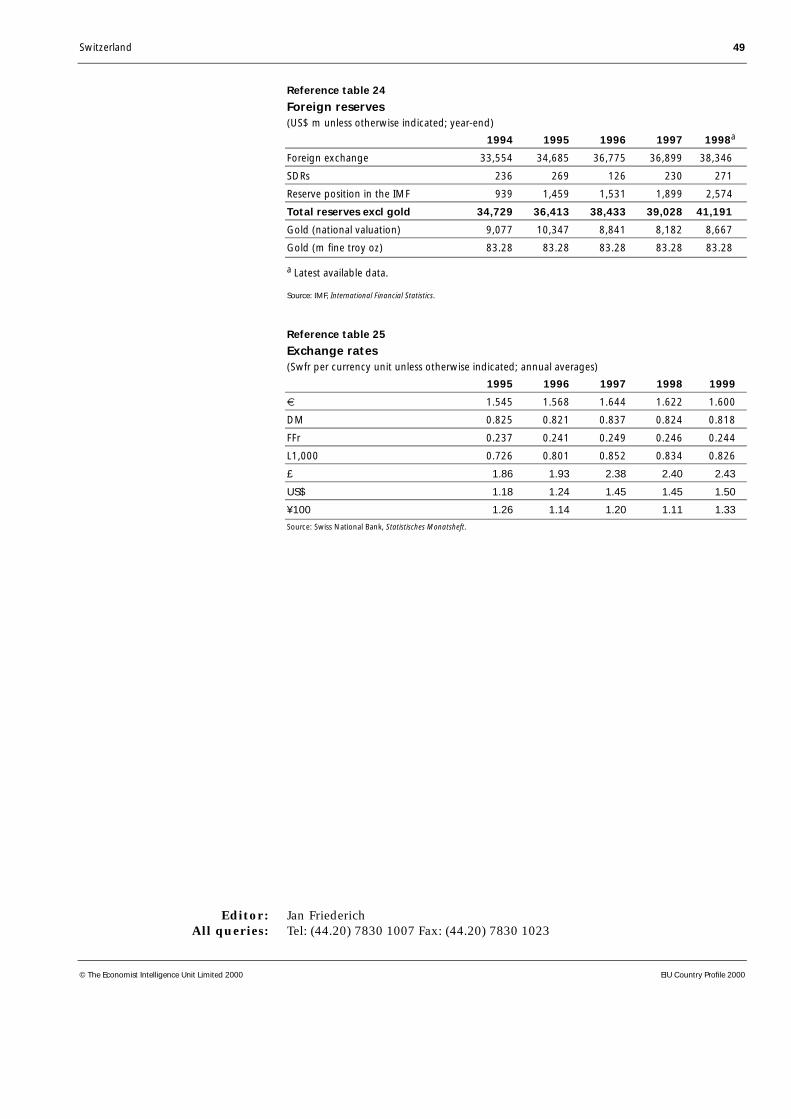
Switzerland 49
© The Economist Intelligence Unit Limited 2000 EIU Country Profile 2000
Reference table 24
Foreign reserves(US$ m unless otherwise indicated; year-end)
1994 1995 1996 1997 1998a
Foreign exchange 33,554 34,685 36,775 36,899 38,346
SDRs 236 269 126 230 271
Reserve position in the IMF 939 1,459 1,531 1,899 2,574
Total reserves excl gold 34,729 36,413 38,433 39,028 41,191
Gold (national valuation) 9,077 10,347 8,841 8,182 8,667
Gold (m fine troy oz) 83.28 83.28 83.28 83.28 83.28
a Latest available data.
Source: IMF, International Financial Statistics.
Reference table 25
Exchange rates(Swfr per currency unit unless otherwise indicated; annual averages)
1995 1996 1997 1998 1999
€ 1.545 1.568 1.644 1.622 1.600
DM 0.825 0.821 0.837 0.824 0.818
FFr 0.237 0.241 0.249 0.246 0.244
L1,000 0.726 0.801 0.852 0.834 0.826
£ 1.86 1.93 2.38 2.40 2.43
US$ 1.18 1.24 1.45 1.45 1.50
¥100 1.26 1.14 1.20 1.11 1.33
Source: Swiss National Bank, Statistisches Monatsheft.
Editor: Jan FriederichAll queries: Tel: (44.20) 7830 1007 Fax: (44.20) 7830 1023