Embed Size (px)
Citation preview

IPART
Sydney Water Corporation - Expenditure Review Supplementary Report
01 July 2016

Sydney Water Corporation - Expenditure Review Supplementary Report
Sydney Water Corporation - Expenditure Review | Version 2.2 | 01 July 2016 | 5145571 2
Notice
This document and its contents have been prepared and are intended solely for IPART’s information and use in relation to Sydney Water’s expenditure review 2015.
WS Atkins International (Australia) Limited (‘Atkins’), in association with Cardno (Queensland) Pty (‘Cardno’), assumes no responsibility to any other party in respect of or arising out of or in connection with this document and/or its contents.
This document has 57 pages including the cover.
Document history
Job number: 5145571 Document ref:
Revision Purpose description Originated Checked Reviewed Authorised Date
Rev 1.0 Draft JNSJ, GJ, DF SJI JNSJ GJ 11/05/16
Rev 2.0 Final JNSJ, GJ, DF SJI JNSJ GJ 26/05/16
Rev 2.1 Final JNSJ, GJ, DF SJI JNSJ GJ 06/06/16
Rev 2.2 Final JNSJ, GJ, DF SJI JNSJ GJ 01/07/16

Sydney Water Corporation - Expenditure Review Supplementary Report
Sydney Water Corporation - Expenditure Review | Version 2.2 | 01 July 2016 | 5145571 3
Table of contents
Chapter Pages
Table of contents 3
Glossary 6
Executive summary 8
1. Introduction 12 1.1 Terms of Reference 12 1.2 Sydney Water Corporation submission to IPART 12 1.3 Review Process 12
2. Operating Expenditure 13 2.1. Efficient Expenditure in IPART Draft Report 13 2.2. Sydney Water Submission 13 2.3. Review 14 2.4. Findings 15 2.5. Impact on Expenditure Proposals 15
3. Prudent Expenditure 17 3.1. Prudent Expenditure in the IPART Draft Report 17 3.2. Sydney Water Submission 17 3.3. Review 17 3.4. Finding 18 3.5. Impact on the Price Control 18 3.6. Other Representations on IT Expenditure 18
4. Capital Expenditure 19 4.1. Capital Efficiency 19 4.2. Metering 21 4.3. North West Growth Centre 24 4.4. Wastewater Treatment Works Renewals 27 4.5. North Head Biosolids 30 4.6. Avoid Fail Sewers 35 4.7. Reticulation Mains Renewals 37
5. Asset Lives 40
6. Total Efficient Expenditure 41 6.1. Operating Expenditure 41 6.2. Prudent Expenditure 42 6.3. Capital Expenditure 42
Appendices 51
Appendix A. Terms of Reference 52
Appendix B. Response to representations on the IPART Draft Report related to Sydney Water’s IT proposal 56

Sydney Water Corporation - Expenditure Review Supplementary Report
Sydney Water Corporation - Expenditure Review | Version 2.2 | 01 July 2016 | 5145571 4
Tables Table 1-1 Efficient Expenditure after May 2016 review ........................................................................... 8 Table 1-2 Efficient Expenditure after May 2016 review ........................................................................... 9 Table 1-3 Efficient level of Capital Expenditure at company level ......................................................... 11 Table 2-1 Operating expenditure – Change to electricity cost adjustment ............................................ 15 Table 2-2 Efficient Operating Expenditure in the future price path ........................................................ 16 Table 3-1 Recommended prudency adjustment in the future price path............................................... 18 Table 4-1 Future Price Path – Proposed Capital Efficiencies % ........................................................... 19 Table 4-2 Sydney Water’s breakdown of delivery efficiencies applied to growth program ................... 20 Table 4-3 Summary of Recommended Adjustments to take account of double-counting of efficiency in the growth program ......................................................................................................................................... 21 Table 4-4 Revised Meter Program Activities and Expenditure .............................................................. 24 Table 4-5 Summary of Revised Capital Expenditure Recommendations: Metering ............................. 24 Table 4-6 Summary of Revised Capital Expenditure Recommendations: NWGC ................................ 26 Table 4-7 Summary of Revised Capital Expenditure Recommendations – WWTP Renewals ............. 30 Table 4-8 Summary of Revised Capital Expenditure Recommendations- North Head Biosolids ......... 34 Table 4-9 Summary of Revised Capital Expenditure Recommendations – Avoid Fail Sewer Renewals . ............................................................................................................................................... 37 Table 4-10 Summary of Revised Capital Expenditure Recommendations – Reticulation Main Renewals . ............................................................................................................................................... 39 Table 6-1 Summary of Revised Assesment of Efficient Operating Expenditure ................................... 41 Table 6-2 Recommended prudency adjustment in the future price path............................................... 42 Table 6-3 Summary of Revised Assesment of Efficient Capital Expenditure ........................................ 43 Table 6-4 Summary of IPART Draft Report Capital Program Adjustments by Year ............................. 43 Table 6-5 Summary of Revised Capital Program Adjustments by Year (15-16M) ................................ 44 Table 6-6 Water Service: Summary of Revised Assesment of Efficient Capital Expenditure ............... 45 Table 6-7 Wastewater Service: Summary of Revised Assesment of Efficient Capital Expenditure...... 46 Table 6-8 Stormwater Service: Summary of Efficient Capital Expenditure- NOT AMENDED .............. 47 Table 6-9 Corporate Service: Summary of Efficient Capital Expenditure- NOT AMENDED ................. 48 Table 6-10 Summary of Prudent Efficient Capital Expenditure ............................................................... 49
Figures Figure 1-1 Summary of revised capital expenditure program recommendation for 2017-20 ($15-16M) 10 Figure 4-1 Metered consumption distribution for 20mm household meters ........................................... 22 Figure 4-2 20mm Household Meter Replacement by Age and Consumption Drivers ............................ 23 Figure 4-3 Reprofiling of NWGC water service expenditure in IPART Draft Report (pre-efficiency)...... 25 Figure 4-4 Sydney Water’s updated development outturn and projections for NWGC .......................... 25 Figure 4-5 Revised capital expenditure recommendation: NWGC (pre-efficiency) ................................ 27 Figure 4-6 Approach to re-calculating WWTP Renewals expenditure allowance ($M) .......................... 29 Figure 4-7 Assuming that the treated effluent quality is better than the historical median significantly affects the urgency of a second additional digester ........................................................................................ 32 Figure 4-8 A lower monthly peaking factor significantly pushes back the need for a second additional digester even assuming a treated effluent TSS of 175 ................................................................................... 33 Figure 4-9 Revised capital expenditure recommendation: North Head WWTP Bisolids Amplification (pre-efficiency) ............................................................................................................................................... 34 Figure 4-10 Approach to re-calculating NSOOS Avoid Fail Sewer Renewals expenditure allowance .... 36 Figure 4-11 Trend in reticulation mains breaks and leaks ........................................................................ 38 Figure 4-12 Water continuity – performance against operating licence measure .................................... 38 Figure 6-1 Summary of revised capital expenditure program recommendation in 2017-20 ($15-16M) . 44 Figure 6-2 Assessment of Efficient Capex versus the Proposed Level by Product ............................... 50

Sydney Water Corporation - Expenditure Review Supplementary Report
Sydney Water Corporation - Expenditure Review | Version 2.2 | 01 July 2016 | 5145571
5

Sydney Water Corporation - Expenditure Review Supplementary Report
Sydney Water Corporation - Expenditure Review | Version 2.2 | 01 July 2016 | 5145571
6
Glossary
Term Definition
AIR Annual Information Return
CMA Competition and Markets Authority, UK
CRC Current Replacement Cost
CRM Customer Relationship Management System
CWM Critical Water Main
DD Draft Determination
DSP Developer Service Plans
ECM Efficiency Carryover Mechanism
EPPM Enterprise Program and Project Management
ERP Enterprise Resource Planning
E&W England and Wales (water companies of)
IPART Independent Pricing and Regulatory Tribunal
MEERA Modern Engineering Equivalent Replacement Asset
MLD Mega litres per Day
MOU Memorandum of Understanding
NPV Net present value
NSOOS Northern Suburbs Ocean Outfall Sewer
NWGC North West Growth Centre
PBC Program Business Case
PCA Process Capability Assessment
PCG Project Control Group
RAB Regulated Asset Base
RBCE Risk Based Cost Estimate
RCM Regulatory Cost Model

Sydney Water Corporation - Expenditure Review Supplementary Report
Sydney Water Corporation - Expenditure Review | Version 2.2 | 01 July 2016 | 5145571
7
Term Definition
SAP It is a trademark name for a leading Enterprise Resource Planning system (Systeme, Anwendungen, Produkte in der Datenverarbeitung which translates from German into Systems, Applications & Products in Data Processing).
SCADA System Control and Data Acquisition
SWC Sydney Water Corporation
SWIMS Sydney Water Information Management System
T2020 Billing system replacement for Access
TSS Total Suspended Solids
WFP Water Filtration Plant
WWTP Wastewater Treatment Plant

Sydney Water Corporation - Expenditure Review Supplementary Report
Sydney Water Corporation - Expenditure Review | Version 2.2 | 01 July 2016 | 5145571
8
Executive summary
This report presents the findings of our review of Sydney Water’s representations on the capital and operating expenditure elements of IPART’s Draft Report. IPART issued its Draft Determination and Report in March 2016. Sydney Water submitted a document in response to the Draft Report in April 2016. We were subsequently asked by IPART to review this submission and report our findings to the Tribunal. This report has been prepared in accordance with the Terms of Reference set out in the contract between Atkins/Cardno and IPART dated 6th April 2016.
The scope of our review focused on those areas of expenditure challenged by Sydney Water. This comprised operating expenditure, prudent expenditure and elements of capital expenditure related to metering, North West Growth Centre, wastewater treatment works renewals, North Head biosolids, avoid fail sewers, reticulation water mains and capital procurement efficiency.
We held a series of meetings with Sydney Water on 27 and 28 April to discuss specific areas of challenge. We set out our approach to the review of efficiency and prudency and discussed Sydney Water’s representations. Further information was provided by Sydney Water at and following these meetings. We discussed our findings with the IPART Secretariat and presented our findings to the Tribunal on 4 May 2016. This Supplementary Report sets out our findings of this review. This report should be read in parallel with our Final Report on the Efficiency Review1.
Operating Expenditure
Sydney Water has responded positively to the efficiency challenge made by the Draft Report and has carried out further analysis to identify more efficiencies from core operating expenditure. While we still consider there are further efficiencies to be made, which may be incentivised through the opex ECM, they are difficult to quantify and validate with sufficient certainty. Sydney Water identified cost risks although these have a small impact on the total future price path expenditure which we believe can be managed by a highly experienced and professional team. We therefore accept the Sydney Water revised proposals.
IPART has advised us that its view on efficient electricity costs has resulted in a change to the efficient expenditure adjustment from -$19.4M to -$9.3M.
Table 1-1 Efficient Expenditure after May 2016 review
Prudent Expenditure
We found that there is no further evidence to change our original view that early write-off of the CMS system was not prudent. The regulatory asset lives are based on Sydney Water’s current assumptions for specific assets. Given the size of the original expenditure we consider it appropriate to apply a specific asset life rather than the average. The impact of this early write-off is a $24.8m adjustment in 2018.
Capital Expenditure
We have reviewed our original findings taking into account our discussions with Sydney Water and the further
information it has provided. We have accepted expenditure related to metering and the North West Growth
1 Sydney Water Corporation Expenditure Review, Atkins Cardno December 2015
($k 2015/16) year ending June 2017 2018 2019 2020 Total 2017
to 2020
Sydney Water 2015 proposal 772.5 774.1 769.1 764.0 3079.6
IPART Draft Decision 764.2 757.9 742 734.8 2998.9
Atkins Cardno revised expenditure 771.4 766.1 751.1 744.0 3032.7
SYDNEY WATER EFFICIENT EXPENDITURE - REVISED AFTER MAY 2016 REVIEW

Sydney Water Corporation - Expenditure Review Supplementary Report
Sydney Water Corporation - Expenditure Review | Version 2.2 | 01 July 2016 | 5145571
9
Centre. We have accepted in part the representations on reticulation mains renewals, avoid-fail sewers and
some double counting on procurement efficiency. We have accepted some elements of the wastewater
treatment plant renewals but there is still a material difference between Sydney Water and our view on efficient
expenditure. We found that there was insufficient evidence to change our view on the North Head biosolids
project although we revised the expenditure adjustment.
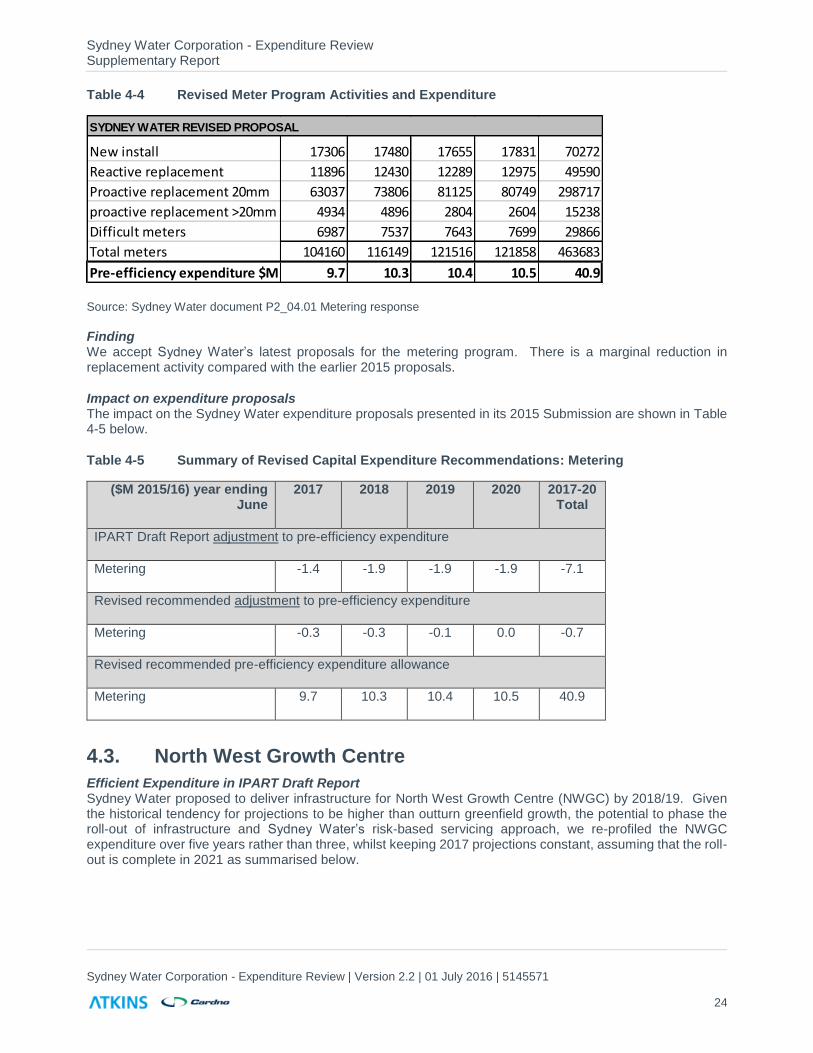
The impact on expenditure of our review is shown in Table 1-2. Our original efficiency proposal was for
$419.7M of scope adjustments and efficiencies. Sydney Water accepted $185.3M but challenged $234.5M.
As a result of our review, we accepted $119.8M as supported expenditure. The final capex adjustment applied
to the Sydney Water 2015 submission was $299.9M.
Table 1-2 Efficient Expenditure after May 2016 review
The results of this review are to propose an overall capital program in the future price path of $2473.0M which
is 11% lower than SWC’s original price submission proposal. This compares with the $2353.2M in the IPART
Draft Report. This is shown in Figure 1-1 below.

Sydney Water Corporation - Expenditure Review Supplementary Report
Sydney Water Corporation - Expenditure Review | Version 2.2 | 01 July 2016 | 5145571
10
Figure 1-1 Summary of revised capital expenditure program recommendation for 2017-20 ($15-16M)
The level of efficient expenditure by year and service area is shown in Table 1-3. The adjustments following
this review are highlighted.

Sydney Water Corporation - Expenditure Review Supplementary Report
Sydney Water Corporation - Expenditure Review | Version 2.2 | 01 July 2016 | 5145571
11
Table 1-3 Efficient level of Capital Expenditure at company level
Atkins Cardno would like to take this opportunity to thank Sydney Water Corporation for the professional manner in which it presented information at interviews and responded to our questions and requests for further information.
We include in Appendix B our response to other representations on the IPART Draft Report related to Sydney Water's IT proposals.

Sydney Water Corporation - Expenditure Review Supplementary Report
Sydney Water Corporation - Expenditure Review | Version 2.2 | 01 July 2016 | 5145571
12
1. Introduction
1.1 Terms of Reference
In August 2015 the Independent Pricing Tribunal of New South Wales (IPART) appointed the Atkins/Cardno
consortium to carry out a detailed review of the Sydney Water Corporation’s operating expenditure and capital
expenditure. The purpose of this review is to inform the Tribunal’s Determination on prices for the upcoming
price control period which applies from 1st July 2016 to 30th June 2020.
IPART issued its Draft Determination and Report in March 2016. Sydney Water submitted a document in
response to the Draft Report in April 2016. We were subsequently asked by IPART to review this submission
and report our findings to the Tribunal. This report has been prepared in accordance with the Terms of
Reference set out in the contract between Atkins/Cardno and IPART dated 6April 2016. These are reproduced
in Appendix A.
1.2 Sydney Water Corporation submission to IPART
Sydney Water submitted a report to IPART dated 18 April making representations on a range of issues in the
IPART \Draft Report. Our Terms of Reference asked us to review those areas of operating and capital
expenditure which were challenged by Sydney Water. There related to
Operating expenditure adjustments
Prudent expenditure in relation to the CRM system
Capital expenditure procurement efficiency
Metering
North West Growth Centre
Wastewater treatment works renewals
North Head Biosolids
Avoid fail sewers
Reticulation water mains
Whilst we have endeavoured to satisfy ourselves as to the provenance and robustness of the data provided,
a detailed audit of the completeness and accuracy of the information lies outside the scope of this project.
1.3 Review Process
We, the Atkins/Cardno team, commenced our review on 20 April 2016. Following a review of the Sydney
Water submission, we held a series of meetings with Sydney Water on 27 and 28 April to discuss specific
areas of challenge. We set out our approach to the efficiency and discussed Sydney Water’s representations.
Further information was provided by Sydney Water at and following these meetings. We discussed our findings
with the IPART Secretariat and presented our findings to the Tribunal on 4 May 2016. We submitted this
Supplementary Report on 11 May 2016 setting our findings on the Sydney Water submission. This report
should be read in parallel with our Final Report on the Efficiency Review2.
Atkins/Cardno would like to take the opportunity to thank Sydney Water Corporation for making its staff
available for the interview days and for the professional manner in which the organisation responded to our
challenges and requests for further detail.
2 Sydney Water Corporation Expenditure Review, Atkins Cardno December 2015

Sydney Water Corporation - Expenditure Review Supplementary Report
Sydney Water Corporation - Expenditure Review | Version 2.2 | 01 July 2016 | 5145571
13
2. Operating Expenditure
2.1. Efficient Expenditure in IPART Draft Report
Our approach to efficient expenditure in the future price path followed the concept of catch-up efficiency to achieve the performance of a frontier agency and the continuing efficiency it will make over time through innovation, systems and improved management processes.
We found that a low risk approach is taken across both operating and capital expenditure and there is little appetite to increase this. At the same time, there was no regulatory incentives for Sydney Water to take greater risks on service provision to drive greater efficiencies. While this will be debated through the next price path period, we have identified some areas where risks are not shared equitably with customers. In these areas, both operating and capital expenditure, we made adjustments as a surrogate for the impact of incentives. We subsequently noted that an opex ECM has been included in IPART’s Draft Report.
We noted the significant efficiencies were achieved through the current price path, greater than those set in the Determination. These initiatives will continue to drive efficiencies through the current price path.
We made adjustments to two specific areas: energy costs to reflect balancing cost risks with customers and Service Delivery expenditure where we would expect further optimisation and risk based approached will lead to an even trend in expenditure. We considered applying a reduction in this trend but concluded that effective planned maintenance is essential to be able to defer some capital expenditure presented in the submission. We amended the operating expenditure forecast following Sydney Water’s representations.
Our benchmarking comparisons of totex showed that Sydney Water has further efficiencies to make to approach a frontier company or the average of the UK companies using the CMA analysis. We applied catch-up efficiency increasing from 0.5% in 2017 to 2% in 2020. We adjusted the level of catch-up following representations from Sydney Water in November 2015. This reflects the full impact of the initiatives implemented in the current price path and the impact of the procurement strategy currently being phased in. In addition, we noted the Business Improvement initiatives being promoted and the forecast benefits from the ERP information technology system being implemented. We also took account of the current transformation project and the likely changes this will bring towards the latter half of the future price path. This adjusted level of catch-up efficiency does not assume that Sydney Water should be at the frontier by 2020 but reflects the achievability of delivering further cost reductions over the future price path.
We assumed a continuing efficiency of 0.25% per annum to reflect overall technological improvements and innovation that a frontier company competing in an open market with strong commercial pressures, would be implementing. This is consistent with the 2012 Determination. We excluded bulk water, recycled water and energy costs from the adjustments we have made. These efficiencies are challenging but the Corporation has experienced professionals who are motivated to deliver.
The impact of our combined continuing and catch-up efficiency was to set a level of efficient expenditure of an average 0.75% per annum cumulative although weighted to the second part of the future price path. We have compared this with a recent efficiency analysis supporting the UK Competition and Markets Authority (CMA) determination on Bristol Water. Our proposal is below the CMA analysis in Section 6.6 and recognises that Sydney Water may need more time to achieve improved level of efficiency compared with others.
2.2. Sydney Water Submission
Sydney Water accepted our efficiency findings related to energy costs (-$19.4M) and re-profiling of Service Delivery costs (-$8.5M). It had carried out a detailed review of its core operating expenditure forecast using a bottom-up approach from Divisional budgets. This lead to a net efficiency reduction of $28.1M. It disputed $24.7M of operating efficiencies. It also highlighted some risks of higher costs through greater water demand through water filtration works, electricity costs, and the impact of capital expenditure reductions planned for Reticulation Water mains, Avoid Fail sewers and wastewater treatment plants.

Sydney Water Corporation - Expenditure Review Supplementary Report
Sydney Water Corporation - Expenditure Review | Version 2.2 | 01 July 2016 | 5145571
14
Sydney Water explained why it did not accept our continuing and catch-up efficiency as applied to operating expenditure, although this was accepted when applied to capital expenditure. One main reason was that the methodology and data was not sufficiently validated.
2.3. Review
We note that while Sydney Water accepted the energy efficiency review challenge of $19.4M, it has identified up to nearly half this amount as a risk, dependent on the outcome of the Electricity Price Review. We note that IPART is responding to this adjustment to ensure a consistent approach is taken with all water utilities.
Sydney Water has also accepted the re-profiling of Service Delivery expenditure (-$8.5M). While it has challenged the basis of the catch-up and continuing efficiency adjustments, Sydney Water has accepted $28.1M of efficiencies. The outstanding challenge related to $24.7M of efficiencies which is 0.8% of total expenditure.
Sydney Water has derived the further efficiencies from a review of its core operating expenditure using the methodology it applied to the 2015 submission. This included a detailed review and update of its divisional budgets and internal challenge through its ‘heat map’ and other adjustments. These are offset by the cost of some new initiatives. Savings from the heat map process include SPS optimisation, analytical services and reductions in IT staff and backfilling. Reductions from other initiatives include postage costs, training and removal of capitalised labour uplift. Additional costs from new initiatives include ‘safe and well together’, growth servicing and customer communications. We formed the view that Sydney Water has responded positively to the efficiency challenge.
Sydney Water commented that further efficiencies are expected although the timing is uncertain and are more likely to be reflected in subsequent price paths beyond the future price path under review. Our view is that further efficiencies are likely through the Transformation Project and related restructuring although the extent and timing are not defined.
We also took into account the impact of the opex ECM and the incentive to drive further efficiencies for sharing with customers.
Sydney Water identifies some additional risks related to the efficiency adjustments.
Electricity costs: $5M to $10M (up to 0.33% of operating costs) of the $19.4M adjustment due to network price increases following the successful appeal of the Australian Regulator’s decision, with the timing and extent of risk yet to be determined. We were advised that IPART will review this aspect to ensure consistency with other utilities;
Higher water filtration costs: $1M (0.03%) is as a result of higher demand forecasts assumed by IPART;
Reticulation mains renewals: $3M to $4M (0.10% to 0.13%) – we have changed our view on the extent of reticulation mains renewal so any change in opex is not likely to be material;
Avoid Fail sewers: $1M to $2M (0.03% to 0.06%) – we have changed our approach to this capex area based on new information provided. Our adjustment is based on the NSOOS sewer only;
Impact of other reductions in the capital expenditure program: >$10M (0.33%) – Sydney Water stated that this relates mainly to the wastewater treatment works renewals program. We have made some adjustments to our earlier capex assumptions which we discuss in Section 4.4. In addition, we commented in our December 2015 report that ‘we considered applying a reduction in this [Service Delivery] trend but concluded that effective planned maintenance is essential to be able to defer some

Sydney Water Corporation - Expenditure Review Supplementary Report
Sydney Water Corporation - Expenditure Review | Version 2.2 | 01 July 2016 | 5145571
15
capital expenditure presented in the submission. We amended the expenditure forecast following Sydney Water’s representations’.
We recognise that the above are risks that Sydney Water may face in the future price period; there are likely to be other risks and potential gains in the future price path which we have not reviewed. The overall quantum of these risks are of the order of 0.5% if all eventuated.
IPART has applied a consistent view across all water utilities following the current position on the electricity network charges determination. It has increased the allowance from the Draft Determination and advised us that its view on efficient electricity costs. The revised adjustment for electricity is shown in Table 2.1 below.
Table 2-1 Operating expenditure – Change to electricity cost adjustment
2.4. Findings
Sydney Water has responded positively to the efficiency challenge made by the Draft Report and has carried out further analysis to identify more efficiencies from core operating expenditure. While we still consider there are further efficiencies to be made, which may be incentivised through the opex ECM, they are difficult to quantify and validate with sufficient certainty. We therefore accept the Sydney Water revised proposals.
IPART has advised us that its view on efficient electricity costs has resulted in a change to the efficient expenditure adjustment from -$19.3M to -$9.3M.
Cost risks have been identified although these have a small impact on the total future price path expenditure which we believe can be managed by a highly experienced and professional team.
2.5. Impact on Expenditure Proposals
The impact of the adjustments set out above is to increase total operating expenditure from $2998.9M in the Draft Report to $3032.7M. The difference comprises $23.8M for efficiencies and $10.0M for electricity. The summary by year is shown in Table 2-2 below.
SYDNEY WATER EFFICIENT EXPENDITURE - REVISED AFTER MAY 2016 REVIEW
($k 2015/16) year ending June 2017 2018 2019 2020 Total 2017
to 2020
Electricity -1.95 -5.01 -5.89 -6.51 -19.36
IPART adjustment following DD 2.83 2.45 2.39 2.37 10.04
Re-profiled Electricity adjustment 0.88 -2.56 -3.50 -4.14 -9.32
EXPENDITURE SUBJECT TO EFFICIENCY ADJUSTMENTS

Sydney Water Corporation - Expenditure Review Supplementary Report
Sydney Water Corporation - Expenditure Review | Version 2.2 | 01 July 2016 | 5145571
16
Table 2-2 Efficient Operating Expenditure in the future price path
SYDNEY WATER EFFICIENT EXPENDITURE - REVISED AFTER MAY 2016 REVIEW
($k 2015/16) year ending June 2017 2018 2019 2020 Total 2017
to 2020
Water 229.6 230.7 230.5 229.2 920.0
Wastewater 506.5 505.3 501.9 497.8 2011.5
Stormwater 12.2 12.6 12.8 12.8 50.5
Bulk Water 480.5 480.0 479.2 483.3 1922.9
Recycled Water 27.2 27.1 25.7 25.8 105.8
Finance Leases 0.0 0.0 0.0 0.0 0.0
Less Rosehill Scheme -3.1 -1.7 -1.7 -1.7 -8.2
Total Regulated Services 1252.9 1254.1 1248.3 1247.2 5002.5
Total less bulk water 772.5 774.1 769.1 764.0 3079.6
Electricity 0.9 -2.6 -3.5 -4.1 -9.3
Service Delivery Reprofile -1.0 -2.5 -2.5 -2.5 -8.5
Water 229.6 229.1 228.5 227.0 914.1
Wastewater 506.4 501.9 497.8 493.4 1999.6
Stormwater 12.2 12.6 12.8 12.8 50.5
Recycled Water 27.2 27.1 25.7 25.8 105.8
Finance Leases 0.0 0.0 0.0 0.0 0.0
Less Rosehill Scheme -3.1 -1.7 -1.7 -1.7 -8.2
Reprofiled expenditure 772.3 769.0 763.1 757.3 3061.8
Efficiency -0.9 -2.9 -12.0 -13.3 -29.1
Water 229.3 228.2 224.7 222.8 905.0
Wastewater 505.8 499.9 489.6 484.3 1979.7
Stormwater 12.2 12.6 12.8 12.8 50.5
Recycled Water 27.2 27.1 25.7 25.8 105.8
Rosehill Scheme -3.1 -1.7 -1.7 -1.7 -8.2
Total Efficient Expenditure 771.4 766.1 751.1 744.0 3032.7
SERVICE
EXPENDITURE SUBJECT TO EFFICIENCY ADJUSTMENTS
REPROFILING
ADJUSTED EXPENDITURE BEFORE APPLICATION OF EFFICIENCY TARGETS
EFFICIENCY ADJUSTMENTS
EFFICIENT EXPENDITURE

Sydney Water Corporation - Expenditure Review Supplementary Report
Sydney Water Corporation - Expenditure Review | Version 2.2 | 01 July 2016 | 5145571
17
3. Prudent Expenditure
3.1. Prudent Expenditure in the IPART Draft Report
In our Report3 we found one potential imprudent expenditure in the future price path where the Customer Relation Management System which was commissioned in 2011 is likely to be decommissioned in 2018 as its functions will be superseded by the new billing system, called T2020. Our view was that this asset is being decommissioned before the end of its asset life and should be considered as a stranded asset.
In 2007 Sydney Water’s consultant recommended considering SAP as combined provider, which is of relevance given the path originally pursued by the Corporation was to implement Oracle’s Siebel CMS solution; it is now pursuing a combined SAP solution. The consultant stated that: “…While there are limited examples of utilities implementing SAP CRM without SAP IS-U, we would recommend keeping SAP CRM in the frame for consideration at this stage. SWC could engage SAP locally to establish if they would be confident to propose SAP CRM standalone without SAP IS-U in a competitive tendering process”. CMS was implemented in 2011 with a value of $42m when it was put into the Regulatory Asset Base.
We challenged Sydney Water about the seven year asset life it had been assigned as we did not believe that this is consistent with the asset life of other comparable systems, such as now assumed for ERM and T2020. We based our adjustment of a stranded asset on a 15 year asset life when CMS is replaced in 2018 by the combined SAP IS-U and SAP CRM solution. Based on the information made available at that time, we had not identified any other assets which are likely to be stranded. There may be other assets which fall into this category in the future price path and will need to be considered at the time of the subsequent price path review.
3.2. Sydney Water Submission
The representation from Sydney Water4 stated that we had been inconsistent in our approach to assigning IT asset lives and we had ignored the avoided costs associated with not having to integrate our new billing system to the new CMS.
Sydney Water disputed our 15-year asset life assumption and referred to Section 8 of our report1. It considered its decision as prudent and efficient and asked that no prudency adjustment should apply.
3.3. Review
Avoided Costs
Sydney Water stated that in developing its business case for the SAP IS-U and SAP CRM systems it considered the option of keeping and integrating the existing CMS into the new SAP platform. It estimated that it would cost an extra $17.6M over five years to do this. The basis of our prudency adjustment can be traced back to the original business case for CMS and our observations in the 2011 Efficiency Review5 about prudency and efficiency of approach. At that time we formed the view that the level of maturity of IT business planning was not very well developed. We then compared the business with a Frontier company and commented that
‘.we believe that the IT maturity level of a Frontier Company would lead it to follow the path of an integrated system – which is both the preference and the norm in many of the utilities with
3 Sydney Water Corporation Expenditure Review, Atkins Cardno December 2015 4 Sydney Water’s response to IPART’s Draft Report and Determination, Sydney Water April 2016 5 Detailed Review of Sydney Water Corporation’s capital and operating expenditure, Atkins Cardno November
2011

Sydney Water Corporation - Expenditure Review Supplementary Report
Sydney Water Corporation - Expenditure Review | Version 2.2 | 01 July 2016 | 5145571
18
which we are familiar. The latter approach [an integrated system] is more likely to promote best value also when considering the whole life least cost solution”.
These observations are relevant given the path pursued by the Corporation was to implement Oracle’s Siebel CMS solution rather than pursue a combined SAP solution. In other words, the avoided costs of integration would not have been relevant if a combined SAP solution had been pursued in the first place. Regulatory Asset Lives We based our assumption on regulatory asset life based on current Sydney Water IT life assumptions and information provided by them as part of the IT expenditure review. In Section 8 of our Report1 we stated that
‘Sydney Water provided a schedule of asset lives for each fixed asset category. These are dated
January 2014 although there have been few changes from the 2012 Determination. These
changes relate to …….IT assets: the asset life has been extended from 10 to 15 years related to
the payback period expected from new systems …’
For the future price path, Sydney Water has provided a schedule of new IT systems to be developed in the future price path. Each system has been allocated a life of 5 or 15 years. For example most of the new billing system and ERP have assumed lives of 15 years consistent with the payback period assumed for these systems6.
3.4. Finding
We found that there is no further evidence to change our original view that early write-off of the CMS system was not prudent. The regulatory asset lives are based on Sydney Water’s current assumptions for specific assets. Given the size of the original expenditure we consider it appropriate to apply a specific asset life rather than the average.
3.5. Impact on the Price Control
We have made no adjustment to our original findings. We confirm the value of the adjustment in Table 3-1
below.
Table 3-1 Recommended prudency adjustment in the future price path
.Source: Atkins/Cardno analysis
3.6. Other Representations on IT Expenditure We include in Appendix B our response to other representations on the IPART Draft Report related to Sydney Water's IT proposals.
6 Sydney Water document ‘JJ_22-02_Analysis on Weighted Corporate IT Lives’

Sydney Water Corporation - Expenditure Review Supplementary Report
Sydney Water Corporation - Expenditure Review | Version 2.2 | 01 July 2016 | 5145571
19
4. Capital Expenditure
4.1. Capital Efficiency
Efficient Expenditure in IPART Draft Report Efficiencies were applied to all of Sydney Water’s proposed capital expenditure in the future price path as follows:
Table 4-1 Future Price Path – Proposed Capital Efficiencies %
This produced an overall efficiency saving of $155.0M or 6.2% of capital expenditure after Atkins-Cardno’s recommended adjustments.
Sydney Water Submission Sydney Water stated that it accepted $60.4 million of the challenge arising from Atkins-Cardno’s capital program efficiencies; these are the efficiencies associated with capital program management and optimisation, value engineering and cost estimation. It proposed to apply a reduction of 7% to those programs which had not previously been subject to delivery efficiency challenge, equal to $41.6M. However, it believed there had been double-counting of catch-up efficiencies, and disputed $38.9 million of the procurement delivery efficiencies as it considered that these were already factored into its forecasts.
Review We have focussed our review on three areas: the overall level of capital efficiency and its application to both renewals and growth expenditure, the two areas in which Sydney Water appears to have applied delivery efficiency.
Level of capital efficiency Sydney Water has commissioned an assessment which classified it as at a “foundation” level of maturity in 2014, aiming to progress to ‘leading’ status by 2017. It is putting significant efforts into procurement efficiency and expects about 4% efficiency in 2016/17 compared to recent costs7. Many of the major capex procurement initiatives are recent or underway, so are not ‘baked in’ to historical outturn costs. As such, we consider 2% procurement efficiency in 16/17 followed by 4% thereafter to be realistic targets.
The level of efficiency reportedly applied by Sydney Water to many of its programs (7%) and Atkins-Cardno’s recommended overall capital program efficiency, an average of 6.2%, are close. We recommend retaining our original level of challenge, as there are a number of differences to how they have been applied; for example Sydney Water has not applied it to the whole capital program, and we have not received any information which changes our view on the appropriate level.
7 Sydney Water document: ‘P_09-10-15_5. DF Procurement deep dive’
2017 2018 2019 2020
Continuing efficiency at the Frontier 0.25 0.5 0.75 1
Catch-up: capital program management and optimisation 0.5 1 1.5 2
Catch-up: value engineering 0.4 0.8 1.2 1.6
Catch-up: cost-estimating 0 0 0.5 1
Catch-up: procurement 2 4 4 4
Catch-up efficiency 2.9 5.8 7.2 8.6
Total efficiency 3.15 6.3 7.95 9.6
Cumulative efficiency challenge (%)

Sydney Water Corporation - Expenditure Review Supplementary Report
Sydney Water Corporation - Expenditure Review | Version 2.2 | 01 July 2016 | 5145571
20
Renewals expenditure We do not consider that there is potential double-counting of efficiency savings in the renewals program because the ‘adjusted expenditure before application of efficiency targets’ which the efficiencies have been applied to represents our view of prudent pre-efficiency expenditure.
Growth expenditure We consider that there is potential for double-counting of efficiency savings in the growth program. This is because we have based the ‘adjusted expenditure before application of efficiency targets’ on Sydney Water’s cost estimates after appropriate prudency adjustments. If Sydney Water has applied an appropriate delivery efficiency then further application of capital efficiencies could be double-counted.
Sydney Water has provided a high level breakdown of delivery efficiencies applied to growth expenditure shown in Table 4.2. We have limited confidence in the robustness of the figures as the initial forecasts for the “Sydney Water delivered” lines appear to have been derived from the ‘forecast after delivery efficiency’ figures, with all of the initial forecast figures precisely matching the first decimal points of their associated delivery efficiencies, leading to 2016-20 forecasts which have no remainder at one decimal point8.
Table 4-2 Sydney Water’s breakdown of delivery efficiencies applied to growth program
Source: P2_31-01_Delivery efficiencies in the growth program
When reviewing projects and programs it was difficult to identify the delivery efficiencies which had been applied. Given the lack of clarity in how these have been applied and the limited confidence in the breakdown supplied, we recommend assuming that only half of the total efficiencies which Sydney Water claim has been applied to the growth program could be double-counted.
8 This suggests that the ‘delivery efficiency’ and ‘initial forecast’ figures have been derived from a set of 2016-20
forecasts which had no decimal places.

Sydney Water Corporation - Expenditure Review Supplementary Report
Sydney Water Corporation - Expenditure Review | Version 2.2 | 01 July 2016 | 5145571
21
Finding We have netted-off half of the delivery efficiencies which Sydney Water claims to have applied to its growth program, as we consider there to be potential double-counting of these efficiencies.
We recommend that, for future reviews, Sydney Water clearly documents the level, type and timing of efficiencies in order to be able to demonstrate more clearly the challenge it has applied to its program.
Impact on expenditure proposals We recommend that the removal for double-counting be addressed as a positive pre-efficiency expenditure adjustment summarised below.
Table 4-3 Summary of Recommended Adjustments to take account of double-counting of efficiency in the growth program
($M 2015/16) year ending June 2017 2018 2019 2020 2017-20 Total
IPART Draft Report adjustment to pre-efficiency expenditure
Efficiencies already applied to growth program- Wastewater Service Adjustment
0.0 0.0 0.0 0.0 0.0
Efficiencies already applied to growth program- Water Service Adjustment
0.0 0.0 0.0 0.0 0.0
Revised recommended adjustment to pre-efficiency expenditure
Efficiencies already applied to growth program- Wastewater Service Adjustment
6.9 8.5 5.0 2.1 22.5
Efficiencies already applied to growth program- Water Service Adjustment
3.5 3.6 3.4 2.0 12.4
Revised recommended pre-efficiency expenditure allowance
n/a
4.2. Metering
Efficient Expenditure in IPART Draft Report
Replacement of damaged, faulty and broken meters is an essential activity in order for Sydney Water to correctly bill customers and maximise revenue. The accuracy of billing is also the biggest source of customer complaints and Sydney Water has an obligation to comply with the National Measurement Act where an accuracy of +/-4% is required.
The meter program includes for the provision of new meters, reactive meter replacement on failure and a proactive program to comply with reading accuracy. The total meter asset stock is some 1.3M of which 92% are 20mm.

Sydney Water Corporation - Expenditure Review Supplementary Report
Sydney Water Corporation - Expenditure Review | Version 2.2 | 01 July 2016 | 5145571
22
In the current price path, Sydney Water is forecasting 309,500 replacement and new meters against a target of 384,400, a variance of 75,000 meters, or-24%, under output target. In the previous price path the shortfall against target was 35%. The shortfall in the current price path was attributed in part to the contractor having difficulty in retaining staff. New contracts were in place from July 2015 with two meter suppliers and meter field service contractor.
We accepted the need for new meters and reactive replacement continuing at historic rates. We challenged the basis of the 20mm proactive meter replacement as it was not consistent with the age profile of the current asset stock and the extended life measured as volume or years. We accepted the level of larger meter replacements. We took into account the under-delivery of meter replacement in the previous and current price path periods. We assumed that the increase in proactive meter replacement compared with current levels is half that proposed. We also checked this against a model of forecast replacement using the consumption thresholds assumed by Sydney Water. Our forecast showed an average meter workload 98,000 per annum.
Sydney Water Submission Sydney Water provided further information to demonstrate a higher level of 20mm household meter replacement than was assumed in the Draft Report. Meter replacement continues to be based on consumption thresholds; Elster meters are replaced at a 4100 kl/a threshold and Reliance meters at a 3500 threshold. Sydney Water also provided information to show the level of meter replacement due to age was driving an increasing level of replacement.
Review Sydney Water presented a distribution of annual consumption distribution of 20mm household meters as shown on Figure 4.1 below. The distribution shows that while the average water use is 211 kl/a, the 95%tile is 456 kl/a. This confirms that the number of annual meter replacements, using the consumption thresholds, is greater than applying the average consumption.
Figure 4-1 Metered consumption distribution for 20mm household meters
Source: Sydney Water document P2_04.01 Metering response
Sydney Water also showed that the age criteria has an increasing impact on the number of replacements in the future price path. This is because for meters where total consumption has not met the volume criteria, the age replacement assumption of 20 years for the Elster meters and 15 years for Reliance meters, is driving an increasing level of replacement over the future price path.
0
2
4
6
8
10
12
Perc
enta
ge c
on
sum
pti
on
Consumption kl/a
Distribution of annual consumption

Sydney Water Corporation - Expenditure Review Supplementary Report
Sydney Water Corporation - Expenditure Review | Version 2.2 | 01 July 2016 | 5145571
23
This age-driven replacement profile is shown in Figure 4.2 increasing from 7,100 in 2017 to 33,600 in 2020. Meter replacement driven by consumption shows an even trend of an average 55,000 per year over the price period.
Figure 4-2 20mm Household Meter Replacement by Age and Consumption Drivers
Source: Sydney Water document P2_04.01 Metering response
We noted that the forecast new and replacement meters for the year ending June 2016 is c 88,000 compared with the 98,000 assumed in the current price path. This under-delivery was attributed to the extension of meter life for the Elster meters.
The forecast meter replacement program and expenditure is shown in Table 4-4. This shows a significant increase in meter activity from 104,000 in 2017 to 122,000 in 2020 mainly driven by the Reliance age replacements. Forecast of new meters and reactive replacement are based on historical trends. Proactive replacement of the 20mm meters is based on the Sydney Water modelling of consumption and age. Replacement of larger meters is from historic trends. Difficult meters are identified where more work is needed for meter replacement above the normal activity; these attract additional costs which have been include in the composite replacement rate.
We questioned the achievability of the enhanced programme. We formed the view that the meter replacement program is a low technology and repetitive activity that could be scaled up with appropriate resources. We have therefore not made any adjustment for achievability but recognise that management needs to be focused to deliver the program.
0
10000
20000
30000
40000
50000
60000
70000
80000
90000
100000
0
10000
20000
30000
40000
50000
60000
70000
80000
90000
100000
2017 2018 2019 2020
Met
er N
um
ber
s
20mm Meter Replacement by Age and Consumption
Elster age Reliance age Itron age Elster consumption
Reliance consumption Itron consumption age replacement consumption replacement
Sydney Water Corporation - Expenditure Review Supplementary Report
Sydney Water Corporation - Expenditure Review | Version 2.2 | 01 July 2016 | 5145571
24
Table 4-4 Revised Meter Program Activities and Expenditure
Source: Sydney Water document P2_04.01 Metering response
Finding We accept Sydney Water’s latest proposals for the metering program. There is a marginal reduction in replacement activity compared with the earlier 2015 proposals.
Impact on expenditure proposals The impact on the Sydney Water expenditure proposals presented in its 2015 Submission are shown in Table 4-5 below.
Table 4-5 Summary of Revised Capital Expenditure Recommendations: Metering
($M 2015/16) year ending June
2017 2018 2019 2020 2017-20 Total
IPART Draft Report adjustment to pre-efficiency expenditure
Metering -1.4 -1.9 -1.9 -1.9 -7.1
Revised recommended adjustment to pre-efficiency expenditure
Metering -0.3 -0.3 -0.1 0.0 -0.7
Revised recommended pre-efficiency expenditure allowance
Metering 9.7 10.3 10.4 10.5 40.9
4.3. North West Growth Centre
Efficient Expenditure in IPART Draft Report Sydney Water proposed to deliver infrastructure for North West Growth Centre (NWGC) by 2018/19. Given the historical tendency for projections to be higher than outturn greenfield growth, the potential to phase the roll-out of infrastructure and Sydney Water’s risk-based servicing approach, we re-profiled the NWGC expenditure over five years rather than three, whilst keeping 2017 projections constant, assuming that the roll-out is complete in 2021 as summarised below.
SYDNEY WATER REVISED PROPOSAL
New install 17306 17480 17655 17831 70272
Reactive replacement 11896 12430 12289 12975 49590
Proactive replacement 20mm 63037 73806 81125 80749 298717
proactive replacement >20mm 4934 4896 2804 2604 15238
Difficult meters 6987 7537 7643 7699 29866
Total meters 104160 116149 121516 121858 463683
Pre-efficiency expenditure $M 9.7 10.3 10.4 10.5 40.9

Sydney Water Corporation - Expenditure Review Supplementary Report
Sydney Water Corporation - Expenditure Review | Version 2.2 | 01 July 2016 | 5145571
25
Figure 4-3 Reprofiling of NWGC water service expenditure in IPART Draft Report (pre-efficiency)
Sydney Water Submission In its response to IPART’s draft report, Sydney Water stated that NWGC growth is now ahead of, rather than behind, forecast and it had already assumed some commercial risk in later years. It provided updated development rates taking account of outturn 2015-16 development activity (presented below).
Figure 4-4 Sydney Water’s updated development outturn and projections for NWGC
Source: Sydney Water presentation ‘P2_08-01_290416 NWGC Data’
Review As part of our review we asked for maps of development activities at land parcel level around the proposed lead-in locations.

Sydney Water Corporation - Expenditure Review Supplementary Report
Sydney Water Corporation - Expenditure Review | Version 2.2 | 01 July 2016 | 5145571
26
Our review of the information provided found that development has now accelerated in NWGC with evidence to show that development is at an advanced stage in the areas which would be served by the proposed lead-in investments.
Finding Given the acceleration of development in the NWGC and signs of advanced development activity in land parcels to be served by the lead-ins, we are now supportive of Sydney Water’s proposed investment in line with its original Pricing Submission.
Impact on expenditure proposals We recommend that the previous adjustment now be removed as summarised below:
Table 4-6 Summary of Revised Capital Expenditure Recommendations: NWGC
($M 2015/16) year ending June 2017 2018 2019 2020 2017-20 Total
IPART Draft Report adjustment to pre-efficiency expenditure
NWGC Wastewater Service Adjustment
0.0 -7.1 -7.9 7.3 -7.8
NWGC Water Service Adjustment 0.0 -11.9 0.7 5.6 -5.6
Revised recommended adjustment to pre-efficiency expenditure
NWGC Wastewater Service Adjustment
0.0 0.0 0.0 0.0 0.0
NWGC Water Service Adjustment 0.0 0.0 0.0 0.0 0.0
Revised recommended pre-efficiency expenditure allowance
NWGC Wastewater Service 16.6 14.9 15.7 0.5 47.6
NWGC Water Service 8.1 17.4 4.9 0.0 30.4

Sydney Water Corporation - Expenditure Review Supplementary Report
Sydney Water Corporation - Expenditure Review | Version 2.2 | 01 July 2016 | 5145571
27
Figure 4-5 Revised capital expenditure recommendation: NWGC (pre-efficiency)
4.4. Wastewater Treatment Works Renewals
Efficient Expenditure in IPART Draft Report Our recommendations for expenditure reflected a focus on considering the service performance outcomes of programs as evidenced by the various internal and external targets and licence criteria. Sydney Water maintains an asset-centric approach to renewals based on asset condition assessments and estimates of remaining service life. Our methodology focused on serviceability of assets in delivering outcomes to customers and the environment. We tested the assumption that the future is the same as the past in looking at the performance of wastewater plants against environmental licence parameters, enforcement related to serviceability and not operational performance, and trends in work orders for unplanned maintenance.
In our review, we assessed the expenditure that delivered the current performance levels in relation to breakdown work orders and EPL licence breaches related to asset serviceability. We recommended on-going expenditure based on these historical levels. Our review considered the Quaker’s Hill project separately to the base renewals program as it is essentially an exceptional project. Sydney Water describe the project as essentially a full rebuild of the treatment plant. We recognise the integrated system planning that has been undertaken for this project with the nearby St Marys and Riverstone WWTPs, to develop an optimised approach to collection and treatment of wastewater and biosolids.
Sydney Water Submission Sydney Water’s submission maintains the focus on renewals based on asset condition and estimated remaining life of the assets creating an unacceptable performance risk. The renewals program is developed using an “industry sense check” which assumes a treatment plant has a full replacement cycle of 33 years and therefore the long term renewals rate should be 3 per cent of the replacement value of assets. Specific needs are identified through asset condition assessments and estimates of remaining life.
Sydney Water provided details of projects comprising the $290M expenditure by status with
$114.2M (39%) ‘active’ projects which are ready to proceed or underway;
$59.8M (21%) ‘candidate’ projects where the initiation is approval but have yet to be scoped;
$103.8M (36%) funded concepts where projects have been identified but have yet to be approved; and
$12.2M (4%) are reactive where work is unplanned but require immediate completion.

Sydney Water Corporation - Expenditure Review Supplementary Report
Sydney Water Corporation - Expenditure Review | Version 2.2 | 01 July 2016 | 5145571
28
Sydney Water submits that all projects in the program are required to be undertaken and any adjustments will defer projects to the next regulatory period, increasing risk and the expenditure required in future periods. Sydney Water provided further detail on the breakdown of historical expenditure indicating that a number of large and ongoing projects have been rolled up into the WWTP renewals spend in the current price path. Specifically, this included the Malabar WWTP which is on-going in the next price path period.
Review We have reviewed our earlier findings to take account of additional information provided by Sydney Water. Our revised approach is demonstrated in Figure 4-6 and explained in the following paragraphs.
We have taken the $275.4Mspend in 2012-16 as a base level of expenditure. The base includes spend on Malabar WWTP of $86.1M and on the typical renewals work (covered by the allocation) of $189.3M9. The proposed spend on Malabar WWTP in 2016-20 is $12.7m and while separately identified, is considered typical renewals work that would be covered by the allocation. We found that serviceability measures available to us such as work orders and asset-related licence performance did not show any material change over the current price path. We found that there was no evidence to suggest that expenditure in the future price path should differ from current expenditure, subject to any exceptional expenditure.
The proposed spend of $173.2M on Quakers Hill in 2016-20 is essentially a complete rebuild and would be predominantly considered exceptional work not normally covered by renewals allocation. However some of this expenditure would be already be allocated for on-going renewals at Quakers Hill. Sydney Water have estimated the 30 year asset renewal cost to be approximately $69.8M (refer WWTP Renewals Program BC 2015-20). This expenditure would need to be brought forward to enable renewals. We have assumed that approximately half of this expenditure would be deferred if major renewals are completed now so we have brought forward $34.9M to the next price period. This $34.9M for Quakers Hill is therefore considered part of the base renewals program. The remaining expenditure for Quakers Hill (from the $173.2M proposed) is considered to be exceptional expenditure and has been considered separately; we have made no scope adjustment to the Quakers Hill project. .
9 Includes $1.0M spend on Quakers Hill in the current price path

Sydney Water Corporation - Expenditure Review Supplementary Report
Sydney Water Corporation - Expenditure Review | Version 2.2 | 01 July 2016 | 5145571
29
Figure 4-6 Approach to re-calculating WWTP Renewals expenditure allowance ($M)
We have therefore calculated the base renewal program, excluding Malabar and Quakers Hill, for 2016-20 to be:
Base expenditure of $275.4M carried forward from 2012-16;
Subtract proposed spend of $12.7M for Malabar WWTP;
Subtract estimated $34.9M of "already allocated” renewals for Quakers Hill WWTP;
Leaving $227.8M in ‘base’ WWTP renewals expenditure for 2016-20.
Comparing our calculated figure of $227.8M against Sydney Water’s proposed spend of $290.0M leaves a recommended adjustment of -$62.0M. This adjustment reflects the uncertainties in scope and timing of some of the program. The adjustment is the equivalent of deferring 60% of the ‘concept’ projects to the next price period, where these have yet to be scoped and appraised, or assuming a program over nearly five years compared with the four proposed.
Finding We maintain our view and approach that leading businesses are focussing on service performance outcomes as a key indicator for expenditure levels and that this is consistent with international asset management standards. On this approach, we maintain the view that Sydney Water has not sufficiently demonstrated the need for a significant increase in renewals expenditure.
Impact on expenditure proposals We recommend that the previous adjustment now be revised as summarised in Table 4.7 below.

Sydney Water Corporation - Expenditure Review Supplementary Report
Sydney Water Corporation - Expenditure Review | Version 2.2 | 01 July 2016 | 5145571
30
Table 4-7 Summary of Revised Capital Expenditure Recommendations – WWTP Renewals
($M 2015/16) year ending June 2017 2018 2019 2020 2017-20
Total
IPART Draft Report adjustment to pre-efficiency expenditure
WWTP Renewals -22.6 -22.6 -26.1 -30.1 -101.5
Revised recommended adjustment to pre-efficiency expenditure
WWTP Renewals -12.8 -12.8 -16.2 -20.2 -62.0
Revised recommended pre-efficiency expenditure allowance
WWTP Renewals 56.9 56.9 56.9 56.9 227.8
4.5. North Head Biosolids
Efficient Expenditure in IPART Draft Report North Head WWTP is Sydney Water’s second biggest wastewater treatment plant. There are currently three digesters on site. In its price submission, Sydney Water proposed to construct two additional units, adding approximately +65% to digester capacity, or +100% in the planning scenario with one of the digesters out of service.
We considered that it had not made a strong case that a single additional digester would not be sufficient to cope with anticipated demand in the medium term, for the next price path plus five years. We therefore made an adjustment to the total pre-efficiency challenge expenditure allowance for this project of a third, which is $13.3M.
Sydney Water Submission Sydney Water reiterated its view that two additional digesters are required because the investment is intended to improve reliability as well as to increase capacity for growth. It also disputed the adjustment of $13.3M. It stated that review of the West Camden biosolids project showed the difference in cost between one and two digesters was less than $3.0 million due to the set-up and indirect costs.
Review Our review focussed on a number of issues summarised below:
Other factors affecting performance In addition to digester capacity, Sydney Water has proposed measures to improve biosolids performance at North Head.
Sydney Water’s process capability assessment (PCA) for North Head10 highlights that current performance is affected by factors beyond digester volume, such as thickening and mixer function. We are supportive of the works to address these factors which the PCA indicates will improve existing digester capacity and performance.
10 North Head WWTP – Process Capability Assessment (03 August 2015), prepared by an Integrated Planning Team
consisting of personnel from Sydney Water and its panel consultants AAJV and ENSureJV

Sydney Water Corporation - Expenditure Review Supplementary Report
Sydney Water Corporation - Expenditure Review | Version 2.2 | 01 July 2016 | 5145571
31
In particular, recuperative thickening appears to be a key constraint on current performance and capacity, with the PCA stating that “current recuperative thickening configuration limits digested sludge TSR“. Sydney Water’s proposed investment envisages a number of measures, which we are supportive of, to improve thickening of sludge, including additional rotary drum thickener capacity and dedicated recuperative thickening with polymer dosing.
Likewise, the PCA indicates that Sydney Water was rectifying one of the non-functional mixers in 2015. We also note that the Formal Warning from the EPA for this site in 2015 appears to be related to incorrect wiring by a contractor during maintenance rather than asset capacity, reliability or condition.
The benefits of these improvements are expected to be significant, with the PCA anticipating that optimised recuperative thickening would increase the capacity of two digesters by nearly 30% from 29 to 37 tonnes per day11. Given that we have made no adjustment to this element of the proposed project we consider that it is reasonable to assume that the associated improvements will be in place when considering the case for additional digester capacity.
These reliability and performance benefits may also be enhanced by the large renewals investments envisaged at this WWTP: $45.7M in the next price path12.
Planning scenario We consider that Sydney Water has adopted a conservative planning scenario which significantly affects the timing of the need for two additional digesters.
The solids load to the digesters is a function of the performance of the solids removal at the treatment plant, with higher solids loads to the digesters associated with lower total suspended solids (TSS) in the treated effluent.
The justification for two additional digesters is based on assumed treated effluent TSS of 175mg/l in the peak month. This seems conservative, in terms of sludge loads, given the historical overall median TSS is 186 mg/l, which it is reasonable to assume would be higher in the peak month, with growth expected to increase this further. The choice of treated effluent quality in the peak month makes a significant difference to the timing of the need for an additional digester as summarised below.
11 At the design standard (15 day retention time), see Table 5-25 of the PCA 12 See Table 6-18 of Sydney Water’s response to IPART’s Draft Report and Determination, 18 April 2016

Sydney Water Corporation - Expenditure Review Supplementary Report
Sydney Water Corporation - Expenditure Review | Version 2.2 | 01 July 2016 | 5145571
32
Figure 4-7 Assuming that the treated effluent quality is better than the historical median significantly affects the urgency of a second additional digester
The planning scenario used to derive the loading to the digesters assumes a monthly peaking factor of 1.4, which appears high for a month-to-year uplift in biosolids loading for a large wastewater treatment plant. The PCA states that this is based on “alternative analysis using the influent suspended solids”. It is significantly higher than the peaking factors for raw sludge derived as part of the 2014 Coastal Biosolids Options Study13, quoted in the PCA as:
Primary sludge peaking factor: 1.15
Maximum month peak factor: 1.15
Peak week peak factor: 1.38
The choice of peaking factor makes a significant difference to the timing of the need for an additional digester as summarised below.
13 Document referenced in PCA, but not reviewed by Atkins/Cardno

Sydney Water Corporation - Expenditure Review Supplementary Report
Sydney Water Corporation - Expenditure Review | Version 2.2 | 01 July 2016 | 5145571
33
Figure 4-8 A lower monthly peaking factor significantly pushes back the need for a second additional digester even assuming a treated effluent TSS of 175
The PCA also states that the West Hornsby WWTP currently discharges approximately 2.2 TDS/d of digested sludge to North Head WWTP as the West Hornsby dewatering centrifuge is currently unavailable and the second digester is out of service. Given that Sydney Water proposes to spend c$12M on renewals at West Hornsby14, headroom may be made available in the North Head digesters when this discharge is reduced or stopped.
Cost estimation Sydney Water has provided a disaggregated cost estimate for the proposed works based on two digesters, dated 23 November 201515. It includes the cost of digesters, SCADA, electrical works, rotary drum thickeners, screw presses, conveyor upgrades and a new polymer plant. The digesters themselves make up just over half of the direct costs.
The indirect cost estimates are all based on a percentage of the direct costs rather than lump sums. To derive the adjustment due to one digester rather than two we have therefore applied a 26% reduction to Sydney Water’s price submission estimate, based on the direct costs of a single digester as a proportion of total direct costs. This gives a total of $9.2M less than in the price submission.
This costing method specific to this project appears to be more appropriate than the use of a reported incremental cost for West Camden WWTP which is likely to differ in dimensions and design.
14 See Figure 6-7 of Sydney Water’s response to IPART’s Draft Report and Determination, 18 April 2016 15 Sydney Water document ‘P2_20-01_Attachment 8 151117 TOTAL CEP Minimum’

Sydney Water Corporation - Expenditure Review Supplementary Report
Sydney Water Corporation - Expenditure Review | Version 2.2 | 01 July 2016 | 5145571
34
Finding We consider that Sydney Water has not made a sufficiently robust case that, along with other proposed improvements at this site, construction of two additional digesters over the next price path period is required.
We have used the cost estimate provided during this review to amend the estimate of the cost impact of a single additional digester, leading to a pre-efficiency adjustment of -$9.2M, rather than -$13.3M, in the future price path.
Impact on expenditure proposals We recommend that the previous adjustment now be amended as summarised below:
Table 4-8 Summary of Revised Capital Expenditure Recommendations- North Head Biosolids
($M 2015/16) year ending June 2017 2018 2019 2020 2017-20 Total
IPART Draft Report adjustment to pre-efficiency expenditure
North Head Biosolids- adjustment 0 -13.3 0.0 0.0 -13.3
Revised recommended adjustment to pre-efficiency expenditure
North Head Biosolids- adjustment -3.3 -5.9 0.0 0.0 -9.2
Revised recommended pre-efficiency expenditure allowance
North Head Biosolids 9.2 16.6 0.0 0.0 25.8
Figure 4-9 Revised capital expenditure recommendation: North Head WWTP Bisolids Amplification (pre-efficiency)

Sydney Water Corporation - Expenditure Review Supplementary Report
Sydney Water Corporation - Expenditure Review | Version 2.2 | 01 July 2016 | 5145571
35
4.6. Avoid Fail Sewers
Efficient Expenditure in IPART Draft Report Our recommendations on the efficient expenditure for this renewal program were based on the success of current approaches to deferring expenditure including:
Use of sacrificial alkali gel as a short term protector against corrosion to extend asset life;
Challenges to condition assessment outcomes and recommendations;
Implementation of corrosion and odour control strategies.
In our view, Sydney Water did not provide sufficient evidence to justify the proposed increase in expenditure above the current price path.
This program in the SIR includes the Northern Suburbs Ocean Outfall System (NSOOS) project, which is the largest project in this program. We had assumed, due to inconsistent naming of line items in the SIR, that the project was separately identified. We suggest that the NSOOS project is separately identified in the SIR because of the value of the proposed expenditure.
Sydney Water Submission Sydney Water provided further detailed information on the make-up of the renewals program including, importantly, that expenditure for the NSOOS project was actually included within the renewals program. The breakdown of expenditure provided indicated that the NSOOS project makes up almost half of the entire avoid fail sewer renewals program. A current program of works, prepared for Sydney Water by a consultant, was submitted which indicated significant expenditure requirements each year from 2015/16 to 2030/31.
Sydney Water further submitted that the wider use of sacrificial alkali gels was not possible with the cost of application deemed to be higher than the cost savings from deferring renewals expenditure. Further analysis of these initial findings was being undertaken.
Sydney Water further stated that the benefits of the odour and corrosion control strategy would not likely be seen until beyond 2020.
Review We undertook a review of Sydney Water’s information supplied around the important NSOOS project, particularly around the revelation that the project would be fully funded from within the renewals program. Given this separation of the NSOOS project expenditure, we undertook a more detailed investigation of the project. We identified that the project is essentially based around three stages of works – tunnel access rehabilitation (includes manholes, ladders, platforms and railings), de-silting and finally tunnel/sewer rehabilitation. The program of works was developed within the criteria of around $30-35M of expenditure annually. This is somewhat different to the proposed expenditure request included in the SIR of around $24.6M annually across the next regulatory period. Upon request, Sydney Water also provided an update to the current year’s expenditure (2015/16) indicating that it is approximately 5% over budget.
While the current progress against budget is on-track, the next stages of work are very complex with de-silting and tunnel / sewer rehabilitation works required. We consider the current program to be optimistic given the risk of working in confined spaces. Some trials of de-silting and rehabilitation methods have been undertaken; however we consider that further work is required. In particular, we are of the opinion that in-situ trials are required to demonstrate and assess the efficiency, safety and effectiveness of the proposed approaches; specifically, desilting and the rehabilitation works. We have therefore proposed a staged program of expenditure to facilitate this with this program shown in Figure 4-10.

Sydney Water Corporation - Expenditure Review Supplementary Report
Sydney Water Corporation - Expenditure Review | Version 2.2 | 01 July 2016 | 5145571
36
Figure 4-10 Approach to re-calculating NSOOS Avoid Fail Sewer Renewals expenditure allowance
Finding We accept Sydney Water’s assertions that the potential avenues for achieving efficiencies, as assumed in the Draft Determination report, are limited, however with the separate identification and subsequent more detailed analysis of the NSOOS project, we have concern over the initial implementation of the proposed rehabilitation approaches. We are proposing a brief staged implementation process in the first two years of the next price path with expenditure as proposed by Sydney Water in the latter two years in the price path.
Our revised approach leads to the deferral of approximately $25.5m from the next regulatory period beyond 2020.
Impact on expenditure proposals We recommend that the previous adjustment now be amended as summarised in Table 4-9 below.

Sydney Water Corporation - Expenditure Review Supplementary Report
Sydney Water Corporation - Expenditure Review | Version 2.2 | 01 July 2016 | 5145571
37
Table 4-9 Summary of Revised Capital Expenditure Recommendations – Avoid Fail Sewer Renewals
($M 2015/16) year ending June 2017 2018 2019 2020 2017-20 Total
IPART Draft Report adjustment to pre-efficiency expenditure
Avoid Fail Sewer Renewals -8.1 -6.7 -8.4 -11.0 -34.3
Revised recommended adjustment to pre-efficiency expenditure
Avoid Fail Sewer Renewals -16.7 -8.8 0.0 0.0 -25.5
Revised recommended pre-efficiency expenditure allowance
Avoid Fail Sewer Renewals 36.7 43.1 53.7 56.3 189.8
4.7. Reticulation Mains Renewals
Efficient Expenditure in IPART Draft Report Our recommendations for expenditure reflected a focus on considering the service performance outcomes of programs as evidenced by the various internal and external targets and licence criteria. Sydney Water maintains a more asset centric approach to renewals based on asset condition assessments and estimates of remaining service life.
In our review, we assessed the expenditure that delivered the current performance levels, in relation to water continuity / unplanned interruptions and the rates of breaks and leaks, and recommended on-going expenditure based on these historical levels. Our review highlighted that expenditure over past price path periods has decreased by 45% however service performance has generally not decreased. This is shown in Figure 4-11 which shows a reducing trend in mains burst rates.

Sydney Water Corporation - Expenditure Review Supplementary Report
Sydney Water Corporation - Expenditure Review | Version 2.2 | 01 July 2016 | 5145571
38
Figure 4-11 Trend in reticulation mains breaks and leaks
There was also evidence of a continuing headroom in properties affected by three or more interruptions against the licence measure as shown in Figure 4-12 below.
Figure 4-12 Water continuity – performance against operating licence measure

Sydney Water Corporation - Expenditure Review Supplementary Report
Sydney Water Corporation - Expenditure Review | Version 2.2 | 01 July 2016 | 5145571
39
Sydney Water Submission Sydney Water’s submission maintains the focus on renewals based on asset condition and estimated remaining life of the assets creating an unacceptable performance risk. The renewals program is made up of mains that experience three breaks in a two year period. The early years of the program are based on actual mains scheduled for renewal while a funding envelope covers future years based on analysis of the asset population. A net present value analysis is conducted for each main scheduled for renewal to determine if the NPV is greater than 1; if so, the main is scheduled for renewal. In relation to service performance standards, Sydney Water submit that the targets we have used as performance measures are only minimum standards and do not represent an efficient level of investment.
Review While we understand Sydney Water’s position that the targets we have used as the basis for assessing service performance might represent minimum standards, our view remains that the performance against operating licence measures should be the main driver for investment. This is a common approach applied by England and Wales water companies. Investment in assets should be assessed to ensure services to customers is maintained.
We have not changed our methodology applied in the Draft Report but have updated our calculation of the average expenditure which delivered the service performance in the current price path. Sydney Water’s latest estimate of expenditure for 2015-16 is $39.8M. We have not had the opportunity to confirm that this expenditure is prudent and efficient, although for expediency have accepted this.
Finding We have maintained our position that service performance should be a key driver for investment and we have updated our calculation of average renewal expenditure to account for the latest historical data.
Impact on expenditure proposals We recommend that the previous adjustment now be amended as summarised in Table 4-10 below.
Table 4-10 Summary of Revised Capital Expenditure Recommendations – Reticulation Main Renewals
($M 2015/16) year ending June 2017 2018 2019 2020 2017-20 Total
IPART Draft Report adjustment to pre-efficiency expenditure
Reticulation Main Renewals -6.5 -6.5 -6.5 -6.5 -26.1
Revised recommended adjustment to pre-efficiency expenditure
Reticulation Main Renewals -1.2 -1.2 -1.2 -1.2 -4.9
Revised recommended pre-efficiency expenditure allowance
Reticulation Main Renewals 32.3 32.3 32.3 32.3 129.2

Sydney Water Corporation - Expenditure Review Supplementary Report
Sydney Water Corporation - Expenditure Review | Version 2.2 | 01 July 2016 | 5145571
40
5. Asset Lives
IPART Draft Report In Section 8 of our Report1 we commented on Sydney Water’s asset classification and asset lives. In Section 9 we reviewed the asset lives which Sydney Water proposed for the valuation of its finance leases. We found that
i. The civil assets at the Prospect, Macarthur and Wyuna plants are relatively low when compared with Sydney Water’s similar assets and other company assumptions. These assets are generally large structures and storage reservoirs. Civil assets form the greater part of the total assets and will have the largest impact on depreciation. We suggest a 100 year asset life from the date of commissioning would be appropriate;
ii. The electrical and mechanical assets at the Prospect and Wyuna plants are consistent with Sydney Water’s similar assets. At Macarthur, the asset lives appear to be low and, unless driven by poor asset condition, should be similar to the other plants;
iii. The electronic asset lives at Prospect and Wyuna are low in comparison with similar assets although this may be driven by the duration of the lease. We would normally expect to apply an asset life of 15 years.
Sydney Water Submission Sydney Water explained that asset lives for the Prospect and two Wyuna filtration plants were determined using expert judgement. The life assumption was 70 years from the date of construction implying a remaining life of 50 years for the Prospect plant and 51 years for the two Wyuna filtration plants. It considered that the asset lives were derived from a more accurate assessment of the actual state of the physical assets being acquired.
The asset lives at the Macarthur filtration plant of 14 years for electrical, 19 years for mechanical and 14 years for electronic assets related to the assumption that assets should be depreciated over the remaining live of the finance lease.
Review Sydney Water did not provide any further information to support its views. We revisited the information provided in October 2015 and our findings at that time. We confirmed that most of the civil assets are large structures and storage tanks where, from comparison with other utilities and the asset lives assumed by Sydney Water for its own assets, a 100 year asset life from the date of commissioning would be appropriate. This implies a current remaining asset life of 80 years.
We assumed that the Macarthur filtration plan is likely to continue in operation beyond the life of the current lease as this is a large plant necessary to supply water in the long term. The electrical, mechanical and electronic asset lives should reflect the continuing operational of the plant beyond the current lease. It is not necessary to write off the assets at the termination of the lease.
Findings We found that there is no reason to change from our earlier assumptions on asset lives as applied by IPART in its Draft report.
Impact There is no impact on assumed asset lives and depreciation.

Sydney Water Corporation - Expenditure Review Supplementary Report
Sydney Water Corporation - Expenditure Review | Version 2.2 | 01 July 2016 | 5145571
41
6. Total Efficient Expenditure
6.1. Operating Expenditure
Total efficient operationg expenditure is presented in Table 6-1 below. This takes into account the changes to opex efficiency and the adjustment for electricity costs discussed in Section 2.
Table 6-1 Summary of Revised Assesment of Efficient Operating Expenditure
SYDNEY WATER EFFICIENT EXPENDITURE - REVISED AFTER MAY 2016 REVIEW
($k 2015/16) year ending June 2017 2018 2019 2020 Total 2017
to 2020
Water 229.6 230.7 230.5 229.2 920.0
Wastewater 506.5 505.3 501.9 497.8 2011.5
Stormwater 12.2 12.6 12.8 12.8 50.5
Bulk Water 480.5 480.0 479.2 483.3 1922.9
Recycled Water 27.2 27.1 25.7 25.8 105.8
Finance Leases 0.0 0.0 0.0 0.0 0.0
Less Rosehill Scheme -3.1 -1.7 -1.7 -1.7 -8.2
Total Regulated Services 1252.9 1254.1 1248.3 1247.2 5002.5
Total less bulk water 772.5 774.1 769.1 764.0 3079.6
Electricity 0.9 -2.6 -3.5 -4.1 -9.3
Service Delivery Reprofile -1.0 -2.5 -2.5 -2.5 -8.5
Water 229.6 229.1 228.5 227.0 914.1
Wastewater 506.4 501.9 497.8 493.4 1999.6
Stormwater 12.2 12.6 12.8 12.8 50.5
Recycled Water 27.2 27.1 25.7 25.8 105.8
Finance Leases 0.0 0.0 0.0 0.0 0.0
Less Rosehill Scheme -3.1 -1.7 -1.7 -1.7 -8.2
Reprofiled expenditure 772.3 769.0 763.1 757.3 3061.8
Efficiency -0.9 -2.9 -12.0 -13.3 -29.1
Water 229.3 228.2 224.7 222.8 905.0
Wastewater 505.8 499.9 489.6 484.3 1979.7
Stormwater 12.2 12.6 12.8 12.8 50.5
Recycled Water 27.2 27.1 25.7 25.8 105.8
Rosehill Scheme -3.1 -1.7 -1.7 -1.7 -8.2
Total Efficient Expenditure 771.4 766.1 751.1 744.0 3032.7
SERVICE
EXPENDITURE SUBJECT TO EFFICIENCY ADJUSTMENTS
REPROFILING
ADJUSTED EXPENDITURE BEFORE APPLICATION OF EFFICIENCY TARGETS
EFFICIENCY ADJUSTMENTS
EFFICIENT EXPENDITURE

Sydney Water Corporation - Expenditure Review Supplementary Report
Sydney Water Corporation - Expenditure Review | Version 2.2 | 01 July 2016 | 5145571
42
6.2. Prudent Expenditure
We have made no adjustment to our original findings. We confirm the value of the adjustment in Table 6-
2Table 6-3 below.
Table 6-2 Recommended prudency adjustment in the future price path
6.3. Capital Expenditure
We have derived a revised recommendation for the efficient level of capital expenditure for each service based on the adjustments detailed in Section 4. As for our original assessment, continuing and catch-up efficiencies have been applied to the adjusted ‘pre-efficiency’ expenditure to reflect the catch-up potential in investment planning, cost estimating and contingency management and procurement.
6.3.1. Summary of amendments As outlined in Section 4 above, this review has led to a number of changes in the recommended level of expenditure.
The evolution of the adjustments made to Sydney Water’s capital program are summarised in Table 6-3 below. Overall, Sydney Water accepted $185.3M, just under half (44%) of the reductions outlined in IPART’s Draft Report and challenged $234.5M or 56% of them. As a result of this Supplementary Review, we have accepted Sydney Water’s representations on $119.8M of the adjustments, leading to recommended reductions of $299.9M.
The change in ‘catch-up and continuing efficiency’ reflects both the adjustment for the potential double-counting of efficiency in the growth program and the increase in the absolute (in $) effect of efficiency challenge as a result of items added back into the pre-efficiency capital program.
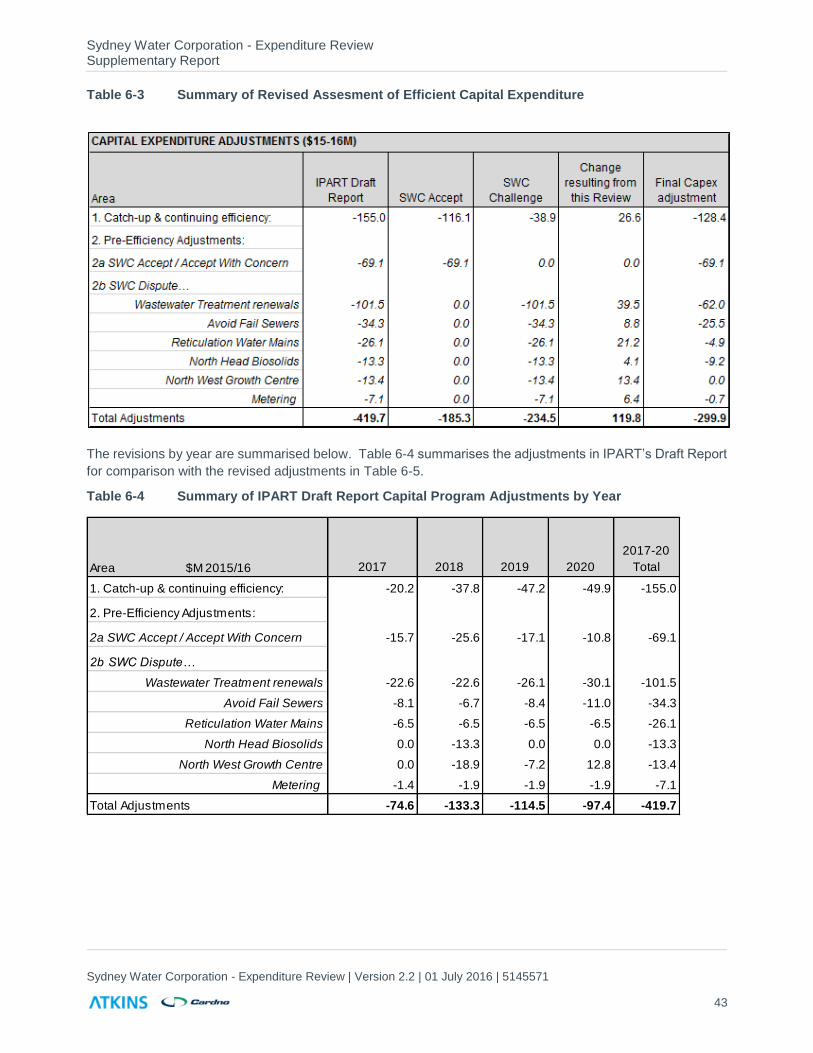
Sydney Water Corporation - Expenditure Review Supplementary Report
Sydney Water Corporation - Expenditure Review | Version 2.2 | 01 July 2016 | 5145571
43
Table 6-3 Summary of Revised Assesment of Efficient Capital Expenditure
The revisions by year are summarised below. Table 6-4 summarises the adjustments in IPART’s Draft Report
for comparison with the revised adjustments in Table 6-5.
Table 6-4 Summary of IPART Draft Report Capital Program Adjustments by Year
Area $M 2015/16 2017 2018 2019 2020
2017-20
Total
1. Catch-up & continuing efficiency: -20.2 -37.8 -47.2 -49.9 -155.0
2. Pre-Efficiency Adjustments:
2a SWC Accept / Accept With Concern -15.7 -25.6 -17.1 -10.8 -69.1
2b SWC Dispute…
Wastewater Treatment renewals -22.6 -22.6 -26.1 -30.1 -101.5
Avoid Fail Sewers -8.1 -6.7 -8.4 -11.0 -34.3
Reticulation Water Mains -6.5 -6.5 -6.5 -6.5 -26.1
North Head Biosolids 0.0 -13.3 0.0 0.0 -13.3
North West Growth Centre 0.0 -18.9 -7.2 12.8 -13.4
Metering -1.4 -1.9 -1.9 -1.9 -7.1
Total Adjustments -74.6 -133.3 -114.5 -97.4 -419.7

Sydney Water Corporation - Expenditure Review Supplementary Report
Sydney Water Corporation - Expenditure Review | Version 2.2 | 01 July 2016 | 5145571
44
Table 6-5 Summary of Revised Capital Program Adjustments by Year (15-16M)
As summarised below, the results of this review are to suggest an overall capital program in the future price
path of $2473.0M which is 11% lower than Sydney Water’s original price submission proposal.
Figure 6-1 Summary of revised capital expenditure program recommendation in 2017-20 ($15-16M)
Further details of the revised proposals for capital expenditure are provided below. As in the original submission, in each table we have provided an indicative asset category breakdown for the recommended expenditure. This is based on the “SIR CEMELEND” sheet provided by Sydney Water, amended based on our estimate of the asset category breakdown of the specific adjustments made and then pro-rated for the capital efficiency targets.
Area $M 2015/16 2017 2018 2019 2020
2017-20
Total
1. Catch-up & continuing efficiency: -10.3 -28.8 -41.8 -47.5 -128.4
2. Pre-Efficiency Adjustments:
2a SWC Accept / Accept With Concern -15.7 -25.6 -17.1 -10.8 -69.1
2b SWC Dispute…
Wastewater Treatment renewals -12.8 -12.8 -16.2 -20.2 -62.0
Avoid Fail Sewers -16.7 -8.8 0.0 0.0 -25.5
Reticulation Water Mains -1.2 -1.2 -1.2 -1.2 -4.9
North Head Biosolids -3.3 -5.9 0.0 0.0 -9.2
North West Growth Centre 0.0 0.0 0.0 0.0 0.0
Metering -0.3 -0.3 -0.1 0.0 -0.7
Total Adjustments -60.3 -83.4 -76.4 -79.8 -299.9
2772.9
2353.22473.0
0.0
500.0
1000.0
1500.0
2000.0
2500.0
3000.0
SWC PriceSubmission Proposal
IPART Draft Report RevisedRecommendation
OVERALL CAPITAL PROGRAM

Sydney Water Corporation - Expenditure Review Supplementary Report
Sydney Water Corporation - Expenditure Review | Version 2.2 | 01 July 2016 | 5145571
45
Water Service
We summarise our proposals for prudent and efficient capital expenditure in Table 6-6 below.
Table 6-6 Water Service: Summary of Revised Assesment of Efficient Capital Expenditure

Sydney Water Corporation - Expenditure Review Supplementary Report
Sydney Water Corporation - Expenditure Review | Version 2.2 | 01 July 2016 | 5145571
46
Wastewater Service
We summarise our proposals for prudent and efficient capital expenditure in Table 6-7 below.
Table 6-7 Wastewater Service: Summary of Revised Assesment of Efficient Capital Expenditure

Sydney Water Corporation - Expenditure Review Supplementary Report
Sydney Water Corporation - Expenditure Review | Version 2.2 | 01 July 2016 | 5145571
47
Stormwater Service
We summarise our proposals for prudent and efficient capital expenditure in Table 6-8 below. These have
not been amended since our original assessment.
Table 6-8 Stormwater Service: Summary of Efficient Capital Expenditure- NOT AMENDED

Sydney Water Corporation - Expenditure Review Supplementary Report
Sydney Water Corporation - Expenditure Review | Version 2.2 | 01 July 2016 | 5145571
48
Corporate Service
We summarise our proposals for prudent and efficient capital expenditure in Table 6-9 below. These have not
been amended since our original assessment.
Table 6-9 Corporate Service: Summary of Efficient Capital Expenditure- NOT AMENDED

Sydney Water Corporation - Expenditure Review Supplementary Report
Sydney Water Corporation - Expenditure Review | Version 2.2 | 01 July 2016 | 5145571
49
The overall company level of prudent and efficient capital expenditure is summarised in Table 6-10 below.
Table 6-10 Summary of Prudent Efficient Capital Expenditure
Sydney Water Corporation - Expenditure Review Supplementary Report
Sydney Water Corporation - Expenditure Review | Version 2.2 | 01 July 2016 | 5145571
50
Figure 6-2 Assessment of Efficient Capex versus the Proposed Level by Product

Appendices

Sydney Water Corporation - Expenditure Review Supplementary Report
Sydney Water Corporation - Expenditure Review | Version 2.2 | 01 July 2016 | 5145571
52
Appendix A. Terms of Reference
SCOPE OF WORK
PROJECT NAME: Sydney Water Corporation - Expenditure Review – Extension
1. BACKGROUND
IPART is seeking to extend Atkins Cardno’s engagement for the review of Sydney Water’s expenditure for the 2016 Determination period.
Task: Review Sydney Water’s submission to IPART’s draft report, including a further review of material presented by Sydney Water to support its proposed operating and capital expenditure.
2016 Price Review
IPART is conducting a review of Sydney Water’s maximum charges for its water, sewerage, stormwater drainage and other services, to apply from 1 July 2016. The maximum charges determined by IPART for the upcoming determination period will cover a period of up to five years from 1 July 2016 (the duration of which will be determined by IPART during the course of the review).
In setting prices, we are required to consider the matters set out in section 15 of the Independent Pricing and Regulatory Tribunal Act 1992, which include the standards for quality, reliability, and safety.
In December 2015, Atkins Cardno delivered its final report to IPART on its review of Sydney Water’s operating and capital expenditure. Recommendations included reducing Sydney Water’s proposed capital expenditure by $420 million, operating expenditure by $81 million and removing $25 million from the regulatory asset based (RAB) for redundant IT assets.
In March 2016, IPART released its draft report and draft determination. In setting price for the draft report, IPART accepted all of Atkins Cardno’s recommendations.
IPART’s Draft Report and Draft Determination are available at: http://www.ipart.nsw.gov.au/Home/Industries/Water/Reviews/Metro_Pricing/Review_of_prices_for_Sydney_Water_Corporation_from_1_July_2016
2. OBJECTIVES
The objectives of this consultancy are:
A review of Sydney Water’s submission to IPART’s Draft Report, with respect to Sydney Water’s response to IPART’s draft decisions on operating and capital expenditure.
3. DESCRIPTION OF SERVICES
IPART requires the consultant to provide the following services:
Task 1: Review of Sydney Water’s response to IPART’s draft decisions on expenditure
Atkins Cardno must undertake a review of Sydney Water’s submission to IPART’s draft report and draft determination, with respect to its response to IPART’s draft decisions on capital and operating expenditure.

Sydney Water Corporation - Expenditure Review Supplementary Report
Sydney Water Corporation - Expenditure Review | Version 2.2 | 01 July 2016 | 5145571
53
Atkins Cardno is required to review Sydney Water’s arguments and any further evidence on both capital and operating expenditure. This may include: the appropriateness of the continuing and catch-up efficiency factors used to derive efficient operating expenditure reductions to Sydney Water’s proposed expenditure on electricity evidence and arguments used to contest our adjustments to specific Sydney Water capital projects and programs the appropriateness of the continuing and catch-up efficiency factors used to derive efficient capital expenditure, and any trade-offs between capital expenditure and operating expenditure.
Atkins Cardno must provide advice on:
a) The level of efficient operating expenditure it recommends for Sydney Water between 2016-17 and 2019-20 for IPART’s final report and determination
b) The level of efficient capital expenditure it recommends for Sydney Water between 2016-17 and 2019-20 for IPART’s final report and determination
c) Any other adjustments deemed appropriate, as necessary.
4. REQUIRED OUTPUT
The primary output items from the project are set out below.
4.1 Reports
Final Report on the review of Sydney Water’s submission
The consultant will be required to produce a Final Report, which addresses Task 1 above. The report must include:
A clear explanation of the consultant’s reasons or rationale for each of these recommendations, including its information sources, approach and any key assumptions used report values in $2015-16.
Furthermore:
all tables and calculations in the reports must also be provided in Excel format to facilitate the transfer of the consultant’s outputs to IPART’s pricing models (to avoid rounding errors introduced through text-only formats), and
The consultant must conduct a thorough Quality Assurance check of all outputs to eliminate errors and inconsistencies.
The Final Report should be clearly and logically set out and written in plain English, avoiding the unnecessary use of technical terms. The report should incorporate appendices for supporting information and evidence where necessary.
The consultant should note that the Final Report may be released as a public document and made available on the IPART website. Sydney Water may identify expenditure projects or other detail that is commercial-in-confidence. The consultant must provide a version of the Final Report suitable for publication without commercial-in-confidence information, subject to IPART’s instructions as to whether it agrees that the identified information is commercial-in-confidence. Therefore, the consultant must provide two versions of the Final Report:
One confidential version
One public version suitable for publication without confidential information.

Sydney Water Corporation - Expenditure Review Supplementary Report
Sydney Water Corporation - Expenditure Review | Version 2.2 | 01 July 2016 | 5145571
54
The Final Report must be provided in PDF format suitable for web publication (i.e., on IPART’s website for stakeholder comment).
4.2 Presentation
Presentation to Tribunal
The consultant must prepare and deliver a presentation to the Tribunal which covers:
Key findings
Reasons for findings
5. SOURCES OF INFORMATION
The list of documents below is provided as a guide only, it should not be considered exhaustive.
Task 1: Review of Sydney Water’s submission to IPART’s Draft Report
Sydney Water’s submission will set out its arguments and reasons for its proposed changes to IPART’s draft decisions on operating and capital expenditure.
Sydney Water may also collate and produce further documents and evidence which support its submission, but are not in the public domain.
In addition to its own analysis of available information provided, the consultant is required to source and report analysis of other inputs through:
Interviews with Sydney Water staff
Comparisons with relevant organisations, and
The consultant’s experience in water and wastewater businesses and in undertaking other similar tasks.
In the event that the consultant identifies gaps in the information, it is the responsibility of the consultant to take the necessary steps to acquire the required information and to liaise promptly with IPART to ensure that the consultancy outputs are delivered on time. Should the reliability of the information be in doubt, the consultant is expected to source ‘second best information’, apply sound judgement and provide detail and justification for assumptions made.
6. LIAISON/CONSULTATION
The consultant may be required to attend and participate in meetings, have involvement in consultation, and attend and present at workshops or Tribunal meetings as circumstances dictate.

Sydney Water Corporation - Expenditure Review Supplementary Report
Sydney Water Corporation - Expenditure Review | Version 2.2 | 01 July 2016 | 5145571
55
7. TIMETABLE
The consultant must meet the following work schedule:
Date Activity
15 April 2016 Inception meeting with IPART
18 April 2016 Commence review of submission
4 May 2016 Presentation of findings to Tribunal
6 May 2016 Provide final report

Sydney Water Corporation - Expenditure Review Supplementary Report
Sydney Water Corporation - Expenditure Review | Version 2.2 | 01 July 2016 | 5145571
56
Appendix B. Response to representations on the IPART Draft Report related to Sydney Water’s IT proposal
IPART received representations seeking clarification on a number of points. Broadly, these clarifications relate to the optioneering process to determine Sydney Water Corporation’s IT programme and the costs involved in its ERP implementation, which includes replacement of its billing and customer relationship management systems. Many of the issues raised reflect areas which we have reviewed and the Corporation was either able to satisfy us that its plans are prudent and efficient, or where we were not satisfied, or the evidence was available, we have identified any risks and concerns to IPART.
Overall, we identified that Sydney Water has made significant progress in the level of maturity of its IT business planning, and its ability to delivery transformative projects like a SAP ERP since our review in 2011. When comparisons are made with other water utilities in Australia, it is expected that Sydney Water would be an outlier where there is a necessary and justified peak in expenditure, as is the case for the implementation of SAP. Our benchmarking with other Australian utilities suggest opex is under the average and that capex is higher than the average, which we also observed in 2011.
Sydney Water Corporation has undertaken extensive planning and investigation with some of the world’s leading IT consultancies as well as acquiring skills in house in order to identify and assess the options and their relative costs. Ultimately, the selection of a ‘Best of Breed’ versus an ERP solution is a function of the business strategy and resilience as enabled by the IT strategy and the procurement process that supports this decision.
The business case for the replacement of the billing system is primarily driven by the risks of an IT failure, while the business case for the wider ERP implementation is driven by efficiencies and enablers to the whole business. We have identified this in our report where there is a risk that existing assets are being decommissioned and replaced before the end of their asset life, and recommended adjustments are made. This relates to the CMS in the next price path.
There is no one single factor that determines which system is better than the other, rather the system that is implemented must be the one that most effectively and efficiently supports the business strategy. In the UK, SAP is used extensively in the water industry. Of the eight water utilities where it is used, Anglian Water, Southern Water and Thames Water have or are implementing the SAP CRM and Billing components while the other companies integrate with different solutions. In Australia, Sydney Water Corporation will be the first water utility to implement a SAP solution but it is used extensively by other companies.
Overall, the work done on the billing and customer relationship management components has been extensive; this is reflected in the robust cost build-up. Our review of the costs associated with the wider ERP implementation identified that the certainty of estimates relates to the stages of development of this project; that is, some costs towards the end of the price path are less certain. One of the benefits of the IPART regulatory process is that the prudence and efficiency of investments are assessed both before investment and also at the next Price Determination. There is therefore a strong incentive on Sydney Water to manage the implementation successfully and demonstrate its prudence and efficiency at the next price review.
We are not aware of any program to use digital or smart meters by Sydney Water.

© Atkins Ltd except where stated otherwise. The Atkins logo, ‘Carbon Critical Design’ and the strapline ‘Plan Design Enable’ are trademarks of Atkins Ltd.
WS Atkins International Ltd. Woodcote Grove Ashley Road Epsom KT18 5BW