Embed Size (px)
Citation preview
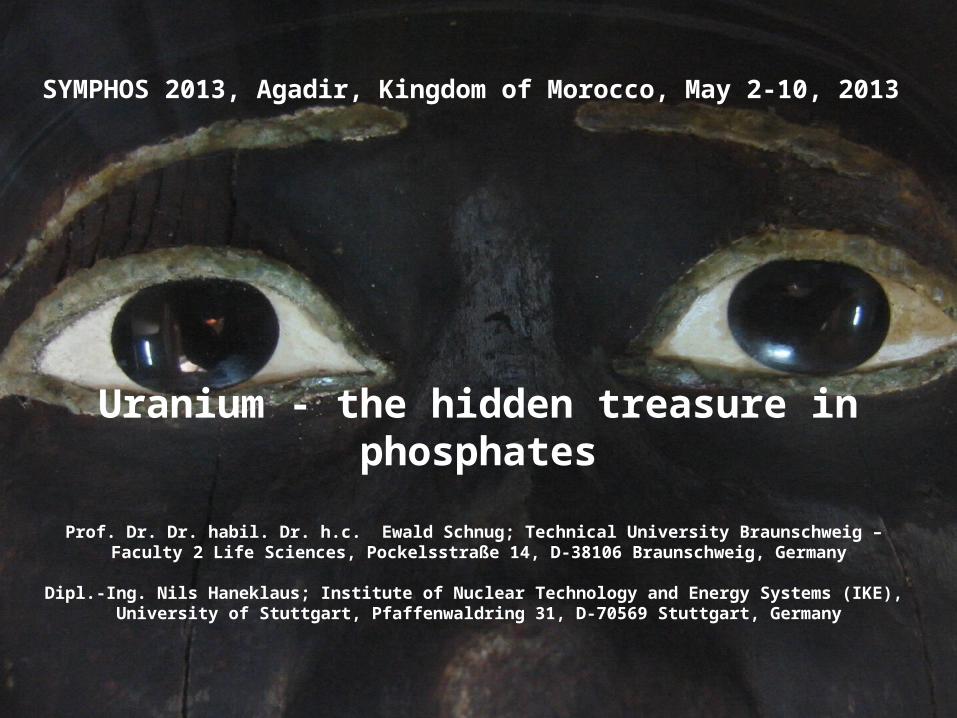
SYMPHOS 2013, Agadir, Kingdom of Morocco, May 2-10, 2013
Uranium - the hidden treasure in phosphates
Prof. Dr. Dr. habil. Dr. h.c. Ewald Schnug; Technical University Braunschweig – Faculty 2 Life Sciences, Pockelsstraße 14, D-38106 Braunschweig, Germany
Dipl.-Ing. Nils Haneklaus; Institute of Nuclear Technology and Energy Systems (IKE), University of Stuttgart, Pfaffenwaldring 31, D-70569 Stuttgart, Germany
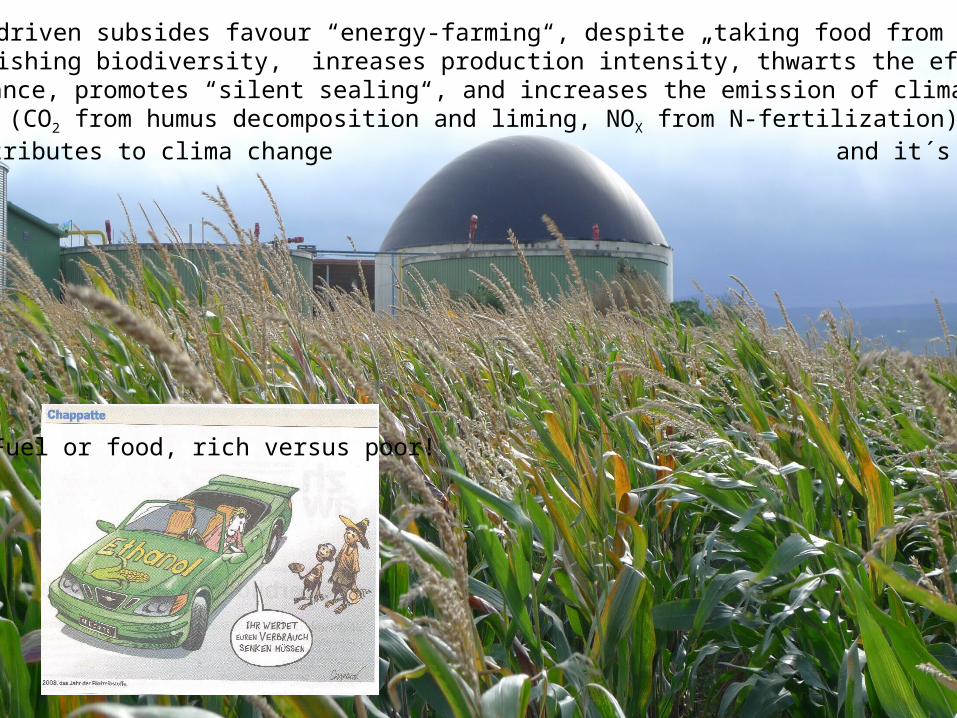
Political driven subsides favour “energy-farming“, despite „taking food from the poor“ and diminishing biodiversity, inreases production intensity, thwarts the efforts of
cross-compliance, promotes “silent sealing“, and increases the emission of clima gases from soils (CO2 from humus decomposition and liming, NOX from N-fertilization) and therefore contributes to clima change and it´s consequences.
Fuel or food, rich versus poor!
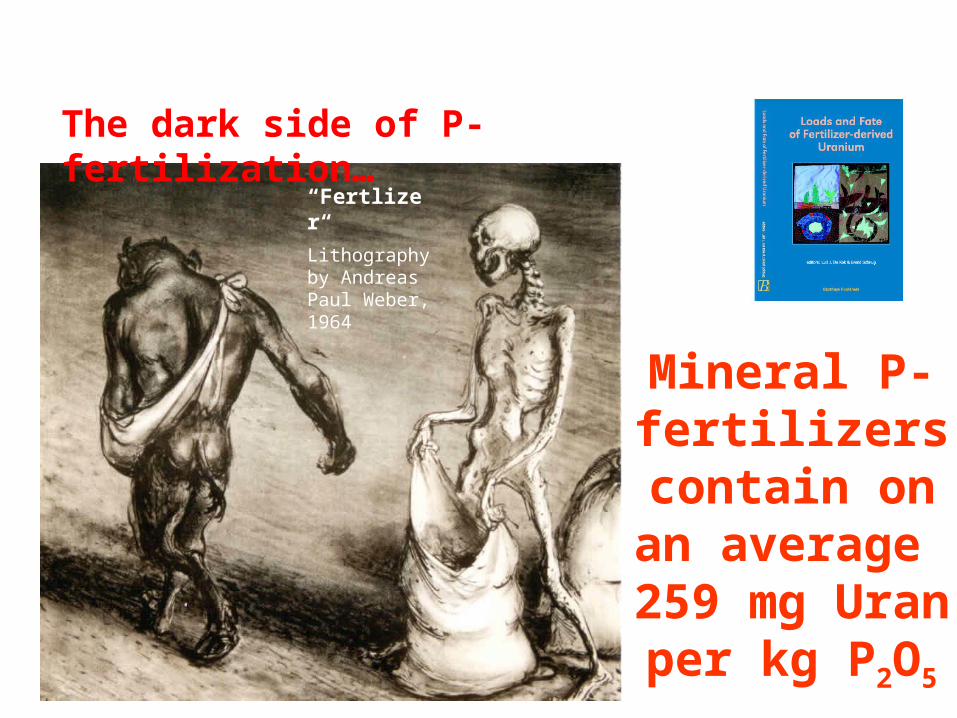
“Fertlizer“
Lithography by Andreas Paul Weber, 1964
The dark side of P-fertilization…
Mineral P-fertilizers contain on
an average 259 mg Uran per kg P2O5
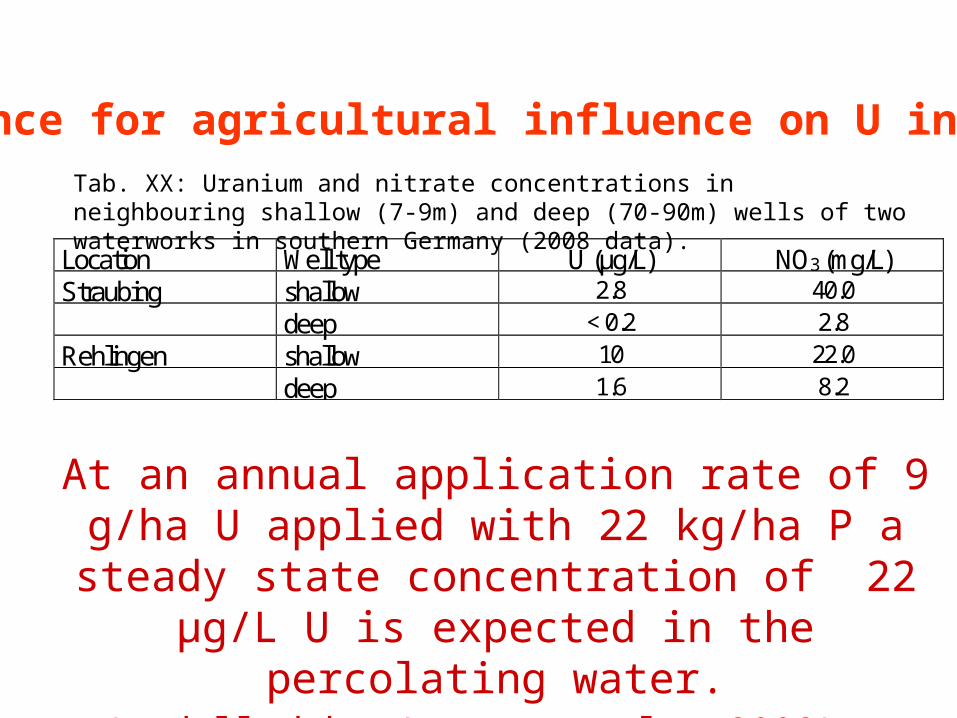
Location Well type U (µg/L) NO3 (mg/L) Straubing shallow 2.8 40.0 deep < 0.2 2.8 Rehlingen shallow 10 22.0 deep 1.6 8.2
Tab. XX: Uranium and nitrate concentrations in neighbouring shallow (7-9m) and deep (70-90m) wells of two waterworks in southern Germany (2008 data).
Evidence for agricultural influence on U in water
At an annual application rate of 9 g/ha U applied with 22 kg/ha P a steady state
concentration of 22 µg/L U is expected in the percolating water.
(modelled by Jaques et al., 2008)
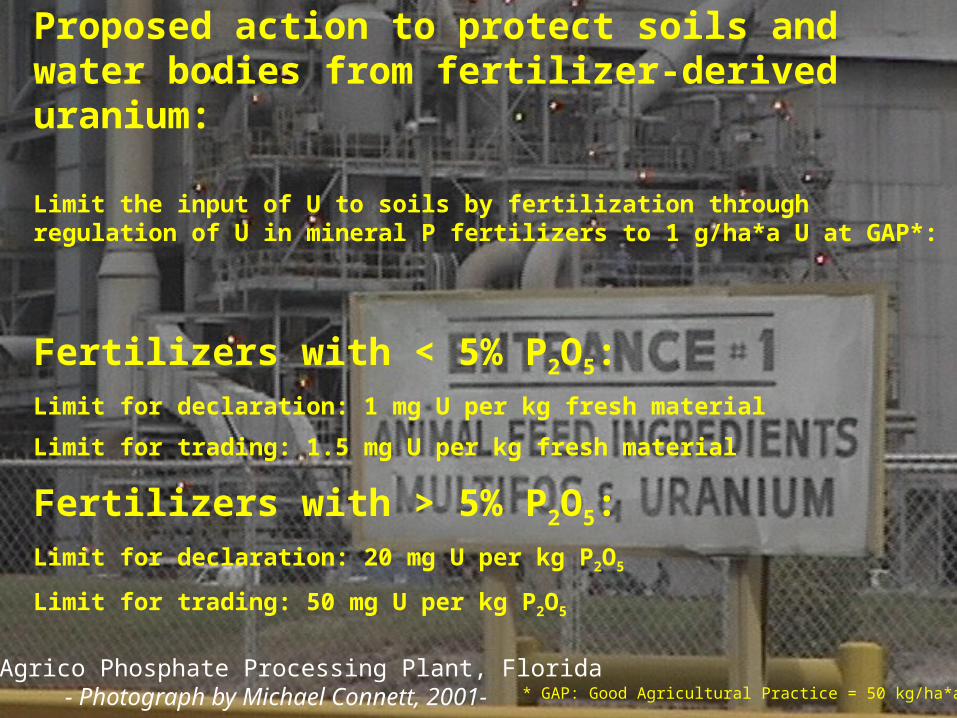
IMC Agrico Phosphate Processing Plant, Florida - Photograph by Michael Connett, 2001-
Proposed action to protect soils and water bodies from fertilizer-derived uranium:
Limit the input of U to soils by fertilization through regulation of U in mineral P fertilizers to 1 g/ha*a U at GAP*:
Fertilizers with < 5% P2O5: Limit for declaration: 1 mg U per kg fresh material
Limit for trading: 1.5 mg U per kg fresh material
Fertilizers with > 5% P2O5: Limit for declaration: 20 mg U per kg P2O5
Limit for trading: 50 mg U per kg P2O5
* GAP: Good Agricultural Practice = 50 kg/ha*a P2O5
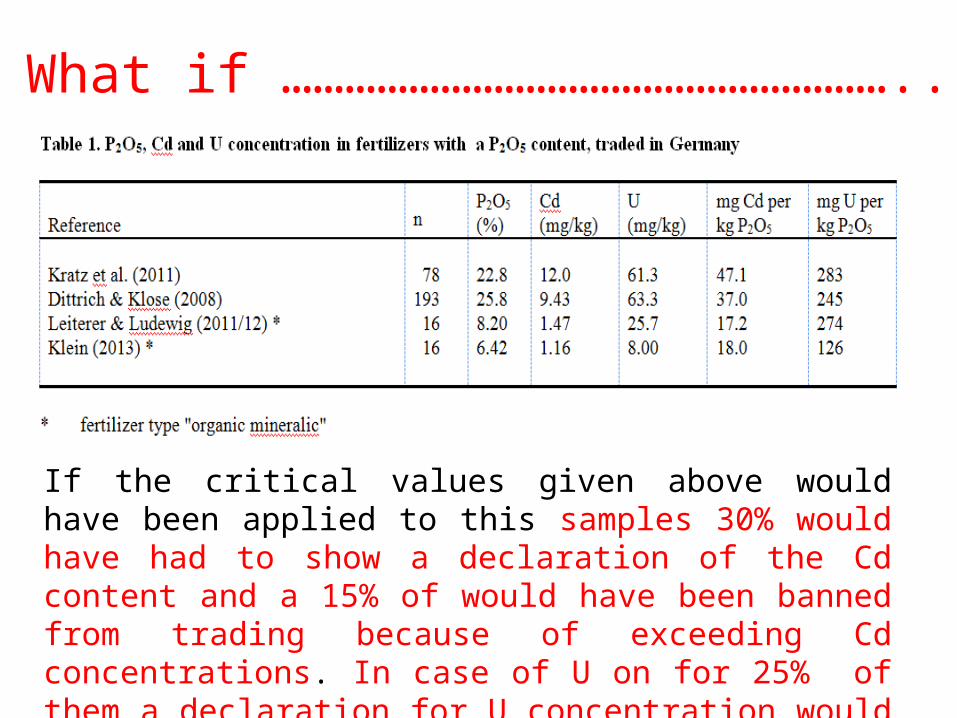
If the critical values given above would have been applied to this samples 30% would have had to show a declaration of the Cd content and a 15% of would have been banned from trading because of exceeding Cd concentrations. In case of U on for 25% of them a declaration for U concentration would have been required and nearly 50% of them would be not marketable.
What if …………………………………………………..
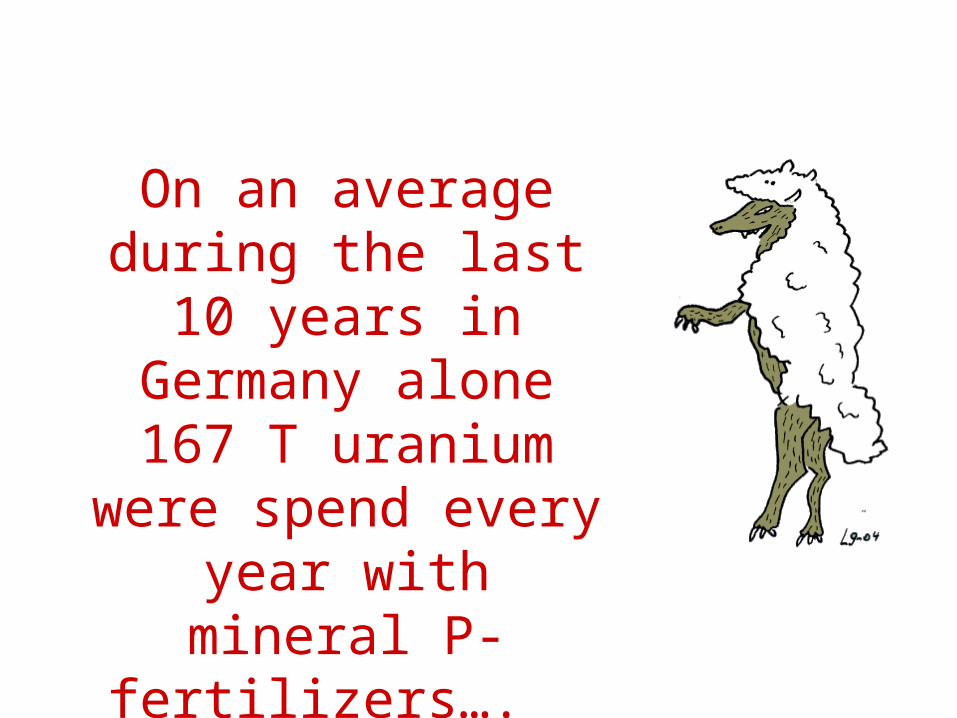
On an average during the last 10 years in Germany
alone 167 T uranium were
spend every year with mineral P-fertilizers….
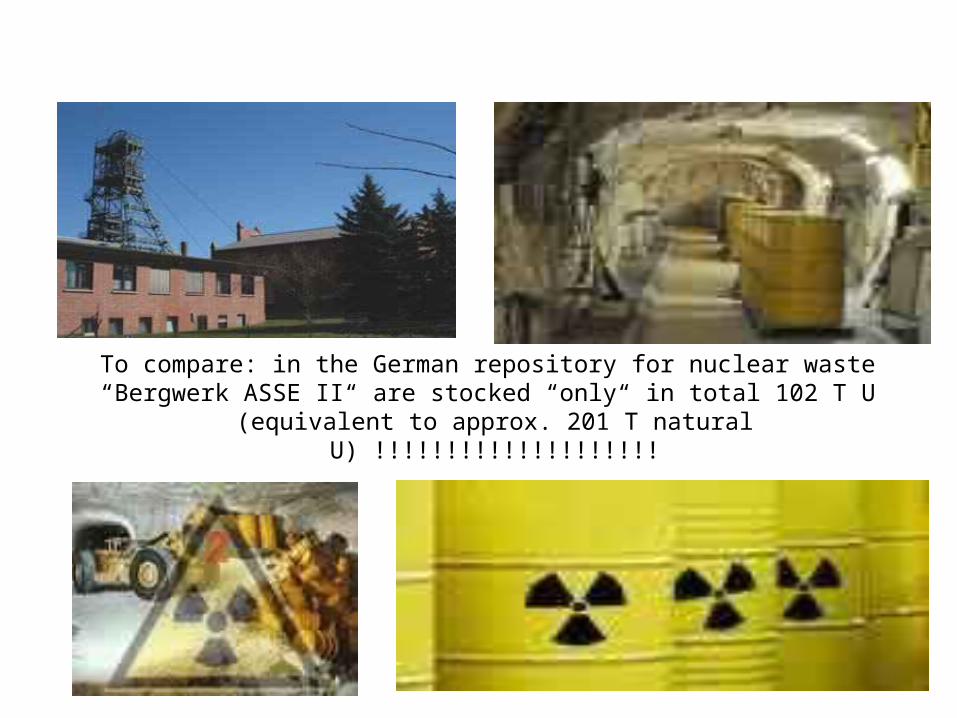
To compare: in the German repository for nuclear waste “Bergwerk ASSE II“ are stocked “only“ in total 102 T U (equivalent to approx. 201 T natural U) !!!!!!!!!!!!!!!!!!!!
Whereto with the uranium in mineral P-fertilizers?
BUT:
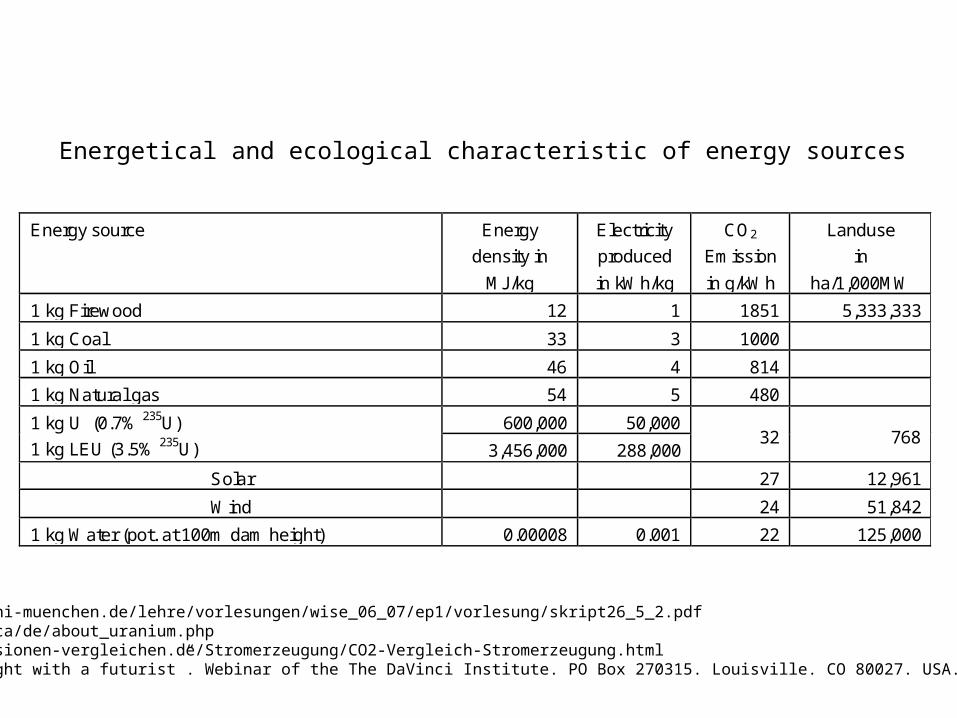
Energy source Energy
density in
MJ/kg
Electricity
produced
in kWh/kg
CO2
Emission
in g/kWh
Landuse
in
ha/1,000MW
1 kg Firewood 12 1 1851 5,333,333
1 kg Coal 33 3 1000
1 kg Oil 46 4 814
1 kg Natural gas 54 5 480
1 kg U (0.7% 235U)
1 kg LEU (3.5% 235U)
600,000 50,000 32 768
3,456,000 288,000
Solar 27 12,961
Wind 24 51,842
1 kg Water (pot. at 100m dam height) 0.00008 0.001 22 125,000
Sources: http://www.physik.uni-muenchen.de/lehre/vorlesungen/wise_06_07/ep1/vorlesung/skript26_5_2.pdfhttp://www.xemplar.ca/de/about_uranium.phphttp://www.co2-emissionen-vergleichen.de/Stromerzeugung/CO2-Vergleich-Stromerzeugung.htmlDeal. J. (2010) “Night with a futurist”. Webinar of the The DaVinci Institute. PO Box 270315. Louisville. CO 80027. USA. January 10, .2010.
Energetical and ecological characteristic of energy sources

On an average during the last 10 years in Germany
alone 167 T uranium were
spend every year with mineral P-fertilizers….
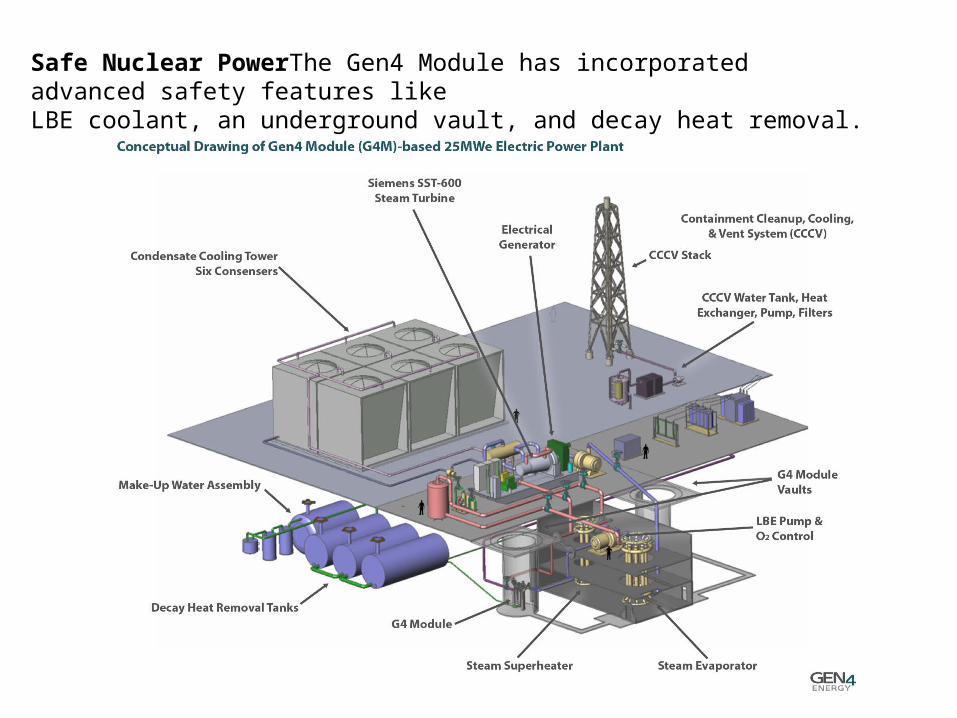
Safe Nuclear PowerThe Gen4 Module has incorporated advanced safety features like LBE coolant, an underground vault, and decay heat removal.
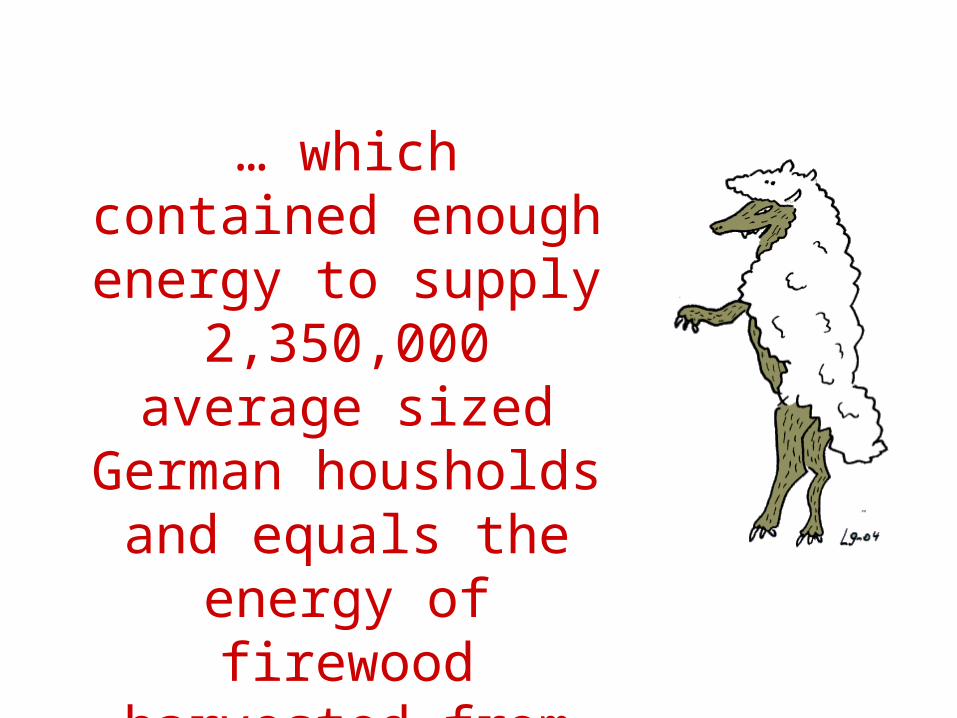
… which contained enough energy to supply 2,350,000
average sized German housholds and equals
the energy of firewood harvested from
5,600,000 ha forest.
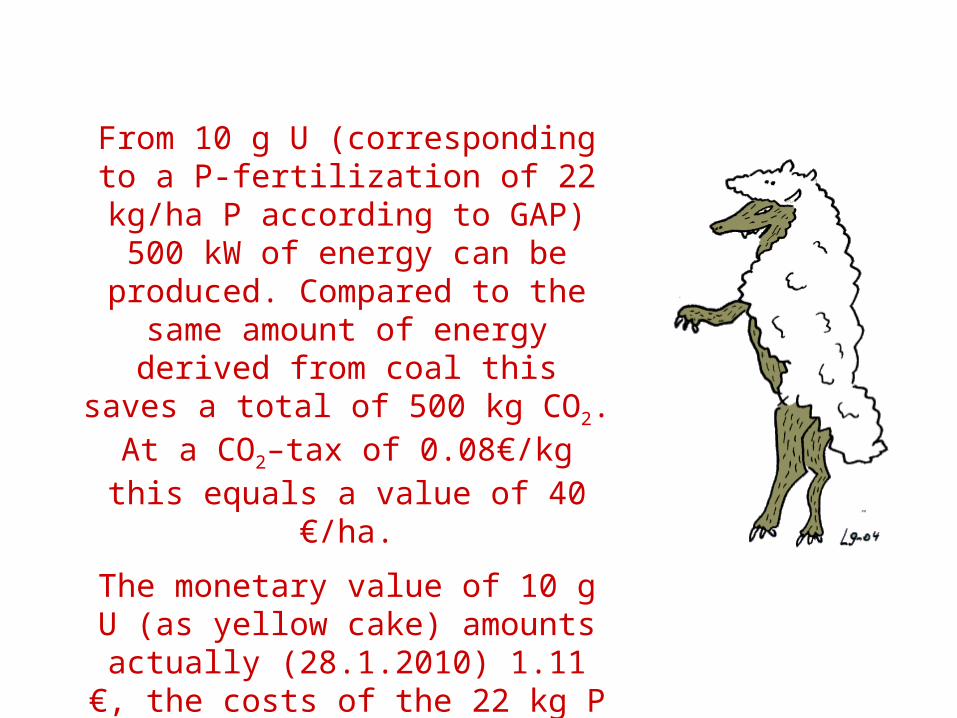
From 10 g U (corresponding to a P-fertilization of 22 kg/ha P
according to GAP) 500 kW of energy can be produced.
Compared to the same amount of energy derived from coal this saves a total of 500 kg CO2. At a CO2–tax of 0.08€/kg this equals
a value of 40 €/ha.
The monetary value of 10 g U (as yellow cake) amounts
actually (28.1.2010) 1.11 €, the costs of the 22 kg P 32 €.
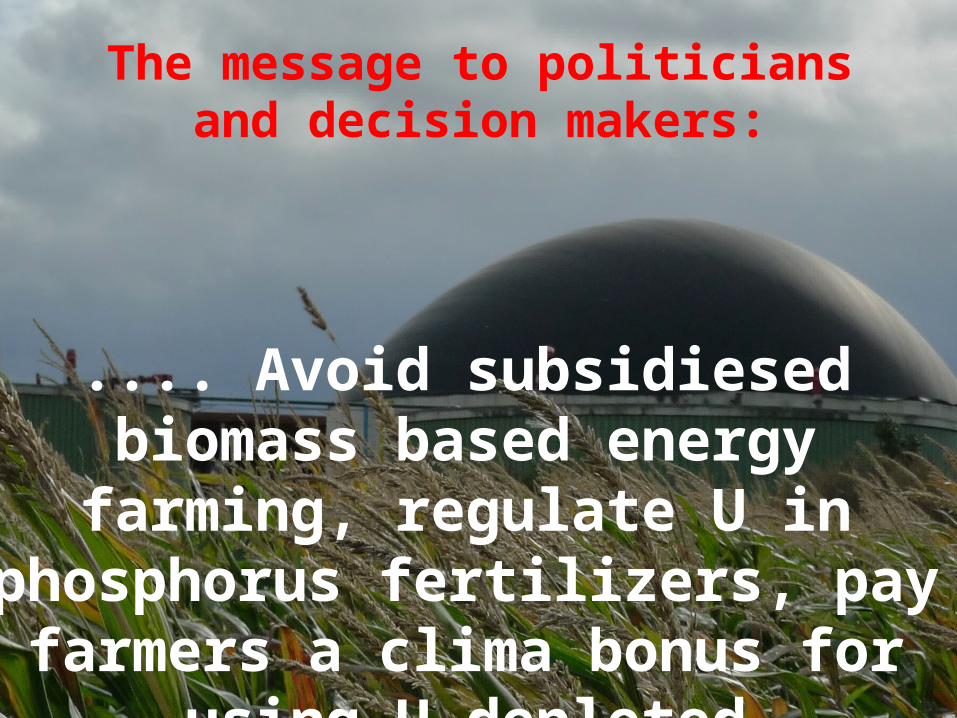
The message to politicians and decision makers:
.... Avoid subsidiesed biomass based energy farming, regulate U in
phosphorus fertilizers, pay farmers a clima bonus for using U depleted
fertilizers!
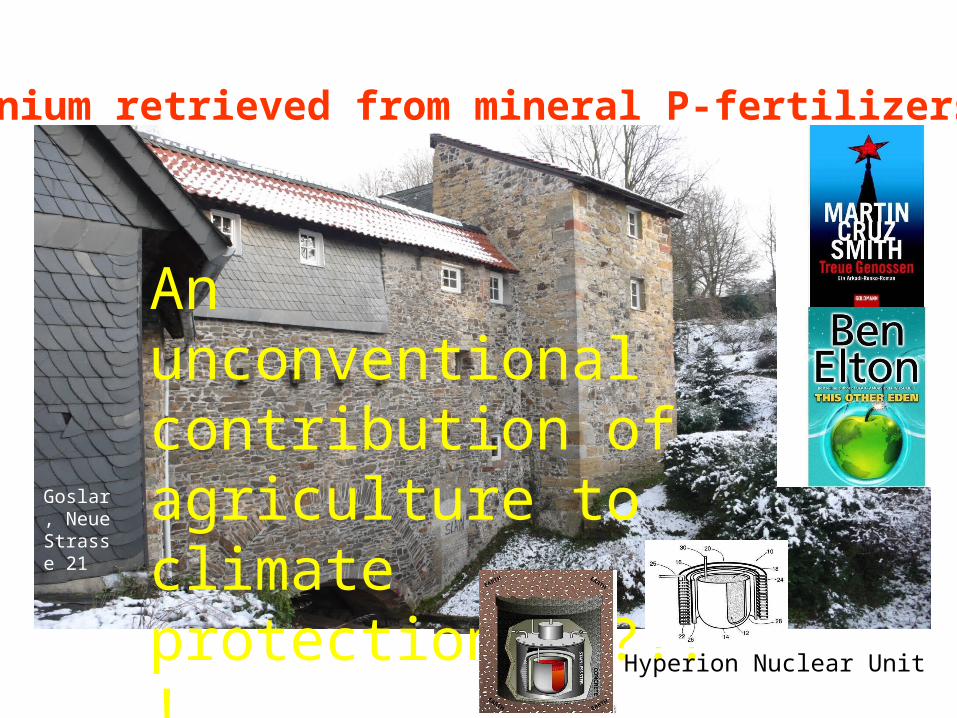
An unconventional contribution of agriculture to climate protection ?!?!?!
Uranium retrieved from mineral P-fertilizers –
Hyperion Nuclear Unit
Goslar, Neue Strasse 21
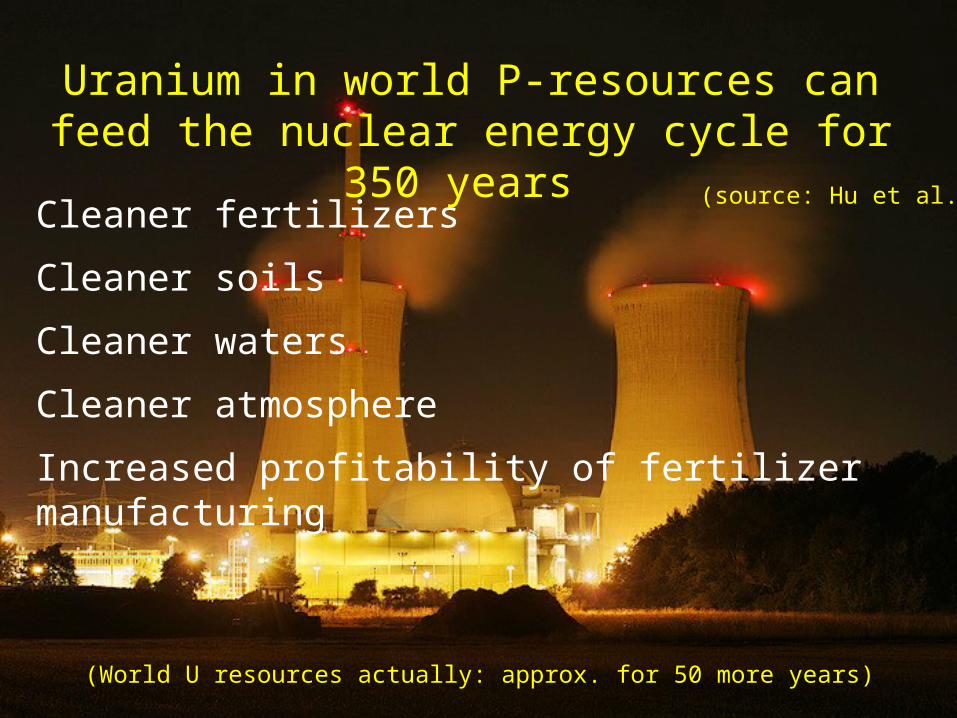
Uranium in world P-resources can feed the nuclear energy cycle for 350 years
(World U resources actually: approx. for 50 more years)
Cleaner fertilizers
Cleaner soils
Cleaner waters
Cleaner atmosphere
Increased profitability of fertilizer manufacturing
(source: Hu et al., 2008)

Thank you for your attention!


![Untitled-2 [] · Dr. Akshay Dr. Gade Dr. pratiksha Pat" Dr. Suresh Dr. AmitRajput Bensley Dr. Shefali Karkhanis Dr. Patil Dr. S Mulay Dr. Kamini Lakhiani Dr. Shah Dr. Jaydeep Rev](https://img.pdfslide.net/doc/110x75/5adee08b7f8b9a8f298c298a/untitled-2-akshay-dr-gade-dr-pratiksha-pat-dr-suresh-dr-amitrajput-bensley.jpg)


![2nd International Symposium on Innovation and Technology in the Phosphate Industry - [SYMPHOS 2013] Hydroxyapatite and Alizarin sulfonate ARS modeling](https://img.pdfslide.net/doc/110x75/5519d1b1550346695e8b4ce5/2nd-international-symposium-on-innovation-and-technology-in-the-phosphate-industry-symphos-2013-hydroxyapatite-and-alizarin-sulfonate-ars-modeling.jpg)