Embed Size (px)
Citation preview

HAL Id: tel-01202611https://tel.archives-ouvertes.fr/tel-01202611
Submitted on 21 Sep 2015
HAL is a multi-disciplinary open accessarchive for the deposit and dissemination of sci-entific research documents, whether they are pub-lished or not. The documents may come fromteaching and research institutions in France orabroad, or from public or private research centers.
L’archive ouverte pluridisciplinaire HAL, estdestinée au dépôt et à la diffusion de documentsscientifiques de niveau recherche, publiés ou non,émanant des établissements d’enseignement et derecherche français ou étrangers, des laboratoirespublics ou privés.
Synthesis and characterisation of nanofibre supports forplatinum as electrodes for polymer electrolyte fuel cells
Iuliia Maciejasz
To cite this version:Iuliia Maciejasz. Synthesis and characterisation of nanofibre supports for platinum as electrodes forpolymer electrolyte fuel cells. Material chemistry. Université Montpellier 2, 2014. English. �tel-01202611�

Délivré par l’Université Montpellier 2
Sciences et Techniques du Languedoc
Préparée au sein de l’école doctorale
Sciences Chimiques Balard
Et de l’unité de recherche UMR5253
Spécialité: Chimie et Physicochimie des Matériaux
Présentée par Iuliia SAVYCH MACIEJASZ
16 Juillet 2014
M. N. ALONSO-VANTE, Professeur, Université de Poitiers Rapporteur
M. P. KULESZA, Professeur, Université de Varsovie Rapporteur
M. J. ROZIÈRE, Professeur, UM 2 Directeur de thèse
Mme S. CAVALIERE, Maître de conférences, UM 2 Co-Directeur
Mme D. J. JONES, Directeur de Recherche, UM 2 Examinateur
M. J. J. ZAJĄC, Professeur, UM 2 Président du jury
M. P. KNAUTH, Professeur, Aix-Marseille Université Examinateur
Mme M. L. DI VONA, Professeur, Université de Rome Examinateur
SYNTHESE ET CARACTERISATION DE
NANOCOMPOSITES PLATINE/NANOFIBRES
POUR ELECTRODES DE PILES A COMBUSTIBLE
A ELECTROLYTE POLYMERE


Delivered by University of Montpellier 2
Prepared within the doctoral school
Sciences Chimiques Balard
and the research unit UMR5253
Specialty: Chemistry and Physicochemistry
of Materials
Presented by Iuliia SAVYCH MACIEJASZ
16 July 2014
M. N. ALONSO-VANTE, Professor, University of Poitiers Reviewer
M. P. KULESZA, Professor, University of Warsaw Reviewer
M. J. ROZIÈRE, Professor, UM 2 Supervisor
Mme S. CAVALIERE, Lecturer, UM 2 Co-Supervisor
Mme D. J. JONES, Research Director, UM 2 Examiner
M. J. J. ZAJĄC, Professor, UM 2 President of the jury
M. P. KNAUTH, Professor, Aix-Marseille University Examiner
Mme M. L. DI VONA, Professor, University of Rome Examiner
SYNTHESIS AND CHARACTERISATION OF
NANOFIBRE SUPPORTS FOR PLATINUM AS
ELECTRODES FOR POLYMER ELECTROLYTE
FUEL CELLS


À mon mari !
To my husband!
Mojemu mężowi!


I
ACKNOWLEDGEMENTS
I would like to thank one of my supervisors, Prof. Jacques Rozière for the scientific
discussions during my PhD thesis. I am highly impressed by his vast knowledge in the field of
fuel cells and original strategies of solving many scientific problems.
I would like to acknowledge my co-supervisor, Dr Sara Cavaliere for her encouragement
and her time that she gave very generously to discuss with me scientific issues, and to check
my thesis, scientific publications and oral presentations.
My special thanks goes to Dr Deborah Johnes, the director of research, who gave me the
opportunity to work on such an interesting topic and to participate in the Marie Curie program.
She believed in my ideas and gave me the possibility to work independently. All this helped me
to solve research problems and to become self-confident and independent researcher.
I would like to thank all the members of the jury for reading my PhD thesis and being
present during my public defense for the Ph.D. degree. In particular, I would like to thank
Prof. Kulesza and Prof. Alonso-Vante for their positive reports. Also I would like to thank
president of the committee Prof. Zając and the examiners Prof. Knauth and Prof. Di Vona. Last
but not lease, I would like to thank the members of my research committee Dr. D. Jones,
Prof. J. Rozière and Dr. S. Cavaliere, without whose guidance the completion of this thesis
would not be possible.
I would like to say thank you to my colleagues Ganna, Tahra, Vanessa, Rakhi, Kristina,
Anna, Christoph, Álvaro, Stefano, Surya, Elia, Paul, Visot, Yannick, Aurélien, Pierre, Najib,
Giorgio, Kahlil, Marcus, Adam, Bernard, Laura, Philippe, Marta, Anita, Nikolas, Vincent,
Julien, Marie and all the members of the AIME team for their support and good time that I
have spent with them.
A special thanks for Marc, Nicolas and Julien for their help with the single fuel cell testing.
Also, for David and José for their help with Raman analysis and Didier Cot for his help with
obtaining SEM images. I would like also to acknowledge Frédéric for helping me with
understanding various electrochemistry problems and Vanessa for English proofreading of my
thesis.
Thanks to Cathy and Tatyana for their help with all the administrative issues.
I would like to thank my parents, my sister and whole my family, all my friends and my
husband, whom I love a lot, for their love and support.


III
Contents
Acknowledgements................................................................................................. I
Contents .............................................................................................................. III
List of acronyms ................................................................................................ VII
Une Version Abrégée en Français .................................................................... -1-
CHAPITRE 1: Contexte et motivation .............................................................................. -3-
CHAPITRE 2: Nanofibres de carbone .............................................................................. -6-
CHAPITRE 3: Dioxyde de titane ....................................................................................... -8-
CHAPITRE 4: Dioxyde d'étain ........................................................................................ -14-
CHAPITRE 5: Caractérisation in situ d’AME à base de Pt / Nb-SnO2 dans une
monocellule de PEMFC ................................................................................................ -19-
Conclusions et perspectives............................................................................................... -23-
CHAPTER 1: Context and motivation ............................................................... 1
General introduction ............................................................................................. 3
1 Fuel cells ........................................................................................................... 4
1.1 Introduction .................................................................................................... 4
1.2 Polymer Electrolyte Membrane Fuel Cells (PEMFC) .......................................... 7
2 State of the art for PEMFC electrocatalyst supports ................................ 24
2.1 Carbon-based catalyst supports ....................................................................... 24
2.2 Alternative supports materials ......................................................................... 27
3 The electrospinning technique ..................................................................... 36
3.1 Introduction and principle ............................................................................... 36
3.2 Electrospun fibres as electrocatalyst support .................................................... 38
4 Principle of the synthesis and deposition of Pt nanoparticles ................... 43
4.1 Impregnation .................................................................................................. 43
4.2 Colloid methods .............................................................................................. 43
Motivation of the PhD thesis .............................................................................. 45
References ............................................................................................................ 46

IV
CHAPTER 2: Carbon nanofibres as electrocatalyst support ......................... 59
1 Synthesis and characterisation of carbon nanofibres ................................ 61
1.1 Synthesis of carbon nanofibres ......................................................................... 61
1.2 Morphological characterisation of carbon nanofibres ........................................ 62
1.3 Structural characterisation of carbon nanofibres .............................................. 65
1.4 Electrical characterisation of carbon nanofibres................................................ 67
2 Synthesis and characterisation of Pt supported on CNFs ......................... 70
2.1 Synthesis and physico-chemical characterisation of Pt/CNFs .............................. 70
2.2 Electrochemical characterisation of Pt/CNFs .................................................... 72
Conclusions and perspectives ............................................................................. 82
References ............................................................................................................ 83
CHAPTER 3: Titanium dioxide as electrocatalyst support ............................ 85
1 Synthesis and characterisation of electrospun titanium dioxide .............. 87
1.1 Synthesis and morphological characterisation of titania nanofibres .................... 88
1.2 Structural characterisation of titania nanofibres ............................................... 94
1.3 Electrical and electrochemical characterisation of titania nanofibres .................. 99
2 Synthesis and characterisation of Pt supported Nb doped titania
nanofibres ....................................................................................................... 101
2.1 Pt deposition and physico-chemical characterisation of obtained Pt/TNFs ......... 101
2.2 Electrochemical characterisation of Pt/TNFs .................................................. 104
Conclusions ........................................................................................................ 110
Perspectives ........................................................................................................ 110
References .......................................................................................................... 111
CHAPTER 4: Tin dioxide as electrocatalyst support .................................... 113
1 Introduction ................................................................................................. 115
2 Synthesis and characterisation of electrospun Nb doped SnO2 .............. 118
2.1 Synthesis of Nb doped SnO2 ........................................................................... 118
2.2 Mechanism of nanotube formation ................................................................. 121
2.3 Structural and properties of Nb doped SnO2 ................................................... 125
Conclusions ........................................................................................................ 130

V
3 Synthesis and characterisation of electrospun antimony doped SnO2... 131
3.1 Synthesis of Sb doped SnO2 ........................................................................... 131
3.2 Structural and properties of Sb doped SnO2 ................................................... 132
Conclusions ..........................................................................................................................135
4 Synthesis and characterisation of Pt supported on Nb-SnO2 ................. 136
4.1 Pt deposition and physico-chemical characterisation of Pt/Nb-SnO2 ................. 136
4.2 Electrochemical characterisation of Pt/Nb-SnO2 ............................................. 138
Conclusions ........................................................................................................ 145
Perspectives ......................................................................................................... 145
References .......................................................................................................... 146
CHAPTER 5: In situ characterisation of platinum on doped tin oxide
nanotube as a cathode electrocatalyst for PEMFC .................................... 149
1 Introduction ................................................................................................. 151
2 Characterisation of Pt/Nb-SnO2 based MEA with Nafion® membrane 153
2.1 Performance evaluation of Pt/Nb-SnO2 based MEA ........................................ 153
2.2 Electrochemical impedance spectroscopy (EIS) ............................................... 154
2.3 Durability evaluation of the Pt/Nb-SnO2 based MEA ....................................... 158
2.4 Evaluation of MEA durability using impedance spectroscopy .......................... 159
2.5 TEM characterisation before and after durability test ..................................... 161
2.6 SEM characterisation of the catalyst layer after durability test ........................ 163
Conclusions ........................................................................................................ 165
Perspectives ......................................................................................................... 165
3 Characterisation of Pt/Nb-SnO2 based MEA with PBI/H3PO4
membrane ...................................................................................................... 166
3.1 Performance evaluation at high temperature .................................................. 166
3.2 Electrochemical impedance spectroscopy ........................................................ 167
3.3 Durability evaluation of the Pt/Nb-SnO2 based MEA at high temperature ........ 168
3.4 Evaluation of MEA durability using impedance spectroscopy .......................... 169
3.5 TEM and SEM characterisation of MEAs after durability test ......................... 170
Conclusions ........................................................................................................ 172

VI
4 Characterisation of Pt/Sb-SnO2 based MEA with Nafion® membrane.173
4.1 Performance of Pt/Sb-SnO2 based MEA ......................................................... 173
4.2 Electrochemical impedance spectroscopy ........................................................ 173
4.3 Stability to potential cycling ........................................................................... 175
4.4 Evaluation of MEA durability using impedance spectroscopy .......................... 175
Conclusions and perspectives ........................................................................... 177
References .......................................................................................................... 179
CONCLUSIONS AND FUTURE PERSPECTIVES ..................................... 181
Conclusions and future perspectives ............................................................... 183
ANNEX A: Experimental part ......................................................................... 187
1. Synthesis of nanofibres and tubes via electrospinning ...............................................189
2. Characterisation of the support ...................................................................................191
3. Synthesis and deposition of Pt nanoparticles ..............................................................193
4. Ex situ electrochemical characterisation of Pt supported on electrospun fibres .....197
5. In situ characterisation of oxide based MEA ..............................................................199
References ............................................................................................................................202
Résumé / Abstract ............................................................................................. 204

VII
List of acronyms
AFC - Alkaline fuel cell
ATO - Sb doped tin oxide
BET - Brunauer–Emmett–Teller
CCM - Catalyst coated membrane
CCS - Catalyst coated substrate
CL - Catalyst layer
CNFs - Carbon nanofibres
CNTs - Carbon nanotubes
CVD - Chemical vapour deposition
DFT - Density Functional Theory
DMF - Dimethylformamide
DMFC - Direct methanol fuel cell
DOE - Department of Energy
ECSA - Electrochemical surface area
EDX - Energy-dispersive X-ray spectroscopy
EOR - Ethanol oxidation reaction
FC - Fuel cell
FWHM - Full width of high maximum
GDE - Gas diffusion electrode
GDL - Gas diffusion layer
HT-PEMFC - High-temperature proton exchange membrane fuel cell
ITO - Indium tin oxide
LSV - Linear sweep voltammetry
MCFC - Molten carbonate fuel cell
MEA - Membrane electrode assembly
MOR - Methanol oxidation reaction
MWCNTs - Multi-wall carbon nanotubes
NSTF - Nanostructured thin-films
OCV - Open circuit voltage
OMC - Ordered mesoporous carbon
ORR - Oxygen reduction reaction
PAFC - Phosphoric acid fuel cell

VIII
PAN - Polyacrylonitrile
PBI - Polybenzimidazole
PCFC - Protonic Ceramic fuel cell
PEM - Proton exchange membrane or Polymer electrolyte membrane
PEMFC - Proton exchange membrane fuel cell or Polymer electrolyte membrane fuel cell
PFSA - Perfluorosulfonic acid
PTFE - Polytetrafluoroethylene
PVA - Polyvinyl alcohol
PVP - Polyvinyl pyrrolidone
RDE - Rotating disc electrode
RH - Relative humidity
RHE - Reversible hydrogen electrode
RRDE - Rotating ring disc electrode
SEM - Scanning electron microscope
SMSI - Strong metal support interactions
SOFC - Solid oxide fuel cell
SWCNTs - Single-wall carbon nanotubes
TGA - Thermogravimetric analysis
TEM - Transmission electron microscope
TNFs - Titania nanofibers
TONT - Titanium oxide nanotubes
XPS - X-ray photoelectron spectroscopy
XRF - X-ray fluorescence

Une Version Abrégée en Français
sur
la thèse
de
SYNTHESE ET CARACTERISATION DE
NANOCOMPOSITES PLATINE/NANOFIBRES
POUR ELECTRODES DE PILES A COMBUSTIBLE
A ELECTROLYTE POLYMERE


Une Version Abrégée en Français
- 3 -
CHAPITRE 1: Contexte et motivation
Introduction
L'utilisation de combustibles fossiles (pétrole et gaz) a engendré un impact négatif sur
l'environnement comme le réchauffement climatique (en raison de l'émission de dioxyde de
carbone) et la pollution (due au monoxyde de carbone et aux oxydes d'azote). Avec la
croissance de la population mondiale, la demande d'énergie augmentera également, ce qui
entraînera une diminution des réserves de pétrole et de gaz. Par conséquent, l'utilisation de
sources d'énergie renouvelable est nécessaire.
Le remplacement des combustibles fossiles par des sources d'énergie renouvelables est très
attrayant, mais il y a toujours le problème concernant le stockage de l'énergie produite.
L'énergie peut être stockée sous forme d'hydrogène, produit par électrolyse, et ensuite convertie
en énergie électrique grâce à la technologie des piles à combustible. Une pile à combustible est
une pile qui convertit l'énergie chimique en énergie électrique par l'oxydation du combustible.
Il existe plusieurs types de piles à combustible. Parmi eux, les cellules à combustible
à membrane électrolyte polymère (PEMFC) offrent plusieurs avantages tels que de fortes
densités de courant et le démarrage/arrêt rapide en raison des températures de fonctionnement
relativement basses. De plus, elles sont des convertisseurs d’énergie propre, n’émettant pas de
dioxyde de carbone. Tous ces atouts rendent l’utilisation des PEMFC idéale pour une variété
d'applications telles que le transport, le stationnaire et les appareils électroniques portables.
L'assemblage membrane-électrode (AME) est le cœur de la PEMFC, composé d'une membrane
conductrice de protons placée entre deux électrodes. L'hydrogène est fourni du côté anode, où il
est décomposé sur la surface de platine en protons et électrons. Les protons migrent à travers la
membrane à la cathode, tandis que les électrons se déplacent le long d'un circuit électrique
extérieur vers la cathode, où ils réagissent avec l'oxygène. L'eau est le seul produit formé en
milieu acide pendant cette réaction. Les couches catalytiques aux électrodes sont constituées de
nanoparticules de catalyseur (par exemple platine) déposées sur un support de noir de carbone
mélangé avec un ionomère. Un support de catalyseur performant doit fournir une conductivité
électrique élevée, une grande surface spécifique et une porosité adéquate pour obtenir une
dispersion homogène du catalyseur et une grande résistance à la corrosion. Les noirs de
carbone sont actuellement utilisés en tant que supports en raison de leur conductivité élevée et
de leur grande surface développée. Cependant, ils se corrodent en particulier en phase de

Une Version Abrégée en Français
- 4 -
démarrage et d'arrêt, ce qui se traduit par l'agglomération et la perte des nanoparticules de
platine. Le carbone est oxydé à hauts potentiels, et la dissolution des nanoparticules de platine
se produit à des potentiels supérieurs à 0,6 V. De plus, la corrosion de carbone à niveau local
peut conduire à l'effondrement de la structure de l'électrode poreuse, qui est responsable des
pertes de performance. La courte durée de vie de l’AME est l'un des principaux obstacles pour
la commercialisation des PEMFC.
Par conséquent, d'autres supports carbonés ayant une meilleure stabilité électrochimique
(tel que le noir de carbone graphitisé, les nanofibres et les nanotubes de carbone) sont en cours
d’étude. Cependant, la corrosion du carbone ne peut pas être complètement évitée. Par
conséquent, des supports céramiques tels que des oxydes, des carbures et nitrures suscitent
beaucoup d'attention en tant que supports alternatifs. Selon des calculs thermochimiques et des
mesures expérimentales, l'oxyde de titane et l'oxyde d'étain sont stables dans les conditions de
fonctionnement de PEMFC. Par conséquent, ce travail est axé sur le développement d'oxyde de
titane et d'oxyde d'étain en tant que supports pour nanoparticule de platine dans les PEMFC.
Filage électrostatique
Au cours des dernières décennies, les nanostructures monodimensionnelles ont suscité un grand
intérêt en raison de leurs propriétés électriques, optiques, catalytiques et mécaniques
exceptionnelles. Il existe plusieurs méthodes pour la fabrication de fibres et de tubes tels que le
dépôt chimique en phase vapeur, la synthèse hydrothermale et assistée par les micro-ondes etc.
Cependant, elles nécessitent généralement de conditions strictes ou de procédures en plusieurs
étapes. En revanche, le filage électrostatique est une méthode simple qui permet d'obtenir des
matériaux de différente composition (fibres organiques, céramiques, hybrides et métalliques),
et morphologie (nanofibres, nanotubes, fibres creuses à canaux multiples). En outre, il permet
de préparer des structures 1D continues avec des diamètres uniformes.
Le système de filage électrostatique se compose d'une source de haute tension, d’un collecteur,
d'un pousse-seringue et d'une seringue. Quand une haute tension est appliquée à une goutte de
liquide, elle se charge et prend une forme conique en raison de la répulsion électrostatique (ce
qu'on appelle le cône de Taylor). Si la force électrostatique dépasse la tension superficielle et la
force viscoélastique, un jet liquide se forme à partir d'une solution de polymère. Ce jet liquide
est soumis à un processus d'allongement et amincissement, pendant lequel le solvant s'évapore.
Enfin, un tissu de fibres est déposé sur le collecteur.

Une Version Abrégée en Français
- 5 -
Objectif de la thèse
Dans ce travail, des nanofibres de carbone, TiO2 et SnO2 ont été préparées par la technique de
filage électrostatique. Afin d'améliorer la conductivité électronique et la surface spécifique de
TiO2 et SnO2, différents traitements thermiques et le dopage avec un hétéroatome (Nb) ont été
mis en œuvre. Les propriétés des supports de catalyseur obtenus ont été caractérisées par la
diffraction des rayons X (DRX), la spectroscopie de photoélectrons X (XPS), la spectroscopie
Raman, les mesures de surface spécifique, les mesures de conductivité électronique, la
microscopie électronique à balayage (MEB) et la microscopie électronique à transmission
(MET). Ensuite des nanoparticules de platine ont été obtenues par la méthode polyol assistée
par les micro-ondes et déposées sur les fibres et les tubes. L'influence de tels supports sur
l'activité catalytique et la stabilité a été évaluée en utilisant une électrode à disque tournant. Le
meilleur électrocatalyseur (Pt sur SnO2 dopé par Nb) a été caractérisé in situ dans une
monocellule de pile à combustible à électrolyte polymère.

Une Version Abrégée en Français
- 6 -
CHAPITRE 2: Nanofibres de carbone
Nanofibres de carbone
Les nanofibres de carbone graphitisé sont largement étudiées en tant que supports de catalyseur
pour PEMFC en raison de leur résistance à la corrosion plus élevée et leur conductivité.
Cependant, une graphitisation à des températures très élevées provoque une diminution de la
surface spécifique, ce qui ne permet pas d’atteindre la dispersion élevée et la forte interaction
avec le catalyseur métallique qui caractérisent les supports conventionnels tels que le noir de
carbone.
Dans ce travail, les nanofibres de carbone (CNF) ont été obtenus par filage électrostatique
d’une solution de polyacrylonitrile (PAN) (voir la Figure 1). La carbonisation a été réalisée
à trois températures différentes (700 - 100 - 1500 °C). Les échantillons obtenus ont été
caractérisés par la spectroscopie Raman, les mesures de surface spécifique, les mesures de
conductivité électronique et la microscopie électronique à balayage.
Stirring overnight at 60 °C
Electrospinning
PAN in DMF
Carbonisation at 1000 °C
for 1 h in N2
Carbonisation at 700 °C
for 1 h in N2
Stabilisation at 280 °C for 1 h at 1 °C/min in air
Carbonisation at 1500 °C
for 1 h in N2
Figure 1 : Représentation schématique du protocole de synthèse des fibres de carbone par filage
électrostatique.
Les propriétés des fibres de carbone sont résumées dans le Tableau 1. Le degré de
graphitisation et la conductivité électronique augmentent avec la température de carbonisation,
tandis que la surface spécifique diminue. CNF1000 et CNF1500 ont été choisis pour la
caractérisation électrochimique en raison de leur conductivité électrique élevée par rapport
à celle des CNF700.

Une Version Abrégée en Français
- 7 -
Tableau 1 : Rapport bande D / bande G, la conductivité électronique, la surface spécifique
des fibres de carbone.
Température de carbonisation 700 °C 1000 °C 1500 °C
Rapport des bandes D/G 2.2 1.7 0.9
Conductivité électronique, S/cm 0.0012 6.2 10
Surface spécifique, m2/g 262 36 20
Stabilité électrochimique
Le test de corrosion accélérée a été réalisé à 1,4 V vs. ERH (électrode réversible à hydrogène)
pendant 2 h à 80 °C dans H2SO4, 0,5 M, afin d'évaluer la stabilité électrochimique des fibres de
carbone. Les courants de corrosion mesurés pour CNF1000, CNF1500 et Vulcan XC-72R en
fonction du temps sont présentés dans la Figure 2. Les courants de corrosion intégrés pour
CNF1000, Vulcan XC-72R et CNF1500 ont des valeurs de 5,6 et 3,9 et 1,4 C / mg,
respectivement, indiquant une meilleure résistance à la corrosion de CNF1500 attribuée à son
degré élevé de graphitisation.
Figure 2 : Courant d'oxydation en fonction du temps pour CNF1000, CNF1500 et Vulcan
XC-72R à 1,4 V vs. EDH, 80 °C dans une solution de H2SO4 0,5 M.

Une Version Abrégée en Français
- 8 -
CHAPITRE 3: Dioxyde de titane
Le dioxyde de titane est un matériau prometteur en tant que support en raison de sa stabilité
électrochimique élevé et de fortes interactions avec le catalyseur métallique. Cependant, sa
faible conductivité électrique est l'une des principales limitations dans son application à la pile
à combustible. Ainsi, pour faire face à ce problème, deux stratégies ont été utilisées, le dopage
par des ions métalliques d’une part et le traitement à haute température en présence de H2
d’autre part. Les phases de Magneli obtenues à haute température (≥ 1000 °C) possèdent des
conductivités électroniques très élevée. Cependant, en général, elles présentent de très faibles
surfaces spécifiques (de l’ordre de 1 m2 / g), ce qui n'est pas assez élevé pour être utilisé
comme support de catalyseur. Par conséquent, une température relativement basse de réduction
de 800 °C a été choisie pour obtenir un compromis entre la conductivité élevée et une grande
surface spécifique.
Figure 3 : Etapes de synthèse des nanofibres d'oxyde de titane.
Synthèse et caractérisation de nanofibres d'oxyde de titane
Afin de préparer des fibres d’oxyde de titane, l'isopropoxyde de titane a été mélangé avec la
solution de polymère (polyvinylpyrrolidone - PVP) qui a été utilisée pour augmenter la
viscosité de la solution. L'acide acétique a été ajouté à la solution pour la stabiliser en
empêchant l'hydrolyse totale de l'isopropoxyde de titane avant le filage électrostatique. Les

Une Version Abrégée en Français
- 9 -
fibres ainsi préparées ont été calcinés à l'air à 500 °C ou à 800 °C à 5 °C / min pendant 6 heures
afin d'éliminer le polymère. Les fibres calcinées à 500 °C et à 800 °C sont indiquées comme
LT (basse température) et HT (haute température), respectivement (Figure 3). L'échantillon
réduit à 800 °C a été nommé HTR (réduction à haute température). Les nanofibres LT et HT
sont blanches, tandis que HTR sont de couleur bleue, ce qui suggère la présence de Ti3+.
Les valeurs de conductivité de pastilles (obtenus par pressage d'échantillons LT) réduites
à 800 °C sous atmosphère d’Ar/H2 sont rassemblées dans le Tableau 2. Après un tel traitement
thermique, la conductivité augmente de ~ 10-9 S/cm pour LT à ~ 10-3 S/cm pour HTR.
L'augmentation de conductivité est probablement due à la présence de Ti3+ à la surface des
nanofibres de TiO2, détectée par l’analyse XPS.
Enfin, la conductivité de 10-5 S/m pour l'échantillon non dopé, atteint ~ 10-3 S/m pour
l’échantillon HTR dopé par Nb.
Tableau 2 : Valeurs de conductivité électrique des nanofibres de TiO2 HTR avec différentes
concentrations de Nb.
%at Nb 0 5 10 20
σ (S/cm) 2.10-5 2.10-3 5.10-3 1.10-3
Afin d'estimer la surface spécifique, des isothermes d’adsorption/désorption d'azote ont été
établies pour les nanofibres LT, HT et HTR (Figure 4). L'isotherme de l'échantillon LT
présente une hystérésis, qui est typique des matériaux mésoporeux (isotherme de type IV). Les
isothermes des échantillons préparés à haute température, HT et HTR, ont montré une
diminution de l'adsorption de l'azote. En effet, les traitements à haute température conduisent
à la disparition des pores et à la diminution de la rugosité de la surface en raison de
l'agglomération des grains. Par conséquent, la surface spécifique diminue après réduction
à 800 °C de 65 à 16 m2 / g pour 10 at. % Nb dopé TiO2 (Figure 4).

Une Version Abrégée en Français
- 10 -
Figure 4 : Isothermes d'adsorption-désorption d’azote obtenues pour les nanofibres LT, HT
et HTR (à gauche); Valeurs de surface spécifique en fonction de la teneur en Nb en fibres de
TiO2 (à droite).
Parmi les différents échantillons d’oxyde de titane dopé au niobium, celui réduit à haute
témpérature (HTR) et contenant 10 at. % de Nb présente la conductivité électronique la plus
élevée. Par conséquent, cet échantillon (nommé nanofibres d'oxyde de titane - TNF) a été
sélectionné pour le dépôt de nanoparticules de platine et la caractérisation électrochimique.
Synthèse de Pt/TNF
Les nanoparticules de platine ont été préparées par la méthode polyol assistée par les micro-
ondes (Figure 5). Dans ce procédé, l'éthylène glycol joue le rôle de solvant, réducteur et
stabilisant des nanoparticules de platines. L'hydroxyde de sodium a été ajouté jusqu'à ce que
le pH 11.5, afin d'augmenter la concentration de l'anion glycolate après réduction. Ce dernier
peut stabiliser les nanoparticules en formant des complexes chélates à la surface du platine par
l'intermédiaire de leurs groupes carboxyliques. Le temps de réaction a été diminué de 2 heures
à 6 min à l'aide du réacteur à micro-ondes. L'acide sulfurique a été ajouté aux nanoparticules de
platine jusqu'à ce que le pH soit devenu 2, afin d'éviter la répulsion électrostatique entre les
nanoparticules de platine et l’oxyde de titane.
Les nanoparticules de platine déposées sur les TNF et le carbone Vulcan XC-72R (support
commercial) sont présentées dans la Figure 6. Les particules de platine sont dispersées de façon
moins homogène sur les TNF que sur le Vulcan XC-72R. Leur diamètre moyen est de 2,3 nm
pour Pt/TNF et 2,4 nm pour Pt/Vulcan XC-72R.

Une Version Abrégée en Français
- 11 -
NaOH addition until pH = 11.5
Microwave heating for 6 min at 120 °C
H2PtCl6 was dissolved in ethylene glycol
Addition of TiO2 nanofibres
H2SO4 addition until pH = 2
Stirring overnight
Centrifugation, washing with water and ethanol
Drying in oven at 80 °C overnight
Figure 5 : Schéma du protocole de synthèse des nanoparticules de platine.
Figure 6 : Image MET de 16% Pt/TNF (a) et 33% Pt/Vulcan XC-72R (b) et histogrammes de
distribution de taille des nanoparticules de platine obtenues à partir de mesures des 100
nanoparticules (c, d).

Une Version Abrégée en Français
- 12 -
Stabilité électrochimique
La stabilité électrochimique de Pt supporté sur l’oxyde de titane et Vulcan XC-72R a été évalué
en effectuant 1000 cycles entre 0,05 et 1,2 V. La perte de surface électrochimique (ECSA) a été
calculée après intégration de la zone d’adsorption/désorption d’hydrogène avant et après 1000
cycles (Figure 7). La perte d’ECSA était de 25% pour Pt/TNF, 32% pour le Pt/Vulcain
XC-72R et 39% pour catalyser commercial (Pt/C).
Figure 7 : Voltampérogrammes obtenus après 100 et 1000 cycles pour Pt/TNF (a), Pt/C (b)
et Pt/Vulcan XC-72R (c).
Sur la figure 8 sont présentées les activités massiques pour la réaction de réduction de
l’oxygène (ORR), calculées à partir des courbes de polarisation, à une vitesse de rotation de
900 tours par minute, avant et après 1000 cycles. Tous les catalyseurs ont présentés des pertes
d'activité massique (Tableau 3). Un tel résultat peut être attribué à la formation d’une couche
résistive de TiO2 à la surface des fibres au cours des 1000 cycles.

Une Version Abrégée en Français
- 13 -
Figure 8 : Activités massiques pour la réduction de l’oxygène avant (a) et après (b) 1000
cycles électrochimiques.
Tableau 3 : Perte d’activité massique pour la réduction de l’oxygène après les 1000 cycles
électrochimiques.
Catalyseur Pt/C Pt/Vulcan XC-72R Pt/TNFs
Perte d’activité massique, % 94 81 94
Le catalyser Pt/TNF a conservé 75% de son ECSA initiale après les 1000 cycles, mais a montré
une forte perte d'activité massique (Tableau 3), ce qui peut être attribuée à la formation d’une
couche d'oxyde résistif sur la surface des nanofibres.

Une Version Abrégée en Français
- 14 -
CHAPITRE 4: Oxyde d'étain
Les fibres creuses sont généralement préparées par filage électrostatique en utilisant une
aiguille à configuration coaxiale. Cependant, cette technique nécessite un contrôle strict des
paramètres de travail, et les paires de solution de précurseur appropriés. Par conséquent, un
nouveau procédé a été proposé, qui permet la fabrication de fibres creuses céramique après le
traitement thermique sans utilisation de l’aiguille coaxiale.
Synthèse des fibres-dans-tubes d’oxyde d'étain
Afin d'obtenir SnO2 dopé au Nb, SnCl2 et NbCl5 ont été dissous dans l'éthanol, tandis que
polymère de PVP a été dissous dans du DMF (Figure 9). Le mélange obtenu a été agité. Des
fibres de PVP/SnCl2 ont été préparées par filage électrostatique et ensuite calcinées à 600 °C
afin d'éliminer le polymère et permettre la formation de fibres creuses.
0.78 g SnCl2 and 0.06 g (5 at. %) NbCl5in 5.7 ml ethanol Solution 1
0.8 g PVP in 3.1 ml DMF
Solution 2
Electrospinning
syringe-collector distance - 10 cm, voltage - 15 kV, 0.4 ml/h
Calcination
600 °C, 4 h in air, 5 °C/min
Mixing and stirring
for 30 min
Figure 9 : Représentation schématique du protocole de synthèse de l'oxyde d'étain dopé au
niobium.
Une structure des fibres inhabituelles a été obtenue dans le cas d'échantillons dopés au
niobium, comme représenté sur la Figure 10. Des grains plus gros forment les parois des tubes
externes, tandis que des petits grains forment des fibres situées à l'intérieur des tubes.

Une Version Abrégée en Français
- 15 -
600 nm 300 nm
Figure 10 : Images MEB des fibres d'oxyde d'étain dopé au niobium.
Effet des paramètres de synthèse sur la morphologie de l'oxyde d'étain
L’oxyde d'étain dopé avec différent pourcentages atomiques de niobium (0,5, 2, 5 et 10 at. %)
a été préparé, afin de comprendre l'influence de la concentration de Nb sur la morphologie des
fibres. Les images MET montrent les sections transversales des fibres obtenues (Figure 11).
Des fibres creuses ont été observées lorsque la concentration de Nb est comprise entre 5 et 10
at. %, tandis que des fibres denses ont été obtenues lorsque le dopage Nb se situe entre 0,5 et 2
at. %. Par conséquent, on peut conclure que la présence de Nb favorise la formation de la
morphologie des fibres creuses.
Figure 11 : Images MET de coupes transversales de SnO2 dopé au 0,5 (a), 2 (b), 5 (c), et 10
at. % Nb (d).

Une Version Abrégée en Français
- 16 -
Afin d'évaluer l'effet de la vitesse de chauffage sur la morphologie de la fibre, Nb-SnO2 a été
calciné dans différentes conditions, comme présenté sur la Figure 12. Avec une vitesse de
chauffage de 1 °C/min, des fibres denses ont été obtenues, tandis qu’à 5 °C/min et 10 °C/min,
des fibres creuses avec un diamètre plus grand ont été observées en raison de l'effet de
l'expansion des gaz. Une telle augmentation de la vitesse de chauffage augmente la
décomposition du polymère, ce qui conduit à une augmentation de dégagement de dioxyde de
carbone et permet ainsi la formation de fibres creuses avec un diamètre supérieur. Par
conséquent, les fibres creuses peuvent être obtenues en utilisant des vitesses de chauffage
élevées.
Figure 12 : Tubes de Nb-SnO2 préparés en utilisant les taux de chauffage de 1, 5
et 10 °C/min.
Effet du dopage sur la conductivité électrique et la surface spécifique de SnO2
L'addition de Nb conduit à une augmentation de la conductivité électrique de SnO2 de
0,0011 S/cm à 0,021 S/cm. De plus, le dopage par Nb a un impact significatif sur la
morphologie des fibres de SnO2 comme l'inhibition de la croissance des grains de SnO2. Cela
conduit à une augmentation de la surface spécifique de SnO2 de 26 à 42 m2/g.
Synthèse de Pt/Nb-SnO2
Les nanoparticules de platine ont été préparées comme décrit dans le chapitre précédent.
L’image MET montre le catalyseur obtenu avec une teneur de 21% de Pt (Figure 13). La
surface intérieure des fibres creuses est également accessible à des particules de platine, ce qui
permet une bonne dispersion de Pt. Le diamètre moyen des particules est environ 3 nm, qui est
proche de la taille des particules calculée à partir de diffraction des rayons X (4 nm).

Une Version Abrégée en Français
- 17 -
Figure 13 : Images MET de coupes transversales de 21% Pt/Nb-SnO2 (à gauche) et
histogrammes de la distribution de la taille des nanoparticules de platine obtenues à partir de
la mesure de 100 nanoparticules (à droite).
Stabilité électrochimique
L'ECSA a été évaluée avant et après 2000 cycles électrochimiques, afin de comparer la stabilité
du Pt/Nb-SnO2 avec un catalyseur conventionnel Pt /C. Sur la figure 14 sont présentés les
voltampérogrammes obtenus après 100, 1000 et 2000 cycles pour Pt/Nb-SnO2 et Pt/C. L'ECSA
diminue avec le nombre de cycles pour tous les échantillons. Généralement, ce phénomène est
attribué à la dissolution, la migration, l'agglomération et la croissance de nanoparticules Pt.
Cependant, Pt/Nb-SnO2 a subi une perte d’ECSA significativement plus faible (24%) comparée
à celle de Pt/C (86%) après 2000 cycles. Ce résultat peut être attribué à une meilleure durabilité
électrochimique de Pt/Nb-SnO2, et suggère une forte interaction entre les nanoparticules de
platine et d'oxyde d’étain.
Figure 14 : Voltampérogrammes obtenus après 100, 1000 et 2000 cycles pour Pt/Nb-SnO2
(a) et Pt/C (b) à une vitesse de balayage de 50 mV/s.

Une Version Abrégée en Français
- 18 -
L'activité massique pour la réaction de réduction de l’oxygène a été évaluée avant et après les
2000 cycles (Figure 15). Le catalyseur Pt/Nb-SnO2 a présenté une perte de 90% de l'activité
massique après 2000 cycles, tandis que Pt/C a montré une perte de 99% après le même nombre
de cycles, ce qui indique une meilleure stabilité du support Nb-SnO2. Ce résultat est lié à la
diminution d’ECSA observé précédemment.
Figure 15 : Activités de masse de mesures à 900 tours par minute pour Pt/Nb-SnO2 et Pt/C
avant (à gauche) et après (à droite) le test de stabilité. Charge de Pt sur les électrodes était ~
120 µg/cm2.
Pt/Nb-SnO2 catalyseur présente une meilleure stabilité électrochimique par rapport à Pt/TNF.
Par conséquent, il a été sélectionné pour la caractérisation dans une cellule de PEMFC.

Une Version Abrégée en Français
- 19 -
CHAPITRE 5: Caractérisation in situ d’une AME à base de Pt / Nb-SnO2
dans une cellule de PEMFC
Préparation d’AME
Afin de préparer un assemblage membrane-électrode (AME), Pt/Nb-SnO2 ou un catalyseur
commercial Pt/C ont été dispersés dans l'éthanol et une solution de Nafion®. Les encres
catalytiques obtenus ont été pulvérisées sur la couche de diffusion (10 Sigracet BC, 4 cm2) et
ont été séchées à 80 °C sur une plaque chauffante. L'épaisseur des électrodes obtenues était
d'environ 10 µm. Le chargement de Pt et la quantité de Nafion® dans l’electrode était 0,5
mg/cm2.
Performance d’AME à base de Pt/Nb-SnO2
La Figure 16 montre les courbes de polarisation d’AME contenant Pt/Nb-SnO2, Pt/Nb-SnO2-
Vulcan et Pt/C à la cathode. L’AME à base de Pt/Nb-SnO2 fournit une densité de puissance
maximale de 0,41 W/cm2, ce qui est relativement élevé étant donné que l'électrode n'a pas été
optimisée en termes de chargement de platine ou ionomère. L’AME à base de Pt/C présente
une densité de puissance maximale plus élevée de 0,96 W/cm2 indiquant une meilleure
utilisation de Pt pour le catalyseur commercial.
0.0 0.5 1.0 1.5 2.0
0.0
0.2
0.4
0.6
0.8
1.0
0.41 W/cm2
0.61 W/cm2
21% Pt/NbSnO2
20% Pt/NbSnO2+Vulcan
50% Pt/C
Po
ten
tia
l (V
)
Current density (A/cm2)
0.96 W/cm2
0.0
0.2
0.4
0.6
0.8
1.0
Po
wer
den
sity
(W
/cm
2)
Figure 16 : Courbes de polarisation pour des AME contenant Pt/Nb-SnO2 (100% RH),
Pt/Nb-SnO2-Vulcan (50% RH à la cathode) et Pt/C (100% RH) à 80 °C sous H2/O2 (1,5: 2) et
2 bars (abs).

Une Version Abrégée en Français
- 20 -
Afin d'améliorer la conductivité électrique de la cathode, du noir de carbone (Vulcan XC-72R)
a été ajouté à l'encre du catalyseur. La teneur obtenue en Vulcan XC-72R était 0,125 mg/cm2.
Ainsi, la densité de puissance maximale a été augmentée de 0,41 W/cm2 à 0,61 W/cm2 pour
Pt/Nb-SnO2-Vulcan-AME.
Durabilité d’AME à base de Pt/Nb-SnO2
Afin d'étudier la stabilité des performances des piles à combustible, un test de vieillissement
accéléré a été réalisé. Au cours de chaque cycle, la valeur de potentiel a été variée entre 0,9 et
1,4 V avec un palier de potentiel de 3 s. Les conditions expérimentales du test de stabilité sont
indiquées dans le Tableau 4.
Tableau 4 : Conditions du test de stabilité.
T 80 °C
Humidité relative (RH) 100 %
Pression 2 bar (abs)
Gaz stœchiométrie H2/O2 – 1.5/2
Protocole d'un cycle 0.9 V pendant 3 s et ensuite 1.4 V pendant 3 s
Nombre de cycles 1200
Sur la figure 17 sont présentées les courbes de polarisation des AME contenant Pt/Nb-SnO2 et
Pt/C à la cathode avant et après le test de stabilité. Le potentiel de circuit ouvert (OCV) était
d'environ 0,96 V pour tous les AME et il est resté pratiquement inchangé après le test de
stabilité. La courbe de polarisation de l'AME contenant Pt/Nb-SnO2 est restée pratiquement
inchangée, tandis que pour Pt/C, on constate une augmentation importante des polarisations
déjà après 400 cycles.
A haut potentiel (1,4 V), l'oxydation de carbone conduit à une fonctionnalisation de la surface
de carbone, ce qui se traduit par une augmentation du caractère hydrophile de la couche de
catalyseur et des grandes surtensions de transport de masse. La diminution de la performance
de la pile à combustible est également liée à l'amincissement de la couche catalytique en raison
du détachement, de la migration et de l'isolement de nanoparticules de platine suite à la
corrosion du carbone. Pour l’AME contenant Pt/Nb-SnO2-Vulcan on constate également une
chute de tension importante due à la corrosion du noir de carbone.

Une Version Abrégée en Français
- 21 -
Figure 17 : Courbes de polarisation pour PEMFC contenant Pt/Nb-SnO2 (a), Pt/Nb-SnO2-
Vulcan (b) et Pt/C (c) à la cathode avant et après le test de stabilité à 80 °C.
La Figure 18 montre des images MEB des AME contenant Pt/Nb-SnO2, Pt/Nb-SnO2-Vulcan et
Pt/C. La couche catalytique contenant Pt/C présente une agrégation significative des
nanoparticules de platine, tandis qu'aucune agrégation particulière du platine ne peut être
observée à la cathode contenant Pt/Nb-SnO2. On observe également que la structure tubulaire
d’oxyde d’étain est maintenue pendant le test de stabilité.
Une bande de Pt prononcée peut être observée au milieu de la membrane, dans l’AME
contenant Pt/C, qui résulte de la dissolution de Pt à la cathode et la migration des ions à travers
la membrane, et la précipitation de particules de platine après réduction par l’hydrogène présent
au sein de la membrane. Ce phénomène est moins évident pour l’AME contenant Pt/Nb-SnO2,
ce qui peut être attribué à la plus grande stabilité de l'oxyde d'étain et les interactions fortes
entre le Pt et l’oxyde.

Une Version Abrégée en Français
- 22 -
s
Figure 18 : Images MEB des AME contenant Pt/Nb-SnO2, Pt/Nb-SnO2-Vulcan et Pt/C après
le test de stabilité.

Une Version Abrégée en Français
- 23 -
CONCLUSIONS ET PERSPECTIVES
Des nanofibres de carbone ont été préparées par filage électrostatique et calcination à trois
différentes températures (700, 1000 et 1500 °C) afin de trouver un compromis entre la stabilité
électrochimique et de la surface spécifique. Les CNF700 ont présenté une surface spécifique
élevée, mais n'étaient pas suffisamment conductrices pour être utilisées en pile. Les
échantillons CNF1000 et CNF1500 ont donné des conductivités bien plus élevées, mais des
surfaces spécifiques inférieures à celle de CNF700. CNF1500 était plus stable que CNFs1000 et
support commercial (Vulcan XC-72R).
Pour les futurs travaux, le dopage à l'azote peut être utilisé pour améliorer la stabilité
électrochimique, la conductivité et l'interaction entre les nanoparticules de Pt et les CNF. Une
activation à la vapeur d'eau pendant l'étape de carbonisation pourrait permettre l’élaboration de
CNF avec une surface développée supérieure.
Dans le chapitre 3, nous avons étudié des nanofibres d’oxyde de titane préparés par filage
électrostatique. La conductivité électrique de nanofibres de TiO2 a été améliorée par le dopage
par Nb et par un traitement thermique à 800 °C en présence d'hydrogène. De plus, le dopage
par Nb inhibe la croissance des grains de TiO2 conduisant à l'amélioration de la surface
spécifique des nanofibres. Cependant, la surface spécifique a diminué de manière significative
après une calcination à des températures élevées.
Le catalyseur Pt/TNF a présenté une plus grande stabilité après 1000 cycles électrochimiques
que celle de Pt/CNF. Cependant, l'activité massique pour la réaction de réduction de l’oxygène
a diminuée de façon dramatique au cours du test de stabilité, probablement en raison de la
formation d'une couche résistive de TiO2 à la surface des TNF. En outre, l'activité de Pt/TNF
était inférieure à celle de Pt/C. Ce résultat peut être attribué à la conductivité et la surface
spécifique fable des TNF. Par conséquent, la conductivité électrique de ces matériaux pourra
être augmentée davantage en utilisant différents dopants (par exemple, Ta et W).
Dans le chapitre suivant, SnO2 a également été caractérisé comme support de catalyseur pour
PEMFC. Ainsi, SnO2 dopé par Nb a été obtenu en combinant le filage électrostatique avec un
traitement thermique spécifique. L'addition de Nb a permis d'améliorer la conductivité
électrique et la surface spécifique de SnO2 et obtenir des fibres creuses.

Une Version Abrégée en Français
- 24 -
Pt déposé sur SnO2 dopé par Nb fourni une stabilité électrochimique plus élevée par rapport
à un catalyseur commercial type Pt/C. Par conséquent, il a été choisi pour une caractérisation
supplémentaire dans une monocellule de pile à combustible.
Dans la dernière partie de cette étude, Pt/Nb-SnO2 a été intégré dans l’assemblage membrane-
électrode (AME) à la cathode avec une membrane Nafion®. L’AME à base de Pt/Nb-SnO2
a montré une plus faible densité de puissance maximale, mais une plus grande stabilité que
celle de l’AME contenant Pt/C à la cathode. Dans le cas de l’AME à base de Pt/C, une bande
de Pt a été observée dans la membrane après le test de stabilité, indiquant la dissolution de ce
métal à la cathode, sa migration et sa précipitation au milieu de la membrane. Afin d'augmenter
la conductivité de la couche de catalyseur, le carbone Vulcan XC-72R a été ajouté à l’encre
catalytique contenant Pt/Nb-SnO2. Cela s'est traduit par une amélioration des performances de
la pile à combustible. Cependant, cette AME présente une stabilité inférieure à celle sans
Vulcan XC-72R indiquant la corrosion du carbone.
Afin d'améliorer les performances de l’AME contenant l’oxyde d’étain l’optimisation de la
structure de la couche catalytique à la cathode (épaisseur, porosité) et les techniques de
préparation des électrodes (conditions de pressage à chaud) devra être abordée. De plus, la
teneur en catalyseur et ionomère doivent également être optimisés.

CHAPTER 1:
Context and motivation


Chapter 1: Context and motivation
3
General introduction
The use of fossil fuels (oil, gas and coal) has engendered a negative impact on the
environment such as global warming (due to carbon dioxide emission) and environmental
pollution (due to carbon monoxide, nitrogen oxides and unburned hydrocarbons emissions).
With the growth of the world population, the demand for energy will also increase, which will
cause a depletion of the oil and gas reserve. According to the BP Statistical Review of World
of Energy 2012, the world primary energy consumption has grown by 1.8 % in 2012 and the
oil reserves are sufficient to meet the demand for only 52.9 years of global production [1].
Therefore, the use of alternative sources of energy [2] is required.
Renewable energy sources such as solar and wind power offer such possibility. These
environmentally clean technologies are expected to replace the conventional fossil fuels in the
future. In 2012, Denmark has signed an energy agreement where at least 50 % of the
electricity will be provided by wind power by 2020 and 100 % by renewable energy by 2050.
The federal Government of Germany has decided to close down all nuclear plants facilities by
2022 due to nuclear waste problems and risk of nuclear meltdown, as occurred in Fukushima
in 2011 and in Chernobyl in 1986.
Even though the replacement of fossil fuels by renewable power sources is quite
appealing, there is still the problem concerning the storage of the energy produced. The issue
can be resolved by coupling the system with batteries, a pumped hydro or hydrogen
storage [3],[4]. For instance, in Lolland (Denmark), in Unst (Scotland) and in other
countries [5], the excess of renewable power is stored in the form of hydrogen. This hydrogen
is produced by electrolysis and can be converted into electrical power through fuel cell
technology. The proton exchange membrane fuel cell (also known as polymer electrolyte
membrane fuel cell, PEMFC) is one of the most efficient fuel cells, which can be used in
transport, portable and stationary applications. However, low life time and high cost of the
PEMFC are two main barriers to its commercialisation. In particular, carbon supported Pt
electrocatalyst provides poor durability. In order to overcome the problem of support
corrosion, carbon should be replaced with more stable materials. Therefore, this work is
focused on development of alternative catalyst supports for PEMFC.

Chapter 1: Context and motivation
4
1. Fuel cells
1.1 Introduction
Christian Friedrich Schönbein discovered the principle of fuel cell in 1838 [6] followed by
the pioneering work of Sir William Grove in 1839, who built up the first fuel cell called
“a gaseous Voltaic battery” [7],[8]. Porous platinum was used as the electrodes and diluted
sulfuric acid was the electrolyte. Mond and Langer improved the Grove’s fuel cell using
porous matrix to hold the liquid electrolyte and platinum black as a catalyst [9]. After 100
years since discovery of the first fuel cell, Francis Thomas Bacon developed the first alkaline
40-cell stack with a power of 5 kW. A similar type of alkaline fuel cell was used by the
NASA for the space missions in 1960s (Apollo in 1968).
A fuel cell is a device that converts chemical energy into electrical energy through the
oxidation of the fuel. The system consists of two electrodes in contact with an electrolyte,
which conducts only ionic species. At the anode, fuel is decomposed into ions and electrons.
Depending on the type of the fuel cell the ionic species travel from anode to cathode or vice
versa, while electrons travel along an external circuit to the cathode, where reduction of
oxygen takes place.
There are many advantages of using fuel cells over conventional energy conversion
devices such as [10]:
Efficiency of fuel cells is not limited by the Carnot cycle. Therefore, they show higher
theoretical and practical efficiency than combustion engines (the theoretical efficiency of
a fuel cell at 25 °C using hydrogen is around 83 %).
Scalable power. Small fuel cells can be almost as efficient as large ones compared to
other technologies such as gas turbines that can be 50 % less efficient when scaled down to
a smaller size.
Possibility to connect individual fuel cells in a series (fuel cell stack).
Zero CO2 emission, when hydrogen produced by electrolysis is used as fuel. Water is
the only product of the reactions in PEMFC.
Absence of moving parts in the fuel cells what makes them quiet.
Furthermore, fuel cells generate the electricity as long as the oxidant and fuel are
supplied. This is an important advantage over conventional batteries, which often require long
recharge time.
Chapter 1: Context and motivation
5
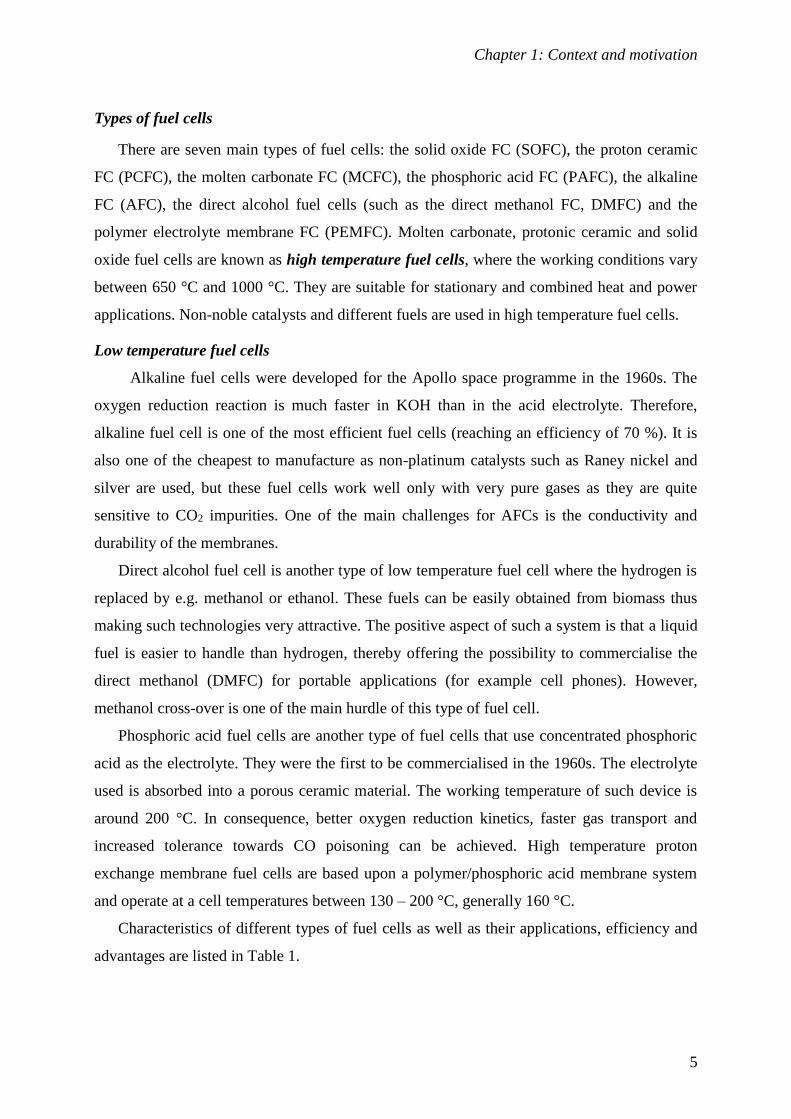
Types of fuel cells
There are seven main types of fuel cells: the solid oxide FC (SOFC), the proton ceramic
FC (PCFC), the molten carbonate FC (MCFC), the phosphoric acid FC (PAFC), the alkaline
FC (AFC), the direct alcohol fuel cells (such as the direct methanol FC, DMFC) and the
polymer electrolyte membrane FC (PEMFC). Molten carbonate, protonic ceramic and solid
oxide fuel cells are known as high temperature fuel cells, where the working conditions vary
between 650 °C and 1000 °C. They are suitable for stationary and combined heat and power
applications. Non-noble catalysts and different fuels are used in high temperature fuel cells.
Low temperature fuel cells
Alkaline fuel cells were developed for the Apollo space programme in the 1960s. The
oxygen reduction reaction is much faster in KOH than in the acid electrolyte. Therefore,
alkaline fuel cell is one of the most efficient fuel cells (reaching an efficiency of 70 %). It is
also one of the cheapest to manufacture as non-platinum catalysts such as Raney nickel and
silver are used, but these fuel cells work well only with very pure gases as they are quite
sensitive to CO2 impurities. One of the main challenges for AFCs is the conductivity and
durability of the membranes.
Direct alcohol fuel cell is another type of low temperature fuel cell where the hydrogen is
replaced by e.g. methanol or ethanol. These fuels can be easily obtained from biomass thus
making such technologies very attractive. The positive aspect of such a system is that a liquid
fuel is easier to handle than hydrogen, thereby offering the possibility to commercialise the
direct methanol (DMFC) for portable applications (for example cell phones). However,
methanol cross-over is one of the main hurdle of this type of fuel cell.
Phosphoric acid fuel cells are another type of fuel cells that use concentrated phosphoric
acid as the electrolyte. They were the first to be commercialised in the 1960s. The electrolyte
used is absorbed into a porous ceramic material. The working temperature of such device is
around 200 °C. In consequence, better oxygen reduction kinetics, faster gas transport and
increased tolerance towards CO poisoning can be achieved. High temperature proton
exchange membrane fuel cells are based upon a polymer/phosphoric acid membrane system
and operate at a cell temperatures between 130 – 200 °C, generally 160 °C.
Characteristics of different types of fuel cells as well as their applications, efficiency and
advantages are listed in Table 1.

Chapter 1: Context and motivation
6
Table 1: Comparison of fuel cell types
FC Electrolyte Mobile
Ion
T, °C Electrical
Efficiency
Applications Advantages
Polymer
Electrolyte
Membrane
(PEMFC)
Poly-
perfluoro-
sulfonic
acid
H+
80
60 %
transporta-
tion
35 %
stationary
Backup power
Portable power
Distributed
generation
Transportation
Solid electrolyte
reduced
corrosion
Quick start-up
Low
temperature
Direct methanol
(DMFC)
Poly-
perfluoro-
sulfonic
acid
H+
0-80
40 % Portable
Combined heat
and power
(CHP)
Liquid fuel
Quick start-up
Low
temperature
Alkaline (AFC)
Solution of
KOH
soaked in a
matrix
OH-
90-
200
60 %
Military
Space
Cathode
reaction is faster
Variety of
catalysts
Phosphoric acid
(PAFC)
Phosphoric
acid soaked
in a matrix
H+
150-
200
40 %
Distributed
generation
High efficiency
with CHP
Increased
tolerance to fuel
impurities
Molten
Carbonate
(MCFC)
Solution of
lithium,
sodium or
potassium
carbonates
soaked in a
matrix
CO32-
600-
700
45 – 50 %
Distributed
generation
Electric utility
High efficiency
Fuel flexibility
Variety of
catalysts
Suitable for
CHP
Protonic
Ceramic (PCFC)
Perovskite-
type
ceramic
membrane
H+
600-
700
- Power station
Micro-
cogeneration
Fossil fuel can
be used
Solid electrolyte
Solid oxide
(SOFC)
Yttria
stabilized
zirconia
O2-
700-
1000
60% Auxiliary power
Electric utility
Distributed
generation
High efficiency
Fuel flexibility
Variety of
catalysts
Solid electrolyte

Chapter 1: Context and motivation
7
1.2 Polymer Electrolyte Membrane Fuel Cells (PEMFC)
1.2.1 Introduction and principle
The first PEM fuel cell was developed by Willard Thomas Grubb and Leonard Niedrach
in the early 1960s. A huge progress in PEMFC performance was achieved in 1966, when the
sulfonated polystyrene membrane was replaced by Nafion® membrane (DuPont) [11]. In
1960s and early 1970s the utilisation of carbon black supported Pt allowed an increase of the
Pt surface area from 25 m2/g for Pt black to 100 m2/g for Pt/C and decrease of the Pt sintering
rate. In 1983 the decrease in a thickness of the Nafion® membrane from 175 to 50 µm resulted
in a significant enhancement of PEMFC performance [12]. Furthermore, a new short side
chain perfluorosulfonic acid (PFSA) membrane was developed by DOW in this period, with
lower equivalent weight and high conductivity. Finally, the addition of dispersed Nafion® into
the electrode layer ensured proton transport, which leads to more efficient catalyst utilisation
and hence high fuel cell performance. For example, in 1988 Srinivasan et al. [13] worked on
optimisation of the ionomer content in the catalyst layer and used high Pt loading to obtain
thin electrodes, which allowed achieving enhanced fuel cell performance.
Currently, Nafion® is still the most used PEMFC membrane due to its high proton
conductivity and durability, while carbon black supported Pt and Pt alloys are still the most
used electrocatalysts.
PEMFCs provide several advantages such as high power densities and fast start-up and
shutdown due to the low operating temperatures. Moreover, they are environmentally friendly
due to the zero emission of greenhouse gases. All these positive attributes make PEMFCs
ideal for a variety of applications such as transport, small-stationary and portable electronics.
However, further hurdles remain to be overcome to make such system attractive for
worldwide commercialisation. For instance, reduction of the precious metal used,
improvement of the lifetime of the device, reduction of the catalyst poisoning (by CO, sulphur
species, and ammonia) as well as improvement in the water management.
Chapter 1: Context and motivation
8
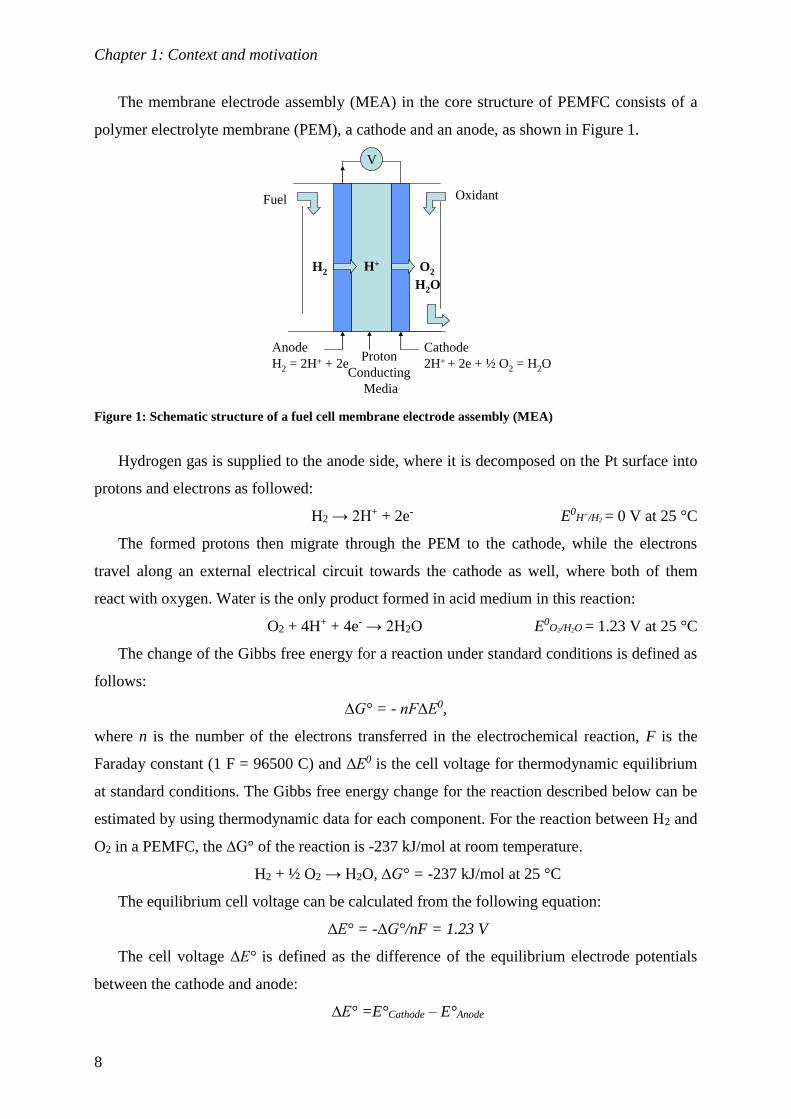
The membrane electrode assembly (MEA) in the core structure of PEMFC consists of a
polymer electrolyte membrane (PEM), a cathode and an anode, as shown in Figure 1.
H+
Proton
Conducting
Media
Cathode
2H+ + 2e + ½ O2 = H2O
Anode
H2 = 2H+ + 2e
H2 O2
V
H2O
Fuel Oxidant
Figure 1: Schematic structure of a fuel cell membrane electrode assembly (MEA)
Hydrogen gas is supplied to the anode side, where it is decomposed on the Pt surface into
protons and electrons as followed:
H2 → 2H+ + 2e- E0H+/H2 = 0 V at 25 °C
The formed protons then migrate through the PEM to the cathode, while the electrons
travel along an external electrical circuit towards the cathode as well, where both of them
react with oxygen. Water is the only product formed in acid medium in this reaction:
O2 + 4H+ + 4e- → 2H2O E0O2/H2O = 1.23 V at 25 °C
The change of the Gibbs free energy for a reaction under standard conditions is defined as
follows:
∆G° = - nF∆E0,
where n is the number of the electrons transferred in the electrochemical reaction, F is the
Faraday constant (1 F = 96500 C) and ∆E0 is the cell voltage for thermodynamic equilibrium
at standard conditions. The Gibbs free energy change for the reaction described below can be
estimated by using thermodynamic data for each component. For the reaction between H2 and
O2 in a PEMFC, the ∆G° of the reaction is -237 kJ/mol at room temperature.
H2 + ½ O2 → H2O, ∆G° = -237 kJ/mol at 25 °C
The equilibrium cell voltage can be calculated from the following equation:
∆E° = -∆G°/nF = 1.23 V
The cell voltage ∆E° is defined as the difference of the equilibrium electrode potentials
between the cathode and anode:
∆E° =E°Cathode – E°Anode

Chapter 1: Context and motivation
9
Mechanism of the hydrogen oxidation reaction (HOR)
There are two main pathways for HOR namely Tafel-Volmer and Heyrovski-Volmer [14].
The first mechanism involves adsorption of hydrogen onto the catalyst surface and
dissociation of H2 molecules into the atoms (Tafel reaction), while during the second one,
dissociation into proton and hydrogen atom takes place (Heyrovski reaction), followed by fast
charge-transfer step (Volmer reaction):
Tafel reaction: H2 → Had + Had
Heyrovsky reaction: H2 → Had + H+ + e-
Volmer reaction: Had → H+ + e-
The HOR in fuel cells on the Pt surface was considered to occur via Tafel-Volmer
mechanism. However, more recent studies have shown that HOR on Pt surface occurs via the
Tafel-Volmer mechanism at low overpotentials, whereas the contribution of Heyrovsky-
Volmer pathway increases with the overpotential [15],[16].
The HOR kinetics is ca 106 times faster compared with that of ORR. Therefore,
substantial efforts have been made for the development of efficient ORR
electrocatalyst [17],[18].
Mechanism of the oxygen reduction reaction (ORR)
Oxygen reduction reaction in acid medium is a sluggish reaction, which limits the
performance of a PEMFC. There are two pathways of ORR, the first one is a 2 electrons
reduction via hydrogen peroxide formation followed by another 2 electrons reduction to
water, while the second way is the direct 4 electrons reduction. The amount of H2O2 produced
in ORR and detected using rotating ring disc electrode (RRDE) is usually below 1 % for Pt/C
electrocatalyst in the potential range between 0.6 and 1.0 VRHE [19]. Presence of H2O2 leads
to the degradation of membrane and carbon support due to the formation of HO• radicals.
Therefore, the 4e- pathway is preferred. Both mechanisms are shown in Figure 2.
O2
2H2O
H2O2
H2O + O2
2H2O
2H+ + 2e-
disproportionation
4H+ + 4e-
2H+ + 2e-
4 electrons mechanism
2 electrons mechanism
Figure 2: Schematic pathways for the ORR in acidic solution [20].

Chapter 1: Context and motivation
10
Using density functional theory (DFT) calculations, the dissociative and the associative
mechanisms of oxygen reduction on Pt surface have been proposed [21],[22]. In the
dissociative mechanism (detailed form of 4-electron pathway), oxygen adsorption breaks
directly the O-O bond and the formed atomic O* (where * is a site on the Pt surface) is
reduced to OH* and to H2O without H2O2 formation:
½ O2 + * → O*
O* + H+ + e → OH*
OH* + H+ + e → H2O
The associative mechanism becomes dominant with increasing current density. In this
mechanism, the O-O bond is not broken during adsorption step, making possible the H2O2
formation.
O2 + * → O2*
O2* + H+ + e → HO2*
HO2* + H+ + e → H2O + O*
O* + H+ + e → OH*
OH* + H+ + e → H2O + *
There are three models for oxygen adsorption on the Pt surface, namely Griffiths, Bridge
and Pauling models [23]:
PtO
O
PtO – H
O – H
PtO
O
Pt – O – H
Pt – O – H
Pt
Pt – O
O
Pt + 2 H2O
2 Pt + 2 H2O
Pt – O
O – H
2H+2H+
2H+ 2H+
H+
H+
3H+ Pt + 2 H2O
Pt + H2O2
e-
e-
3e-
2e-2e-
2e-2e-
Griffiths model:
Pauling model:
Bridge model:
PtO
O
PtO – H
O – H
PtO
O
Pt – O – H
Pt – O – H
Pt
Pt – O
O
Pt + 2 H2O
2 Pt + 2 H2O
Pt – O
O – H
2H+2H+
2H+ 2H+
H+
H+
3H+ Pt + 2 H2O
Pt + H2O2
e-
e-
3e-
2e-2e-
2e-2e-
Griffiths model:
Pauling model:
Bridge model:
Figure 3 shows the activities of metals plotted as a function of the oxygen binding
energies (the so-called volcano plot) and as a function of both the O and the OH binding
energy. According to both plots, Pt is the most active ORR catalyst with optimum binding
energies of the oxygenated species. For Ag and Au, the low oxygen adsorption becomes rate-
determining step. In contrast, for metals located on the left side of the volcano plot, too strong
oxygen adsorption results in slow desorption of the oxygenated species [24].

Chapter 1: Context and motivation
11
Figure 3: Trends in oxygen reduction activity plotted as a function of the oxygen binding energy (left) and
as a function of both the O and the OH binding energy (right) [25].
Particle size effect
The ORR kinetics is sensitive to changes of Pt nanoparticles size. For example,
Kinoshita [26] reported that ORR specific activity (A/cm2Pt) decreases with decreasing
particle size (so called “negative size effect”), while mass activity (A/gPt) reaches the
maximum for particles with diameter of ca 3 - 4 nm. In contrast, HOR specific activity
increases with decreasing particle size (positive size effect) [19]. Such particle size effect can
be attributed to an increased amount of low-coordinated sites, which leads to the stronger
adsorption of oxygenated species on the surface of small Pt particles (1 - 5 nm) compared
with Pt bulk [24]. In particular in acid electrolytes, particle size effect on ORR plays
important role due to the strong adsorption of anions, such as phosphate and sulphate [27].
Butler-Volmer Equation
At low overpotential the reaction kinetics can be described by Butler-Volmer equation:
j = j0{exp(αAFη/RT)-exp(-αCFη/RT)}
where j is current density, j0 is the exchange current density, αA and αC are the anodic and
cathodic transfer coefficients (usually close to 0.5), F is the Faraday constant, η is the
overpotential, R is the gas constant and T is the temperature.
At higher overpotential one of the terms of the Butler-Volmer equation becomes much
smaller than the other one. Therefore, this equation can be simplified to the Tafel equation:
log j = log j0 + αFη/2.3RT
The plot of log j versus η is shown in Figure 4. The slope of this plot is known as the Tafel
slope. For ORR on platinum surface in acid medium, two linear regions are observed with the

Chapter 1: Context and motivation
12
slopes of 60 mV/dec at low overpotentials (Pt is covered by oxygenated species) and of 120
mV/dec at high overpotentials [21],[20].
j (A/cm2)
log j
η (V)
oxidationreduction
Slope = - αnF/2.3RT
η (V)
Figure 4: Current-potential curves and corresponding Tafel plots.
1.2.2 Polarisation curve
The plot of cell voltage versus current density is known as the polarisation curve
(Figure 5), which is one of the most important characteristics of the fuel cell performance.
The polarisation curve can be divided into three domains. In the low current density region
the cell voltage decreases with increasing current density due to activation overpotential. In
the middle and the high current density regions the potential decreases due to the ohmic
polarisation and mass-transport limitations, respectively [12]. Therefore, the cell voltage can
be written as follows:
Ecell = E0 – η activation – η ohmic – η concentration
where Ecell is the voltage for a certain operating condition, E0 is the theoretical cell voltage,
ηactivation is the overpotential, which corresponds to the activation at the cathode and anode,
ηohmic is the overpotential associated with the conduction of protons and electrons and
ηconcentration is the overpotential resulting from the decrease in concentration of the reacting
gases [21].
Current density (A/cm2)
Mass transport
region
Ohmic
region
Activation
region
Fu
el c
ell
volt
age
(V)
Figure 5: Ideal polarisation curve with losses and corresponding regions.
Chapter 1: Context and motivation
13
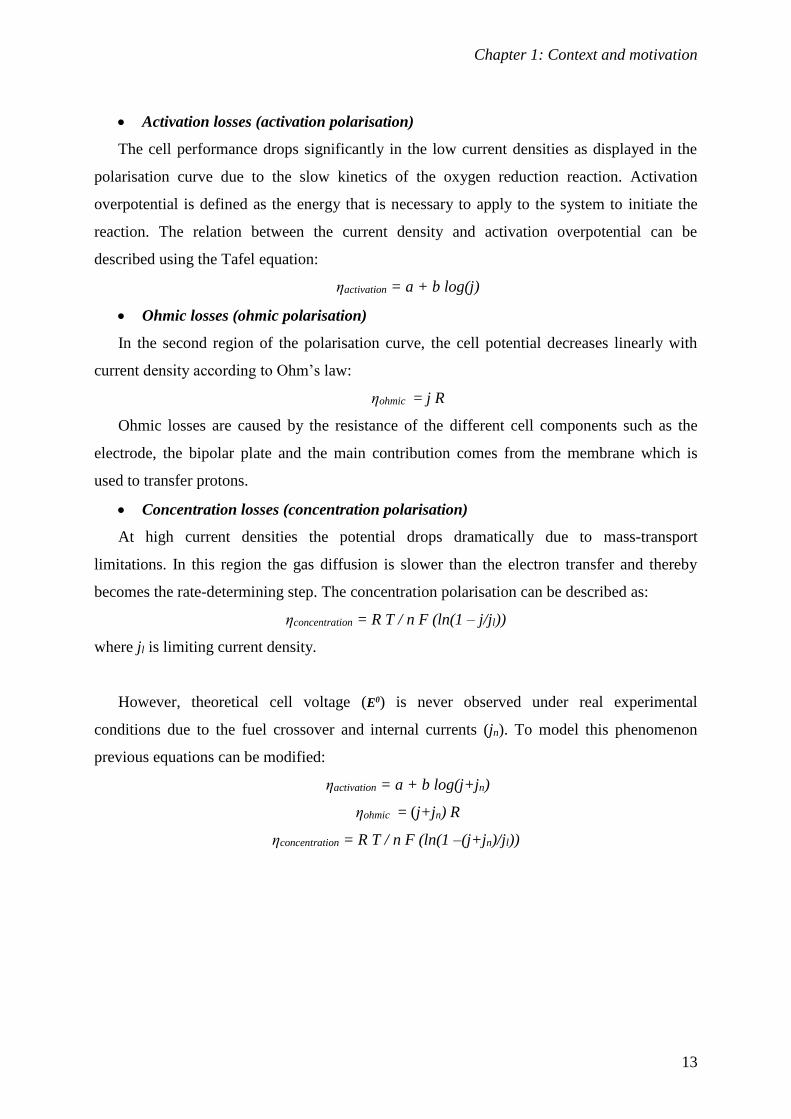
Activation losses (activation polarisation)
The cell performance drops significantly in the low current densities as displayed in the
polarisation curve due to the slow kinetics of the oxygen reduction reaction. Activation
overpotential is defined as the energy that is necessary to apply to the system to initiate the
reaction. The relation between the current density and activation overpotential can be
described using the Tafel equation:
ηactivation = a + b log(j)
Ohmic losses (ohmic polarisation)
In the second region of the polarisation curve, the cell potential decreases linearly with
current density according to Ohm’s law:
ηohmic = j R
Ohmic losses are caused by the resistance of the different cell components such as the
electrode, the bipolar plate and the main contribution comes from the membrane which is
used to transfer protons.
Concentration losses (concentration polarisation)
At high current densities the potential drops dramatically due to mass-transport
limitations. In this region the gas diffusion is slower than the electron transfer and thereby
becomes the rate-determining step. The concentration polarisation can be described as:
ηconcentration = R T / n F (ln(1 – j/jl))
where jl is limiting current density.
However, theoretical cell voltage (E0) is never observed under real experimental
conditions due to the fuel crossover and internal currents (jn). To model this phenomenon
previous equations can be modified:
ηactivation = a + b log(j+jn)
ηohmic = (j+jn) R
ηconcentration = R T / n F (ln(1 –(j+jn)/jl))

Chapter 1: Context and motivation
14
1.2.3 PEMFC components
The PEMFC consists of several components such as the membrane electrode assembly
(MEA), the gaskets, the bipolar plates and the current-collectors, as shown in Figure 6.
Membrane
Catalyst
Gas diffusion layer
Gasket
Bipolar plate
Interconnector
Membrane
Catalyst
Gas diffusion layer
Gasket
Bipolar plate
Interconnector
Figure 6: Schematic structure of PEMFC components in a stack.
Bipolar plates
Bipolar plates should provide electrical connection between the MEAs in the stack,
transport the fuel and oxidant uniformly via flow channels to the electrodes and remove the
water produced at the cathode side. Therefore, the requirements of bipolar plates include high
electrical and thermal conductivity, impermeability for gases, high chemical stability,
corrosion resistance, low weight and volume as well as low cost. Bipolar plates are usually
made of graphite or metals such as stainless steel, titanium and aluminium.
Membrane electrode assembly (MEA)
The MEA is the core of the fuel cell, which is composed by a membrane sandwiched
between two electrodes. There are two main methods to prepare MEA such as Catalyst
Coated Membrane (CCM) method, where the catalyst is directly applied onto the membrane,
and Catalyst Coated Substrate (CCS) method, in which the catalyst is applied on the Gas
diffusion layer (GDL). In order to solve the problem of membrane swelling during CCM
method, the Decal Transfer Method (DTM) can be used. In this method the catalyst ink is
applied on the temporary substrate, hot pressed onto the membrane and then the substrate is
peeled off. The components of the MEA are described in the following paragraph.

Chapter 1: Context and motivation
15
Polymer Electrolyte Membrane (PEM)
The main functions of PEM are transport of protons as well as separation of fuel and
oxidant. Thus, the PEM should posses the following properties [28],[29]:
High protonic conductivity to transport protons from the anode to the cathode due
to the presence of the fixed ionic groups under the influence of a potential
gradient. Low membrane thickness leads to improved proton conductivity.
However, thick membranes show better physical stability and lower fuel
crossover.
Impermeability to gases to separate hydrogen and oxygen (low crossover);
High chemical and mechanical stability under fuel cell conditions;
High electronic resistance;
Low cost and availability.
Nafion® produced by the DuPont Company is the most characterised and the most used
PFSA membrane for PEMFCs. It provides high protonic conductivity in the range from
0.1 mS/cm at 20 % relative humidity (RH) to 100 mS/cm at 100 % RH at 45 - 80 °C [12] as
well as high chemical and thermo-mechanical stability due to the combination of sulfonate
fixed ionic groups with the polytetrafluoroethylene (PTFE) backbone, as shown in Figure 7.
- ( CF2 – CF2 )x – ( CF2 – CF )y -
( O – CF2 – CF )m – O – ( CF2 )n – SO3H
CF3
Nafion® (m > 1, n = 2, x = 5 – 13.5, y = 1000)
Figure 7: Chemical structure of Nafion®.
The PFSA membranes need to be hydrated in order to conduct the protons. Therefore,
Nafion®-based membranes are not able to work at temperatures above 100 °C, unless the fuel
cell is pressurised. However, high operating temperatures are desirable to improve ORR
kinetics, water management and tolerance of the platinum electrocatalyst toward CO
poisoning. In addition, slow kinetics of alcohol oxidation in DAFC may also be improved at
high temperature.
High-temperature membranes
In order to improve water-retaining capacity of PFSA and increase its operation
temperatures, hydroscopic particles such as oxides and zirconium phosphate can be embedded

Chapter 1: Context and motivation
16
in the polymer matrix [30]. Another strategy is to replace water with low volatile solvents
using polymer with basic groups that can adsorb acid. For example, polybenzimidazole (PBI)
membrane developed by Savinell et al. [31] is a promising candidate for high temperature
PEMFC (HT-PEMFC) that can adsorb acid via acid-base interaction. Such phosphoric acid
doped PBI membrane provides high conductivity of >0.04 S/cm at 190 °C at 10 % RH as well
as good mechanic properties and thermal stability. Highly acid doped PBI membranes under
development in the laboratory at ICGM-AIME provide conductivity >150 mS/cm at 140 °C.
The proton transfer occurs via a Grotthuss (hopping) mechanism in anhydrous conditions and
depends on acid doping level. However, phosphate anion strongly adsorbs on the Pt surface
leading to the slow kinetics of ORR. Another disadvantages of this system are phosphoric
acid leaching and oligomerisation of phosphoric acid which results in decrease of proton
conductivity [32]. Finally, carbon corrosion rate increases with the temperature. Thus, more
durable alternative catalyst support materials should be developed.
Electrodes
Electrodes are composed of catalyst layer and gas diffusion layer (GDL), as shown in
Figure 8.
Catalyst layer GDL
Pt Carbon Nafion
Figure 8: Schematic structure of the PEMFC electrode.
a. Gas diffusion layer (GDL)
The gas diffusion layer is placed between the catalyst layer and the bipolar plate. The
main functions of GDL are gas distribution, current and heat conduction, as well as water
removal [12]. Therefore, the requirements for a GDL are:
High porosity to transport reactants and to remove water;
High electronic and thermal conductivity;
Good mechanical strength.
There are two layers within the GDL, a thin microporous and a thick macroporous layer
(diffusion layer), as shown in Figure 9. Microporous layer consists of carbon black powder or
graphite particles mixed with a hydrophobic binder (usually PTFE). It possesses a pore size

Chapter 1: Context and motivation
17
between 100 and 500 nm and suitable hydrophobicity to remove water [33]. Furthermore, it
provides electrical contact between catalyst and macroporous layer of GDL. Macroporous
layer consists of carbon fibres in the form of paper or cloth and have a pore size between 10
and 30 µm [34]. Polyacrylonitrile (PAN) and heavy fractions of petroleum or coal (pitch-
precursor-carbon) are mainly used as the precursors for carbon fibres.
Catalyst layer
10 – 50 µm
Micro-porous layer
Carbon powder and hydrophobic agent
10 – 100 µm
Macro-porous carbon paper or cloth
300 – 400 µm
Bipolar plate with flow channels
Gas Diffusion layer
Catalyst layer
10 – 50 µm
Micro-porous layer
Carbon powder and hydrophobic agent
10 – 100 µm
Macro-porous carbon paper or cloth
300 – 400 µm
Bipolar plate with flow channels
Gas Diffusion layer
Figure 9: Schematic structure of PEMFC electrode [21].
b. Catalyst layer (CL)
CL is composed of catalyst (e.g. platinum) nanoparticles on carbon black support mixed
with PFSA ionomer and PTFE, which provides hydrophobicity leading to improved water
management. Good CL has to provide [28],[12]:
The three-phase boundary sites, where electrolyte, reactants and catalyst are in
contact, as shown in Figure 10 [35];
High active surface area per catalyst mass;
Hydrophobic pathways to transport reactants to the catalyst;
Hydrophilic pathways for efficient water removal;
High electronic conductivity.
Figure 10: Schematic diagram of a three-phase boundary [21].
The presence of the Nafion® ionomer in the catalyst layer provides a pathway for protons
transport and plays the role of a binder that holds the catalyst particles together. Improved
ionic conductivity of the CL results in the increased number of catalyst active sites and better
platinum utilisation. However, very high ionomer loading can hinder the gas transport to the
reactive sites and leads to the mass transport losses. Therefore, the optimisation of the

Chapter 1: Context and motivation
18
ionomer content in the CL is one of the main challenges for the catalyst layer design. The
optimum ionomer loading depends on the surface area and density of the support and should
be ca 30 wt. %, when carbon black, such as Vulcan, is used as a catalyst support [12].
Moreover, porosity and thickness of the catalyst layer also have to be optimised. On the
one hand high catalyst layer porosity leads to the increase of the mass transfer rates, but on
the other hand, it results in a decrease of electron and proton transport rates. Porosity is
usually in the range from 30 to 60 % for PEMFC electrodes. The thickness of the catalyst
layer may be reduced by using high Pt loadings. For example, catalyst layer with 10 µm
thickness for 0.4 mg/cm2 Pt loading can be prepared with 50 wt. % Pt/C electrocatalyst, which
allows to reduce ionic and mass-transfer resistance [12].
Pt is the state of the art catalyst for both HOR and ORR. The sluggish ORR kinetics can
be improved by using Pt alloys. In particular, so-called Pt skin structure with a pure Pt atomic
layer on the surface of the alloys has shown high ORR activity [36]. For example, Pt3Ni1(111)
skin provided two orders of magnitude higher ORR activity compared with commercial
Pt/C [37],[38]. However, the main disadvantage of Pt-based catalysts is their high cost.
Therefore, non-precious metal catalysts have attracted great attention [39]. Already in 1964
Jasinski et al. [40] investigated activity of Co phthalocyanine as a fuel cell cathode catalyst.
Dodelet’s group has achieved high ORR activity increase by mixing carbon support with iron
and nitrogen precursors, followed by ball-milling and pyrolysis. Such Fe-based catalysts
contain Fe cations coordinated by pyridinic nitrogen (active sites) in the graphitic sheets
within the micropores [41]. Research is performed on non-noble metal catalysts in the
Laboratory.
Catalyst supports play an important role in the improvement of fuel cell performance and
durability. They are used in order to increase the surface area of catalyst per unit of mass as
well as to prevent the agglomeration of the catalyst nanoparticles. The catalyst support should
possess the following properties:
High electronic conductivity;
High surface area to enhance catalyst dispersion;
High amount of mesopores to provide an accessibility of the reactants to the catalytic
sites and removal of the water;
High stability in acidic environment and at high potentials under fuel cell operation.
Performance, durability and cost of CL are main aspects to be considered for the
commercialisation of PEMFC. According to the United States Department of Energy (DOE)

Chapter 1: Context and motivation
19
2017 targets, the MEA with platinum group metals loading of 0.125 mg/cm2 should provide
power densities of 8.0 kW/gPt [17]. Furthermore, electrocatalyst has to maintain 90 % of its
initial performance after 5000 h of operation [42].
1.2.4 Degradation of MEA components
One of the fundamental drawbacks of PEMFC is its poor durability overtime. Therefore, it
is important to understand the mechanisms of catalyst and membrane degradation in order to
improve their stability.
1.2.4.1 PEM degradation
The PEM degradation can be physical (cracks and creep) or chemical due to peroxide radical
formation during PEMFC operation. Operating conditions, such as relative humidity (RH),
temperature, cell voltage and current density have a great influence on both types of
degradation. In particular, fast degradation occurs under open circuit voltage (OCV)
conditions.
Chemical degradation
According to the LaConti mechanism, oxygen crossover through the membrane to the
anode results in H2O2 formation [43]:
H2 + Pt → Pt-H (anode)
Pt-H + O2 (diffused through PEM to anode) → •OOH
•OOH + Pt-H → H2O2
Hydrogen peroxide formation is accelerated at the anode side at potentials below 0.2 V,
where the hydrogen adsorption occurs on the Pt surface [44]. The presence of impurities such
as Fe2+ and Cu2+ enhances the membrane degradation [45],[46] due to the formation of
hydroxyl and hydroperoxyl radicals in the reaction with H2O2 (Fenton reaction):
Fe2+ + H2O2 → Fe3+ + •OH + OH−
•OH + H2O2 → + •OOH + H2O
Furthermore, at high potential Pt nanoparticles dissolution from the cathode and re-
precipitate in the membrane takes place [47]. Such Pt ions can generate free radicals inside
the membrane [48]. Formed radicals tend to attack the end groups of the polymer, which
results in fast polymer decomposition leading to the thinning of the membrane and loss of
fluorine [49]:
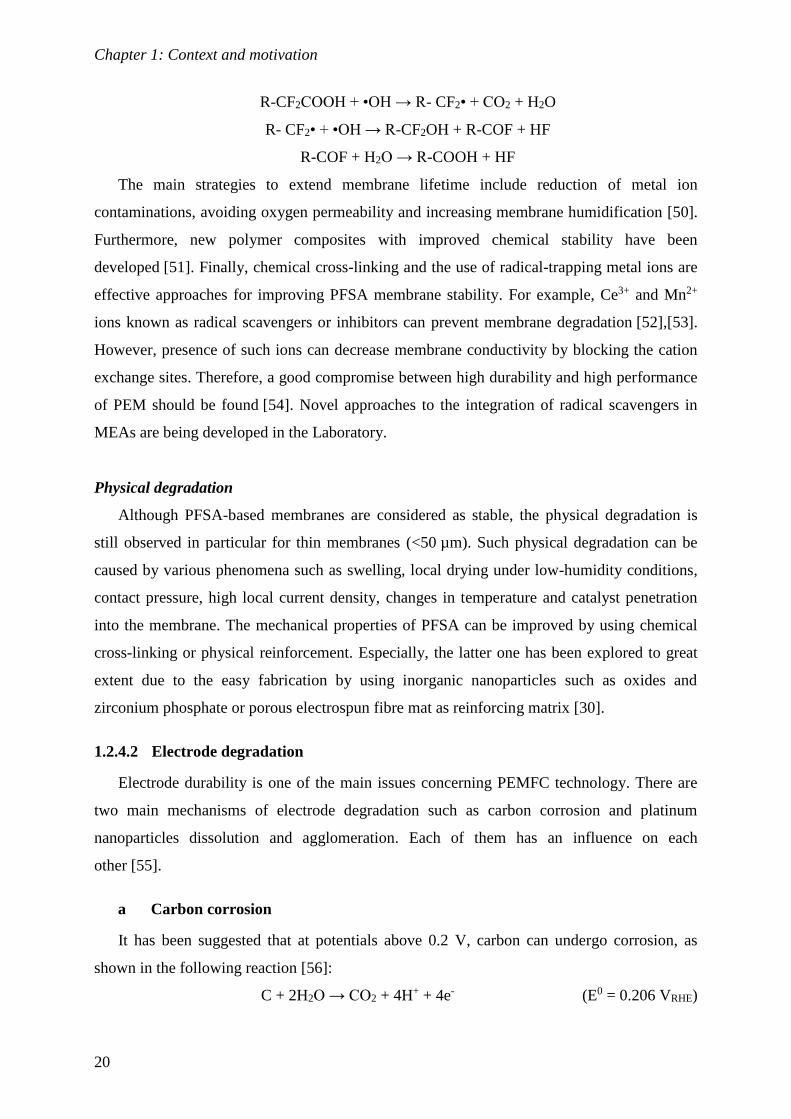
Chapter 1: Context and motivation
20
R-CF2COOH + •OH → R- CF2• + CO2 + H2O
R- CF2• + •OH → R-CF2OH + R-COF + HF
R-COF + H2O → R-COOH + HF
The main strategies to extend membrane lifetime include reduction of metal ion
contaminations, avoiding oxygen permeability and increasing membrane humidification [50].
Furthermore, new polymer composites with improved chemical stability have been
developed [51]. Finally, chemical cross-linking and the use of radical-trapping metal ions are
effective approaches for improving PFSA membrane stability. For example, Ce3+ and Mn2+
ions known as radical scavengers or inhibitors can prevent membrane degradation [52],[53].
However, presence of such ions can decrease membrane conductivity by blocking the cation
exchange sites. Therefore, a good compromise between high durability and high performance
of PEM should be found [54]. Novel approaches to the integration of radical scavengers in
MEAs are being developed in the Laboratory.
Physical degradation
Although PFSA-based membranes are considered as stable, the physical degradation is
still observed in particular for thin membranes (<50 µm). Such physical degradation can be
caused by various phenomena such as swelling, local drying under low-humidity conditions,
contact pressure, high local current density, changes in temperature and catalyst penetration
into the membrane. The mechanical properties of PFSA can be improved by using chemical
cross-linking or physical reinforcement. Especially, the latter one has been explored to great
extent due to the easy fabrication by using inorganic nanoparticles such as oxides and
zirconium phosphate or porous electrospun fibre mat as reinforcing matrix [30].
1.2.4.2 Electrode degradation
Electrode durability is one of the main issues concerning PEMFC technology. There are
two main mechanisms of electrode degradation such as carbon corrosion and platinum
nanoparticles dissolution and agglomeration. Each of them has an influence on each
other [55].
a Carbon corrosion
It has been suggested that at potentials above 0.2 V, carbon can undergo corrosion, as
shown in the following reaction [56]:
C + 2H2O → CO2 + 4H+ + 4e- (E0 = 0.206 VRHE)

Chapter 1: Context and motivation
21
However, at potentials encountered in normal PEMFC operation (0.6 – 0.9 VRHE) kinetics
of carbon corrosion is slow. It is generally accepted that elevated potentials greater than
1.2 VRHE lead to the corrosion of carbon at a significantly high reaction rate.
Different factors influence the kinetics of carbon corrosion:
Structure of the carbon particles. Carbon black composed of an amorphous
core and graphitic surface are generally less stable compared to graphitised carbon.
Presence of Pt accelerates formation of highly reactive OH and OOH radicals,
which can attack carbon surface [57].
Carbon functionalisation with various groups such as phenols, carbonyls,
carboxylic acids, ethers, quinones, and lactones, might play the role of protective layer.
However, the presence of water results in further oxidation of the surface oxide layer to
CO2 [58]:
R-C-H → R-C-OH → R-C=O → R-COOH → R-H + CO2
Carbon functionalisation leads to an increase in the hydrophilicity of the catalyst layer,
which results in flooding and mass-transport overpotentials.
Some PEMFC operating conditions such as start-up and shutdown lead to local
fuel starvation, when H2 and O2 are coexisting in the anode side. Thus, oxygen reduction
occurs at the anode side. Protons for this reaction can be obtained from carbon oxidation or
oxygen evolution reaction at the cathode side, as shown in Figure 11. Consequently, a reverse
current is established, which forces the cathode to very high potentials up to 1.44 V leading to
carbon corrosion in a short period of time [59]. Therefore, local hydrogen starvation is one of
the main reasons for catalyst layer degradation on the cathode side.
H+ H+
HOR: H2 2H+ + 2e-
ORR: O2 + 4H+ + 4e- H2O
ORR: O2 + 4H+ + 4e- H2Oe-
e-OER: H2O O2 + 4H+ + 4e-
Carbon corrosion: C + H2O 4H+ + 4e- + CO2
Anode
Cathode
H+ H+
HOR: H2 2H+ + 2e-
ORR: O2 + 4H+ + 4e- H2O
ORR: O2 + 4H+ + 4e- H2Oe-
e-OER: H2O O2 + 4H+ + 4e-
Carbon corrosion: C + H2O 4H+ + 4e- + CO2
Anode
Cathode
Figure 11: A schematic illustration of electrode reactions occurring during start/stop conditions [56].

Chapter 1: Context and motivation
22
Maas et al. [60] and Mathias et al. [61] reported that carbon degradation depends on
potential, temperature and humidity. The mechanism of carbon corrosion consists of the
following steps [62]:
oxidation of the carbon lattice, C → C+ + e-
hydrolysis, C + 1/2H2O → CO + H+ (E0 = 0.518 VRHE)
carbon dioxide formation, CO + H2O → CO2(g) + 2H+ + 2e− (E0 = -0.103 VRHE)
Carbon corrosion results in detachment of catalyst nanoparticles and thinning of cathode
catalyst layer leading to PEMFC performance losses.
b Platinum dissolution and agglomeration
The Pourbaix diagram shown in Figure 12 presents stability region for Pt, PtO, PtO2 and
PtO3 as a function of electrolyte pH and electrode potential at 25 °C [63]. Pt is
thermodynamically unstable at pH lower than 0 and potential higher than 1.0 VRHE.
Furthermore, Pt dissolution increases with the increasing potential and temperature.
-2 -1 0 1 2 3 4 5 6 7 8 9 10 11 12
pH
2
1.6
1.2
0.8
0.4
0
-0.4
-0.8
-1.2
Pote
nti
al (
V)
3
PtO2
PtO3
Pt
2
1
Pt(OH)2
4
6
5Pt2+
Figure 12: Regions of stability for platinum vs potential and pH at 25 °C and the corresponding reactions:
1. Pt + 2H2O → Pt(OH)2 + 2H+ +2e-;
2. Pt(HO)2 → PtO2 + 2H+ +2e−;
3. PtO2 + H2O → PtO3 + 2H+ +2e−;
4. Pt2+ + 2H2O → Pt(OH)2 + 2H+;
5. Pt → Pt2+ + 2e−;
6. Pt2+ + 2H2O → PtO2 + 4H+ 2e-.

Chapter 1: Context and motivation
23
Darling and Meyers described a three-step model, which explains the oxidation and
dissolution of platinum in a PEMFC [64],[65]:
Platinum dissolution: Pt → Pt2+ + 2e−;
Platinum oxide formation: Pt + H2O → PtO + 2H+ +2e−;
Platinum oxide dissolution: PtO + 2H+ → Pt2+ + H2O.
Whereas Shao-Horn et al. proposed four mechanisms explaining the decrease of
electrochemical surface area (ECSA) especially after potential cycling operations [66]:
Ostwald ripening involves Pt dissolution from small size particles and re-
deposition (reduction) onto large particles, which results in the growth of larger particles at
the expense of small ones [67].
Pt crystal migration and coalescence on the carbon support without Pt
dissolution by thermal motion (sintering).
Dissolution and re-precipitation of Pt single crystals in the membrane
involves the dissolution of Pt in the first step followed by migration into the membrane and
finally deposition of Pt metal in a reducing atmosphere. This leads to Pt loss from the catalyst
layer. Platinum band is usually observed in aged MEA [68].
Detachment of Pt nanoparticles occurs due to carbon corrosion. Such
isolated Pt particles are not able to participate in the electrochemical reactions.
Poisoning of the Pt surface with contaminates from the fuel and the air (such as CH4, CO,
CO2, H2S, NH3, NO, NO2, SO2, SO3, and O3) also leads to the loss of catalyst activity and fuel
cell performance. For example, adsorbed CO blocks the access of H2 to the Pt catalytic active
sites and thereby decreases the activity of the catalyst [69].

Chapter 1: Context and motivation
24
2 State of the art for PEMFC electrocatalyst supports
2.1 Carbon-based catalyst supports
The properties of catalyst support play important role for PEMFC performance and
durability. For example, electrode thickness, catalyst activity and stability can be influenced
by the choice of the support. Therefore, various carbon-based materials such as carbon blacks,
mesoporous carbon, carbon nanofibres and nanotubes were developed.
2.1.1 Carbon blacks
Carbon blacks are conventionally used as catalyst support due to their high electrical
(>1 S/cm) and thermal conductivity, high surface area (1500 m2/g for Black Pearls) and the
ability to form porous CL. They are cheap and available in large quantities. Carbon blacks
consist of porous particles of around 20 - 50 nm in diameter. Two main types of carbon blacks
are usually used in PEMFC [28]:
furnace blacks (e.g., Vulcan XC-72R with surface area of ca 230 m2/g) made by
pyrolysis from heavy oils;
extra conductive blacks (e.g. Ketjen Black with surface area of ca 800 m2/g), a by-
product of heavy oil cracking.
Carbon blacks with a hydrophobic agent (PTFE) are also used as the microporous layer in
the GDL. However, the electrochemical and thermal stability of these materials need to be
improved. Especially, amorphous core of carbon particles is susceptible to corrosion. Other
disadvantages of the carbon black are microporous structure and impurities formed during
synthesis.
2.1.2 Mesoporous carbon
Mesoporous carbon [70],[71] can be divided into ordered (OMC) with regular pore
structure and disordered (DOMC) carbon. Both provide high surface area with pore size
between 2 and 50 nm. OMCs are usually prepared by using mesoporous templates.
Yu et al. [72] investigated the effect of the catalyst support pore size on DMFC performance.
They demonstrated that mesoporous carbon with a pore diameter of 25 nm showed the highest
performance due to its high surface area and large pore volume. In comparison with
Vulcan XC-72R, mesoporous carbons possess less micropores and deep cracks, which hinder
triple-phase boundary formation. Thus, high surface area and interconnected mesopores
system can facilitate the transport of reactants and products. However, the cost of mesoporous
carbon is much higher than that of conventional carbon blacks.

Chapter 1: Context and motivation
25
The durability of both carbon blacks and mesoporous carbons needs to be improved.
Therefore, graphitised carbons were developed. For example, Shao et al. obtained a highly
graphitised mesoporous carbon (GMPC) supported Pt, which exhibited an improved activity
and durability compared to the commercial Pt/C [73].
2.1.3 Graphitised and nitrogen doped carbons
Graphitised carbons can be obtained by heat-treatment at high temperatures. High
graphitic content leads to stronger delocalised π-bond (sp2-hybridised carbon) on the carbon
surface, which are important for the strong metal–support interaction (SMSI) [74]. Moreover,
graphitisation enhances stability and conductivity of the carbon, but decreases its surface area.
As a consequence, catalyst nanoparticles dispersion is usually reduced. Furthermore,
graphitisation does not eliminate corrosion completely; it only slows down the reaction
kinetics.
Nitrogen-doped carbons as support showed enhanced catalytic activity and durability
towards oxygen reduction and methanol oxidation due to a better interaction between Pt
nanoparticles and the support [75].
a. Carbon nanotubes (CNTs)
Since the first reports of CNTs in 1991 by Iijima et al. [76], they have attracted huge
interest in the field of nanotechnology. CNTs are also used as catalyst support for
PEMFC [77],[78]. They consist of graphene sheets rolled into a cylinder. There are two types
of CNTs, namely, single-wall (SWCNTs) and multi-wall (MWCNTs) with diameter of ca 10-
50 nm, as shown in Figure 13.
Figure 13: A: Schematic illustrations of the structures of (a) armchair, (b) zigzag, and (c) chiral SWCNTs.
B: Structure of a MWCNT [79].

Chapter 1: Context and motivation
26
There are three main synthesis methods of CNTs namely arc discharge, laser ablation and
chemical vapour deposition (CVD) via catalytic deposition of carbon precursors [79]. CVD
method allows control of morphology of the CNTs and their orientation on the substrate.
CNTs provide many advantages such as high electrical conductivity, high corrosion
resistance [80], high surface area (200 – 400 m2/g for MWCNTs and 400 – 900 m2/g for
SWCNTs) and strong interaction with the Pt nanoparticles (due to the delocalised π electrons
of CNTs), resulting in increased catalytic activity of the Pt supported on CNTs. Moreover,
CNTs possess improved mesoporosity, fewer organosulfur impurities (poisoning for Pt) as
well as higher mechanical and thermal stability compared to carbon blacks [81]. Unlike
carbon blacks, CNTs are free from deep cracks, which can be the cause of catalyst activity
losses [82],[83]. However, CNTs are chemically inert thus making it difficult to deposit Pt
nanoparticles. Functionalisation of the CNTs with strong acids (HNO3 and H2SO4) introduces
surface groups such as hydroxyl and carboxyl acid groups, which can improve the dispersion
of catalyst nanoparticles. Nevertheless, CNTs supported catalysts have received great
attention due to their enhanced activity and durability [84],[85],[86]. Saha and co-workers
[87] developed MWCNTs grown on a carbon paper supported Pt nanoparticles. Such
electrodes have provided higher single-cell performance in a H2/O2 fuel cell than Pt/C-based
electrodes. However, the high cost of production and the risk for the health [88] have hindered
the commercialisation of CNTs.
b. Graphite-based carbon nanofibres (CNF)
Graphitised CNFs are cyclindric nanostructures with high aspect ratio, which consist of
graphene sheets. There are three main types of CNFs namely stacked platelet (graphene layer
perpendicular to the growth axis), tubular (graphene layer parallel to the growth axis) or
fishbone type (with an angel of 45° to the growth axis), as shown in Figure 14 [78].
Figure 14: Schematic representation of three types of CNFs [79].

Chapter 1: Context and motivation
27
The diameter of CNFs is much higher than that of CNTs and can reach up to 500 nm.
CNF are usually produced by CVD or by electrospinning of polymer solutions (see
Paragraph 3) followed by a thermal-treatment [89]. As CNTs, CNFs are promising catalyst
supports for PEMFC due to their high electrical conductivity, high corrosion resistance and
strong interaction between catalyst and support [90]. In addition, they provide crystalline
structure and high conductivity at a lower cost compared with CNTs [91].
CNFs supported catalysts have received great attention in particular for DMFC. For
instance, Bessel et al. [92] demonstrated that platinum supported on “platelet” and “ribbon”
type graphite showed improved performance for methanol oxidation compared to Vulcan
XC-72R. Park et al. [93] also reported that a graphite carbon nanofibres (G-CNFs) supported
PtRu catalysts showed higher catalytic activity towards methanol oxidation than the Vulcan
XC-72R supported catalyst due to the strong interactions between the metal particles and the
G-CNFs. Furthermore, Knupp et al. [94] observed that the electrochemical surface area
(ECSA) of Pt/CNFs (64.8 m2/g) was higher than that of commercial Pt/C catalyst (50.6 m2/g).
Li et al. [95] deposited Pt nanoparticles of 2 - 4 nm on stacked-cup carbon nanofibres
(SC-CNFs obtained by CVD) via a modified ethylene glycol method. The Pt/SC-CNFs-based
MEA demonstrates higher Pt utilisation than carbon black-based MEA due to the formation of
continuous conductive networks in the ionomer matrix.
2.1.4 Conductive diamonds
Diamond is a promising catalyst support for PEMFC owing to its very wide potential
window, mechanical stability and corrosion resistance under oxidative conditions. Electrical
conductivity of non-conducting diamond can be improved by using p-type (boron) or n-type
(nitrogen) doping. For instance, boron doped diamond (BDD) developed by Wang and Swain,
exhibit no activity loss even after 2000 potential cycles [96]. Generally, BDD possesses low
surface area, which should be improved in order to make this material more promising for
PEMFC applications [97],[82].
2.2 Alternative supports materials
Another approach to overcome the problem of support corrosion is replacement of carbon
by alternative materials. Thus, metal oxides, carbides, borides, nitrides and organic whiskers
have been developed in order to meet the durability targets for PEMFC [70],[98],[99].
Moreover, the presence of strong metal support interactions (SMSI) [100] can increase
ORR activity, stability, CO-tolerance of the catalyst and even enhance charge-transfer

Chapter 1: Context and motivation
28
properties [101]. For instance, a decrease in Pt 4f binding energy observed for Pt/TiO2/C
compared to Pt/C using XPS was attributed to increased electron density on the Pt surface
atoms, which can explain enhanced ORR activity of TiO2 supported Pt [102]. Also,
Pt/SnO2-C showed improved ORR activity, CO-tolerance and stability compared to Pt/C due
to SMSI [103].
2.2.1 Carbides
Metal carbides are very attractive support materials due to their stability in acidic
solutions at anodic potentials, unique resistance to poisons (carbon monoxide, hydrocarbons,
and hydrogen sulfides) and high electrical conductivity. Tungsten carbide is the most studied
among other carbides due to its high electrical conductivity and commercial availability.
Chhina et al. demonstrated that Pt supported on WC provides lower ORR activity, but higher
durability than conventional Pt/C catalyst [104],[105]. Bernard d’Arbigny et al. developed Pt
supported on hollow carbon microspheres with a tungsten carbide kernel, which demonstrated
high specific surface area, electrical conductivity and high ECSA retention after prolonged
cycles [106]. Furthermore, Nie et al. reported much higher ORR activity for Pt-WC/C than for
Pt/C [107]. However, thermodynamic instability in oxidative environments is one of the main
disadvantages of carbides [98].
2.2.2 Metal oxides
Conducting oxides are promising candidates that may replace commercial carbon in PEM
fuel cells due to their high electrochemical stability and SMSI, which could promote
electrocatalysis and favour the anchoring of catalyst nanoparticles in the oxide
surface [82],[108]. According to thermochemical calculations reported by Sasaki et al. [109],
Sn, Ti, Nb, Ta, W, and Sb are stable as oxides under PEMFC conditions such as 80 °C,
1.0 VSHE and pH = 0. This calculations are in agreement with the experimental data [110],
[111]. Furthermore, transition metal oxides (CeO2, SnO2 and TiO2) are known to accelerate
alcohol electrooxidation and enhance CO-tolerance of Pt [112], consequently, they are widely
used in DMFCs anodes [113]. Finally, oxides with good proton conductivity can improve
transfer of protons in the catalyst layer [114].
Pt supported on various oxides such as TiOx, SnOx, WOx, CeO2, MoOx, RuOx and Ta2O5
have been already explored as electrocatalyst for PEMFC and DMFC [98],[114]. For instance,
Pt immobilised in a tungsten oxide matrix exhibited enhanced activity of methanol oxidation

Chapter 1: Context and motivation
29
reaction [115],[116],[117]. In this paragraph, progress in development of titanium and tin
oxides is reviewed.
a. Titanium oxide as catalyst support
Titanium oxide is commonly applied in pigments, coatings and sunscreens [118]. Since
discovery of photocatalytic water splitting on TiO2 by Fujishina and Honda [119] in 1972,
TiO2 is widely explored for energy-related applications [120], such as photocatalysis,
dye-sensitised solar cells, Li-ion batteries, supercapacitors and fuel cells. Titania is very stable
under PEMFC conditions, non-toxic, cheap and available. All these advantages make titanium
oxide a promising support material, but its poor electrical conductivity (10-13 S/cm) has to be
improved. Indeed, TiO2 is a semiconductor with a band gap of 3.2 eV for anatase and of
3.0 eV for rutile. Its electrical conductivity can be increased by doping (with Nb, V, Ta and
Ru) or by reduction at high temperatures to form sub-stoichiometric oxides. For instance, Pt
supported on Ru doped TiO2 was investigated by Haas et al. [121] and Wang et al. [122].
Nb is the most used n-type dopant [123] due to the similarity of the ionic radius of Ti3+
(0.68 Å) and Nb5+ (0.7 Å) as well as the possibility of solid solution formation in a wide
concentration range [124]. The charge compensation for substitution of Ti4+ by Nb5+ can be
reached via the creation of one Ti4+ vacancy per four Nb atoms or via reduction of one Ti4+ to
Ti3+ per Nb atom [125].
Recently, Wang et al. prepared Pt [126] and PtPd [127] nanoparticles supported on 6 at. %
Nb doped TiO2. Such Pt-Pd alloy supported on Pd-composited Nb0.06Ti0.94O2 electrocatalyst
showed higher mass activity than Pt/C.
Another approach to create conductive oxide is the formation of sub-stoichiometric oxide
by heating TiO2 in the presences of H2 or with metallic titanium under an inert
atmosphere [128]:
nTiO2 + H2 → TinO2n−1 + H2O
1/2Ti+(n−1/2)TiO → TinO2n−1
Such titanium suboxides TinO2n−1 where 3 < n < 10 (Magneli phases) are commercially
available under the Ebonex® (Altraverde) trade name. In general, titanium suboxides exhibit
high conductivity (1000 S/cm for Ti4O7 at RT [82]), but low specific surface area [129],
which may lead to poor catalyst dispersion. Chen et al. [128] compared stability of different
conductive oxide supports such as Ebonex®, and Ti4O7 and Nb0.1Ti0.9O2. They all showed
high electrical conductivity, but poor surface area between 1 and 2 m2/g. Ebonex® and Ti4O7
microparticles could be thermally oxidised in air at temperature above 400 °C to non-

Chapter 1: Context and motivation
30
conductive TiO2, unlike Nb0.1Ti0.9O2, which was thermally and electrochemically stable.
Ioroi et al. [130] also prepared Ti4O7 microparticles, which were more oxidation-resistant than
Vulcan XC-72R. However, the mass activity of Pt/Ti4O7 was lower than that of conventional
Pt/C, what was attributed to low ECSA of Pt/Ti4O7. Recently, Ioroi et al. [131],[132],[133]
obtained Magneli phase TiOx with improved surface area of more than 20 m2/g using a pulsed
UV laser irradiation method. Pt supported on such nano-submicron TiOx particles provided
high ORR activity and retained their initial ECSA even after 10000 voltage cycles between
0.05 and 1.2 V vs RHE at 100 mV/s, while Pt/Vulcan XC-72R lost 30 – 50 % of its ECSA.
Ti-alloyed Pt/TiOx catalysts demonstrated higher specific activity than conventional
Pt/Vulcan XC-72R due to the formation of Pt-Ti alloy.
Both approaches Nb doping and high-temperature reduction can be applied in order to
enhance electrical conductivity. For example, Park et al. [134] developed Nb-TiO2
nanoparticles (reduced at 400 °C) supported Pt that showed better ORR activity than
commercial Pt/C, which was explained by SMSI. In contrast, Chhina et al. [135] obtained
Nb-TiO2 (reduced at 700 °C) supported Pt, which was less active, but more stable than Pt/C.
However, Nb-TiO2 (reduced at 700 °C) supported Pt obtained by Popov group [136] exhibited
improved conductivity, activity, as well as high durability. The properties of recently
developed TiOx supported catalyst are summarised in Table 2.
Titanium oxide nanotubes (TONT) are attractive catalyst supports due to their high
surface area and mesoporosity [137]. Wang et al. [138] and Macak et al. [139] reported that
TONT supported catalyst showed high methanol oxidation activity. Kang et al. developed
TONT supported PtNi [140] and PtCo [141] electrocatalysts. PtNi/TONT showed very poor
ORR activity (due to the OH adsorption), which was significantly improved after reduction in
H2 at 400 °C. Pt70Co30/TONT electrocatalyst showed much higher ORR activity compared to
Pt70Co30 on compact TiO2 films due to the high surface area, accessibility of the inner wall
and porous structure of the TONT. Recently, Zhang et al. [142] developed ternary
tin-palladium-platinum catalysts supported on hydrogenated TiO2 nanotube arrays [143].
Such electrocatalyst exhibits much higher activity and excellent longer-term
electrochemical durability compared to the commercial 20 % Pt/C.

Chapter 1: Context and motivation
31
Table 2: Properties of TiO2 as catalyst support for PEMFC.
Ref.
Electro-
catalyst
Synthesis
of the support
T, °C
gas
Sur-face
area,
m2/g
Conducti-
vity of the
support,
S/cm
ECSA,
m2/g
(Pt-NP
size)
ORR activity
or max
power
density
Catalyst was
more stable
than Pt/C after
the following
test
Park 2007
[134]
Pt/Nb-
TiOx
hydro-thermal 400
H2
- 0.1
-
(3 nm)
higher than
that for Pt/C
-
Chhina
2009
[135]
Pt/Nb-
TiOx
hydrolysis 700
H2
13 6.1 10-4 - lower than
that for Pt/C
60 h at 1.4 V
Huang 2009
[144]
Pt/TiO2 template-
assisted
- 250
- 13.8
(6.2 nm)
0.94 W/cm2 200 h at
1.2 V
Huang 2010
[136]
Pt/Nb-
TiOx
template-
assisted
700
H2
10 1.11 - 0.72 W/cm2 2500 cycles
(0 - 1.2 V)
Huang 2011
[145]
Pt/TiO2 template-
assisted
- 266
31.2
(5.1 nm)
2.3 mA/cm2 at
0.85 V
1.01 W/cm2
2500 cycles (0.6
-1.4 V)
Ioroi 2011
[132]
Pt/TiOx
pulsed UV
laser
irradiation
900
H2
- 10-3 (5-10 nm) - 10000 cycles
(1.0 -1.5 V)
Huang 2012
[146]
PtPd/
TiO2
template-
assisted
300
N2
186
1.47 10-6 (3-
5 nm)
3 mA/cm2 at
0.85 V
1.15 W/cm2
1500 cycles
(0.6 -1.4 V)
Bauer 2012
[149]
Pt/Nb-
TiO2
sPEEK
template
500
air
120
- 25
(5 nm)
3.9 A/gPt
at 0.9 V
1000 cycles
(0.05 -1.2 V)
Chevallier
2012
[150]
Pt/Nb-
TiO2
sPEEK
template
500
air
120 -150 1 10-4 30 5.3 A/gPt
at 0.9 V
1000 cycles
(0.05 -1.2 V)
Zhang 2013
[143]
NiPt/
TiO2
tubes
Electro-
chemical
anodic
oxidation
- 104 1.42 10-4 (30 nm)
0.557 W/cm2
600 cycles
(0 -1.2 V)
Wang 2012
[126]
Pt/Nb0.06-
Ti0.94O2
acid-catalysed
sol-gel
400
H2
63- 48 2 10-5 11 - 27 6-32 A/gPt
at 0.9 V
19 % mass
activity loss
1000 cycles
(0 -1.2 V)
Wang 2013
[127]
PtPd/
Nb0.06-
Ti0.94O2
acid-catalysed
sol-gel
700
H2
4.5 4.45 10-3 22.2 130
mA/mgPt
at 0.9 V
Mass activity
losses are 31 –
74 %
1000 cycles
(0 -1.2 V)
Siracusano
2013
[147]
Pt/TiOx
(amorph)
TiTaOx
(amorph)
TiTaOx
TiO2
TiTaOx
complexation
complexation
complexation
sulphite route
sulphite route
300 –
600
air
117.7
253
66
279
175
0.38 Ohm
cm2/mg
0.04
0.39
0.12
0.09
- Pt/TiTaOx
(Sulphite
route) showed
the best
PEMFC
performance
-
Stassi 2013
[148]
PtCo/Ta-
TiO2
sulphite route
400
O2
150 - 12.1
(2.9 nm)
lower
performance
than PtCo/C
Holding at
1.4 V for
150 min
Cerri 2013
[151]
Pt/Nb-
TiO2
physical vapor
deposition
(PVD)
450 –
600
O2
- ~0.1 Ohm
cm
(2 nm) Pt/6.1% Nb-
TiO2 has the
best ORR
activity
-

Chapter 1: Context and motivation
32
Popov et al. developed a high surface area (186 - 266 m2/g) mesoporous TiO2 (calcined at
300 °C) supported catalyst [144],[145],[146] that showed high ORR activity as well as high
electrochemical stability. However, large catalyst loading (~60 wt. %) and ultrathin catalyst
layer (~ 1 µm) were used to overcome the problem of low support conductivity. Recently,
Arico et al. investigated Pt [147] and PtCo [148] supported on Ta doped TiO2. Such
PtCo/oxide showed a lower ECSA and larger ohmic resistance, but higher durability
compared to Pt3Co1/C.
High surface amorphous titania calcined at low temperature is usually non-conductive, but
it can provide high catalyst dispersion even at large metal loadings, which are required to
improve the resistance of the catalyst layer. However, amorphous titania showed low stability
in strong acidic environment [143]. In contrast, sub-oxides are highly conductive, but
generally they have poor surface area. Doped TiO2 is usually more stable than sub-oxide.
Consequently doping is preferred. Synthesis of highly conductive Ti oxide with large surface
area and mesoporous structure is still a challenge. Therefore, a compromise between
conductivity, surface area, crystalline properties and stability needs to be found.
b. Tin oxide as catalyst support
Tin oxide is widely used in solar cells, microelectronics, displays, gas sensors, oxidation
catalyst and transparent conductor [152]. Table 3 summarises the properties of SnO2 and
Pt/SnO2. As shown in the last column of the Table 3, SnO2 as support can withstand high
cyclability under high applied potential. Tseung and Dhara were the first to investigate the
activity of Pt supported on tin oxide for the reduction of oxygen. They demonstrated that the
doped electrocatalyst was more stable than Pt black at 150 °C in 85% H3PO4 [153]. Watanabe
et al. also developed conductive tin oxide supported Pt for ORR [154]. Enhanced oxygen
reduction activity on tin oxide supported Au was attributed to the metal support interactions
[155]. Recently, Pt supported on high surface area mesoporous tin oxide demonstrated good
activity for ORR and better stability in cycling test than commercial Pt/C catalyst [156].
Adsorption of OH species on SnO2 promotes the oxidation of CO and alcohols on the Pt
surface and thus leads to enhanced tolerance of the catalyst towards CO poisoning. Therefore,
SnO2 supported catalysts were successfully used for formic acid [157], methanol and ethanol
oxidation reactions (MOR and EOR) [158],[159],[160]. Okanishi et al. demonstrated that the
degradation of Pt/SnO2 with 100 ppm CO was much smaller than that of Pt/C due to the
strong interactions between Pt and SnO2 [161].

Chapter 1: Context and motivation
33
Tin oxide is an n-type semiconductor with rutile structure and band gap of 3.6 eV. Its
electrical resistivity varies in the range from 10 to 106 Ω cm, depending on the oxide
stoichiometry. However, electrical conductivity of SnO2 can be improved by using either
a donor (Sb5+, Nb5+) or acceptor (Al3+) doping [110]. For example, electrical conductivity of
SnO2 was increased dramatically by doping it with Sb [162]. Pt supported on Sb doped SnO2
(Pt/ATO) showed not only higher activities for MOR and EOR, but also higher stability than
commercial Pt/C [163]. Furthermore, Pt/ATO electrocatalyst showed improved activity for
the ORR in comparison to Pt black [164]. Recently, Yin et al. [165] also synthesised ATO
support with improved electrical conductivity (1.13 S/cm at 130 °C). Pt on such ATO/carbon
composite support showed enhanced ORR activity and durability, which was attributed to
modified electronic structure of Pt by the ATO. Ru-SnO2 supported Pt possesses good
catalytic activity towards MOR as well as improved durability [166],[167]. However,
Elezovic et al. [168] recently demonstrated that Pt/Ru-SnO2 was less stable than Pt/Sb-SnO2.
Takasaki et al. [110] showed that Nb doping leads to an improvement in the electronic
conductivity and specific surface area of tin oxide. Pt supported on such Nb doped tin oxide
demonstrated excellent stability towards potential cycling. Recently, the same group
developed Nb doped SnO2 cathode using pulse laser deposition in order to reduce contact
resistance between the particles of SnO2. Such Sn0.98Nb0.02O2 supported Pt electrocatalyst
provided improved PEMFC performance while keeping the high durability [169].
One-dimensional structures (high-aspect-ratio supports) such as nanofibres and nanotubes
are known to have unique electrical properties and high specific surface area [78]. Saha et al.
developed catalyst supported on SnO2 nanowires grown directly on the carbon paper by
a thermal evaporation method, which exhibited higher activity for ORR and MOR than
a commercial Pt/C [170],[171]. Authors attributed such high activity mainly to the unique 3D
structure of the nanowires support and strong interaction between Pt and SnO2.
Recently, Dou et al. reported that Pt supported on SnO2 nanoclusters demonstrated
comparable performance to Pt/C as anode electrocatalyst, but exhibited superior
stability [172]. Zhang et al. [156] obtained Pt supported on high surface area mesoporous tin
oxide (205 m2/g), which demonstrated good activity for ORR and better stability towards
potential cycling than commercial Pt/C catalyst. Gurrola et al. [173] obtained mesoropous
ATO with the highest until now reported surface area of 217 m2/g. Such ATO supported Pt
electrocatalyst showed significant stability compared with Pt/Vulcan XC-72R.
Sasaki et al. [174] reported that Pt/SnO2 shows the best performance in terms of both

Chapter 1: Context and motivation
34
electrochemical activity, and stability compared to Pt supported on MoO3, SnO2, Nb2O5,
Ta2O5, TiO2, and WO3.
All these advantages demonstrate that SnO2 can be a promising candidate that might
replace commercial carbon in PEMFCs due to its high electrochemical stability, reasonable
electronic conductivity and metal support interactions that could promote
electrocatalysis [161].
Table 3: Properties of SnO2 as catalyst support for PEMFC.
Ref. Pt on
tin oxide
Synthesis T, °C Conducti
vity,
S/cm
Surface
area,
m2/g
ORR activity
or PEMFC
performance
Catalyst was
more stable than
Pt/C after
Saha 2007
[170]
SnO2 nano-
wires
Thermal
evaporation
method
- - -
high -
Lee 2008
[163]
Sb-SnO2 Hydrolysis 400 - 99.7 Methanol oxidation 1000 cycles
(0.05-1.2V)
Masao 2009
[175]
SnO2
Co-precipitation
600
-
less than
20
lower than for Pt/C
10000 cycles
(0.6 -1.3 V)
Takasaki
2009
[176]
SnO2
NbSnO2
AlSnO2
Co-precipitation
600
-
less than
30
lower than for Pt/C
10000 cycles
0.9 V (30 s) -1.3
V (30 s)
Zhang 2010
[156]
SnO2
Neutral
surfactant
template-
assisted method
400
-
205
13 A/g at 0.85 V
1600 cycles
(0-1.2 V)
Kakinuma
2011
[177]
Sb0.04-
Sn0.96O2-δ
Flame
combustion
method
- 1.2 125 1.2 mA/cm2
at 0.8 V
5000 cycles (0.9-
1.3V)
Takasaki
2011
[110]
SnO2
Nb-SnO2
Al-SnO2
Sb-SnO2
Co-precipitation
600
10-4
less than
50
lower than for Pt/C
60000 cycles
0.9 V (30 s) -1.3
V (30 s)
Higashi
2013
[169]
Nb0.04
Sn0.96O2
Pulse laser
deposition
- - - lower than for Pt/C 60000 cycles
(1.0-1.5V)
Dou 2013
[172]
SnO2
nano-cluster
Mesoporous
silica as a hard
template
700 - 128 anode catalyst 0 h at 1.6 V
Kakinuma
2013
[178]
Nb-SnO2-δ
Sb-SnO2-δ
Flame
combustion
method
800 1) 0.7
2) 40
1) 37
2) 33
1) 608 A/g at 0.85 V
2) 515 A/g at 0.85 V
105 cycles
0.9 V (30 s) -1.3
V (30 s)
Rabis 2013
[179]
SnO2 thin
films
Magnetron
sputtering
- - 3.5 43 μA/cm2Pt
at 0.9 V
-
Gurrola
2013 [173]
Sb-SnO2
Sol-gel 500 0.202 216.7 - 100 cycles
(0 – 1.7 V)
Elezovic
2013
[168]
Sb-SnO2
Ru-SnO2
Hydrazine
reduction
method
400 - 1) 115
2) 141
1) 94 mA/mg
2) 107 mA/mg
at 0.85 V
Pt/Sb-SnO2 is
more stable than
Pt/Ru-SnO2
Yin 2014
[165]
Sb-SnO2
(ATO)
Hydrolysis 600 0.09 –
0.83
21 – 57
Pt/C-ATO showed
lower activity than
Pt/C
3000 cycles
(0.35 -0.85 V)

Chapter 1: Context and motivation
35
2.2.3 Nonconductive whiskers
Debe et al. from 3M [180],[181] developed nanostructured thin-films (NSTF), which
consist of oriented nonconductive crystalline whiskers obtained by thermal sublimation and
annealing of a perylene red organic pigment. These organic whiskers are insoluble in strong
acids, chemically and thermally very stable. The thickness of the NSTF can be controlled by
changing the length of the whiskers. Such NSTF was sputter-coated by continues Pt layer,
which ensures electron transport. Ultrathin electrode layer (10 - 30 times thinner than
conventional Pt/C electrode layer) provides lower ionic resistivity even without additional
ionomer as well as better access to all Pt surface area. Unlike conventional electrodes,
Pt-coated whiskers showed 100 % catalyst utilisation with a reduction in the mass-transport
losses at high current densities. Also, such catalyst exhibits much higher stability than Pt/C
catalyst towards potential cycling under fuel cell conditions. Recently, PtNi alloy supported
NSTF electrocatalyst showed extremely high ORR activities [182],[183].

Chapter 1: Context and motivation
36
3 The electrospinning technique
3.1 Introduction and principle
In the last few decades, one-dimensional structures attracted great interest due to their
unusual electrical, optical, catalytic and mechanical properties. There are several methods for
the fabrication of fibres and tubes such as chemical vapour deposition (CVD), hard and soft
templating, hydrothermal, microwave-assisted routes and others [184]. However, they usually
require strict synthesis conditions and multi-step procedures.
Electrospinning is a facile method that allows obtaining various materials such as organic,
ceramic, hybrid and even metallic fibres, as well as different morphologies such as hollow
fibres, core-shell structures and multichannel tubes [185],[186]. Furthermore, it allows
preparation of extremely long 1D structures with uniform diameters ranging from tens of
nanometres to several micrometres.
In 1902 and 1903 the spraying of liquid by using electrical charges was patented by
Cooley and Moore [187]. In 1914 Zeleny observed the spinning behaviour of conducting
polymer solution in an electric field [188]. In 1934 Formhals wrote the first patent about
electrospinning and its set-up [189]. This method did not receive much attention until the
1990s, when Doshi et al. and other researchers demonstrated that various organic polymers
can be electrospun into fibres [190]. Since then, the amount of publications about
electrospinning increased dramatically up to 3699 publications in 2013 (from SciFinder).
Electrospinning system consists of a source of high voltage, a grounded collector (usually
aluminum plate or rotating drum) a pump and a spinneret (a needle), as shown in Figure 15.
Electrospinning setup is usually placed in a closed box in order to control the humidity. The
syringe is filled with the polymer solution or the melt. When a high voltage is applied to
a drop of fluid polymer on the tip of the syringe needle, the drop becomes charged and
elongated into a conical shape due to electrostatic repulsion (this shape is known as Taylor
cone). If the electrostatic force overcomes the surface tension and viscoelastic force, a jet of
polymer solution forms from the tip of Taylor cone. The liquid jet undergoes an elongation
and thinning process, during which the solvent evaporates. This leads to the deposition of the
non-woven fibrous mat on the collector.
Several parameters influence fibre diameter and morphology, namely molecular weight
and concentration of the polymer, solution properties (viscosity, conductivity and surface
tension), process parameters (applied potential, flow rate, distance between the capillary and
collector) and ambient parameters (room temperature and humidity). In particular, the

Chapter 1: Context and motivation
37
polymer concentration has a very important influence on the fibres morphology and diameter.
When the concentration is low, the liquid jet can breakup, what results in the electrospraying
of drops. If the concentration is increased, beads and fibres can be obtained. When it is high
enough, fibres without beads are obtained. The diameter of the fibres increases with precursor
concentration [192].
Figure 15: Scheme of the electrospinning set-up [191].
There are various applications of electrospinning [193],[194], such as filtration [195],
medical (tissue engineering, wound dressing and drug delivery) [196], sensors [197] and
energy related applications [191]. Electrospun fibres and fibre mats are widely used as
electrode or membranes in energy conversion and storage devices such as solar cells, fuel
cells, lithium ion batteries and supercapacitors due to its high porosity and surface
area [198],[199].
Despite the huge progress in electrospinning during the last few decades, the fabrication
of fibres without beads and with diameter smaller than 50 nm is still challenging. Another
problem is the fragility of the ceramic films, which are easily destroyed after calcination and
could not be handled as a self-standing mat.
2004 2005 2006 2007 2008 2009 2010 2011 2012 2013
0
10
20
30
40
50
60
70
80
Nu
mb
er o
f p
ub
lish
ed p
ap
ers
Year
Figure 16: Research articles published on the use of electrospun nanofibres in the field of fuel cell (from
SciFinder using keywords: “electrospinning” and “fuel cell”).

Chapter 1: Context and motivation
38
3.2 Electrospun fibres as electrocatalyst support
In the last years, significant attention has been gained by electrospun fibres for fuel cell
applications. The number of publications increased from 1 in 2004 to 74 in 2013, as shown in
Figure 16. In particular, carbon and ceramic fibres described in this paragraph have been
explored as support to disperse the Pt nanoparticles [191].
3.2.1 Carbon nanofibres
Several polymers can be electrospun and carbonised such as polyacrylonitrile (PAN),
polybenzimidazole (PBI), poly(vinyl alcohol) (PVA), poly(amic acid) (PAA), polyimide (PI),
pitch and others [200],[201]. PAN is the most widely used precursor for production of carbon
fibres due to the high carbon yield [202]. PAN-based CNFs [203],[204] found application in
energy conversion devices such as PEM fuel cells, supercapacitors and lithium ion
batteries [191],[198].
Thermal treatment of PAN nanofibres consists of three steps: stabilisation, carbonisation
and graphitisation [205],[206]. The first step is stabilisation in air between 180 °C and 300 °C,
which allows the cyclisation of the nitrile groups (Figure 17). Stabilisation is usually
performed at a low heating rate to prevent melting or fusing of the fibres. During the
stabilisation process, two reactions take place, which are: cyclisation and dehydrogenation.
The PAN-based fibres change colour from white to dark brown. The second step is
carbonisation in a nitrogen or argon atmosphere between 600 °C and 1300 °C to keep out
non-carbon atoms. The third step is graphitisation at 1500 – 3000 °C, which leads to an
increase in graphite content. During heat treatment, the PAN fibre is stretched and shrinks in
diameter.
280 °C
1 h, 1 °C/min
1000 – 3000 °C
1 h, 5 °C/min
Figure 17: Mechanism of CNF formation

Chapter 1: Context and motivation
39
One of the advantages of the 1 D structure is the increased conductivity along the axis of
the fibres. The electrical conductivity of single CNF carbonised at 1000 °C was
275 S/cm [207]. Agend et al. measured even higher electrical conductivity of around
600 S/cm for a CNF mat carbonised at 1100 °C [208].
CNF supported catalyst exhibit a good performance towards the electrocatalytic oxidation
of formic acid [209] and methanol (MOR) [210]. Lin et al. used soft 1-aminopyrene-
functionalisation methods to activate CNFs before catalyst deposition. Obtained Pt/CNFs
electrocatalyst exhibit improved ECSA and performance for the MOR compared to the
catalyst deposited by traditional harsh oxidising functionalisation using HNO3 and H2SO4
acids [211]. Li et al. developed catalyst supported on electrospun fibrous mats (CFM), which
provides with high electrical conductivity and increased activity towards
MOR [212],[213],[214],[215]. Park et al. [216] observed high PEMFC performance with
Pt/CNFs electrocatalyst, which was attributed to higher electrical conductivity (9.9 S/cm) and
larger surface area (307 m2/g) of CNFs compared to the commercial Vulcan XC-72R support
(4.5 S/cm and 235 m2/g). Recently, Padmavathi et al. [217] demonstrated that fuctionalisation
treatments of CNFs with acids resulted in an enhanced PEMFC performance. Properties of
CNFs supported catalyst are listed in Table 4.
3.2.2 Electrospun metal oxides
Originally electrospinning was used to obtain polymer fibres. However, combination of
electrospinning and appropriate thermal treatment allows fabrication of inorganic fibres.
Electrospinning solution consists of a carrier polymer (usually poly(vinyl pyrlidone) (PVP),
polyacrylonitrile (PAN) or poly(vinyl acetate) (PVA)), metal salt precursor and solvent
(water, ethanol and dimethylformamide (DMF)), which evaporates during the electrospinning
procedure. The polymer is added to increase the viscosity of the solution and make it
spinnable. After electrospinning of such solution calcination is necessary in order to remove
all organic components. In some cases viscous solution could be used without addition of
polymer [220]. The metal alkoxide are usually used as precursors for oxide-based
fibres [185],[221].
It is also possible to obtain porous and hollow ceramic fibres. For example, titania tubes
can be prepared by co-spinning of two solutions such as Ti(OiPr)4/PVP and heavy mineral oil.
In this case, the spinneret consists of two coaxial capillaries, which allow the generation of
core-shell fibres. Mineral oil can be removed by extraction with n-hexane followed by
calcination in air [222],[223]. Even titania tube with channel number from two to five can be

Chapter 1: Context and motivation
40
prepared via multifluidic coaxial electrospinning [224]. Furthermore, high surface area
(199 m2/g) mesoporous fibres have been obtained using surfactant and low calcination
temperature of 400 °C [225].
Table 4: PAN-based electrospun nanofibres for fuel cell electrodes application
Ref. Material Fibre
diameter,
nm
Condu-
ctivity
of CNF,
S/cm
Surface
area of
CNF,
m2/g
Catalyst
size,
nm
ECSA,
m2/g
Advantages FC
type
Park
[216]
Pt/CNFs 250 9.9 307 2.6 30.8 High FC
performance
H2-
PEM
Li
[212]
Pt/CFM 150 50 7 50-200 - Improved
performance
DMFC
Li
[213]
Pt/C-CFM 150 55 - - - High activity
and stability
DMFC
Li
[218]
Pt/C-CFM 150 42 - 5 - High
performance
DMFC
Liu
[214]
Pt/AuCFM 740 104 - 4.2-7.5 39.8 High activity DMFC
Chang
[215]
Pt/Graphene-
CFMs
150 65 - 5-10 34.8 Improved
stability
DMFC
Lin
[210]
Pt/CNFs 200-300 - - 20 187 µC High
performance
DMFC
Lin
[211]
PtRu/1-AP-
CNFs
100-300 - - 3.1 32.7 Improved
ECSA and
performence
DMFC
Huang
[209]
PtAu/CNFs 700
- - 118 - Higher activity
than that of
Pt/C
FAFC
Padma-
vanthi
[217]
Pt/CNFs 300 - 107.9-
237.54
3.9-5.2 17.16-
35.34
High activity
and stability
H2-
PEM
An
[219]
Pt/CNFs
Pt/CNFs-Ru
core-shell
197-250 - - 1-3 - Higher activity
than that of
Pt/C
DMFC

Chapter 1: Context and motivation
41
3.2.3 Electrospun titania
TiO2 has been explored as alternative support for PEMFC as already seen in
paragraph 2.2.2. Electrospun titanium oxide fibres are used for lithium ion batteries [226],
dye-sensitised solar cells [227], H2-PEMFC and DMFC [191]. Indeed, electrospun TiO2
supported Pt prepared by microwave irradiation showed higher activity towards methanol
oxidation than commercial Pt/C [228].
In collaborative research between the Laboratory and the Institute for Fuel Cell Innovation
(Vancouver, Canada), electrospun Nb-TiO2 supported Pt demonstrated higher stability
compared to that of the commercially available Pt/C catalyst [149]. Pt supported on Nb-TiO2
and on reduced TiOx showed improved ORR activity compared to Pt/TiO2 due to their
enhanced electrical conductivity [229].
Recently, Du et al. [230] deposited Pt nanoparticles on the electrospun Nb-TiO2
membrane using atomic layer deposition (ALD). 10 at. % Nb doped TiO2 supported Pt
exhibited ~20-fold higher ORR activity compared to the Pt/TiO2. Only 10 % loss in ORR
activity was observed after stability test.
In order to increase the conductivity of TiO2, Senevirathne et al. [231] reduced titania
nanofibres at 1050 °C. However, the obtained Ti4O7 supported Pt electrocatalyst showed poor
ORR mass activity after prolonged cycles due to the progressive formation of a TiO2
insulating layer.
Another approach to increase both electrical conductivity and surface area of TiO2-based
support is the use of carbon-TiO2 composite materials. For instance, the PtRu supported on
the carbon-TiO2 composite electrospun nanofibre support showed a significant increase in the
MOR activity and durability compared to RtRu supported on Vulcan [232]. The use of the
carbon-TiO2 support leads to decreased CO poisoning keeping the high conductivity and high
surface area of the carbon support. Synthesis conditions and properties of Pt supported on
TiO2-based electrospun nanofibres are listed in Table 5.
a. Electrospun tin oxide
Electrospun tin oxide is used for gas sensors [235], lithium ion batteries [236], dye-
sensitised solar cells [237] and fuel cells. For instance, Kim et al. [238] added electrospun Sb
doped SnO2 nanowires to the commercial Pt/C electrocatalyst. Obtained hybrid Pt/C-ATO
catalyst exhibited enhanced alcohol oxidation activity and durability.

Chapter 1: Context and motivation
42
Recently, Ogi [239],[240] has proposed to use electrospun Pt/SnO2 nanofibres (with
ECSA of 81 m2/g) as anode electrocatalyst due to its ORR-blocking properties, which can
prevent cathode degradation during start-up and shutdown of FC (see reverse-current
mechanism paragraph 1.2.4.2). ORR inhibition effect of Pt/SnO2 was attributed to the
presence of organic nitrile-group molecules (from the carrier polymer, PAN), which are easily
adsorbed by hydroxyl molecules. It is well known that high hydroxyl coverage on Pt inhibits
oxygen reduction [241].
Table 5: TiO2-based electrospun nanofibres for PEMFC electrodes application
Ref. Electro-
catalyst
Calcina
tion T,
°C,
gas
Pt
deposition
method
Support
surface
area,
m2/g
ECSA,
m2/g
(Pt
particle
size)
Activity Catalyst was
more stable
than Pt/C
after the
following test
Bauer
2010
[229]
1) Pt/
NbTiO2,
2) Pt/
TiOx
500
air,
650 H2
Polyol
method
- 1.3-5
(5 nm)
ORR activity
was lower than
that for Pt/C
1000 cycles
(0.05 - 1.3 V)
Senevi-
rathne
2012
[231]
Pt/Ti4O7
1050
H2/N2
(1:1)
NaBH4
reduction
6 ~ 6 ORR mass
activity:
11 mA/mgPt
Non-
conductive
TiO2 layer
formation
Bauer
2012
[149]
Pt/NbTiO2
500
air
Polyol
method
72
22
(5 nm)
ORR mass
activity:
3.2 A/gPt
at 0.9 V
1000 cycles
(0.05 - 1.2 V)
Du
2014
[230]
Pt/NbTiO2
500
air
ALD
500 °C
5% H2/Ar
14.74 (14
nm)
ORR mass
activity:
0.28 mA/gPt
at 0.9 V
10 % ORR
activity loss
30000 cycles
(0.6 – 1.0 V)
Long
2010
[228]
Pt/TiO2 500
air
Microwave
assisted
polyol
method
- - Methanol
electro-
oxidation
-
Formo
2008
[233]
[234]
Pt/TiO2 510
air
Polyol
method
- 16 - 56 Methanol
electro-
oxidation
-
Abdel-
kareem
2012
[232]
PtRu/C-
TiO2
1000
N2,
850
steam
NaBH4
reduction
207 (9.6
nm)
Methanol
electro-
oxidation
Showed higher
stability than
PtRu/Vulcan

Chapter 1: Context and motivation
43
4 Principle of the synthesis and deposition of Pt nanoparticles
There are many methods that can be used for the deposition of metal catalyst on the
support, for example impregnation, colloidal methods (so-called Bönnemann method, see
below, microemulsion and polyol [242]), electrodeposition, vapour deposition and
others [21].
4.1 Impregnation
In the impregnation method, the Pt salt (for example H2PtCl6) is reduced either under
a flow of H2 at around 300 °C or by using a reducing agent [243]. It is a very simple method,
which allows the obtaining of a good dispersion on the support with very small Pt
nanoparticle size of around 2 nm. One of the advantages of this method is the deposition of
the Pt nanoparticles within the pore structure of the support. The disadvantage of this method
is the very poor Pt loading, between 1 and 10 wt. %, which is too low for PEMFC cathode
application. The attempt to increase the metal loading on the carbon support leads to a less
homogeneous distribution of the particle size. This method does not provide the control of Pt
particle size and distribution. In order to overcome this problem, Coutanceau et al. [244] used
a colloid method.
4.2 Colloid methods
In this particular method, the reduction of platinum salt in the solution is followed by the
adsorption of the Pt ions on the support. The use of a stabilising agents such as polyvinyl
pyrrolidone (PVP) and surfactants allows an efficient control of the metal nanoparticle size
and also prevents the agglomeration of the Pt nanoparticles [245]. But it can be difficult to
remove these surfactant molecules from the surface of the catalyst after the synthesis. This
problem was resolved by using ethylene glycol as the stabilising agent due to its easy removal
by heat treatment below 160 °C. Another disadvantage of the colloidal methods is the high
dilution of the colloidal particles, which involve a big amount of solvent; therefor this method
is not the best solution for large scale production.
Bönnemann method
In this method, tetraalkylammonium salt acts as both the reducing agent and the
stabilising agent for Pt and Pt alloys in tetrahydrofuran. Small nanoparticles of PtRu and
Pt3Sn below 2 nm diameter with a very narrow particle size distribution were obtained by this

Chapter 1: Context and motivation
44
method, but the surfactant needs to be removed by calcination at 300 °C [246]. However, such
high temperature can cause changes in the catalyst structure.
Microemulsion method
In this system water droplets with metal salts (nanoreactors) are dispersed in a nonpolar
solvent. The surfactant acts as the separator between the two phases. The reduction of the
metal salts and grain growth take place in a surfactant stabilised microdroplets, as described
by Boutonnet et al. [247]. This method allows the synthesis of monodispersed particles with
a very narrow size distribution. But the use of surfactant with long washing steps is not
economical in terms of scale-up [242].
Polyol method
Fievet et al. [248], [249] proposed the reduction of metal-containing salt by using
poly(ethylene glycol)s. In the so-called polyol method ethylene glycol plays the role of the
solvent, reducing agent and stabilising agent for metal particles. Unlike other stabilising
agents, it can be easily removed at low temperatures.
The ethylene glycol can be oxidised in the reaction with a metal salt to aldehydes and then
to glycolic and oxalic acids. At high pH, the glycolic acid dissociates and is present in the
form of glycolate anion, which stabilizes the Pt nanoparticles by forming a chelate-type
complex via carboxyl groups [250]. The metal particle size depends strongly on the
concentration of the glycolate anion in the solution. Therefore, the size of the Pt nanoparticle
can be controlled by changing the pH of the solution and precursor concentration. The higher
is the pH of the initial solution, the smaller is the particles size of the Pt [251].
Microwave-assisted polyol method
Microwave heating have many advantages namely rapid and homogeneous heating, high
reaction rate and chemical yield. Such system results in uniform nucleation, leading to
formation of monodispersed small nanoparticles, with narrow particle size distribution [252].
Ethylene glycol is a very efficient solvent for microwave rapid heating due to its high
dielectric constant (ε = 41.2).

Chapter 1: Context and motivation
45
Motivation of the PhD thesis
The main aim of the research described in this thesis was to overcome the problem of
carbon corrosion by using alternative catalyst supports, which may increase the lifetime of
PEMFC. In this work, carbon, TiO2 and SnO2 nanofibres were prepared via the
electrospinning technique. In order to enhance electronic conductivity and surface area of
TiO2 and SnO2 various thermal treatments and doping (Nb or Sb) were applied. The
structural, surface and electrical properties of obtained catalyst supports were characterised by
various methods including scanning electron microscopy (SEM), transmission electron
microscopy (TEM), X-ray diffraction (XRD), X-ray photoelectron spectroscopy (XPS),
Raman spectroscopy, Brunauer–Emmett–Teller (BET) analysis and electronic conductivity
measurements. Afterward Pt nanoparticles were deposited on the selected electrospun fibres
by modified microwave-assisted polyol method. The influence of such carbon-based and
oxide-based supports on the catalyst activity and stability was evaluated ex situ on rotating
disk electrode (RDE). The support with best electrochemical prosperities was then chosen for
in situ characterisation in a single PEMFC test bench.
Second, third and fourth chapters describe synthesis and characterisations of electrospun
carbon, TiO2 and SnO2 nanofibres, respectively. The effect of doping on the conductivity,
surface area and morphology of TiO2 and SnO2 is also investigated. The fifth chapter
describes the characterisation of the obtained SnO2 supported Pt in a single fuel cell with
Nafion® and polybenzimidazole membranes. The general conclusions and future perspectives
are presented in the last chapter.
The thesis presented in this manuscript was carried out in the group of ICGM-AIME (Institute
Charles Gerhardt of Montpellier; research group: Aggregates, Interfaces and Materials for
Energy) under the supervision of Prof. Jacques Rozière and Dr. Sara Cavaliere.
The various aspects of the research described in this thesis were financed by:
QuasiDry (QUASI-anhydrous and DRY membranes for next generation fuel cells)
is an European Framework Programme 7 project (2011);
Marie Curie Initial Training Network SUSHGEN (Sustainable Hydrogen
Generation) is an European Framework Programme 7 project (2012);
SURICAT (SUpports Robustes et Innovants pour CATalyseurs de PEMFC) is
a project of National Research Agency (2013 - 2014).
Chapter 1: Context and motivation
46
References
[1] “BP Statistical Review of World Energy About this review Contents,” June, 2013.
[2] Q. Schiermeier, J. Tollefson, T. Scully, A. Witze, and M. Oliver, “Energy alternatives: Electricity
without carbon,” Nature, vol. 454, pp. 816–823, 2008.
[3] F. Díaz-González, A. Sumper, O. Gomis-Bellmunt, and R. Villafáfila-Robles, “A review of energy
storage technologies for wind power applications,” Renewable and Sustainable Energy Reviews, vol. 16,
no. 4, pp. 2154–2171, May 2012.
[4] F. T. Wagner, B. Lakshmanan, and M. F. Mathias, “Electrochemistry and the Future of the Automobile,”
The Journal of Physical Chemistry Letters, vol. 1, no. 14, pp. 2204–2219, Jul. 2010.
[5] G. Gahleitner, “Hydrogen from renewable electricity: An international review of power-to-gas pilot
plants for stationary applications,” International Journal of Hydrogen Energy, vol. 38, no. 5, pp. 2039–
2061, Feb. 2013.
[6] C. F. Schönbein, “On the Voltaic Polarization of Certain Solid and Fluid Substances,” The London and
Edinburgh Philosophical Magazine and Journal of Science, vol. XIV, pp. 42–45, 1839.
[7] W. R. Grove, “On a Gaseous Voltaic Battery,” Philosophical Magazine and Journal of Science, vol.
XXI, pp. 417–420, 1842.
[8] U. Bossel, The Birth of the Fuel Cell 1835-1845. 2000.
[9] L. Mond and C. Langer, “A new form of gas battery,” Proceedings of the Royal Society of London, vol.
46, p. 296, 1889.
[10] A. Dicks, Fuel Cell Systems Explained. 2003, p. 23.
[11] “Proton exchange membrane fuel cell,”
http://en.wikipedia.org/wiki/Proton_exchange_membrane_fuel_cell#cite_note-11. .
[12] S. S. Kocha, “Volum 3. Fuel Cell Technology and Applications Part1,” in in Hand book of Fuel Cells,
First., W. Vielstich, A. Lamm, and H. A. Gasteiger, Eds. Chichester: John Wiley and Sons, 2003, pp.
538–560.
[13] S. Srinivasan, E. A. Ticianellii, R. Derouin, and A. Redondo, “Advances in solid polymer electrolyte
technology with low platinum loading,” Journal of Power Sources,, vol. 22, pp. 359–375, 1988.
[14] N. M. Markovic, B. N. Grgur, and P. N. Ross, “Temperature-Dependent Hydrogen Electrochemistry on
Platinum Low-Index Single-Crystal Surfaces in Acid Solutions,” The Journal of Physical Chemistry B,
vol. 101, pp. 5405–5413, 1997.
[15] P. M. Quaino, J. L. Fernández, M. R. Gennero de Chialvo, and a. C. Chialvo, “Hydrogen oxidation
reaction on microelectrodes: Analysis of the contribution of the kinetic routes,” Journal of Molecular
Catalysis A: Chemical, vol. 252, no. 1–2, pp. 156–162, Jun. 2006.
[16] J. X. Wang, T. E. Springer, and R. R. Adzic, “Dual-Pathway Kinetic Equation for the Hydrogen
Oxidation Reaction on Pt Electrodes,” Journal of The Electrochemical Society, vol. 153, no. 9, p. A1732,
2006.
[17] M. K. Debe, “Electrocatalyst approaches and challenges for automotive fuel cells.,” Nature, vol. 486, no.
7401, pp. 43–51, Jun. 2012.
[18] H. a Gasteiger and N. M. Marković, “Just a dream-or future reality?,” Science, vol. 324, no. 5923, pp.
48–9, Apr. 2009.
[19] F. Maillard, S. Pronkin, and E. R. Savinova, “Volum 5. Advances in Electrocatalysis, Materials,
Diagnostics and Durability: Part 1,” in in Hand book of Fuel Cells, W. Vielstich, H. Yokokawa, and H.
A. Gasteiger, Eds. Chichester: John Wiley and Sons, 2003, pp. 91–112.
[20] P. Derek, Ed., A First Course in Electrode Processes. Cambridge: RSC Publishing, 2009, p. 211.
[21] H. Zhang, X. Wang, J. Zhang, and J. Zhang, “PEM Fuel Cell Electrocatalysts and Catalyst Layers.
Conventional Catalyst Ink, Catalyst Layer and MEA Preparation,” J. Zhang, Ed. London: Springer-
Verlag, 2008, pp. 1 – 1137.
[22] V. Zhdanov and B. Kasemo, “Kinetics of electrochemical O2 reduction on Pt,” Electrochemistry
Communications, vol. 8, no. 7, pp. 1132–1136, Jul. 2006.
[23] E. Yeager, “Dioxygen electrocatalysis: mechanisms in relation to catalyst structure,” Journal of
Molecular Catalysis, vol. 38, pp. 5–25, 1986.
[24] I. Katsounaros, S. Cherevko, A. R. Zeradjanin, and K. J. J. Mayrhofer, “Oxygen electrochemistry as a
cornerstone for sustainable energy conversion,” Angewandte Chemie, vol. 53, no. 1, pp. 102–21, Jan.
2014.
[25] J. K. Nørskov, J. Rossmeisl, A. Logadottir, L. Lindqvist, D.- Lyngby, and H. Jo, “Origin of the
Overpotential for Oxygen Reduction at a Fuel-Cell Cathode,” J. Phys. Chem. B, vol. 108, pp. 17886–
17892, 2004.
[26] K. Kinoshita, “Particle Size Effects for Oxygen Reduction on Highly Dispersed Platinum in Acid
Electrolytes,” Journal of The Electrochemical Society, vol. 137, no. 3, p. 845, 1990.

Chapter 1: Context and motivation
47
[27] M. Peuckert, T. Yoneda, R. A. D. Betta, and M. Boudart, “Oxygen Reduction on Small Supported
Platinum Particles,” J. Electrochem. Soc., vol. 133, p. 944, 1986.
[28] D. P. Wilkinson, J. Zhang, R. Hui, J. Fergus, and X. Li, Eds., Proton exchange membrane fuel cells.
Boca Raton: CRC Press, 2010, pp. 1 – 446.
[29] S. J. Peighambardoust, S. Rowshanzamir, and M. Amjadi, “Review of the proton exchange membranes
for fuel cell applications,” International Journal of Hydrogen Energy, vol. 35, no. 17, pp. 9349–9384,
Sep. 2010.
[30] S. Subianto, M. Pica, M. Casciola, P. Cojocaru, L. Merlo, G. Hards, and D. J. Jones, “Physical and
chemical modification routes leading to improved mechanical properties of perfluorosulfonic acid
membranes for PEM fuel cells,” Journal of Power Sources, vol. 233, pp. 216–230, Jul. 2013.
[31] J. S. Wainright, J. Wang, D. Weng, R. F. Savinell, and M. Litt, “Acid-Doped Polybenzimidazoles: A
New Polymer Electrolyte,” J. Electrochem. Soc., vol. 142, no. 7, pp. 121–123, 1995.
[32] J. S. Wainright, M. H. Litt, and R. F. Savinell, “Volum 3. Fuel Cell Technology and Applications Part1,”
in in Hand book of Fuel Cells, W. Vielstich, A. Lamm, and H. A. Gasteiger, Eds. Chichester: John Wiley
and Sons, 2003, pp. 349–356.
[33] M. F. Mathias, J. Roth, J. Fleming, and W. Lehnert, “Volum 3. Fuel Cell Technology and Applications
Part1,” in in Hand book of Fuel Cells, W. Vielstich, A. Lamm, and H. A. Gasteiger, Eds. Chichester:
John Wiley and Sons, 2003, pp. 517–537.
[34] S. Park, J.-W. Lee, and B. N. Popov, “A review of gas diffusion layer in PEM fuel cells: Materials and
designs,” International Journal of Hydrogen Energy, vol. 37, no. 7, pp. 5850–5865, Apr. 2012.
[35] R. O’Hayre, D. M. Barnett, and F. B. Prinz, “The Triple Phase Boundary,” Journal of The
Electrochemical Society, vol. 152, no. 2, p. A439, 2005.
[36] J. Greeley, I. E. L. Stephens, a S. Bondarenko, T. P. Johansson, H. a Hansen, T. F. Jaramillo, J.
Rossmeisl, I. Chorkendorff, and J. K. Nørskov, “Alloys of platinum and early transition metals as
oxygen reduction electrocatalysts.,” Nature chemistry, vol. 1, no. 7, pp. 552–6, Oct. 2009.
[37] V. R. Stamenkovic, B. Fowler, B. S. Mun, G. Wang, P. N. Ross, C. a Lucas, and N. M. Marković,
“Improved oxygen reduction activity on Pt3Ni(111) via increased surface site availability.,” Science, vol.
315, no. 5811, pp. 493–7, Jan. 2007.
[38] V. R. Stamenkovic, B. S. Mun, K. J. J. Mayrhofer, P. N. Ross, and N. M. Markovic, “Effect of surface
composition on electronic structure, stability, and electrocatalytic properties of Pt-transition metal alloys:
Pt-skin versus Pt-skeleton surfaces.,” Journal of the American Chemical Society, vol. 128, no. 27, pp.
8813–9, Jul. 2006.
[39] F. Jaouen, E. Proietti, M. Lefèvre, R. Chenitz, J.-P. Dodelet, G. Wu, H. T. Chung, C. M. Johnston, and P.
Zelenay, “Recent advances in non-precious metal catalysis for oxygen-reduction reaction in polymer
electrolyte fuel cells,” Energy & Environmental Science, vol. 4, no. 1, p. 114, 2011.
[40] R. Jasinski, “A New Fuel Cell Cathode Catalyst,” Nature, vol. 201, pp. 1212–1213, 1964.
[41] M. Lefèvre, E. Proietti, F. Jaouen, and J.-P. Dodelet, “Iron-based catalysts with improved oxygen
reduction activity in polymer electrolyte fuel cells.,” Science, vol. 324, no. 5923, pp. 71–4, Apr. 2009.
[42] “US Department of Energy (DOE). Fuel cell technologies office multi-year research, development and
demonstration plan— Technical Plan: Fuel Cells,”
http://www1.eere.energy.gov/hydrogenandfuelcells/mypp/, 2012. .
[43] R. Borup, J. Meyers, B. Pivovar, Y. S. Kim, R. Mukundan, N. Garland, D. Myers, M. Wilson, F. Garzon,
D. Wood, P. Zelenay, K. More, K. Stroh, T. Zawodzinski, J. Boncella, J. E. McGrath, M. Inaba, K.
Miyatake, M. Hori, K. Ota, Z. Ogumi, S. Miyata, A. Nishikata, Z. Siroma, Y. Uchimoto, K. Yasuda, K.-
I. Kimijima, and N. Iwashita, “Scientific aspects of polymer electrolyte fuel cell durability and
degradation.,” Chemical reviews, vol. 107, no. 10, pp. 3904–51, Oct. 2007.
[44] N. M. Markovic, H. A. Gasteiger, and P. N. Ross, “Oxygen Reduction on Platinum Low-Index Single-
Crystal Surfaces in Sulfuric Acid Solution: Rotating Ring Pt(hkl) Disk Studies,” Journal of Physical
Chemistry, vol. 99, no. 11, pp. 3411–3415, 1995.
[45] T. Kinumoto, M. Inaba, Y. Nakayama, K. Ogata, R. Umebayashi, A. Tasaka, Y. Iriyama, T. Abe, and Z.
Ogumi, “Durability of perfluorinated ionomer membrane against hydrogen peroxide,” Journal of Power
Sources, vol. 158, pp. 1222–1228, 2006.
[46] A. Pozio, R. F. Sil, M. De Francesco, and L. Giorgi, “Nafion degradation in PEFCs from end plate iron
contamination,” Electrochimica Acta, vol. 48, pp. 1543–1549, 2003.
[47] J. Peron, Y. Nedellec, D. Jones, and J. Roziere, “The effect of dissolution, migration and precipitation of
platinum in Nafion®-based membrane electrode assemblies during fuel cell operation at high potential,”
Journal of Power Sources, vol. 185, no. 2, pp. 1209–1217, Dec. 2008.
[48] A. Ohma, S. Suga, S. Yamamoto, and K. Shinohara, “Phenomenon Analysis of PEFC for Automotive
Use (1): Membrane Degradation Behavior During OCV Hold Test,” ECS Transactions, vol. 3, no. 1, pp.
519–529, 2006.

Chapter 1: Context and motivation
48
[49] D. E. Curtin, R. D. Lousenberg, T. J. Henry, P. C. Tangeman, and M. E. Tisack, “Advanced materials for
improved PEMFC performance and life,” Journal of Power Sources, vol. 131, no. 1–2, pp. 41–48, May
2004.
[50] A. B. LaConti, M. Hamdan, and R. C. McDonald, “Volum 3. Fuel Cell Technology and Applications
Part1,” in in Hand book of Fuel Cells, 1st ed., W. Vielstich, A. Lamm, and H. A. Gasteiger, Eds.
Chichester: John Wiley and Sons, 2003, pp. 647–662.
[51] E. Endoh, “Highly Durable MEA for PEMFC Under High Temperature and Low Humidity Conditions
Eiji Endoh,” ECS Transactions, vol. 3, no. 1, pp. 9–18, 2006.
[52] B. P. Pearman, N. Mohajeri, D. K. Slattery, M. D. Hampton, S. Seal, and D. a. Cullen, “The chemical
behavior and degradation mitigation effect of cerium oxide nanoparticles in perfluorosulfonic acid
polymer electrolyte membranes,” Polymer Degradation and Stability, vol. 98, no. 9, pp. 1766–1772,
Sep. 2013.
[53] B. P. Pearman, N. Mohajeri, R. P. Brooker, M. P. Rodgers, D. K. Slattery, M. D. Hampton, D. A. Cullen,
and S. Seal, “The degradation mitigation effect of cerium oxide in polymer electrolyte membranes in
extended fuel cell durability tests,” Journal of Power Sources, vol. 225, pp. 75–83, Mar. 2013.
[54] M. P. Rodgers, L. J. Bonville, H. R. Kunz, D. K. Slattery, and J. M. Fenton, “Fuel cell perfluorinated
sulfonic acid membrane degradation correlating accelerated stress testing and lifetime.,” Chemical
reviews, vol. 112, no. 11, pp. 6075–103, Nov. 2012.
[55] Y. Yu, H. Li, H. Wang, X.-Z. Yuan, G. Wang, and M. Pan, “A review on performance degradation of
proton exchange membrane fuel cells during startup and shutdown processes: Causes, consequences, and
mitigation strategies,” Journal of Power Sources, vol. 205, pp. 10–23, May 2012.
[56] F. N. Büchi, M. Inanba, and T. J. Schmidt, Eds., Polymer Electrolyte Fuel Cell Durability. New York:
Springer-Verlag, 2009, pp. 1–69.
[57] M. Cai, M. S. Ruthkosky, B. Merzougui, S. Swathirajan, M. P. Balogh, and S. H. Oh, “Investigation of
thermal and electrochemical degradation of fuel cell catalysts,” Journal of Power Sources, vol. 160, no.
2, pp. 977–986, Oct. 2006.
[58] Y. Yang and Z. G. Lin, “In situ FTIR characterization of the electrooxidation of glassy carbon
electrodes,” Journal of Applied Electrochemistry, vol. 25, no. 3, pp. 259–266, Mar. 1995.
[59] C. A. Reiser, L. Bregoli, T. W. Patterson, J. S. Yi, J. D. Yang, M. L. Perry, and T. D. Jarvi, “A Reverse-
Current Decay Mechanism for Fuel Cells,” Electrochemical and Solid-State Letters, vol. 8, no. 6, p.
A273, 2005.
[60] S. Maass, F. Finsterwalder, G. Frank, R. Hartmann, and C. Merten, “Carbon support oxidation in PEM
fuel cell cathodes,” Journal of Power Sources, vol. 176, no. 2, pp. 444–451, Feb. 2008.
[61] M. F. Mathias, R. Makharia, H. A. Gasteiger, J. J. Conley, T. J. Fuller, C. J. Gittleman, S. S. Kocha, D.
P. Miller, C. K. Mittelsteadt, T. Xie, S. G. Yan, P. T. Yu, U. S, and H. Hoover, “Two Fuel Cell Cars In
Every Garage?,” The Electrochemical Society Interface, vol. 14, no. 3, p. 24, 2005.
[62] K. H. Kangasniemi, D. a. Condit, and T. D. Jarvi, “Characterization of Vulcan Electrochemically
Oxidized under Simulated PEM Fuel Cell Conditions,” Journal of The Electrochemical Society, vol.
151, no. 4, p. E125, 2004.
[63] B. M. J. N. Pourbaix, J. Van Muylder, and N. De Zoubov, “Electrochemical Properties of the Platinum
Metals,” Platinum Metals Rev., vol. 3, no. 2, pp. 47–53, 1959.
[64] R. M. Darling and J. P. Meyers, “Kinetic Model of Platinum Dissolution in PEMFCs,” Journal of The
Electrochemical Society, vol. 150, no. 11, p. A1523, 2003.
[65] S. Zhang, X.-Z. Yuan, J. N. C. Hin, H. Wang, K. A. Friedrich, and M. Schulze, “A review of platinum-
based catalyst layer degradation in proton exchange membrane fuel cells,” Journal of Power Sources,
vol. 194, no. 2, pp. 588–600, Dec. 2009.
[66] Y. Shao-Horn, W. C. Sheng, S. Chen, P. J. Ferreira, E. F. Holby, and D. Morgan, “Instability of
Supported Platinum Nanoparticles in Low-Temperature Fuel Cells,” Topics in Catalysis, vol. 46, no. 3–
4, pp. 285–305, Nov. 2007.
[67] P. J. Ferreira, G. J. la O’, Y. Shao-Horn, D. Morgan, R. Makharia, S. Kocha, and H. A. Gasteiger,
“Instability of Pt∕C Electrocatalysts in Proton Exchange Membrane Fuel Cells,” Journal of The
Electrochemical Society, vol. 152, no. 11, p. A2256, 2005.
[68] K. G. Gallagher, R. M. Darling, and T. F. Fuller, “Volum 6. Advances in Electrocatalysis, Material,
Diagnostics and Durability: Part 2,” in in Hand book of Fuel Cells, W. Vielstich, H. Yokokawa, and H.
A. Gasteiger, Eds. Chichester: John Wiley and Sons, 2003, pp. 819–829.
[69] O. Yamazaki, Y. Oomori, H. Shintaku, and T. Tabata, “Study on Degradation of the Pt-Ru Anode of
PEFC for Residential Application (2) Analyses of the MEAs Degrad ed in the Anode Performance,” ECS
Transactions, vol. 11, no. 1, pp. 287–295, 2007.
[70] S. Sharma and B. G. Pollet, “Support materials for PEMFC and DMFC electrocatalysts—A review,”
Journal of Power Sources, vol. 208, pp. 96–119, Jun. 2012.

Chapter 1: Context and motivation
49
[71] E. Antolini, “Carbon supports for low-temperature fuel cell catalysts,” Applied Catalysis B:
Environmental, vol. 88, no. 1–2, pp. 1–24, Apr. 2009.
[72] G. S. Chai, S. B. Yoon, J.-S. Yu, J.-H. Choi, and Y.-E. Sung, “Ordered Porous Carbons with Tunable
Pore Sizes as Catalyst Supports in Direct Methanol Fuel Cell,” The Journal of Physical Chemistry B,
vol. 108, no. 22, pp. 7074–7079, Jun. 2004.
[73] Y. Shao, S. Zhang, R. Kou, X. Wang, C. Wang, S. Dai, V. Viswanathan, J. Liu, Y. Wang, and Y. Lin,
“Noncovalently functionalized graphitic mesoporous carbon as a stable support of Pt nanoparticles for
oxygen reduction,” Journal of Power Sources, vol. 195, no. 7, pp. 1805–1811, Apr. 2010.
[74] F. Coloma and J. L. G. Fierro, “Preparation of Platinum Supported on Pregraphitized Carbon Blacks,”
Langmuir, vol. 10, no. 3, pp. 750–755, 1994.
[75] Y. Shao, J. Sui, G. Yin, and Y. Gao, “Nitrogen-doped carbon nanostructures and their composites as
catalytic materials for proton exchange membrane fuel cell,” Applied Catalysis B: Environmental, vol.
79, no. 1, pp. 89–99, Feb. 2008.
[76] S. Iijima and T. Ichlhashi, “Single-shell carbon nanotubes of 1-nm diameter,” Nature, vol. 363, pp. 603–
605, 1993.
[77] K. Lee, J. Zhang, H. Wang, and D. P. Wilkinson, “Progress in the synthesis of carbon nanotube- and
nanofiber-supported Pt electrocatalysts for PEM fuel cell catalysis,” Journal of Applied
Electrochemistry, vol. 36, no. 5, pp. 507–522, Mar. 2006.
[78] M. S. Saha, V. Neburchilov, D. Ghosh, and J. Zhang, “Nanomaterials-supported Pt catalysts for proton
exchange membrane fuel cells,” Wiley Interdisciplinary Reviews: Energy and Environment, vol. 2, no. 1,
pp. 31–51, Jan. 2013.
[79] X. Sun and M. S. Saha, “Nanotubes, Nanofibres and Nanowires as Supports for Catalysts,” in PEM Fuel
Cell Electrocatalysts and Catalyst Layers. Conventional Catalyst Ink, Catalyst Layer and MEA
Preparation, H. Zhang, X. Wang, J. Zhang, and J. Zhang, Eds. London: Springer-Verlag, 2008, pp. 655–
703.
[80] X. Wang, W. Li, Z. Chen, M. Waje, and Y. Yan, “Durability investigation of carbon nanotube as catalyst
support for proton exchange membrane fuel cell,” Journal of Power Sources, vol. 158, no. 1, pp. 154–
159, Jul. 2006.
[81] F. Hu and P. K. Shen, “Adwances of the Nanostructured Carbon-Based Catalyst for Low-Temperature
Fuel Cells,” in in Nanostructured and Advanced Materials for Fuel Cells, S. P. Jiang and P. K. Shen,
Eds. Boca Raton: CRC Press, 2014, pp. 223–248.
[82] Y. Shao, J. Liu, Y. Wang, and Y. Lin, “Novel catalyst support materials for PEM fuel cells: current
status and future prospects,” Journal of Materials Chemistry, vol. 19, no. 1, p. 46, 2009.
[83] S. Zhang, Y. Shao, G. Yin, and Y. Lin, “Recent progress in nanostructured electrocatalysts for PEM fuel
cells,” Journal of Materials Chemistry A, pp. 4631–4641, 2013.
[84] S. Park, Y. Shao, R. Kou, V. V. Viswanathan, S. a. Towne, P. C. Rieke, J. Liu, Y. Lin, and Y. Wang,
“Polarization Losses under Accelerated Stress Test Using Multiwalled Carbon Nanotube Supported Pt
Catalyst in PEM Fuel Cells,” Journal of The Electrochemical Society, vol. 158, no. 3, pp. B297–B302,
2011.
[85] S. Wang, S. P. Jiang, T. J. White, and X. Wang, “Synthesis of Pt and Pd nanosheaths on multi-walled
carbon nanotubes as potential electrocatalysts of low temperature fuel cells,” Electrochimica Acta, vol.
55, no. 26, pp. 7652–7658, Nov. 2010.
[86] X. Wang, M. Waje, and Y. Yan, “CNT-Based Electrodes with High Efficiency for PEMFCs,”
Electrochemical and Solid-State Letters, vol. 8, no. 1, p. A42, 2005.
[87] M. S. Saha, R. Li, and X. Sun, “High loading and monodispersed Pt nanoparticles on multiwalled carbon
nanotubes for high performance proton exchange membrane fuel cells,” Journal of Power Sources, vol.
177, no. 2, pp. 314–322, Mar. 2008.
[88] M. Pacurari, V. Castranova, and V. Vallyathan, “Single- and multi-wall carbon nanotubes versus
asbestos: are the carbon nanotubes a new health risk to humans?,” Journal of toxicology and
environmental health. Part A, vol. 73, no. 5, pp. 378–95, Jan. 2010.
[89] F. R. Colom, A. Sepulvedaescribano, “Heat-treated carbons-blacks as supports for platinum catalysts,”
Journal of Catalysis, vol. 154, no. 2, pp. 299–305, 1995.
[90] Y. Shao, G. Yin, and Y. Gao, “Understanding and approaches for the durability issues of Pt-based
catalysts for PEM fuel cell,” Journal of Power Sources, vol. 171, no. 2, pp. 558–566, Sep. 2007.
[91] D. Sebastián, M. J. Lázaro, I. Suelves, R. Moliner, V. Baglio, a. Stassi, and a. S. Aricò, “The influence of
carbon nanofiber support properties on the oxygen reduction behavior in proton conducting electrolyte-
based direct methanol fuel cells,” International Journal of Hydrogen Energy, vol. 37, no. 7, pp. 6253–
6260, Apr. 2012.

Chapter 1: Context and motivation
50
[92] C. a. Bessel, K. Laubernds, N. M. Rodriguez, and R. T. K. Baker, “Graphite Nanofibers as an Electrode
for Fuel Cell Applications,” The Journal of Physical Chemistry B, vol. 105, no. 6, pp. 1115–1118, Feb.
2001.
[93] I.-S. Park, K.-W. Park, J.-H. Choi, C. R. Park, and Y.-E. Sung, “Electrocatalytic enhancement of
methanol oxidation by graphite nanofibers with a high loading of PtRu alloy nanoparticles,” Carbon,
vol. 45, no. 1, pp. 28–33, Jan. 2007.
[94] S. L. Knupp, W. Li, O. Paschos, T. M. Murray, J. Snyder, and P. Haldar, “The effect of experimental
parameters on the synthesis of carbon nanotube/nanofiber supported platinum by polyol processing
techniques,” Carbon, vol. 46, no. 10, pp. 1276–1284, Aug. 2008.
[95] W. Li, M. Waje, Z. Chen, P. Larsen, and Y. Yan, “Platinum nanopaticles supported on stacked-cup
carbon nanofibers as electrocatalysts for proton exchange membrane fuel cell,” Carbon, vol. 48, no. 4,
pp. 995–1003, Apr. 2010.
[96] J. Wang and G. M. Swain, “Fabrication and Evaluation of Platinum/Diamond Composite Electrodes for
Electrocatalysis,” Journal of The Electrochemical Society, vol. 150, no. 1, p. E24, 2003.
[97] A. E. Fischer and G. M. Swain, “Preparation and Characterization of Boron-Doped Diamond Powder,”
Journal of The Electrochemical Society, vol. 152, no. 9, p. B369, 2005.
[98] A. Rabis, P. Rodriguez, and T. J. Schmidt, “Electrocatalysis for Polymer Electrolyte Fuel Cells: Recent
Achievements and Future Challenges,” ACS Catalysis, vol. 2, no. 5, pp. 864–890, May 2012.
[99] E. Antolini and E. R. Gonzalez, “Ceramic materials as supports for low-temperature fuel cell catalysts,”
Solid State Ionics, vol. 180, no. 9–10, pp. 746–763, May 2009.
[100] S. J. Tauster, “Strong metal-support interactions,” Accounts of Chemical Research, vol. 20, no. 11, pp.
389–394, Nov. 1987.
[101] J. Ma, A. Habrioux, and N. Alonso-Vante, “The Effect of Substrates at Cathodes in Low-temperature
Fuel Cells,” ChemElectroChem, vol. 1, no. 1, pp. 37–46, Jan. 2014.
[102] A. Lewera, L. Timperman, A. Roguska, and N. Alonso-vante, “Metal-Support Interactions between
Nanosized Pt and Metal Oxides (WO3 and TiO2) Studied Using X-ray Photoelectron Spectroscopy,” The
Journal of Physical Chemistry C, vol. 115, pp. 20153–20159, 2011.
[103] B. Ruiz Camacho, C. Morais, M. A. Valenzuela, and N. Alonso-Vante, “Enhancing oxygen reduction
reaction activity and stability of platinum via oxide-carbon composites,” Catalysis Today, vol. 202, pp.
36–43, Mar. 2013.
[104] H. Chhina, S. Campbell, and O. Kesler, “Thermal and electrochemical stability of tungsten carbide
catalyst supports,” Journal of Power Sources, vol. 164, no. 2, pp. 431–440, Feb. 2007.
[105] H. Chhina, S. Campbell, and O. Kesler, “High surface area synthesis, electrochemical activity, and
stability of tungsten carbide supported Pt during oxygen reduction in proton exchange membrane fuel
cells,” Journal of Power Sources, vol. 179, no. 1, pp. 50–59, Apr. 2008.
[106] J. Bernard d’Arbigny, G. Taillades, M. Marrony, D. J. Jones, and J. Rozière, “Hollow microspheres with
a tungsten carbide kernel for PEMFC application,” Chemical communications, vol. 47, no. 28, pp. 7950–
2, Jul. 2011.
[107] M. Nie, P. K. Shen, M. Wu, Z. Wei, and H. Meng, “A study of oxygen reduction on improved Pt-WC/C
electrocatalysts,” Journal of Power Sources, vol. 162, no. 1, pp. 173–176, Nov. 2006.
[108] J. Ma, A. Habrioux, and N. Alonso-Vante, “The Effect of Substrates at Cathodes in Low-temperature
Fuel Cells,” ChemElectroChem, vol. 1, no. 1, pp. 37–46, Jan. 2014.
[109] K. Sasaki, F. Takasaki, and Z. Noda, “Alternative Electrocatalyst Support Materials for Polymer
Electrolyte Fuel Cells Thermochemical stability of support materials,” ECS Transactions, vol. 33, no. 1,
pp. 473–482, 2010.
[110] F. Takasaki, S. Matsuie, Y. Takabatake, Z. Noda, A. Hayashi, Y. Shiratori, K. Ito, and K. Sasaki,
“Carbon-Free Pt Electrocatalysts Supported on SnO2 for Polymer Electrolyte Fuel Cells: Electrocatalytic
Activity and Durability,” Journal of The Electrochemical Society, vol. 158, no. 10, p. B1270, 2011.
[111] K. Kanda, Z. Noda, Y. Nagamatsu, T. Higashi, S. Taniguchi, S. M. Lyth, a. Hayashi, and K. Sasaki,
“Negligible Start-Stop-Cycle Degradation in a PEFC Utilizing Platinum-Decorated Tin Oxide
Electrocatalyst Layers with Carbon Fiber Filler,” ECS Electrochemistry Letters, vol. 3, no. 4, pp. F15–
F18, Feb. 2014.
[112] J. Xi, J. Wang, L. Yu, X. Qiu, and L. Chen, “Facile approach to enhance the Pt utilization and CO-
tolerance of Pt/C catalysts by physically mixing with transition-metal oxide nanoparticles.,” Chemical
communications, no. 16, pp. 1656–8, May 2007.
[113] J.-K. Oh, Y.-W. Lee, S.-B. Han, A.-R. Ko, D.-Y. Kim, H.-S. Kim, S.-J. Kim, B. Roh, I. Hwang, and K.-
W. Park, “3-Dimensional TiO2 nanostructure supports and their improved electrochemical properties in
methanol electrooxidation,” Catalysis Science & Technology, vol. 1, no. 3, p. 394, 2011.

Chapter 1: Context and motivation
51
[114] Z. Zhang, J. Liu, J. Gu, L. Su, and L. Cheng, “An Overview on Metal Oxide Materials as
Electrocatalysts and Supports for Polymer Electrolyte Fuel Cells,” Energy & Environmental Science,
pp. 1–95, 2014.
[115] P. J. Kulesza and B. Grzybowska, “Tungsten Oxides as Active Supports for Highly Dispersed Platinum
Microcenters: Electrocatalytic Reactivity Toward Reduction of Hydrogen Peroxide and Oxygen,”
J. Electrochem. Soc., vol. 144, no. 6, p. 1911, 1997.
[116] P. J. Kulesza and L. R. Faulkner, “Electrodeposition and Characterization of Three-Dimensional
Tungsten(VI, V)-Oxide Films Containing Spherical Pt Microparticles,” J. Electrochem. Soc., vol. 136,
no. 3, p. 707, 1989.
[117] P. J. Kulesza, B. Grzybowska, M. a Malik, M. Chojak, and K. Miecznikowski, “Oxidation of methanol
at an electrocatalytic film containing platinum and polynuclear oxocyanoruthenium microcenters
dispersed within tungsten oxide matrix,” Journal of Electroanalytical Chemistry, vol. 512, no. 1–2,
pp. 110–118, Oct. 2001.
[118] X. Chen and S. S. Mao, “Titanium dioxide nanomaterials: synthesis, properties, modifications, and
applications.,” Chemical reviews, vol. 107, no. 7, pp. 2891–959, Jul. 2007.
[119] A. Fujishima and K. Honda, “Electrochemical Photolysis of Water at a Semiconductor Electrode,”
Nature, vol. 238, pp. 37–38, 1972.
[120] Z. Weng, H. Guo, X. Liu, S. Wu, K. W. K. Yeung, and P. K. Chu, “Nanostructured TiO2 for energy
conversion and storage,” RSC Advances, vol. 3, no. 47, p. 24758, 2013.
[121] O. E. Haas, S. T. Briskeby, O. E. Kongstein, M. Tsypkin, and R. Tunold, “Synthesis and
Characterisation of RuxTix-1O2 as a Catalyst Support for Polymer Electrolyte Fuel Cell,” Journal of New
Materials for Elect rochemical Systems, vol. 11, pp. 9–14, 2008.
[122] A. Wang, H. Xu, Y. Lu, J. Hu, X. Kong, B. Tian, and H. Dong, “Synthesis and Characterization of
Ruthenium-Titanium Composite Oxide and a Platinum Catalyst Supported on It,” Chinese Journal of
Catalysis, vol. 30, no. 3, pp. 179–181, Mar. 2009.
[123] E. Valenzuela, V. Ramos-Sanchez, A. Adolfo, L. Arista, and O. Savadogo, “Nanostructured TiO2 Doped
with Nb as a Novel Support for PEMFC,” Journal of Materials, vol. 2013, pp. 1–7, 2013.
[124] K. A. Michalow, D. Flak, A. Heel, M. Parlinska-Wojtan, M. Rekas, and T. Graule, “Effect of Nb doping
on structural, optical and photocatalytic properties of flame-made TiO2 nanopowder,” Environmental
Science and Pollution Research, vol. 19, no. 9, pp. 3696–3708, 2012.
[125] A. M. Ruiz, G. Dezanneau, J. Arbiol, A. Cornet, and J. R. Morante, “Insights into the Structural and
Chemical Modifications of Nb Additive on TiO2 Nanoparticles,” Chemistry of Materials, vol. 16, no. 17,
pp. 862–871, 2004.
[126] Y.-J. Wang, D. P. Wilkinson, and J. Zhang, “Synthesis of conductive rutile-phased Nb0.06Ti0.94O2 and its
supported Pt electrocatalysts (Pt/Nb0.06Ti0.94O2) for the oxygen reduction reaction,” Dalton transactions,
vol. 41, no. 4, pp. 1187–94, Jan. 2012.
[127] Y.-J. Wang, D. P. Wilkinson, A. Guest, V. Neburchilov, R. Baker, F. Nan, G. a. Botton, and J. Zhang,
“Synthesis of Pd and Nb–doped TiO2 composite supports and their corresponding Pt–Pd alloy catalysts
by a two-step procedure for the oxygen reduction reaction,” Journal of Power Sources, vol. 221, pp.
232–241, Jan. 2013.
[128] G. Chen, S. R. Bare, and T. E. Mallouk, “Development of Supported Bifunctional Electrocatalysts for
Unitized Regenerative Fuel Cells,” Journal of The Electrochemical Society, vol. 149, no. 8, p. A1092,
2002.
[129] F. C. Walsh and R. G. a. Wills, “The continuing development of Magnéli phase titanium sub-oxides and
Ebonex® electrodes,” Electrochimica Acta, vol. 55, no. 22, pp. 6342–6351, Sep. 2010.
[130] T. Ioroi, Z. Siroma, N. Fujiwara, S. Yamazaki, and K. Yasuda, “Sub-stoichiometric titanium oxide-
supported platinum electrocatalyst for polymer electrolyte fuel cells,” Electrochemistry
Communications, vol. 7, no. 2, pp. 183–188, Feb. 2005.
[131] T. Ioroi, H. Kageyama, T. Akita, and K. Yasuda, “Formation of electro-conductive titanium oxide fine
particles by pulsed UV laser irradiation.,” Physical chemistry chemical physics: PCCP, vol. 12, no. 27,
pp. 7529–35, Jul. 2010.
[132] T. Ioroi, T. Akita, S. Yamazaki, Z. Siroma, N. Fujiwara, and K. Yasuda, “Corrosion-Resistant PEMFC
Cathode Catalysts Based on a Magnéli-Phase Titanium Oxide Support Synthesized by Pulsed UV Laser
Irradiation,” Journal of The Electrochemical Society, vol. 158, no. 10, p. C329, 2011.
[133] T. Ioroi, T. Akita, M. Asahi, S. Yamazaki, Z. Siroma, N. Fujiwara, and K. Yasuda, “Platinum–titanium
alloy catalysts on a Magnéli-phase titanium oxide support for improved durability in Polymer Electrolyte
Fuel Cells,” Journal of Power Sources, vol. 223, pp. 183–189, Feb. 2013.
[134] K.-W. Park and K.-S. Seol, “Nb-TiO2 supported Pt cathode catalyst for polymer electrolyte membrane
fuel cells,” Electrochemistry Communications, vol. 9, no. 9, pp. 2256–2260, Sep. 2007.

Chapter 1: Context and motivation
52
[135] H. Chhina, S. Campbell, and O. Kesler, “Ex Situ and In Situ Stability of Platinum Supported on
Niobium-Doped Titania for PEMFCs,” Journal of The Electrochemical Society, vol. 156, no. 10, p.
B1232, 2009.
[136] S.-Y. Huang, P. Ganesan, and B. N. Popov, “Electrocatalytic activity and stability of niobium-doped
titanium oxide supported platinum catalyst for polymer electrolyte membrane fuel cells,” Applied
Catalysis B: Environmental, vol. 96, no. 1–2, pp. 224–231, Apr. 2010.
[137] D. V. Bavykin, J. M. Friedrich, and F. C. Walsh, “Protonated Titanates and TiO2 Nanostructured
Materials: Synthesis, Properties, and Applications,” Advanced Materials, vol. 18, no. 21, pp. 2807–2824,
Nov. 2006.
[138] M. Wang, D. Guo, and H. Li, “High activity of novel Pd/TiO2 nanotube catalysts for methanol electro-
oxidation,” Journal of Solid State Chemistry, vol. 178, no. 6, pp. 1996–2000, Jun. 2005.
[139] J. M. Macak, P. J. Barczuk, H. Tsuchiya, M. Z. Nowakowska, a. Ghicov, M. Chojak, S. Bauer, S.
Virtanen, P. J. Kulesza, and P. Schmuki, “Self-organized nanotubular TiO2 matrix as support for
dispersed Pt/Ru nanoparticles: Enhancement of the electrocatalytic oxidation of methanol,”
Electrochemistry Communications, vol. 7, no. 12, pp. 1417–1422, Dec. 2005.
[140] S. H. Kang, T.-Y. Jeon, H.-S. Kim, Y.-E. Sung, and W. H. Smyrl, “Effect of Annealing PtNi
Nanophases on Extended TiO2 Nanotubes for the Electrochemical Oxygen Reduction Reaction,” Journal
of The Electrochemical Society, vol. 155, no. 10, p. B1058, 2008.
[141] S. H. Kang, Y.-E. Sung, and W. H. Smyrl, “The Effectiveness of Sputtered PtCo Catalysts on TiO2
Nanotube Arrays for the Oxygen Reduction Reaction,” Journal of The Electrochemical Society, vol. 155,
no. 11, p. B1128, 2008.
[142] C. Zhang, H. Yu, Y. Li, L. Fu, Y. Gao, W. Song, Z. Shao, and B. Yi, “Highly stable ternary tin-
palladium-platinum catalysts supported on hydrogenated TiO2 nanotube arrays for fuel cells.,”
Nanoscale, vol. 5, no. 15, pp. 6834–41, Aug. 2013.
[143] C. Zhang, H. Yu, Y. Li, W. Song, B. Yi, and Z. Shao, “Preparation of Pt catalysts decorated TiO2
nanotube arrays by redox replacement of Ni precursors for proton exchange membrane fuel cells,”
Electrochimica Acta, vol. 80, pp. 1–6, Oct. 2012.
[144] S.-Y. Huang, P. Ganesan, and B. N. Popov, “Development of Novel Metal Oxide Supported Pt catalysts
for Polymer Electrolyte Membrane and Unitized Regenerative Fuel Cells Applications,” ECS
Transactions, vol. 25, no. 1, pp. 1893–1902, 2009.
[145] S.-Y. Huang, P. Ganesan, and B. N. Popov, “Titania supported platinum catalyst with high
electrocatalytic activity and stability for polymer electrolyte membrane fuel cell,” Applied Catalysis B:
Environmental, vol. 102, no. 1–2, pp. 71–77, Feb. 2011.
[146] S.-Y. Huang, P. Ganesan, and B. N. Popov, “Electrocatalytic Activity and Stability of Titania-Supported
Platinum–Palladium Electrocatalysts for Polymer Electrolyte Membrane Fuel Cell,” ACS Catalysis, vol.
2, no. 5, pp. 825–831, May 2012.
[147] S. Siracusano, a. Stassi, E. Modica, V. Baglio, and a. S. Aricò, “Preparation and characterisation of Ti
oxide based catalyst supports for low temperature fuel cells,” International Journal of Hydrogen Energy,
vol. 38, no. 26, pp. 11600–11608, Aug. 2013.
[148] A. Stassi, I. Gatto, V. Baglio, E. Passalacqua, and A. S. Aricò, “Oxide-supported PtCo alloy catalyst for
intermediate temperature polymer electrolyte fuel cells,” Applied Catalysis B: Environmental, vol. 142–
143, pp. 15–24, Oct. 2013.
[149] A. Bauer, L. Chevallier, R. Hui, S. Cavaliere, J. Zhang, D. Jones, and J. Rozière, “Synthesis and
characterization of Nb-TiO2 mesoporous microsphere and nanofiber supported Pt catalysts for high
temperature PEM fuel cells,” Electrochimica Acta, vol. 77, pp. 1–7, Aug. 2012.
[150] L. Chevallier, A. Bauer, S. Cavaliere, R. Hui, J. Rozière, and D. J. Jones, “Mesoporous nanostructured
Nb-doped titanium dioxide microsphere catalyst supports for PEM fuel cell electrodes.,” ACS applied
materials & interfaces, vol. 4, no. 3, pp. 1752–9, Mar. 2012.
[151] I. Cerri, T. Nagami, J. Davies, C. Mormiche, A. Vecoven, and B. Hayden, “Innovative catalyst supports
to address fuel cell stack durability,” International Journal of Hydrogen Energy, vol. 38, no. 1, pp. 640–
645, Jan. 2013.
[152] M. Batzill and U. Diebold, “The surface and materials science of tin oxide,” Progress in Surface
Science, vol. 79, no. 2–4, pp. 47–154, 2005.
[153] A. C. Tseung and S. C. Dhara, “Loss of surface area by platinum and supported platinum black
electrocatalyst,” Electrochimica Acta, vol. 20, no. 9, pp. 681–683, 1975.
[154] M. Watanabe, S. Venkatesan, and H. A. Laitinen, “Preparation of Dispersed Platinum on Conductive Tin
Oxide and Its Catalytic Activity for Oxygen Reduction,” Journal of Electrochemical Society, vol. 130,
no. 1, pp. 59–64, 1983.
Chapter 1: Context and motivation
53
[155] W. S. Baker, J. J. Pietron, M. E. Teliska, P. J. Bouwman, D. E. Ramaker, and K. E. Swider-Lyons,
“Enhanced Oxygen Reduction Activity in Acid by Tin-Oxide Supported Au Nanoparticle Catalysts,”
Journal of The Electrochemical Society, vol. 153, no. 9, p. A1702, 2006.
[156] P. Zhang, S.-Y. Huang, and B. N. Popov, “Mesoporous Tin Oxide as an Oxidation-Resistant Catalyst
Support for Proton Exchange Membrane Fuel Cells,” Journal of The Electrochemical Society, vol. 157,
no. 8, p. B1163, 2010.
[157] H. Lu, Y. Fan, P. Huang, and D. Xu, “SnO2 nanospheres supported Pd catalyst with enhanced
performance for formic acid oxidation,” Journal of Power Sources, vol. 215, pp. 48–52, Oct. 2012.
[158] L. A. Frolova, Y. A. Dobrovolsky, and N. G. Bukun, “Oxide supported platinum electrocatalysts for
hydrogen and alcohol fuel cells,” Russian Journal of Electrochemistry, vol. 47, no. 6, pp. 697–708, Jun.
2011.
[159] Y. Fan, J. Liu, H. Lu, P. Huang, and D. Xu, “Hierarchical structure SnO2 supported Pt nanoparticles as
enhanced electrocatalyst for methanol oxidation,” Electrochimica Acta, vol. 76, pp. 475–479, Aug. 2012.
[160] H. Zhang, C. Hu, X. He, L. Hong, G. Du, and Y. Zhang, “Pt support of multidimensional active sites and
radial channels formed by SnO2 flower-like crystals for methanol and ethanol oxidation,” Journal of
Power Sources, vol. 196, no. 10, pp. 4499–4505, May 2011.
[161] T. Okanishi, T. Matsui, T. Takeguchi, R. Kikuchi, and K. Eguchi, “Chemical interaction between Pt and
SnO and influence on adsorptive properties of carbon monoxide,” Applied Catalysis A: General, vol.
298, pp. 181–187, Jan. 2006.
[162] I. Saadeddin, B. Pecquenard, J. P. Manaud, R. Decourt, C. Labrugère, T. Buffeteau, and G. Campet,
“Synthesis and characterization of single- and co-doped SnO2 thin films for optoelectronic applications,”
Applied Surface Science, vol. 253, no. 12, pp. 5240–5249, Apr. 2007.
[163] K. Lee, I. Park, Y. Cho, D. Jung, N. Jung, H. Park, and Y. Sung, “Electrocatalytic activity and stability
of Pt supported on Sb-doped SnO2 nanoparticles for direct alcohol fuel cells,” Journal of Catalysis, vol.
258, no. 1, pp. 143–152, Aug. 2008.
[164] D. J. You, K. Kwon, C. Pak, and H. Chang, “Platinum–antimony tin oxide nanoparticle as cathode
catalyst for direct methanol fuel cell,” Catalysis Today, vol. 146, no. 1–2, pp. 15–19, Aug. 2009.
[165] M. Yin, J. Xu, Q. Li, J. O. Jensen, Y. Huang, L. N. Cleemann, N. J. Bjerrum, and W. Xing, “Highly
active and stable Pt electrocatalysts promoted by antimony-doped SnO2 supports for oxygen reduction
reactions,” Applied Catalysis B: Environmental, vol. 144, pp. 112–120, Jan. 2014.
[166] J.-M. Lee, S.-B. Han, Y.-W. Lee, Y.-J. Song, J.-Y. Kim, and K.-W. Park, “RuO2–SnO2 nanocomposite
electrodes for methanol electrooxidation,” Journal of Alloys and Compounds, vol. 506, no. 1, pp. 57–62,
Sep. 2010.
[167] H. L. Pang, X. H. Zhang, X. X. Zhong, B. Liu, X. G. Wei, Y. F. Kuang, and J. H. Chen, “Preparation of
Ru-doped SnO2-supported Pt catalysts and their electrocatalytic properties for methanol oxidation.,”
Journal of colloid and interface science, vol. 319, no. 1, pp. 193–8, Mar. 2008.
[168] N. R. Elezovic, B. M. Babic, V. R. Radmilovic, and N. V. Krstajic, “Synthesis and Characterization of Pt
Catalysts on SnO2 Based Supports for Oxygen Reduction Reaction,” Journal of the Electrochemical
Society, vol. 160, no. 10, pp. F1151–F1158, Sep. 2013.
[169] T. Higashi, Z. Noda, A. Hayashi, and K. Sasaki, “Pulse Laser Deposition and Sputtering of Carbon-free
Pt/SnO2 Electrocatalysts for PEFC,” ECS Transactions, vol. 58, no. 1, pp. 1293–1299, 2013.
[170] M. Saha, Sudan, R. Li, M. Cai, and X. Sun, “High Electrocatalytic Activity of Platinum Nanoparticles on
SnO2 Nanowire-Based Electrodes,” Electrochemical and Solid-State Letters, vol. 10, no. 8, p. B130,
2007.
[171] M. S. Saha, R. Li, and X. Sun, “Composite of Pt–Ru supported SnO2 nanowires grown on carbon paper
for electrocatalytic oxidation of methanol,” Electrochemistry Communications, vol. 9, no. 9, pp. 2229–
2234, Sep. 2007.
[172] M. Dou, M. Hou, D. Liang, W. Lu, Z. Shao, and B. Yi, “SnO2 nanocluster supported Pt catalyst with
high stability for proton exchange membrane fuel cells,” Electrochimica Acta, vol. 92, pp. 468–473,
Mar. 2013.
[173] M. P. Gurrola, M. Guerra-Balcázar, L. Álvarez-Contreras, R. Nava, J. Ledesma-García, and L. G.
Arriaga, “High surface electrochemical support based on Sb-doped SnO2,” Journal of Power Sources,
vol. 243, pp. 826–830, Dec. 2013.
[174] Y. Takabatake, Z. Noda, S. M. Lyth, a. Hayashi, and K. Sasaki, “Cycle durability of metal oxide
supports for PEFC electrocatalysts,” International Journal of Hydrogen Energy, pp. 1–9, Feb. 2014.
[175] A. Masao, S. Noda, F. Takasaki, K. Ito, and K. Sasaki, “Carbon-Free Pt Electrocatalysts Supported on
SnO2 for Polymer Electrolyte Fuel Cells,” Electrochemical and Solid-State Letters, vol. 12, no. 9, p.
B119, 2009.

Chapter 1: Context and motivation
54
[176] F. Takasaki, Z. Noda, A. Masao, Y. Shiratori, K. Ito, and K. Sasaki, “Carbon-free Pt Electrocatalysts
Supported on Doped SnO2 for Polymer Electrolyte Fuel Cells,” ECS Transactions, vol. 25, no. 1, pp.
831–837, 2009.
[177] K. Kakinuma, M. Uchida, T. Kamino, H. Uchida, and M. Watanabe, “Synthesis and electrochemical
characterization of Pt catalyst supported on Sn0.96Sb0.04O2−δ with a network structure,” Electrochimica
Acta, vol. 56, no. 7, pp. 2881–2887, Feb. 2011.
[178] K. Kakinuma, Y. Chino, Y. Senoo, M. Uchida, T. Kamino, H. Uchida, S. Deki, and M. Watanabe,
“Characterization of Pt catalysts on Nb-doped and Sb-doped SnO2–δ support materials with aggregated
structure by rotating disk electrode and fuel cell measurements,” Electrochimica Acta, vol. 110, pp. 316–
324, Nov. 2013.
[179] A. Rabis, E. Fabbri, A. Foelske, M. Horisberger, R. Kötz, and T. J. Schmidt, “Durable Oxide-based
Catalysts for Application as Cathode Materials in Polymer Electrolyte Fuel Cells (PEFCs) A. Rabis,”
ECS Transactions, vol. 50, no. 36, pp. 9–17, 2013.
[180] M. K. Debe, A. K. Schmoeckel, S. M. Hendricks, G. D. Vernstrom, G. M. Haugen, R. T. Atanasoski,
and R. T., “Durability Aspects of Nanostructured Thin Film,” ECS Transactions, vol. 1, no. 8, pp. 51–
66, 2006.
[181] M. K. Debe, A. K. Schmoeckel, G. D. Vernstrom, and R. Atanasoski, “High voltage stability of
nanostructured thin film catalysts for PEM fuel cells,” Journal of Power Sources, vol. 161, no. 2, pp.
1002–1011, Oct. 2006.
[182] M. K. Debe, A. J. Steinbach, G. D. Vernstrom, S. M. Hendricks, M. J. Kurkowski, R. T. Atanasoski, P.
Kadera, D. A. Stevens, R. J. Sanderson, E. Marvel, and J. R. Dahn, “Extraordinary Oxygen Reduction
Activity of Pt3Ni7,” Journal of The Electrochemical Society, vol. 158, no. 8, p. B910, 2011.
[183] M. K. Debe, “Nanostructured Thin Film Electrocatalysts for PEM Fuel Cells – A Tutorial on the
Fundamental Characteristics and Prac tical Properties of NSTF Catalysts,” ECS Transactions, vol. 45,
no. 2, pp. 47–68, 2012.
[184] G. Shen, P.-C. Chen, K. Ryu, and C. Zhou, “Devices and chemical sensing applications of metal oxide
nanowires,” Journal of Materials Chemistry, vol. 19, no. 7, p. 828, 2009.
[185] D. Li, J. T. McCann, Y. Xia, and M. Marquez, “Electrospinning: A Simple and Versatile Technique for
Producing Ceramic Nanofibers and Nanotubes,” Journal of the American Ceramic Society, vol. 89, no.
6, pp. 1861–1869, Jun. 2006.
[186] W.-E. Teo, R. Inai, and S. Ramakrishna, “Technological advances in electrospinning of nanofibers,”
Science and Technology of Advanced Materials, vol. 12, no. 1, p. 013002, Feb. 2011.
[187] J. F. Cooley, “Apparatus for electrically dispersing fluids,” 1902.
[188] J. Zeleny, “The Electrical Discharge from Liquid Points, and a Hydrostatic Method of Measuring the
Electric Intensity at their Surfaces,” Physical Review, vol. 3, pp. 69–91, 1914.
[189] A. Formhals, “Process and apparatus for preparing artificial threads,” 1934.
[190] J. Doshi and D. H. Reneker, “Electrospinning Process and Applications of Electrospun Fibers,” Journal
of Electrostatics, vol. 35, pp. 151–160, 1995.
[191] S. Cavaliere, S. Subianto, I. Savych, D. J. Jones, and J. Rozière, “Electrospinning: designed architectures
for energy conversion and storage devices,” Energy & Environmental Science, vol. 4, pp. 4761–4785,
2011.
[192] H. Fong, I. Chun, and D. H. Reneker, “Beaded nanofibers formed during electrospinning,” Polymer, vol.
40, no. 16, pp. 4585–4592, Jul. 1999.
[193] J. H. Wendorff, S. Agarwal, and A. Greiner, Eds., Electrospinning. Materials, Processing and
Applications. Weinheim: John Wiley and Sons, 2012, pp. 1 – 241.
[194] S. Ramakrishna, K. Fujihara, W.-E. Teo, T.-C. Lim, and Z. Ma, Eds., An Introduction to Electrospinning
and Nanofibers. Singapore: World Scientific Publishing, 2005, pp. 1 – 380.
[195] R. Barhate and S. Ramakrishna, “Nanofibrous filtering media: Filtration problems and solutions from
tiny materials,” Journal of Membrane Science, vol. 296, no. 1–2, pp. 1–8, Jun. 2007.
[196] W. Cui, Y. Zhou, and J. Chang, “Electrospun nanofibrous materials for tissue engineering and drug
delivery,” Science and Technology of Advanced Materials, vol. 11, no. 1, p. 014108, Feb. 2010.
[197] Y. Ding, Y. Wang, L. Zhang, H. Zhang, C. M. Li, and Y. Lei, “Preparation of TiO2-Pt hybrid nanofibers
and their application for sensitive hydrazine detection.,” Nanoscale, vol. 3, no. 3, pp. 1149–57, Mar.
2011.
[198] Z. Dong, S. J. Kennedy, and Y. Wu, “Electrospinning materials for energy-related applications and
devices,” Journal of Power Sources, vol. 196, no. 11, pp. 4886–4904, Jun. 2011.
[199] V. Thavasi, G. Singh, and S. Ramakrishna, “Electrospun nanofibers in energy and environmental
applications,” Energy & Environmental Science, vol. 1, no. 2, p. 205, 2008.

Chapter 1: Context and motivation
55
[200] C.-K. Liu, K. Lai, W. Liu, M. Yao, and R.-J. Sun, “Preparation of carbon nanofibres through
electrospinning and thermal treatment,” Polymer International, vol. 58, no. 12, pp. 1341–1349, Dec.
2009.
[201] M. Inagaki, Y. Yang, and F. Kang, “Carbon nanofibers prepared via electrospinning.,” Advanced
materials, vol. 24, no. 19, pp. 2547–66, May 2012.
[202] S. K. Nataraj, K. S. Yang, and T. M. Aminabhavi, “Polyacrylonitrile-based nanofibers—A state-of-the-
art review,” Progress in Polymer Science, vol. 37, no. 3, pp. 487–513, Mar. 2012.
[203] I. S. Chronakis, “Novel nanocomposites and nanoceramics based on polymer nanofibers using
electrospinning process—A review,” Journal of Materials Processing Technology, vol. 167, no. 2–3, pp.
283–293, Aug. 2005.
[204] L. Zhang, A. Aboagye, A. Kelkar, C. Lai, and H. Fong, “A review: carbon nanofibers from electrospun
polyacrylonitrile and their applications,” Journal of Materials Science, vol. 49, no. 2, pp. 463–480, Sep.
2014.
[205] N. Yusof and a. F. Ismail, “Post spinning and pyrolysis processes of polyacrylonitrile (PAN)-based
carbon fiber and activated carbon fiber: A review,” Journal of Analytical and Applied Pyrolysis, vol. 93,
pp. 1–13, Jan. 2012.
[206] M. S. a. Rahaman, a. F. Ismail, and a. Mustafa, “A review of heat treatment on polyacrylonitrile fiber,”
Polymer Degradation and Stability, vol. 92, no. 8, pp. 1421–1432, Aug. 2007.
[207] Y. Wang and J. J. Santiago-aviles, “Magnetoconductance , carrier concentration and mobility
measurement in electrospun carbon nanofibers,” Carbon, vol. 41, pp. 2665–2667, 2003.
[208] F. Agend, N. Naderi, and R. Fareghi-alamdari, “Fabrication and Electrical Characterization of
Electrospun Polyacrylonitrile-Derived Carbon Nanofibers,” Journal of Applied Polymer Science, vol.
106, pp. 255–259, 2007.
[209] J. Huang, H. Hou, and T. You, “Highly efficient electrocatalytic oxidation of formic acid by electrospun
carbon nanofiber-supported PtxAu100−x bimetallic electrocatalyst,” Electrochemistry Communications,
vol. 11, no. 6, pp. 1281–1284, Jun. 2009.
[210] Z. Lin, L. Ji, and X. Zhang, “Electrocatalytic properties of Pt/carbon composite nanofibers,”
Electrochimica Acta, vol. 54, no. 27, pp. 7042–7047, Nov. 2009.
[211] Z. Lin, L. Ji, W. E. Krause, and X. Zhang, “Synthesis and electrocatalysis of 1-aminopyrene-
functionalized carbon nanofiber-supported platinum–ruthenium nanoparticles,” Journal of Power
Sources, vol. 195, no. 17, pp. 5520–5526, Sep. 2010.
[212] M. Li, G. Han, and B. Yang, “Fabrication of the catalytic electrodes for methanol oxidation on
electrospinning-derived carbon fibrous mats,” Electrochemistry Communications, vol. 10, no. 6, pp.
880–883, Jun. 2008.
[213] M. Li, S. Zhao, G. Han, and B. Yang, “Electrospinning-derived carbon fibrous mats improving the
performance of commercial Pt/C for methanol oxidation,” Journal of Power Sources, vol. 191, no. 2, pp.
351–356, Jun. 2009.
[214] X. Liu, M. Li, G. Han, and J. Dong, “The catalysts supported on metallized electrospun polyacrylonitrile
fibrous mats for methanol oxidation,” Electrochimica Acta, vol. 55, no. 8, pp. 2983–2990, Mar. 2010.
[215] Y. Chang, G. Han, M. Li, and F. Gao, “Graphene-modified carbon fiber mats used to improve the
activity and stability of Pt catalyst for methanol electrochemical oxidation,” Carbon, vol. 49, no. 15, pp.
5158–5165, Dec. 2011.
[216] J.-H. Park, Y.-W. Ju, S.-H. Park, H.-R. Jung, K.-S. Yang, and W.-J. Lee, “Effects of electrospun
polyacrylonitrile-based carbon nanofibers as catalyst support in PEMFC,” Journal of Applied
Electrochemistry, vol. 39, no. 8, pp. 1229–1236, Jan. 2009.
[217] R. Padmavathi and D. Sangeetha, “Synthesis and characterization of electrospun carbon nanofiber
supported Pt catalyst for fuel cells,” Electrochimica Acta, vol. 112, pp. 1–13, Dec. 2013.
[218] M. Li, Y. Chang, G. Han, and B. Yang, “Platinum nanoparticles supported on electrospinning-derived
carbon fibrous mats by using formaldehyde vapor as reducer for methanol electrooxidation,” Journal of
Power Sources, vol. 196, no. 19, pp. 7973–7978, Oct. 2011.
[219] G.-H. An and H.-J. Ahn, “Pt electrocatalyst-loaded carbon nanofibre–Ru core–shell supports for
improved methanol electrooxidation,” Journal of Electroanalytical Chemistry, vol. 707, pp. 74–77, Oct.
2013.
[220] G. Zhang, W. Kataphinan, R. Teye-Mensah, P. Katta, L. Khatri, E. a. Evans, G. G. Chase, R. D.
Ramsier, and D. H. Reneker, “Electrospun nanofibers for potential space-based applications,” Materials
Science and Engineering: B, vol. 116, no. 3, pp. 353–358, Feb. 2005.
[221] H. Wu, W. Pan, D. Lin, and H. Li, “Electrospinning of ceramic nanofibers: Fabrication, assembly and
applications,” Journal of Advanced Ceramics, vol. 1, no. 1, pp. 2–23, Jun. 2012.
[222] D. Li and Y. Xia, “Direct Fabrication of Composite and Ceramic Hollow Nanofibers by
Electrospinning,” Nano Letters, vol. 4, no. 5, pp. 933–938, May 2004.

Chapter 1: Context and motivation
56
[223] J. T. McCann, D. Li, and Y. Xia, “Electrospinning of nanofibers with core-sheath, hollow, or porous
structures,” Journal of Materials Chemistry, vol. 15, no. 7, p. 735, 2005.
[224] Y. Zhao, X. Cao, and L. Jiang, “Bio-mimic multichannel microtubes by a facile method.,” Journal of the
American Chemical Society, vol. 129, no. 4, pp. 764–5, Jan. 2007.
[225] S. Madhugiri, B. Sun, P. G. Smirniotis, J. P. Ferraris, and K. J. Balkus, “Electrospun mesoporous
titanium dioxide fibers,” Microporous and Mesoporous Materials, vol. 69, no. 1–2, pp. 77–83, Apr.
2004.
[226] M. Fehse, S. Cavaliere, P. E. Lippens, I. Savych, A. Iadecola, L. Monconduit, D. J. Jones, J. Rozie, F.
Fischer, C. Tessier, L. Stievano, D. De Recherche, and B. A. Daney, “Nb-Doped TiO2 Nanofibers for
Lithium Ion Batteries,” J. Phys. Chem. C, vol. 117, p. 13827 − 13835, 2013.
[227] T. G. Deepak, A. Gs, S. Thomas, A. T. A, S. V Nair, and S. Nair, “A Review on Materials for Light
Scattering in Dye-sensitized Solar Cells,” RSC Advances, vol. 4, pp. 17615–17638, 2014.
[228] Q. Long, M. Cai, J. Li, H. Rong, and L. Jiang, “Improving the electrical catalytic activity of Pt/TiO2
nanocomposites by a combination of electrospinning and microwave irradiation,” Journal of
Nanoparticle Research, vol. 13, no. 4, pp. 1655–1662, Apr. 2010.
[229] A. Bauer, K. Lee, C. Song, Y. Xie, J. Zhang, and R. Hui, “Pt nanoparticles deposited on TiO2 based
nanofibers: Electrochemical stability and oxygen reduction activity,” Journal of Power Sources, vol.
195, no. 10, pp. 3105–3110, May 2010.
[230] Q. Du, J. Wu, and H. Yang, “Pt@Nb-TiO2 Catalyst Membranes Fabricated by Electrospinning and
Atomic Layer Deposition,” ACS Catalysis, vol. 4, pp. 144–151, 2014.
[231] K. Senevirathne, R. Hui, S. Campbell, S. Ye, and J. Zhang, “Electrocatalytic activity and durability of
Pt/NbO2 and Pt/Ti4O7 nanofibers for PEM fuel cell oxygen reduction reaction,” Electrochimica Acta,
vol. 59, pp. 538–547, Jan. 2012.
[232] M. A. Abdelkareem, Y. Ito, T. Tsujiguchi, and N. Nakagawa, “Carbon-TiO2 Composite Nanofibers as a
Promising Support for PtRu Anode Catalyst of DMFC,” ECS Transactions, vol. 50, no. 2, pp. 1959–
1967, 2012.
[233] E. Formo, Z. Peng, E. Lee, X. Lu, H. Yang, and Y. Xia, “Direct Oxidation of Methanol on Pt
Nanostructures Supported on Electrospun Nanofibers of Anatase,” The Journal of Physical Chemistry C,
vol. 112, no. 27, pp. 9970–9975, Jul. 2008.
[234] E. Formo, E. Lee, D. Campbell, Y. Xia, B. Engineering, W. U. V, and S. Louis, “Functionalization of
Electrospun TiO2 Nanofibers with Pt Nanoparticles and Nanowires for Catalytic Applications,” Nano
letters, vol. 8, pp. 668–672, 2008.
[235] J. Wu, D. Zeng, and S. Zhang, “Mesoporous Al-doped SnO2 nanotubes with enhanced gas-sensing
properties fabricated by electrospinning,” in AMA Conferences - Sensor Materials, 2013, pp. 257–262.
[236] L. Li, X. Yin, S. Liu, Y. Wang, L. Chen, and T. Wang, “Electrospun porous SnO2 nanotubes as high
capacity anode materials for lithium ion batteries,” Electrochemistry Communications, vol. 12, no. 10,
pp. 1383–1386, Oct. 2010.
[237] C. Gao, X. Li, B. Lu, L. Chen, Y. Wang, F. Teng, J. Wang, Z. Zhang, X. Pan, and E. Xie, “A facile
method to prepare SnO2 nanotubes for use in efficient SnO2-TiO2 core-shell dye-sensitized solar cells,”
Nanoscale, vol. 4, no. 11, pp. 3475–81, Jun. 2012.
[238] Y. S. Kim, H. S. Jang, and W. B. Kim, “An efficient composite hybrid catalyst fashioned from Pt
nanoparticles and Sb-doped SnO2 nanowires for alcohol electro-oxidation,” Journal of Materials
Chemistry, vol. 20, no. 36, p. 7859, 2010.
[239] A. B. Suryamas, G. M. Anilkumar, S. Sago, T. Ogi, and K. Okuyama, “Electrospun Pt/SnO2 nanofibers
as an excellent electrocatalysts for hydrogen oxidation reaction with ORR-blocking characteristic,”
Catalysis Communications, vol. 33, pp. 11–14, Mar. 2013.
[240] S. Sago, A. B. Suryamas, G. M. Anilkumar, T. Ogi, and K. Okuyama, “In situ growth of Pt nanoparticles
on electrospun SnO2 fibers for anode electrocatalyst application,” Materials Letters, vol. 105, pp. 202–
205, Aug. 2013.
[241] J. Zhang, M. B. Vukmirovic, K. Sasaki, A. U. Nilekar, M. Mavrikakis, and R. R. Adzic, “Mixed-metal pt
monolayer electrocatalysts for enhanced oxygen reduction kinetics.,” Journal of the American Chemical
Society, vol. 127, no. 36, pp. 12480–1, Sep. 2005.
[242] K.-Y. Chan, J. Ding, J. Ren, S. Cheng, and K. Y. Tsang, “Supported mixed metal nanoparticles as
electrocatalysts in low temperature fuel cells,” Journal of Materials Chemistry, vol. 14, no. 4, p. 505,
2004.
[243] E. Antolini, “Formation , microstructural characteristics and stability of carbon supported platinum
catalysts for low temperature fuel cells,” Journal of Materials Science, vol. 38, pp. 2995–3005, 2003.
[244] C. Coutanceau, S. Brimaud, C. Lamy, J.-M. Léger, L. Dubau, S. Rousseau, and F. Vigier, “Review of
different methods for developing nanoelectrocatalysts for the oxidation of organic compounds,”
Electrochimica Acta, vol. 53, no. 23, pp. 6865–6880, Oct. 2008.

Chapter 1: Context and motivation
57
[245] A. Esmaeilifar, S. Rowshanzamir, M. H. Eikani, and E. Ghazanfari, “Synthesis methods of low-Pt-
loading electrocatalysts for proton exchange membrane fuel cell systems,” Energy, vol. 35, no. 9, pp.
3941–3957, Sep. 2010.
[246] H. Bönnemann, R. Brinkmann, P. Britz, U. Endruschat, R. Mörtel, U. A. Paulus, T. J. Schmidt, H. A.
Gasteiger, and R. J. Behm, “Nanoscopic Pt-bimetal colloids as precursors for PEM fuel cell catalysts,”
Journal of New Materials for Electrochemical Systems, vol. 206, pp. 199–206, 2000.
[247] P. Boutonnet, M; Kizling, J; Stenius, “The preparation of monodisperse colloidal metal particles from
microemulions,” Colloids and Surfaces, vol. 5, no. 3, pp. 209–225, 1982.
[248] F. Fievet, J. P. Lagier, and B. Blin, “Homogeneous and heterogeneous nucleations in the polyol process
for the preparation of micron and submicron size metal particles,” Solid State Ionics, vol. 32–33, no. Part
1, pp. 195–205, 1989.
[249] G. Viau, P. Toneguzzo, A. Pierrard, O. Acher, and F. Fie, “Heterogeneuos Nucleation and Growth of
Metalnanoparticles in Polyols,” Scripta materialia, vol. 44, pp. 2263–2267, 2001.
[250] C. Bock, C. Paquet, M. Couillard, G. a Botton, and B. R. MacDougall, “Size-selected synthesis of PtRu
nano-catalysts: reaction and size control mechanism,” Journal of the American Chemical Society, vol.
126, no. 25, pp. 8028–37, Jun. 2004.
[251] H.-S. Oh, J.-G. Oh, Y.-G. Hong, and H. Kim, “Investigation of carbon-supported Pt nanocatalyst
preparation by the polyol process for fuel cell applications,” Electrochimica Acta, vol. 52, no. 25, pp.
7278–7285, Sep. 2007.
[252] M. Tsuji, M. Hashimoto, Y. Nishizawa, M. Kubokawa, and T. Tsuji, “Microwave-assisted synthesis of
metallic nanostructures in solution,” Chemistry a Eurorean Journal, vol. 11, no. 2, pp. 440–52, Jan.
2005.


CHAPTER 2:
Carbon nanofibres as electrocatalyst support


Chapter 2: Carbon nanofibres as electrocatalyst support
61
1 Synthesis and characterisation of carbon nanofibres
Graphitised CNFs are widely explored as catalyst supports for H2-PEMFC and DMFC due
to their higher corrosion resistance, enhanced conductivity and SMSI compared to that of
traditional carbon black supports (see Chapter 1). However, graphitisation at high temperatures
usually induces a decrease of the specific surface area, which is essential for high catalyst
dispersion on the support. Therefore in this chapter, electrospun CNFs were carbonised at three
temperatures (700, 1000 and 1500 °C) in order to find a good compromise between high
electrical conductivity and high specific surface area for the support. The obtained samples
were characterised by scanning electron microscopy (SEM), Raman, N2 adsorption/desorption,
conductivity measurement and finally accelerated corrosion tests. Afterwards Pt nanoparticles
were prepared using microwave-assisted polyol method and deposited on CNFs.
Electrochemical characterisation of the obtained Pt/CNFs electrocatalyst was performed using
RDE.
Results described in this chapter have been partially published in [1]:
I. Savych, J. Bernard d’Arbigny, S. Subianto, S. Cavaliere, D. J. Jones, and J. Rozière, On
the Effect of Non-Carbon Nanostructured Supports on the Stability of Pt Nanoparticles during
Voltage Cycling: a Study of TiO2 Nanofibres, Journal of Power Sources (2014) 257, 147-155.
1.1 Synthesis of carbon nanofibres
The synthesis steps for the preparation of carbon nanofibres (CNFs) from a polymer
precursor are depicted in Figure 1. A 7.5 wt. % polyacrylonitrile (PAN, Mw ~ 150,000 g/mol,
Sigma-Aldrich) solution in N,N-dimethylformamide (DMF, 98 %, Sigma-Aldrich) was stirred
at 60 °C overnight, in order to obtain a homogeneous solution and thus electrospun fibres with
uniform diameter. The fibre diameter increases with the polymer concentration [2]. Therefore,
the concentration of 7.5 wt. % PAN was chosen in order to achieve small fibre diameter and
avoid beads formation, which takes place at low concentration of the polymer. The solution
was electrospun under 10 kV. The distance between the needle tip and aluminium collector was
10 cm and the flow rate was 0.5 ml/h. The electrospun nanofibrous mat was stabilised in air at
280 °C for 1 h. The heating rate (1 °C/min) was relatively low in order to prevent release of
large amount of heat leading to the fusing of the polymer [2]. After cooling down to room
temperature (RT), the fibres were carbonised at 700 °C, 1000 °C or 1500 °C (called from now
on as CNF700, CNF1000 and CNF1500) for 1 h in an inert atmosphere (heating rate was 5 °C/min).

Chapter 2: Carbon nanofibres as electrocatalyst support
62
Stirring overnight at 60 °C
Electrospinning
PAN in DMF
Carbonisation at 1000 °C
for 1 h in N2
Carbonisation at 700 °C
for 1 h in N2
Stabilisation at 280 °C for 1 h at 1 °C/min in air
Carbonisation at 1500 °C
for 1 h in N2
Figure 1: Schema of CNFs synthesis protocol by electrospinning of PAN.
1.2 Morphological characterisation of carbon nanofibres
1.2.1 SEM analysis
Figure 2 shows as-spun (a), stabilised at 280 °C (b), carbonised at 700 °C (e) and
1000 °C (f) CNFs with an average diameter of 447, 411, 273 and 224 nm, respectively. It can
be observed that the carbon fibres diameter decreases with increasing carbonisation
temperature. This behaviour is attributed to weight loss and gas evolution (CO, CO2, etc).
A decrease in fibre diameter at temperatures higher than 1000 °C is related to the densification
caused by the liberation of heteroatoms [3]. After the stabilisation, the white nanofibrous mat
became brown, and after carbonisation it became black, with a mass loss of about 46 % of the
initial weight.

Chapter 2: Carbon nanofibres as electrocatalyst support
63
1.2 µm
300 400 500 600 700 800 9000
10
20
30
40
Fre
qu
ency
(%
)
Fibre diameter (nm)
c
300 400 500 600 700 800 9000
10
20
30
40
Fre
qu
ency
(%
)
Fibre diameter (nm)
d
150 200 250 300 3500
10
20
30
40
Fre
qu
ency
(%
)
Fibre diameter (nm)
g
150 200 250 300 3500
10
20
30
40
Freq
uen
cy (
%)
Fibre diameter (nm)
h
Figure 2: SEM images of as-spun (a), stabilised at 280 °C (b) and carbonised at 700 °C (e), at 1000 °C (f)
CNFs and corresponding fibres diameter distribution histograms obtained from measurements of 100
CNFs (c, d, g and h).
e f
c
a b

Chapter 2: Carbon nanofibres as electrocatalyst support
64
1.2.2 Specific surface area measurements
High surface area is one of the most important characteristics of the support, which allows
high catalyst dispersion. In order to determine the specific surface area of CNFs,
N2 adsorption/desorption analysis was carried out. The nitrogen adsorption/desorption
isotherms of CNF700, CNF1000 and CNF1500 are depicted in Figure 3. The adsorption was
completed at low relative pressure approximately at 0.05 (type I isotherm [4]), which is typical
for microporous materials. However, CNF1000 and CNF1500 provided very low amount of
micropores compared to CNF700 sample, which showed the highest BET surface area of
262 m2/g. CNF1500 showed the smallest surface area of 20 m2/g, as calculated by the Brunauer–
Emmett–Teller (BET) method. Specific surface area of CNFs decreased with the increasing
carbonisation temperature due to the unification of micropores at high temperatures [2].
The specific surface area of CNF1000 (36 m2/g) obtained in this work was lower than that of
electrospun CNFs carbonised at 1000 °C obtained by Padmavathi et al. (107.9 m2/g) [5]. This
difference in surface area can be attributed to the high heating rate (10 °C/min) used by
Padmavathi et al. However, our CNF1500 sample provided slightly higher surface area (20 m2/g)
compared to that of electrospun carbon nanofibrous mats (CFMs) carbonised at 1200 °C for 1 h
(7 m2/g) [6]. Specific surface area of CNFs can be enhanced using steam activation at 800 °C
and 30 vol. % steam [4].
0.0 0.2 0.4 0.6 0.8 1.00
20
40
60
80
100
CNF1000
CNF1500
Ad
sorb
ed
qu
an
tity
(cm
3 g
-1)
Relative pressure
CNF700
Figure 3: Nitrogen adsorption/desorption isotherms of CNF700, CNF1000 and CNF1500.
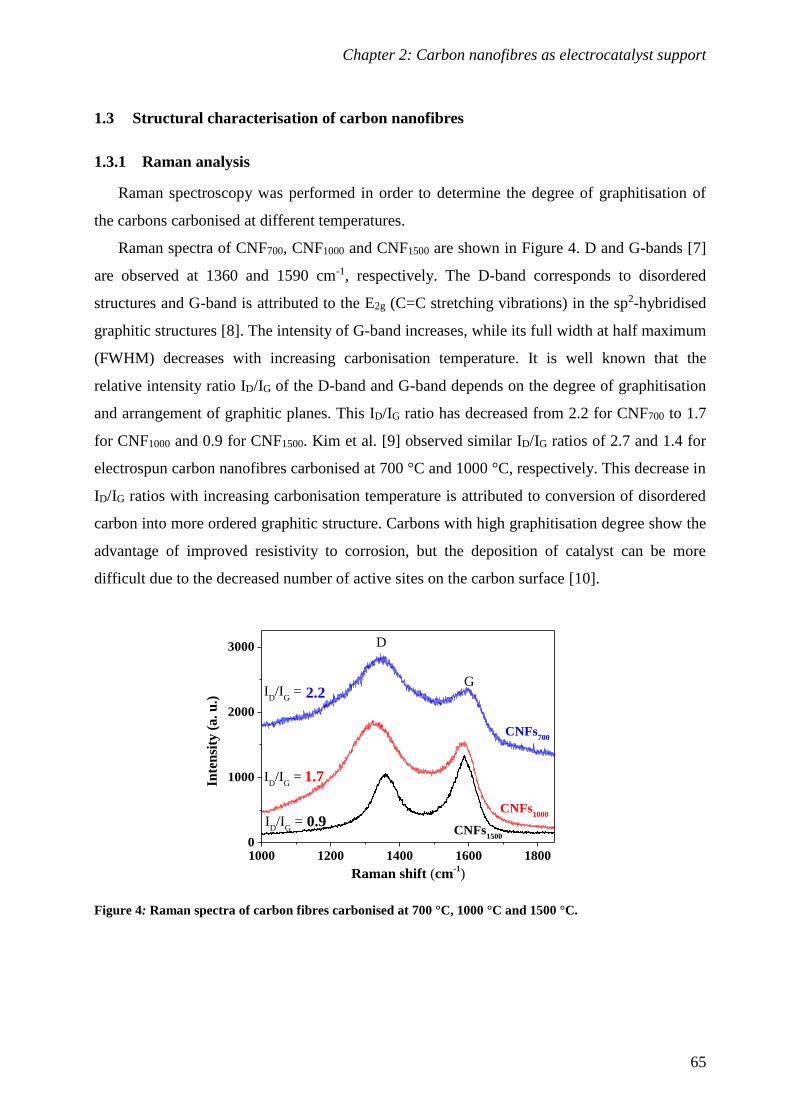
Chapter 2: Carbon nanofibres as electrocatalyst support
65
1.3 Structural characterisation of carbon nanofibres
1.3.1 Raman analysis
Raman spectroscopy was performed in order to determine the degree of graphitisation of
the carbons carbonised at different temperatures.
Raman spectra of CNF700, CNF1000 and CNF1500 are shown in Figure 4. D and G-bands [7]
are observed at 1360 and 1590 cm-1, respectively. The D-band corresponds to disordered
structures and G-band is attributed to the E2g (C=C stretching vibrations) in the sp2-hybridised
graphitic structures [8]. The intensity of G-band increases, while its full width at half maximum
(FWHM) decreases with increasing carbonisation temperature. It is well known that the
relative intensity ratio ID/IG of the D-band and G-band depends on the degree of graphitisation
and arrangement of graphitic planes. This ID/IG ratio has decreased from 2.2 for CNF700 to 1.7
for CNF1000 and 0.9 for CNF1500. Kim et al. [9] observed similar ID/IG ratios of 2.7 and 1.4 for
electrospun carbon nanofibres carbonised at 700 °C and 1000 °C, respectively. This decrease in
ID/IG ratios with increasing carbonisation temperature is attributed to conversion of disordered
carbon into more ordered graphitic structure. Carbons with high graphitisation degree show the
advantage of improved resistivity to corrosion, but the deposition of catalyst can be more
difficult due to the decreased number of active sites on the carbon surface [10].
1000 1200 1400 1600 18000
1000
2000
3000
CNFs1500
CNFs1000
ID/I
G =
ID/I
G =
ID/I
G =
Inte
nsi
ty (
a.
u.)
Raman shift (cm-1)
D
G
2.2
1.7
0.9
CNFs700
Figure 4: Raman spectra of carbon fibres carbonised at 700 °C, 1000 °C and 1500 °C.

Chapter 2: Carbon nanofibres as electrocatalyst support
66
1.3.2 XRD analysis
X-ray diffraction patterns of CNF1000 are shown in the Figure 5. The reflection at 2 θ = 25°
was attributed to the (002) crystallographic plane of graphite structure [9]. A small broad peak
at 2 θ = 43° is assigned to the graphite basal plane (100) [11],[12].
The large width of both peaks indicates the amorphous structure of the CNF support. The
average crystallite size of 1.4 nm were calculated from the (002) plane using the Scherrer
formula, which was smaller than the one obtained by Kim et al, where they found an average
size of 2.15 nm [9] for CNFs calcinated at 1000 °C:
L= (K λ)/((βobs − βinstrm) cos(θ)),
where: L = Cristallite size (nm), λ = wavelength of the radiation (1.54 Å Kα1 of Cu),
K = Sherrer constant (usually 0.87 < K < 1), βobs = observed full width at half maximum
(FWHM) (radian), βinstrm = instrumental broadening.
FWHM was measured using the XFit program. The instrumental broadening was calculated
using the following formula:
βinstrm = A + B1 x (2 θ) + B2 x (2 θ)2 ,
where: A = 8.11 10-2 is polynomial constant, B1 = -8.36 10-4 and B2 = 9.29 10-6 are polynomial
factors.
10 20 30 40 50 60
3000
6000
9000
(100)
Co
un
ts
2 Theta
7.5 % PAN 1000 °C 1h
(002)
Figure 5: X-ray diffraction patterns of CNF1000.

Chapter 2: Carbon nanofibres as electrocatalyst support
67
1.4 Electrical characterisation of carbon nanofibres
1.4.1 Electrical conductivity measurements
Electrical conductivity is a crucial property of the electrode materials. The Van der Pauw
method was used to observe the trends in resistivity of carbon-based supports using thin and
flat pellets with similar porosity and uniform thickness.
An in-house developed conductivity cell consists of a Teflon body, ceramic heating
element and four small area electrodes positioned, as shown in Figure 6. The temperature was
controlled using a thermocouple. The four electrodes (A, B, C and D) were coated with Pt and
placed on the boundary of the pellet. A current was passed through two electrodes
(for instance, IAB) and the voltage was measured through the other two electrodes (for instance,
UCD). The resistance can be calculated via Ohm’s law:
RAB,CD = UCD/IAB and RBC,DA = UDA/IBC
Van der Pauw showed that the sheet resistance can be measured from these two resistances
using the equation [13]:
exp (- π t RAB,CD/ρ) + exp (- π t RAC,BD/ρ) = 1,
where: t is the thickness of the sample and ρ is the specific resistance of the material. This
equation can be solved for ρ as:
ρ = (π t / ln 2) F (RAB,CD + RAC,BD)/2,
where: F is the “correction function” of the ratio RAB,CD/RAC,BD defined by Van der Pauw [13].
When the sample has an axis of symmetry (RAB,CD = RAC,BD) the sheet resistance can be
calculated as:
ρ = π t RAB,CD/ln2
Tested pellet
Heating element
Electrodes B C
A D
U
I
Figure 6: Schema of the in-house developed conductivity cell.

Chapter 2: Carbon nanofibres as electrocatalyst support
68
Figure 7 shows the electrical conductivities of the carbon nanofibres measured as a function
of temperature between 20 and 250 °C with a few minutes stabilisation for each point. The
electrical conductivity values increased with increasing final carbonisation temperature of PAN
fibres. The electrical conductivity of CNF700°C (10-3 S/cm) at RT was about three orders of
magnitude lower than that of CNF1000 (6.2 S/cm), CNF1500 (10.0 S/cm) and Vulcan XC-72R
(5.3 S/cm). Similar increase of the conductivity with carbonisation temperature of PAN was
observed by Kim et al. (6.8 10-3 S/cm for CNF700, 1.96 S/cm for CNF1000 [9] and 14.86 S/cm
for CNF1500 [3]). These results can be attributed to the increase in graphitisation degree with
increasing carbonisation temperature. The commercial Vulcan XC-72R and CNF1500 show
metallic behaviour. Their electrical conductivity decreases with the increase of temperature,
while the conductivity of CNF1000 remains almost unchanged. The CNF700 sample shows
semiconductor behaviour, its conductivity increases with increasing temperature.
0 50 100 150 200 250
0.002
0.004
0.006
a
CNF700
Co
nd
uct
ivit
y (
S/c
m)
Temperature (°C)
0 50 100 150 200 250
2
4
6
8
10
Co
nd
uct
ivit
y (
S/c
m)
CNF1000
Temperature (°C)
b
0 50 100 150 200 250
2
4
6
8
10
Con
du
ctiv
ity (
S/c
m)
c
CNF1500
Temperature (°C)0 50 100 150 200 250
2
4
6
8
10
Con
du
ctiv
ity (
S/c
m)
Vulcan XC-72Rd
Temperature (°C)
Figure 7: Electrical conductivity of CNF700 (a), CNF1000 (b), CNF1500 (c) and Vulcan XC-72R (d) as
a function of the temperature.
The properties of the synthesised CNFs are summarised in Table 1. The degree of
graphitisation and electrical conductivity of carbon fibres increase with carbonisation
temperature, however the specific surface area decreases. CNF1000 and CNF1500 sample were
chosen for further characterisation due to their high conductivity compared to that of CNF700.

Chapter 2: Carbon nanofibres as electrocatalyst support
69
Table 1: Ratio of D-band /G-band, conductivity and surface area of CNF700, CNF1000 and CNF1500.
Carbonisation temperature 700 °C 1000 °C 1500 °C
Ratio of D-band /G-band 2.2 1.7 0.9
Electrical conductivity, S/cm 0.0012 6.2 10
Specific surface area, m2/g 262 36 20
1.4.2 Electrochemical stability of the support
The accelerated stress test [14],[15] was carried out at 1.4 V RHE for 2 h at 80 °C in 0.5 M
H2SO4, in order to evaluate and compare electrochemical stability of CNFs at high potentials.
Corrosion currents measured for CNF1000, CNF1500 and Vulcan XC-72R are shown in
Figure 8a. The integrated corrosion-oxidation charges for CNF1000, Vulcan XC-72R and
CNF1500 were 5.6 and 3.9 and 1.4 C/mg, respectively, indicating higher corrosion resistance of
CNF1500 attributed to its high graphitic degree. Commercial Ketjenblack support showed higher
oxidation charge (17.44 C/mg ) [14]. This result may be related to the high surface area of
Ketjenblack (850 m2/g). Oxidation currents in logarithmic scale show comparable slopes for all
samples indicating similar degradation mechanisms (Figure 8b).
0 200 4000
1
2
3
4
5
Vulcan XC-72R
CNF1500
CNF1000
Cu
rren
t (m
A)
Time (s)
a
-4 -3 -2 -1 0 1-2
-1
0
1 b
Lo
g (
Cu
rren
t /m
A)
Time (s)
Vulcan XC-72R
CNF1500
CNF1000
Figure 8: Oxidation currents in linear (a) and logarithmic (b) scales for CNF1000, CNF1500 and Vulcan XC-
72R at 1.4 VRHE, 80 °C in 0.5 M H2SO4 solution.
CNF1500 has shown the best electrochemical stability among the tested samples. However,
due to the technical limitations of our laboratory (tubular oven cannot be heated at 1500 °C) it
was provided by external laboratory. Unfortunately, it was not possible to obtain higher amount
of this material, which was necessary for further characterisation. Therefore, only the CNF1000
sample was characterised as Pt nanoparticles support, as described in the following paragraphs.
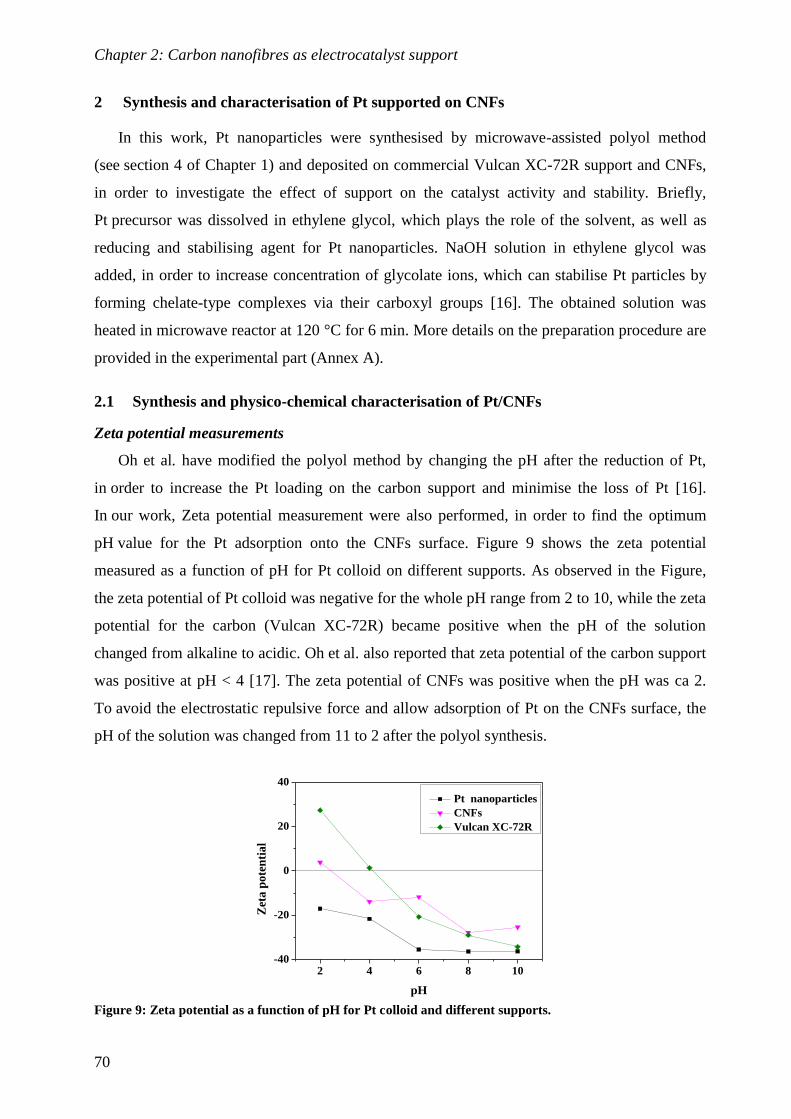
Chapter 2: Carbon nanofibres as electrocatalyst support
70
2 Synthesis and characterisation of Pt supported on CNFs
In this work, Pt nanoparticles were synthesised by microwave-assisted polyol method
(see section 4 of Chapter 1) and deposited on commercial Vulcan XC-72R support and CNFs,
in order to investigate the effect of support on the catalyst activity and stability. Briefly,
Pt precursor was dissolved in ethylene glycol, which plays the role of the solvent, as well as
reducing and stabilising agent for Pt nanoparticles. NaOH solution in ethylene glycol was
added, in order to increase concentration of glycolate ions, which can stabilise Pt particles by
forming chelate-type complexes via their carboxyl groups [16]. The obtained solution was
heated in microwave reactor at 120 °C for 6 min. More details on the preparation procedure are
provided in the experimental part (Annex A).
2.1 Synthesis and physico-chemical characterisation of Pt/CNFs
Zeta potential measurements
Oh et al. have modified the polyol method by changing the pH after the reduction of Pt,
in order to increase the Pt loading on the carbon support and minimise the loss of Pt [16].
In our work, Zeta potential measurement were also performed, in order to find the optimum
pH value for the Pt adsorption onto the CNFs surface. Figure 9 shows the zeta potential
measured as a function of pH for Pt colloid on different supports. As observed in the Figure,
the zeta potential of Pt colloid was negative for the whole pH range from 2 to 10, while the zeta
potential for the carbon (Vulcan XC-72R) became positive when the pH of the solution
changed from alkaline to acidic. Oh et al. also reported that zeta potential of the carbon support
was positive at pH < 4 [17]. The zeta potential of CNFs was positive when the pH was ca 2.
To avoid the electrostatic repulsive force and allow adsorption of Pt on the CNFs surface, the
pH of the solution was changed from 11 to 2 after the polyol synthesis.
2 4 6 8 10-40
-20
0
20
40
Zet
a p
ote
nti
al
pH
Pt nanoparticles
CNFs
Vulcan XC-72R
Figure 9: Zeta potential as a function of pH for Pt colloid and different supports.

Chapter 2: Carbon nanofibres as electrocatalyst support
71
Morphological characterisation
Figure 10 shows TEM images of the obtained Pt nanoparticles on CNFs and Vulcan
XC-72R supports. The Pt nanoparticles diameter was 2.3 nm for Pt on CNFs and 2.4 nm for Pt
on Vulcan XC-72R. The Pt nanoparticles were less homogeneously dispersed on the surface of
CNFs than on the Vulcan XC-72R.
0 1 2 3 4 50
20
40
60
F
req
uen
cy (
%)
Pt nanoparticle size (nm)
c
0 1 2 3 4 50
20
40
60
d
Fre
qu
ency
(%
)
Pt nanoparticle size (nm)
Figure 10: TEM micrographs of Pt/CNFs (a) and Pt/Vulcan XC-72R (b) and corresponding Pt nanoparticle
size distribution histograms (c and d).
Determination of the Pt loading
Pt loading on the carbon-based supports was measured by thermogravimetric analysis
(TGA). Pt/CNFs and Pt/Vulcan XC-72R were heated up to 800 °C at a heating rate of
10 °C/min in air in order to decompose the carbon and to obtain pure Pt. The measured Pt
loading were 18 wt. % for Pt/CNFs and 33 wt. % for Pt/Vulcan XC-72R, respectively. Higher
Pt adsorption on the Vulcan XC-72R may be attributed to high specific surface area of the
commercial support.
Surface analysis
In order to determine the surface oxidation states of the deposited Pt nanoparticles, XPS
analysis of Pt/CNFs and Pt/Vulcan XC-72R was performed. The investigated regions were the
a b

Chapter 2: Carbon nanofibres as electrocatalyst support
72
C 1s of the support and the Pt 4f of the deposited electrocatalyst for the two carbon-based
samples (Figure 11). The C 1s spectrum was fitted with two peaks for the Pt/CNFs and with
three peaks for Pt/Vulcan XC-72R. The most intense peak at 284.7 eV is assigned to graphitic
carbon. The higher binding energy peak at 286 eV corresponds well to the published value for
–CO like species [19]. The small peak at 288.8 eV of the Pt/Vulcan XC-72R can be attributed
to the functional groups with high oxygen contents (for example -COOH).
After fitting the Pt 4f signal, it can be observed that there are two peaks underneath each of
the peaks of the doublet. The intense doublet (at 71.4 eV for Pt/CNFs and 71.5 eV for
Pt/Vulcan XC-72R) corresponds to metallic Pt. The slight shift of this doublet to higher
binding energies is typical for small Pt particles [20]. The small doublet at 72.3 eV for Pt/CNFs
and for Pt/Vulcan can be attributed to the PtO and Pt(OH)2 [21].
80 75 70 650
5000
10000
15000
Co
un
ts (
1/s
)
Binding energy (eV)
Experimental
Pt4f7 A
Pt4f5 A
Pt4f7 B
Pt4f5 B
Background
a
80 75 70 650
5000
10000
15000
Co
un
ts (
1/s
)
b
Binding energy (eV)
Experimental
Pt4f7 A
Pt4f5 A
Pt4f7 B
Pt4f5 B
Backgnd.
290 288 286 284 282 2800
5000
10000
15000
Co
un
ts (
1/s
)
c
Experimental
C1s A
C1s B
Background
Binding energy (eV)
290 288 286 284 282 2800
5000
10000
15000
20000
25000
30000
Co
un
ts (
1/s
)
d
Binding energy (eV)
Experimental
C1s A
C1s B
C1s C
Background
Figure 11: The C 1s and Pt 4f regions of the XPS spectrum of the Pt (a) on CNFs (c) and Pt (b) on
Vulcan XC-72R (d) electrocatalysts.
2.2 Electrochemical characterisation of Pt/CNFs
The electrochemical surface area (ECSA) and stability of the obtained electrocatalysts and
commercial Pt/C was evaluated by cycling voltammetry in three-electrode cell. Furthermore,
ORR activity measurements and TEM observations were carried out before and after stability
test, in order to compare degradation of different carbon-based supports.

Chapter 2: Carbon nanofibres as electrocatalyst support
73
2.2.1 Measurements in three-electrode cell
Principle
The electrochemical characterisation was carried out in a three-electrode set up consisting
of a working electrode, a reference electrode and a counter electrode (Figure 12). During
cycling voltammetry and linear sweep voltammetry the current was measured while the applied
voltage was varied. The working electrode is used to apply the desired potential in a controlled
way. A rotating disc electrode (working electrode) consisted of a glassy carbon disc with
a surface area of 0.196 cm2 surrounded by a Teflon sheath. A saturated calomel reference
electrode (Hg / Hg2Cl2 / Cl-) was used as the reference electrode to control the applied
potential. The standard potential of this electrode is +0.241 V versus standard hydrogen
electrode (RHE) at 25 °C in acidic medium. The main disadvantage of this electrode is the
diffusion of Cl- ions from the electrode to the Pt surface. Such ions can be adsorbed on the Pt,
thereby blocking its active sites. In order to solve this problem, the reference electrode with
a double liquid junction was used. The secondary salt bridge should be filled with a reference
electrolyte solution which does not contain Cl- ions (for example KNO3). Pt wire was used as
the counter electrode. The electrochemical characterisation was performed in N2 saturated
0.1 M HClO4. This acid was chosen in order to avoid the poisoning effect of sulphate
adsorption onto the Pt surface in H2SO4 solution [22].
Working electrode
(rotating disc electrode)
Reference electrode
(saturated calomel electrode)
Counter electrode
(Pt wire)
N2/O2
0.1 M HClO4
Figure 12: Schema of the three-electrode cell
2.2.2 Determination of the electrochemical surface area (ECSA)
Principle
Cyclic voltammetry was performed to determine the ECSA of the composite electrodes
prepared in this thesis. The electrode was cycled in the potential range from 0.05 to 1.2 V
vs. RHE at a scan rate of 50 mV/s in an electrolyte solution containing 0.1 M HClO4.

Chapter 2: Carbon nanofibres as electrocatalyst support
74
Figure 13 shows typical cyclic voltammogram of a Pt/C catalyst. Three distinct zones may
be observed in the voltammogram of Pt in the acid solution, namely: the hydrogen region, the
double layer region and the oxygen region. In the double-layer region only the capacitive
processes take place. Pt oxide is formed in the potential region from 0.8 to 1.2 V (oxygen
region). The obtained PtO layer is desorbed in the reverse sweep from 1.2 to 0.6 V (hydrogen
region). Hydrogen adsorption/desorption region in the potential range of 0.05 to 0.4 V is
usually used to estimate the electrochemical surface area (ECSA) by integrating the hydrogen
adsorption peak after subtracting the effect of the double layer region using the following
equation:
ECSA = Qads/ Γ mPt [23],
where: Qads = ∫ Idt is charge density obtained after the integration of the hydrogen desorption
peak, Γ = 210 µC/cm2 [24] is the charge required to reduce a monolayer of protons onto the Pt
surface and mPt is mass of Pt on the electrode. Γ is a charge equivalent for 1 cm2 of Pt, it can be
calculated according to the following equation:
Γ = e × d = (1.602 ×10⁻¹⁹ C) × (1.31 ×1015 cm2) = 210 μC/cm2 [23],
where: e is the electron charge and d is diameter of the Pt atom, in the case when Miller index
planes (100), (110), and (111) predominate, in a proportion of 33 % for each one.
0.0 0.2 0.4 0.6 0.8 1.0 1.2-6
-4
-2
0
2
4
Cu
rren
t d
ensi
ty (
mA
/cm
2)
Hydrogen
region
Oxygen region
Qadsp
3
Potential (V vs RHE)
1
Qdesp
2 Double
layer
region
Figure 13: Cyclic voltammogram for a 50 % Pt/C (JM) in N2 saturated 0.1 M HClO4 with a scan rate of
50 mV/s.

Chapter 2: Carbon nanofibres as electrocatalyst support
75
Results and discussion
Cyclic voltammograms of Pt/C, Pt/Vulcan XC-72R and Pt/CNFs are shown in Figure 14.
The ECSA for Pt/C, Pt/Vulcan XC-72R and Pt/CNFs was calculated to be 33 m2/g, 47 m2/g
and 24 m2/g respectively. The ECSA calculated for Pt/C (33 m2/g) is smaller compared to that
of Pt/Vulcan XC-72R (47 m2/g). This result may be attributed to the larger Pt nanoparticles size
of 3.8 nm (obtained from TEM observations) for Pt/C sample compared to particle size of
2.4 nm for Pt/Vulcan XC-72R. The smallest ECSA (24 m2/g) was obtained for Pt supported on
CNFs, which can be related to the small specific surface area of the CNFs (36 m2/g). This can
lead to poor Pt dispersion and formation of bigger aggregates of the Pt nanoparticles. The
ECSA obtained in this thesis is higher than that of 20 wt. % Pt/CNFs (17.16 m2/g) obtained by
Padmavathi et al. [5], probably due to the difference in Pt nanoparticles size (2.4 and 5.2 nm).
0.0 0.2 0.4 0.6 0.8 1.0 1.2
-40
-20
0
20
40
C
urren
t d
en
sity
(m
A/m
gP
t)
Potential (V vs RHE)
Pt/C
Pt/Vulcan XC-72R
Pt/CNFs
Figure 14: Cyclic voltammograms obtained for Pt/CNFs, Pt/C and Pt/Vulcan XC-72R in N2 saturated
0.1 M HClO4 solution.
2.2.3 Determination of kinetics of oxygen reduction reaction activity
Principle
An electrochemical reaction usually consists of two main steps, the electron transfer
process and mass transfer process. The velocity of the reaction is determined by the slowest
step called the rate-determining step. Three distinctive regions can be observed on the
polarisation curves of the oxygen reduction reaction: the electron-transfer, mixed and mass
transport controlled regions (Figure 15). In the electron-transfer controlled regime, the current
density varies with the potential, but it is independent of the rotation rate of the RDE. When the
mass transfer becomes the rate-determining step, the current density is independent of
potential, but depends strongly on the rotation rate of the RDE.

Chapter 2: Carbon nanofibres as electrocatalyst support
76
ORR mass activities were calculated from the polarisation curves at a rotation speed of
900 rpm before and after the stability test using the Koutecky-Levich equation [25]:
1/J = 1/Jk + 1/Jd, Jk = Jd J/(Jd - J)
where: Jk is the kinetic current density (ORR activity), Jd is a diffusion-limited current density
(obtained from the diffusion-limited region at 0.3 V) and J is the measured current density.
The number of electrons involved in the reaction can be approximately estimated using
following formula:
1/Jd = 1/n B ω1/2 in which B = 0.2 F D022/3 ν-1/6 C02,
where: n is the number of electrons involved in the reaction, J is the experimentally obtained
current density, F the Faraday constant (96485.34 C/mol), ω the rotation speed of the RDE,
C02 the bulk O2-solubility (1.26 10-3 mol/L), D02 the diffusion coefficient of O2 in the HClO4
solution (1.93 10-5 cm2/s) and ν the kinematic viscosity of the electrolyte
(1.009 10-2 cm2/s) [26].
0.2 0.4 0.6 0.8 1.0
-4
-2
0
Cu
rren
t d
ensi
ty (
mA
/cm
2) electron
transfer
control
mixed control
Potential (V vs RHE)
900 rpm
mass transport control
Figure 15: Oxygen reduction reaction polarization curves obtained on Pt/Vulcan XC-72R.
Results and discussion
The linear sweep voltammograms recorded for Pt/C, Pt/Vulcan and Pt/CNFs are shown in
Figure 16. The current density is reported as current per geometric electrode area of the RDE.
The polarisation curves show an onset potential at ca 0.9 V. In the region from 0.95 to 0.60 V,
the ORR curves of Pt/C and Pt/Vulcan XC-72R were under mixed kinetic and diffusion
control. The mixed kinetic-diffusion controlled region of Pt/CNFs was shifted slightly to
a lower potential, ranging from 0.85 to 0.50 V. The E1/2 is the point half-way between the
diffusion limited current and the zero current and it is usually used to indicate the ORR activity
of the electrocatalyst. The E1/2 of Pt/CNFs, Pt/C and Pt/Vulcan XC-72R was 0.75, 0.82 and

Chapter 2: Carbon nanofibres as electrocatalyst support
77
0.81, respectively at 900 rpm, indicating lower ORR activity of Pt/CNFs compared to that of
Pt/C and Pt/Vulcan XC-72R.
Linear plots were obtained for Pt/CNFs, Pt/C and Pt/Vulcan XC-72R by using the Levich-
Koutecky equation at 0.3 V (Figure 16d). The number of electrons involved in the reaction was
ca 3.4, 3.6 and 3.7 for Pt/CNFs, Pt/Vulcan XC-72R and Pt/C, respectively, indicating that
oxygen reduction occurs mostly via a 4 electron mechanism (see Chapter 1).
0.2 0.4 0.6 0.8 1.0-7
-6
-5
-4
-3
-2
-1
0
Cu
rren
t d
ensi
ty (
mA
/cm
2)
Potential (V vs RHE)
2500 rpm
1600 rpm
900 rpm
400 rpm
a
0.2 0.4 0.6 0.8 1.0-7
-6
-5
-4
-3
-2
-1
0
Cu
rren
t d
ensi
ty (
mA
/cm
2) b
Potential (V vs RHE)
2500 rpm
1600 rpm
900 rpm
400 rpm
0.2 0.4 0.6 0.8 1.0-7
-6
-5
-4
-3
-2
-1
0
Cu
rren
t d
ensi
ty (
mA
/cm
2) c
Potential (V vs RHE)
2500 rpm
1600 rpm
900 rpm
400 rpm
0.02 0.03 0.04 0.05
0.2
0.4
0.6
n = 2
n = 4
Pt/CNFs
Pt/C
Pt/Vulcan
d
1/Rotation rate1/2
(1/rpm1/2
)
1/C
urr
ent
den
sity
(cm
2/A
)
Figure 16: Oxygen reduction reaction polarization curves obtained on Pt/CNFs (a), Pt/C (b) and Pt/Vulcan
XC-72R (c) and the inverse current densities as a function of the inverse of the square root of the rotation
rate (d).
Figure 17 shows potential plotted as a function of kinetic current density in logarithmic
scale, known as Tafel plot. Similar values of Tafel slope (Table 2) for Pt/C and Pt/Vulcan
XC-72R indicate the same mechanism of the ORR reaction for both electrocatalysts. However,
Pt/CNFs shows higher Tafel slope, what may be attributed to slightly different mechanism of
oxygen reduction.
Furthermore, Pt/CNFs shows the lowest ORR mass activity at 0.8 VRHE (Table 2). This
result may be attributed to smaller specific surface area of the CNFs (36 m2/g) compared to the
commercial Vulcan XC-72R (250 m2/g) as well as to difference in ECSA of these
electrocatalysts.

Chapter 2: Carbon nanofibres as electrocatalyst support
78
Table 2: Comparison of ORR mass activities and Tafel slopes for ORR on different catalysts.
Electrocatalyst Pt/C Pt/Vulcan XC-72R Pt/CNFs
ORR mass activity at 0.8 V, A/gPt 61.4 36.5 7.6
Tafel slope, mV/dec -55 -52 -75
0.1 1
0.8
0.9
1.0
Pt/CNFs
Pt/C
Pt/Vulcan XC-72R
Po
ten
tia
l (V
vs.
RH
E)
Log (current density (mA/cm2))
Figure 17: Tafel plots for ORR of different catalysts at 900 rpm in 0.1 M HClO4.
2.2.4 Evaluation of the electrochemical stability
Cyclic voltammograms of Pt/C, Pt/Vulcan XC-72R and Pt/CNFs before and after the
stability test are shown in Figure 18. For all samples, a decrease in the Pt ECSA was observed
with increasing cycle number due to the Pt nanoparticles sintering (see TEM, page 94). The
electrochemical surface area decreased dramatically from 24 to 2 m2/g for Pt/CNFs (Table 3).
The other two electrocatalysts showed a similar trend, but their ECSA decreased less rapidly
from 33 to 20 m2/g for Pt/C and from 47 to 32 m2/g for Pt/Vulcan XC-72R. It can be concluded
that the CNFs support is less stable compared to the conventional carbon materials. This result
is in agreement with the results obtained from the potential hold test (see paragraph 1.4.2). Poor
Pt dispersion can be also a reason for low Pt/CNFs durability. Furthermore, it can be noticed
that there is an increase in the capacitance in the double layer region for Pt/CNFs after
prolonged cycling, which may indicate the oxidation of the CNFs and the formation of surface
functional groups such as -OH and -COOH [27].
Table 3: ECSA of Pt/CNFs, Pt/C and Pt/Vulcan XC-72R before and after the 1000 cycle stability test.
Number of cycles Cycle 20 Cycle 100 Cycle 1000
Pt/CNFs 24 16 2
Pt/C 33 33 20
Pt/Vulcan XC-72R 47 40 32

Chapter 2: Carbon nanofibres as electrocatalyst support
79
Figure 18 also shows a decrease in the intensity and a shift of the oxygen reduction peak
between 0.7 and 0.9 V for Pt/C and Pt/Vulcan. In the case of Pt/CNFs this peak has almost
disappeared, which indicates a poor ORR activity after the stability test [22].
0.0 0.2 0.4 0.6 0.8 1.0 1.2-4
-2
0
2
Cu
rren
t d
ensi
ty (
mA
/cm
2)
Potential (V vs RHE)
cycle 100
cycle 1000
a
0.0 0.2 0.4 0.6 0.8 1.0 1.2-6
-4
-2
0
2
4
Cu
rren
t d
ensi
ty (
mA
/cm
2)
b
Potential (V vs RHE)
cycle 100
cycle 1000
0.0 0.2 0.4 0.6 0.8 1.0 1.2-6
-4
-2
0
2
4
Cu
rren
t d
en
sity
(m
A/c
m2)
c
Potential (V vs RHE)
cycle 100
cycle 1000
Figure 18: Cyclic voltammograms obtained after 100 and 1000 cycles for Pt/CNFs (a), Pt/C (b) and
Pt/Vulcan XC-72R (c).
ORR activity evaluation after stability test
Figure 19 shows the ORR mass activities calculated from the polarisation curves at
a rotation speed of 900 rpm before and after the stability test. The mass activities at 0.8 V were
much higher for Pt/C and Pt/Vulcan XC-72R than for Pt/CNFs, as shown in Table 4. The
smaller ORR activity of Pt/Vulcan XC-72R compared to the commercial Pt/C can be related to
smaller nanoparticle size of the Pt supported on Vulcan XC-72R [28].
After the stability test, all the catalysts showed very poor mass activity, especially the
Pt/CNFs catalyst (Table 4). This result indicates the lower stability of the CNFs compared to
the commercial supports and is consistent with the rapid ECSA loss of Pt/CNFs.
Table 4: ORR mass activities before and after the stability test at 0.8 VRHE.
Electrocatalyst Pt/C Pt/Vulcan XC-72R Pt/CNFs
Before 1000 cycles 61.4 36.5 7.6
After 1000 cycles 3.9 5.5 0.8

Chapter 2: Carbon nanofibres as electrocatalyst support
80
1 10 1000.7
0.8
0.9
1.0
Pt/C
Pt/Vulcan XC-72R
Pt/CNFs
Pote
nti
al
(V)
Mass activity (A/g)
a
1 10 1000.7
0.8
0.9
1.0
b
Pt/C
Pt/Vulcan XC-72R
Pt/CNFs
Po
ten
tia
l (V
)
Mass activity (A/g)
Figure 19 : Mass activities of ORR measurements before (a) and after (b) the stability test.
Transmission electron micrographs before and after the stability test
TEM images show that the particle size of all catalysts increased after the stability tests
which results in the reduction of the ECSA and the ORR activity loss. The average particle size
increased from 2.3 to 7.0 nm with a great dispersion in size up to 15 nm for Pt/CNFs, from 2.4
to 5.0 nm for Pt/Vulcan XC-72R and from 3.8 to 5.3 nm for Pt/C (Figure 20, Figure 21 and
Figure 22, respectively). This result is in agreement with the huge loss of ECSA for Pt/CNFs
(see Figure 18) and can be explained by the corrosion of the carbon-based support during the
potential cycling experiment. Chang et al. [29] also observed the growth of Pt agglomeration
up to 50 nm on the carbon fibre mat (CFM) surface after the stability test.
1 2 3 4 5 6 7 8 9 10 11 12 13 14 150
10
20
30
40
50
F
req
uen
cy (
%)
Pt nanoparticle size (nm)
c
1 2 3 4 5 6 7 8 9 10 11 12 13 14 150
10
20
30
40
50d
Pt nanoparticle size (nm)
Fre
qu
ency
(%
)
Figure 20: TEM micrographs of Pt/CNFs before (a) and after voltammetric cycling (b) and corresponding
Pt nanoparticle size distribution histograms (c and d), respectively.
a b

Chapter 2: Carbon nanofibres as electrocatalyst support
81
1 2 3 4 5 6 7 8 90
10
20
30
40
50
60
70 c
Fre
qu
ency
(%
)
Pt nanoparticle size (nm)
1 2 3 4 5 6 7 8 90
10
20
30
40
50
60
70d
Fre
qu
ency
(%
)
Pt nanoparticle size (nm)
Figure 21: TEM micrographs of Pt/Vulcan XC-72R before (a) and after potential cycling (b) and
corresponding Pt nanoparticle size distribution histograms (c and d), respectively.
2 3 4 5 6 7 8 9 100
10
20
30
40
50
c
Fre
qu
ency
(%
)
Pt nanoparticle size (nm)2 3 4 5 6 7 8 9 10
0
10
20
30
40
50
d
F
req
uen
cy (
%)
Pt nanoparticle size (nm)
Figure 22: TEM micrographs of Pt/C before (a) and after potential cycling (b) and corresponding Pt
nanoparticle size distribution histograms (c and d), respectively.
a b
a b

Chapter 2: Carbon nanofibres as electrocatalyst support
82
Conclusions and perspectives
CNFs were obtained by electrospinning and calcined at different temperatures in order to
find a good compromise between surface area, electrical conductivity and electrochemical
stability. CNF700 showed high surface area, but lower conductivity compared to CNF1000 and
CNF1500. Furthermore, CNF1500 was more stable than CNFs1000 and commercial support
(Vulcan XC-72R). However, it could not be further prepared in our laboratory for technical
issues. Therefore, CNF1000 were selected for further deposition of Pt nanoparticles, which were
prepared using microwave-assisted polyol method. The obtained Pt/CNFs electrocatalyst
provided lower ECSA and ORR activity compared to that of Pt/Vulcan XC-72R and
commercial Pt/C, probably due to poor surface area of CNFs support. Furthermore, Pt/CNFs
electrocatalyst showed lower ECSA and ORR activity after accelerated stress test caused by the
Pt nanoparticles agglomeration and poor corrosion resistance of the support.
In order to increase the stability of the Pt/CNFs, CNFs should be graphitised at
temperatures higher than 1000 °C. Another approach to avoid carbon corrosion is to replace
carbon-based materials with a more stable support such as doped TiOx or SnO2
(see Chapters 3 and 4).

Chapter 2: Carbon nanofibres as electrocatalyst support
83
References
[1] I. Savych, J. Bernard d’Arbigny, S. Subianto, S. Cavaliere, D. J. Jones, and J. Rozière, “On the Effect of
Non-Carbon Nanostructured Supports on the Stability of Pt Nanoparticles during Voltage Cycling: a Study
of TiO2 Nanofibres,” Journal of Power Sources, vol. 257, pp. 147–155, Feb. 2014.
[2] C.-K. Liu, K. Lai, W. Liu, M. Yao, and R.-J. Sun, “Preparation of carbon nanofibres through
electrospinning and thermal treatment,” Polymer International, vol. 58, no. 12, pp. 1341–1349, Dec. 2009.
[3] C. Kim, K. S. Yang, M. Kojima, K. Yoshida, Y. J. Kim, Y. a. Kim, and M. Endo, “Fabrication of
Electrospinning-Derived Carbon Nanofiber Webs for the Anode Material of Lithium-Ion Secondary
Batteries,” Advanced Functional Materials, vol. 16, no. 18, pp. 2393–2397, Dec. 2006.
[4] C. Kim, K.-S. Yang, and W.-J. Lee, “The Use of Carbon Nanofiber Electrodes Prepared by
Electrospinning for Electrochemical Supercapacitors,” Electrochemical and Solid-State Letters, vol. 7, no.
11, p. A397, 2004.
[5] R. Padmavathi and D. Sangeetha, “Synthesis and characterization of electrospun carbon nanofiber
supported Pt catalyst for fuel cells,” Electrochimica Acta, vol. 112, pp. 1–13, Dec. 2013.
[6] M. Li, G. Han, and B. Yang, “Fabrication of the catalytic electrodes for methanol oxidation on
electrospinning-derived carbon fibrous mats,” Electrochemistry Communications, vol. 10, no. 6, pp. 880–
883, Jun. 2008.
[7] Y. Wang, S. Serrano, and J. J. Santiago-avile, “Raman characterization of carbon nanofibers prepared
using electrospinning,” Synthetic Metals, vol. 138, pp. 423–427, 2003.
[8] T. Jawhari, A. Roid, and J. Casado, “Raman Spectroscopic Characterization of some Commercially
Available Carbon Black Materials,” Carbon, vol. 33, no. 11, pp. 1561–1565, 1995.
[9] C. Kim, S.-H. Park, J.-I. Cho, D.-Y. Lee, T.-J. Park, W.-J. Lee, and K.-S. Yang, “Raman spectroscopic
evaluation of polyacrylonitrile-based carbon nanofibers prepared by electrospinning,” Journal of Raman
Spectroscopy, vol. 35, no. 11, pp. 928–933, Nov. 2004.
[10] Y. Shao, G. Yin, and Y. Gao, “Understanding and approaches for the durability issues of Pt-based
catalysts for PEM fuel cell,” Journal of Power Sources, vol. 171, no. 2, pp. 558–566, Sep. 2007.
[11] C. Wang, H. Gao, H. Li, Y. Zhang, B. Huang, J. Zhao, Y. Zhu, W. Z. Yuan, and Y. Zhang, “Graphene
nanoribbons hybridized carbon nanofibers: remarkably enhanced graphitization and conductivity, and
excellent performance as support material for fuel cell catalysts.,” Nanoscale, vol. 6, no. 3, pp. 1377–83,
Jan. 2014.
[12] G. Wang, C. Pan, L. Wang, Q. Dong, C. Yu, Z. Zhao, and J. Qiu, “Activated carbon nanofiber webs made
by electrospinning for capacitive deionization,” Electrochimica Acta, vol. 69, pp. 65–70, May 2012.
[13] L. J. van der Pauw, “A method of measuring specific resistivity and Hall effect of discs of arbitrary
shape,” Philips Research Reports, vol. 13, no. 1, pp. 1–9, 1958.
[14] S. Siracusano, a. Stassi, E. Modica, V. Baglio, and a. S. Aricò, “Preparation and characterisation of Ti
oxide based catalyst supports for low temperature fuel cells,” International Journal of Hydrogen Energy,
vol. 38, no. 26, pp. 11600–11608, Aug. 2013.
[15] M. Wesselmark and C. Lagergren, “Degradation Studies of PEMFC Cathodes Based on Different Types
of Carbon,” ECS Transactions, vol. 25, no. 1, pp. 1241–1250, 2009.
[16] H.-S. Oh, J.-G. Oh, Y.-G. Hong, and H. Kim, “Investigation of carbon-supported Pt nanocatalyst
preparation by the polyol process for fuel cell applications,” Electrochimica Acta, vol. 52, no. 25, pp.
7278–7285, Sep. 2007.
[17] H.-S. Oh, J.-G. Oh, and H. Kim, “Modification of polyol process for synthesis of highly platinum loaded
platinum–carbon catalysts for fuel cells,” Journal of Power Sources, vol. 183, no. 2, pp. 600–603, Sep.
2008.
[18] H. Chhina, “Oxidation-resistatnt catalyst supports for Proton exchnge membrane fuel cells,” 2009.
[19] Z. Liu, L. M. Gan, L. Hong, W. Chen, and J. Y. Lee, “Carbon-supported Pt nanoparticles as catalysts for
proton exchange membrane fuel cells,” Journal of Power Sources, vol. 139, no. 1–2, pp. 73–78, Jan. 2005.
[20] C. Roth, M. Goetz, and H. Fuess, “Synthesis and characterization of carbon-supported Pt-Ru-WOx
catalysts by spectroscopic and diffraction methods,” Journal of Applied Electrochemistry, vol. 31, pp.
793–798, 2001.
[21] A. K. Shukla, M. K. Ravikumar, A. Roy, S. R. Barman, and D. D. Sarma, “Electro-oxidation of Methanol
in Sulfuric Acid Electrolyte on Platinized-Carbon Electrodes with Several Functional-Group
Characteristics,” Journal of Electrochemical Society, vol. 141, no. 6, pp. 463–467, 1994.
[22] A. Stassi, E. Modica, V. Antonucci, and a. S. Aricò, “A Half Cell Study of Performance and Degradation
of Oxygen Reduction Catalysts for Application in Low Temperature Fuel Cells,” Fuel Cells, vol. 9, no. 3,
pp. 201–208, Jun. 2009.
[23] J. M. Doña Rodríguez, J. A. Herrera Melián, and J. Pérez Peña, “Determination of the Real Surface Area
of Pt Electrodes by Hydrogen Adsorption Using Cyclic Voltammetry,” Journal of Chemical Education,
vol. 77, no. 9, p. 1195, Sep. 2000.

Chapter 2: Carbon nanofibres as electrocatalyst support
84
[24] B. E. Conway and H. Angerstein-Kozlowska, “The electrochemical study of multiple-state adsorption in
monolayers,” Accounts of Chemical Research, vol. 14, no. 2, pp. 49–56, Feb. 1981.
[25] S. L. Gojkovic, S. K. Zecevic, and R. F. Savinell, “O2 Reduction on an Ink-Type Rotating Disk Electrode
Using Pt Supported on High-Area Carbons,” Journal of Electrochemical Society, vol. 145, no. 11, pp.
3713–3720, 1998.
[26] D.-S. Kim, T.-J. Kim, J.-H. Kim, E. F. A. Zeid, and Y.-T. Kim, “Fine Structure Effect of PdCo
electrocatalyst for Oxygen Reduction Reaction Activity: Based on X-ray Absorption Spectroscopy Studies
with Synchrotron Beam,” Journal of Electrochemical Science and Technology, vol. 1, no. 1, pp. 31–38,
Sep. 2010.
[27] M. Dou, M. Hou, D. Liang, W. Lu, Z. Shao, and B. Yi, “SnO2 nanocluster supported Pt catalyst with high
stability for proton exchange membrane fuel cells,” Electrochimica Acta, vol. 92, pp. 468–473, Mar. 2013.
[28] A. Sarapuu, A. Kasikov, T. Laaksonen, K. Kontturi, and K. Tammeveski, “Electrochemical reduction of
oxygen on thin-film Pt electrodes in acid solutions,” Electrochimica Acta, vol. 53, no. 20, pp. 5873–5880,
Aug. 2008.
[29] Y. Chang, G. Han, M. Li, and F. Gao, “Graphene-modified carbon fiber mats used to improve the activity
and stability of Pt catalyst for methanol electrochemical oxidation,” Carbon, vol. 49, no. 15, pp. 5158–
5165, Dec. 2011.

CHAPTER 3:
Titanium dioxide as electrocatalyst support


Chapter 3: Titanium dioxide as electrocatalyst support
87
1 Synthesis and characterisation of electrospun titanium dioxide
Titanium dioxide is a promising material as a PEMFC support due to its high
electrochemical stability and strong metal support interactions (see Chapter 1) [1]. However,
its low electrical conductivity is one of the main limitations for its fuel cell application. Thus,
in order to deal with this problem, two strategies have been used, namely doping with
aliovalent metal ions (to modify the band gap) and treatment at high temperature in the
presence of H2 (to obtain a conductive suboxide). Magneli phase (obtained by reduction
at temperature higher than 1000 °C) is highly conductive, but usually it has low surface area.
Therefore, relatively low reduction temperature of 800 °C was chosen in order to prevent
TiO2 particles from sintering and thus to maintain high surface area of the corresponding
nanofibres. Niobium doping was used to enhance the electronic conductivity of TiO2.
Moreover, niobium inhibits TiO2 grain growth, which is expected to result in an enhanced
surface area of Nb doped TiO2 nanofibres.
Various methods have been used to prepare 1 D TiO2 nanostructures including solution-
based (hydrothermal, sol-gel, microwave, etc.), vapour-based (CVD, ALD, etc.), template
growth and top-down approaches [2]. However, most of these methods are relatively
complex, expensive and require a specific protocol. In contrast, electrospinning is a simple,
cost-effective and versatile technique, which allows fabrication of nanofibres and tubes with
desired diameters and high aspect ratio.
In this study, TiO2 nanofibres with 5, 10 and 20 at. % Nb, calcined at 500 °C, 800 °C, and
reduced at 800 °C were characterised using XRD, XPS, SEM, TEM, Raman spectroscopy,
nitrogen adsorption/desorption analysis and electronic conductivity measurements.
10 at. % Nb doped TiO2 reduced at high temperature was chosen for further Pt deposition
due to its high conductivity. Catalyst nanoparticles were synthesised via microwave-assisted
polyol method. ORR activity and stability of the obtained electrocatalyst were evaluated using
a rotating disc electrode and compared with that of the commercial Pt/C.
The results described in this chapter have been partially published in [3]:
I. Savych, J. Bernard d’Arbigny, S. Subianto, S. Cavaliere, D. J. Jones, and J. Rozière, On the
Effect of Non-Carbon Nanostructured Supports on the Stability of Pt Nanoparticles during
Voltage Cycling: a Study of TiO2 Nanofibres, Journal of Power Sources (2014) 257, 147-155.

Chapter 3: Titanium dioxide as electrocatalyst support
88
1.1 Synthesis and morphological characterisation of titania nanofibres
Titania nanofibres were obtained by single-needle electrospinning, whereas hollow fibres
were obtained by coaxial electrospinning. It was expected that TiO2 nanotubes would have
higher surface area compared to titania nanofibres.
1.1.1 Synthesis of titania nanofibres via single-needle electrospinning
For the preparation of titanium dioxide fibres, a procedure similar to that described in [4]
was used. Carrier polymer was added to increase viscosity of the solution and make it
spinnable. PVP is usually used to prepare titania nanofibres due to its good solubility in
alcohols and compatibility with titania and niobium precursors [5]. The fibre diameter can be
controlled by changing polymer and precursor concentration [6]. Acetic acid was added to
stabilise the solution by preventing total hydrolysis of alkoxide to titanium oxide:
Ti{OCH(CH3)2}4 + 2 H2O → TiO2 + 4 (CH3)2CHOH
The as-prepared fibres were calcined in air at 500 °C or 800 °C at 5 °C/min for 6 h in
order to remove the carrier polymer and to allow nucleation and growth of TiO2 particles. The
fibres calcined at 500 and 800 °C were labelled as low temperature (LT) and high temperature
(HT), respectively. Part of the fibres calcined at 500 °C were further heat treated at 800 °C
under 5 % H2/Ar atmosphere for 2 h at 5 °C/min. This sample was labelled as high
temperature reduction (HTR) nanofibres. The LT and HT nanofibres were white, whereas the
HTR ones were blue in colour. Blue colour of HTR suggests the presence of suboxide.
Figure 1 presents the synthesis steps for LT, HT and HTR samples.
was dissolved in 3.3 ml of ethanol
Calcination500 °C, 6 h in air, 5 °C/min (LT)
Mixing and stirring1 h in air at room temperature
Electrospinning (voltage - 15 kV, flow rate - 0.5 ml/h,distance between needle and collector - 10 cm)
were mixed with 1 ml of acetic acid
Calcination 800 °C, 6 h in air, 5 °C/min (HT)
Reduction800 °C, 2 h in H2/Ar, 5 °C/min (HTR)
0.23 mg of PVP0.52 ml of Ti(O-i-Pr)4 and 0.4 (10 %) ml Nb(OEt)5
Solution 1 Solution 2
Figure 1: Schema of the synthesis protocol for titania nanofibres.

Chapter 3: Titanium dioxide as electrocatalyst support
89
LT fibres morphology
TEM micrographs of non-doped and 10 at. % doped titania LT fibres are shown in
Figure 2. The average fibre diameter was slightly higher for the undoped titania (62 nm) than
for the doped sample (47 nm), probably due to smaller particle size of the latter. Nb doping
inhibits the grain growth of TiO2, which was confirmed by grain size calculations
(see paragraph 1.2.1).
0 20 40 60 80 100 1200
10
20
30
40
50
mean = 62 nme
Fibres diameter (nm)
Fre
qu
ency
(%
)
0 20 40 60 80 100 1200
10
20
30
40
50
Fre
qu
ency
(%
)
Fibres diameter (nm)
mean = 47 nmf
Figure 2: TEM images of non-doped (a, c) and 10 at. % Nb doped (b, d) LT fibres and corresponding size
distribution histograms obtained from measurements of 100 nanofibres (e and f), respectively.
c d
a b

Chapter 3: Titanium dioxide as electrocatalyst support
90
Comparison of LT and HTR fibres morphologies
HT and HTR fibres thermal-treated at 800 °C provide similar morphology. Therefore,
only LT and HTR samples morphology were compared using SEM and TEM microscopy.
The obtained results are shown in Figure 3. The average fibre diameters of the 10 at. % doped
LT and HTR fibres were 47 and 57 nm, respectively. Fibre diameter increases after the
reductive treatment at high temperature, probably due to particle sintering at 800 °C. The LT
sample has a more porous structure with smaller grains of around 10 nm diameter, whereas
HTR fibres consist of bigger grains of ca 60 nm diameters.
0 20 40 60 80 100 1200
10
20
30
40
50
mean = 47 nme
Fre
qu
ency
(%
)
Fibres diameter (nm)0 20 40 60 80 100 120
0
10
20
30
40
50
Fibres diameter (nm)
Fre
qu
ency
(%
)
f mean = 57 nm
Figure 3: TEM (a, b) and SEM (c, d) images and corresponding size distribution histograms obtained
from measurements of 100 nanofibres (e, f) of 10 at. % Nb doped TiO2 LT and HTR fibres, respectively.
1.1.2 Specific surface area of titania nanofibres
In order to estimate the specific surface area, nitrogen adsorption/desorption isotherms of
LT, HT and HTR nanofibres were carried out (Figure 4). The isotherm of the LT sample
shows a hysteresis at medium relative pressure, which is typical of mesoporous materials
(type IV isotherm). The isotherms of the samples prepared at high temperature, HT and HTR,
LT HTR
800 °C
Ar/H2

Chapter 3: Titanium dioxide as electrocatalyst support
91
showed decreased nitrogen adsorption. Thermal treatment at high temperature leads to the
disappearance of pores and surface smoothing due to the grain sintering. Therefore, surface
area decreases after reduction at 800 °C from 87 to 22 m2/g for 20 at. % Nb doped TiO2, as
shown in Table 1. Senevirathne et al. [9] reported a similar decrease from 51 to 6 m2/g after
reduction of electrospun titania at 1050 °C. Also, Huang et al. [10] and Chhina et al. [11]
observed the same effect on titanium oxide morphology after high-temperature reduction.
However, the BET surface area obtained here for the Nb doped HTR samples (16 - 22 m2/g)
is slightly higher than those reported by Wang et al. [12] (4.5 m2/g), Huang et al. (10 m2/g)
and Chhina et al. (13.5 m2/g) for Nb doped titania reduced at 700 °C. This difference can be
explained by different preparation method (electrospinning) used in our work.
Table 1: BET surface area (m2/g) of titania nanofibres with different Nb contents and treated at different
temperatures (LT – 500 °C in air, HT – 800 °C in air and HTR – 500 °C in air and then 800 °C in H2/Ar).
at. % Nb 0 5 10 20
LT 26 49 65 87
HT 15 15 22 19
HTR 10 22 16 22
0.0 0.2 0.4 0.6 0.8 1.00
20
40
60
80
Relative pressure (p/p°)
LT
HT
HTR
Ad
sorb
ed N
2 (
cm3/g
)
Figure 4: Nitrogen adsorption-desorption isotherms of 10 at. % Nb nanofibres.
The BET surface area of the LT samples increased from 49 m2/g for 5 at. % Nb-TiO2 to
87 m2/g for 20 at. % Nb-TiO2 (Table 1) with increasing Nb concentration. Similar result was
obtained by Michalow et al. (66.7 m2/g for 5 at. % Nb-TiO2 and 90.0 m2/g for 15 at. % Nb-
TiO2) [13]. The observed result may be attributed to the inhibition of the grain growth in the
presence of Nb, as reported previously [14]. This is in agreement with the particle size
decrease with increasing Nb concentration (see discussion in paragraph 1.2.1 and Table 2).

Chapter 3: Titanium dioxide as electrocatalyst support
92
1.1.3 Synthesis of hollow titania fibres via coaxial electrospinning
Li and Xia demonstrated that coaxial electrospinning could be used to obtain hollow TiO2
fibres [7]. In our work, similar approach (Figure 5) was used to obtain titania tubes. Our setup
was composed of two coaxial needles with diameters of 0.8 and 1.83 mm. The inner needle
was connected to a syringe with mineral oil, whereas the outer one was connected to a syringe
with titania precursor solution. The as-spun fibres were immersed in n-hexane overnight in
order to extract the oil phase and then calcined at 500 °C for 6 h (LT) and afterward reduced
at 800 °C for 2 h in 5 % H2/Ar (HTR). Figure 5 presents the synthesis steps for LT and HTR
hollow fibres. More details are provided in the experimental part (Annex A).
was dissolved in 10 ml of ethanol
Calcination500 °C, 6 h in air 5 °C/min (LT)500 °C, 6 h in air 5 °C/min (LT)
Mixing and stirring1 h in air at room temperature
Syringe 2 with the obtained solutionflow rate - 0.1 ml/h
were mixed with 1 ml of acetic acid
Reduction
800 °C, 2 h in H2/Ar 5 °C/min (HTR)800 °C, 2 h in H2/Ar 5 °C/min (HTR)
0.6 g mg of PVP6.3 ml of Ti(O-i-Pr)4 and 0.6 ml (10%) Nb(OEt)5
Solution 1 Solution 2
Syringe 1 filled with mineral oilflow rate - 0.3 ml/h
Coaxial electrospinningdistance between syringe and collector - 10 cm, voltage - 15 kV
Immersion in n-hexane
overnight
Figure 5: Schema of the synthesis protocol for titania hollow nanofibres (left) and schematic illustration of
the setup of coaxial electrospinning (right) [8].
SEM images of Nb doped LT and HTR hollow fibres are shown in Figure 6. The average
diameter of the LT and HTR were 173 and 153 nm, respectively. It can be observed that LT
hollow fibres consist of smaller grains than HTR fibres. After reduction at 800 °C, the
integrity of hollow fibres deteriorated due to the grain growth of Nb doped TiO2. The wall
thickness was between 50 and 100 nm for both LT and HTR samples.

Chapter 3: Titanium dioxide as electrocatalyst support
93
0 100 200 300 400 5000
10
20
30
40
50
F
req
uen
cy (
%)
Fibres diameter (nm)
e
100 200 300 400 5000
10
20
30
40
50
Fre
qu
ency
(%
)
Fibres diameter (nm)
f
Figure 6: SEM images of 10 at. % Nb doped TiO2 hollow fibres calcined at 500 °C in air for 1 h (a, c) and
reduced at 800 °C in Ar/H2 for 2 h (b, d) and corresponding size distribution histograms obtained from
measurements of 100 nanofibres (e, f).
1.1.4 Specific surface area of hollow titania fibres
The nitrogen adsorption/desorption isotherms of Nb doped LT and HTR hollow fibres are
shown in Figure 7. Similarly as for solid nanofibres, the surface area decreases significantly
after reduction from 48 m2/g for LT to 8 m2/g for HTR hollow fibres. Shao et al. reported
similar surface area of 44.5 m2/g for undoped TiO2 hollow fibres prepared by coaxial
electrospinning and then calcined at 500 °C for 1 h [15].
The surface area of the nanofibres (16 m2/g) is twice that of hollow fibres (8 m2/g) with
the same Nb amount of 10 at. %, which can be attributed to the larger wall thickness of titania
tubes compared to nanofibres diameter. Therefore, titania nanofibres were chosen for further
characterisation.
a b
800 °C
Ar/H2
c
d
d
d
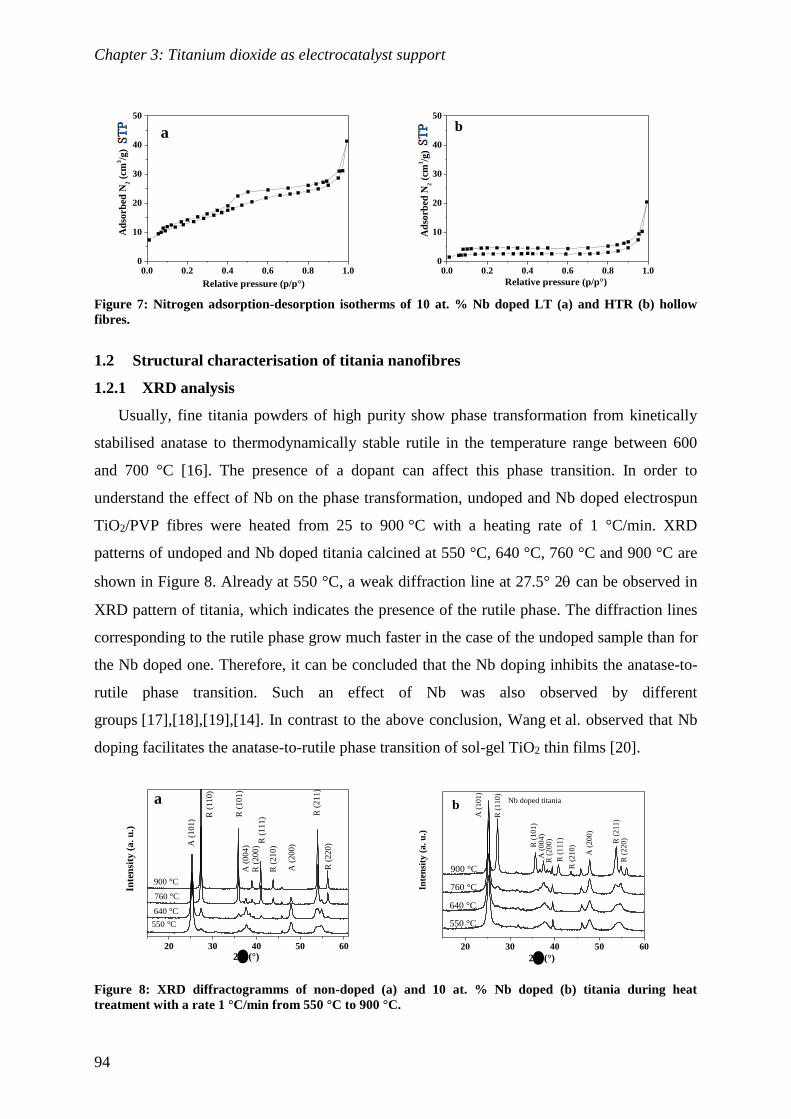
Chapter 3: Titanium dioxide as electrocatalyst support
94
0.0 0.2 0.4 0.6 0.8 1.00
10
20
30
40
50
Relative pressure (p/p°)
Ad
sorb
ed N
2 (
cm3/g
)
a
0.0 0.2 0.4 0.6 0.8 1.00
10
20
30
40
50
Relative pressure (p/p°)
b
Ad
sorb
ed N
2 (
cm3/g
)
Figure 7: Nitrogen adsorption-desorption isotherms of 10 at. % Nb doped LT (a) and HTR (b) hollow
fibres.
1.2 Structural characterisation of titania nanofibres
1.2.1 XRD analysis
Usually, fine titania powders of high purity show phase transformation from kinetically
stabilised anatase to thermodynamically stable rutile in the temperature range between 600
and 700 °C [16]. The presence of a dopant can affect this phase transition. In order to
understand the effect of Nb on the phase transformation, undoped and Nb doped electrospun
TiO2/PVP fibres were heated from 25 to 900 °C with a heating rate of 1 °C/min. XRD
patterns of undoped and Nb doped titania calcined at 550 °C, 640 °C, 760 °C and 900 °C are
shown in Figure 8. Already at 550 °C, a weak diffraction line at 27.5° 2 can be observed in
XRD pattern of titania, which indicates the presence of the rutile phase. The diffraction lines
corresponding to the rutile phase grow much faster in the case of the undoped sample than for
the Nb doped one. Therefore, it can be concluded that the Nb doping inhibits the anatase-to-
rutile phase transition. Such an effect of Nb was also observed by different
groups [17],[18],[19],[14]. In contrast to the above conclusion, Wang et al. observed that Nb
doping facilitates the anatase-to-rutile phase transition of sol-gel TiO2 thin films [20].
20 30 40 50 60
a
A (
00
4)
R (
21
0)
R (
20
0)
550 °C
640 °C
760 °C
R (
22
0)
R (
21
1)
A (
10
1)
A (
20
0)R
(1
11
)R (
10
1)
R (
11
0)
900 °C
2 (°)
Inte
nsi
ty (
a. u
.)
20 30 40 50 60
2 (°)
550 °C
640 °C
900 °C
760 °C
R (
22
0)R (
21
1)
A (
20
0)
R (
21
0)
R (
11
1)
R (
20
0)
A (
00
4)
R (
10
1)
R (
11
0)
A (
10
1)
Nb doped titania
Inte
nsi
ty (
a. u
.)
b
Figure 8: XRD diffractogramms of non-doped (a) and 10 at. % Nb doped (b) titania during heat
treatment with a rate 1 °C/min from 550 °C to 900 °C.

Chapter 3: Titanium dioxide as electrocatalyst support
95
The TiO2/PVP fibres were converted into anatase (JCPDS: 01-084-1285) on heating at
a temperature of 500 °C for 6 h, and into the rutile phase after calcination or reduction at
800 °C (Figure 9). The LT sample is mainly in anatase form, with a very little amount of the
rutile phase. A weak diffraction line at 25.7 ° 2 corresponds to the most intense diffraction
peak of the rutile structure (110). The broadening of the diffraction peaks of the anatase phase
implies the formation of very fine crystalline size of LT sample.
After heat treatment at 800 °C, the HT and HTR samples are mainly in rutile form
(JCPDS: 01-078-1510). A weak diffraction line corresponding to the anatase phase can be
observed at 25.3 °, which is much more intense in the case of 20 at. % Nb-TiO2 compared to
the other samples due to the inhibition of the anatase-to-rutile phase transition in the presence
of Nb (Figure 8).
NbO2 or Nb2O5 phases were not found in any of the samples, indicating that Nb5+ was
incorporated into the lattice structure of titania. Only titanium niobium oxide 2TiO2 5Nb2O5
(JCPDS: 00-040-0039) was present in the HT sample with 20 at. % Nb loading (Figure 9d).
This result may be attributed to the lower solubility limit of Nb in titania for the rutile phase
(6 at. % Nb) than for the anatase phase (> 10 at. % Nb) [14].
20 40 60
25 26
0
5 10
20
Inte
nsi
ty (
a. u
.)
2 (°)
0
5
10
20
a
20 40 60 80
R
b
27 28
0
50000
100000
150000
Inte
nsi
ty (
a. u.)
Pos. [°2Th.]
pristine TiO2
5 wt.% Nb
10 wt.% Nb
20 wt.% Nb
HTR rutile
05
10
20
2010
5
0
2 (°)
Inte
nsi
ty (
a. u
.)
R
R
RR
RR
R
RR
R
20 40 60
c
27.5
20000
40000
60000
80000
100000
120000
140000
160000
Inte
nsi
ty (
a.
u.)
2 Theta (°)
10
5
0
A
R R
R
A
R
R
A
R
R
R R
0
510
20
R
R
2 (°)
Inte
nsi
ty (
a. u
.)
20 30 40 50 60 70
d
In
ten
sity
(a. u
.)
NN AAA
R
R
RR
R
R
R
R
R
R
R - Rutile
A - Anatase
N - Titanium Niobium Oxide
Ti2Nb
10O
29
R
A
N
2 (°)
Figure 9: XRD diffractogramms of undoped and 5, 10 and 20 at. % Nb doped LT (a), HT (b), HTR (c)
and 20 at. % Nb doped HT sample (d).

Chapter 3: Titanium dioxide as electrocatalyst support
96
The shift of the 101 peak for doped anatase and 110 peak for doped rutile (Figure 9) to
lower diffraction angles indicates an enlargement of the unit cell due to the larger ionic radius
of Nb5+ (0.62 Å) compared to that of Ti4+ (0.56 Å) [21]. This result infers the effective
incorporation of Nb5+ into the titania lattice structure [22],[21].
No suboxide phase was detected in the blue HTR samples, probably due to the small
amount of suboxide on the fibres surface, below the detection limit of XRD.
Table 2 shows the coherence length of LT samples estimated from the XRD patterns
(Figure 9a) using the Scherrer equation based on the full-width-half-maximum of the TiO2
diffraction peak given by the (101) plane. This value is similar to the average particle size of
12 nm for electrospun TiO2 fibres obtained by Kumar et al. [23].
The coherence length from XRD decreases with an increase in the Nb concentration from
15 nm for the non-doped sample to 8 nm for the 10 at. % Nb doping (Table 2). This result is
consistent with an increase in BET surface area with increasing Nb concentration
(as discussed before). Archana et al. also reported that electrospun Nb doped TiO2 fibres were
constituted by grains of lower diameter compared to pure titania indicating that the doping
reduced the TiO2 grain growth [24].
Table 2 shows that the growth inhibition is effective until Nb concentration is ca 10 at. %.
Above this concentration, the crystallites have similar size. Ruiz et al. [14] also observed
similar trend. When the Nb concentration exceeded the value of 6 at. % the crystallites of Nb
doped TiO2 had approximately the same size at a given calcination temperature.
Table 2: Crystallite size calculated from XRD patterns of Nb doped anatase nanofibres.
% at. Nb 0 5 10 20
Crystallite size (nm) 15 12 8 9
1.2.2 Raman spectroscopy analysis
There are six modes for the anatase phase that can be seen in the Raman spectrum which
are A1g, two B1g and three Eg; and four Raman-active modes for the rutile phase, namely the
Eg, B1g, A1g and B2g. Figure 10a shows the Raman spectrum of 10 at. % Nb doped titania
calcined at 500 °C. The signals at 144, 197, 393, 517 and 639 1/cm may be attributed to
anatase modes Eg, Eg, B1g, A1g superimposed with mode B1g and Eg respectively [25]. No
peaks for rutile were detected, due to the small amount of rutile phase in the sample and lower
detection limit of the Raman analysis compared to XRD. Figure 10b shows the Raman
spectrum of 10 at. % Nb doped titania calcined at 500 °C and then reduced at 800 °C. The
peaks at 142, 414 and 602 1/cm can be identified as B1g, Eg and A1g respectively. These

Chapter 3: Titanium dioxide as electrocatalyst support
97
results are consistent with XRD results showing that the LT sample is in anatase phase, while
the HTR is in rutile phase.
200 400 600
A1g
/B1g
B1g
Eg
In
ten
sity
(a. u
.)
Raman shift (1/cm)
a Eg
200 400 600
Inte
nsi
ty (
a.
u.)
Raman shift (1/cm)
b
A1g
B1g
Eg
Figure 10: Raman spectra of LT (a) and HTR (b) TiO2 samples.
1.2.3 Surface analysis by X-ray photoelectron spectroscopy
XPS analysis was performed in order to determine the oxidation state of niobium and
titanium in the LT and HTR samples. The high resolution XPS spectra of titanium and
niobium for 10 at. % Nb doped LT and HTR samples are shown in Figure 11. The Nb 3d
spectrum recorded for the LT sample shows a doublet at 207.2 and 209.9 eV, which can be
attributed to the Nb5+ oxidation state (Figure 11c). The extra charge of Nb5+ can be
compensated either by introduction of one Ti4+ vacancy per four Nb5+ incorporations or by
reduction of one Ti4+ to Ti3+ per one Nb5+ incorporation [14],[24]. However, no peaks
attributed to Ti3+ were observed in the spectrum of the LT sample (Figure 11a). Therefore, it
can be concluded that the charge compensation of Nb5+ was achieved not by reduction of Ti4+
to Ti3+, but by creation of one Ti vacancy per four Nb5+ introduced.
Reduction of Ti4+ to Ti3+ would, however, predominate for reductive conditions and high
Nb5+ concentrations [14].
The Ti 2p and Nb 3d spectra recorded for the HTR fibres show broader peaks than those
recorded on the LT sample. The peak position of the Ti 2p3/2A at 459.2 eV corresponds to the
oxidation state of Ti4+, which was expected for TiO2 and agrees with the literature for
LT Nb-doped titania fibres [4]. In contrast, for the HTR sample, an additional signal is
observed at 457.8 eV (Ti 2p3/2 B) after curve fitting, which is attributed to titanium in the
oxidation state of +3 [26]. The relative intensity indicates that ca. 60 % titanium on the
surface of the HTR sample is in oxidation state +3, and its presence may explain the improved
electrical conductivity and the blue colouration of the HTR sample.

Chapter 3: Titanium dioxide as electrocatalyst support
98
After curve fitting of the niobium spectrum of HTR sample (Figure 11d), two more
signals were identified at 206.2 and 208.9 eV, which can be attributed to Nb4+ [14]. The
amount of Nb4+ was about 57 %, indicating that a part of the Nb5+ on the surface of the HTR
sample has been reduced to Nb4+.
465 460 455
10000
20000
a
Spectra of Ti2p
Fit of Ti2p A
Baseline
Ti4+
Co
un
ts (
1/s
)
Binding Energy (eV)
465 460 455
2000
4000
6000
8000
Ti4+
Co
un
ts (
1/s
)
Binding Energy (eV)
Spectra of Ti2p
Fit of Ti2p A
Fit of Ti2p B
Baseline
Ti3+
b
212 210 208 206 204
1000
2000
3000
Cou
nts
(1/s
)
c
Nb5+
Nb5+
Spectra of Nb3d
Fit of Nb3d5 A
Fit of Nb3d3 A
Baseline
Binding Energy (eV)
212 210 208 206 204
1000
2000
3000
Co
un
ts (
1/s
)
d
Nb4+ Nb
4+
Nb5+ Nb
5+
Binding Energy (eV)
Spectra of Nb3d
Fit of Nb3d5 A
Fit of Nb3d3 A
Fit of Nb3d5 B
Fit of Nb3d3 B
Baseline
Figure 11: High resolution XPS spectra of Ti for 10 at. % Nb doped LT (a) and HTR (b) and of Nb for
10 at. % Nb doped LT (c) and HTR (d) fibres.
1.3 Electrical and electrochemical characterisation of titania nanofibres
1.3.1 Conductivity measurements
The electrical conductivity of titania nanofibres was estimated using an in-house
developed cell equipped with four electrodes. Samples were analysed as pellets prepared by
pressing of the powders at 370 MPa for 10 min. The thickness of obtained pellets was
between 600 and 900 µm. The electronic conductivity values were calculated by Van der
Pauw method as described in Chapter 2 and listed in Table 3.
The conductivity increases from ~10-9 S/cm for the undoped LT sample to ~10-7 S/cm for
5 at. % Nb doped LT nanofibres. This is indirect proof for the incorporation of Nb into titania
lattice structure. HT (rutile phase) and LT (anatase phase) samples show comparable
electronic conductivity values.

Chapter 3: Titanium dioxide as electrocatalyst support
99
Table 3: Electronic conductivity (S/cm) of LT and HT TiO2 nanofibres with different Nb concentrations
at RT.
%at Nb 0 5 10 20
LT 4.10-9 2.10-7 7.10-8 8.10-8
HT 6.10-8 2.10-7 2.10-7 9.10-7
Electrical conductivity values for pellets (obtained by pressing of LT samples) reduced at
800 °C in Ar/H2 are listed in Table 4. After such thermal treatment, the conductivity increases
from ~10-9 S/cm for LT to ~10-3 S/cm for HTR samples. The increased conductivity is
probably due to the presence of Ti3+ on the surface of TiO2 nanofibres. Chhina et al. reported
comparable conductivity for Nb doped titania reduced at 700 °C (6.1 10-4 S/cm) and 900 °C
(~1.4 10-3 S/cm), but lower surface area of 13 and 5 m2/g, respectively [27]. Difference in
electrical conductivity can be attributed to different porosity and thickness of the pellets.
Finally, conductivity increases from ~10-5 S/m for undoped HTR sample to ~10-3 S/m for Nb
doped HTR samples.
Table 4: Electrical conductivity of HTR TiO2 nanofibres with different Nb concentrations at RT.
%at Nb 0 5 10 20
σ (S/cm) 2.10-5 2.10-3 5.10-3 1.10-3
10 at. % Nb doped HTR sample provides the highest conductivity compared to the other
samples. Electrical conductivity of this sample reaches 0.01 S/cm at 100 °C and 0.02 S/cm at
150 °C (operating temperature of HT-PEMFC). Its conductivity increases with increasing
temperature indicating semiconducting behaviour of the TiO2 nanofibres (Figure 12).
50 100 150 200
0.0
1.0x10⁻²
2.0x10⁻²
3.0x10⁻²
4.0x10⁻²
Ele
ctri
cal
con
du
ctiv
ity
(S
/cm
)
Temperature (° C)
Figure 12: Electrical conductivity of 10 at. % Nb doped HTR titania nanofibres as a function of the
temperature.

Chapter 3: Titanium dioxide as electrocatalyst support
100
1.3.2 Electrochemical characterisation
The resistance to electrochemical corrosion of LT and HTR samples was evaluated and
compared to that of a conventional carbon support (Vulcan XC-72R). This
chronoamperometric test was performed at a potential of 1.4 V vs. RHE for 2 h at 80 °C in
0.5 M sulphuric acid [28]. Such conditions were chosen to simulate conditions in a PEMFC
cathode during start-up and shut down, when the potential difference rises up to 1.44 V [29].
The obtained oxidation currents of LT, HTR and Vulcan XC-72R are shown in Figure 13.
Vulcan XC-72R begins with a high current peak (oxidation wave) attributed to the oxidation
of the amorphous carbon [30]. LT and HTR samples provide similar response to each other.
The electrochemical degradation was estimated from the integration of those curves. The
integrated charges for HTR, LT fibres and Vulcan XC-72R are 1.04, 0.96 and 3.90 C/mg,
respectively. Both rutile and anatase nanofibres show lower corrosion charge and thus higher
electrochemical stability than the carbon support. Siracusano et al. obtained comparable
oxidation charges for Ti oxide based catalyst supports, which were lower compared to the
commercial carbon support [31].
The logarithmic plots of oxidation currents are depicted in Figure 13b. LT and HTR
samples provide similar slopes which may indicate similar degradation mechanisms.
Among the various niobium-doped titania nanofibre samples, 10 at. % Nb doped HTR
provided the highest electronic conductivity. Therefore, it (labelled as titania nanofibres
(TNFs)) was selected for Pt nanoparticle deposition and further characterisation of obtained
Pt/TNF.
0 100 200 300
0.1
0.2
0.3
a
0 20 40 60 80 1000
1
2
3
4
5
Vulcan XC-72R
Rutile - HTR
Anatase - LT
Cu
rren
t (m
A)
time (s)
C
urren
t (m
A)
Time (s)
-4 -3 -2 -1 0 1-2
-1
0
1
Vulcan XC-72R
Rutile HTR
Anatase LT
Lo
g (
Cu
rren
t /m
A)
Time (s)
b
Figure 13: Oxidation currents in linear (a) and logarithmic (b) scales for LT, HTR samples and Vulcan
XC-72R at 1.4 VRHE, 80 °C in 0.5 M H2SO4 solution.

Chapter 3: Titanium dioxide as electrocatalyst support
101
2 Synthesis and characterisation of Pt supported on Nb doped titania nanofibres
Pt nanoparticles were prepared using a modified microwave-assisted polyol method
(Figure 14). Briefly, Pt precursor was dissolved in ethylene glycol, which plays the role of the
solvent, as well as reducing and stabilising agent for Pt nanoparticles. NaOH solution in
ethylene glycol was added until pH 11.5 was obtained, in order to increase concentration of
glycolate ions, which can stabilise Pt particles by forming chelate-type complexes via their
carboxyl groups [32]. The obtained solution was heated at 120 °C for 6 min in microwave
reactor to allow reduction of Pt salt. Afterwards H2SO4 acid solution was added until pH 2
was obtained (as described in the paragraph 2.1) and the mixture was stirred for 24 h to allow
Pt adsorption onto the oxide surface. More details on the preparation procedure are provided
in the experimental part (Annex A).
NaOH addition until pH = 11.5
Microwave heating for 6 min at 120 °C
H2PtCl6 was dissolved in ethylene glycol
Addition of TiO2 nanofibres
H2SO4 addition until pH = 2
Stirring overnight
Centrifugation, washing with water and ethanol
Drying in oven at 80 °C overnight
Figure 14 : Schema of the synthesis protocol for titania nanofibres supported Pt.
2.1 Pt deposition and physico-chemical characterisation of obtained Pt/TNFs
Zeta potential measurements
The zeta potential on the surface of TNFs was measured as described in Chapter 2. As
shown in Figure 15, it was positive when pH was lower than 3 for TNFs, while it was
negative in the whole range of pH for Pt nanoparticles. Therefore, after mixing of synthesised
Pt nanoparticles with TNFs, acid was added dropwise until the pH was brought down to 2,
in order to avoid the electrostatic repulsion between Pt nanoparticles and TNFs. Such
procedure allows adsorption of Pt nanoparticles on the oxide surface and increases Pt loading.
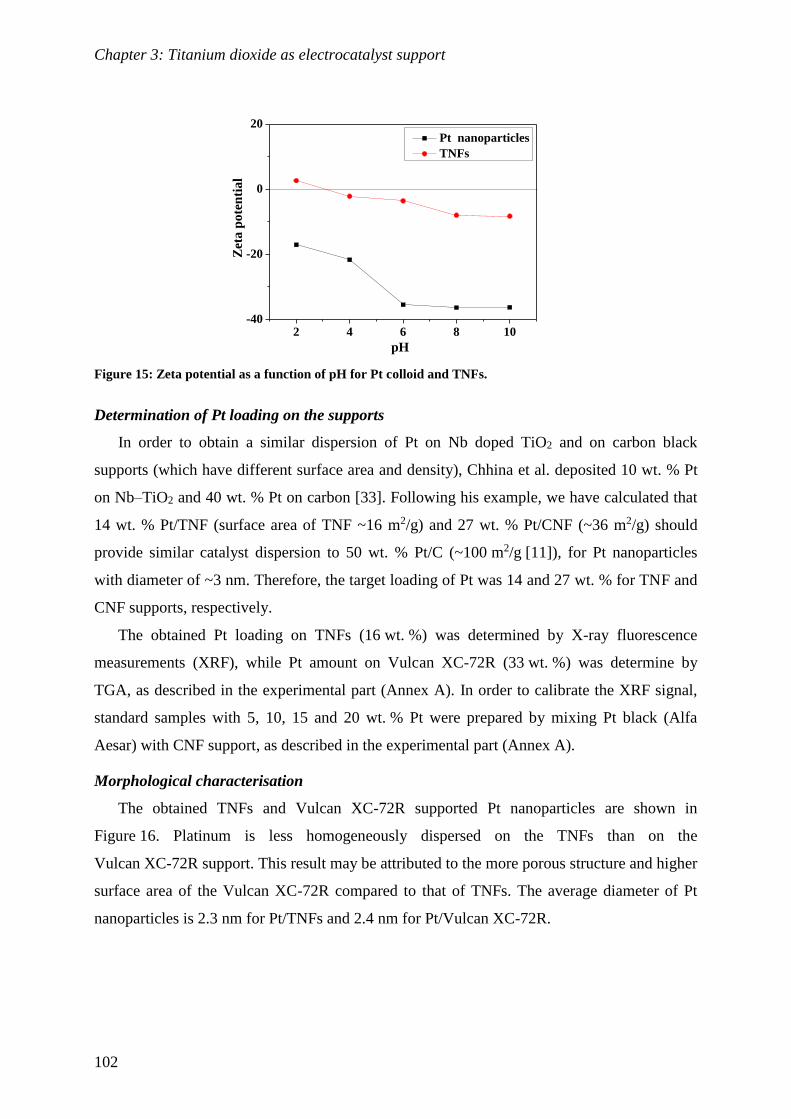
Chapter 3: Titanium dioxide as electrocatalyst support
102
2 4 6 8 10-40
-20
0
20
Pt nanoparticles
TNFs
Zet
a p
ote
nti
al
pH
Figure 15: Zeta potential as a function of pH for Pt colloid and TNFs.
Determination of Pt loading on the supports
In order to obtain a similar dispersion of Pt on Nb doped TiO2 and on carbon black
supports (which have different surface area and density), Chhina et al. deposited 10 wt. % Pt
on Nb–TiO2 and 40 wt. % Pt on carbon [33]. Following his example, we have calculated that
14 wt. % Pt/TNF (surface area of TNF ~16 m2/g) and 27 wt. % Pt/CNF (~36 m2/g) should
provide similar catalyst dispersion to 50 wt. % Pt/C (~100 m2/g [11]), for Pt nanoparticles
with diameter of ~3 nm. Therefore, the target loading of Pt was 14 and 27 wt. % for TNF and
CNF supports, respectively.
The obtained Pt loading on TNFs (16 wt. %) was determined by X-ray fluorescence
measurements (XRF), while Pt amount on Vulcan XC-72R (33 wt. %) was determine by
TGA, as described in the experimental part (Annex A). In order to calibrate the XRF signal,
standard samples with 5, 10, 15 and 20 wt. % Pt were prepared by mixing Pt black (Alfa
Aesar) with CNF support, as described in the experimental part (Annex A).
Morphological characterisation
The obtained TNFs and Vulcan XC-72R supported Pt nanoparticles are shown in
Figure 16. Platinum is less homogeneously dispersed on the TNFs than on the
Vulcan XC-72R support. This result may be attributed to the more porous structure and higher
surface area of the Vulcan XC-72R compared to that of TNFs. The average diameter of Pt
nanoparticles is 2.3 nm for Pt/TNFs and 2.4 nm for Pt/Vulcan XC-72R.

Chapter 3: Titanium dioxide as electrocatalyst support
103
0 1 2 3 4 50
20
40
60
c
Fre
qu
ency
(%
)
Pt nanoparticle size (nm)0 1 2 3 4 5
0
20
40
60
d
Freq
uen
cy (
%)
Pt nanoparticle size (nm)
Figure 16: TEM micrographs of 16 %Pt/TNFs (a) and 33%Pt/Vulcan XC-72R (b) and corresponding Pt
nanoparticle size distribution histograms obtained from measurements of 100 nanoparticles (c, d),
respectively.
80 78 76 74 72 700
10000
20000
30000
Co
un
ts (
1/s
)
a
Spectra of Pt
Pt4f7 A
Pt4f5 A
Pt4f7 B
Pt4f5 B
Baseline
Binding Energy (eV)80 78 76 74 72 70
0
5000
10000
Co
un
ts (
1/s
)
b
Binding energy (eV)
Spectra of Pt
Pt4f7 A
Pt4f5 A
Pt4f7 B
Pt4f5 B
Baseline
78 76 74 72 70
c
Pt/TNF
Pt/Vulcan
Binding Energy (eV)
74.9
74.5
71.5
71.2
Figure 17: XPS spectra of Pt for Pt on TNFs (a) and Pt on Vulcan XC-72R (b) and comparison of both of
them (c).
a b

Chapter 3: Titanium dioxide as electrocatalyst support
104
Surface analysis
The electronic interactions between metal catalysts and supports can be characterised by
using XPS. Figure 17 shows high resolution XPS spectra of the Pt 4f region recorded for
Pt/TNFs and Pt/Vulcan XC-72R. The Pt 4f signal consists of two doublets. The intense
doublet Pt 4f7/2 (at 71.2 eV for Pt/TNFs and 71.5 eV for Pt/Vulcan XC-72R) corresponds to
metallic Pt. The small shift of both doublets to higher binding energies is typical for small Pt
particles [34]. The small doublet at 72.2 eV for Pt/TNFs and 72.3 eV for Pt/Vulcan XC-72R
can be attributed to PtO and Pt(OH)2 [35]. The slight negative shift of 0.3 eV may be
attributed to an increase of electron density on the Pt surface due to the electron transfer from
TiO2 to Pt. Such result is usually associated with the strong metal-support interaction (SMSI)
between Pt and TiO2 (Figure 17c) [36], [37].
2.2 Electrochemical characterisation of Pt/TNFs
The activity and stability of the Pt/TNFs electrocatalyst was evaluated using cyclic
voltammetry and linear sweep voltammetry at rotating disk electrode and compared to that of
commercial Pt/C and Pt/Vulcan XC-72R.
2.2.1 Determination of the electrochemical surface area
The cyclic voltamograms of Pt/TNFs, Pt/C and Pt/Vulcan XC-72R are shown in
Figure 18. The platinum oxidation-reduction region of TNFs was suppressed in comparison to
that of Pt/Vulcan XC-72R. Moreover, the electrochemically active surface area (ECSA) of
Pt/TNFs (36 m2/g) is lower than that of Pt/Vulcan XC-72R (47 m2/g) with similar Pt
nanoparticles size. This could be a result of lower electrical conductivity (10-3 S/cm for TNFs
and 6 S/cm for Vulcan XC-72R) and low surface area of the TNFs. Chhina et al. [27] also
reported smaller ECSA of 10 wt % Pt supported on titania compared to commercial 40 wt. %
Pt/C. Furthermore, Subban et al. [38] reported that the ECSA of Pt on Ti0.7W0.3O2 was lower
than Pt on Vulcan, which was attributed to insufficient electrical conductivity of Ti0.7W0.3O2
and to aggregation of Pt particles. The ECSA of Pt/TNFs was higher than that reported by
Senevirathne et al. [9] for Pt supported on electrospun Ti4O7 (~6 m2/g), probably due to the
difference in Pt nanoparticles size (2.3 and 7 nm).
The PtO reduction peak of Pt/TNFs was shifted to lower voltage compared to that of Pt/C
and Pt/Vulcan XC-72R. This result may be attributed to lower ORR activity for Pt/TNFs.

Chapter 3: Titanium dioxide as electrocatalyst support
105
0.0 0.2 0.4 0.6 0.8 1.0 1.2
-40
-20
0
20
40
Pt/C
Pt/Vulcan XC-72R
Pt/TNFs
Cu
rren
t d
ensi
ty (
mA
/mg
Pt)
Potential (V vs RHE)
Figure 18: Cyclic voltammograms of Pt/TNFs, Pt/C and Pt/Vulcan XC-72R obtained at a scan rate of
50 mV/s in 0.1 M HClO4.
2.2.2 Evaluation of ORR activity
The ORR polarisation curves for Pt supported on TNFs and carbon based supports
(Figure 19) show onset potentials at around 0.9 V. In the region from 0.95 to 0.60 V for Pt/C
and Pt/Vulcan XC-72R, the ORR curves were under mixed kinetic and diffusion control. The
mixed kinetic-diffusion controlled region of Pt/TNFs was between 0.85 and 0.40 V. It is
slightly shifted to lower potentials. The E1/2 of Pt/TNFs, Pt/C and Pt/Vulcan XC-72R was
0.78, 0.82 and 0.81 at 900 rpm, respectively. This result indicates lower ORR activity of
Pt/TNFs compared to that of Pt/C and Pt/Vulcan XC-72R. Indeed, Pt/TNFs show lower mass
activity than other electrocatalysts (Table 5), which could be related to lower conductivity of
the support. Bauer et al. [39] also demonstrated that both Nb doped as well as H2 reduced
electrospun titania supported Pt provided lower ORR activity than Pt/C due to lower
conductivity and surface area of the oxide support. Furthermore, Subban et al. [38] reported
that ORR mass activity of Pt/Ti0.7W0.3O2 was lower than that of Pt/Vulcan.
Figure 19d shows the current density as a function of the square root of the rotation rate of
the RDE. The number of electrons involved in the reaction was 2.8, 3.6 and 3.7 for Pt/TNFs,
Pt/Vulcan XC-72R and Pt/C, respectively. For the oxide based catalyst, a contribution of both
2 and 4 electron mechanisms is then possible. The RRDE studies could be envisaged for the
future to estimate the amount of hydrogen peroxide produced during the oxygen reduction.
Table 5 : Comparison of ORR mass activities and Tafel slopes for ORR on different catalysts.
Electrocatalyst Pt/C Pt/Vulcan XC-72R Pt/TNFs
ORR mass activity at 0.8 V (A/gPt) 61.4 36.5 29.3
Tafel slopes -55 -52 -94

Chapter 3: Titanium dioxide as electrocatalyst support
106
0.2 0.4 0.6 0.8 1.0-7
-6
-5
-4
-3
-2
-1
0
C
urr
ent
den
sity
(m
A/c
m2)
Potential (V vs RHE)
a
400 rpm
900 rpm
1600 rpm
2500 rpm
0.2 0.4 0.6 0.8 1.0-7
-6
-5
-4
-3
-2
-1
0
Cu
rren
t d
ensi
ty (
mA
/cm
2) b
Potential (V vs RHE)
2500 rpm
1600 rpm
900 rpm
400 rpm
0.2 0.4 0.6 0.8 1.0-7
-6
-5
-4
-3
-2
-1
0
Cu
rren
t d
ensi
ty (
mA
/cm
2)
c
Potential (V vs RHE)
2500 rpm
1600 rpm
900 rpm
400 rpm
0.02 0.03 0.04 0.05
0.2
0.4
0.6d
n = 2
n = 4
Pt/C
Pt/Vulcan
Pt/TNFs
1/C
urr
ent
den
sity
(cm
2/A
)
1/Rotation rate1/2
(1/rpm1/2
)
Figure 19: Oxygen reduction reaction polarization curves obtained on Pt/TNFs (a), Pt/C (b) and Pt/Vulcan
XC-72R (c) and current densities as a function of the inverse of the square root of the rotation rate (d).
Figure 20 shows Tafel plots for the ORR on Pt/TNFs, Pt/C and Pt/Vulcan XC-72R at
900 rpm in 0.1 M HClO4. Pt/TNFs show higher slope (Table 5) than the Pt/C and Pt/Vulcan
XC-72R electrocatalysts, which may indicate a different ORR mechanism.
0.1 10.7
0.8
0.9
1.0
Log (Current density (mA/cm2))
Po
ten
tia
l (V
vs.
RH
E)
Pt/C
Pt/Vulcan XC-72R
Pt/TNFs
Figure 20 : Tafel plots for ORR on Pt/TNFs, Pt/C and Pt/Vulcan XC-72R at 900 rpm in 0.1 M HClO4.
2.2.3 Evaluation of the electrochemical stability

Chapter 3: Titanium dioxide as electrocatalyst support
107
In order to compare the stability of Pt/TNFs with Pt supported on carbon-based materials,
1000 potential cycles were recorded between 0.05 and 1.2 V. Cyclic voltammograms before
and after the stability test are shown in Figure 21. The decrease in ECSA after voltage cycling
was lower for Pt/TNFs (25 % ECSA loss) than for Pt/C (39 %) and Pt/Vulcan XC-72R
(32 %), as shown in Table 6.
Bauer et al. also observed lower ECSA loss for electrospun Nb doped TiO2 supported Pt
after 1000 cycles (40 % ECSA loss) [39] compared to commercial Pt/C. This result is usually
attributed to superior stability of oxide-based support. Also, Senevirathne et al. [9] reported
similar ECSA loss of 23 % for electrospun H2 reduced Ti4O7 supported Pt after 1000 cycles.
The drop of ECSA was attributed to the decrease of the support electrical conductivity and to
Pt nanoparticles agglomeration.
Furthermore, in the case of Pt/TNFs, the oxygen reduction peak was shifted to lower
voltage, which suggests poor ORR activity after voltage cycling.
0.0 0.2 0.4 0.6 0.8 1.0 1.2-4
-2
0
2
Cu
rren
t d
ensi
ty (
mA
/cm
2)
Potential (V vs RHE)
cycle 100
cycle 1000
a
0.0 0.2 0.4 0.6 0.8 1.0 1.2-6
-4
-2
0
2
4
Cu
rren
t d
ensi
ty (
mA
/cm
2)
b
Potential (V vs RHE)
cycle 100
cycle 1000
0.0 0.2 0.4 0.6 0.8 1.0 1.2-6
-4
-2
0
2
4
Cu
rren
t d
ensi
ty (
mA
/cm
2)
c
Potential (V vs RHE)
cycle 100
cycle 1000
Figure 21: Cyclic voltammograms obtained after 100 and 1000 cycles on Pt/TNFs (a), Pt/C (b) and
Pt/Vulcan XC-72R (c).
Table 6: ECSA of Pt/TNFs, Pt/Vulcan XC-72R and Pt/C before and after the stability test.
Electrocatalyst Pt/C Pt/Vulcan XC-72R Pt/TNFs
ECSA before voltage cycling, m2/g 33 47 36
ECSA after voltage cycling, m2/g 20 32 27
ECSA loss, % 39 32 25

Chapter 3: Titanium dioxide as electrocatalyst support
108
ORR activity loss after stability test
Figure 22 shows ORR mass activities calculated from the polarisation curves at a rotation
speed of 900 rpm before and after the voltage cycling. In terms of percent loss of mass
activity, the losses for all materials are similar, although slightly less for Pt/Vulcan XC-72R
(Table 7). Given the higher resistance of the oxide support to electrochemical corrosion, these
observations suggest that Pt dissolution/migration/agglomeration phenomena have occurred at
the electrode surface (see TEM characterisation in the next paragraph).
A further explanation is the possible formation of non-conductive TiO2 layer on the
surface of Ti4O7 after voltage cycling, as reported by Li et al. [40]. Comparable ORR mass
loss of 86% for electrospun Ti4O7 supported Pt was observed by Senevirathne et al. [9].
The agglomeration of Pt nanoparticles can be also a cause of such activity loss. Therefore,
TEM analysis was performed before and after the voltage cycling.
1 10 1000.7
0.8
0.9
Pt/C
Pt/Vulcan XC-72R
Pt/TNFs
Po
ten
tia
l (V
)
Mass activity (A/g)
a
1 10 1000.7
0.8
0.9
Pt/C
Pt/Vulcan XC-72R
Pt/TNFs
Pote
nti
al
(V)
Mass activity (A/g)
b
Figure 22: Mass activities of ORR measurements before (a) and after (b) the stability test.
Table 7: ORR mass activities before and after voltage cycling at 0.8 VRHE.
Electrocatalyst Pt/C Pt/Vulcan XC-72R Pt/TNFs
ORR mass activity before voltage cycling, A/g 61.4 36.5 29.3
ORR mass activity after voltage cycling, A/g 3.9 5.5 1.8
ORR mass activity loss, % 94 81 94
Transmission electron micrographs before and after voltage cycling
TEM images (Figure 23) show that the Pt particle size of all samples increased after the
voltage cycling. The average particle size increased from 2.3 to 5.0 nm for Pt/TNFs, from 2.4
to 5.0 nm for Pt/Vulcan XC-72R and from 3.8 to 5.3 nm for Pt/C (see Chapter 2). All
platinum particles therefore showed similar growth. However, there are areas with huge Pt
particles agglomerations for Pt/C electrocatalyst. Such agglomeration is attributed to carbon
corrosion at high potential.

Chapter 3: Titanium dioxide as electrocatalyst support
109
1 2 3 4 5 6 7 8 9 10 11 12 130
10
20
30
40
50
60
c
2.3 nm
Fre
qu
ency
(%
)
Pt nanoparticle size (nm)1 2 3 4 5 6 7 8 9 10 11 12 13
0
10
20
30
40
50
60
d
Pt nanoparticle size (nm)
Fre
qu
ency
(%
)
5.0 nm
Figure 23: TEM micrographs of Pt/TNFs before (a) and after potential cycling (b) and corresponding Pt
nanoparticle size distribution histograms obtained from the measurements of 100 particles (c and d).
a b

Chapter 3: Titanium dioxide as electrocatalyst support
110
Conclusions
Niobium-doped titania nanofibres were prepared by electrospinning and under various
heat-treatment conditions used in order to establish a good compromise between the electrical
conductivity and specific surface area. Structural and surface properties of the obtained fibres
were characterised by nitrogen adsorption/desorption, Raman, XPS and XRD analysis and
conductivity measurements. The effect of Nb on the morphology, specific surface area, phase
transition and the electrical conductivity was investigated. The 10 at. % Nb doped HTR
sample was selected for Pt deposition due to its high conductivity. The obtained Pt/TNFs
electrocatalyst retained 73 % of its initial ECSA after accelerated stress test, but showed high
ORR mass activity loss, which may be attributed to the formation of the resistive
stoichiometric oxide layer on the surface of the nanofibres as well as to platinum dissolution
and agglomeration.
Perspectives
Electrospinning provides the possibility to obtain supported or free-standing mat. These
3 D interconnected nanofibrous networks can be used as catalyst support. However, ceramic
nanofibres mats are too fragile (compared to carbon nanofibres mat) to be handled as a free-
standing film. The use of composite electrospun mats such as polymer/TiO2 or carbon/TiO2
can be a solution to this problem.
The electrical conductivity and surface area of the titanium oxide need to be improved,
in order to enhance ORR activity of Pt/TNF. For instance, TiO2 nanofibres can be heated
at 800 °C under pure H2 atmosphere and in the presence of catalyst such as cobalt [41],
in order to increase the amount of suboxide, while maintaining specific surface area of TiO2.
However, the use of doping such as W and Mo is preferred to avoid oxidation of suboxide
at the cathode.
Furthermore, the composite carbon/TiO2 fibres can be obtained by adding of corrosion
resistive CNTs or graphene into the electrospinning solution in order to increase conductivity
and surface area of TiO2-based fibres.
Another strategy is to replace TiO2 by more conductive oxide such as indium tin oxide
(ITO) or doped tin oxide. Therefore, Nb and Sb doped SnO2 was prepared by electrospinning
and characterised as electrocatalyst support for PEMFC, as described in the next chapter.
Chapter 3: Titanium dioxide as electrocatalyst support
111
References
[1] Z. Zhang, J. Liu, J. Gu, L. Su, and L. Cheng, “An Overview on Metal Oxide Materials as
Electrocatalysts and Supports for Polymer Electrolyte Fuel Cells,” Energy & Environmental Science, pp.
1–95, 2014.
[2] X. Wang, Z. Li, J. Shi, and Y. Yu, “One-Dimensional Titanium Dioxide Nanomaterials: Nanowires,
Nanorodes, and Nanobelts,” Chemical reviews, 2014.
[3] I. Savych, J. Bernard d’Arbigny, S. Subianto, S. Cavaliere, D. J. Jones, and J. Rozière, “On the Effect of
Non-Carbon Nanostructured Supports on the Stability of Pt Nanoparticles during Voltage Cycling: a
Study of TiO2 Nanofibres,” Journal of Power Sources, vol. 257, pp. 147–155, Feb. 2014.
[4] S. Cavaliere, S. Subianto, L. Chevallier, D. J. Jones, and J. Rozière, “Single step elaboration of size-
tuned Pt loaded titania nanofibres,” Chemical communications, vol. 47, no. 24, pp. 6834–6, Jun. 2011.
[5] D. Li and Y. Xia, “Electrospinning of Nanofibers: Reinventing the Wheel?,” Advanced Materials, vol.
16, no. 14, pp. 1151–1170, Jul. 2004.
[6] D. Li and Y. Xia, “Fabrication of Titania Nanofibers by Electrospinning,” Nano Letters, vol. 3, no. 4, pp.
555–560, Apr. 2003.
[7] D. Li and Y. Xia, “Direct Fabrication of Composite and Ceramic Hollow Nanofibers by
Electrospinning,” Nano Letters, vol. 4, no. 5, pp. 933–938, May 2004.
[8] Y. Xiong, B. T. Mayers, and Y. Xia, “Some recent developments in the chemical synthesis of inorganic
nanotubes,” Chemical communications, no. 40, pp. 5013–22, Oct. 2005.
[9] K. Senevirathne, R. Hui, S. Campbell, S. Ye, and J. Zhang, “Electrocatalytic activity and durability of
Pt/NbO2 and Pt/Ti4O7 nanofibers for PEM fuel cell oxygen reduction reaction,” Electrochimica Acta,
vol. 59, pp. 538–547, Jan. 2012.
[10] S.-Y. Huang, P. Ganesan, and B. N. Popov, “Electrocatalytic activity and stability of niobium-doped
titanium oxide supported platinum catalyst for polymer electrolyte membrane fuel cells,” Applied
Catalysis B: Environmental, vol. 96, no. 1–2, pp. 224–231, Apr. 2010.
[11] H. Chhina, “Oxidation-resistatnt catalyst supports for Proton exchnge membrane fuel cells,” 2009.
[12] Y.-J. Wang, D. P. Wilkinson, A. Guest, V. Neburchilov, R. Baker, F. Nan, G. a. Botton, and J. Zhang,
“Synthesis of Pd and Nb–doped TiO2 composite supports and their corresponding Pt–Pd alloy catalysts
by a two-step procedure for the oxygen reduction reaction,” Journal of Power Sources, vol. 221, pp.
232–241, Jan. 2013.
[13] K. A. Michalow, D. Flak, A. Heel, M. Parlinska-Wojtan, M. Rekas, and T. Graule, “Effect of Nb doping
on structural, optical and photocatalytic properties of flame-made TiO2 nanopowder,” Environmental
Science and Pollution Research, vol. 19, no. 9, pp. 3696–3708, 2012.
[14] A. M. Ruiz, G. Dezanneau, J. Arbiol, A. Cornet, and J. R. Morante, “Insights into the Structural and
Chemical Modifications of Nb Additive on TiO2 Nanoparticles,” Chemistry of Materials, vol. 16, no. 17,
pp. 862–871, 2004.
[15] T. Yuan, B. Zhao, R. Cai, Y. Zhou, and Z. Shao, “Electrospinning based fabrication and performance
improvement of film electrodes for lithium-ion batteries composed of TiO2 hollow fibers,” Journal of
Materials Chemistry, vol. 21, no. 38, p. 15041, 2011.
[16] D. A. H. Hanaor and C. C. Sorrell, “Review of the anatase to rutile phase transformation,” Journal of
Materials Science, vol. 46, no. 4, pp. 855–874, Dec. 2010.
[17] V. Guidi, M. C. Carotta, M. Ferroni, G. Martinelli, D. Fisica, V. Paradiso, I. Ferrara, C. Ercole, and
I. Este, “Effect of Dopants on Grain Coalescence and Oxygen Mobility in Nanostructured Titania
Anatase and Rutile,” The Journal of Physical Chemistry B, vol. 107, pp. 120–124, 2003.
[18] H. Song, A. O. Sjastad, H. Fjellvag, H. Okamoto, Ø. B. Vistad, B. Arstad, and P. Norby, “Exfoliation
and thermal transformations of Nb-substituted layered titanates,” Journal of Solid State Chemistry, vol.
184, no. 12, pp. 3135–3143, Dec. 2011.
[19] S. Karvinen, “The effects of trace elements on the crystal properties of TiO2,” Solid State Sciences, vol.
5, no. 5, pp. 811–819, May 2003.
[20] G. Q. Wang, W. Lan, G. J. Han, Y. Wang, Q. Su, and X. Q. Liu, “Effect of Nb doping on the phase
transition and optical properties of sol–gel TiO2 thin films,” Journal of Alloys and Compounds, vol. 509,
no. 10, pp. 4150–4153, Mar. 2011.
[21] H. An and H.-J. Ahn, “Fabrication of wrinkled Nb-doped TiO2 nanofibres via electrospinning,”
Materials Letters, vol. 93, pp. 88–91, Feb. 2013.
[22] M. Hirano and Y. Ichihashi, “Phase transformation and precipitation behavior of niobium component out
of niobium-doped anatase-type TiO2 nanoparticles synthesized via hydrothermal crystallization,”
Journal of Materials Science, vol. 44, no. 22, pp. 6135–6143, Sep. 2009.
[23] A. Kumar, R. Jose, K. Fujihara, J. Wang, and S. Ramakrishna, “Structural and Optical Properties of
Electrospun TiO2 Nanofibers,” Chemistry of Materials, vol. 19, no. 26, pp. 6536–6542, Dec. 2007.

Chapter 3: Titanium dioxide as electrocatalyst support
112
[24] P. S. Archana, R. Jose, T. M. Jin, C. Vijila, M. M. Yusoff, and S. Ramakrishna, “Structural and
Electrical Properties of Nb-Doped Anatase TiO2 Nanowires by Electrospinning,” Journal of the
American Ceramic Society, vol. 93, no. 12, pp. 4096–4102, Dec. 2010.
[25] P. C. Ricci, C. M. Carbonaro, L. Stagi, M. Salis, A. Casu, S. Enzo, F. Delogu, and I. Italiano, “Anatase-
to-Rutile Phase Transition in TiO2 Nanoparticles Irradiated by Visible Light,” The Journal of Physical
Chemistry C, vol. 117, p. 7850 − 7857, 2013.
[26] M. Z. Atashbar, H. T. Sun, B. Gong, W. Wlodarski, and R. Lamb, “XPS study of Nb-doped oxygen
sensing TiO2 thin films prepared by sol-gel method,” Thin Solid Films, vol. 326, pp. 238–244, 1998.
[27] H. Chhina, S. Campbell, and O. Kesler, “Ex Situ and In Situ Stability of Platinum Supported on
Niobium-Doped Titania for PEMFCs,” Journal of The Electrochemical Society, vol. 156, no. 10, p.
B1232, 2009.
[28] M. Wesselmark and C. Lagergren, “Degradation Studies of PEMFC Cathodes Based on Different Types
of Carbon,” ECS Transactions, vol. 25, no. 1, pp. 1241–1250, 2009.
[29] C. A. Reiser, L. Bregoli, T. W. Patterson, J. S. Yi, J. D. Yang, M. L. Perry, and T. D. Jarvi, “A Reverse-
Current Decay Mechanism for Fuel Cells,” Electrochemical and Solid-State Letters, vol. 8, no. 6, p.
A273, 2005.
[30] M. P. Gurrola, J. Gutiérrez, S. Rivas, M. Guerra-Balcázar, J. Ledesma-García, and L. G. Arriaga,
“Evaluation of the corrosion of Sb-doped SnO2 supports for electrolysis systems,” International Journal
of Hydrogen Energy, pp. 2–9, Mar. 2014.
[31] S. Siracusano, a. Stassi, E. Modica, V. Baglio, and a. S. Aricò, “Preparation and characterisation of Ti
oxide based catalyst supports for low temperature fuel cells,” International Journal of Hydrogen Energy,
vol. 38, no. 26, pp. 11600–11608, Aug. 2013.
[32] H.-S. Oh, J.-G. Oh, Y.-G. Hong, and H. Kim, “Investigation of carbon-supported Pt nanocatalyst
preparation by the polyol process for fuel cell applications,” Electrochimica Acta, vol. 52, no. 25, pp.
7278–7285, Sep. 2007.
[33] H. Chhina, D. Susac, S. Campbell, and O. Kesler, “Transmission Electron Microscope Observation of Pt
Deposited on Nb-Doped Titania,” Electrochemical and Solid-State Letters, vol. 12, no. 6, p. B97, 2009.
[34] C. Roth, M. Goetz, and H. Fuess, “Synthesis and characterization of carbon-supported Pt-Ru-WOx
catalysts by spectroscopic and diffraction methods,” Journal of Applied Electrochemistry, vol. 31, pp.
793–798, 2001.
[35] A. K. Shukla, M. K. Ravikumar, A. Roy, S. R. Barman, and D. D. Sarma, “Electro-oxidation of
Methanol in Sulfuric Acid Electrolyte on Platinized-Carbon Electrodes with Several Functional-Group
Characteristics,” Journal of Electrochemical Society, vol. 141, no. 6, pp. 463–467, 1994.
[36] A. Lewera, L. Timperman, A. Roguska, and N. Alonso-vante, “Metal-Support Interactions between
Nanosized Pt and Metal Oxides (WO3 and TiO2) Studied Using X-ray Photoelectron Spectroscopy,” The
Journal of Physical Chemistry C, vol. 115, pp. 20153–20159, 2011.
[37] A. Rabis, P. Rodriguez, and T. J. Schmidt, “Electrocatalysis for Polymer Electrolyte Fuel Cells: Recent
Achievements and Future Challenges,” ACS Catalysis, vol. 2, no. 5, pp. 864–890, May 2012.
[38] C. V Subban, Q. Zhou, A. Hu, T. E. Moylan, F. T. Wagner, and F. J. DiSalvo, “Sol-gel synthesis,
electrochemical characterization, and stability testing of Ti0.7W0.3O2 nanoparticles for catalyst support
applications in proton-exchange membrane fuel cells.,” Journal of the American Chemical Society, vol.
132, no. 49, pp. 17531–6, Dec. 2010.
[39] A. Bauer, K. Lee, C. Song, Y. Xie, J. Zhang, and R. Hui, “Pt nanoparticles deposited on TiO2 based
nanofibers: Electrochemical stability and oxygen reduction activity,” Journal of Power Sources, vol.
195, no. 10, pp. 3105–3110, May 2010.
[40] X. Li, A. L. Zhu, W. Qu, H. Wang, R. Hui, L. Zhang, and J. Zhang, “Magneli phase Ti4O7 electrode for
oxygen reduction reaction and its implication for zinc-air rechargeable batteries,” Electrochimica Acta,
vol. 55, no. 20, pp. 5891–5898, Aug. 2010.
[41] Y. Lee, D. Kwak, A. Park, B. Roh, I. Hwang, and G. Cao, “Facile and Catalytic Synthesis of Conductive
Titanium Suboxides for Enhanced Oxygen Reduction Activity and Stability in Proton Exchange
Membrane Fuel Cells,” Int. J. Electrochem. Sci., vol. 8, pp. 9499–9507, 2013.

CHAPTER 4:
Tin dioxide as electrocatalyst support


Chapter 4: Tin dioxide as electrocatalyst support
115
1 Introduction
This chapter describes the preparation of niobium doped tin oxide nanotubes by
combining conventional electrospinning with a specific thermal treatment in air. The effect of
Nb and Sb doping on the tin oxide conductivity, morphology and surface area was
investigated. Structure and properties of obtained doped SnO2 fibre-in-tubes were
characterised by XRD, SEM, XPS, Raman analysis, nitrogen adsorption/desorption analysis
and electronic conductivity measurements.
Platinum nanoparticles were prepared using microwave-assisted polyol method and
deposited on 5 at. % Nb doped SnO2 support. ORR activity and stability of the obtained
Pt/Nb-SnO2 electrocatalysts were evaluated using a RDE technique and compared with
a commercial Pt/C.
The influence of niobium doping on morphology and properties of tin oxide has been
published in the following paper:
S. Cavaliere, S. Subianto, I. Savych, M. Tillard, D. J. Jones, J. Rozière, Dopant-Driven
Nanostructured Loose-Tube SnO2 Architectures: Alternative Electrocatalyst Supports for
Proton Exchange Membrane Fuel Cells. The Journal of Physical Chemistry C, 117 (2013)
18298 − 18307 [1].

Chapter 4: Tin dioxide as electrocatalyst support
116
State-of-the-art on the preparation of nanotubes by single-needle electrospinning
Electrospun core-shell and tubular structures are usually prepared using a coaxial setup
(see Chapters 1 and 3). However, this technique requires a strict control of the working
parameters, complicated spinnerets and the appropriate precursor solution pairs [2].
Therefore, a new method was proposed, that allows hollow structures formation during heat
treatment. Li et al. were the first authors who, in 2007, obtained nanotubes using a simple
single-needle electrospinning [3]. Recently, various hollow oxide fibres, including
Fe2O3 [4],[5], In2O3-Fe2O3 [6], Cu-doped WO3 [7], SnO2-ZnO [128],[129], ZnO [10],[11],
CuO [12], Al2O3 [13] and Y2O3:Yb3+Er3+ [14] were prepared using conventional
electrospinning, followed by calcination in air. This method also allows the fabrication of
wire-in-tube (nickel–zinc ferrite) [15], as well as tube-in-tube (TiO2, SiO2, In2O3, SnO2 [16]
and Fe2O3 [2]) structures. In particular, hollow tin oxide fibres have gained significant
attention in various fields such as gas sensing, lithium ion batteries and solar cells, as shown
in Table 1.
Two mechanisms have been proposed in the literature to explain the formation of hollow
structures during the calcination process. The first is based on the Kirkendall
effect [17],[18],[19] and the second on the effects of polymer decomposition [20],[21].
Gao et al. [22] demonstrated that both mechanisms play a key role for the formation of hollow
fibres. The lack of the oxygen inside the fibre causes the precursor concentration gradient,
which leads to the diffusion of SnCl2 molecules to the fibre surface (Kirkendall effect -
diffusion via vacancies). Furthermore, the decomposition of a polymer results in release of
carbon dioxide, which facilitates the hollow structure formation. An et al. [23],
Cheng et al. [24] and Mou et al. [2] have prepared hollow and dense fibres by changing the
heating rate. At low heating rate (1 °C/min) dense fibres were obtained, while at high heating
rates hollow fibres were observed due to an increase in the rate of PVP decomposition.
In addition, fibre-in-tube and tube-in-tube structures were prepared using very high heating
rate of 100 °C/min and 250 °C/min, respectively. The formation mechanism was attributed to
the generation of rigid shell due to the enhanced temperature gradient inside the fibre caused
by large heating rates. Such dense shell is believed to prevent further decrease of the fibre
diameter, whereas inner gel will shrink due to the decomposition of the polymer [2]. Finally,
Lang et al. [16] and Gao et al. [22] observed that the precursor concentration has also
a significant impact on fibre morphology.

Chapter 4: Tin dioxide as electrocatalyst support
117
Table 1: SnO2 tubes by conventional electrospinning.
Reference Composition Temperature,
time and
heating rate
Diameter
(nm)
Surface
area
(m2/g)
Application
Li
2010 [25]
SnO2
500 °C, 3 h,
2.8 °C/min
220 27.9 lithium ion
batteries
Choi
2010 [26]
Pd-doped
SnO2
600 °C, 2 h 200 - 300 - gas sensing
Kong
2011 [27]
SnO2
700 °C, 1 h,
10 °/min
100 37.5 –
42.3
-
Xia
2012 [17]
SnO2
600 °C, 3 h,
0.5 °C/min
50 - 300 35.8 -
Jiang
2012 [21]
SnO2
600 °C, 5 h,
10 °C/min
200 - NOx sensing
Gao
2012 [22]
SnO2
500 °C, 2 h,
3.5 °C/min
110 39 solar cells
Lang
2012 [16]
SnO2
500 °C, 4 h,
2 °C/min
- - -
Mohanapriya
2013 [28]
Ce-doped
SnO2
600 °C, 5 h 110 - 234 16.7 –
38.5
ethanol
sensing
Wu
2013 [29]
Al-doped
SnO2
600 °C, 2 h
2 °C/min
200 - 250 - gas sensing
Miao
2013 [30]
SnO2 600 °C, 3 h
150 - 250 - H2O2 sensing
An
2013 [23]
Nb-doped
SnO2
500 °C
0.4–0.5 °C/min
180 - 293 - -
Cheng
2014 [24]
Ni-doped
SnO2
600 °C, 2 h
2 to 10 °C/min
150 - 250 21.66 acetone
sensing
Tang
2014 [9]
SnO2-ZnO
600 °C, 3 h
1 °C/min
160 - 380 17.42 gas sensing
Aravindan
2014 [31]
SnO2
500 °C, 6 h - - lithium ion
batteries
Kadir
2014 [32]
SnO2 500 °C, 4 h
5 °C/min
80 - 400 - H2 gas
sensing

Chapter 4: Tin dioxide as electrocatalyst support
118
2 Synthesis and characterisation of electrospun Nb doped SnO2
Niobium doped SnO2 was explored by the group of Sasaki as a corrosion resistant catalyst
support for PEM fuel cell cathodes [33],[34]. Pt/Nb-SnO2 based MEAs demonstrated
excellent start-stop cycle durability retaining 99 % of their initial cell voltage, even after
60,000 cycles (1.0–1.5 VRHE) [35]. This was the starting point for this work where the aim
was to develop tin oxide based supports with one-dimensional morphology, high surface area
and improved conductivity.
2.1 Synthesis of Nb doped SnO2
The synthesis protocol of niobium doped tin oxide electrospun fibres is shown in Figure 1.
SnCl2 and NbCl5 were dissolved in ethanol, while PVP polymer in DMF. The obtained
mixture was stirred and electrospun. As-prepared SnCl2/PVP fibres were calcinated at 600 °C
in order to remove carrier polymer and to allow formation of hollow fibres.
0.78 g SnCl2 and 0.06 g (5 at. %) NbCl5in 5.7 ml ethanol Solution 1
0.8 g PVP in 3.1 ml DMF
Solution 2
Electrospinning
syringe-collector distance - 10 cm, voltage - 15 kV, 0.4 ml/h
Calcination
600 °C, 4 h in air, 5 °C/min
Mixing and stirring
for 30 min
Figure 1: Schema of the nanofibre/nanotube niobium-doped tin oxide synthesis protocol.
In order to determine the polymer decomposition temperature, thermogravimetric analysis
(TGA) of the obtained electrospun PVP/SnCl2 composite fibres was carried out in the
temperature range from 25 to 750 °C at a heating rate of 10 °C/min (Figure 2). The weight
loss between 50 and 250 °C was attributed to the solvent evaporation. The main weight loss
between 250 and 500 °C was assigned to the decomposition of the PVP polymer. No
significant mass changes were observed at higher temperatures. Therefore, the calcination
temperature higher than 500 °C was selected for fabrication of pure ceramic fibres without
polymer matrix.

Chapter 4: Tin dioxide as electrocatalyst support
119
0 100 200 300 400 500 600 70092
94
96
98
100
PVP
decoposition
Mass
(%
)
Temperature (°C)
solvent
evaporation
Figure 2: Thermogravimetric analysis of SnCl2/PVP with 5 at. % Nb precursor electrospun fibres.
After the thermal treatment, the polymer was decomposed, while Sn2+ and Nb5+ were
oxidised into Nb doped SnO2 fibres. An unusual fibre-in-tube structure was obtained in the
case of Nb doped samples, as shown in Figure 3. Larger grains formed the outer tube, while
smaller grains formed a fibre inside the tube.
600 nm 300 nm
Figure 3: SEM images of 5 at. % Nb doped SnO2 fibre-in-tube structures.
In the case of undoped SnO2, dense fibres with smaller diameter of around 190 nm were
obtained from the solution with 10 wt. % SnCl2. However, when the concentration of the
precursor was increased up to 15 wt. %, fibre-in-tube morphology with average tube diameter
of 510 nm was the dominant structure, as shown in Figure 4.

Chapter 4: Tin dioxide as electrocatalyst support
120
600 nm600 nm600 nm 600 nm600 nm
0 200 400 600 800 10000
10
20
30
40
50
60
190 nm - 10 % SnCl2
c
Fre
qu
ency
(%
)
Diameter (nm)
0 200 400 600 800 10000
10
20
30
40
50
60
d
510 nm - 15 % SnCl2
Fre
qu
ency
(%
)
Diameter (nm)
Figure 4: SEM images of SnO2 fibres obtained from the solution with 10 (a) and 15 (b) wt. % SnCl2 and
then calcined at 600 °C for 4 h and corresponding fibre diameter distribution histograms (c and d).
The SEM images of Nb doped SnO2 fibres with varying SnCl2 concentrations are shown
in Figure 5. Unlike undoped SnO2, Nb doped SnO2 has hollow structure for all precursor
concentrations. This result may be attributed to the presence of Nb and the increased heating
rate, which might facilitate formation of the hollow structure.
The diameter of the hollow fibres as well as the grain size increased with increasing the
concentration of the precursor due to the increased viscosity of the solution. For instance,
fibres obtained from the solution containing 3 wt. % SnCl2 had small diameters of ~60 nm,
whereas the fibres prepared from the solution containing 15 wt. % SnCl2 showed larger
diameters between 1 and 2 µm and are folded.
The effect of the precursor concentration on grain size distributions of the undoped and
Nb doped SnO2, estimated from the SEM images, is shown in Figure 6. The average grain
size increases with higher precursor concentration from 25 nm for fibres prepared from
a solution containing 3 wt. % SnCl2, to 50 - 60 nm in the case of 15 wt. % SnCl2 due to the
increased viscosity of the solution. It can be concluded that the diameter and grain size of
hollow fibres can be controlled by changing the precursor concentration.
a b

Chapter 4: Tin dioxide as electrocatalyst support
121
1000 nm1000 nm600 nm600 nm 300 nm300 nm 600 nm600 nm 1000 nm1000 nm600 nm600 nm 300 nm300 nm 600 nm600 nm600 nm600 nm 300 nm300 nm 600 nm600 nm
100 nm 200 nm 1 µm100 nm 100 nm 200 nm 1 µm100 nm
0 100 200 300 400 500 6000
10
20
30
40
50
60
70
80
F
req
uen
cy (
%)
Diameter (nm)
60 nm - 3 % SnCl2
0 100 200 300 400 500 6000
10
20
30
40
50
60
120 nm - 5 % SnCl2
Fre
qu
ency
(%
)
Diameter (nm)
0 100 200 300 400 500 6000
10
20
30
40
50
60
350 nm - 8.5 % SnCl2
Diameter (nm)
Fre
qu
ency
(%
)
Diameter (nm)
0 500 1000 1500 2000 2500 3000 3500 40000
10
20
30
40
50
60
1650 nm - 15 % SnCl2
Fre
qu
ency
(%
)
Diameter (nm)
Figure 5: SEM (top) and TEM cross section (middle) images of 5 at. % Nb doped SnO2 fibres prepared
from solutions with 3, 5, 8.5 and 15 wt. % SnCl2 from left to right, respectively, and corresponding fibre
diameter distribution histograms obtained from measurement of 100 tubes (bottom).
2.2 Mechanism of nanotube formation
As described previously, the formation of hollow electrospun fibres is usually attributed to
Kirkendall effect (diffusion in the solid state takes place via vacancies) followed by gas
release caused by the decomposition of the polymer [22]. Therefore, the effect of heating rate
used in the thermal treatment step, as well as influence of Nb doping on tin oxide
morphology, were investigated.
3 % 5 % 8.5 % 15 %
3 % 5 % 8.5 % 15 %

Chapter 4: Tin dioxide as electrocatalyst support
122
Figure 6: Grain size distribution of the undoped (left) and 5 at. % Nb doped SnO2 (right) electrospun
fibres obtained from the solution with different inorganic precursor concentration.
2.2.1 Effect of the degree of niobium doping on tin oxide morphology
Tin oxide electrospun materials with 0.5, 2, 5 and 10 at. % Nb were prepared, in order to
understand the influence of Nb concentration on the SnO2 morphology. TEM images show
the cross sections of the obtained fibres (Figure 7). The fibre-in-tube structure was observed
when the Nb concentration was between 5 and 10 at. %, while dense fibres were obtained
when the Nb doping was between 0.5 and 2 at. %. Therefore, it can be concluded that Nb
promotes formation of fibre-in-tube morphology.
Figure 7: TEM micrographs of cross sections of SnO2 doped with 0.5 (a), 2 (b), 5 (c), and 10 at. % Nb (d).
All fibres were obtained from solution with 8.5 wt. % of SnCl2.
In order to gain a better understanding of the tube formation mechanism in the presence
of Nb, doped and undoped fibres were calcined at 300 °C. At this temperature, the fibres still
contained the carrier polymer, as indicated by the TGA curve (Figure 2). Cross sections of the
PVP/SnO2 composite fibres are shown in Figure 8. In the case of the undoped SnO2, the grain

Chapter 4: Tin dioxide as electrocatalyst support
123
size (2 – 4 nm) was homogeneous inside as well as on the surface of the fibre. Therefore, it
can be concluded that tube formation takes place mainly at temperature higher than 300 °C
due to gas expansion caused by PVP decomposition, as shown in Figure 9.
100 nm100 nm 100 nm100 nm
Figure 8: TEM cross section of 5 at. % Nb-SnO2 (8.5 wt. % SnCl2) and undoped SnO2 fibres (15 wt. %
SnCl2) thermally treated at 300 °C for 4 h.
Figure 9: Scheme of the proposed mechanism of the formation of fibre-in-tube structures for undoped and
Nb-doped SnO2 [1].
In the case of Nb doped SnO2, at 300 °C larger grains were observed on the fibre surface
compared to grains in the core structure. Such significant size difference between external and
inner grain size, is attributed to inhibition of particle growth by niobium doping [36]. After
removal of PVP at 500 °C, small particles form a fibre inside the tube, whereas the larger
particles remain on the exterior, forming the shell of the fibre-in-tube structure.
Finally, the Nb concentration in the external tubes and in the inner fibres was determined
using high resolution TEM coupled with an energy-dispersive X-ray spectroscopy (EDX).
The average Nb content was 2.5 ± 0.6 at. % in the inner fibre, whereas it was 0.6 ± 0.4 at. %
in the outer shell. This result is in agreement with the decreased SnO2 particles size inside the
tube due to the presence of Nb. Therefore, it can be concluded that Kirkendall effect plays
a dominant role for Nb doped SnO2 tube formation. The proposed mechanism is introduced in
Figure 9.
5 at.%Nb/SnO2 SnO2

Chapter 4: Tin dioxide as electrocatalyst support
124
2.2.2 Effect of the heating rate during thermal treatment on tin oxide morphology
The heating rate has also a significant influence on the fibre morphology as
reported previously [22],[24]. Therefore, Nb doped SnO2 was calcined at various heating
rates. The obtained dense and hollow fibres are shown in Figure 10. At a heating rate of
1 °C/min, compact tubes with large inner fibre (solid core) and small diameter were obtained,
while when heating rate was increased up to 5 °C/min and 10 °C/min, hollow fibres with
smaller inner fibre and larger diameter were observed due to the effect of gas expansion.
An increase in the heating rate enhances the decomposition of the polymer, which leads to an
increase in carbon dioxide evolution and thus allows formation of hollow fibres with
increased diameter. Consequently, hollow fibres can be obtained by using an appropriate
heating rate. Other recent articles, published after the completion and publication of the
present work [1], describe fabrication of electrospun Nb doped SnO2 [23] and Ni doped
SnO2 [24] hollow-fibres using an appropriate heating rate.
Figure 10: Nb-doped SnO2 tubes prepared using heating rates of 1, 5, and 10 °C/min.

Chapter 4: Tin dioxide as electrocatalyst support
125
2.3 Structure and properties of Nb doped SnO2
In order to find the sample with the highest specific surface area and electrical
conductivity, SnO2 with different amount of niobium doping was prepared.
2.3.1 Electronic conductivity
Nb has been chosen as an n-type dopant due to the similarities in Nb5+ (0.62 Å) and Sn4+
(0.69 Å) ionic radii [23]. The 5 at. % Nb doped sample showed electronic conductivity of
0.02 S/cm, which was much higher than that of the undoped sample. Table 2 lists the
conductivities of the samples doped with different amounts of Nb. The measured conductivity
was lower than that reported by Kakinuma et al. [37] for 4 at. % Nb doped tin oxide obtained
by a flame combustion method (0.7 S/cm). Various conductivity values for Nb doped SnO2
can be found in bibliographic data, probably due to the difference in the measurement method
(in-plane/through-plane conductivity, pressure during the measurements) as well as in the
porosity and thickness of the pellets.
Table 2: Electrical conductivity (RT) of the SnO2 fibre-in-tube samples with different Nb concentrations.
Nb at. % 0 0.5 2 5 8
Conductivity (S/cm) 0.0011 0.0028 0.0086 0.021 0.0078
The electrical conductivity of SnO2 with different Nb amount was measured as a function
of temperature, as shown in Figure 11. The increase in the conductivity of the sample with
temperature indicates semiconducting behaviour of Nb doped SnO2. The 5 at. % Nb-SnO2
showed the highest conductivity of 0.026 S/cm at 150 °C.
0 50 100 150 200 2500.00
0.01
0.02
0.03
0 % Nb
0.5 % Nb
2 % Nb
5 % Nb
8 % Nb
Co
nd
uct
ivit
y (
S/c
m)
Temperature (°C)
Figure 11: Conductivity of the undoped and Nb doped SnO2 as a function of the temperature.
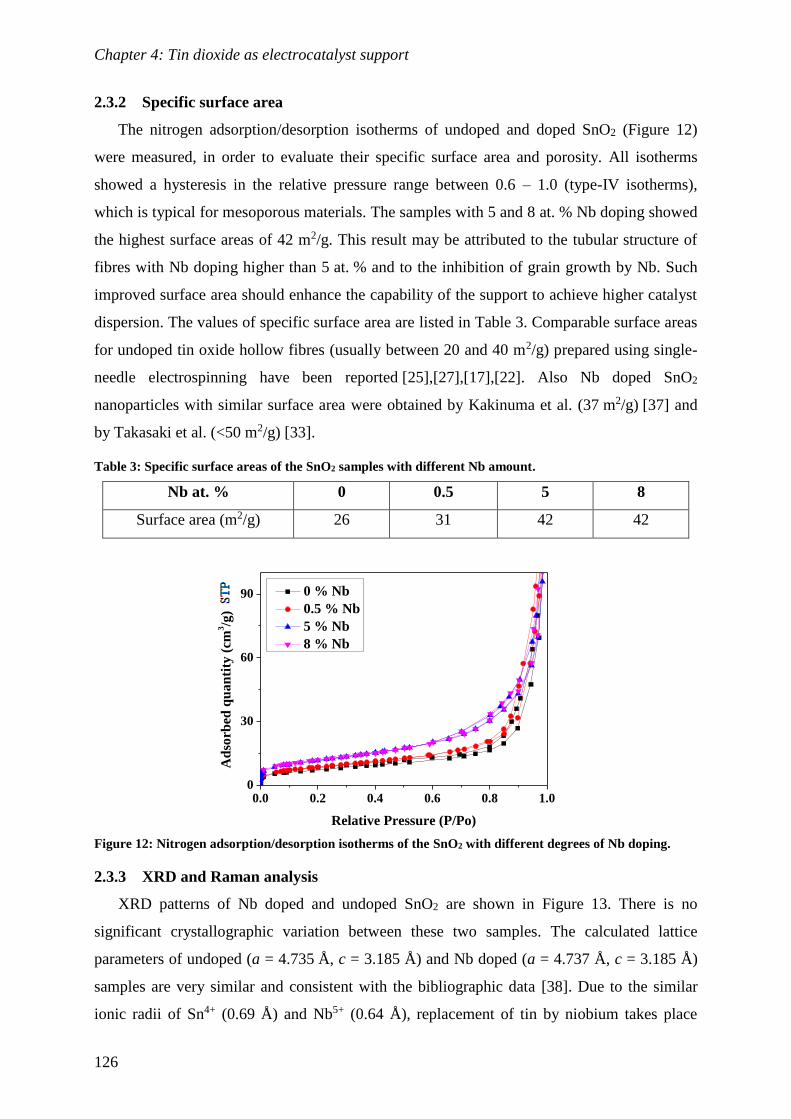
Chapter 4: Tin dioxide as electrocatalyst support
126
2.3.2 Specific surface area
The nitrogen adsorption/desorption isotherms of undoped and doped SnO2 (Figure 12)
were measured, in order to evaluate their specific surface area and porosity. All isotherms
showed a hysteresis in the relative pressure range between 0.6 – 1.0 (type-IV isotherms),
which is typical for mesoporous materials. The samples with 5 and 8 at. % Nb doping showed
the highest surface areas of 42 m2/g. This result may be attributed to the tubular structure of
fibres with Nb doping higher than 5 at. % and to the inhibition of grain growth by Nb. Such
improved surface area should enhance the capability of the support to achieve higher catalyst
dispersion. The values of specific surface area are listed in Table 3. Comparable surface areas
for undoped tin oxide hollow fibres (usually between 20 and 40 m2/g) prepared using single-
needle electrospinning have been reported [25],[27],[17],[22]. Also Nb doped SnO2
nanoparticles with similar surface area were obtained by Kakinuma et al. (37 m2/g) [37] and
by Takasaki et al. (<50 m2/g) [33].
Table 3: Specific surface areas of the SnO2 samples with different Nb amount.
Nb at. % 0 0.5 5 8
Surface area (m2/g) 26 31 42 42
0.0 0.2 0.4 0.6 0.8 1.00
30
60
90
Ad
sorb
ed q
ua
nti
ty (
cm3/g
)
Relative Pressure (P/Po)
0 % Nb
0.5 % Nb
5 % Nb
8 % Nb
Figure 12: Nitrogen adsorption/desorption isotherms of the SnO2 with different degrees of Nb doping.
2.3.3 XRD and Raman analysis
XRD patterns of Nb doped and undoped SnO2 are shown in Figure 13. There is no
significant crystallographic variation between these two samples. The calculated lattice
parameters of undoped (a = 4.735 Å, c = 3.185 Å) and Nb doped (a = 4.737 Å, c = 3.185 Å)
samples are very similar and consistent with the bibliographic data [38]. Due to the similar
ionic radii of Sn4+ (0.69 Å) and Nb5+ (0.64 Å), replacement of tin by niobium takes place

Chapter 4: Tin dioxide as electrocatalyst support
127
without significant changes in the cell volume. Such substitutional doping is possible due to
the similar outer shell electronic configuration of Nb and Sn, as reported previously for Fe
doped tin oxide [39]. All the diffraction peaks were in agreement with standard data (JCPDS:
41-1445) for the tetragonal P42/mnm cassiterite structure. No trace of a separate niobium-
containing phase was observed.
Figure 13: Experimentally observed (crosses) and calculated (solid line) X-ray diffraction (Cu Kα) X-ray
diffraction patterns for undoped and 5 at. % Nb-doped SnO2 samples. The (observed – calculated)
difference is plotted at the bottom of the diagram, and positions of Bragg possible reflections are indicated
with vertical markers. Structures were refined using the Rietveld method.
The broadening of the diffraction peaks is commonly attributed to the small particle size.
The average crystallite size of undoped and 5 at. % Nb doped SnO2 calculated using the
Scherrer equation was around 31 and 16 nm, respectively (Table 4). As already mentioned
above, Nb doping decreases the size of the tin oxide crystallites [40],[36]. An et al. also
observed that the grain size of SnO2 hollow fibres decreases with increasing Nb
concentration [23]. Also, Segawa et al. reported similar grain size for undoped and Ce doped
SnO2 tubes (41 and 22 nm respectively) [28].
Table 4: Size of undoped and Nb doped SnO2 crystallite calculated from the X-ray diffraction lines given
by (110), (101) and (211) planes.
Peak Peak position (2θ) FWHM (2θ) Crystallite size (nm)
Non-doped SnO2
(110) 26.5127 0.3225 33.2
(101) 33.8012 0.3409 31.3
(211) 51.7065 0.3748 29.5
5 at. % Nb doped SnO2
(110) 26.5627 0.6113 15.6
(101) 33.8392 0.5790 16.8
(211) 51.7701 0.6298 16.3

Chapter 4: Tin dioxide as electrocatalyst support
128
Raman spectra of undoped and Nb doped SnO2 are shown in Figure 14. Characteristic for
SnO2 cassiterite structure, peaks at 475, 631 and 772 1/cm can be identified as the Eg, A1g and
B2g mode, respectively [41]. Similar Raman spectra were observed by Jiang et al. for
electrospun SnO2 tubes [21].
400 450 500 550 600 650 700 750 800
Inte
nsi
ty (
a. u
.)
Raman shift (1/cm)
SnO2
Nb-SnO2
475 cm-1 - E
g772 cm
-1- B
2g
631 cm-1 - A
1g
Figure 14: Raman spectra of SnO2 and 5 at. % Nb doped SnO2 calcined at 600 °C.
2.3.4 X-ray-photoelectron spectroscopy
An XPS spectrum of the Sn 3d region with spin-orbital split doublet peak is shown in the
Figure 15a. The Sn 3d5/2 signal at 486.6 eV is usually attributed to the Sn4+. However, it is not
possible to distinguish between Sn4+ and Sn2+ species using the position of this peak [42]. The
stoichiometric Sn/O ratios are: 0.77 for non-doped and 0.55 for doped sample. These values
were obtained by integration of Sn 3d5/2 and O 1s peaks (O 1s signal at 530.7 eV in Figure 16
is attributed to the oxides). Therefore, it can be concluded that Sn2+ is present on the surface
of pure and doped SnO2. Kaciulis et al. [43] obtained similar stoichiometric ratio of 0.7 for
undoped tin oxide calcined at 500 °C.
Figure 15: XPS (a) and Auger emission (b) spectra of the Sn region for non-doped and 5 at. % Nb doped
SnO2 electrospun materials.

Chapter 4: Tin dioxide as electrocatalyst support
129
The Auger emission spectra (Figure 15b) were recorded in order to investigate whether all
tin species are present as Sn4+ at the surface of the tin oxide fibres. The Auger peaks at
432.7 eV and 432.4 eV are attributed to the undoped and doped samples, respectively.
The Auger parameter α first introduced by Wagner [44] as a sum of binding and kinetic
energies was calculated to be 919.3 eV and 919.2 eV for the pure and doped samples,
respectively:
α = BE Sn 3d5/2 + KE Sn,
where: BE is the binding energy of the photoelectron and KE is the kinetic energy of the
Auger transition. Gonzalez-Elipe et al. observed similar Auger parameter of 919.2 eV for SnO
and 918.5 eV for SnO2 [45]. Also, Kaciulis et al. [43] and Mahmoudi Chernari et al. [38]
reported the comparable value of 918.8 for nanostructured SnOx. It can be concluded, that
both Sn4+ and Sn2+ species are present on the surface of doped and undoped tin oxides
(oxygen deficient surfaces) prepared in this work.
The presence of Nb in the sample was also confirmed using XPS analysis. The Nb 3d
region is shown in Figure 16. The doublet at 207.5 and 210.1 eV is attributed to the Nb5+ [46].
212 210 208 206
3600
3800
4000
4200
4400
Nb 3d5/2
Co
un
ts (
s-1)
Binding energy (eV)
Nb 3d3/2
534 532 530 528
20000
40000
60000
80000
Binding energy (eV)
Cou
nts
(s-1
)
O 1s
Figure 16: XPS spectra of the niobium and oxygen regions for 5 at. % Nb doped SnO2.
2.3.5 Electrochemical characterisation of niobium doped tin oxide fibres
In order to evaluate the stability of the support under conditions similar to that in
a PEMFC, an accelerated stress test (80 °C, 2h, 0.5 M H2SO4, 1.4 V) was performed, as
described in the experimental part (Annex A). The oxidation charges were obtained by
integrating the area under the chronoamperometric curves shown in Figure 17. The oxidation
charge normalised by weight of the support was significantly lower for Nb doped SnO2
(0.9 C/mg) than for Vulcan XC-72R (3.9 C/mg). This result indicates the high corrosion
resistance of tin oxide support.

Chapter 4: Tin dioxide as electrocatalyst support
130
Figure 17: Chronoamperometric curves in linear (a) and logarithmic (b) scales for electrospun 5 at. %
Nb–SnO2 and Vulcan XC-72 at 1.4 VRHE at 80 °C.
Conclusions
Addition of Nb leads to an improved electrical conductivity of SnO2. Moreover,
Nb doping has significant impact on SnO2 fibre morphology such as the formation of the
fibre-in-tube structure and inhibition of SnO2 grain growth. This leads to improved specific
surface area of the support. The most conductive sample (5 at. % Nb doped SnO2)
demonstrated also enhanced surface area. Therefore, this composition was chosen for the Pt
deposition by a microwave-assisted polyol method.
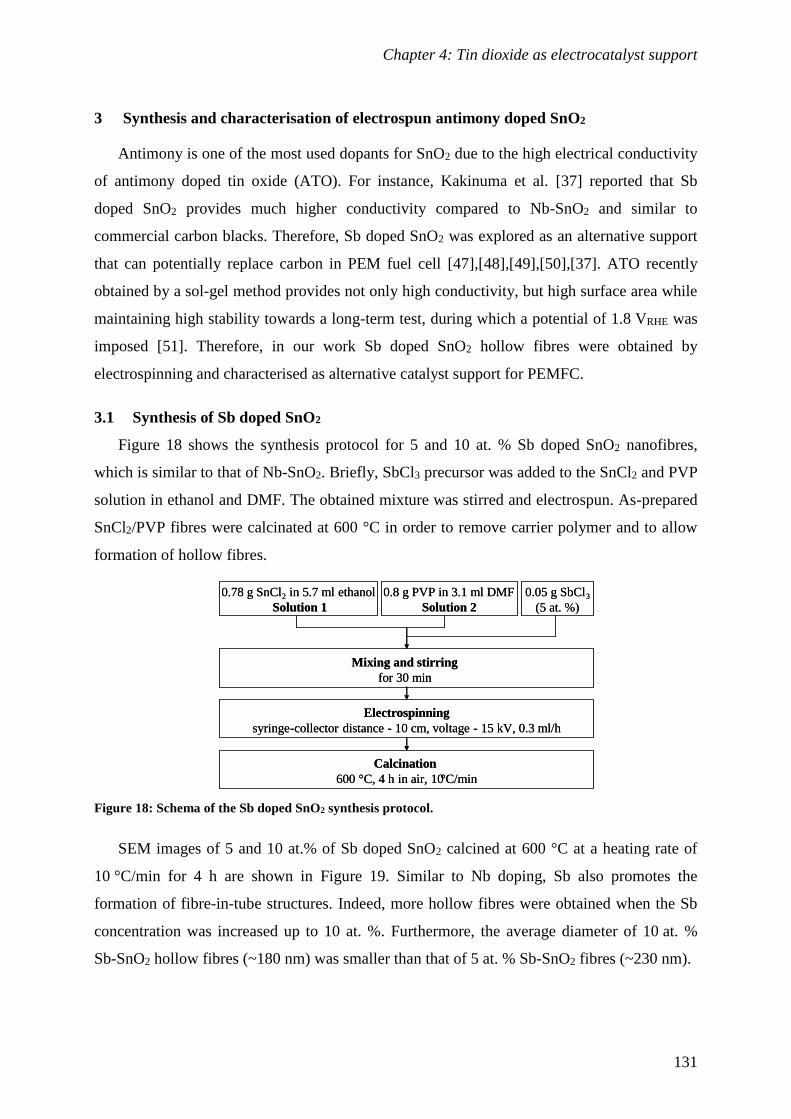
Chapter 4: Tin dioxide as electrocatalyst support
131
3 Synthesis and characterisation of electrospun antimony doped SnO2
Antimony is one of the most used dopants for SnO2 due to the high electrical conductivity
of antimony doped tin oxide (ATO). For instance, Kakinuma et al. [37] reported that Sb
doped SnO2 provides much higher conductivity compared to Nb-SnO2 and similar to
commercial carbon blacks. Therefore, Sb doped SnO2 was explored as an alternative support
that can potentially replace carbon in PEM fuel cell [47],[48],[49],[50],[37]. ATO recently
obtained by a sol-gel method provides not only high conductivity, but high surface area while
maintaining high stability towards a long-term test, during which a potential of 1.8 VRHE was
imposed [51]. Therefore, in our work Sb doped SnO2 hollow fibres were obtained by
electrospinning and characterised as alternative catalyst support for PEMFC.
3.1 Synthesis of Sb doped SnO2
Figure 18 shows the synthesis protocol for 5 and 10 at. % Sb doped SnO2 nanofibres,
which is similar to that of Nb-SnO2. Briefly, SbCl3 precursor was added to the SnCl2 and PVP
solution in ethanol and DMF. The obtained mixture was stirred and electrospun. As-prepared
SnCl2/PVP fibres were calcinated at 600 °C in order to remove carrier polymer and to allow
formation of hollow fibres.
0.78 g SnCl2 in 5.7 ml ethanol
Solution 1
0.8 g PVP in 3.1 ml DMF
Solution 2
Electrospinning
syringe-collector distance - 10 cm, voltage - 15 kV, 0.3 ml/h
Calcination
600 °C, 4 h in air, 10°C/min
Mixing and stirring
for 30 min
0.05 g SbCl3
(5 at. %)
0.78 g SnCl2 in 5.7 ml ethanol
Solution 1
0.8 g PVP in 3.1 ml DMF
Solution 2
Electrospinning
syringe-collector distance - 10 cm, voltage - 15 kV, 0.3 ml/h
Calcination
600 °C, 4 h in air, 10°C/min
Mixing and stirring
for 30 min
0.05 g SbCl3
(5 at. %)
Figure 18: Schema of the Sb doped SnO2 synthesis protocol.
SEM images of 5 and 10 at.% of Sb doped SnO2 calcined at 600 °C at a heating rate of
10 °C/min for 4 h are shown in Figure 19. Similar to Nb doping, Sb also promotes the
formation of fibre-in-tube structures. Indeed, more hollow fibres were obtained when the Sb
concentration was increased up to 10 at. %. Furthermore, the average diameter of 10 at. %
Sb-SnO2 hollow fibres (~180 nm) was smaller than that of 5 at. % Sb-SnO2 fibres (~230 nm).

Chapter 4: Tin dioxide as electrocatalyst support
132
600 nm600 nm
600 nm600 nm
50 100 150 200 250 300 3500
10
20
30
40
50
Fibre diameter (nm)
Fre
qu
ency
(%
)
226 nm
50 100 150 200 250 300 3500
10
20
30
40
50
Fibre diameter (nm)
F
req
uen
cy (
%)
176 nm
Figure 19: SEM images of 5 (left) and 10 (right) at.% of Sb doped SnO2 calcined with a heating rate of
10 °C/min at 600 °C for 4 h and corresponding fibre diameter distribution histograms.
3.2 Structure and properties of Sb doped SnO2
Structural, surface area and electrical properties of the obtained Sb-SnO2 fibres were
characterised by using XRD, nitrogen adsorption/desorption analysis and electrical
conductivity measurements.
20 30 40 50 60 70 80
10 at. % Sb
5 at. % Sb
undoped sample
2 Theta (°)
Inte
nsi
ty (
a.
u.)
Figure 20: XRD diffractogramms of undoped, 5 and 10 at. % Sb doped SnO2 tubes.

Chapter 4: Tin dioxide as electrocatalyst support
133
3.2.1 Structural analysis
Figure 20 shows the XRD patterns of undoped and Sb doped SnO2 samples. For undoped,
5 and 10 at. % Sb doped samples, all diffraction peaks can be indexed as tetragonal cassiterite
SnO2 structure. No separate phases containing antimony were detected. This result indicates
that the antimony ions might have substituted the tin ions in the SnO2 lattice.
The XRD peak broadening with increasing Sb concentration indicates a decrease in the
grain size of SnO2 doped with Sb. Indeed, the crystallite sizes calculated using Scherrer
equation were ca 31, 22 and 18 nm for undoped, 5 and 10 at. % Sb doped SnO2, respectively,
as displayed in Table 5. Like Nb doping, also Sb inhibits grain growth, as reported
previously [52].
Table 5: Size of the Sb doped SnO2 crystallite calculated from XRD pattern.
Peak Peak position (2θ) FWHM (2θ) Crystallite size (nm)
Undoped SnO2
(110) 26.5127 0.3225 33
(101) 33.8012 0.3409 31
(211) 51.7065 0.3748 29
5 at. % Sb doped SnO2
(110) 26.5149 0.4300 23
(101) 33.7957 0.4493 22
(211) 51.6991 0.5153 20
10 at. % Sb doped SnO2
(110) 26.5380 0.5077 19
(101) 33.8075 0.5568 18
(211) 51.7158 0.5998 17
3.2.2 Electrical properties
The electrical conductivity increases significantly from ca 0.001 S/cm for SnO2 to
0.7 S/cm for 5 at. % Sb doped SnO2 and to 1 S/cm for 10 at. % Sb doped SnO2 sample.
Antimony can be incorporated into the SnO2 lattice as Sb5+ or as Sb3+. Terrier et al. [53]
reported that antimony was present only as Sb5+ (donor-doping), when the Sb concentration
was 3.8 %. However, the Sb3+ (acceptor-doping) amount increases with increasing doping
level. Therefore, further addition of Sb may result in the compensating effect and thus no
further increase in conductivity with increasing Nb concentration. Therefore, the high Sb
concentrations (> 10 at. %) were not characterised in this work.
Figure 21 shows conductivities of 5 and 10 at. % Sb doped SnO2 as a function of
temperature. A small increase in the conductivity of the material with temperature indicates
semiconductor behaviour of Sb doped SnO2. Similar electrical conductivity was measured by

Chapter 4: Tin dioxide as electrocatalyst support
134
Kakinuma et al. (1.2 S/cm) [54] and Yin et al. (0.99 S/cm at 80 °C) [48] for Sb doped SnO2
nanoparticles.
20 40 60 80 100
0.7
0.8
0.9
1.0
1.1
1.2
Co
nd
uct
ivit
y (
S/c
m)
Temperature (°C)
5 at. % Sb
10 at. % Sb
Figure 21: Electrical conductivity of 5 and 10 at. % Sb doped SnO2 as a function of temperature.
3.2.3 Surface properties
The nitrogen adsorption/desorption isotherms of 5 and 10 at. % Sb doped SnO2 are
displayed in Figure 22. Both isotherms showed hysteresis in the relative pressure range
between 0.7 – 1.0 (type-IV isotherms), which is typical for mesoporous materials.
The specific surface areas obtained using BET analysis were 26, 27 and 35 m2/g for undoped,
5 and 10 at. % Sb doped SnO2, respectively. Like Nb doped SnO2, 10 at. % Sb doped SnO2
exhibits enhanced surface area compared to 5 at. % Sb doped and undoped SnO2, probably
due to its smaller grain size and more hollow structure.
0.0 0.2 0.4 0.6 0.8 1.00
30
60
90
120
150
Ad
sorb
ed
qu
an
tity
(cm
3/g
)
5 % Sb
10 % Sb
Relative pressure (P/P0)
Figure 22: Nitrogen adsorption/desorption isotherms of Sb-SnO2 samples calcined at 600 °C for 4 h.

Chapter 4: Tin dioxide as electrocatalyst support
135
Modification of calcination time
Fabbri et al. [55] reported that Sb-SnO2 calcined at 550 °C for 2 h provide superior
electrochemical stability than Sb-SnO2 calcined at 550 °C for 10 h. Such behaviour was
attributed to the sublimation or dissolution of Sb during heat treatment or potential cycling.
Therefore, in this work, the calcination time was decreased from 4 to 1 h. Such change in
thermal treatment resulted in an improvement of the surface area from 35 to 42 m2/g
(Figure 23), probably due to smaller grain size of Sb-SnO2 calcined for 1 h.
0.0 0.2 0.4 0.6 0.8 1.00
30
60
90
120
150
Ad
sorb
ed q
ua
nti
ty (
cm3/g
)
Relative pressure (P/P0)
Figure 23: Nitrogen adsorption/desorption isotherms of 10 at. % Sb doped SnO2 calcined for 1 h.
Conclusions
Sb doping leads to a dramatic increase in electrical conductivity of SnO2. Furthermore,
it promoted hollow structure formation and decreased grain growth of SnO2, which lead to
higher surface area of Sb-doped SnO2 fibres. The calcination time was decreased from 4 to
1 h, to limit grain growth and to avoid sublimation of Sb. The 10 at. % Sb doped SnO2
provided higher conductivity and surface area than the 5 at. % Sb doped SnO2. Therefore,
it was selected for deposition of Pt nanoparticles obtained by microwave-assisted polyol
method. The obtained electrocatalyst was in situ characterised in a single PEMFC
(see Chapter 5). Sb-SnO2 demonstrated similar morphology and specific surface area,
but much higher electrical conductivity than Nb-SnO2, which might lead to an improved
performance of a Sb-SnO2 based cathode.

Chapter 4: Tin dioxide as electrocatalyst support
136
4 Synthesis and characterisation of Pt supported on Nb-SnO2
Pt nanoparticles were prepared by microwave-assisted polyol method as described in the
experimental part. The target Pt loading was ~30 wt. % for Nb and Sb doped SnO2 hollow
fibres with surface area of 42 m2/g (see calculations in the experimental part – Anex A). High
Pt loadings allow fabrication of thin catalyst layer, which leads to decreased mass transport
losses.
4.1 Pt deposition and physico-chemical characterisation of Pt/Nb-SnO2
Zeta potential measurements
The surface charge of the Nb-SnO2 and Pt colloids were measured as a function of pH
(Figure 24), in order to estimate the optimal pH, which favours Pt nanoparticles adsorption on
the surface of Nb-SnO2, as described in the experimental part. The surface charge of the Pt
nanoparticles was negative over the whole pH range, whereas zeta potential of tin oxide was
positive at pH 2. Therefore, after the synthesis of Pt nanoparticles and addition of the
Nb-SnO2 support, sulphuric acid was added drop-wise until the pH reached the value of 2.
2 4 6 8 10-40
-20
0
Pt
Nb-SnO2
Zet
a p
ote
nti
al
pH
Figure 24: Zeta potential as a function of pH for Pt nanoparticles and Nb doped SnO2 hollow fibres.
Morphological characterisation
TEM cross section images of 21 wt. % Pt/Nb-SnO2 is shown in Figure 25. The Pt
nanoparticles are evenly distributed on both the outer surface as well as the inner surface of
the hollow fibres. This result indicates that the inner surface of the tube is also accessible to
platinum particles, which allows high Pt dispersion. The average particle diameter was ca 3
nm, which is close to the particle size calculated from the XRD patterns (4 nm, see Table 6).

Chapter 4: Tin dioxide as electrocatalyst support
137
1 2 3 4 5 60
10
20
30
40
50
F
req
uen
cy (
%)
Pt nanoparticle size (nm)
Figure 25: TEM cross section micrographs of 21 wt. % Pt/Nb-SnO2 (left) and corresponding Pt
nanoparticle size distribution histograms obtained from measurement of 100 nanoparticles (right).
XPS analysis of Pt/Nb-SnO2 and Pt/Vulcan XC-72R
The XPS spectra of Pt4f for Pt/Nb-SnO2 and Pt/Vulcan XC-72R are shown in Figure 26.
After the curve fitting, a signal assigned to the Pt0 form is observed at 71.5 eV for both of the
electrocatalysts, while signals attributed to Pt2+ for Pt/Nb-SnO2 and Pt/Vulcan XC-72R are
observed at 72.6 and 72.3 eV, respectively. In the literature, a negative shift in the Pt 4f
binding energies for the Pt/C and Pt/oxide have been observed, which is generally attributed
to the strong metal support interactions [56]. However, in this work, peak assigned to Pt0
appears at the same position.
78 76 74 72 70
1000
2000
3000
4000
a
Experimental data
Pt4f7 A
Pt4f5 A
Pt4f7 B
Pt4f5 B
Backgnd.
Co
un
ts (
1/s
)
Binding Energy (eV)
80 78 76 74 72 700
5000
10000
Co
un
ts (
1/s
)
b
Binding energy (eV)
Spectra of Pt
Pt4f7 A
Pt4f5 A
Pt4f7 B
Pt4f5 B
Baseline
Figure 26: The Pt 4f region of the XPS spectrum of the Pt/Nb-SnO2 (a) and Pt/Vulcan XC-72R (b).
XRD analysis
As shown in Figure 27, the characteristic diffraction peaks of (111) and (200) facets of Pt
are observed at 39° 2 and 46° 2, respectively. The broadening of the diffraction peaks
indicates small size of Pt nanoparticles. Indeed, the Pt coherence length was around 4 nm
calculated from XRD spectra using the Scherrer equation. The obtained results are
summarised in Table 6.

Chapter 4: Tin dioxide as electrocatalyst support
138
35 40 45 50
SnO2
SnO2
Pt
(200)
21 % Pt /Nb-SnO2
Pt
(111) SnO2
2 Theta (°)
Inte
nsi
ty (
a.
u.)
Figure 27: XRD patterns of Pt/Nb-SnO2 sample.
Table 6: Pt crystallite size calculated from XRD pattern.
Peak Peak position (2θ) Crystallite size (nm)
(111) 40.016 4.4
(200) 46.169 4.1
4.2 Electrochemical characterisation of Pt/Nb-SnO2
The electrochemical characterisation of Pt/Nb-SnO2 was performed using a RDE, in order
to evaluate its ECSA, ORR activity and stability to potential cycling and compared to that of
commercial Pt/C electrocatalyst. Amounts of Pt and Nafion® on the RDE are showed in
Table 7.
Table 7: Mass of the Pt and Nafion on the electrode.
50 % Pt/C (JM) 33 % Pt/Vulcan 21 % Pt/Nb-SnO2
Mass of Pt (µg) 23.8 23.7 23.9
Pt loading (µg/cm2) 121.2 120.7 121.7
Mass of Nafion (µg) 10.4 15.5 9.9
Nafion loading (µg/cm) 53.1 79 50.5
4.2.1 Determination of ECSA
Figure 28a shows the cyclic voltammograms of Nb-SnO2 and Pt/Nb-SnO2. The hydrogen
adsorption-desorption peaks between 0.05 and 0.4 V were observed only for Pt/Nb-SnO2 and
not for the oxide support alone. Therefore, the ECSA calculated from the hydrogen desorption
peak was attributed to the Pt nanoparticles only and not to the Nb-SnO2. Similar behaviour for
tin oxide has been previously reported in the literature [57], although Zhang et al. [58] have
reported hydrogen adsorption-desorption signals for SnO2.

Chapter 4: Tin dioxide as electrocatalyst support
139
0.0 0.2 0.4 0.6 0.8 1.0 1.2
-3
-2
-1
0
1
2
3
a
Cu
rren
t d
en
sity
(m
A/c
m2)
Potential (V vs RHE)
Nb-SnO2
21 wt. % Pt/Nb-SnO2
0.0 0.2 0.4 0.6 0.8 1.0 1.2
-3
-2
-1
0
1
2
3
b
Nb-SnO2
13 wt. % Pt/Nb-SnO2
Cu
rren
t d
ensi
ty (
mA
/cm
2)
Potential (V vs RHE)
0.0 0.2 0.4 0.6 0.8 1.0 1.2
-40
-20
0
20
c
Pt/C
Pt/Vulcan XC-72R
Pt/NbSnO2
Cu
rren
t d
ensi
ty (
mA
/mg
Pt)
Potential (V vs RHE)
Figure 28: Cyclic voltammograms obtained for NbSnO2 and 21 wt. % Pt/Nb-SnO2 (a), 13 wt. % Pt/Nb-
SnO2 (b), Pt/Nb-SnO2, Pt/C and Pt/Vulcan XC-72R (c) at a scan rate of 50 mV/s in 1 M HClO4.
The oxidation-reduction and hydrogen adsorption/desorption region of Pt/Nb-SnO2 were
suppressed compared to that of Pt/C and Pt/Vulcan XC-72R, as shown in Figure 28b, giving
a lower electrochemically active surface area of Pt on Nb-SnO2 (25 m2/g) than that of Pt on
Vulcan XC-72R (47 m2/g), Table 8. The difference in ECSAs may be attributed to a slightly
higher Pt nanoparticles size for Pt/Nb-SnO2 (3 nm) compared with that on Pt/Vulcan XC-72R
(2.4 nm) and to a lower surface area and electrical conductivity of Nb-SnO2 (42 m2/g
and ca 10-2 S/cm). Sasaki et al. [34] reported a similar ECSA of 21.4 m2/g for
20 wt. %Pt/Sn0.98Nb0.02O2, which was lower than that of Pt/Vulcan. This result was attributed
to high Pt loading and to low surface area of Sn0.98Nb0.02O2, which was not high enough for
good Pt nanoparticles dispersion (the specific surface area of tin oxide was much lower than
that of Vulcan). Lee et al. [47] also reported that ECSA of Pt/Vulcan was much higher than
that of Pt on tin oxide due to the lower surface are of the oxide support (99.7 m2/g).
An increase of ECSA with decreasing Pt loading was attributed to the better dispersion
of Pt nanoparticles on tin oxide. In our work higher ECSA of 53 m2/g was obtained when the
Pt loading was reduced from 21 to 13 wt. % and when the Pt nanoparticles size was reduced

Chapter 4: Tin dioxide as electrocatalyst support
140
from ~3 to 2.4 nm. This result indicates that the Pt nanoparticles are more homogeneously
dispersed when Pt loading was relatively low.
Table 8: ECSA of Pt/Nb-SnO2, Pt/Vulcan XC-72R and Pt/C.
Electrocatalyst 50%Pt/C 33%Pt/Vulcan 13%Pt/Nb-SnO2 21%Pt/Nb-SnO2
ECSA (m2/g) 33 47 53 25
Pt particles size (nm) 3.8 2.4 2.4 3.0
0.2 0.4 0.6 0.8 1.0-7
-6
-5
-4
-3
-2
-1
0
Cu
rren
t d
ensi
ty (
mA
/cm
2) a
Potential (V vs RHE)
1600 rpm
900 rpm
400 rpm
2500 rpm
21 % Pt/Nb-SnO2
0.2 0.4 0.6 0.8 1.0-7
-6
-5
-4
-3
-2
-1
0
Cu
rren
t d
ensi
ty (
mA
/cm
2)
b
Potential (V vs RHE)
2500 rpm
1600 rpm
900 rpm
400 rpm
50 % Pt/C
0.2 0.4 0.6 0.8 1.0-7
-6
-5
-4
-3
-2
-1
0
Cu
rren
t d
ensi
ty (
mA
/cm
2) c
Potential (V vs RHE)
2500 rpm
1600 rpm
900 rpm
400 rpm
33 % Pt/Vulcan
0.02 0.03 0.04 0.05
0.2
0.4
0.6
d
n = 2
n = 4
Pt/C
Pt/Vulcan
Pt/Nb-SnO2
1/Rotation rate1/2
(1/rpm1/2
)
1/C
urr
ent
den
sity
(cm
2/A
)
Figure 29: Linear sweep voltammograms of Pt/Nb-SnO2 (a), Pt/C (b) and Pt/Vulcan XC-72R (c)
at different rotation rates and the inverse current densities as a function of the inverse of the square root
of the rotation rate (d).
4.2.2 Evaluation of ORR activity
Linear sweep voltammograms of Pt/Nb-SnO2, Pt/C and Pt/Vulcan XC-72R are presented
in Figure 29. All polarisation curves show an onset potential at around 0.9 VRHE. The E1/2 of
Pt/Nb-SnO2, Pt/C and Pt/Vulcan XC-72R was 0.81, 0.82 and 0.81 VRHE, respectively,
at 900 rpm, indicating similar ORR activity for all electrocatalysts. The ORR mass activities
of the different electrocatalysts at 0.8 VRHE are listed in Table 9. Pt/Nb-SnO2 showed lower
ORR mass activity than the commercial Pt/C electrocatalyst. This result may be related
to higher ECSA and higher conductivity of the Pt/C compared to the Pt/Nb-SnO2.
Zhang et al. [58] and Sasaki et al. [59],[34] also obtained higher ORR activities for
commercial Pt/C compared to the Pt supported on tin oxide.

Chapter 4: Tin dioxide as electrocatalyst support
141
Table 9: ORR mass activities and Tafel slopes for ORR on Pt/C, Pt/Vulcan XC-72R and Pt/Nb-SnO2.
Electrocatalyst Pt/C Pt/Vulcan XC-72R Pt/Nb-SnO2
ORR mass activity at 0.8 V (A/gPt) 61.4 36.5 42.7
Tafel slope (mV/dec) -55 -52 -64
The number of electrons involved in the reaction was around 3.6, 3.6 and 3.7 for Pt/Nb-
SnO2, Pt/Vulcan XC-72R and Pt/C, respectively. Thus, it can be concluded that oxygen
reduction occurs mainly via a 4 electron pathway.
Figure 30 shows Tafel plots obtained from ORR measurements at 900 rpm. Pt/Nb-SnO2
has higher Tafel slope (Table 9) compared to other electrocatalysts, which may indicate
a slightly different mechanism of oxygen reduction.
0.1 1
0.8
0.9
1.0
Pt/C
Pt/Vulcan XC-72R
Pt/Nb-SnO2
Log (current density (mA/cm2))
Po
ten
tia
l (V
vs.
RH
E)
Figure 30: Tafel plots for ORR on Pt/Nb-SnO2, Pt/C and Pt/Vulcan XC-72R at 900 rpm in 0.1 M HClO4.
4.2.3 Evaluation of the electrochemical stability
The ECSA was evaluated before and after prolonged voltage cycling, in order to compare
the stability of the Pt/Nb-SnO2 with Pt/C and Pt/Vulcan XC-72R electrocatalysts. Figure 31
shows the voltammograms of Pt/Nb-SnO2, Pt/C and Pt/Vulcan XC-72R after 100, 1000 and
2000 cycles. The ECSA loss before and after the stability test are listed in Table 10.
The ECSA decreases with the number of cycles for all samples. Generally, this phenomenon
is assigned to dissolution, migration, agglomeration and growth of Pt nanoparticles. However,
the Pt/Nb-SnO2 demonstrated a significantly lower ECSA loss of 24 % after 2000 cycles than
Pt/C (86 %) and Pt/Vulcan XC-72R (51 %) electrocatalysts, indicating better electrochemical
durability of the Pt/Nb-SnO2 to cycling to high potential. Similar ECSA loss of 20 % after
1600 cycles was demonstrated by Zhang et al. [58] for Pt/SnO2 catalyst, while Lee et al. [47]
reported higher ECSA loss of 40% after 1000 cycles for 20 wt. % Pt/Sb-SnO2. This result can
be attributed to the high electrochemical corrosion resistance of the support, and also suggests
a strong interaction between Pt nanoparticles and the oxide support.

Chapter 4: Tin dioxide as electrocatalyst support
142
0.0 0.2 0.4 0.6 0.8 1.0 1.2-6
-4
-2
0
2
4C
urr
ent
den
sity
(m
A/c
m2)
a
Potential (V vs RHE)
21 % Pt/NbSnO2
cycle 100
cycle 1000
cycle 2000
0.0 0.2 0.4 0.6 0.8 1.0 1.2-6
-4
-2
0
2
4
Cu
rren
t d
ensi
ty (
mA
/cm
2)
cycle 100
cycle 1000
cycle 2000
Potential (V vs RHE)
50% Pt/Cb
0.0 0.2 0.4 0.6 0.8 1.0 1.2-6
-4
-2
0
2
4
Cu
rren
t d
ensi
ty (
mA
/cm
2)
33 % Pt/Vulcanc
cycle 100
cycle 1000
cycle 2000
Potential (V vs RHE)
Figure 31: CV curves of Pt/Nb-SnO2 (a), Pt/C (b) and Pt/Vulcan XC-72R (c) at a scan rate of 50 mV/s.
Table 10: ECSA of Pt/Nb-SnO2, Pt/C and Pt/Vulcan before (fresh catalyst) and after (aged catalyst) 2000
potential cycles.
Sample
ECSA (m2/g) ECSA loss (%)
before cycling after cycling after cycling
Pt/Nb-SnO2 25 19 24
Pt/C 33 4 86
Pt/Vulcan XC-72R 47 23 51
ORR activity loss after stability test
The ORR mass activity was evaluated before and after these prolonged cycles, as shown
in Table 11 and Figure 32. The Pt/Nb-SnO2 electrocatalyst showed ca 90 % loss in ORR mass
activity after 2000 cycles, while Pt/C showed a 99 % loss in ORR mass activity after 2000
electrochemical cycles indicating a slightly better stability of the Pt/Nb-SnO2. High ORR
activity loss can be related to strong adsorption of anions or other molecules on the platinum
surface.
Table 11: ORR mass activities before and after the stability test at 0.8 VRHE.
Electrocatalyst Pt/C Pt/Vulcan XC-72R Pt/Nb-SnO2
ORR mass activity before stability test (A/g) 61.4 36.5 42.7
ORR mass activity after stability test (A/g) 0.3 4.3 4.3

Chapter 4: Tin dioxide as electrocatalyst support
143
1 10 1000.7
0.8
0.9
1.0
Pt/NbSnO2
Pt/C
Pt/Vulcan XC-72R
P
ote
nti
al
(V)
Mass activity (A/g)
1 10 1000.7
0.8
0.9
1.0
Pt/Nb-SnO2
Pt/C
Pt/Vulcan XC-72R
Pote
nti
al
(V)
Mass activity (A/g)
Figure 32: Mass activities of ORR measurements at 900 rpm for Pt/Nb-SnO2, Pt/Vulcan XC-72R and Pt/C
before (left) and after (right) stability test. Pt loading on the electrodes was ca 120 µg/cm2.
Transmission electron micrographs before and after stability test
Figure 33 shows the TEM images of the Pt/Nb-SnO2 as well as the distribution of the Pt
particles before and after potential cycling. The average size of Pt nanoparticles increases
after potential cycling from 3.0 to 5.3 nm. Similar particle growth during potential cycles was
observed by Lee et al. [47] for Pt loaded on Sb doped SnO2. Higher increase in average Pt
nanoparticle size after stability test is observed for Pt/Vulcan XC-72R (from 2.4 to 5.8 nm)
and for Pt/C (from 3.8 to 6.6 nm), as shown in Figure 34 and Figure 35, with broader particle
size distributions. This result is consistent with the ECSA loss as described above.
100 nm 100 nm
1 2 3 4 5 6 7 8 9 100
10
20
30
40
50
c
F
req
uen
cy (
%)
Pt nanoparticle size (nm)
3.0 nm
1 2 3 4 5 6 7 8 9 100
10
20
30
40
50
d
Fre
qu
ency
(%
)
Pt nanoparticle size (nm)
5.3 nm
Figure 33: TEM micrographs of Pt/Nb-SnO2 before (a) and after voltammetric cycling (b) and
corresponding Pt nanoparticle size distribution histograms (c and d), respectively.
b a

Chapter 4: Tin dioxide as electrocatalyst support
144
100 nm 100 nm
1 2 3 4 5 6 7 8 9 10 11 12 130
10
20
30
40
50
60
70
c
Fre
qu
ency
(%
)
Pt nanoparticle size (nm)
2.4 nm
1 2 3 4 5 6 7 8 9 10 11 12 130
10
20
30
40
50
60
70
d
Fre
qu
ency
(%
)
Pt nanoparticle size (nm)
5.8 nm
Figure 34: TEM micrographs of Pt/Vulcan XC-72R before (a) and after potential cycling (b) and
corresponding Pt nanoparticle size distribution histograms (c and d), respectively.
100 nm 100 nm
2 4 6 8 10 12 14 160
10
20
30
40
50
c
3.8 nm
Fre
qu
ency
(%
)
Pt nanoparticle size (nm)2 4 6 8 10 12 14 16
0
10
20
30
40
50
d
Fre
qu
ency
(%
)
Pt nanoparticle size (nm)
6.6 nm
Figure 35: TEM micrographs of Pt/C before (a) and after voltammetric cycling (b) and corresponding Pt
nanoparticle size distribution histograms (c and d), respectively.
a b
a b

Chapter 4: Tin dioxide as electrocatalyst support
145
Conclusions
Nb and Sb doped SnO2 fibre-in-tubes were obtained by conventional single-needle
electrospinning, without using complicated coaxial setup. The diameter of these 1 D
structures increased with increasing precursor concentration. The addition of the doping
agents such as Nb and Sb enhanced electrical conductivity of SnO2. In particular, Sb-SnO2
exhibits high conductivity of ca 1 S/cm at room temperature. In addition, electrical
conductivity of doped materials increased with the temperature, while that of carbon
decreased. Furthermore, addition of Nb and Sb doping promoted formation of hollow fibres
and inhibited SnO2 grain growth leading to an enhanced surface area of the doped materials.
Pt nanoparticles were synthesised by microwave-assisted polyol method and deposited
on Nb-SnO2. The obtained Pt/Nb-SnO2 was characterised ex situ using RDE.
The electrocatalyst exhibited higher durability upon potential cycling compared to the
commercial Pt/C. The improved durability can be attributed to the high resistance of the
oxide-based materials to corrosion and strong metal support interactions. Therefore, Nb-SnO2
hollow fibres can be an alternative support materials, which might be able to replace carbon
and therefore lead to an enhancement of the PEMFC lifetime.
Perspectives
Pt/Sb-SnO2 electrocatalyst should be characterised by RDE, in order to evaluate its ORR
activity and electrochemical stability and to compare it with that of Pt/Nb-SnO2.
Further improvement of oxide surface area and porosity is necessary in order to disperse
Pt particles more homogeneously and to enhance ECSA of Pt on oxide support. In addition,
the optimal Pt loading on the oxide needs to be determined.
The further optimisation of Pt synthesis using microwave-assisted polyol method is also
envisaged, in order to control the Pt nanoparticle size distribution.
The Pt loading on the oxide support should be confirmed by more reliable technique such
as for example inductively coupled plasma-mass spectrometric analysis (ICP-MS), after
dissolving these Pt catalysts in hot aqua regia. This method is commonly used to determine
Pt mass %.
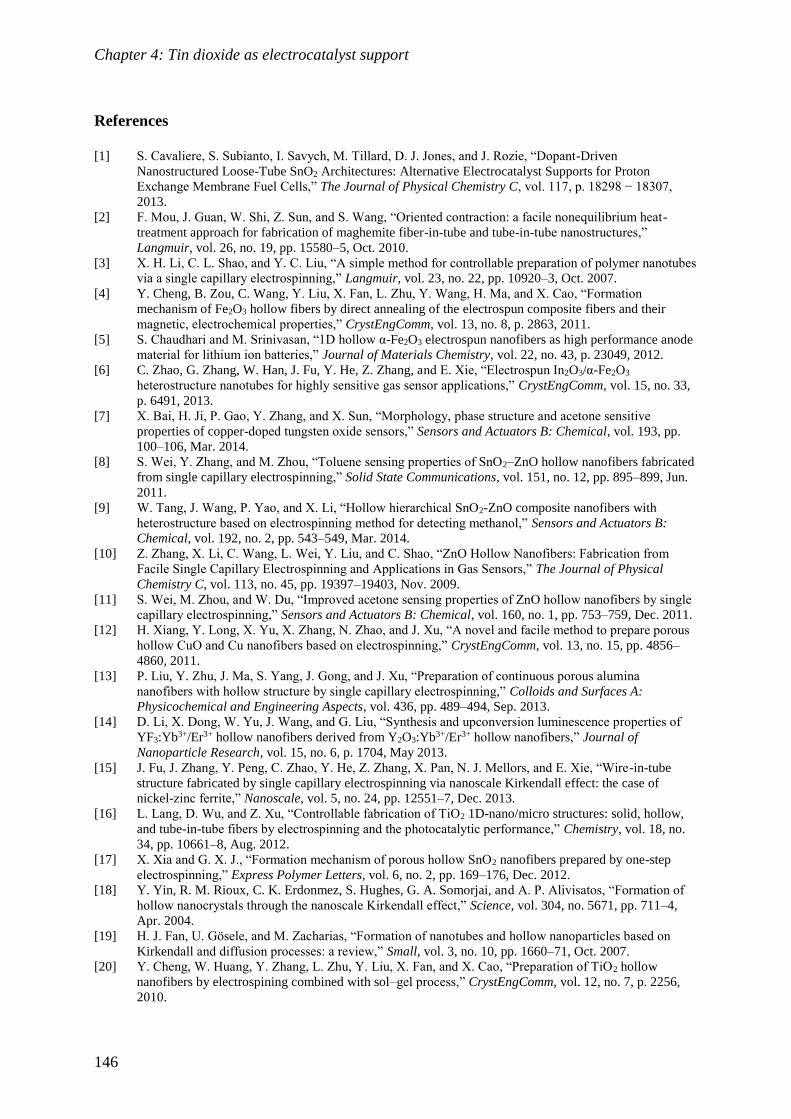
Chapter 4: Tin dioxide as electrocatalyst support
146
References
[1] S. Cavaliere, S. Subianto, I. Savych, M. Tillard, D. J. Jones, and J. Rozie, “Dopant-Driven
Nanostructured Loose-Tube SnO2 Architectures: Alternative Electrocatalyst Supports for Proton
Exchange Membrane Fuel Cells,” The Journal of Physical Chemistry C, vol. 117, p. 18298 − 18307,
2013.
[2] F. Mou, J. Guan, W. Shi, Z. Sun, and S. Wang, “Oriented contraction: a facile nonequilibrium heat-
treatment approach for fabrication of maghemite fiber-in-tube and tube-in-tube nanostructures,”
Langmuir, vol. 26, no. 19, pp. 15580–5, Oct. 2010.
[3] X. H. Li, C. L. Shao, and Y. C. Liu, “A simple method for controllable preparation of polymer nanotubes
via a single capillary electrospinning,” Langmuir, vol. 23, no. 22, pp. 10920–3, Oct. 2007.
[4] Y. Cheng, B. Zou, C. Wang, Y. Liu, X. Fan, L. Zhu, Y. Wang, H. Ma, and X. Cao, “Formation
mechanism of Fe2O3 hollow fibers by direct annealing of the electrospun composite fibers and their
magnetic, electrochemical properties,” CrystEngComm, vol. 13, no. 8, p. 2863, 2011.
[5] S. Chaudhari and M. Srinivasan, “1D hollow α-Fe2O3 electrospun nanofibers as high performance anode
material for lithium ion batteries,” Journal of Materials Chemistry, vol. 22, no. 43, p. 23049, 2012.
[6] C. Zhao, G. Zhang, W. Han, J. Fu, Y. He, Z. Zhang, and E. Xie, “Electrospun In2O3/α-Fe2O3
heterostructure nanotubes for highly sensitive gas sensor applications,” CrystEngComm, vol. 15, no. 33,
p. 6491, 2013.
[7] X. Bai, H. Ji, P. Gao, Y. Zhang, and X. Sun, “Morphology, phase structure and acetone sensitive
properties of copper-doped tungsten oxide sensors,” Sensors and Actuators B: Chemical, vol. 193, pp.
100–106, Mar. 2014.
[8] S. Wei, Y. Zhang, and M. Zhou, “Toluene sensing properties of SnO2–ZnO hollow nanofibers fabricated
from single capillary electrospinning,” Solid State Communications, vol. 151, no. 12, pp. 895–899, Jun.
2011.
[9] W. Tang, J. Wang, P. Yao, and X. Li, “Hollow hierarchical SnO2-ZnO composite nanofibers with
heterostructure based on electrospinning method for detecting methanol,” Sensors and Actuators B:
Chemical, vol. 192, no. 2, pp. 543–549, Mar. 2014.
[10] Z. Zhang, X. Li, C. Wang, L. Wei, Y. Liu, and C. Shao, “ZnO Hollow Nanofibers: Fabrication from
Facile Single Capillary Electrospinning and Applications in Gas Sensors,” The Journal of Physical
Chemistry C, vol. 113, no. 45, pp. 19397–19403, Nov. 2009.
[11] S. Wei, M. Zhou, and W. Du, “Improved acetone sensing properties of ZnO hollow nanofibers by single
capillary electrospinning,” Sensors and Actuators B: Chemical, vol. 160, no. 1, pp. 753–759, Dec. 2011.
[12] H. Xiang, Y. Long, X. Yu, X. Zhang, N. Zhao, and J. Xu, “A novel and facile method to prepare porous
hollow CuO and Cu nanofibers based on electrospinning,” CrystEngComm, vol. 13, no. 15, pp. 4856–
4860, 2011.
[13] P. Liu, Y. Zhu, J. Ma, S. Yang, J. Gong, and J. Xu, “Preparation of continuous porous alumina
nanofibers with hollow structure by single capillary electrospinning,” Colloids and Surfaces A:
Physicochemical and Engineering Aspects, vol. 436, pp. 489–494, Sep. 2013.
[14] D. Li, X. Dong, W. Yu, J. Wang, and G. Liu, “Synthesis and upconversion luminescence properties of
YF3:Yb3+/Er3+ hollow nanofibers derived from Y2O3:Yb3+/Er3+ hollow nanofibers,” Journal of
Nanoparticle Research, vol. 15, no. 6, p. 1704, May 2013.
[15] J. Fu, J. Zhang, Y. Peng, C. Zhao, Y. He, Z. Zhang, X. Pan, N. J. Mellors, and E. Xie, “Wire-in-tube
structure fabricated by single capillary electrospinning via nanoscale Kirkendall effect: the case of
nickel-zinc ferrite,” Nanoscale, vol. 5, no. 24, pp. 12551–7, Dec. 2013.
[16] L. Lang, D. Wu, and Z. Xu, “Controllable fabrication of TiO2 1D-nano/micro structures: solid, hollow,
and tube-in-tube fibers by electrospinning and the photocatalytic performance,” Chemistry, vol. 18, no.
34, pp. 10661–8, Aug. 2012.
[17] X. Xia and G. X. J., “Formation mechanism of porous hollow SnO2 nanofibers prepared by one-step
electrospinning,” Express Polymer Letters, vol. 6, no. 2, pp. 169–176, Dec. 2012.
[18] Y. Yin, R. M. Rioux, C. K. Erdonmez, S. Hughes, G. A. Somorjai, and A. P. Alivisatos, “Formation of
hollow nanocrystals through the nanoscale Kirkendall effect,” Science, vol. 304, no. 5671, pp. 711–4,
Apr. 2004.
[19] H. J. Fan, U. Gösele, and M. Zacharias, “Formation of nanotubes and hollow nanoparticles based on
Kirkendall and diffusion processes: a review,” Small, vol. 3, no. 10, pp. 1660–71, Oct. 2007.
[20] Y. Cheng, W. Huang, Y. Zhang, L. Zhu, Y. Liu, X. Fan, and X. Cao, “Preparation of TiO2 hollow
nanofibers by electrospining combined with sol–gel process,” CrystEngComm, vol. 12, no. 7, p. 2256,
2010.

Chapter 4: Tin dioxide as electrocatalyst support
147
[21] C. Jiang, G. Zhang, Y. Wu, L. Li, and K. Shi, “Facile synthesis of SnO2 nanocrystalline tubes by
electrospinning and their fast response and high sensitivity to NOx at room temperature,”
CrystEngComm, vol. 14, no. 8, p. 2739, 2012.
[22] C. Gao, X. Li, B. Lu, L. Chen, Y. Wang, F. Teng, J. Wang, Z. Zhang, X. Pan, and E. Xie, “A facile
method to prepare SnO2 nanotubes for use in efficient SnO2-TiO2 core-shell dye-sensitized solar cells,”
Nanoscale, vol. 4, no. 11, pp. 3475–81, Jun. 2012.
[23] H. An and H. Ahn, “Processing Research Morphology control of Nb-doped SnO2 nanofibres formed via
electrospinning: From hollow nanofibres to dense nanofibres,” Journal of Ceramic Processing Research,
vol. 14, no. 3, pp. 371–375, 2013.
[24] J. P. Cheng, B. B. Wang, M. G. Zhao, F. Liu, and X. B. Zhang, “Nickel-doped tin oxide hollow
nanofibers prepared by electrospinning for acetone sensing,” Sensors and Actuators B: Chemical, vol.
190, pp. 78–85, Jan. 2014.
[25] L. Li, X. Yin, S. Liu, Y. Wang, L. Chen, and T. Wang, “Electrospun porous SnO2 nanotubes as high
capacity anode materials for lithium ion batteries,” Electrochemistry Communications, vol. 12, no. 10,
pp. 1383–1386, Oct. 2010.
[26] J.-K. Choi, I.-S. Hwang, S.-J. Kim, J.-S. Park, S.-S. Park, U. Jeong, Y. C. Kang, and J.-H. Lee, “Design
of selective gas sensors using electrospun Pd-doped SnO2 hollow nanofibers,” Sensors and Actuators B:
Chemical, vol. 150, no. 1, pp. 191–199, Sep. 2010.
[27] J. Kong, S. Y. Wong, Y. Zhang, H. R. Tan, X. Li, and X. Lu, “One-dimensional carbon–SnO2 and SnO2
nanostructures via single-spinneret electrospinning: tunable morphology and the underlying
mechanism,” Journal of Materials Chemistry, vol. 21, no. 40, p. 15928, 2011.
[28] P. Mohanapriya, H. Segawa, K. Watanabe, K. Watanabe, S. Samitsu, T. S. Natarajan, N. V. Jaya, and N.
Ohashi, “Enhanced ethanol-gas sensing performance of Ce-doped SnO2 hollow nanofibers prepared by
electrospinning,” Sensors and Actuators B: Chemical, vol. 188, pp. 872–878, Nov. 2013.
[29] J. Wu, D. Zeng, and S. Zhang, “Mesoporous Al-doped SnO2 nanotubes with enhanced gas-sensing
properties fabricated by electrospinning,” in AMA Conferences - Sensor Materials, 2013, pp. 257–262.
[30] Y.-E. Miao, S. He, Y. Zhong, Z. Yang, W. W. Tjiu, and T. Liu, “A novel hydrogen peroxide sensor
based on Ag/SnO2 composite nanotubes by electrospinning,” Electrochimica Acta, vol. 99, pp. 117–123,
Jun. 2013.
[31] V. Aravindan, J. Sundaramurthy, E. N. Kumar, P. S. Kumar, W. C. Ling, R. von Hagen, S. Mathur, S.
Ramakrishna, and S. Madhavi, “Does carbon coating really improves the electrochemical performance
of electrospun SnO2 anodes?,” Electrochimica Acta, vol. 121, pp. 109–115, Mar. 2014.
[32] R. A. Kadir, Z. Li, A. Z. Sadek, R. A. Rani, A. S. Zoolfakar, M. R. Field, J. Z. Ou, A. F. Chrimes, and K.
Kalantar-zadeh, “Electrospun Granular Hollow SnO2 Nano fibers Hydrogen Gas Sensors Operating at
Low Temperatures,” The Journal of Physical Chemistry C, vol. 118, pp. 3129–3139, 2014.
[33] F. Takasaki, S. Matsuie, Y. Takabatake, Z. Noda, a. Hayashi, Y. Shiratori, K. Ito, and K. Sasaki,
“Carbon-Free Pt Electrocatalysts Supported on SnO2 for Polymer Electrolyte Fuel Cells: Electrocatalytic
Activity and Durability,” Journal of The Electrochemical Society, vol. 158, no. 10, p. B1270, 2011.
[34] T. Tsukatsune, Y. Takabatake, Z. Noda, A. Hayashi, and K. Sasaki, “Electrochemical Properties and
Durability of Electrocatalysts Supported on SnO2,” ECS Transactions, vol. 58, no. 1, pp. 1251–1257,
2013.
[35] K. Kanda, Z. Noda, Y. Nagamatsu, T. Higashi, S. Taniguchi, S. M. Lyth, a. Hayashi, and K. Sasaki,
“Negligible Start-Stop-Cycle Degradation in a PEFC Utilizing Platinum-Decorated Tin Oxide
Electrocatalyst Layers with Carbon Fiber Filler,” ECS Electrochemistry Letters, vol. 3, no. 4, pp. F15–
F18, Feb. 2014.
[36] I. T. Weber, R. Andrade, E. R. Leite, and E. Longo, “A study of the SnO2 Nb2O5 system for an ethanol
vapour sensor: a correlation between microstructure and sensor performance,” Sensors and Actuator,
vol. 72, pp. 180–183, 2001.
[37] K. Kakinuma, Y. Chino, Y. Senoo, M. Uchida, T. Kamino, H. Uchida, S. Deki, and M. Watanabe,
“Characterization of Pt catalysts on Nb-doped and Sb-doped SnO2–δ support materials with aggregated
structure by rotating disk electrode and fuel cell measurements,” Electrochimica Acta, vol. 110, pp. 316–
324, Nov. 2013.
[38] H. Mahmoudi Chenari, L. Weinhardt, N. S. Rodriguez Lastra, M. a. Ernst, F. Reinert, M. M. Golzan, and
A. Hassanzadeh, “Structural properties and x-ray photoelectron spectroscopic study of SnO2
nanoparticles,” Materials Letters, vol. 85, pp. 168–170, Oct. 2012.
[39] T. S. Ribeiro, J. M. Sasaki, and I. F. Vasconcelos, “Structural disorder of ball-milled, nanosized, Fe-
doped SnO2: X-ray diffraction and Mössbauer spectroscopy characterization,” Journal of Materials
Science, vol. 47, no. 6, pp. 2630–2636, Nov. 2012.

Chapter 4: Tin dioxide as electrocatalyst support
148
[40] W. Fliegel, G. Behr, J. Werner, and G. Krabbes, “Preparation, development of microstructure, electrical
and gas- sensitive properties of pure and doped SnO2, powders,” Sensors and Actuators, vol. 19, pp. 18–
19, 1994.
[41] A. Diéguez, A. Romano-Rodrı́guez, A. Vilà, and J. R. Morante, “The complete Raman spectrum of
nanometric SnO2 particles,” Journal of Applied Physics, vol. 90, no. 3, p. 1550, 2001.
[42] J.-M. Themlin, M. Chtaib, L. Henrard, P. Lambin, J. Darville, and J. Gilles, “Characterization of tin
oxides by x-ray-photoemission spectroscopy,” Physical Review B, vol. 46, no. 4, pp. 2460–2466, 1992.
[43] S. Kaciulis, L. Pandolfi, E. Comini, G. Faglia, M. Ferroni, G. Sberveglieri, S. Kandasamy, M. Shafiei,
and W. Wlodarski, “Nanowires of metal oxides for gas sensing applications,” Surface and Interface
Analysis, vol. 40, no. 3–4, pp. 575–578, Mar. 2008.
[44] D. Wagner, “Chemical Shifts of Auger Lines, and the Auger Parameter,” Farad. Discuss. Chem. Soc.,
vol. 60, p. 291, 1975.
[45] V. M. Jiménez, J. A. Mejias, J. P. Espinds, and A. R. Gonzfilez-Elipe, “Interface effects for metal oxide
thin films deposited on another metal oxide II SnO2 deposited on SiO2,” Surface Science, vol. 366, pp.
545–555, 1996.
[46] S. G. Kim, M. J. Ju, I. T. Choi, W. S. Choi, H.-J. Choi, J.-B. Baek, and H. K. Kim, “Nb-doped TiO2
nanoparticles for organic dye-sensitized solar cells,” RSC Advances, vol. 3, no. 37, p. 16380, 2013.
[47] K. Lee, I. Park, Y. Cho, D. Jung, N. Jung, H. Park, and Y. Sung, “Electrocatalytic activity and stability
of Pt supported on Sb-doped SnO2 nanoparticles for direct alcohol fuel cells,” Journal of Catalysis, vol.
258, no. 1, pp. 143–152, Aug. 2008.
[48] M. Yin, J. Xu, Q. Li, J. O. Jensen, Y. Huang, L. N. Cleemann, N. J. Bjerrum, and W. Xing, “Highly
active and stable Pt electrocatalysts promoted by antimony-doped SnO2 supports for oxygen reduction
reactions,” Applied Catalysis B: Environmental, vol. 144, pp. 112–120, Jan. 2014.
[49] J. Suffner, S. Kaserer, H. Hahn, C. Roth, and F. Ettingshausen, “Sb-Doped SnO2 Hollow Spheres
Offering Micro- and Nanoporosity in Fuel Cell Electrode Structures,” Advanced Energy Materials, vol.
1, no. 4, pp. 648–654, Jul. 2011.
[50] M. P. Gurrola, M. Guerra-Balcázar, L. Álvarez-Contreras, R. Nava, J. Ledesma-García, and L. G.
Arriaga, “High surface electrochemical support based on Sb-doped SnO2,” Journal of Power Sources,
vol. 243, pp. 826–830, Dec. 2013.
[51] M. P. Gurrola, J. Gutiérrez, S. Rivas, M. Guerra-Balcázar, J. Ledesma-García, and L. G. Arriaga,
“Evaluation of the corrosion of Sb-doped SnO2 supports for electrolysis systems,” International Journal
of Hydrogen Energy, pp. 2–9, Mar. 2014.
[52] V. Senthilkumar, P. Vickraman, M. Jayachandran, and C. Sanjeeviraja, “Structural and electrical studies
of nano structured Sn1−xSbxO2 (x = 0.0, 1, 2.5, 4.5 and 7 at%) prepared by co-precipitation method,”
Journal of Materials Science: Materials in Electronics, vol. 21, no. 4, pp. 343–348, Jun. 2009.
[53] C. Terriera, J. P. Chatelon, R. Berjoan, and J. A. Rogera, “Sb-doped SnO2, transparent conducting oxide
from the sol-gel dip-coating technique,” Thin Solid Films, vol. 263, pp. 37–41, 1995.
[54] K. Kakinuma, M. Uchida, T. Kamino, H. Uchida, and M. Watanabe, “Synthesis and electrochemical
characterization of Pt catalyst supported on Sn0.96Sb0.04O2−δ with a network structure,”
Electrochimica Acta, vol. 56, no. 7, pp. 2881–2887, Feb. 2011.
[55] E. Fabbri, A. Rabis, R. Kötz, and T. J. Schmidt, “Pt nanoparticles supported on Sb-doped SnO2 porous
structures: developments and issues,” Physical Chemistry Chemical Physics, 2014.
[56] N. Zhang, S. Zhang, C. Du, Z. Wang, Y. Shao, F. Kong, Y. Lin, and G. Yin, “Pt/Tin Oxide/Carbon
Nanocomposites as Promising Oxygen Reduction Electrocatalyst with Improved Stability and Activity,”
Electrochimica Acta, vol. 117, pp. 413–419, Jan. 2014.
[57] M. Dou, M. Hou, D. Liang, W. Lu, Z. Shao, and B. Yi, “SnO2 nanocluster supported Pt catalyst with
high stability for proton exchange membrane fuel cells,” Electrochimica Acta, vol. 92, pp. 468–473,
Mar. 2013.
[58] P. Zhang, S.-Y. Huang, and B. N. Popov, “Mesoporous Tin Oxide as an Oxidation-Resistant Catalyst
Support for Proton Exchange Membrane Fuel Cells,” Journal of The Electrochemical Society, vol. 157,
no. 8, p. B1163, 2010.
[59] F. Takasaki, Z. Noda, A. Masao, Y. Shiratori, K. Ito, and K. Sasaki, “Carbon-free Pt Electrocatalysts
Supported on Doped SnO2 for Polymer Electrolyte Fuel Cells,” ECS Transactions, vol. 25, no. 1, pp.
831–837, 2009.

CHAPTER 5:
In situ characterisation of platinum supported
on doped tin oxide nanotube as a cathode
electrocatalyst for PEMFC


Chapter 5: In situ characterisation of Pt/Nb-SnO2 as a cathode electrocatalyst for PEMFC
151
1 Introduction
Most of the electrochemical characterisation of doped oxide supported Pt reported in the
literature has been performed ex situ using RDE. There are few studies focused on the
characterisation of Pt/tin oxide as a cathode in a single fuel cell with Nafion® [1],[2],[3] and
even fewer with PBI membrane [4], as listed in Table 1.
In these studies, Pt/C at the cathode side usually provides better performance in PEMFC
than oxide supported Pt, due to the lower electrical conductivity and surface area of oxide
compared with that of carbon support. Several approaches have been developed to overcome
the problem of low conductivity of the support. On the one hand, Popov’s group [1],[5],[6]
used high Pt loadings of around 60 wt.% on oxide supports (namely TiO2 and SnO2), in order
to obtain a very thin catalyst layer (~1 µm). In this case, Pt nanoparticles not only play the role
of a catalyst, but also ensure the electron transport [5]. Furthermore, oxide-based supports
provide the ability to obtain thin catalyst layers due to their higher density compared with that
of carbon. Thin electrodes allow an increase of the current density at potentials lower than
0.7 V due to improved mass transport kinetics. For instance, the 3M NSTF-type catalysts [7]
are ultrathin cathode layers (~0.27 µm) based on sputtered platinum on stacked perylene red
nano-whiskers, which showed 100 % catalyst utilisation with low mass transport losses at high
current densities. On the other hand, composite support materials containing both carbon and
oxide are widely used to improve conductivity and surface area of ceramic supports.
For instance, Sb doped SnO2 (ATO) loaded on carbon nanotubes (CNT) provided improved
surface area and conductivity compared to pure ATO support, which resulted in enhanced
HT-PEMFC performance of a Pt/ATO-CNT based MEA [4]. Furthermore, Pt/ATO-C provides
higher ECSA and ORR activity than Pt/ATO [8].
In this chapter, the performance and the stability of Pt/Nb-SnO2 based catalyst layers were
evaluated with Nafion® and PBI membranes in a single PEMFC. The effect of addition
of Vulcan XC-72R to the catalyst layer was evaluated in terms of initial performance and
performance after potential cycling. Later in this chapter, Pt supported on more conductive
electrospun Sb-SnO2 (compared to Nb-SnO2) was also characterised as cathode catalyst
in a single PEMFC.

Chapter 5: In situ characterisation of Pt/Nb-SnO2 as a cathode electrocatalyst for PEMFC
152
Table 1: Characterisation of tin oxide supported Pt in situ in single PEMFC
Reference Electrocatalyst
on the cathode
side
Pt
loading,
mgPt/cm2
Catalyst
deposition
method
Operating
conditions
Comparison with
commercial Pt/C
with PFSA membrane
Masao
2009 [9]
Pt/SnO2 0.6 spray-printing on
carbon paper
H2/air, 80 °C,
100 % RH
comparable performance
to that of Pt/C
Zhang
2010 [1]
Pt/SnO2 0.5 spray-coated
onto a GDL
H2/O2, 75 °C,
100 % RH
0.74 W/cm2, lower power
density, but higher
stability than that of Pt/C
Sasaki
2010 [10]
Pt/SnO2 - - H2/air, 80 °C,
100 % RH, 1 bar
comparable performance
to that of Pt/C
Suchsland
2012 [11]
Pt/Sb-SnO2 0.1 CCM method by
decal process
H2/air, 85 °C,
50 % RH, 1.5 bar
lower performance than
that of Pt/C (Sb leaches
out of Sb-SnO2)
Kakinuma
2013 [3]
Pt/Sn0.96Nb0.04Oδ
Pt/Sn0.96Sb0.04Oδ
0.2 sprayed onto a
GDL
H2/air, 80 °C,
53 % RH
lower than that of Pt/C
(Sn cation dissolution of
Sn0.96Sb0.04Oδ)
Higashi
2013 [12]
Pt/Sn0.96Nb0.04O2
0.5 by pulse laser
deposition(oxide)
sputtering (Pt)
H2/air, 80 °C
lower power density, but
higher stability than that
of Pt/C
Kanda
2014 [2]
Pt/Nb-SnO2 with
carbon nanofibre
filler
0.5 spray printing H2/air, 80 °C
44 % RH (cathode)
higher performance than
that of Pt/Nb-SnO2
without carbon
with PBI/H3PO4 membrane
Xu
2013 [4]
Pt/Sb-SnO2 0.7 spraying H2/air,
120 – 200 °C
Lower performance than
that of Pt/CNT
and Pt/Sb-SnO2-CNT

Chapter 5: In situ characterisation of Pt/Nb-SnO2 as a cathode electrocatalyst for PEMFC
153
2 Characterisation of Pt/Nb-SnO2 based MEA with Nafion® membrane
Electrodes were prepared using the catalyst coated substrate (CCS) method. For this
purpose, Pt/Nb-SnO2 or commercial Pt/C electrocatalysts were dispersed in ethanol and
Nafion® solution by ultra-sonication. The obtained catalyst inks were sprayed onto the GDL
(Sigracet 10 BC, 4 cm2) and dried at 80 °C on a hot plate protected by aluminium foil. Spraying
was performed using a BADGER 360 air brash. The thickness of obtained electrodes was
around 10 µm. The porosities were ca 43 and 45 % for Pt/Nb-SnO2 and Pt/C based cathodes,
respectively, as calculated in the experimental part (Annex A). The loading of Pt and Nafion®
are listed in Table 2.
Table 2: Cathode catalyst layer composition.
Composition of 50 wt. % Pt/C based MEA
Pt loading 0.5 mg/cm2
Nafion® loading 0.5 mg/cm2
Carbon loading 0.5 mg/cm2
Pt loading on the anode (GDE) provided by JM 0.4 mg/cm2
Composition of 21 wt. % Pt/Nb-SnO2 based MEA with Vulcan XC-72R
Pt loading 0.5 mg/cm2
Nafion® loading 0.5 mg/cm2
Nb-SnO2 loading 2 mg/cm2
Vulcan XC-72R loading 0.125 mg/cm2
Pt loading on the anode (GDE) provided by JM 0.4 mg/cm2
The obtained cathodes were hot-pressed at 140 °C for 2 min at 250 kg/cm2 together with
a Nafion® 212 membrane (thickness ~50 µm) and an anode provided by Johnson Matthey
(JM), in order to prepare Pt/Nb-SnO2, Pt/Nb-SnO2-Vulcan and Pt/C based MEAs. The MEAs
were tested in a single PEMFC. Experimental conditions are listed in Table 3.
Table 3: PEMFC testing conditions.
Break-in 0.5 A/cm2, 12 h, 80 °C, 100 % RH
FC temperature 80 °C
Relative humidity (RH) 100 %
Pressure 2 bar (abs)
Gases stoichiometry H2/O2 – 1.5/2
2.1 Performance evaluation of Pt/Nb-SnO2 based MEA
The polarisation curves for MEAs with Pt/Nb-SnO2, Pt/Nb-SnO2-Vulcan and Pt/C cathodes
are shown in Figure 1. The Pt/Nb-SnO2-MEA provided a maximum power density of
0.41 W/cm2, which is relatively high given that the electrode was not optimised in terms of Pt
or ionomer loading or its porosity. The Pt/C-MEA provides higher maximum power density of
0.96 W/cm2 indicating higher Pt utilisation for the commercial catalyst. The initial voltage drop

Chapter 5: In situ characterisation of Pt/Nb-SnO2 as a cathode electrocatalyst for PEMFC
154
at low current density for Pt/Nb-SnO2-MEA is compatible with the lower ORR activity and
ECSA of Pt/Nb-SnO2 described in Chapter 4. Further voltage losses in the ohmic region can be
attributed to the relatively low electron conductivity of tin oxide compared to the carbon-based
support.
To enhance the cathode conductivity, Vulcan XC-72R was added to the catalyst ink. The
obtained loading of Vulcan XC-72R was 0.125 mg/cm2. This resulted in a higher fuel cell
performance, particularly in the ohmic region, caused by the increased conductivity of the
catalyst layer. Thus, the maximum power density was enhanced from 0.41 W/cm2 for
Pt/Nb-SnO2-MEA to 0.61 W/cm2 for Pt/Nb-SnO2-Vulcan-MEA.
Sasaki et al. [12] and Popov et al. [1] also demonstrated that an MEA having a cathode
of Pt supported on SnO2 showed lower fuel cell performance than one with a Pt/C cathode.
In a more recent work of Sasaki et al. [2], carbon fibres were added as a conducting filler to the
catalyst layer which resulted in increased conductivity of the Pt/Nb-SnO2 based electrodes and
increased performance of the tin oxide based MEA.
0.0 0.5 1.0 1.5 2.0
0.0
0.2
0.4
0.6
0.8
1.0
0.41 W/cm2
0.61 W/cm2
21% Pt/NbSnO2
20% Pt/NbSnO2+Vulcan
50% Pt/C
Po
ten
tia
l (V
)
Current density (A/cm2)
0.96 W/cm2
0.0
0.2
0.4
0.6
0.8
1.0
Po
wer
den
sity
(W
/cm
2)
Figure 1: Polarisation curves for Pt/Nb-SnO2 (100 % RH), Pt/Nb-SnO2-Vulcan (50 % RH for cathode,
64 °C) and Pt/C (100 % RH) based MEAs at 80 °C under H2/O2 (1.5:2) and 2 bar (abs).
2.2 Electrochemical impedance spectroscopy (EIS)
During an EIS experiment, a sinusoidal current (I) or potential (E) is applied with a small
amplitude (∆I or ∆E):
E = ∆E sin(2πft), where f is frequency and t is time.

Chapter 5: In situ characterisation of Pt/Nb-SnO2 as a cathode electrocatalyst for PEMFC
155
The response is also sinusoidal with the same frequency, but different amplitude (∆I) and
phase (φ):
I = ∆I sin(2πft + φ)
The impedance is defined as:
Z = E/I
It can also be expressed in Cartesian coordinates as:
Z = Zre + iZim, where Zre and Zim are real and imaginary parts, respectively.
An impedance spectrum is commonly plotted in Nyquist form, where the imaginary part of
the impedance is plotted versus the real part at each frequency.
A Randles circuit [13] is often used to describe a single semicircle loop resulting from the
impedance measurements (Figure 2). In the PEM fuel cell, the high frequency intercept of the
semicircle with the real axis represents the total ohmic resistance (Rel) of the cell components
such as membrane, catalyst layer, GDL and bipolar plates. Generally, it is mostly related to the
membrane proton conductivity. The diameter of the semicircle (also called as kinetic loop)
corresponds to the charge transfer resistance of the cathode (Rct) (due to the fast kinetics
of HOR compared to that of ORR).
In real systems, the electrode surface is porous leading to deformations of the impedance
diagram. In this case, the double layer capacity (Cdl) on the electrode-electrolyte interface)
is often replaced by a constant phase element (CPE) to describe the depressed semicircle due
to the distribution of double layer charging along the length of the pores [14]. An impedance
of CPE can be expressed as [15]:
ZCPE (ω) = q−1 (iω )−α,
where: q is a factor of proportionality, and α is the CPE exponent that characterises the phase
shift, ω = 2πf. For porous electrodes α ~ 0.5, whereas for a smooth electrodes α ~ 1.
It is possible to evaluate double layer capacitance (Cdl) using CPE (q) [16]:
Cdl = [q (1/ Rel + 1/Rct)α-1]1/α
The impedance spectra in Figure 2 consist of one semicircle, which is attributed to oxygen
reduction on the cathode due to the fast kinetics of hydrogen oxidation reaction.
Figure 2: Randles circuit (left) and corresponding Nyquist plot (right) [15].

Chapter 5: In situ characterisation of Pt/Nb-SnO2 as a cathode electrocatalyst for PEMFC
156
Warburg impedance (W) is usually added to the Randles model, as shown in Figure 3 [15].
It describes the resistance associated with the mass and ionic transport process in the electrode.
Figure 3: Mixed kinetic and diffusion control equivalent circuit (left) and corresponding Nyquist plot
(right) [15].
0.0 0.2 0.4 0.6 0.8 1.00.0
0.2
0.4
0.6
0.8
1.0
a
21 % Pt/NbSnO2
0.1 A/cm2
0.3 A/cm2
0.5 A/cm2
ZRe(Ohm cm2)
ZIm
(Oh
m c
m2)
80 °C
0.0 0.2 0.4 0.6 0.8 1.00.0
0.2
0.4
0.6
0.8
1.0
b
0.1 A/cm2
0.3 A/cm2
0.5 A/cm2
80 °C
21 % Pt/NbSnO2+Vulcan
ZRe(Ohm cm2)
ZIm
(Oh
m c
m2)
0.0 0.2 0.4 0.6 0.8 1.00.0
0.2
0.4
0.6
0.8
1.0
c
0.1 A/cm2
0.3 A/cm2
0.5 A/cm2
ZRe(Ohm cm2)
ZIm
(Oh
m c
m2)
50 % Pt/C
80 °C
Figure 4: Nyquist plot of Pt/Nb-SnO2 (a), Pt/Nb-SnO2-Vulcan (b) and Pt/C (c) based MEAs for different
current densities, over the frequency range from 20 kHz to 100 mHz.

Chapter 5: In situ characterisation of Pt/Nb-SnO2 as a cathode electrocatalyst for PEMFC
157
Figure 4 shows the impedance spectra of the Pt/C, Pt/Nb-SnO2 and Pt/Nb-SnO2-Vulcan
based MEAs obtained at different current densities. The Randles circuit was used to fit the
single semicircle loop measured at low current densities. Parameters obtained using simulation
in EC-Lab software (Randomized + Simplex method) are summarised in Table 4. The relative
uncertainty (χ2) was ca 10-2, which was considered as acceptable. The ohmic resistance mainly
attributed to the membrane resistance was ca 70 mΩ cm2 for Pt/C-MEA, which is expected for
Nafion® 212 membrane (50 µm). In the case of the Pt/Nb-SnO2 based MEA, the ohmic
resistance was higher (88 - 95 mΩcm2). This could result from lower membrane hydration
caused by slower electrocatalysis with the Pt/Nb-SnO2. In addition, high Rel can be attributed
to presence of Nb-SnO2 in the MEA, which provides higher resistance than carbon support.
Relatively low Nb-SnO2 conductivity can also cause higher charge transfer resistance of
Pt/Nb-SnO2-MEA compared to that of Pt/C-MEA. However, addition of Vulcan XC-72R
results in decrease of Rct, as shown in Table 4. The Rct decreases with increasing current
density from 0.1 to 0.5 A/cm2 for all MEAs due to the increasing driving force for the charge
transfer reaction.
Table 4: The values of the Randles cell components obained by fitting the impedance spectra.
A/cm2 Rel, Ωcm2 Rct, Ωcm2 CPE α Cdl, Fcm2
Pt/Nb-SnO2
0.1 0.095 0.835 0.092 0.79 0.021
0.3 0.090 0.460 0.120 0.78 0.025
0.5 0.088 0.404 0.145 0.78 0.027
Pt/Nb-SnO2-Vulcan
0.1 0.093 0.820 0.521 0.84 0.260
0.3 0.090 0.386 0.375 0.88 0.203
0.5 0.090 0.292 0.327 0.91 0.200
Pt/C
0.1 0.071 0.503 0.287 0.88 0.152
0.3 0.072 0.180 0.296 0.87 0.123
0.5 0.070 0.114 0.282 0.88 0.120

Chapter 5: In situ characterisation of Pt/Nb-SnO2 as a cathode electrocatalyst for PEMFC
158
2.3 Durability evaluation of the Pt/Nb-SnO2 based MEA
In order to investigate the stability of MEAs, an accelerated stress test was performed.
During each cycle, the potential was stepped between 0.9 and 1.4 V with a holding period
of 3 s at each potential on the cathode side. Kakinuma et al. [17] performed a similar test
protocol for durability evaluation of the Pt/Sb-SnO2 based MEA, where the potential was
stepped between 0.9 V and 1.3 V with a holding period of 30 s at each potential. Experimental
conditions for the stability test are listed in Table 5.
Table 5: Accelerated stress test conditions.
T, °C 80 °C
RH 100 %
Pressure 2 bar (abs)
Gases stoichiometry H2/O2 – 1.5/2
Protocol of one cycle 0.9 V for 3 s and then 1.4 V for 3 s
Number of cycles 1200
The polarisation curves of MEAs based on Pt/Nb-SnO2 and Pt/C cathode catalysts before
and after this accelerated stress test are depicted in Figure 5. The initial open circuit voltage
(OCV) was around 0.96 V for both MEAs and remained practically unchanged after the
accelerated stress test, indicating that membrane conductivity was not affected by the stability
test.
The performance of the MEA with the cathode comprising Pt/Nb-SnO2 stayed almost
unchanged, whereas for that with Pt/C cathode, a dramatic drop in performance was observed
already after 400 cycles. The performance loss particularly in the ohmic and mass-transfer
regions is attributed to a decrease in the conductivity of the catalyst layer and to mass-transport
losses. At high potential (1.4 V), oxidation leads to functionalisation of the carbon surface,
which results in an increase in the hydrophilicity of the catalyst layer and high mass-transport
overpotentials [18] (see Chapter 1). The loss of the fuel cell performance is also related to the
thinning of catalyst layer due to detachment, migration and three-phase-boundary isolation
of Pt nanoparticles as a result of carbon corrosion (see paragraph 2.6). In contrast to the results
with the Pt/oxide-only cathode, the Pt/Nb-SnO2-Vulcan-MEA also shows a significant voltage
drop upon potential cycling which, it may be deduced, is due to Vulcan XC-72R corrosion
leading to a decrease of cathode conductivity.
A slight increase in performance of the Pt/Nb-SnO2-MEA was observed after 400 cycles,
probably caused by the improved mass-transfer properties of the cathode. Sasaki et al. [12] also
reported an increase in performance of Pt/SnO2 based MEA in the mass transport region after

Chapter 5: In situ characterisation of Pt/Nb-SnO2 as a cathode electrocatalyst for PEMFC
159
potential cycling between 1.0 and 1.5 V for 2 sec per cycle. However, a slight voltage decrease
was observed at low current densities after the stability test for Pt/Nb-SnO2-MEA, indicating
a decrease in ORR activity probably caused by some agglomeration and growth
of Pt nanoparticles (see paragraph 2.5).
The greater stability of the tin oxide based electrocatalyst at high potentials can be assigned
to the corrosion resistance of such support, already demonstrated in ex situ tests (see Chapter 4)
and strong metal support interactions.
0.0 0.5 1.0 1.5 2.00.0
0.2
0.4
0.6
0.8
1.0
a
Po
ten
tia
l (V
)
Current density (A/cm2)
before stability test
after 400 cycles
after 1000 cycles
80 °C
21 % Pt/Nb-SnO2
0.0 0.5 1.0 1.5 2.00.0
0.2
0.4
0.6
0.8
1.0
b
20 % Pt/NbSnO
2
0.125 mg/cm2 of Vulcan
Po
ten
tia
l (V
)
Current density (A/cm2)
before stability test
after 400 cycles
after 1200 cycles
80 °C
0.0 0.5 1.0 1.5 2.00.0
0.2
0.4
0.6
0.8
1.0
c
50 % Pt/C
Current density (A/cm2)
80 °C
Po
ten
tia
l (V
)
before stability test
after 400 cycles
after 1000 cycles
Figure 5: Polarisation curves for PEMFCs with Pt/Nb-SnO2 (a), Pt/Nb-SnO2-Vulcan (b) and Pt/C (c)
electrocatalysts before and after potential cycling 0.9-1.4 V at 80 °C.
2.4 Evaluation of MEA durability using impedance spectroscopy
In order to investigate the durability over time of the catalyst layer, electrochemical
impedance spectroscopy was carried out before and after the stability test. Impedance spectra
of Pt/Nb-SnO2, Pt/C and Pt/NbSnO2-Vulcan based MEAs at 80 °C are shown in Figure 6.
Ohmic and charge transfer resistance obtained after the fitting using Randles model are
summarised in Table 6.
The charge transfer resistance increases significantly with the number of potential cycles
from 0.5 to 0.9 Ω cm2 for Pt/C-MEA, whereas it remains almost unchanged upon cycling for
the Pt/Nb-SnO2-MEA, indicating its high stability.

Chapter 5: In situ characterisation of Pt/Nb-SnO2 as a cathode electrocatalyst for PEMFC
160
Table 6: The values of the Randles circuit components obained by fitting the impedance spectra at
0.1 A/cm2 for Pt/Nb-SnO2, Pt/Nb-SnO2-Vulcan and Pt/C based MEAs before and after stability test.
A/cm2 Rel, Ωcm2 Rct, Ωcm2
Pt/Nb-SnO2
0 0.095 0.835
1200 0.098 0.810
Pt/Nb-SnO2-Vulcan
0 0.093 0.820
1200 0.144 0.808
Pt/C
0 0.071 0.503
1200 0.070 0.900
0.0 0.2 0.4 0.6 0.8 1.00.0
0.2
0.4
0.6
0.8
1.0
0.1 A/cm2
a
before stability test
after 400 cycles
after 1200 cycles
21 % Pt/NbSnO2
ZRe(Ohm cm2)
ZIm
(Oh
m c
m2)
80 °C
0.0 0.2 0.4 0.6 0.8 1.00.0
0.2
0.4
0.6
0.8
1.0
before stability test
after 400 cycles
after 1200 cycles
0.1 A/cm2
20 % Pt/NbSnO2
0.125 mg/cm2 of Vulcan
80 °CZ
Im(O
hm
cm
2)
ZRe(Ohm cm2)
b
0.0 0.2 0.4 0.6 0.8 1.00.0
0.2
0.4
0.6
0.8
1.0
0.1 A/cm2
before stability test
after 400 cycles
after 1200 cycles
ZIm
(Oh
m c
m2)
ZRe(Ohm cm2)
50 % Pt/C
80 °C
c
Figure 6: Electrochemical impedance spectra of Pt/Nb-SnO2 (a) and Pt/Nb-SnO2-Vulcan (b) and Pt/C (c)
catalyst before and after potential cycling test at 80 °C.

Chapter 5: In situ characterisation of Pt/Nb-SnO2 as a cathode electrocatalyst for PEMFC
161
2.5 TEM characterisation before and after durability test
TEM micrographs of Pt/Nb-SnO2, Pt/C and Pt/Nb-SnO2-Vulcan before and after
1200 cycles are shown in Figure 8, Figure 9 and Figure 10, respectively. All samples
demonstrated similar platinum particle growth from 2-4 nm to ~ 5 nm, although the distribution
of Pt particle size remains slightly narrower for the Pt/Nb-SnO2 support (Figure 7). In addition,
in the case of the commercial Pt/C electrocatalyst, a higher amount of Pt nanoparticles are
unsupported after potential cycling. Such detachment and isolation of Pt nanoparticles may be
caused by carbon degradation.
0 2 4 6 8 10 12 140
20
40
60
21 % Pt/Nb-SnO2
50 % Pt/C
20 % Pt/Nb-SnO2+ Vulcan
Fre
qu
ency
(%
)
Pt nanoparticle size (nm)
before stability test
0 2 4 6 8 10 12 140
20
40
60
F
req
uen
cy (
%)
Pt nanoparticle size (nm)
after stability test
21 % Pt/Nb-SnO2
50 % Pt/C
20 % Pt/Nb-SnO2+Vulcan
Figure 7: Comparison of Pt nanoparticle size distribution histograms before (left) and after (right) the
stability test.
100 nm 100 nm
1 2 3 4 5 6 7 8 90
10
20
30
40
50 c
F
req
uen
cy (
%)
Pt nanoparticle size (nm)
3.0 nm
1 2 3 4 5 6 7 8 90
10
20
30
40
50 d
Pt nanoparticle size (nm)
Fre
qu
ency
(%
)
5.0 nm
Figure 8: TEM micrographs of 21 % Pt/Nb-SnO2 before (a) and after 1200 cycles (b) and corresponding Pt
nanoparticle size distribution histograms (c and d, respectively).
a b

Chapter 5: In situ characterisation of Pt/Nb-SnO2 as a cathode electrocatalyst for PEMFC
162
100 nm 100 nm
2 4 6 8 10 12 140
10
20
30
40
50
c
3.8 nm
Fre
qu
ency
(%
)
Pt nanoparticle size (nm)
2 4 6 8 10 12 140
10
20
30
40
50d
5.3 nm
Fre
qu
ency
(%
)
Pt nanoparticle size (nm)
Figure 9: TEM micrographs of 50 % Pt/C before (a) and after 1200 cycles (b) and corresponding Pt
nanoparticle size distribution histograms (c and d, respectively).
100 nm 100 nm
0 1 2 3 4 5 6 7 8 90
20
40
60
Fre
qu
ency
(%
)
Pt nanoparticle size (nm)
2.4 nm c
0 1 2 3 4 5 6 7 8 90
20
40
60
Pt nanoparticle size (nm)
Fre
qu
ency
(%
)
4.6 nm d
Figure 10: TEM micrographs of 20 % Pt/Nb-SnO2-Vulcan before (a) and after 1200 cycles (b) and
corresponding Pt nanoparticle size distribution histograms (c and d, respectively).
a b
a b

Chapter 5: In situ characterisation of Pt/Nb-SnO2 as a cathode electrocatalyst for PEMFC
163
2.6 SEM characterisation of the catalyst layer after durability test
BSE-SEM images of the cross-section of Pt/Nb-SnO2, Pt/Nb-SnO2-Vulcan and Pt/C based
cathodes after potential cycling are shown in Figure 11. The Pt/C cathode catalyst layer shows
a significant aggregation of the Pt nanoparticles, whereas no particular aggregation of the Pt
nanoparticle can be observed for the Pt/Nb-SnO2 cathode, where the presence of the hollow
fibres at the cathode is clearly visible. It is observed that the tubular structure of the support
material is retained during electrode development and assembly of the MEA. Either or both of
these steps, involving ink formation (ultra-sound treatment) and lamination under pressure
could have caused physical degradation to the morphology. This is also true after the
accelerated ageing cycling, where the tubes supporting the Pt nanocatalyst are clearly observed.
In particular, Figure 8b shows the dispersion of the Pt particles all over the internal and
external tube surfaces. Thus, the stability of these alternative supports to the MEA preparation
route used, during polarisation and electrochemical cycling is then established.
Figure 11: BSE-SEM images of 21 % Pt/Nb-SnO2 (a), 20 % Pt/Nb-SnO2-Vulcan (b), and 50 % Pt/C (c)
based cathode after 1200 cycles.
Figure 12 shows SEM micrographs of the cross-sections of Pt/Nb-SnO2, Pt/Nb-SnO2-
Vulcan and Pt/C based MEAs. For all MEAs Pt bands can be observed in the middle of the
membrane. They are caused by Pt dissolution from the cathode and migration through the
membrane, where it precipitates as Pt nanoparticles at the point where it meets crossover
hydrogen. The presence of Pt in the membrane results in generation of peroxide radicals, which
can attack the Nafion® membrane [19].
Pt/Nb-SnO2 Pt/C Pt/Nb-SnO2+Vulcan
a b c

Chapter 5: In situ characterisation of Pt/Nb-SnO2 as a cathode electrocatalyst for PEMFC
164
20 µm 20 µm
20 µm2 4 6 8 10
0
20
Am
on
ut
of
Pt
(wt.
%)
Points
50 % PtC
21 % Pt/Nb-SnO2
20 % Pt/Nb-SnO2-Vulcan
d
Figure 12: BSE-SEM cross-sections images of 21 % Pt/Nb-SnO2 (a), 20 % Pt/Nb-SnO2-Vulcan (b),
and 50 % Pt/C (c) based MEAs after 1200 cycles and Pt amount measured by EDX analysis in the
membrane (d).
For the MEA having the oxide support at the cathode, however, significantly less Pt is
detected in the membrane (both visually and by EDX, Figure 12d.), and it may be concluded
that the resistance to electrochemical oxidation of the support material at the cathode directly
impacts the stability of the supported Pt catalyst with regard to dissolution and migration. This
observation is important, and is interpreted as indicating that a strong metal support interaction
has formed between Pt and Nb-SnO2 that is effective in stabilising the Pt to dissolution at high
cell voltage. Since support oxidation and Pt dissolution could, in principle, each be considered
as separate degradation phenomena, this observation further shows that these degradation
phenomena are in fact related when carbon supports are used, but can be decoupled by use
of an oxide support.
Pt band
Pt/C
Pt/Nb-SnO2-Vulcan
a b
c
Pt/Nb-SnO2

Chapter 5: In situ characterisation of Pt/Nb-SnO2 as a cathode electrocatalyst for PEMFC
165
Conclusions
The MEA based on Pt/Nb-SnO2 (at the cathode) exhibits encouraging fuel cell performance
and significantly enhanced durability compared to the MEA having Pt/C cathode. Such
behaviour can be ascribed to carbon corrosion leading to platinum dissolution, migration and
re-deposition of oxidised Pt into the membrane. Furthermore, carbon surface oxidation at high
potentials leads to increased hydrophobicity of the catalyst layer, resulting in water
management problems. SEM analysis after potential cycling indicated that the Pt/Nb-SnO2
enables higher resistance to Pt dissolution than commercial Pt/C electrocatalyst, which is
undoubtedly ascribable to a strong platinum-Nb-SnO2 support interaction. Further effort will be
made to identify this interaction by spectroscopic means.
Although addition of Vulcan XC-72R results in the improvement in PEMFC performance
caused by increased cathode conductivity, the carbon component undergoes rapid corrosion
at high potentials leading to performance degradation.
Perspectives
Further improvements in the electronic conductivity of tin oxide based cathodes are
necessary to improve the performance of the corresponding MEAs. The use of different doping
agents and in different proportions may increase this property.
A higher Pt loading on SnO2 could also improve the electron transfer. This could be
achieved by novel deposition methods (e.g. thin continuous metal layers) or by increasing the
Pt adsorption (e.g. by using high surface area support). This would allow decreasing the
catalyst layer thickness (see for instance [1]) for a fixed cathode loading and reducing the
resistive issues (see paragraph 4).
Another possibility would be the use of carbon-based additives into the electrodes. For
example Vulcan XC-72R can be replaced by CNT or highly graphitised CNF, which provide
improved corrosion resistance. Utilisation of more conductive support material can lead to
higher voltage in ohmic region and thus to enhanced power density (see paragraph 4).
Addition of Nafion® ionomer leads to the improvement in proton conductivity of the
catalyst layer. However, at high Nafion® loading, some Pt active sites may be covered by
a thick layer of ionomer, which hinders the reactants diffusion to the catalyst surface.
Therefore, Nafion® amount needs to be optimised for each new catalyst support depending on
its surface area and density to achieve better performance of Pt/Nb-SnO2 based MEA.

Chapter 5: In situ characterisation of Pt/Nb-SnO2 as a cathode electrocatalyst for PEMFC
166
3 Characterisation of Pt/Nb-SnO2 based MEA with PBI/H3PO4 membrane
The HT-PEMFCs have gained a great interest due to easier water management and higher
tolerable amount of impurities in the fuel. However, carbon oxidation rate increases with
increasing temperature [20] and alternative support materials are therefore also of considerable
interest for HT-PEMFCs. Amongst these, tin oxide has been studied as a corrosion resistant
catalyst support for high temperature applications such as HT-PEMFC [4], regenerative
PEMFC [21], and PEM electrolysers [22].
In this work, a brief evaluation was made of Pt/Nb-SnO2-MEA performance and durability
in HT-PEMFC. Electrocatalyst powders were mixed with Nafion® ionomer and sprayed onto
the GDL (Sigracet 10 BC, 4 cm2), in order to prepare cathode with Pt loading of 0.8 mg/cm2.
The thicknesses of obtained cathodes were between 20 - 22 µm. The cathodes were assembled
without pressing with an in-house developed PBI/H3PO4 membrane and anode provided
by Johnson Matthey with Pt loading of 0.8 mg/cm2. The PBI/H3PO4 membrane was prepared
by Aurélien Kreisz with thickness of ca 40 µm, proton conductivity ~ 160 S/cm at 140 °C and
acid doping level (ADL) of 25. Experimental conditions are listed in Table 7.
Table 7: HT-PEMFC testing conditions.
Break-in 160 °C, 1 bar (abs), 0.2 A/cm2
FC temperature 140 - 180 °C
Pressure 1 bar (abs)
Gases stoichiometry H2/O2 – 1.5/2
Pt loading on the cathode 0.8 mg/cm2
Nafion® loading on the cathode 0.17 mg/cm2
Pt loading on the anode provided by JM 0.8 mg/cm2
3.1 Performance evaluation at high temperature
The polarisation curves of Pt/Nb-SnO2 and Pt/C based MEAs at temperatures ranging from
140 to 180 °C are shown in Figure 13. The fuel cell performance increases with increasing
temperature for both MEAs, which is due to the higher membrane conductivity and improved
reaction kinetics for both ORR and HOR at higher temperatures. Both types of MEAs show
a dramatic voltage drop at low current densities compared to MEAs prepared with the Nafion®
membrane and tested at 80 °C. Such high activation overpotential is well known for
HT-PEMFCs, and can be attributed to the blocking of the Pt active sites in the electrode by
phosphoric acid.

Chapter 5: In situ characterisation of Pt/Nb-SnO2 as a cathode electrocatalyst for PEMFC
167
0.0 0.5 1.0 1.5 2.00.0
0.2
0.4
0.6
0.8
1.0
Po
wer
den
sity
(W
/cm
2)
P
ote
nti
al
(V)
Pt/Nb-SnO2 140 °C
160 °C
180 °C
a
Current density (A/cm2)
0.0
0.2
0.4
0.6
0.8
1.0
0.0 0.5 1.0 1.5 2.00.0
0.2
0.4
0.6
0.8
1.0
140 °C
160 °C
180 °C
Po
ten
tia
l (V
)
Current density (A/cm2)
b Pt/C
0.0
0.2
0.4
0.6
0.8
1.0
Po
wer
den
sity
(W
/cm
2)
Figure 13: Polarisation curves of the Pt/Nb-SnO2 (a) and Pt/C (b) at 140, 160 and 180 °C with Pt loading
of 0.8 mg/cm2.
The Pt/Nb-SnO2-MEA provided a current density of ca. 0.6 V at 0.3 A/cm2 (160 °C,
H2-O2), which is lower than that for the Pt/C-MEA, and the electrode formulation requires
optimisation. Parrondo et al. [23] also reported that at high concentrations of tin oxide in the
cathode catalyst layer, the performance of HT-PEMFC decreased as a result of mass transport
limitations within the electrode. Furthermore, Rel increased when tin oxide concentration
increased from 7 to 18 wt. %.
In addition, low performance of Pt/Nb-SnO2-MEA can be attributed to high electrode
thickness of Pt/Nb-SnO2-based cathode (ca 20 µm), which may lead to high ohmic and charge
transfer resistances as well as high mass transport losses.
3.2 Electrochemical impedance spectroscopy
The electrochemical impedance spectra of Pt/Nb-SnO2 and Pt/C at 140, 160 and 180 °C are
depicted in Figure 14. The ohmic and charge transfer resistances of both MEAs were calculated
using Randles model and listed in Table 8. The Pt/Nb-SnO2-MEA provides higher ohmic and
charge transfer resistances than Pt/C-MEA probably due to the presence of the less conductive
oxide and lower ORR activity of Pt/Nb-SnO2. The charge transfer resistance decreases with
increasing temperature due to the improved ORR kinetics for both MEAs.
Despite of improved ORR kinetics at high temperatures, the charge transfer resistance
of Pt/C-PBI/H3PO4 based MEA (0.64 mΩ cm2 at 140 °C and 0.1 A/cm2) is higher than that
of Pt/C-Nafion® based MEA (0.50 mΩ cm2 at 80 °C and 0.1 A/cm2). This behaviour
is consistent with low performance in activation region, which is attributed to adsorption
of phosphates on the Pt surface and blocking of Pt active sites [24],[25].

Chapter 5: In situ characterisation of Pt/Nb-SnO2 as a cathode electrocatalyst for PEMFC
168
Table 8: Ohmic and charge transfer resistance before and after stability test obtained from Nyquist plots
at 0.1 A/cm2 for Pt/Nb-SnO2 and Pt/C based MEAs at different temperatures.
T °C Rel, Ωcm2 Rct, Ωcm2 CPE α Cdl, Fcm2
Pt/Nb-SnO2
180 0.237 0.810 0.478 0.65 0.061
160 0.211 0.960 0.520 0.64 0.076
140 0.175 1.150 0.564 0.63 0.088
Pt/C
180 0.049 0.570 0.692 0.91 0.485
160 0.053 0.592 0.722 0.90 0.491
140 0.054 0.641 0.740 0.91 0.515
0.0 0.3 0.6 0.9 1.20.0
0.2
0.4
0.6
0.8
1.0
1.2 140 °C
160 °C
180 °C
ZIm
(Oh
m c
m2)
a
ZRe(Ohm cm2)
Pt/Nb-SnO2
0.1 A/cm2
0.0 0.3 0.6 0.9 1.20.0
0.2
0.4
0.6
0.8
1.0
1.2 b
ZIm
(Oh
m c
m2)
ZRe(Ohm cm2)
Pt/C
140 °C
160 °C
180 °C
0.1 A/cm2
Figure 14: Electrochemical impedance spectra of Pt/Nb-SnO2 (a) and Pt/C (b) at 140, 160 and 180 °C.
3.3 Durability evaluation of the Pt/Nb-SnO2 based MEA at high temperature
The polarisation curves for Pt/Nb-SnO2 and Pt/C based MEAs before and after stability test
are shown in Figure 15. Both MEAs undergo degradation after potential cycling, particularly
Pt/C-MEA exhibits a huge performance loss already after 400 cycles caused by carbon
corrosion.
0.0 0.5 1.0 1.5 2.00.0
0.2
0.4
0.6
0.8
1.0
before stability test
after 400 cycles
after 800 cycles
180 °C
Current density (A/cm2)
Po
ten
tia
l (V
)
a
0.0 0.5 1.0 1.5 2.00.0
0.2
0.4
0.6
0.8
1.0
Po
ten
tial
(V)
Current density (A/cm2)
b
180 °C
before stability test
after 400 cycles
after 800 cycles
Figure 15: Polarisation curves for PEMFCs with Pt/Nb-SnO2 (a) and Pt/C (b) catalyst before and after
potential cycling test at 180 °C under H2 and O2.

Chapter 5: In situ characterisation of Pt/Nb-SnO2 as a cathode electrocatalyst for PEMFC
169
3.4 Evaluation of MEA durability using impedance spectroscopy
The ohmic and charge transfer resistances calculated from the impedance spectra of Pt/C
and Pt/Nb-SnO2 based MEAs (Figure 16) are summarised in Table 9. The Pt/C-MEA shows
an increase in charge transfer resistance of 0.353 Ωcm2, whereas Pt/Nb-SnO2-MEA provides
smaller increase of 0.229 Ωcm2, which may be related to the block of catalyst pore structure
by phosphoric acid. In addition, Rel increases dramatically from ca 0.24 to 0.4 Ωcm2 for
Pt/Nb-SnO2-MEA. This behaviour can be attributed to the H3PO4 leaching from the PBI/H3PO4
membrane, which results in a decrease in proton conductivity [26].
Table 9: Ohmic and charge transfer resistance before and after stability test obtained from Nyquist plots
at 0.1 A/cm2 for Pt/Nb-SnO2 and Pt/C based MEAs at 180 °C before and after stability test.
Cycles Rel, Ωcm2 Rct, Ωcm2
Pt/Nb-SnO2
0 0.237 0.811
800 0.396 1.04
Pt/C
0 0.049 0.570
800 0.071 0.927
0.0 0.3 0.6 0.9 1.20.0
0.3
0.6
0.9
1.2 a
0.1 A/cm2
20 % Pt/Nb-SnO2
180 °C
before stability tesst
after 400 cycles
after 800 cycles
ZIm
(Oh
m c
m2)
ZRe(Ohm cm2)
0.0 0.3 0.6 0.9 1.20.0
0.3
0.6
0.9
1.2 b
ZRe(Ohm cm2)
ZIm
(Oh
m c
m2)
180 °C
0.1 A/cm2
50 % Pt/C
before stability test
after 400 cycles
after 800 cycles
Figure 16: Electrochemical impedance spectra of Pt/Nb-SnO2 (a) and Pt/C (b) catalyst at 180 °C.

Chapter 5: In situ characterisation of Pt/Nb-SnO2 as a cathode electrocatalyst for PEMFC
170
3.5 TEM and SEM characterisation of MEAs after durability test
SEM and TEM micrographs of Pt/C and Pt/Nb-SnO2 catalysts after stability test and the
corresponding Pt nanoparticle size distribution histograms are shown in Figure 17, Figure 18
and Figure 19. Both catalysts show comparable Pt nanoparticle growth from 2.4 to 4.1 for
Pt/Nb-SnO2 (Figure 18) and from 3.8 to 4.5 nm for Pt/C (Figure 19).
Figure 17: SEM micrographs of Pt/Nb-SnO2 (a) and Pt/C (b) after 800 cycles at 180 °C.
100 nm 100 nm
0 1 2 3 4 5 6 7 8 90
20
40
60
Fre
qu
ency
(%
)
Pt nanoparticle size (nm)
2.4 nm c
0 1 2 3 4 5 6 7 8 90
20
40
60d
Fre
qu
ency
(%
)
Pt nanoparticle size (nm)
4.1 nm
Figure 18: TEM micrographs of 20 % Pt/Nb-SnO2 before (a) and after 800 cycles (b) and corresponding Pt
nanoparticle size distribution histograms (c and d, respectively).
a b
a b
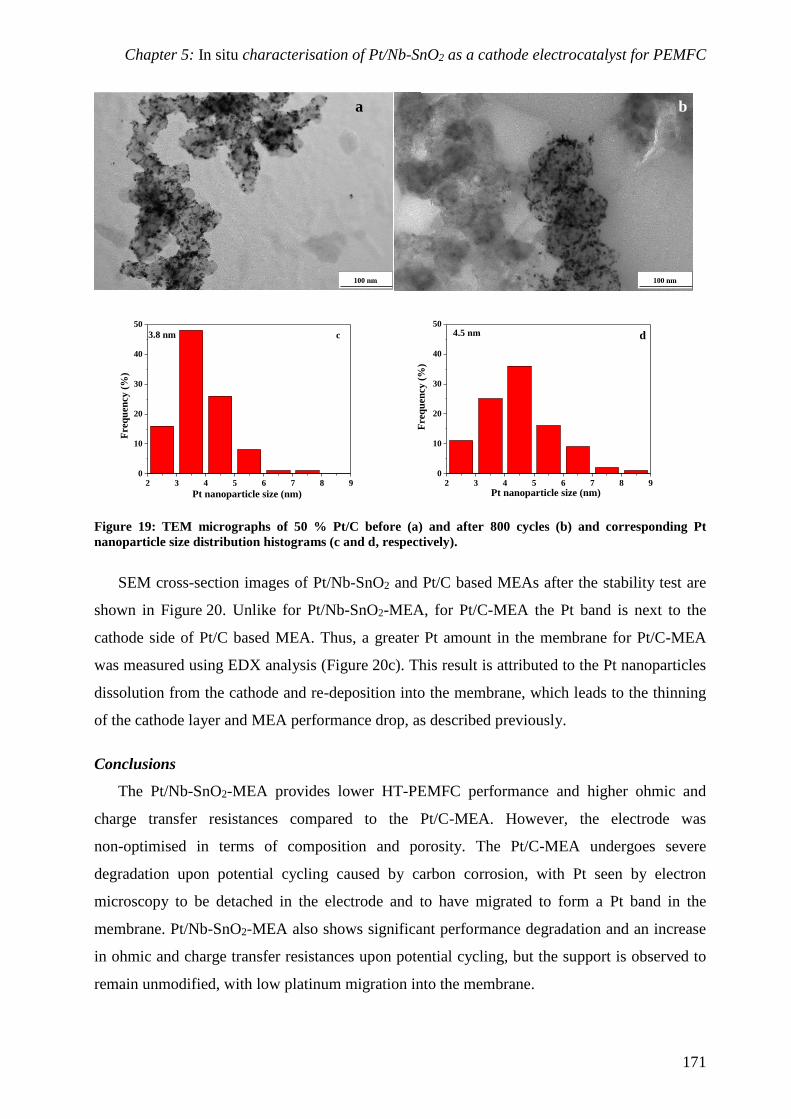
Chapter 5: In situ characterisation of Pt/Nb-SnO2 as a cathode electrocatalyst for PEMFC
171
100 nm 100 nm
2 3 4 5 6 7 8 90
10
20
30
40
50
c
3.8 nm
Fre
qu
ency
(%
)
Pt nanoparticle size (nm)
2 3 4 5 6 7 8 90
10
20
30
40
50
d
F
req
uen
cy (
%)
Pt nanoparticle size (nm)
4.5 nm
Figure 19: TEM micrographs of 50 % Pt/C before (a) and after 800 cycles (b) and corresponding Pt
nanoparticle size distribution histograms (c and d, respectively).
SEM cross-section images of Pt/Nb-SnO2 and Pt/C based MEAs after the stability test are
shown in Figure 20. Unlike for Pt/Nb-SnO2-MEA, for Pt/C-MEA the Pt band is next to the
cathode side of Pt/C based MEA. Thus, a greater Pt amount in the membrane for Pt/C-MEA
was measured using EDX analysis (Figure 20c). This result is attributed to the Pt nanoparticles
dissolution from the cathode and re-deposition into the membrane, which leads to the thinning
of the cathode layer and MEA performance drop, as described previously.
Conclusions
The Pt/Nb-SnO2-MEA provides lower HT-PEMFC performance and higher ohmic and
charge transfer resistances compared to the Pt/C-MEA. However, the electrode was
non-optimised in terms of composition and porosity. The Pt/C-MEA undergoes severe
degradation upon potential cycling caused by carbon corrosion, with Pt seen by electron
microscopy to be detached in the electrode and to have migrated to form a Pt band in the
membrane. Pt/Nb-SnO2-MEA also shows significant performance degradation and an increase
in ohmic and charge transfer resistances upon potential cycling, but the support is observed to
remain unmodified, with low platinum migration into the membrane.
a b

Chapter 5: In situ characterisation of Pt/Nb-SnO2 as a cathode electrocatalyst for PEMFC
172
20 µm 20 µm
2 4 6 80
10
20
30
Am
on
ut
of
Pt
(wt.
%)
Points
20 % Pt/NbSnO2
50 % Pt/C
c
Figure 20: SEM cross-section micrographs of 20 % Pt/Nb-SnO2 (a) and 50 % Pt/C (b) based MEAs after
800 cycles between 0.9-1.4 V at 180 °C and Pt amount measured by EDX in the membrane (c).
The ink formulation and the deposition method for the electrode preparation should be
optimised. At the operating temperature of HT-PEMFC the conductivity of metal oxide
is increasing due to their semi-conducting nature. While, the addition of a carbon additive
in the catalyst layer could improve the cathode conductivity, a more promising route is to
implement more highly conducting alternative supports such as the antimony doped tin oxide
prepared in this work.
Pt band
a b

Chapter 5: In situ characterisation of Pt/Nb-SnO2 as a cathode electrocatalyst for PEMFC
173
4 Characterisation of Pt/Sb-SnO2 based MEA with Nafion® membrane
Following the calculation of Chhina et al. [27], we have estimated that Pt loading on
Sb-SnO2 hollow fibres with surface area of 42 m2/g should be around 30 wt. %. The obtained
Pt loading (33 wt. %) was determined using XRF, as described in the experimental part
(Annex A).
4.1 Performance of Pt/Sb-SnO2 based MEA
The polarisation curves obtained for MEAs with Pt/Nb-SnO2 and Pt/Sb-SnO2 cathodes are
plotted in Figure 21. They show similar behaviour at low current densities, result that can be
attributed to the similar ORR activity of both electrocatalysts. However, there is a markedly
improved performance in the ohmic region for the MEA with the Pt/Sb-SnO2 cathode, which
is caused by the improved conductivity of the Sb-SnO2. The maximum power density
is 0.61 W/cm2 for the MEA with Pt/Sb-SnO2 cathode, what is a significant increase over the
0.41 W/cm2 for the MEA with the Pt/Nb-SnO2 cathode. In addition, high Pt loading on
Sb-SnO2 (33 wt. %) allows fabrication of thin catalyst layer, which may lead to lower ohmic
and mass transport losses. Although the performance of Pt/Sb-SnO2-MEA is still lower than
that of Pt/C-MEA, this result clearly identifies the conductivity of the support as a one of the
main factors driving MEA performance.
0.0 0.5 1.0 1.50.0
0.2
0.4
0.6
0.8
1.0
Current density (A/cm2)
0.96 W/cm2
Pt/Sb-SnO2
Pt/Nb-SnO2
Pt/C
Po
ten
tia
l (V
)
0.41 W/cm2
0.61 W/cm2
Po
wer
den
sity
(W
/cm
2)
0.0
0.2
0.4
0.6
0.8
1.0
Figure 21: Polarisation curves of MEA with 21 wt. % Pt/Nb-SnO2, 33 wt. % Pt/Sb-SnO2 and 50 wt. % Pt/C
cathodes at 80 °C and 100 % RH.
4.2 Electrochemical impedance spectroscopy
The ohmic and charge transfer resistances obtained from impedance spectra in Figure 22
are listed in Table 10. The Pt/Sb-SnO2-MEA exhibits lower Rct than Pt/Nb-SnO2-MEA due to
the improved conductivity of Sb doped SnO2. This result is in agreement with the improved
PEMFC performance for the Pt/Sb-SnO2-MEA.
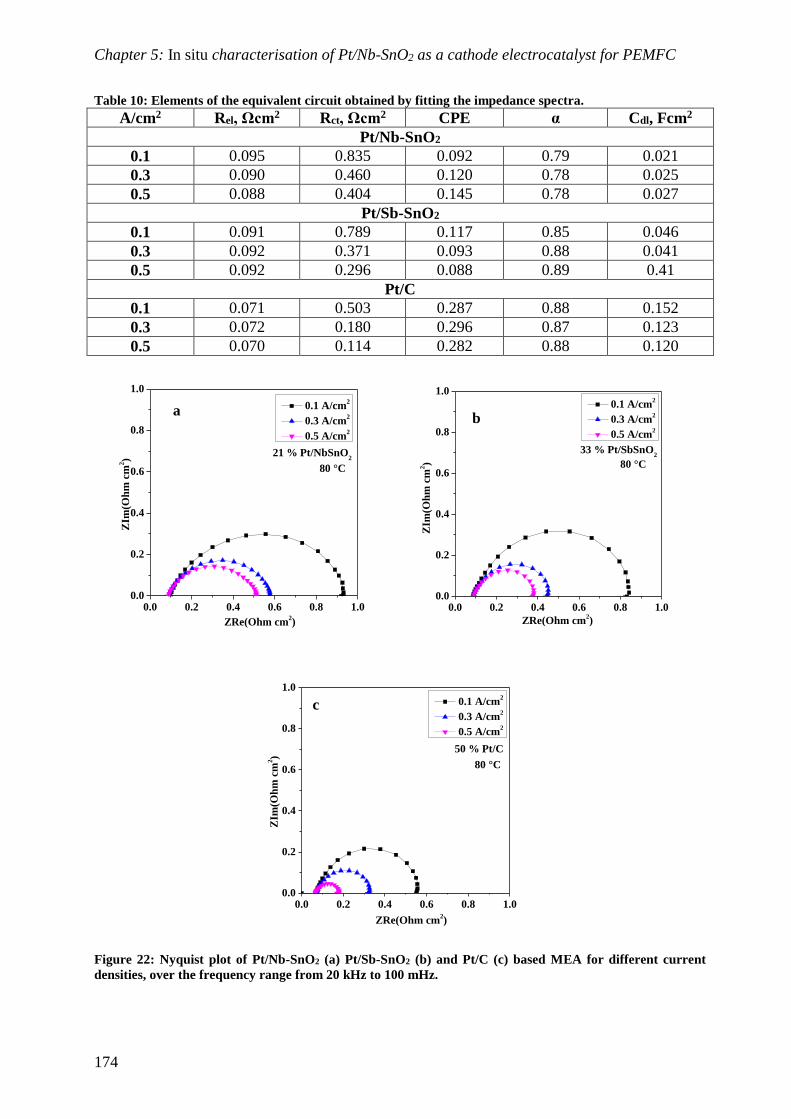
Chapter 5: In situ characterisation of Pt/Nb-SnO2 as a cathode electrocatalyst for PEMFC
174
Table 10: Elements of the equivalent circuit obtained by fitting the impedance spectra.
A/cm2 Rel, Ωcm2 Rct, Ωcm2 CPE α Cdl, Fcm2
Pt/Nb-SnO2
0.1 0.095 0.835 0.092 0.79 0.021
0.3 0.090 0.460 0.120 0.78 0.025
0.5 0.088 0.404 0.145 0.78 0.027
Pt/Sb-SnO2
0.1 0.091 0.789 0.117 0.85 0.046
0.3 0.092 0.371 0.093 0.88 0.041
0.5 0.092 0.296 0.088 0.89 0.41
Pt/C
0.1 0.071 0.503 0.287 0.88 0.152
0.3 0.072 0.180 0.296 0.87 0.123
0.5 0.070 0.114 0.282 0.88 0.120
0.0 0.2 0.4 0.6 0.8 1.00.0
0.2
0.4
0.6
0.8
1.0
a
21 % Pt/NbSnO2
0.1 A/cm2
0.3 A/cm2
0.5 A/cm2
ZRe(Ohm cm2)
ZIm
(Oh
m c
m2)
80 °C
0.0 0.2 0.4 0.6 0.8 1.00.0
0.2
0.4
0.6
0.8
1.0
b
0.1 A/cm2
0.3 A/cm2
0.5 A/cm2
ZIm
(Oh
m c
m2)
ZRe(Ohm cm2)
33 % Pt/SbSnO2
80 °C
0.0 0.2 0.4 0.6 0.8 1.00.0
0.2
0.4
0.6
0.8
1.0
c
0.1 A/cm2
0.3 A/cm2
0.5 A/cm2
ZRe(Ohm cm2)
ZIm
(Oh
m c
m2)
50 % Pt/C
80 °C
Figure 22: Nyquist plot of Pt/Nb-SnO2 (a) Pt/Sb-SnO2 (b) and Pt/C (c) based MEA for different current
densities, over the frequency range from 20 kHz to 100 mHz.

Chapter 5: In situ characterisation of Pt/Nb-SnO2 as a cathode electrocatalyst for PEMFC
175
4.3 Stability to potential cycling
The polarisation curves obtained before and after the potential cycling test for Pt/Sb-SnO2,
Pt/Nb-SnO2 and Pt/C based MEAs are shown in Figure 23. After potential cycling, the
performance of the Pt/C based MEA decreased dramatically, while only a slight performance
decrease was observed for MEA based on Pt/Sb-SnO2.
0.0 0.5 1.0 1.5 2.00.0
0.2
0.4
0.6
0.8
1.0
a
Po
ten
tia
l (V
)
Current density (A/cm2)
before stability test
after 1000 cycles
80 °C
21 % Pt/Nb-SnO2
0.0 0.5 1.0 1.5 2.00.0
0.2
0.4
0.6
0.8
1.0
33 % Pt/Sb-SnO2
before stability test
after 1200 cyclesb
80 °C
Current density (A/cm2)
Po
ten
tial
(V)
0.0 0.5 1.0 1.5 2.00.0
0.2
0.4
0.6
0.8
1.0
before stability test
after 1200 cycles
Current density (A/cm2)
50 % Pt/C
80 °C
Po
ten
tia
l (V
)
c
Figure 23: Polarisation curves of the Pt/Nb-SnO2 (a), Pt/Sb-SnO2 (b) and Pt/C (c) based MEAs before and
after stability test at 80 °C and 100 % RH.
4.4 Evaluation of MEA durability using impedance spectroscopy
The ohmic and charge transfer resistances obtained from impedance spectra in Figure 24
are listed in Table 11. The ohmic resistances remained almost unchanged after the potential
cycling test for all MEAs. However, Pt/Sb-SnO2-MEA showed a lower decrease of charge
transfer resistance than Pt/C-MEA, but higher than Pt/Nb-SnO2-MEA, which can be attributed
to the slightly lower stability of Pt/Sb-SnO2 compared to Pt/Nb-SnO2 based MEA.
Sasaki et al. [10] and Kakinuma et al. [3] also have shown that Pt supported on Sb doped SnO2
is less stable than Pt on Nb doped SnO2, due to Sn dissolution from the Sb doped SnO2, leading
to performance degradation caused by Pt poisoning by Sn [3]. In addition, Suchsland et al. [11]
reported that antimony leached out of the tin oxide, leading to the poisoning of the Pt surface
and activity loss.

Chapter 5: In situ characterisation of Pt/Nb-SnO2 as a cathode electrocatalyst for PEMFC
176
Table 11: Elements of the equivalent circuit obtained by fitting the impedance spectra.
Cycles Rel, Ω cm2 Rct, Ω cm2
Pt/Sb-SnO2
0 0.095 0.835
1200 0.092 0.888
Pt/C
0 0.071 0.503
1200 0.070 0.900
Pt/Nb-SnO2
0 0.095 0.835
1200 0.098 0.810
0.0 0.2 0.4 0.6 0.8 1.00.0
0.2
0.4
0.6
0.8
1.0
0.1 A/cm2
a
before stability test
after 1200 cycles
21 % Pt/Nb-SnO2
ZRe(Ohm cm2)
ZIm
(Oh
m c
m2)
80 °C
0.0 0.2 0.4 0.6 0.8 1.00.0
0.2
0.4
0.6
0.8
1.0
before cycling
after 1200 cycles
ZRe(Ohm cm2)
ZIm
(Oh
m c
m2)
b
33 % Pt/Sb-SnO2
0.1 A/cm2
80 °C
0.0 0.2 0.4 0.6 0.8 1.00.0
0.2
0.4
0.6
0.8
1.0
0.1 A/cm2
before stability test
after 1200 cycles
ZIm
(Oh
m c
m2)
ZRe(Ohm cm2)
50 % Pt/C
80 °C
c
Figure 24: Electrochemical impedance spectra of Pt/Nb-SnO2 (a), Pt/Sb-SnO2 (b) and Pt/C (c) based MEA
before and after potential cycling test.
MEAs integrating Nb- or Sb-SnO2 based cathodes provide similar cell voltage at low
current density, but Pt/Sb-SnO2-MEA shows significantly higher performance in ohmic region,
as a result of the improved conductivity of the catalyst. Although it provides lower maximum
power density compared to Pt/C-MEA, the results clearly show promise.

Chapter 5: In situ characterisation of Pt/Nb-SnO2 as a cathode electrocatalyst for PEMFC
177
Conclusions and perspectives
This chapter describes in situ characterisation of doped tin oxide supported Pt in a single
test station. The cathodes based on Pt/Nb-SnO2, Pt/Sb-SnO2 and Pt/C were prepared by CCS
method, in which the catalyst ink was spray-coated onto GDL. The obtained gas diffusion
electrodes (GDE) were hot-pressed with Nafion® or PBI/H3PO4 membranes and anode, in order
to fabricate MEA. Performance of the obtained MEAs was evaluated before and after
accelerated stress test, which was performed to simulate potential changes during start-up and
shutdown of fuel cell. In addition, impedance spectroscopy was used to evaluate the charge
transfer resistance at the cathode before and after the stability test. Finally, presence of Pt band
in the membrane after stability test was determined by SEM microscopy.
A strong dependence of PEMFC durability on the catalyst supports was observed. The
Pt/Nb-SnO2-Nafion based MEA exhibited better stability than Pt/C based MEA, which can be
attributed to higher corrosion resistance and stronger interactions between Pt nanoparticles and
oxide-based support. However, it showed higher ohmic and charge transfer resistances and thus
lower maximum power density than Pt/C based MEA, probably due to the lower conductivity
and surface area of Nb-SnO2 compared to that of carbon. In order to enhance conductivity
of the catalyst layer, commercial Vulcan XC-72R was mixed with Pt/Nb-SnO2 before spray-
coating. This led to enhanced maximum power density, but decreased stability indicating rapid
corrosion of Vulcan XC-72R support, which should be replaced by graphitised carbon or more
conductive ceramic support such as Sb doped SnO2.
Therefore, Sb-SnO2 supported Pt was characterised in a single PEMFC test station and
compared to Pt/Nb-SnO2-MEA. Both oxide based MEAs provide similar performance at low
current density, but different slopes indicating improved conductivity of Sb-SnO2 based
cathode. As expected, it exhibited higher performance than Pt/Nb-SnO2-MEA maintaining high
durability. However, Pt/Sb-SnO2-MEA provides lower maximum power density than
Pt/C-MEA. Therefore, ORR activity of the oxide supported Pt needs to be improved by
increasing surface area and conductivity of the oxide support.
It was expected that at elevated temperature Nb-SnO2 based cathode will provide higher
conductivity and thus improved fuel cell performance. However, the Pt/Nb-SnO2-PBI/H3PO4
based MEA provided decreased performance at 180 °C. This behaviour can be attributed to the
blocking of cathode pore structure and Pt active sites by phosphoric acid.

Chapter 5: In situ characterisation of Pt/Nb-SnO2 as a cathode electrocatalyst for PEMFC
178
For the future work, Pt loading on the oxide-based support and Nafion® amount in the
catalyst layer as well as cathode thickness and porosity need to be optimised, in order to
improve PEMFC performance of oxide based MEA. Finally, PTFE can be added to the catalyst
ink, in order to increase hydrophobicity of the electrode. In the case of HT-PEMFC, Nafion®
in the catalyst layer should be replaced by more efficient binder such as polyvinylidene
difluoride (PVDF), which allows to achieve lower ohmic and charge transfer resistance leading
to improved maximum power density [28].
Chapter 5: In situ characterisation of Pt/Nb-SnO2 as a cathode electrocatalyst for PEMFC
179
References
[1] P. Zhang, S.-Y. Huang, and B. N. Popov, “Mesoporous Tin Oxide as an Oxidation-Resistant Catalyst
Support for Proton Exchange Membrane Fuel Cells,” Journal of The Electrochemical Society, vol. 157,
no. 8, p. B1163, 2010.
[2] K. Kanda, Z. Noda, Y. Nagamatsu, T. Higashi, S. Taniguchi, S. M. Lyth, a. Hayashi, and K. Sasaki,
“Negligible Start-Stop-Cycle Degradation in a PEFC Utilizing Platinum-Decorated Tin Oxide
Electrocatalyst Layers with Carbon Fiber Filler,” ECS Electrochemistry Letters, vol. 3, no. 4, pp. F15–
F18, Feb. 2014.
[3] K. Kakinuma, Y. Chino, Y. Senoo, M. Uchida, T. Kamino, H. Uchida, S. Deki, and M. Watanabe,
“Characterization of Pt catalysts on Nb-doped and Sb-doped SnO2–δ support materials with aggregated
structure by rotating disk electrode and fuel cell measurements,” Electrochimica Acta, vol. 110, pp. 316–
324, Nov. 2013.
[4] J. Xu, D. Aili, Q. Li, C. Pan, E. Christensen, J. O. Jensen, W. Zhang, G. Liu, X. Wang, and N. J. Bjerrum,
“Antimony doped tin oxide modified carbon nanotubes as catalyst supports for methanol oxidation and
oxygen reduction reactions,” Journal of Materials Chemistry A, vol. 1, no. 34, p. 9737, 2013.
[5] S.-Y. Huang, P. Ganesan, and B. N. Popov, “Electrocatalytic Activity and Stability of Titania-Supported
Platinum–Palladium Electrocatalysts for Polymer Electrolyte Membrane Fuel Cell,” ACS Catalysis, vol. 2,
no. 5, pp. 825–831, May 2012.
[6] S.-Y. Huang, P. Ganesan, and B. N. Popov, “Titania supported platinum catalyst with high electrocatalytic
activity and stability for polymer electrolyte membrane fuel cell,” Applied Catalysis B: Environmental,
vol. 102, no. 1–2, pp. 71–77, Feb. 2011.
[7] M. K. Debe, A. K. Schmoeckel, G. D. Vernstrom, and R. Atanasoski, “High voltage stability of
nanostructured thin film catalysts for PEM fuel cells,” Journal of Power Sources, vol. 161, no. 2, pp.
1002–1011, Oct. 2006.
[8] M. Yin, J. Xu, Q. Li, J. O. Jensen, Y. Huang, L. N. Cleemann, N. J. Bjerrum, and W. Xing, “Highly active
and stable Pt electrocatalysts promoted by antimony-doped SnO2 supports for oxygen reduction
reactions,” Applied Catalysis B: Environmental, vol. 144, pp. 112–120, Jan. 2014.
[9] A. Masao, S. Noda, F. Takasaki, K. Ito, and K. Sasaki, “Carbon-Free Pt Electrocatalysts Supported on
SnO2 for Polymer Electrolyte Fuel Cells,” Electrochemical and Solid-State Letters, vol. 12, no. 9, p. B119,
2009.
[10] K. Sasaki, F. Takasaki, and Z. Noda, “Alternative Electrocatalyst Support Materials for Polymer
Electrolyte Fuel Cells Thermochemical stability of support materials,” ECS Transactions, vol. 33, no. 1,
pp. 473–482, 2010.
[11] J. P. Suchsland, B. Klose-Schubert, D. Herein, T. Martin, C. Eickes, and M. Lennartz, “The Potential of
Non Carbon Based Catalysts for Automotive Fuel Cells,” ECS Transactions, vol. 50, no. 2, pp. 1659–
1667, 2012.
[12] T. Higashi, Z. Noda, A. Hayashi, and K. Sasaki, “Pulse Laser Deposition and Sputtering of Carbon-free
Pt/SnO2 Electrocatalysts for PEFC,” ECS Transactions, vol. 58, no. 1, pp. 1293–1299, 2013.
[13] J. E. B. Randels, “Kinetics of rapid electrode reactions,” Discussions of the Faraday Society, vol. 1, pp.
11–19, 1947.
[14] X. Yuan, H. Wang, J. Colinsun, and J. Zhang, “AC impedance technique in PEM fuel cell diagnosis -
A review,” International Journal of Hydrogen Energy, vol. 32, no. 17, pp. 4365–4380, Dec. 2007.
[15] X.-Z. Yuan, C. Song, H. Wang, and J. Zhang, Electrochemical Impedance Spectroscopy in PEM Fuel
Cells. London: Springer-Verlag, 2010, pp. 1–413.
[16] G. J. Brug, A. L. G. Van der Eeden, M. Sluyters-Rehbach, and J. H. Sluyters, “The analysis of electrode
impedances complicated by the presence of a constant phase element,” J. Electroanal. Chem., vol. 176,
pp. 275–295, 1984.
[17] K. Kakinuma, M. Uchida, T. Kamino, H. Uchida, and M. Watanabe, “Synthesis and electrochemical
characterization of Pt catalyst supported on Sn0.96Sb0.04O2−δ with a network structure,” Electrochimica
Acta, vol. 56, no. 7, pp. 2881–2887, Feb. 2011.
[18] K. Kinoshita and J. A. S. Bett, “Influence of electrochemical treatment in phosphoric acid on the
wettability of carbons,” Carbon, vol. 13, pp. 405–409, 1975.
[19] J. Peron, Y. Nedellec, D. Jones, and J. Roziere, “The effect of dissolution, migration and precipitation of
platinum in Nafion®-based membrane electrode assemblies during fuel cell operation at high potential,”
Journal of Power Sources, vol. 185, no. 2, pp. 1209–1217, Dec. 2008.
[20] L. M. Roen, C. H. Paik, and T. D. Jarvi, “Electrocatalytic Corrosion of Carbon Support in PEMFC
Cathodes,” Electrochemical and Solid-State Letters, vol. 7, no. 1, p. A19, 2004.
[21] J. C. Cruz, S. Rivas, D. Beltran, Y. Meas, R. Ornelas, G. Osorio-Monreal, L. Ortiz-Frade, J. Ledesma-
García, and L. G. Arriaga, “Synthesis and evaluation of ATO as a support for Pt–IrO2 in a unitized

Chapter 5: In situ characterisation of Pt/Nb-SnO2 as a cathode electrocatalyst for PEMFC
180
regenerative fuel cell,” International Journal of Hydrogen Energy, vol. 37, no. 18, pp. 13522–13528, Sep.
2012.
[22] A. T. Marshall and R. G. Haverkamp, “Electrocatalytic activity of IrO2–RuO2 supported on Sb-doped
SnO2 nanoparticles,” Electrochimica Acta, vol. 55, no. 6, pp. 1978–1984, Feb. 2010.
[23] J. Parrondo, F. Mijangos, and B. Rambabu, “Platinum/tin oxide/carbon cathode catalyst for high
temperature PEM fuel cell,” Journal of Power Sources, vol. 195, no. 13, pp. 3977–3983, Jul. 2010.
[24] A. Kamat, M. Herrmann, D. Ternes, O. Klein, U. Krewer, and S. Scholl, “Experimental Investigations into
Phosphoric Acid Adsorption on Platinum Catalysts in a High Temperature PEM Fuel Cell,” Fuel Cells,
vol. 11, no. 4, pp. 511–517, Aug. 2011.
[25] S. Kaserer, K. M. Caldwell, D. E. Ramaker, and C. Roth, “Analyzing the Influence of H3PO4 as Catalyst
Poison in High Temperature PEM Fuel Cells Using in-operando X-ray Absorption Spectroscopy,” The
Journal of Physical Chemistry B, vol. 117, pp. 6210–6217, 2013.
[26] G. Liu, H. Zhang, J. Hu, Y. Zhai, D. Xu, and Z. Shao, “Studies of performance degradation of a high
temperature PEMFC based on H3PO4-doped PBI,” Journal of Power Sources, vol. 162, no. 1, pp. 547–
552, Nov. 2006.
[27] H. Chhina, “Oxidation-resistatnt catalyst supports for Proton exchnge membrane fuel cells,” 2009.
[28] H. Su, S. Pasupathi, B. Bladergroen, V. Linkov, and B. G. Pollet, “Optimization of gas diffusion electrode
for polybenzimidazole-based high temperature proton exchange membrane fuel cell: Evaluation of
polymer binders in catalyst layer,” International Journal of Hydrogen Energy, vol. 38, no. 26, pp. 11370–
11378, Aug. 2013.

CONCLUSIONS
AND
FUTURE PERSPECTIVES


Conclusions and future perspectives
183
CONCLUSIONS AND FUTURE PERSPECTIVES
Carbon blacks are the state-of-the-art electrocatalyst support materials for PEMFC
technology due to their high surface area and electrical conductivity. However, they suffer
from severe corrosion in particular during start-up and shut-down of the PEMFC. Thus, the
objective of this thesis is to develop corrosion resistant support materials that can potentially
replace carbon. Therefore, three types of materials: graphitised carbon, TiO2 and SnO2
nanofibres were selected due to their stability and strong metal support interactions.
Nanofibres and nanotubes were prepared using electrospinning technique, in order to exploit
the directional properties of this nanometric 1D materials. The obtained materials were
characterised using various techniques such as SEM, TEM, XRD, XPS, Raman spectroscopy,
N2 adsorption/desorption analysis, and electrical conductivity measurements. The
conductivity of the oxide-based materials was improved by doping the support with aliovalent
ions and by specific thermal treatments. In a further step, Pt nanoparticles were prepared
by microwave-assisted polyol method and deposited onto the selected electrospun fibres and
a commercial carbon based support (Vulcan XC-72R). The Pt loading on the carbon-based
and on the oxide-based supports was determined using TGA and XRF, respectively.
ORR activity and stability of the obtained electrocatalysts were characterised using RDE and
compared to that of the commercial Pt/C. The size of Pt nanoparticles before and after
prolonged potential cycling was estimated using TEM. The sample with the best
electrochemical properties was selected for further in situ characterisation in a fuel cell setup.
Electrochemical impedance spectroscopy was used to evaluate charge transfer resistance
of the cathode before and after stability test.
As described in Chapter 2, CNFs were carbonised at three different temperatures (700,
1000 and 1500 °C) in order to find a compromise between higher electrochemical stability
and specific surface area. CNF700 showed higher surface area, but was not conductive enough
to be used as catalyst support in PEMFC. CNF1000 and CNF1500 gave much higher
conductivity, but lower surface area than CNF700. CNF1500 was more stable than CNFs1000 and
commercial support (Vulcan XC-72R).
ORR activity and stability of Pt supported on CNF1000 was lower than that of the Pt
supported on Vulcan XC-72R and of the commercial Pt/C electrocatalyst due to the low
corrosion resistance of the support and agglomeration of Pt nanoparticles.

Conclusions and future perspectives
184
For future work, nitrogen doping can be used to improve electrochemical stability,
conductivity and interaction between Pt nanoparticles and CNFs. Furthermore, steam
activation during the carbonisation step could allow fabrication of CNFs with improved
surface area. Also, it would be interesting to obtain interconnected free-standing carbon
nanofibres mat, which can be directly used as support for PEMFC. Finally, the stability of
Pt/CNF could be improved by increasing carbonisation temperature of the carbon materials.
Even though, the use of graphitised carbons slow down corrosion kinetics, but it cannot be
completely avoided. Therefore, development of more stable ceramic supports such as metal
oxides is required.
Thus, in Chapter 3, electrospun titania 1 D structures were explored as an alternative
catalyst supports. Titania nanofibres and tubes were prepared by single-needle and coaxial
electrospinning, respectively. TiO2 nanofibres were selected for further characterisation due to
their high surface area. The electrical conductivity of TiO2 nanofibres was improved by Nb
doping and thermal treatment at 800 °C in the presence of hydrogen. In addition, Nb doping
inhibited TiO2 grain growth leading to the enhancement of the surface area of the nanofibres.
However, the surface area decreased significantly after calcination at high temperatures.
These reduced Nb doped titania nanofibres provided better electrochemical stability at high
potentials than carbon-based supports. However, the stability of Pt supported on Nb doped
titania towards potential cycling was lower compared to Pt supported on Vulcan XC-72R and
to the commercial Pt/C, probably due to the formation of a nonconductive TiO2 layer on the
surface of the TiOx fibres. Furthermore, ORR activity of the titania supported Pt was lower
than that of the Pt/C. This behaviour was attributed to lower conductivity and surface area of
the oxide-based support. Therefore, electrical conductivity of TiO2 can be further increased by
using different doping agents (e.g. Ta and W). In order to improve the surface area of titania,
addition of porogens to electrospinning solution is envisaged.
In the next part of the work, SnO2 was also characterised as catalyst support for PEMFC
owing to its higher conductivity compared to TiO2. Thus, tin oxide fibres and tubes were
obtained by combining electrospinning with an appropriate thermal treatment. The formation
of hollow structures during thermal treatment was attributed to gas expansion (using relatively
high heating rates) and to Kirkendall effect (diffusion via vacancies). In addition, Nb and Sb
doping promoted the formation of hollow fibres and inhibited SnO2 grain growth leading to
an increase in the surface area of doped SnO2. Furthermore, the addition of Nb and Sb
resulted in improved electrical conductivity of SnO2. In particular, Sb doped SnO2 presented

Conclusions and future perspectives
185
high electrical conductivity of ca 1 S/cm, which increased with the temperature approaching
conductivity of Vulcan XC-72R.
As expected, Nb doped tin oxide exhibited higher electrochemical stability at high
potentials than commercial carbon support. Consequently, Pt supported on Nb doped SnO2
provided higher stability towards potential cycling than commercial Pt/C electrocatalyst.
Therefore, it was chosen for further in situ characterisation in a single PEMFC test bench.
In the final part of this study, Pt supported on Nb doped SnO2 was integrated in MEA with
Nafion® and PBI/H3PO4 membranes, in order to investigate its performance and durability at
80 °C and 180 °C.
At 80 °C Pt/Nb-SnO2-MEA showed lower maximum power density, but higher stability
compared to Pt/C based MEA. In the case of Pt/C-MEA, Pt band was observed in the
membrane after stability test indicating Pt dissolution from the cathode, migration and
re-deposition into the membrane.
In order to increase the conductivity of the catalyst layer, Vulcan XC-72R support was
added to the Pt/Nb-SnO2. This resulted in improved fuel cell performance, but lower stability
indicating corrosion of the Vulcan XC-72R, which can be replaced by more stable CNTs
or graphitised CNFs.
As expected, Pt/Sb-SnO2-MEA provided comparable stability, but higher performance
than Pt/Nb-SnO2-MEA, due to the higher conductivity of the Sb-SnO2 support.
At 180 °C Pt/Nb-SnO2-MEA provided poor performance and poor stability probably
due to blocking of Pt active sites and electrode pore structure by phosphoric acid leaking out
from the membrane.
In order to improve the MEA performance the optimisation of the cathode layer structure
(thickness, porosity) and preparation technique (hot-pressing conditions, use of CCM method)
should be performed in the case of the oxide based electrocatalysts. In addition, catalyst and
ionomer loadings need to be optimised.
Despite the lower conductivity and surface area of the prepared Sb doped SnO2 hollow
fibres as compared to that of Vulcan XC-72R, they can be considered as promising catalyst
support for PEMFC due to their better electrochemical stability. In order to increase surface
area and conductivity of such supports, composite materials containing both oxide and
graphitised carbon can be developed to combine stability and SMSI of oxide with high
conductivity and surface area of carbon-based supports.


ANNEX A:
Experimental part

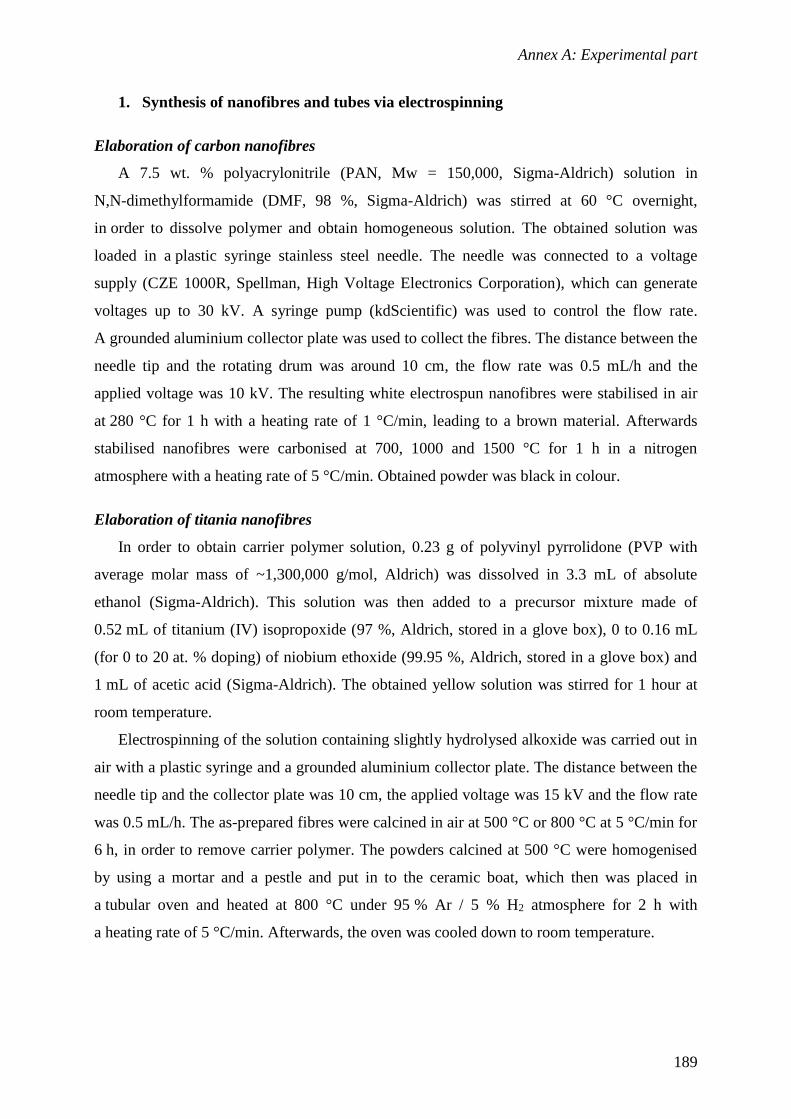
Annex A: Experimental part
189
1. Synthesis of nanofibres and tubes via electrospinning
Elaboration of carbon nanofibres
A 7.5 wt. % polyacrylonitrile (PAN, Mw = 150,000, Sigma-Aldrich) solution in
N,N-dimethylformamide (DMF, 98 %, Sigma-Aldrich) was stirred at 60 °C overnight,
in order to dissolve polymer and obtain homogeneous solution. The obtained solution was
loaded in a plastic syringe stainless steel needle. The needle was connected to a voltage
supply (CZE 1000R, Spellman, High Voltage Electronics Corporation), which can generate
voltages up to 30 kV. A syringe pump (kdScientific) was used to control the flow rate.
A grounded aluminium collector plate was used to collect the fibres. The distance between the
needle tip and the rotating drum was around 10 cm, the flow rate was 0.5 mL/h and the
applied voltage was 10 kV. The resulting white electrospun nanofibres were stabilised in air
at 280 °C for 1 h with a heating rate of 1 °C/min, leading to a brown material. Afterwards
stabilised nanofibres were carbonised at 700, 1000 and 1500 °C for 1 h in a nitrogen
atmosphere with a heating rate of 5 °C/min. Obtained powder was black in colour.
Elaboration of titania nanofibres
In order to obtain carrier polymer solution, 0.23 g of polyvinyl pyrrolidone (PVP with
average molar mass of ~1,300,000 g/mol, Aldrich) was dissolved in 3.3 mL of absolute
ethanol (Sigma-Aldrich). This solution was then added to a precursor mixture made of
0.52 mL of titanium (IV) isopropoxide (97 %, Aldrich, stored in a glove box), 0 to 0.16 mL
(for 0 to 20 at. % doping) of niobium ethoxide (99.95 %, Aldrich, stored in a glove box) and
1 mL of acetic acid (Sigma-Aldrich). The obtained yellow solution was stirred for 1 hour at
room temperature.
Electrospinning of the solution containing slightly hydrolysed alkoxide was carried out in
air with a plastic syringe and a grounded aluminium collector plate. The distance between the
needle tip and the collector plate was 10 cm, the applied voltage was 15 kV and the flow rate
was 0.5 mL/h. The as-prepared fibres were calcined in air at 500 °C or 800 °C at 5 °C/min for
6 h, in order to remove carrier polymer. The powders calcined at 500 °C were homogenised
by using a mortar and a pestle and put in to the ceramic boat, which then was placed in
a tubular oven and heated at 800 °C under 95 % Ar / 5 % H2 atmosphere for 2 h with
a heating rate of 5 °C/min. Afterwards, the oven was cooled down to room temperature.

Annex A: Experimental part
190
Elaboration of hollow titania nanofibres via coaxial electrospinning
In order to obtain a hollow structure, 0.6 g of polyvinyl pyrrolidone (PVP with average
Mw ~1,300,000 g/mol, Aldrich) was dissolved in 10 mL ethanol (Sigma-Aldrich), while
6.3 mL of Ti(OiPr)4 (97 %, Aldrich) and 0.6 mL of niobium ethoxide (10 at.% doping) were
dissolved in 4 mL acetic acid. The two solutions were mixed together and stirred for at least
1 h and then put into the syringe. Another syringe was filled with mineral oil
(WD-40 Company). Two syringes were connected with two pumps and two capillaries.
The diameters of the coaxial needles were 0.8 and 1.83 mm. The flow rate was 0.3 mL/h for
the mineral oil and 0.1 mL/h for the PVP solution. The applied voltage was 15 kV.
The distance between the needle and aluminium collector was 10 cm. The as-spun fibres were
immersed in n-hexane overnight in order to extract the oil phase and calcined at 500 °C for
6 h and then reduced under 95 % Ar / 5 % H2 atmosphere at 800 °C for 2 h in 5 % H2/Ar with
a heating rate of 5 °C/min.
Elaboration of tin oxide nanofibres
In order to obtain Nb-SnO2 hollow fibres, 0.78 g of tin (II) chloride (98 %,
Sigma-Aldrich) was dissolved 5.7 mL of absolute ethanol (puriss., Sigma-Aldrich). For
Nb doped materials niobium (V) chloride (98 % min., Merck, 0.5 – 10 at. % ) was added to
the solution. The obtained solution was mixed with 0.8 g of polyvinylpyrrolidone (average
Mw ~ 1,300,000 g/mol, Aldrich) in 3.1 mL of N,N-dimethylformamide (98 % min., Fluka).
For Sb doped materials antimony (III) chloride (99 % min., Sigma-Aldrich, 5 – 10 at. %) was
added to the mixture. The obtained mixture was stirred at least for 1 h, in order to obtain
homogeneous solution. This solution was electrospun at RT using an applied voltage of
15 kV, a needle-collector distance of 10 cm and a flow rate of 0.4 mL/h. The obtained
materials were calcined at 600 °C for 4 h or 1 h in air with a heating rate of 5 °C/min.

Annex A: Experimental part
191
2. Characterisation of the support
Electron microscopy
The morphology of the electrospun materials was analysed using a Hitachi S-4800
scanning electron microscope (SEM), a FEI Quanta FEG 200 equipped with
energy-dispersive spectroscopy analysis (EDX) and a JEOL 1200 EXII transmission electron
microscope (TEM) operating at 120 kV, equipped with a CCD camera SIS Olympus Quemesa
(11 million pixels). For TEM analyses, the samples were suspended in ethanol and
ultrasonicated before deposition onto carbon-coated copper grids. The diameters of the Pt
nanoparticles and diameters of the fibres were determined by measuring at least 100 selected
particles using an ImageJ software.
X-ray diffraction
Powder X-ray diffraction (XRD) patterns were recorded during ca 12 hours at room
temperature in Bragg-Brentano configuration using a PANAlytical X’pert diffractometer,
equipped with a hybrid monochromator, operating with CuKα radiation (λ = 1.541 Å).
Specific surface area determination
Nitrogen adsorption/desorption isotherms were determined by using Micromeritics ASAP
2020 apparatus after outgassing overnight at 200 °C. The specific surface area was calculated
using the Brunauer-Emmett-Teller (BET) equation, taking 0.162 nm2 as the cross-sectional
area of one N2 molecule.
Raman spectroscopy
Raman analysis was performed on a LabRAM Aramis IR2 (Horiba Jobin Yvon) equipped
with a He/Ne laser (λ = 633 nm, 17 mW on titania and on tin oxide and 4 mW on carbon
nanofibres) and a long work distance objective × 50.
X-ray photoelectron spectroscopy
The surface composition of the electrospun fibres was monitored by X-ray photoelectron
spectroscopy (XPS) on an ESCALAB 250 (Thermo Electron). The X-ray excitation was
provided by a monochromatic Al Kα (1486.6 eV) source and the analysed surface area was
400 μm2. A constant analyser energy mode was used for the electron detection (20 eV pass
energy). Detection of the emitted photoelectrons was performed perpendicularly to the sample
surface. Data quantification was performed in the Avantage software, removing the
background signal using the Shirley method. The surface atomic concentrations were

Annex A: Experimental part
192
determined from photoelectron peaks areas using the atomic sensitivity factors reported by
Scofield. Binding energies of all core levels are referred to the C-C bond of C 1s at 284.8 eV.
Electrical conductivity measurements
Pellets of 13 mm in diameter and of 250 - 600 µm thick (measured using a micrometer)
were obtained by using a cylindrical die and then compressed using a manual hydraulic press
during 5 or 10 minutes at 370 - 740 MPa. The thickness of the pellet was measured using
a micrometer. The electrical conductivity of the obtained pellets was measured using Van der
Pauw method with an in-house developed conductivity cell.
In the case of carbon-based materials 558 mg of 5 wt. % Nafion® dispersion (Aldrich) was
added as a binder to 96 mg of carbon (CNFs or Vulcan XC-72R, Cabot). Nafion® ionomer
was added in order to achieve a suitable cohesion of the pellet. The obtained mixture was
oven dried at 70 °C overnight.
Electrochemical characterisation
The electrochemical analyses were carried out in a three-electrode cell equipped with
a thermostat comprising a gold rotating disk electrode (RDE) with surface area of 0.03 cm2
(working electrode), a saturated calomel electrode (SCE, reference electrode), a platinum wire
(counter electrode), and a Bio-Logic SP-150 potentiostat.
In order to estimate stability of various supports, accelerated stress test was performed by
holding the working electrode potential at 1.4 V vs RHE for 2 h in 0.5 M H2SO4 at 80 °C.
An ink was first prepared by dispersing (ultrasonication, 30 min) 20 mg of the support
material (CNF1000, CNF1500, TNFs, 5%at Nb−SnO2 tubes or Vulcan XC-72, from Cabot)
in 1 mL of ethanol (Aldrich) and 200 μL of 5 wt. % Nafion® dispersion in alcohol (Aldrich).
A 3 μL portion of the ink was then deposited onto the RDE surface using a micropipette and
dried in air.

Annex A: Experimental part
193
3. Synthesis and deposition of Pt nanoparticles
Microwave-assisted polyol method
177 mg of hexachloroplatinic acid (H2PtCl6 6H2O, 99.9 % Alfa Aesar) were dissolved in
80 ml of ethylene glycol (99.5 %, Fluka) and adjusted to a pH of 11.5 by addition of NaOH
(98 %, Sigma Aldrich) dissolved in ethylene glycol. The resulting solution was heated at
110 °C for 6 minutes in microwave reactor (MiniFlow 220SS Sairem) to obtain Pt
nanoparticles.
It is possible to control Pt nanoparticles size by changing concentration of the platinum
salt or changing pH of the solution. When the concentration of hexachloroplatinic acid was
increased up to 0.0068 mol/L, Pt particle diameter increased from 2.4 nm to 3 nm for
21 wt. % Pt/Nb-SnO2 electrocatalyst.
Zeta potential measurements
In order to determine a suitable pH for the Pt adsorption on the surface of the supports,
0.5 mg of the support was dispersed in 40 ml of MilliQ-water and the resulting suspension
was sonicated for at least 10 minutes and the zeta potential of the carbon supports and
Pt particles was measured as a function of pH using a Malvern Zetasizer 3000 device.
Deposition of Pt on electrospun nanofibres
A suspension containing 100 mg of the support material (carbon, titania, tin oxide
nanofibres or Vulcan XC-72R) in 5 ml ethylene glycol was sonicated for 10 min and added to
the Pt nanoparticle solution, and the solution was adjusted to pH 2 (pH = 4 for Vulcan
XC-72R) by the addition of 1M H2SO4 (aq solution, 95-98 %, Aldrich) solution in ethylene
glycol and stirred for at least 24 h to allow the Pt adsorption onto the support. After 24 hours
the product was recovered by centrifugation (4000 rpm, 20 min), washed with milli-Q water
and ethanol on filter, and dried in an oven at 80 °C for 24 h in air.
Thermogravimetric analysis
Thermogravimetric analysis was performed in air up to 800 °C (10 °C/min) using
a Netzsch TG 439 thermobalance to determine the Pt loading on CNF electrospun fibres and
on commercial Vulcan XC-72R support.
In order to determine characteristic weight loss profiles of composite SnO2/PVP
electrospun fibres and polymer decomposition temperature, thermogravimetric analysis was
performed in air up to 1000 °C at 10 °C/min.

Annex A: Experimental part
194
X-ray fluorescence
Pt/oxide catalyst was analysed by X-ray fluorescence, in order to determine the Pt amount,
which was adsorbed on the tin oxide or titania nanofibres after polyol synthesis. The samples
were prepared by grinding 50 mg of Nb-SnO2 with 25 mg of cellulose to facilitate the
formatting of the pellet. The recovered powder was then placed in a cavity in the H3BO3
matrix subsequently pressed, in order to obtain a pellet of 32 mm diameter with scanned
surface of ca. 12 mm. The same protocol was utilised to prepare four standard samples using
15, 20, 25 and 30 wt. % of Pt black (Alfa Aesar) and tin oxide hollow fibres or 5, 10, 15 and
20 wt. % of Pt black and titania nanofibres to obtain a calibration lines. Figure 1 shows the
calibration curve that was used to estimate the amount of Pt adsorbed on the Nb doped SnO2
support after polyol synthesis. The analyses were performed with a PANalytical Axios Max
spectrometer fitted with a Rh (4kW) tube. Omnian software and LiF200 crystal have been
used for the analysis.
15 20 25 3020
30
40
Inte
nsi
ty
Pt weight, %
Pt black/Nb-SnO2
Figure 1: Calibration curve obtained after XRF analysis of standard samples.

Annex A: Experimental part
195
Calculation to determine the amount of Pt added
Carbon blacks exhibit large specific surface area (~230 m2/g for Vulcan XC-72R).
However, significant part of this area is not accessible for Pt (usual size of 3-5 nm) or Nafion®
ionomer, due to high microporosity of carbon blacks (pores < 2 nm). Therefore, only the
external surface area (~100 m2/g) of the carbon was accounted for in our calculations,
following the methodology of Chhina et al. [1],[2].
Average Pt crystallite size for 50 wt. % PT/C (XRD) = 3 nm
Assuming spherical particles:
Volume of one Pt particle = 4/3π r3 = 1.13*10-25 m3
Surface area of one Pt particle - 4 π r2 = 1.13*10-16 m2
For 50 wt. % Pt/C there is 1 g Pt g-1 of C
Volume of Pt g-1 of C
= 1 g Pt g-1 of C/Pt density (ρPt = 21.45 g cm-3) = volume of Pt g-1 of C
= 4.66*10-8 m3 Pt g-1 of C
No. of Pt crystallites g-1 of C
= Volume of Pt required g-1 of C/Volume of one Pt particle
= 4.66*10-8 m3 Pt g-1 of C / 1.13*10-25
= 4.12*1017 crystallite g-1 C
No. of Pt crystallites m-2 of C
= 4.12*1017 crystallite g-1 C/C external SA (100 m2/g)
= 4.12*1015 Pt crystallites m-2 of C
Pt surface area/support surface area
= Pt crystallites m-2 of C * surface area of a crystallite
= 4.12*1015 m-2 of C * 1.13*10-16 m2
= 0.466 m2 Pt m-2 C

Annex A: Experimental part
196
For TiO2
No. of Pt crystallites g-1 of TiO2
No. of Pt crystallite m-2 C * TiO2 BET SA (16 m2/g)
Want 4.12*1015 Pt crystallite m-2 of support * 16 m2/g
= 6.6*1016 crystallites g-1 TiO2
Volume of Pt g-1 of TiO2 needed
= No of Pt crystallites g-1 of TiO2 * Vol. of one Pt particle
= 6.6*1016 crystallites g-1 * 1.13*10-25 m3
= 7.46*10-9 m3 Pt g-1 of TiO2 * 21.45 g cm-3 (100)3
= 0.16 g of Pt g-1 of TiO2
~13.8 wt. % Pt/TiO2
For SnO2
No. of Pt crystallites g-1 of SnO2
No. of Pt crystallite m-2 C * SnO2 BET SA (42 m2/g)
Want 4.12*1015 Pt crystallite m-2 of support * 42 m2/g
= 1.73*1017 crystallites g-1 SnO2
Volume of Pt g-1 of SnO2 needed
= No of Pt crystallites g-1 of SnO2 * Vol. of one Pt particle
= 1.73*1017 crystallites g-1 * 1.13*10-25 m3
= 1.95*10-8 m3 Pt g-1 of SnO2 * 21.45 g cm-3 (100)3
= 0.42 g of Pt g-1 of SnO2
~29.6 wt. % Pt/SnO2
For Carbon nano-fibers (CNF)
No. of Pt crystallites g-1 of CNF
No. of Pt crystallite m-2 C * CNF BET SA (36 m2/g)
Want 4.12*1015 Pt crystallites m-2 of support * 36 m2/g
= 1.48*1017 crystallites g-1 CNF
Volume of Pt g-1 of CNF needed
= No of Pt crystallites g-1 of CNF * Vol. of one Pt particle
= 1.48*1017 crystallites g-1 * 1.13*10-25 m3
= 1.67*10-8 m3 Pt g-1 of CNF * 21.45 g cm-3 (100)3
= 0.36 g of Pt g-1 of CNF
~26.5 wt. % Pt/CNF

Annex A: Experimental part
197
4. Ex situ electrochemical characterisation of Pt supported on electrospun fibres
Cyclic voltammetry
Voltammograms were recorded using RDE glassy carbon electrode with surface area of
0.196 cm2. Catalyst inks were prepared via the following procedure: 5 mg of the support
material (Pt/CNFs, Pt/C, Pt/Vulcan XC-72R, Pt/TNFs or Pt/Nb-SnO2) were dispersed in
0.20-0.35 mL of absolute ethanol (Aldrich), 10-25 μL of water and 10-25 μL of 5 %wt
Nafion® dispersion (Aldrich) by ultrasonication for at least 30 minutes. 5 or 10 μL of these
inks were then deposited onto the RDE surface with a micropipette and dried in air.
The Pt loading was 86 μg/cm2 for Pt/TNFs, 115 μg/cm2 for Pt/CNFs, 122 μg/cm2 for
Pt/Nb-SnO2, 121 μg/cm2 for Pt/Vulcan XC-72R and 121 μg/cm2 for commercial Pt/C to fully
cover the glassy carbon RDE.
Cyclic voltammograms were carried out between 0.05 and 1.2 V vs RHE at a scan rate of
50 mV/s. The ECSA was evaluated from the hydrogen desorption peaks (between 0.05 0.4 V
vs RHE), assuming a hydrogen desorption charge of 210 µC/cm2 for the electroactive
Pt surface. Each electrode was cycled at least 10 times in N2-saturated 0.1 M HClO4 in order
to clean the Pt surface.
ORR activity measurements
The ORR polarisation curves were performed using linear sweep voltammetry
at rotation rate varying from 400 to 2500 rpm in an O2 saturated 0.1 M HClO4. The potential
was swept in the potential range from 1.0 V to 0.2 V vs RHE at a scan rate of 5 mV/s.
The polarisation curves were obtained after subtracting the curve obtained in N2 atmosphere
from the curve obtained in an O2 saturated electrolyte. All the potential values are referred
to the reversible hydrogen electrode (RHE) and the current densities are reported as current
per geometric electrode area. The pH = 1 for 0.1 M HClO4 solution.
Stability test
For durability test the same cycles were performed 1000 times. In order to evaluate the
stability of the electrocatalyst support, the variation of the ECSA was evaluated before and
after these prolonged cycles. Its calculation was based on hydrogen desorption peaks in the
range of 0.05 V to 0.4 V vs RHE, assuming a hydrogen desorption charge of 210 µC cm-2 for
the electroactive Pt surface.

Annex A: Experimental part
198
In order to compare the stability of the different carbon-based supports, 1000 or 2000
cycles were performed between 0.05 and 1.2 V vs RHE at a scan rate of 50 mV/s in 0.1 M
HClO4. Nitrogen was bubbled into the solution during the stability test in order to remove any
dissolved O2. The ECSA was evaluated before and after the stability test as described
previously.
TEM characterisation
In order to prepare a hard resin, 4.8 g of LV resin was mixed with 5.2 g hardener and
0.25 mL of accelerator (Agar Scientific, R1078). The mixture was sonicated for 60 min and
stored in the freezer. The MEAs before and after 1000 cycles were immersed in the obtained
resin for 24 h at 80 °C in a plastic form and then cut with diamond knife. The obtained layers
were then deposited onto a copper grid.

Annex A: Experimental part
199
5. In situ characterisation of oxide based MEA
Pre-treatment procedure
The Nafion® 212 membrane with 50 µm thickness was treated using following procedure:
Nafion® 212 membranes were immersed in a 3 % v/v H2O2 solution (30 wt. %, Carlo Erba
Reagents), which was then stirred for 1 h at 100 °C. After washing with water, the membranes
were immersed in a 50 % w/w solution of HNO3 (65 wt. %, Sigma Aldrich), which was then
stirred for 30 min at room temperature. Finally, the membranes were washed, immersed
in a 1 M solution of H2SO4 (95 wt. %, Sigma Aldrich) for 1 h at 100 °C. After such
treatments, the membranes were washed last time and stored in the plastic bags.
Preparation and characterisation of Pt/Nb-SnO2 and Pt/Sb-SnO2 based MEA with Nafion®
membrane
The cathodes loaded with 0.5 mg/cm2 of Pt and 0.5 mg/cm2 of Nafion® binder were
prepared using the following procedure: a mixture of 9.5 mg of 21 wt. % Pt/Nb-SnO2 or 6 mg
of 33 wt. % Pt/Sb-SnO2 or 4 mg of 50 wt. % Pt/C catalyst or 10 mg of 20 wt. % Pt/Nb-SnO2
with 0.53 mg of Vulcan XC-72R, 46 µL of a 5 wt. % Nafion® solution (Sigma-Aldrich),
200 µL of Milli-Q water and 1 mL of ethanol was sonicated for at least 30 min and sprayed-
coated on a GDL (4 cm2, Sigracet 10 BC).
The GDE for anode side loaded with 0.4 mg/cm2 of Pt used in this work was provided by
Johnson Matthey for Maestro Project.
The MEA was assembled by pressing the electrodes and membrane at 140 °C for 2 min
at 1 ton. The MEA was then incorporated in the fuel cell setup using fluorinated ethylene
propylene (FEP) gaskets at 10 - 15 % compression, which prevent leakage of the reactants.
The MEA break-in step was performed prior to the actual tests at 0.5 A/cm2 overnight
at 80 °C. H2 and O2 were bubbled through milli-Q water, which was heated at 80 °C.
The humidity of the reactant gases was maintained at 100 % RH for both cathode and anode
sides for all MEAs, except Pt/Nb-SnO2-Vulcan-MEA. In the case of Pt/Nb-SnO2-Vulcan-
MEA, the RH on the cathode was 50 %, in order to avoid flooding, which may lead to the
catalyst degradation. Polarisation curves and impedance measurements were carried out under
H2/O2 (using a 1.5/2 stoichiometry) by setting the current density and measuring the cell
potential. Tests were performed under the pressure of 1 bar (2 bar absolute pressure).

Annex A: Experimental part
200
Accelerated stress test
The accelerated stress test consists of 1200 cycles at 80 °C in H2 and O2 for the anode and
cathode. During each cycle potential of 0.9 V for 3 sec and of 1.4 V for 3 sec was applied on
the cathode side (working electrode) in order to simulate the start-up and shutdown of the fuel
cell. Kakinuma et al. [3] used similar test protocol for evaluation of the Pt/Sb-SnO2 stability,
according to which the potential was stepped between 0.9 V and 1.3 V with a holding period
of 30 s at each potential. This test was proposed by Fuel Cell Commercialization Council of
Japan.
Impedance spectroscopy
The impedance spectra were carried out with frequency in the range from 20 kHz to
100 mHz at 0.1, 0.3 and 0.5 A/cm² and with a sinusoidal amplitude of 10 % of applied current
density. The two electrode configuration was used, where cathode was used as the working
electrode, while anode was used as both reference and counter electrode.
Preparation and characterisation of Pt/Nb-SnO2 based MEA with PBI membrane
PBI membrane was prepared by Aurélien Kreisz (ICGM Montpellier) with thickness of
ca 40 µm, proton conductivity ~ 160 S/cm at 140 °C and acid doping level (ADL) of 25.
The cathodes loaded with 0.8 mg/cm2 of Pt and 0.2 mg/cm2 of Nafion® binder were
prepared using the following procedure: a mixture containing 6.4 mg of 50 wt. % Pt/C or
16 mg of 20 wt. % Pt/Nb-SnO2 was mixed with, 18 µL of a 5 %wt Nafion® solution
(Sigma-Aldrich), 200 µL of water and 1 mL of ethanol, then it was sonicated for at least
30 min and sprayed-coated on a GDL (4 cm2, Sigracet 10 BC).
GDEs with Pt loading of 0.8 mg/cm2 provided by Johnson Matthey were used as anode.
This GDE was assembled with PBI/H3PO4 membrane and cathode without pressing. The
obtained MEA were tested in a single HT-PEMFC under atmosphere pressure with pure H2
and O2 gases.
Porosity measurements of the cathode
The porosity of the electrodes was calculated using following equations:
Volume of an electrode = surface area * thickness
Volume of electrode materials = mass/density (Pt) + mass/density (support) +
mass/density (Nafion®)
Porosity = 1 - Volume of an electrode / Volume of electrode materials

Annex A: Experimental part
201
Thickness of Pt/Nb-SnO2 and Pt/C based cathode was ~10 µm (Figure 2). The densities of
carbon, Nafion®, Pt, and tin oxide are 2, 21.45, 1.8 and 6.95, respectively. The obtained
porosities were ca 43 % for Pt/Nb-SnO2 and 45 % for Pt/C based cathode.
Figure 2: SEM cross-section images of the cathode based on Pt/Nb-SnO2 (left) and Pt/C (right).
cathode
d cathode
d

Annex A: Experimental part
202
References:
[1] H. Chhina, “Oxidation-resistatnt catalyst supports for Proton exchnge membrane fuel cells,” 2009.
[2] H. Chhina, S. Campbell, and O. Kesler, “Ex Situ and In Situ Stability of Platinum Supported on
Niobium-Doped Titania for PEMFCs,” Journal of The Electrochemical Society, vol. 156, no. 10, p.
B1232, 2009.
[3] K. Kakinuma, M. Uchida, T. Kamino, H. Uchida, and M. Watanabe, “Synthesis and electrochemical
characterization of Pt catalyst supported on Sn0.96Sb0.04O2−δ with a network structure,” Electrochimica
Acta, vol. 56, no. 7, pp. 2881–2887, Feb. 2011.

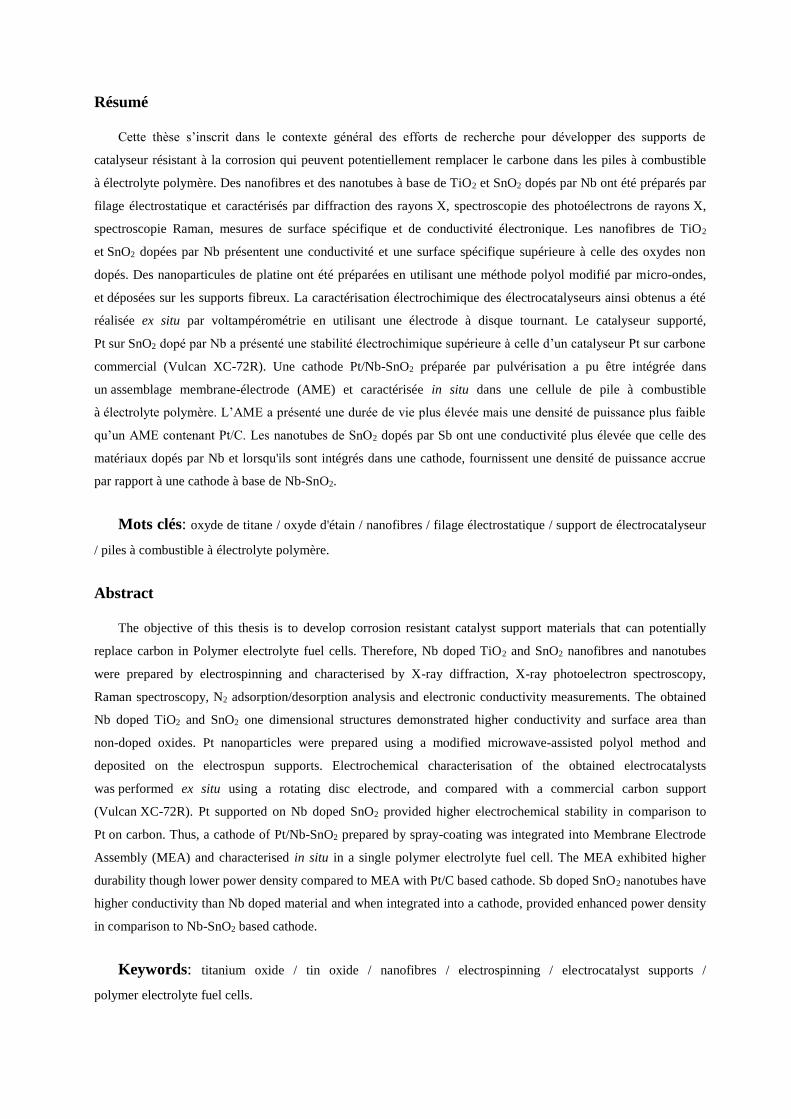
Résumé
Cette thèse s’inscrit dans le contexte général des efforts de recherche pour développer des supports de
catalyseur résistant à la corrosion qui peuvent potentiellement remplacer le carbone dans les piles à combustible
à électrolyte polymère. Des nanofibres et des nanotubes à base de TiO2 et SnO2 dopés par Nb ont été préparés par
filage électrostatique et caractérisés par diffraction des rayons X, spectroscopie des photoélectrons de rayons X,
spectroscopie Raman, mesures de surface spécifique et de conductivité électronique. Les nanofibres de TiO2
et SnO2 dopées par Nb présentent une conductivité et une surface spécifique supérieure à celle des oxydes non
dopés. Des nanoparticules de platine ont été préparées en utilisant une méthode polyol modifié par micro-ondes,
et déposées sur les supports fibreux. La caractérisation électrochimique des électrocatalyseurs ainsi obtenus a été
réalisée ex situ par voltampérométrie en utilisant une électrode à disque tournant. Le catalyseur supporté,
Pt sur SnO2 dopé par Nb a présenté une stabilité électrochimique supérieure à celle d’un catalyseur Pt sur carbone
commercial (Vulcan XC-72R). Une cathode Pt/Nb-SnO2 préparée par pulvérisation a pu être intégrée dans
un assemblage membrane-électrode (AME) et caractérisée in situ dans une cellule de pile à combustible
à électrolyte polymère. L’AME a présenté une durée de vie plus élevée mais une densité de puissance plus faible
qu’un AME contenant Pt/C. Les nanotubes de SnO2 dopés par Sb ont une conductivité plus élevée que celle des
matériaux dopés par Nb et lorsqu'ils sont intégrés dans une cathode, fournissent une densité de puissance accrue
par rapport à une cathode à base de Nb-SnO2.
Mots clés: oxyde de titane / oxyde d'étain / nanofibres / filage électrostatique / support de électrocatalyseur
/ piles à combustible à électrolyte polymère.
Abstract
The objective of this thesis is to develop corrosion resistant catalyst support materials that can potentially
replace carbon in Polymer electrolyte fuel cells. Therefore, Nb doped TiO2 and SnO2 nanofibres and nanotubes
were prepared by electrospinning and characterised by X-ray diffraction, X-ray photoelectron spectroscopy,
Raman spectroscopy, N2 adsorption/desorption analysis and electronic conductivity measurements. The obtained
Nb doped TiO2 and SnO2 one dimensional structures demonstrated higher conductivity and surface area than
non-doped oxides. Pt nanoparticles were prepared using a modified microwave-assisted polyol method and
deposited on the electrospun supports. Electrochemical characterisation of the obtained electrocatalysts
was performed ex situ using a rotating disc electrode, and compared with a commercial carbon support
(Vulcan XC-72R). Pt supported on Nb doped SnO2 provided higher electrochemical stability in comparison to
Pt on carbon. Thus, a cathode of Pt/Nb-SnO2 prepared by spray-coating was integrated into Membrane Electrode
Assembly (MEA) and characterised in situ in a single polymer electrolyte fuel cell. The MEA exhibited higher
durability though lower power density compared to MEA with Pt/C based cathode. Sb doped SnO2 nanotubes have
higher conductivity than Nb doped material and when integrated into a cathode, provided enhanced power density
in comparison to Nb-SnO2 based cathode.
Keywords: titanium oxide / tin oxide / nanofibres / electrospinning / electrocatalyst supports /
polymer electrolyte fuel cells.