Embed Size (px)
Citation preview

SYNTHESIS AND CHARACTERIZATION OF TETRANITRO AND
TETRAAMINO ZINC PHTHALOCYANINES AND THEIR COMBINATIONS
WITH MICA-TITANIA PIGMENT
A THESIS SUBMITTED TO
THE GRADUATE SCHOOL OF NATURAL AND APPLIED SCIENCES
OF
MIDDLE EAST TECHNICAL UNIVERSITY
BY
YASEMİN SÖNMEZ
IN PARTIAL FULFILLMENT OF THE REQUIREMENTS
FOR
THE DEGREE OF MASTER OF SCIENCE
IN
CHEMICAL ENGINEERING
FABRUARY 2014


Approval of the thesis:
SYNTHESIS AND CHARACTERIZATION OF TETRANITRO AND
TETRAAMINO ZINC PHTHALOCYANINES AND THEIR
COMBINATIONS WITH MICA-TITANIA PIGMENT
submitted by YASEMİN SÖNMEZ in partial fulfillment of the requirements for the
degree of Master of Science in Chemical Engineering Department, Middle East
Technical University by,
Prof. Dr. Canan Özgen ______________
Dean, Graduate School of Natural and Applied Sciences
Prof. Dr. Halil Kalıpçılar ______________
Head of Department, Chemical Engineering
Prof. Dr. Güngör Gündüz ______________
Supervisor, Chemical Engineering Dept., METU
Assoc. Prof. Dr. Bora Maviş ______________
Co-supervisor, Mechanical Engineering Dept., HU
Examining Committee Members:
Assoc.Prof. Dr. Naime Aslı Sezgi ______________
Chemical Engineering Dept., METU
Prof. Dr. Güngör Gündüz ______________
Chemical Engineering Dept., METU
Dr. Erhan Bat ______________
Chemical Engineering Dept., METU
Assoc. Prof. Dr. Ali Çırpan ______________
Chemistry Dept., METU
Prof.Dr. İbrahim Uslu ______________
Chemistry Dept., Gazi Uni.
Date: 07.02.2014

iv
I hereby declare that all information in this document has been obtained and
presented in accordance with academic rules and ethical conduct. I also declare
that, as required by these rules and conduct, I have fully cited and referenced
all material and results that are not original to this work.
Name, Last name : YASEMİN SONMEZ
Signature :

v
ABSTRACT
SYNTHESIS AND CHARACTERIZATION OF TETRANITRO AND
TETRAAMINO ZINC PHTHALOCYANINES AND THEIR
COMBINATIONS WITH MICA-TITANIA PIGMENT
Sönmez, Yasemin
M.Sc., Department of Chemical Engineering
Supervisor : Prof. Dr. Güngör Gündüz
Co-Supervisor : Assoc. Prof. Dr. Bora Maviş
Fabruary, 2014, 101 pages
In the present study, tetranitro and tetraamino substituted zinc phthalocyanine were
synthesized by using nitro phthalic acid precursor under microwave irradiation. The
products were purified using different solvents. Molecular structures of these
phthalocyanine pigments were confirmed by FT-IR and UV-visible spectroscopy
analyses. Each of these pigments was settled on the surface mica-titania pigment to
obtain ‘combination pigment’. Tetraamino zinc phthalocyanine was deposited on
mica-titania in water and in dimethyl formamide used as solvent, while tetranitro
zinc phthalocyanine was deposited in chloroform. The pH effect was investigated by
using acetic acid and trifluoro acetic acid. The conditions for optimum deposition
time, solvent, pH and the amount of phthalocyanine were studied. The FT-IR, XPS
and elemental analysis were conducted to analyze the pigment deposited on the

vi
surface of the mica-titania substrate. Moreover, the fluorescence properties of
tetranitro and tetraamino zinc phthalocyanines and their combinations by mica-titania
pigment were obtained in DMF solvent. The surface morphology of synthesized
pigments was analyzed by scanning electron microscopy (SEM). The paint samples
of these pigments were prepared by water based styrene acrylic resin formulation.
The L*a*b* color properties of the pigments were examined by color
spectrophotometer.
These analyses indicated that pigments were successfully synthesized and combined
with mica-titania pigment. The best result with tetranitro zinc phthalocyanine was
obtained in chloroform solvent at 50°C, in 5h, and at a pH of 5; while the best result
with tetraamino zinc phthalocyanine in DMF with acetic acid at 120°C, in 3h and at a
pH of 4. The amount deposited increased with the amount of phthalocyanines in
solution. Mica-titania substrate reduced the fluorescence of phthalocyanine pigments.
But on the other side, the fluorescent property of the mica-titania were developed
with combination of tetra amino and nitro phthalocyanines. It was observed that,
with the increasing amount of tetranitro and tetraamino zinc phthalocyanine, the
deposited amount of pigment increased on mica-titania, as well. As a result high
gloss fluorescent combined pigments with different colors were successfully
synthesized.
Keywords: Mica-titania, tetranitro zinc phthalocyanine, tetraamino zinc
phthalocyanine, combination pigment, fluorescence.

vii
ÖZ
TETRANİTRO VE TETRAAMİNO ÇİNKO FTALOSİYANİN
PİGMENTLERİNİN SENTEZİ, ÖZELLİKLERİNİN BELİRLENMESİ VE
MİKA-TİTANYUM DİOKSİT PİGMENTİ İLE BİRLEŞİK PİGMENT
YAPIMI
Sönmez, Yasemin
Yüksek Lisans, Kimya Mühendisliği Bölümü
Tez Yöneticisi : Prof. Dr. Güngör Gündüz
Ortak Tez Yöneticisi : Doç. Dr. Bora Maviş
Şubat 2014, 101 sayfa
Bu çalışmada, nitro ftalik asit ve öncülleri kullanılarak mikrodalga ortamında
tetranitro çinko ftalosiyanin ve tetraamino çinko ftalosiyanin pigmentleri sentezlendi.
Elde edilen ürünler farklı çözücüler kullanılarak saflaştırıldı. Bu ftalosiyaninlerin
moleküler yapıları FT-IR ve UV-visible spektroskopi analizleri ile doğrulandı. Bu
pigmentler, mika-titan pigmenti üzerine çöktürülerek birleşik pigment elde edildi.
Tetraamino çinko ftalosiyanin su ve dimetilformamit çözücüleri içerisinde mika-titan
yüzeyine çöktürülürken, tetranitro ftalosiyanin kloroform çözücüsü içerisinde mika-
titan üzerine çöktürüldü. Ortamın pH etkisi asetik asit ve trifloro asetik asit
kullanılarak incelendi. En uygun koşullar çöktürme süresi, çözücü, pH ve farklı
miktarda ftalosiyanin kullanımı ile araştırıldı. Mika-titan yüzeyine çöktürülmüş
pigmentleri belirlemek için FT-IR, XPS ve elemental analizleri yapıldı. Bunun yanı
sıra, DMF içerisinde tetranitro ve tetraamino çinko ftalosiyaninlerin ve onların mika-

viii
titan ile oluşturdukları pigmentlerin floresans özelllikleri floresans spekroskopi ile
gözlendi. Sentezlenen birleştirilmiş pigmentlerin yüzey bilgileri elektron taramalı
mikroskop (SEM) ile analiz edildi. Bunlara ek olarak, su esaslı stiren-akrilik
reçinesindeki pigmentlerin L*a*b* renk özellikleri renk spektrofotometresi ile
incelendi.
Yapılan analizler pigmentlerin başarıyla sentezlendiğini ve mika-titan üzerine
çöktürüldüğünü gösterdi. En iyi sonuçlanan birleştirilmiş pigmentlerden biri,
50°C’de, 5 saatte, pH=5’te tetranitro çinko ftalosiyaninin kloroform içinde
çöktürülmesi; diğeri ise 120°C’de, 3 saatte ve pH=4’te DMF ve asetik asit varlığında
tetraamino çinko ftalosiyaninlerin mika-titan üzerine çöktürülmesidir. Mika-titan
pigmenti üzerine çöken ftalosiyaninin floresans etkisini bir miktar azaltmaktadır.
Diğer bir yandan, tetraamino ve nitro ftalosiyaninlaerin mika-titan pigmenti üzerine
çöktürülmesi, mika-titanların floresans özelliklerini geliştirdiği gözlendi. Tetranitro
ve tetraamino çinko ftalosiyaninlerin miktarları artmasıyla, mika-titan üzerine çöken
miktarlarda artma gözlendi. Sonuç olarak, farklı renklerde, parlak görünümlü,
floresans pigmentler elde edilmiştir.
Anahtar sözcükler: Mika-titan, tetranitro çinko ftalosiyanin, tetraamino çinko
ftalosiyanin, bileşenli pigment, floresans.

ix
Şevkiz ki dem-i bülbül-i şeydâdâ nihânız
Hûnuz ki dil-i gonce-i hamrâda nihânız
Biz cism-i nizâr üzre döküp dâne-i eşki
Çun rîşte-i cân gevher-i ma'nâda nihânız
Olsak n'ola bî-nâm ü nişan şöhre-i âlem
Biz dil gibi bir turfe muammada nihânız
Mahrem yine her hâlimize bâd-ı sabâdır
Dâim şiken-i zülf-i dil-ârâda nihânız
Hem gül gibi rengînî-i ma'nâ île zahir
Hem neş'e gibi hâlet-i sahbâda nihânız
Geh hâme gibi şekve-tırâz-ı gam-ı aşkız
Geh nâle gibi hâme-i şekvada nihânız
Etdik o kadar ref'-i taayyün ki Neşâtî
Âyîne-i pür-tâb-i mücellâda nihânız

x
ACKNOWLEDGEMENTS
I would like to thanks to my supervisor Prof. Dr. Güngör Gündüz for his expertise
and support throughout my studies. I also want to thank him for giving me the
chance to work under his supervision.
I am very thankful to my co-supervisor Ass. Prof. Dr. Bora Maviş for his invaluable
guidance, endless helps, great ideas, encouragement and his motivating speeches
throughout my thesis.
I would like to express my sincere and special thanks to Prof. Dr. Ahmet Önal for his
invaluable advice, guidance, selfless manner, support, understanding and kindly
attitude in every aspect. I am very fortunate to have met such a person and teacher.
I would like to offer gratitude to my school friends Ekin Karakaya, Serdar Asmaoğlu,
İdil Öğretim, Sevinç Sevim Kahya, Ayşe Tuğçe Yücel, Tuğçe Kırbaş, Cemre Avşar
for their collaborative, motivating and friendly manner.
My deepest gratitude is to my parents Nahit Sönmez and Nilgün Sönmez, my brother
Yusuf Sönmez and my sister Naciye Karaman for their very special care,
understanding, and moral and material support.
I would like to offer very special thanks to my best friends Ayşe Gökçe Yücel,
Merve Rabia Gürlük, Esra Fehmiye Yıkmaz, Şeyma Güler, Sena Güler, Furkan
Akkoyunlu, Merve Kuba, Fatih Dinç, Kayhan Gedikli, Keziban Ülker, Dilara
Gökçen Akçay. They never leave my side during my difficult times and they are my
brothers more than friends.

xi
TABLE OF CONTENTS
ABSTRACT ................................................................................................................ iv
ÖZ ............................................................................................................................. viii
ACKNOWLEDGEMENTS ..................................................................................... x
TABLE OF CONTENTS ....................................................................................... xii
LIST OF TABLES ................................................................................................ xiv
LIST OF FIGURES .............................................................................................. xvi
LIST OF SYMBOLS AND ABBREVIATIONS ..................................................... xix
CHAPTERS ...................................................................................................................
1. INTRODUCTION ............................................................................................... 1
2. LITERATURE REVIEW..................................................................................... 5
2.1 Effect Pigments .............................................................................................. 5
2.2 Mica Titania Based Pigments ......................................................................... 7
2.3 Phthalocyanines ............................................................................................ 10
2.3.1 Methods of Synthesis ............................................................................ 14
2.3.2 Tetra- Substituted Phthalocyanines ....................................................... 17
2.3.3 Zinc Phthalocyanines ............................................................................ 21
2.3.4 The pH and Solvent Sensitiveness of Phthalocyanines ........................ 22
2.4 Fluorescence ................................................................................................. 25
2.4.1 Fluorescent Pigments ............................................................................ 28
2.4.2 Measurement of Fluorescence............................................................... 31
3. EXPERIMENTAL ............................................................................................. 35
3.1 Materials ..................................................................................................... 355
3.2 Procedure ...................................................................................................... 36

xii
3.2.1 Synthesis of Tetranitro Zinc Phthalocyanine ........................................ 36
3.2.2 Synthesis of Tetraamino Zinc Phthalocyanine ...................................... 37
3.2.3Preparation of Combination Pigments of Tetranitro and Tetraamino Zinc
Phthalocyanine with Mica-Titania .......................................................... …...38
3.2.4 Paint Preparation ................................................................................... 43
3.3 Characterization Methods ............................................................................ 44
3.3.1 Fourier Transform Infrared (FTIR) Spectroscopy ................................ 44
3.3.2 Scanning Electron Microscopy (SEM) ................................................. 44
3.3.3 Energy Dispersive X-Ray Spectroscopy (EDS) .................................... 44
3.3.4 UV-Visible Spectrophotometer ............................................................. 45
3.3.5 Fluorescence Spectrophotometer .......................................................... 45
3.3.6 CHNS/O Elemental Analysis ................................................................ 45
3.3.7 X-Ray Photoelectron Spectroscopy (XPS) ........................................... 45
3.3.8 Color Spectrophotometer ...................................................................... 46
4. RESULTS AND DISCUSSION ......................................................................... 47
4.1 Preliminary Studies ..................................................................................... 47
4.2 Combination pigments ................................................................................. 53
4.2.1 FT-IR Results of Combination Pigments ............................................. 55
4.2.2 SEM and EDS ...................................................................................... 60
4.2.3 Elemental Analysis ............................................................................... 65
4.2.4 XPS ....................................................................................................... 70
4.2.5 Fluorescence ......................................................................................... 72
4.2.6 Optical Properties of Paints Manufactured with Combination
Pigments ......................................................................................................... 76
5. CONCLUSIONS .................................................................................................... 81
6. RECOMMENDATIONS ....................................................................................... 83

xiii
REFERENCES ........................................................................................................... 85
APPENDICES ........................................................................................................... 94
A. FT-IR RESULTS OF THE OTHER EXPERIMENTS ..................................... 95
B. ELEMENTAL ANALYSIS RESULTS OF COMBINATION PIGMENTS... 97
C. EXPECTED FLUORESCENCE OF THE PIGMENTS CALCULATIONS…99
D. SYNTHESIS MATERIALS FOR PHTHALOCYANINES……..………….101

xiv
LIST OF TABLES
TABLES
Table 1.1 Color properties of some mica-based pearlescent pigments ................ 3
Table 2.1 A brief presentation of effect pigments ................................................ 7
Table 2.2 Some functional combination pigments, properties and
applications ......................................................................................... 10
Table 2.3 Effect of solvent on the Q band maxima of protonation of zinc
phthalocyanine ................................................................................... 24
Table 3.1 Parameters used in combination pigments experiments .................... 38
Table 3.2 Parameters of combination of mica-titania with DMF – TAZnPc
experiment .......................................................................................... 39
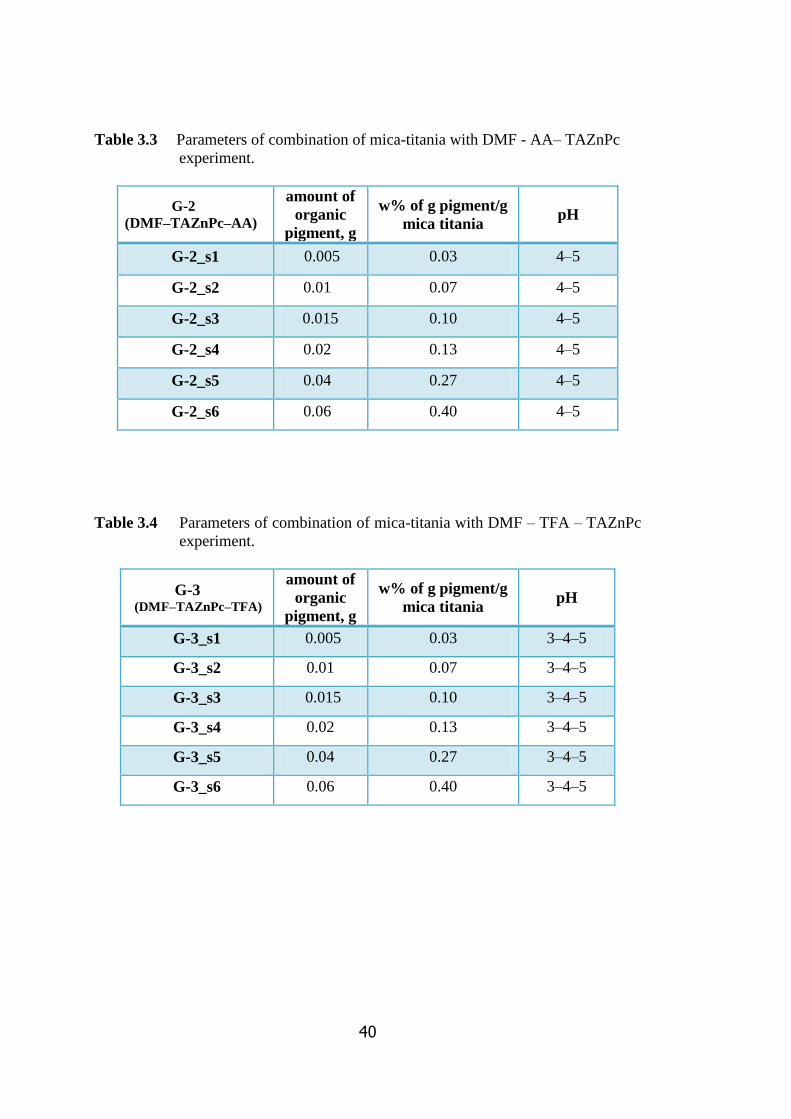
Table 3.3 Parameters of combination of mica-titania with DMF – AA – TAZnPc
experiment. ......................................................................................... 40
Table 3.4 Parameters of combination of mica-titania with DMF – TFA –
TAZnPc experiment ........................................................................ 40
Table 3.5 Parameters of combination of mica-titania with Water – TAZnPc
experiment .......................................................................................... 41
Table 3.6 Parameters of combination of mica-titania with DMF – TNZnPc
experiment. ......................................................................................... 41
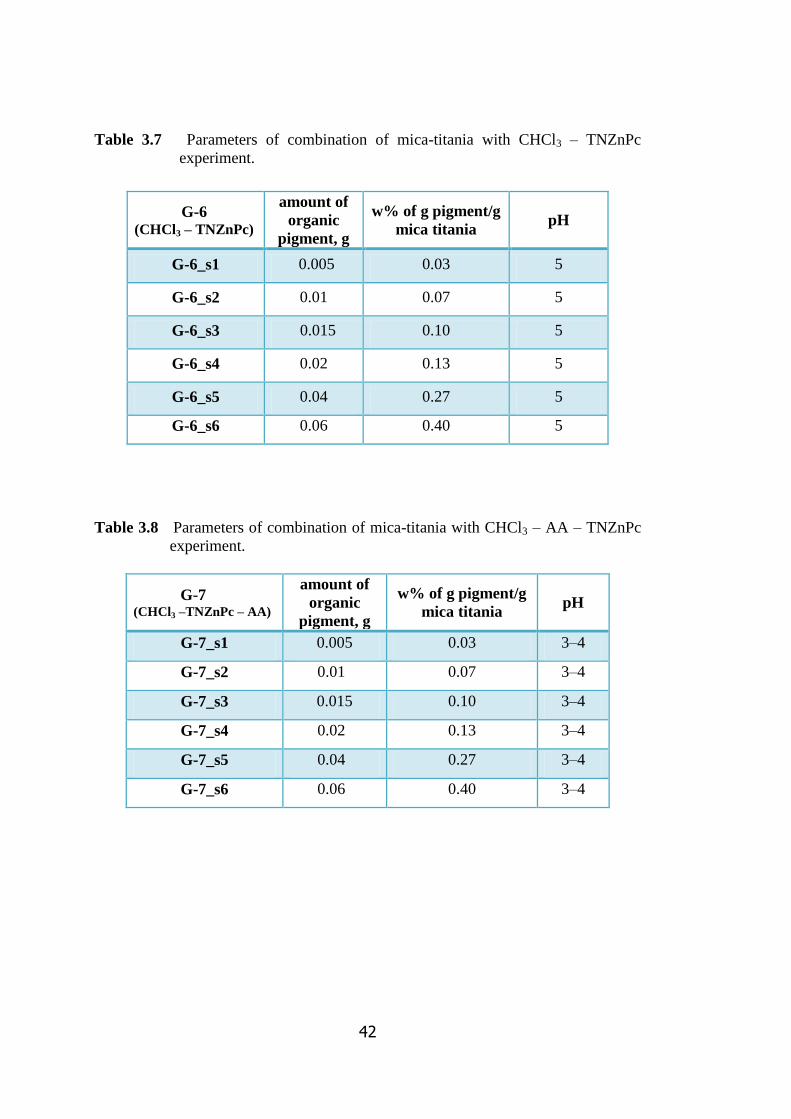
Table 3.7 Parameters of combination of mica-titania with CHCl3 – TNZnPc
experiment .......................................................................................... 42
Table 3.8 Parameters of combination of mica-titania with CHCl3 – AA –
TNZnPc experiment ........................................................................... 42
Table 3.9 Parameters of combination of mica-titania with CHCl3 – TFA –
TNZnPc experiment ........................................................................... 43
Table 3.10 Water based paint formulation ........................................................... 43
Table 4.1 Mass percent of N and TAZnPc on mica-titania ................................ 66
Table 4.2 Mass percent of N and TNZnPc on mica-titania ................................ 68

xv
Table 4.3 Mass percent of Zn for DMF+AA, DMF+TFA, CHCl3 experiments 71
Table 4.4 Mass percent of N for DMF+AA, DMF+TFA, CHCl3 experiments 71
Table 4.5 The L*a*b* values of the paints of TNZnPcMip............................... 77
Table 4.6 The L*a*b* values of the paints of TAZnPcMip............................... 78
Table-C The expected fluorescence results of TNZnPcMip samples ............ 100
Table-D Properties of materials used in this study………………………..101

xvi
LIST OF FIGURES
FIGURES
Figure 2.1 Schematic presentation of optical properties of absorption pigments,
effect pigments and pearlescent pigments. ........................................... 6
Figure 2.2 Schematic represent of structure of mica-titania pigment with the four
existing interphases .............................................................................. 8
Figure 2.3 SEM image of mica pigment particle ................................................... 8
Figure 2.4 Process scheme for titania coated mica pigments. ............................... 9
Figure 2.5 Similarity between porphyrin and phthalocyanine. ............................ 11
Figure 2.6 Non-metalled and metalled phthalocyanine showing the covalent and
partial bonds between the central metal and the nitrogen atoms. ....... 12
Figure 2.7 Phthalocyanine based network polymer ............................................. 13
Figure 2.8 Basic principles of synthesis of metallophthalocyanines ................... 14
Figure 2.9 The reaction for the industrial synthesis of phthalocyanines. ............ 16
Figure 2.10 Absorption spectrum of metallophthalocyanine with Q, B electronic
transition band .................................................................................... 17
Figure 2.11 Numbering scheme for the phthalocyanine core ............................... 18
Figure 2.12 Structure of a) α and b) β octasubstituted phthalocyanines ............... 18
Figure 2.13 Synthesis of tetranitro zinc phthalocyanine ....................................... 20
Figure 2.14 Synthesis of tetraamino zinc phthalocyanine ..................................... 20
Figure 2.15 Isoindole –nitrogen and meso- nitrogen protonation of phthalocyanine
............................................................................................................ 23
Figure 2.16 Distinction between ground, singlet and triple states ........................ 26
Figure 2.17 Electromagnetic spectrum .................................................................. 27
Figure 2.18 Perrin Jablonski diagram and illustration of the relative positions of
absorption, fluorescence, and phosphorescence spectra .................... 28
Figure 2.19 Non-fluorescent vs. fluorescent orange ............................................. 29
Figure 2.20 Schematic diagram of fluorescence spectroscopy ............................. 31

xvii
Figure 2.21 Absorption and emission spectrum of perylene and quinine ............. 32
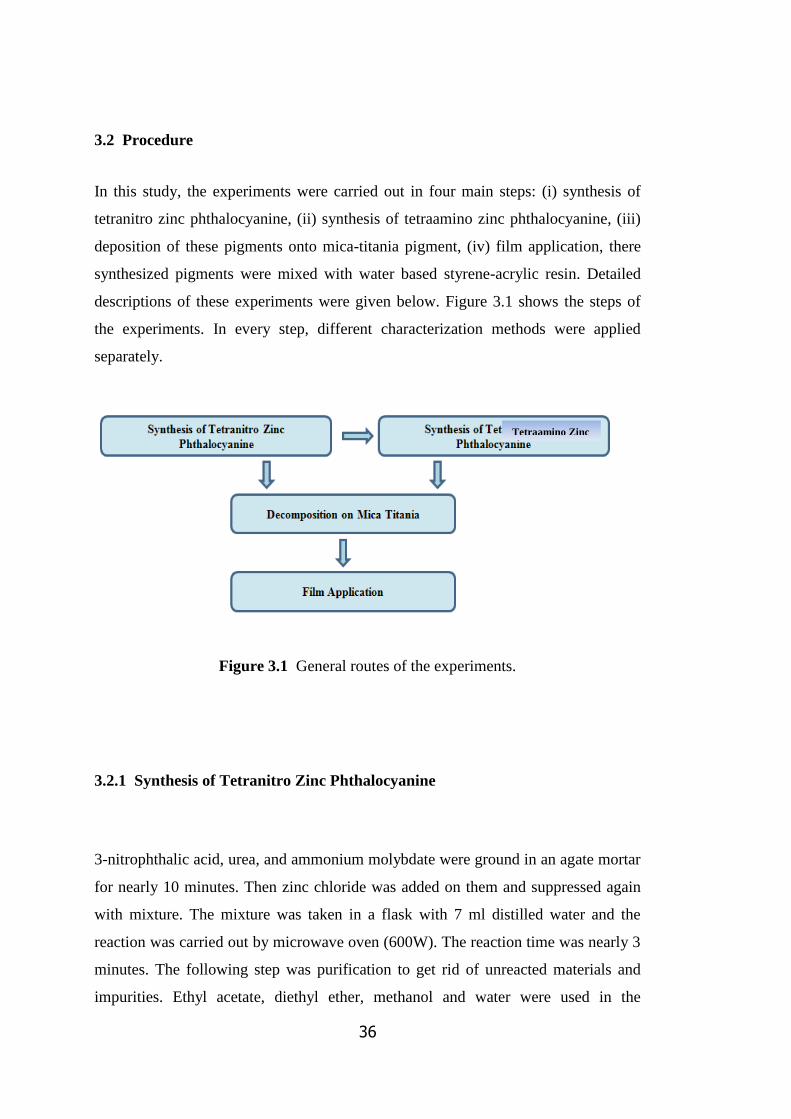
Figure 3.1 General routes of the experiments...................................................... 36
Figure 3.2 Synthesis reaction of tetranitro zinc phthalocyanine. ........................ 37
Figure 3.3 Synthesis reaction of tetraamino zinc phthalocyanine ....................... 37
Figure 3.4 Experimental procedures for combination of TNZnPc and TAZnPc
with mica-titania................................................................................. 39
Figure 4.1 FT-IR spectrum of tetranitro zinc phthalocyanine. ............................ 48
Figure 4.2 FT-IR spectrum of tetraamino zinc phthalocyanine........................... 49
Figure 4.3 UV-Vis spectrum of TNZnPc ............................................................ 50
Figure 4.4 UV-Vis spectrum of TAZnPc ............................................................ 51
Figure 4.5 Fluorescence spectrum of TNZnPc.. .................................................. 52
Figure 4.6 Fluorescence spectrum of TAZnPc .................................................... 52
Figure 4.7 Fluorescence emissions comparing of TAZnPc and TNZnPc ........... 53
Figure 4.8 Pictures of combination pigments, (a) mica-titania, (b) TAZnPcMip,
and (c) TNZnPcMip ........................................................................... 54
Figure 4.9 FT-IR spectra of TNZnPcMip 0.01 g TNZnPc in CHCl3, pH=5; (a)
mica-titania, (b) TNZnPc, and (c) TNZnPcMip ................................ 55
Figure 4.10 FT-IR spectra of TNZnPcMip 0.01 g TNZnPc in CHCl3 , pH=5 at
1700-500 cm-1
; (a) mica-titania, (b) TNZnPc, and (c) TNZnPcMip .. 56
Figure 4.11 FT-IR spectra of TNZnPcMip 0.01 g TNZnPc in CHCl3+ TFA, pH=2
(a) mica-titania, (b) TNZnPc, and (c) TNZnPcMip ........................... 57
Figure 4.12 FT-IR spectra of TAZnPcMip 0.01 g TAZnPc in DMF+AA, pH=4;
(a) mica-titania, (b) TAZnPc, and (c) TAZnPcMip ......................... 58
Figure 4.13 FT-IR spectra of TAZnPcMip 0.01 g TAZnPc in DMF+AA, pH=4 at
1700-500 cm-1
; (a) mica-titania, (b) TAZnPc, and (c) TAZnPcMip .. 59
Figure 4.14 FT-IR spectra of TAZnPcMip 0.01 g TAZnPc in DMF+TFA, pH=3
(a) mica-titania, (b) TAZnPc, and (c) TAZnPcMip. ........................ 60
Figure 4.15 SEM micrographs of mica-titania pigment; (a) high magnification,
(b) low magnification. ........................................................................ 61
Figure 4.16 SEM micrographs of TAZnPcMip synthesized at 120°C in DMF+AA
............................................................................................................ 61

xviii
Figure 4.17 SEM micrographs of TNZnPcMip synthesized at 50°C in CHCl3……62
Figure 4.18 EDX results of on mica-titania TNZnPcMip sample synthesized at
50°C in CHCl3 .................................................................................... 63
Figure 4.19 EDX results of on zinc pigment TNZnPcMip sample synthesized at
50°C in CHCl3. ................................................................................... 64
Figure 4.20 SEM micrographs of TNZnPcMip synthesized at 50°C in CHCl3
+TFA.. ................................................................................................ 65
Figure 4.21 Relation between mass percent of N and TAZnPc for; (a) DMF+AA
samples, (b) DMF+TFA samples ....................................................... 67
Figure 4.22 Relation between mass percent of N and TNZnPc for; (a) CHCl3, (b)
CHCl3+AA, (c) CHCl3+ TFA ....................................................... 69,70
Figure 4.23 Relation between mass percent of N for DMF+AA, DMF+TFA, and
CHCl3 experiments. ............................................................................ 72
Figure 4.24 Fluorescence spectra of TNZnPcMip in chloroform samples at
different ratios .................................................................................... 73
Figure 4.25 Comparison of fluorescence effect of TNZnPcMip, TNZnPc, and
mica-titania ........................................................................................ .74
Figure 4.26 Comparison of experimental and expected fluorescence according to
Rule of Mixtures (ROM) value with respect to mass percent of
TNZnPc pigment ................................................................................ 75
Figure 4.27 Percent increment of fluorescence ..................................................... 76
Figure 4.28 The comparative color properties of combination pigments based on
different phthalocyanine decomposition ............................................ 79
Figure A.1 FT-IR spectra of DMF with TNZnPc, DMF+AA with TNZnPc, and
DMF with TAZnPc ............................................................................ 95
Figure A.2 FT-IR spectra of CHCl3 with TAZnPc, CHCl3 +AA with TNZnPc,
and water with TAZnPc ..................................................................... 96

xix
LIST OF SYMBOLS AND ABBREVIATIONS
AA Acetic Acid
CHCl3
DMF
Chloroform
Dimethyl Formamide
DMSO Dimethyl Sulfoxide
FT-IR Fourier Transform Infrared Spectroscopy
HCl
METU
Hydrochloric Acid
Middle East Technical University
NaOH Sodium Hydroxide
TAZnPc
TAZnPcMip
Tetraamino Zinc Phthalocyanine
Combination pigment of Tetraamino Zinc
Phthalocyanine with Mica-Titania
TFA
TNZnPc
TNZnPcMip
Trifluoro Acetic Acid
Tetranitro Zinc Phthalocyanine
Combination pigment of Tetranitro Zinc
Phthalocyanine with Mica-Titania
SEM Scanning Electron Microscopy
UV-Vis Ultraviolet-Visible Spectroscopy
UNAM Bilkent University National Nanotechnology
Research Center
XPS X-Ray Photoelectron Spectroscopy


1
CHAPTER 1
INTRODUCTION
Pigments have been used as coloring agents since centuries and their properties have
improved year by year. They are not only used to provide color but they also can
provide magnetic, electromagnetic, and corrosion inhibiting properties. Pigments are
classified with respect to their interaction with light. They are either classified
according to their gloss or to their color. In the few decades, pigments with very high
gloss were synthesized and commercialized under the general class name of ‘effect
pigments’. Effect pigments are defined as metallic effect pigments or pearlescent
pigment [1].
Color properties of materials depend on scattered light and viewing angle.
Pearlescent pigments are a kind of pearl-shine appearance luster pigments because
angle dependent transparent layers have different refractive indices [2]. Pearlescent
pigments are very important for many applications like plastics, industrial coating,
printing inks, cosmetics and automobile paint. They are used to obtain pearl,
rainbow, or metallic effects. In addition, transparent color formulations are used to
acquire brilliance, two tone color, luster flops [3].
The discovery of synthetic very thin micron or submicron size plates that can create
an additional layer with metal oxides is a worthwhile development. Titanium dioxide
coated mica flakes, or glass flakes, silica, and alumina flakes can be given as the
examples. Mica has been the main constituent of the effect pigments. It can be used
especially in coatings, and polymers.
2
Pearlescent pigments can be combined with additive pigments which improve optical
properties. It is possible to obtain brilliant color and new coloristic effects by coating
a colorant (absorptional pigment) with a pearlescent pigment. These new pigments
are so-called ‘combination pigments’. An additional advantage of the combination
pigments is that they decrease the optical dispersion problems related with
conventional pigments because of their small particle size and high surface area. A
way to obtain combination pigment is the coating of titanium dioxide-mica pigments
with an organic or inorganic colorant. The colorants provide an additional layer on
mica-titania pigments. Phthalocyanines, carbon black, dioxazines, quinacridones,
perylenes iron (III) oxide are more preferable pigments for combination [3]. Table1.1
represents some pearlescent mica pigments with basic properties.

3
Table 1.1 Color properties of some mica-based pearlescent pigments [3].
Phthalocyanines can be used as additive pigments to mica-titania pigments to acquire
combination pigments. Phthalocyanines are more stable aromatic macrocyclic
compounds, and they are capable of combining more than 70 metallic and non-
metallic ions in the aromatic rings [4]. Phthalocyanines have very attractive physical
and chemical properties which show their importance in molecular functional
materials. Their optical and electronic properties enable their usage in many
applications such as photodynamic therapy medicines, catalysts for the photo
4
oxidation, photoconducting agents for photocopies, deodorants, germicides,
retardation films for plant growth in greenhouses. Their properties can be changed
also by periphery substitutions [5]. In the last decades, there have been new areas for
using phthalocyanines, such as semiconducting devices, photovoltaic solar cells,
electrophotography, rectifying devices, molecular electronics, Langmuir- Blodgett
films, gas sensors, liquid crystals, and electrocatalytic reagents [6, 7].
Metallophthalocyanines have highly intense absorption in the red region of visible
light that can be useful for photosensitizers. To have high triplet state lifetimes and
fluorescence, diamagnetic metal can be combined with phthalocyanines. Zinc,
aluminum and silicon can be used as well diamagnetic metals which have efficient
fluorescent property for many applications.
Functional or substituted phthalocyanines could be obtained by direct and indirect
ways. Halogenated or sulfonated phthalocyanines have synthesized by substitution of
the core molecule or special starting materials [8]. Substituted phthalocyanines, very
little particle sizes, tend to be more soluble in many organic solvents; therefore, they
are preferred in recent applications.
The main problem with phthalocyanines is their aggregation that influences their
gloss negatively, because, large size aggregates absorb the light which is supposed to
be reflected. In order to cope with this problem, they can be deposed on pearlescent
pigments in the form of a thin layer reducing the light absorption and favoring the
reflection. As a result of this combination, pigments become very brilliant in color.
The main objective of this work is the synthesis of tetranitro zinc phthalocyanine and
tetraamino zinc phthalocyanine coated mica-titania combination pigments to obtain
fluorescent effect pigments. Different amounts of phthalocyanines and two different
solvents were used to synthesize combination pigments. Moreover, the effect of pH
on the reaction was examined. Color effects and optical properties were investigated
by using the pigments in a water based clear resin.

5
CHAPTER 2
LITERATURE REVIEW
In this chapter, phthalocyanines and the methods of their production, effect pigments,
and mica-titania based combination pigments and their properties were described
briefly. Besides that, recent and previous studies were overviewed in this study.
2.1 Effect Pigments
Pigments are usually dispersed on the surface of the materials like in inks, plastics,
paints etc. In addition, they maintain their structure after exposing to physical and
chemical processes [9]. Besides generating colors, pigments are used also as filling
materials, corrosion inhibitors, and they also deliver special functions due to their
magnetic, electrical or electromagnetic properties [1].
Effect pigments are classified as anti-corrosive pigments, magnetic pigments, metal
effect pigments, pearl luster pigments, luminescent pigments, and transparent
pigments. The first two properties are not related to color; anti-corrosive pigments
protect the material from environmental corrosive interactions; and magnetic
pigments are used for data storage in electronics. Luminescence pigments will be
addressed in the following sections. Transparent pigments are utilized to color
cleaning in plastic bottles and films for packaging [10].
Figure 2.1 shows the optical features of absorption pigments, metal effect pigments,
pearl and pearlescent pigments. While conventional pigments absorb and/or scatter
light, effect or pearlescent pigments are composed of both pearlescent and metallic
particles. Metal pigments are small metal flakes such as aluminum copper or

6
titanium, and flaky structure generates enhanced light and color impression. Metallic
effect pigments reflect nearly all the incident light, act like a mirror, and then they
seem very brilliant. They are widely used in automotive topcoats. Pearlescent
pigments produce the luster of natural pearls. Metallic and pearlescent pigments
consist of layers that have high and low refractive index. The plates with high
refractive index can settle on substrate surface in parallel alignment. The pearl luster
effect is described by multiple reflections that come out of the depth and seem softly.
The enhancement of the intensity of reflecting light from a flaky pigment surface due
to interference with the lights coming from lower depths increase the gloss and
deliver a shiny or pearlescent appearance. Pearlescent pigments can be transparent or
have partially light absorptive surfaces, they resemble crystal particles [3, 9].
Figure 2.1 Schematic presentation of optical properties of absorption pigments,
effect pigments and pearlescent pigments [3].
Table 2.1 gives some examples of the types of effect pigments. The main purposes of
effect pigments can be explained as; contributing to new improvements in pigments,
more intense interference colors, more capable of hiding power, stability on air

7
conditions, and development on the dispersibility. Effect pigments can be produced
by ecologically safe processes, so they can be thought of as non-toxic pigments.
Table 2.1 A brief presentation of effect pigments [3].
2.2 Mica Titania Based Pigments
The most known type of pearlescent pigments relies on natural mica plates. Coated
mica pigments are produced by depositing smooth metal oxide films on very thin
mica plates. Mica layers are inert and they can be used as a filler and colorant [11].
The particle size and thickness of these platelets change from 1 to 200 µm and from
200 to 500 nm, respectively. Figure 2.2 and Figure 2.3 show the structure of titanium
dioxide mica pigments. The advantages of mica-titania pigments are high luster, well
hiding power, the highest thermal, chemical and physical stability, non-toxicity, low

8
price, and low density. They are used in plastics, cosmetics, printing inks, ceramic
products, and lacquers [3].
Figure 2.2 Schematic representation of structure of mica-titania pigment with the
four existing interphases [3].
Figure 2.3 SEM image of mica pigment particle [3].
Figure 2.4 shows the manufacturing process. Firstly, mica is ground and classified
according to the particle size distribution of platelets produced. After that, a wet
chemical process is carried out to deposit metal oxides on platelets. Then coating,
filtration, drying and calcination steps are carried out in sequence. For laboratory
synthesis, according to Topuz and co-workers’ study two different methods were

9
used to synthesize titania coated mica, which are; homogeneous hydrolysis and
titration methods [12].
Figure 2.4 Process scheme for titania coated mica pigments [1].
The color efficiency of pearlescent pigment can be improved by introducing another
pigment to the titania coated mica. By virtue of these pigments, pearlescent pigments
give additional characteristics like sharper colors, more stability, and well dispersion
[9]. The color is developed because of the combination of base and interference
colors. Additional pigments should have small particle size and high surface area.
The pigment color can be different depending on the composition and viewing angle
of the additional pigment [1].
Pearlescent pigments can be used in conductive flooring, antistatic packaging
materials, IR- reflecting plastic sheets, and laser marking plastics. By new additive
pigments, materials gain new properties. Table 2.2 points out the functional
properties of some metal oxide mica pigments.

10
Table 2.2 Some functional combination pigments, properties and applications [1].
2.3 Phthalocyanines
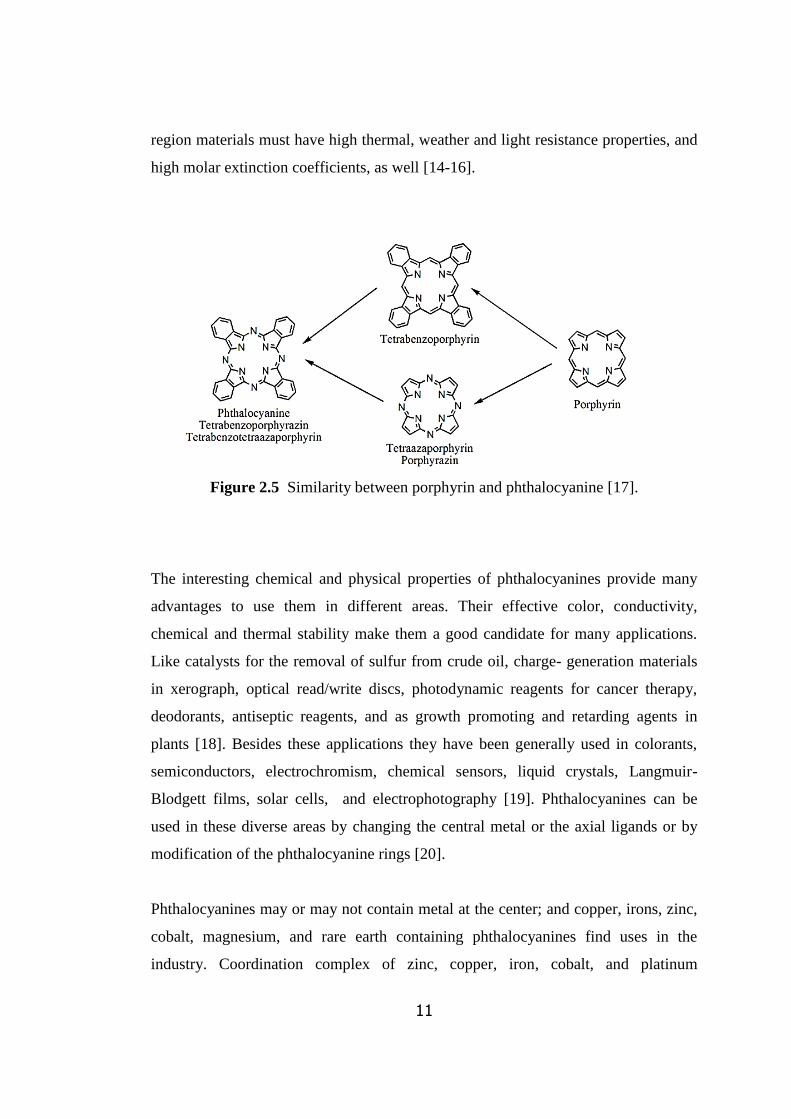
Phthalocyanines (Pc), very close to porphyrin compounds (Figure 2.5), are one of the
most studied groups of functional organic pigments. Phthalocyanines and their
derivatives have many important characteristics such as catalytic, optical, and
electronic properties. Porphyrin structure contributes to the desirable quality of
materials, as large dipole moment, polarizabilities, and hyperpolarizabilities. The
nonlinear optical properties provide energy transfer with molecular control so that
they have been used in data storage and electrooptical signal processing. It is
important that the stability of the molecules of π-radicals makes them useful
especially in photoionization processes [13]. Moreover, phthalocyanines have intense
absorption in the near infrared region (750-1300 nm) that is crucial for many
applications such as thermal imaging, infrared thermal imaging, and liquid crystal
display devices in the security industry. This is because of the fact that near infrared
11
region materials must have high thermal, weather and light resistance properties, and
high molar extinction coefficients, as well [14-16].
Figure 2.5 Similarity between porphyrin and phthalocyanine [17].
The interesting chemical and physical properties of phthalocyanines provide many
advantages to use them in different areas. Their effective color, conductivity,
chemical and thermal stability make them a good candidate for many applications.
Like catalysts for the removal of sulfur from crude oil, charge- generation materials
in xerograph, optical read/write discs, photodynamic reagents for cancer therapy,
deodorants, antiseptic reagents, and as growth promoting and retarding agents in
plants [18]. Besides these applications they have been generally used in colorants,
semiconductors, electrochromism, chemical sensors, liquid crystals, Langmuir-
Blodgett films, solar cells, and electrophotography [19]. Phthalocyanines can be
used in these diverse areas by changing the central metal or the axial ligands or by
modification of the phthalocyanine rings [20].
Phthalocyanines may or may not contain metal at the center; and copper, irons, zinc,
cobalt, magnesium, and rare earth containing phthalocyanines find uses in the
industry. Coordination complex of zinc, copper, iron, cobalt, and platinum

12
demonstrates that they have high stability even in concentrated, nonoxidizing acids
and bases [21]. In other words, unsubstituted phthalocyanines and their metal
complexes are diagnosed by strong intermolecular cohesion which is insoluble and
non-melting solids. Transition metals can be fit in these complex ligands. If
unfavorable volume ratio occurs in phthalocyanine ring and metal complex, stability
may decrease in these materials [22]. Figure 2.6 shows the metal and non-metal
phthalocyanines.
Figure 2.6 Non-metalled and metalled phthalocyanine showing the covalent and
partial bonds between the central metal and the nitrogen atoms.
Phthalocyanines can be synthesized in non-substituted and metal substituted forms.
Non-substituted phthalocyanines can be used as a stable color agent. Their well
conductivity, thermal and chemical stability, make them a suitable choice for
application in organic light emitting devices [23]. Substituted phthalocyanines are
more soluble than other forms. However, aggregation is the main problem for these
phthalocyanines due to their strong interactions between planar molecules in
solutions. Phthalocyanine containing dendrimers and polymers overcome these
difficulties. Besides that, the integration of phthalocyanines in macromolecules
enhances their properties and develops new materials. Phthalocyanine containing
polymers are named according to their side group, main chain or forming a

13
polymeric cycle. Polymeric or macrocyclic phthalocyanines are not soluble in
organic solvents. This makes them difficult in their usefulness and functionality [24].
The solid and solution phase of phthalocyanines can be exposed to different
properties especially in nonlinear optical properties. According to the studies, dilute
solutions of phthalocyanines show nonlinear optical properties, when compared with
their solids. This difference can be explained by excitonic effect, related to
intermolecular interactions [25].
McKeown and co-workers studied a specific phthalocyanine based network polymer.
They prepared microporous material based on phthalocyanines with linking groups
and phthalocyanines with solidly themselves. These materials were synthesized by
the reaction of octasubstituted phthalocyanines with reactive bifunctional linking
groups. These types of macromolecule polymers find place in chemoselective
adsorptions, separations, and heterogeneous catalysts. Figure 2.7 demonstrates the
phthalocyanine based network polymers [26].
Figure 2.7 Phthalocyanine based network polymer [26].

14
2.3.1 Methods of Synthesis
Phthalocyanines can be synthesized in metallo or non- metallo forms. Generally, they
are produced fusing phthalonitrile, metal salts or by later insertion of metals into
phthalocyanines at high temperature conditions. The reaction can be carried out both
in solvents or in solvent free medium. After the completion of reaction, the soluble
impurities and unreactants are removed by extracting with solvents or acids and
bases. Substituted phthalocyanines are more soluble in organic solvents or in acids
and bases, and their purification can be carried out by chromatography,
recrystallization, and extraction [27, 28]. Figure 2.8 demonstrates the basic principles
of synthesis of metallophthalocyanines.
Figure 2.8 Basic principles of synthesis of metallophthalocyanines [27].

15
For the large scale production of phthalocyanines, phthalic anhydrate, urea, metal
salts, and ammonium molybdate which is used as catalyst are heated up to 200°C
[29]. On the laboratory scale, it is suggested that benzene-1,2-dicarbonitrile and
metal salt must be heated in molten urea [30].
Phthalocyanines can be prepared also under microwave radiation in the presence of
proper solvents in high yield. The microwave radiation supplies the high energy
needed and reaction time is completed in a very short time. This is an advantage
when compared with other long time and high temperature reactions. Microwave
radiation heating is selective, direct, rapid, internal and controllable [31].
Safari and co-workers studied the synthesis of metal substituted octachloro-,
hexadecachloro- and tetranitro phthalocyanine by microwave radiation under solvent
free conditions. They prepared the tetranitro metallophthalocyanines under solvent
free conditions. The 3-nitrophthalic anhydride (0.77 g), urea (4.80 g), copper (II)
sulfate pentahydrate (0.12 g) and ammonium heptamolybdate (0.10 g) were ground
until a homogeneous powder was obtained. Then after, the powder was placed in 25
ml beaker and irradiated in a microwave oven at high and medium power for 2 and 1
min, respectively. They also modified the purification route by using methanol and
n-hexane. The solid product was filtered with water to remove excess urea. The dried
phthalocyanines were treated also with degassed dimethyl sulfoxide under nitrogen
atmosphere and the mixture was refluxed for 7 h at 110°C [32].
Industrially, phthalocyanines are produced using phthalic anhydrate and urea, as
phthalic anhydrate is cheaper than phthalonitrile, and it gives higher yield lowering
the cost. The reaction is shown in Figure 2.9.

16
Figure 2.9 The reaction for the industrial synthesis of phthalocyanines.
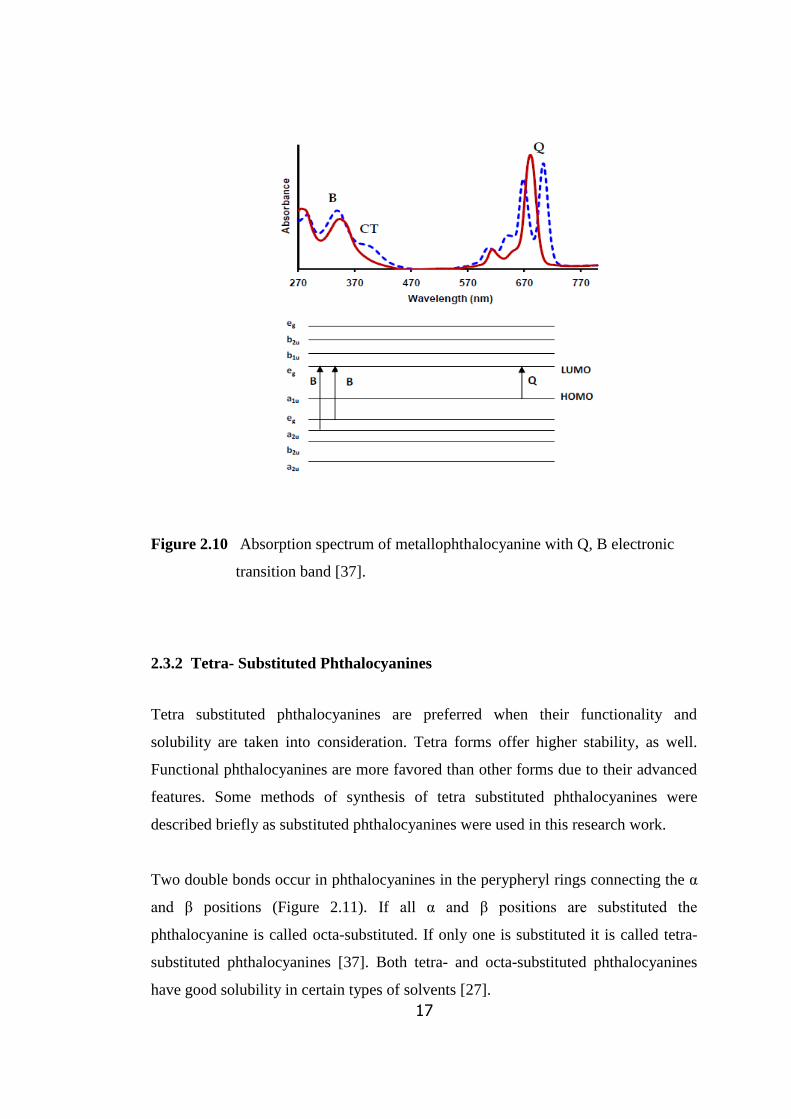
Phthalocyanines absorb the visible spectrum of light. The absorption bands of
molecules are related with molecule structure. Electronic transition between π-π*
bonding in the 18-π-electron systems of the macrocycle leads to two absorption
pikes, the Q and B bands. Figure 2.10 demonstrates the typical absorption spectrum
of metallophthalocyanine (in blue color) and the unmetalled phthalocyanine (in red
color) [33]. Metallophthalocyanines absorb the light in nearly 650 nm. They are very
useful in some devices due to their large scattered configuration [34]. Large
phthalocyanines with additional substitutions can be used in the photodynamic
therapy as they have good photostabilities, high fluorescence quantum yields, and
strong absorption on visible region. Unsubstituted phthalocyanines have a low
solubility in water but they have ability to encapsulate in micelles, or can be used
with polymeric nanoparticles [35, 36].
17
Figure 2.10 Absorption spectrum of metallophthalocyanine with Q, B electronic
transition band [37].
2.3.2 Tetra- Substituted Phthalocyanines
Tetra substituted phthalocyanines are preferred when their functionality and
solubility are taken into consideration. Tetra forms offer higher stability, as well.
Functional phthalocyanines are more favored than other forms due to their advanced
features. Some methods of synthesis of tetra substituted phthalocyanines were
described briefly as substituted phthalocyanines were used in this research work.
Two double bonds occur in phthalocyanines in the perypheryl rings connecting the α
and β positions (Figure 2.11). If all α and β positions are substituted the
phthalocyanine is called octa-substituted. If only one is substituted it is called tetra-
substituted phthalocyanines [37]. Both tetra- and octa-substituted phthalocyanines
have good solubility in certain types of solvents [27].

18
Figure 2.11 Numbering scheme for the phthalocyanine core [38].
The β-substituted phthalocyanines are more soluble due to out of plane bending of
their substance, as seen in Figure 2.12 [9]. The α-crystal has low stability, and the
pigment can return to more stable β forms with the increase in temperature above
218°C [39].
Figure 2.12 Structure of a) α and b) β octasubstituted phthalocyanines [37].

19
Kobayashi et al. investigated 35 phthalocyanines according to the effect of peripheral
substitution on the electronic absorption and fluorescence spectra. They mostly used
alkyl thio groups as an electron releasing group, while nitro and phenylsulfonyl
groups are used as an electron withdrawing group. In their work, α and β position
groups joined the phthalocyanine molecule, so that the B and Q bands shift to longer
wavelength. α and β position groups shows totally different effects. What they found
is that, non-metallophthalocyanines have lower splitting of the Q band with
increasing wavelength, and electron releasing groups are more effective than α-
position phthalocyanines. In addition, 16-electron substituted phthalocyanines have
larger Q band absorption coefficients, than tetra and octa-substituted phthalocyanines
[5].
Substituents and the peripheral phenyl groups of phthalocyanine structure affect the
nature of electronic conductivity of complexes. In 1991, Singerski et al. investigated
the electrical conductivity of nickel (II) tetra-amino phthalocyanine. According to
that research, amine groups on the peripheral benzene ring have great effect on the
increase of electrical conductivity [40].
Alzeer and co-workers studied the synthesis of tetra substituted zinc phthalocyanines
as well as non-metallic forms. Tetranitro zinc phthalocyanines were produced using
4-nitrophthalic anhydride (2.0 g), urea (3.0 g), zinc chloride (383 mg), and
ammonium molybdate (13 mg) all dissolved in nitrobenzene (15 ml). The mixture
was stirred under nitrogen atmosphere at 185oC for 4 hours (Figure 2.13). The
reaction mixture was cooled and diluted with toluene (80 ml). The resulting
precipitate was washed with toluene, water, methanol/ether (1:9), and ethyl
acetate/hexane (2:1). The dried product was a dark green solid. The IR spectrum
showed peaks at 1513, 1321, 1080, 754, 726 cm-1
. The molecular formula of
tetranitro zinc phthalocyanine is C32H13N12O8Zn, and its molecular weight is 757
g/mol [41].

20
Figure 2.13 Synthesis of tetranitro zinc phthalocyanine [41].
Figure 2.14 Synthesis of tetraamino zinc phthalocyanine [41].
They also synthesized tetraamino zinc phthalocyanine using sodium sulfide
nonahydrate (7.4 g) and tetranitro zinc phthalocyanine (1.95 g) in 50 ml DMF. The
reaction was carried out under nitrogen atmosphere at 65°C. After 4 hours, the
mixture was cooled down to room temperature and diluted with ice water. The
resulting matter is filtered by methanol/ether (1:9), and ethyl acetate. The product
was dried and a dark green solid was obtained. The IR spectrum had peaks at 1603,

21
1490, 344, 1092, 1044, 822, 743 cm-1
. The molecular formula of tetraamino zinc
phthalocyanine is C32H21N12Zn, and its molecular weight is 637 g/mol.
Achar and Lokesh studied the tetraamino phthalocyanines having cobalt, nickel, and
copper at the center. The synthesis reaction was carried out by the reduction of nitro
groups with sodium sulphide. They also investigated electrical conductivities of
tetraamino phthalocyanines. They reported that the complexes increased the
conductivity 105-10
6 times, when compared with unsubstituent phthalocyanines [40].
Yenilmez and co-workers studied the synthesis of tetra substituted cobalt, zinc, and
copper phthalocyanines. Microwave radiation was used to synthesize Co and Zn
phthalocyanines from phthalonitrile, metal salts (CoCl2 and Zn (CH3COO)2), and
1,8-diazabicyclo(5.4.0)undec-7-ene (DBU) in hexanol. Cu-phthalocyanine
compound was produced by reaction of phthalonitrile, copper (II) chloride at 160 °C
with the presence of DBU. Phthalocyanines were purified by using column
chromatography. Furthermore, they reported the aggregation properties and
fluorescence behavior of these phthalocyanines [31].
2.3.3 Zinc Phthalocyanines
Metallophthalocyanines have been investigated prevalently due to their increasing
usage in many areas [34, 42, 43]. The presence of central metal ion affects and
improves the photophysical behavior of metallophthalocyanines very strongly. It is
proven that, diamagnetic ions such as Zn2+
, Al3+
, and Si4+
increase both triplet
quantum yields and triplet lifetimes with a closed shell [44, 45].
Zinc (II) phthalocyanine (ZnPc) complexes have been studied intensively by virtue
of their photosensitizing properties [46-49]. They have high fluorescent properties,
leading to their widely usage in photodynamic therapy. Moreover, the special
chemical group at the periphery of zinc phthalocyanine compounds may be
22
selectively preferred by some tumor cells, and the phthalocyanines with these
structures are called third generation photosensitizers [50].
Metallophthalocyanines, as mentioned before, tend to aggregate in solution, which
results in a decrease in the photosensitizing property. The addition of functional
groups to peripheral position also affect the chemical properties of
metallophthalocyanine complex [51]. It can be clearly said that, functional groups
make dissolution in organic solvent easier via increasing the distance between
macrocycle rings carrying the π-electrons. Solvents also influence the photochemical
and photophysical behaviors of metallophthalocyanine complexes [52, 53].
Nombona et al. investigated fluorescence behavior of zinc phthalocyanines having
naphthol and carboxyl groups. The synthesis was achieved by using the mixed
phthalonitrile cyclotetramerization of 3-(1-naphthoxy) phthalonitrile with a
carboxylic acid phthalonitrile [54].
2.3.4 The pH and Solvent Sensitiveness of Phthalocyanines
Phthalocyanines contain high number of conjugated π-electrons that make electron
transfer possible. Electron transfer reactions can be controlled by taking and giving
proton which leads to the modification of the structure [55]. Generally,
phthalocyanines and their metal derivatives have been used as electron donors rather
than electron acceptors, unless high electron taking group is stationed on the
macrocycle [56].
The main purpose of the phthalocyanine protonation is their significant advantage on
the photophysical and structural properties. Protonation of the nitrogen atoms on the
external section of the ring decreases the symmetry. It leads to a shift in the
absorption of the Q band which is desired especially in photodynamic applications.
However, there are limited investigations in protonation of the phthalocyanine on the

23
redox quality. Strong acid is required to protonate the phthalocyanines that have low
basicity [13, 57]. Protonation of phthalocyanines has been generally applied to
insoluble ones. They are protonated in two different ways: the isoindole nitrogen and
meso-nitrogen (Figure 2.15). Phthalocyanine protonation ordinarily occurs at the
meso-nitrogen atom because of the hardness of structural deformation at the
isoindole-nitrogen atom [58]. Nitrogen and hydrogen bound covalently with each
other.
Figure 2.15 Isoindole –nitrogen and meso- nitrogen protonation of phthalocyanine
[59].
Fukuzumi et al. studied on structures and photoinduced electron transfer of
protonated porphyrins and metallophthalocyanines. Metaled azoporphyrins
contribute to acid-base interaction with four nitrogen atoms. According to their
results, protonated porphyriniods increase the chance of producing supramolecules as
well as make the control of redox potentials easier [59].
Tetra-substituted phthalocyanines have red shift in the Q band that is a desirable
point in photosensitizers in photodynamic therapy. A red shift was carried out upon

24
protonation. However, fluorescence decreased when the protonation is applied to
tetra-substituted phthalocyanines. This attributed to decrease in energy triple state
[60].
Ogunsipe and Nyokong worked on protonated and unprotonated zinc phthalocyanine
and its derivatives to observe the ring substituents, axial ligands, and the effect of
solvents on fluorescence. Protonation was achieved by TFA. Concentrated sulfuric
acid was used to get tri- and tetra- protonation of the substance. Their results were
summarized like that: Ring substituted zinc phthalocyanines were not protonated due
to aggregation in the solution, additional acids increased the aggregation, axial
ligands in the solvent vanished when protonation in the solvent, occurred and the
probability of protonation was decreased with the strong basicity. Besides that, for in
all circumstances, fluorescence decreased with protonation ( Table 2.3) [61].
Table 2.3 Effect of solvent on the Q band maxima of protonation of zinc
phthalocyanine [61].
Maree et al. reseached the effects of solvents on the photochemical and
photophysical behavior of zinc phthalocyanines. They used zinc phthalocyanines,
zinc octaphenoxyphthalocyanine and zinc octaesronephthalocyanine besides
tetrahydrofuran, dimethylsulphoxide, N,N'- dimethlyformamide etc. as aromatic
solvents. They investigated influence of the solvents on the ground state spectra
because the photosensitized reactions and their capability of generate singlet oxygen

25
are very important. According to the experimental results, zinc phthalocyanine and
its derivatives give high fluorescence quantum yields in tetrahyrdrofuran [50].
Topal and co-workers examined the α, and β substitued zinc phthalocyanines’ pH
sensitivities in diverse solutions, upon protonation. Phthalocyanine efficiency is
strongly depend on protonation. They used PVC and ethyl cellulose as basic matrix
materials for immobilization of phthalocyanines, and THF for a solvent. They seen
the decreasing in the fluorecence emission on the Q band due to the protonation.
According to them, tetra-substituted zinc phthalocyanines are manageble “high
resolution pH sensitive molecular probes” for the pH range of 2.0-8.0 [62].
2.4 Fluorescence
Luminescence is the emission of light from excited molecules of any substance. It is
considered in two different categories, which are fluorescence and phosphorescence.
Fluorescence is a phenomenon that occurs when a material absorbs the radiation at a
certain wavelength, and then reemitted at different wavelengths. In luminescence the
initially absorbed excitation energy is always higher than the released energy of
luminescent system. The efficiency of luminescence efficiency; is called quantum
yield and it denotes. The ratio of the energy emitted to energy absorbed [9]. In order
to understand clearly, the energy levels of the molecule must be examined. In the
ground single state, the initial state of the molecule absorbs all radiation. In the
singlet state all electrons of the molecule are paired in an electronic state. In the
triplet state the spin of electrons align in the same direction. Figure 2.16 is a
schematic representation of the distinction between ground state, single state, and
triple state.

26
Figure 2.16 Distinction between ground, singlet and triple states.
In fluorescence, the excited electrons in single state lose energy through a
mechanism called ‘internal conversion’, and they go down to lower energy states and
go back to ground state. The time spent in the excited state is generally 10-8
s;
consequently a general fluorescence lifetime is near 10-9
m [63]. It is quite a long
time compared to 10-12
s for deexcitation of electrons from the higher levels of
excited state.
The other category, phosphorescence, is the triple excited state light emission. The
term is typically used to define long lived luminescence. The electrons in the singlet
state undergo transformation by a mechanism called ‘interval conversion’ and the
spins are aligned in the same direction. This state is called triplet state and it has
lower energy than the singlet state. Therefore the lifetime of electrons is much
longer, and is around 10 -3
to 100s. The reason of illumination of phosphorescent
materials in the dark is the long periods of spin inversion. Returning to the discussion
on the difference between fluorescence and phosphorescence; fluorescence is an
emission from an excited state that can be achieved by direct photoexcitation,
whereas phosphorescence is emitted from triplet state [64].
The basic principles of light absorption by molecules, consists of the part of the
molecule from a lower electronic state which is usually the lowest energy (ground
state), to a higher energy state (excited state). In UV, near infrared, visible spectrum
region, electronic transition is formed as shown in Figure 2.17 [65].

27
Figure 2.17 Electromagnetic spectrum [65].
During the absorption and emission processes, many changes may happen in
electronic and vibrational states. The Perrin- Jablonski diagram (Figure 2.18) is
suitable for understanding photon absorption, fluorescence, phosphorescence, and
electron transition processes. S0 is the ground state, S1 and S2 are singlet excitation
states, and T1, and T2 are the triplet states. It is important to note that absorption is
very fast process, nearly 10-15
s, with respect to other processes. Fluorescence
typically comes about at lower energies of longer wavelengths. Vibrational
relaxation is about 10-12
s and generally happens via collision and rotation of
electrons generally before returning to the ground state (S0). Internal conversion (IC)
is also another route of energy returning from the lower levels. In absorption and
emission processes, S1→ S0 transitions are the most likely than S1→ Sn transitions.
The transition may occur from ground state to various excited states (S1, Sn).
Fluorescence happens from S1 to S0, but phosphorescence occurs from T1 to S0 [64,
65].

28
Figure 2.18 Perrin-Jablonski diagram and illustration of the relative positions of
absorption, fluorescence, and phosphorescence spectra [64].
2.4.1 Fluorescent Pigments
Luminescent pigments absorb the incoming radiation, and then convert it into low
energy radiation with longer wavelength. If the absorbed radiation is in near-UV
region but not in visible region the emitted light falls into visible region, and thus the
intensity of visible region becomes augmented. This is actually what fluorescent
radiation is, and the light becomes brilliant. The pigments are commonly activated
by the near-UV and visible violet wavelengths [66]. Fluorescent pigments are

29
inorganic and usually crystalline materials that emit light when activated by UV
radiation. The well-known commercial inorganic fluorescents are zinc sulfide, and
combined zinc and cadmium sulfides known as a daylight fluorescent pigments [67].
Figure 2.19 demonstrates an example for non-fluorescent and fluorescent pigment. It
is clearly seen that the intensity of conventional non- fluorescent orange pigment is
less than the fluorescent one. Non–fluorescent pigment absorbs white light and
reflect 600nm wavelength (orange band) of the visible spectrum. However, a
fluorescent orange pigment absorbs white light and transform to lower wavelength
colors such yellow, green, blue, violet [9].
Figure 2.19 Non-fluorescent vs. fluorescent orange [9].
Most of daylight fluorescent pigments are comprised of fluorescent dyes. They can
be dissolved or dispersed in a polymer matrix and used in paints, plastics or printing
inks [6].
Fluorescent
Non-Fluorescent

30
Metallophthalocyanines have photosensitizing tendencies, which gives absorption
intense in the red visible region. In order to obtain efficient sensitization, high triplet
state quantum yields and long lifetime are required. This criterion may be achieved
by using diamagnetic metals with phthalocyanines such as zinc, aluminum, or
silicon. Durmus et al. studied zinc phthalocyanines because of theirs long triplet
lifetimes. Photochemical and photophysical properties of peripheral and non-
peripheral tetra-substituted zinc phthalocyanines were investigated by them. In
addition, they reported the solvent effect on photochemical and photophysical
parameters of zinc phthalocyanines [68].
Camur et al. synthesized new peripherally and non-peripherally tetra-substituted
metal free and zinc phthalocyanines with functionalities of phenyloxyacetic acid.
They investigated photophysical and photochemical change with respect to metal-
non-metal samples, the position of the -COOH groups and peripheral or non-
peripherally molecules. According to their study peripherally and non- peripherally
substituted zinc phthalocyanines gave effective singlet oxygen quantum yields [69].
Kobayashi and co-workers investigated the effect of substituent groups on electronic
absorption and fluorescence spectra of metal free and zinc phthalocyanines in 35
phthalocyanine compounds. The position and bandwidths of phthalocyanines were
detected with change of the type, number, and positions of peripheral substituents
and central metal atom. They tackled 35 phthalocyanines with electron releasing
alkoxyl or alkylthio groups and electron recovering nitro or sulfonyl groups.
Consequently, they reported metal free and zinc phthalocyanines’ electronic
absorption and fluorescence emission spectra [5].

31
2.4.2 Measurement of Fluorescence
Fluorescence spectroscopy has similar instrumentations like to UV absorption
spectroscopy. One of the most essential differences between absorption and
fluorescence instruments depends on the source. In absorption unit, it is measures
that transmittance or absorbance of sample. Fluorescence unit is designed to measure
of intensity, spectrum, lifetime and polarization.
Figure 2.20 Schematic diagram of fluorescence spectroscopy [70].
Figure 2.20 demonstrates typically fluorescent spectroscopy. It has a xenon lamp that
is a source of exciting light. The instrument includes monochromators to picking out

32
excitation and emission wavelengths. Photomultipler tube (PMT) detects the
fluorescence and it is processes by a computer to quantify. Graphical representation
is obtained as an output [63].
Fluorescence spectrophotometers are recorded as both emission and excitation
spectra but the data is generally presented as emission spectra. Typical fluorescence
emission spectrum and absorption spectrum are shown in Figure 2.20 which is
plotted intensity versus wavelength (nm) or wavenumber (cm-1
).
An emission spectrum is related to the distribution of wavelength, while excitation
spectrum is related to the emission intensity. Both of them are measured at single
excitation wavelength. An excitation spectrum is a broad curve and it is dependent
on the chemical structure of the molecules where solvent effect is excluded.
Emission spectrum can be recorded differently on different instruments due to their
sensitivities of wavelength [71] .
.
Figure 2.21 Absorption and emission spectrum of perylene and quinine [63].

33
As seen in Figure 2.21 the absorption energy is higher than the emission energy,
because of the wavelength distribution. Actually, the molecule absorbs the total
energy and then it is released in the medium, such as photon emission. The
absorption spectrum forms in ground state while the fluorescence and
phosphorescence spectrum occur in excited state. The fluorescence spectrum
displays a maximum emission corresponding to the transition of emission. Emission
is a very fast process that lifetime is within the picosecond to nanosecond range. For
this reason, the fluorophore should be excited steadily to observe fluorescence
emission [63].

34

35
CHAPTER 3
EXPERIMENTAL
In this part, the materials and their properties used in the experiments were
explained. Besides that, the synthesis and characterization method of zinc
phthalocyanines and its derivatives as well as their deposition on mica-titania were
described in detail.
3.1 Materials
3- Nitrophthalic acid
Urea
Zinc chloride
Ammonium heptamolybdate
Sodium sulfide
Dimethyl formamide (DMF)
Chloroform
Ethyl acetate
Diethyl ether
Acetic acid
Trifluroacetic acid (TFA)
Detailed properties of the materials were given in Appendix-D.
36
3.2 Procedure
In this study, the experiments were carried out in four main steps: (i) synthesis of
tetranitro zinc phthalocyanine, (ii) synthesis of tetraamino zinc phthalocyanine, (iii)
deposition of these pigments onto mica-titania pigment, (iv) film application, there
synthesized pigments were mixed with water based styrene-acrylic resin. Detailed
descriptions of these experiments were given below. Figure 3.1 shows the steps of
the experiments. In every step, different characterization methods were applied
separately.
Figure 3.1 General routes of the experiments.
3.2.1 Synthesis of Tetranitro Zinc Phthalocyanine
3-nitrophthalic acid, urea, and ammonium molybdate were ground in an agate mortar
for nearly 10 minutes. Then zinc chloride was added on them and suppressed again
with mixture. The mixture was taken in a flask with 7 ml distilled water and the
reaction was carried out by microwave oven (600W). The reaction time was nearly 3
minutes. The following step was purification to get rid of unreacted materials and
impurities. Ethyl acetate, diethyl ether, methanol and water were used in the
Tetraamino Zinc

37
purification process. The rest of the filtrated pigment was dried in oven at 120°C.
Figure 3.2 shows the reaction for the synthesis of tetranitro zinc phthalocyanine.
Figure 3.2 Synthesis reaction of tetranitro zinc phthalocyanine.
3.2.2 Synthesis of Tetraamino Zinc Phthalocyanine
Tetranitro zinc phthalocyanine was mixed with 100 ml water, and then sodium
sulfide was added into this solution. The reaction was carried out at 65°C for 4 hours.
The next step was the removal of unreacted materials and impurities from the
product. HCl, NaOH and water were used in the purification step. The rest of the
filtrated pigment was dried in an oven at 120°C. Figure 3.3 shows the reaction for the
synthesis of tetraamino zinc phthalocyanine.
Figure 3.3 Synthesis reaction of tetraamino zinc phthalocyanine.

38
3.2.3 Preparation of Combination Pigments of Tetranitro and Tetraamino Zinc
Phthalocyanine with Mica-Titania
At the beginning of this step, the specific amount of tetranitro and tetraamino zinc
phthalocyanines was dissolved in the solvent. After then mica-titania was introduced
into the reactor. Three different solvents, DMF, water, and chloroform, were used to
observe their effects on the deposition of phthalocyanine pigments onto mica-titania.
The boiling temperatures of solvents were taken as the maximum reaction
temperature. The amount of pigment, the pH and the reaction time were taken as the
experimental parameters. Acetic acid and trifluroacetic acid were used to change the
pH of the medium. Experiment parameters and procedure were given briefly in Table
3.1, and Figure 3.4, respectively. Other tables show the parameters in detail.
Table 3.1 Parameters used in combination pigments experimentsa.
Experiment
Groups
Pigment – Solvent
Combination
Parameters
T (°C) pH t (h)
G-1 TAZnPc – DMF 120 8 1-3-6
G-2 TAZnPc – DMF – AA 120 4-5 3
G-3 TAZnPc – DMF – TFA 120 3-4-5 3
G-4 TAZnPc – Water 90 7 1-3-6
G-5 TNZnPc – DMF 120 8 3
G-6 TNZnPc – CHCl3 60 5 5
G-7 TNZnPc – CHCl3 – AA 60 3-4 5
G-8 TNZnPc – CHCl3 – TFA 60 1-2-3 5
a Amount of pigment in each experiment (g): 0.005 – 0.01 – 0.015 – 0.02 – 0.04 – 0.06

39
Figure 3.4 Experimental procedures for combination of TNZnPc and TAZnPc with
mica-titania.
Table 3.2 Parameters of combination of mica-titania with DMF – TAZnPc
experiment.
G-1 (DMF – TAZnPc)
amount of
organic
pigment, g
w% of g pigment/g
mica-titania pH
G-1_s1 0.005 0.03 8
G-1_s2 0.01 0.07 8
G-1_s3 0.015 0.10 8
G-1_s4 0.02 0.13 8
G-1_s5 0.04 0.27 8
G-1_s6 0.06 0.40 8
40
Table 3.3 Parameters of combination of mica-titania with DMF - AA– TAZnPc
experiment.
G-2
(DMF–TAZnPc–AA)
amount of
organic
pigment, g
w% of g pigment/g
mica titania pH
G-2_s1 0.005 0.03 4–5
G-2_s2 0.01 0.07 4–5
G-2_s3 0.015 0.10 4–5
G-2_s4 0.02 0.13 4–5
G-2_s5 0.04 0.27 4–5
G-2_s6 0.06 0.40 4–5
Table 3.4 Parameters of combination of mica-titania with DMF – TFA – TAZnPc
experiment.
G-3 (DMF–TAZnPc–TFA)
amount of
organic
pigment, g
w% of g pigment/g
mica titania pH
G-3_s1 0.005 0.03 3–4–5
G-3_s2 0.01 0.07 3–4–5
G-3_s3 0.015 0.10 3–4–5
G-3_s4 0.02 0.13 3–4–5
G-3_s5 0.04 0.27 3–4–5
G-3_s6 0.06 0.40 3–4–5

41
Table 3.5 Parameters of combination of mica-titania with Water – TAZnPc
experiment.
G-4 (Water – TAZnPc)
amount of
organic
pigment, g
w% of g pigment/g
mica titania pH
G-4_s1 0.005 0.03 7
G-4_s2 0.01 0.07 7
G-4_s3 0.015 0.10 7
G-4_s4 0.02 0.13 7
G-4_s5 0.04 0.27 7
G-4_s6 0.06 0.40 7
Table 3.6 Parameters of combination of mica-titania with DMF – TNZnPc
experiment.
G-5
(DMF– TNZnPc)
amount of
organic
pigment, g
w% of g pigment/g
mica titania pH
G-5_s1 0.005 0.03 8
G-5_s2 0.01 0.07 8
G-5_s3 0.015 0.10 8
G-5_s4 0.02 0.13 8
42
Table 3.7 Parameters of combination of mica-titania with CHCl3 – TNZnPc
experiment.
G-6 (CHCl3 – TNZnPc)
amount of
organic
pigment, g
w% of g pigment/g
mica titania pH
G-6_s1 0.005 0.03 5
G-6_s2 0.01 0.07 5
G-6_s3 0.015 0.10 5
G-6_s4 0.02 0.13 5
G-6_s5 0.04 0.27 5
G-6_s6 0.06 0.40 5
Table 3.8 Parameters of combination of mica-titania with CHCl3 – AA – TNZnPc
experiment.
G-7 (CHCl3 –TNZnPc – AA)
amount of
organic
pigment, g
w% of g pigment/g
mica titania pH
G-7_s1 0.005 0.03 3–4
G-7_s2 0.01 0.07 3–4
G-7_s3 0.015 0.10 3–4
G-7_s4 0.02 0.13 3–4
G-7_s5 0.04 0.27 3–4
G-7_s6 0.06 0.40 3–4

43
Table 3.9 Parameters of combination of mica-titania with CHCl3 – TFA – TNZnPc
experiment.
G-8 (CHCl3–TNZnPc– TFA)
amount of
organic
pigment, g
w% of g pigment/g
mica titania pH
G-8_s1 0.005 0.03 1–2–3
G-8_s2 0.01 0.07 1–2–3
G-8_s3 0.015 0.10 1–2–3
G-8_s4 0.02 0.13 1–2–3
G-8_s5 0.04 0.27 1–2–3
G-8_s6 0.06 0.40 1–2–3
3.2.4 Paint Preparation
The produced mica phthalocyanine pigments were mixed with water based styrene-
acrylic resin to investigate the fluorescence property of paint. In this procedure,
white sprit which is a solvent was first mixed with pigments to aid the separation of
pigment particles from each other. Then, the mixture was introduced into styrene-
acrylic resin (Betapol SA-5017B) supplied by BETEK Boya San. A.Ş. After well
mixing, films were applied on glass plates by a paint applicator. Films were dried at
room temperature and then measurements were carried out. In Table 3.10 the simple
formulation of the paint was given.
Table 3.10 Water based paint formulation [72].
Formulation % (w/w)
Water Based Styrene-Acrylic Resin (50 %w/w) 88.00
White Sprit 10.00
Mica-titania-Phthalocyanine Pigments 2.00

44
3.3 Characterization Methods
In this study, various characterization methods were used which are FTIR
spectroscopy, SEM, EDX, XPS, elemental analysis, UV-Vis, fluorescence
spectrophotometer, color spectroscopy. Details of these methods and instruments are
described below.
3.3.1 Fourier Transform Infrared (FTIR) Spectroscopy
Molecular structures and functional groups of the tetranitro and tetraamino zinc
phthalocyanines and their combinations with mica-titania were analyzed.
(Instrument: Thermo Scientific Nicolet 6700.)
3.3.2 Scanning Electron Microscopy (SEM)
Morphology of the pigments was characterized by using SEM which is located in
Metallurgical and Materials Engineering (METE) department in METU. It is JSM-
6400 Electron Microscope (JEOL), equipped with NORAN System 6 X-ray
Microanalysis System &Semafore Digitizer.
3.3.3 Energy Dispersive X-Ray Spectroscopy (EDS)
Chemical characterization of the pigments was done with using EDX which is an
analytical technique. The device is equipped with SEM spectroscopy system.

45
3.3.4 UV-Visible Spectrophotometer
To observe the UV absorbance properties of tetranitro and tetraamino zinc
phthalocyanines, UV-Visible spectroscopy was utilized. It is Cary 5000 model
device located in Chemical Engineering department in METU.
3.3.5 Fluorescence Spectrophotometer
Fluorescence properties of tetranitro and tetraamino zinc phthalocyanines, and their
combinations with mica-titania pigments were measured by using a fluorescent
spectrophotometer (Model: Cary Eclipse Varian) located in UNAM (Ulusal
Nanoteknoloji Araştırma Merkezi).
3.3.6 CHNS/O Elemental Analysis
Elemental analysis was investigated to determine nitrogen content of the
combination pigments. This equipment is located in UNAM, and it is Thermo
scientific Flash 2000.
3.3.7 X-Ray Photoelectron Spectroscopy (XPS)
XPS is a quantitative spectroscopic technique used to identify elemental
composition. The equipment is located in UNAM, and it is Thermo K-Alpha -
Monochromated high-performance XPS spectrometer.

46
3.3.8 Color Spectrophotometer
Paint properties and colors of the pigments were investigated by using X-Rite 65
color spectrophotometer.

47
CHAPTER 4
RESULTS AND DISCUSSION
4.1 Preliminary Studies
In the first experiment tetranitro zinc phthalocyanine was synthesized using 3-nitro
phthalic acid, urea, and zinc chloride. The reaction yield is nearly 89.1 %. The FT-IR
spectrum of tetranitro zinc phthalocyanine (TNZnPc) given in Figure 4.1 has two
peaks at 3200 and 3090 cm-1
because of the aromatic C-H stretching of the zinc
phthalocyanine. The peak at 1740 cm-1
corresponds to anhydride, C=O bonds,
whereas the one at 1640 cm-1
shows C=C macrocycle ring deformation. The peak at
1600 cm-1
, is due to bending of the N-H groups, and the characteristic peaks of nitro
groups are seen at 1540 and 1360 cm-1
. The peaks at 1300 cm-1
is because of C-C
stretching in isoindole, at 1160, 1120, 1050 cm-1
those correspond to the C-H
bending in plane deformation, C-N stretching in isoindole, and C-N in plane bending,
respectively. The peaks at 930, 830, 720, 575 cm-1
are formed by virtue of C-H
bending out of plane deformation.

48
Figure 4.1 FT-IR spectrum of TNZnPc.
The FT-IR spectrum of TAZnPc is given in the Figure 4.2. The peak that belongs to
the N-H, stretching is seen at 3300 cm-1
. The characteristic nitro peaks in TNZnPc
complexes disappear after the reduction which is converted to amino groups in
TAZnPc. The peaks at 1620, 1340 cm-1
correspond to the stretching vibrations of C-
C and C-N of the TAZnPc plane, respectively. The stretch vibrations of C=N and N-
H of amino groups are found at 1620 cm-1
and 3300 cm-1
, respectively. As a result of
repeated experiments, the reproducible findings are obtained.
5001000150020002500300035004000
Tran
smit
tan
ce (
%)
Wavenumber (cm-1)
3200 3090
1540
1640 13601740
1160
930
720
575
1470
1300
1050
830

49
Figure 4.2 FT-IR spectrum of TAZnPc.
The UV-visible spectrum of TNZnPc and TAZnPc pigments are given in Figure 4.3
and Figure 4.4, respectively. Both of the pigments show absorption at three different
points. The characteristic absorption of the phthalocyanine molecules in the B band
region (UV region) is seen at around 300-400 nm and the Q band region (visible)
appears at around 600-800 nm. TNZnPc complexes are deep green color than
TAZnPc complexes and their absorption in the B band region occurred at 340 nm
and at 349 nm, respectively. Furthermore, TNZnPc and TAZnPc show absorption in
the Q band region at 670 nm and, 765 nm, respectively.

50
Figure 4.3 UV-Vis spectrum of TNZnPc.
The appearance of the second band in the high energy region of the Q band is due to
the aggregation in DMF solution. Besides that the small band formed at 605 nm for
TNZnPc and at 680 nm for TAZnPc pigments. Aggregation in phthalocyanine
molecules occurs via intermolecular π-π interactions. On the other hand, amino
groups interact with DMF to form hydrogen bonding, which provides the high
energy in the Q band region.
300 400 500 600 700 800
Ab
sorb
ance
Wavelength (nm)
670
605
340

51
Figure 4.4 UV-Vis spectrum of TAZnPc.
Figure 4.5 and Figure 4.6 show the fluorescence spectrum of the TNZnPc pigment
and TAZnPc pigment, respectively. Pigments dispersed in DMF have no
fluorescence property according to Kahya’s study at different concentrations.
TNZnPc pigment is excited at 385 nm and its emission peak is at 475 nm and 685
nm. High energy region has higher intensity than small energy region. TAZnPc
pigment was excited at 375 nm and its emission peak is at 465 nm and it has small
peak at 800 nm.
300 400 500 600 700 800
Ab
sorb
ance
Wavelength (nm)
349
680
765

52
Figure 4.5 Fluorescence spectra of TNZnPc.
Figure 4.6 Fluorescence spectra of TAZnPc.
0
100
200
300
400
500
600
400 500 600 700 800
Inte
nsi
ty
Wavelength (nm)
0.1000 mg/ml
0.0500 mg/ml
0.0330 mg/ml
0.0250 mg/ml
0.0125 mg/ml
0
100
200
300
400
500
600
400 500 600 700 800
Inte
nsi
ty
Wavelength (nm)
0.1000 mg/ml
0.0500 mg/ml
0.0330 mg/ml
0.0250 mg/ml
0.0125 mg/ml

53
According to Figure 4.7 the fluorescent intensities of TNZnPc and TAZnPc show
similar tendency. Although, their emission peaks are different from each other.
Figure 4.7 Fluorescence emissions comparing of TAZnPc and TNZnPc.
4.2 Combination pigments
Combination pigments were obtained by using TNZnPc and TAZnPc pigments.
Nitro combination pigments have green color and amino combination pigments have
gray color. Both of them show same behavior on increasing the amount of
depositions, and they get darker in color. Their colors became lighter when the
solvent acidity was increased. This may be related to the protonation of the pigments.
Figure 4.8 gives the photo TNZnPcMip and TAZnPcMip pigment samples.
0
100
200
300
400
500
0 0.02 0.04 0.06 0.08 0.1 0.12
Inte
nsi
ty
Pigment, mg/ml
TAZnPc_Maximum Intensity @ 465 nm
TNZnPc_Maximum Intensity @ 475 nm

54
Figure 4.8 Pictures of combination pigments, (a) mica-titania, (b) TAZnPcMip, and
(c) TNZnPcMip.
In the initial experiment, different temperatures and reaction times were studied for
each solvent. As a result, optimum conditions were decided for the next study. After
determining the optimum temperature and reaction time, the effect of the amount of
phthalocyanine pigments were investigated. In addition, the pH values of the samples
were changed in solvents by using trifluoro acetic acid, and acetic acid.
Firstly, the combination pigment experiments were conducted by using DMF with
TAZnPc, TNZnPc and water with TAZnPc pigments in the range between 0.01g and
0.08g. However these experiments were not successful as deduced from the FT-IR
results. Then after, CHCl3 was used which is more acidic solvent. The protonation of
the pigments started to decompose TAZnPc in DMF. For the protonated pigments,
a b
c

55
acetic acid and trifluoro acetic acid were used. Experiments of the protonation were
made in DMF and CHCl3.
Time and temperature studies were conducted in the experiments. The temperature
and time were set as 120° C and 3 hours for DMF solvents; 50° C and 5 hours for
CHCl3, and 90° C and 3 hours for water, respectively.
4.2.1 FT-IR Results of Combination Pigments
The FT-IR results of some combination pigments produced were analyzed in this
part. Figure 4.9 shows the FT-IR spectra of TNZnPcMip pigment (at 50°C, pH=5
and 0.001 TNZnPc), TNZnPc pigment and mica-titania pigment. According to the
graph, the characteristic peaks for TNZnPc were seen in the range 1500-1300
cm-1
(red circle).
Figure 4.9 FT-IR spectra of TNZnPcMip 0.01 g TNZnPc in CHCl3, pH=5; (a)
mica-titania, (b) TNZnPc, and (c) TNZnPcMip.
5001000150020002500300035004000
Tran
smit
tan
ce (
%)
Wavenumber (cm-1)
(a)
(b)
(c)

56
In order to see these peaks clearly, the FT-IR spectrum in the range 500 cm-1
and
1700 cm-1
was replotted in Figure 4.10.
Figure 4.10 FT-IR spectra of TNZnPcMip 0.01 g TNZnPc in CHCl3, pH=5 at
1700-500 cm-1
; (a) mica-titania, (b) TNZnPc, and (c) TNZnPcMip.
The protonation of TNZnPc couldn’t be achieved when acetic acid was used but it
was accomplished with trifluoro acetic acid. However, the color of TFA protonated
TNZnPc pigment was lighter than unprotonated TNZnPc in CHCl3. Figure 4.11
presents the FT-IR spectrum of pigments treated with DMF - TFA mixture. It can be
seen easily that the intensity of FT-IR peak decreased. The reason for decrease in the
intensity may be that trifluoro acetic acid is very strong acid and the pH of the
reaction is very low.
5007009001100130015001700
Tran
smit
tan
ce (
%)
Wavenumber (cm-1)
(a)
(b)
(c)

57
Figure 4.11 FT-IR spectra of TNZnPcMip 0.01 g TNZnPc in CHCl3+ TFA, pH=2;
(a) mica-titania, (b) TNZnPc, and (c) TNZnPcMip.
Figure 4.12 shows that the FT-IR spectra of TAZnPc in DMF with acetic acid.
TAZnPc characteristic peaks can be seen around at 1600-1400 cm-1
.
5001000150020002500300035004000
Tran
smit
tan
ce (
%)
Wavenumber (cm-1)
(c)
(b)
(a)

58
Figure 4.12 FT-IR spectra of TAZnPcMip 0.01 g TAZnPc in DMF+AA, pH=4; (a)
mica-titania, (b) TAZnPc, and (c) TAZnPcMip.
In order to see these peaks clearly, the FT-IR spectrum in the range between 500
cm-1
and 1700 cm-1
was replotted in Figure 4.13.
5001000150020002500300035004000
Tran
smit
tan
ce (
%)
Wavenumber (cm-1)
(a)
(b)
(c)

59
Figure 4.13 FT-IR spectra of TAZnPcMip 0.01 g TAZnPc in DMF+AA, pH=4 at
1700-500 cm-1
; (a) mica-titania, (b) TAZnPc and (c) TAZnPcMip.
It can be said from the visual observation of the pigments that mica-titania substrate
was successfully coated with phthalocyanine based pigments. The FTIR spectrum
also supports it. However, the identifying peaks came out to be very small as small
amounts of phthalocyanine based pigments were deposited on the substrate. The
elemental analysis based on nitrogen identification can prove the deposition of
phthalocyanine based pigments on the substrate.
5007009001100130015001700
Tran
smit
tan
ce (
%)
Wavenumber (cm-1)
(a)
(b)
(c)

60
Figure 4.14 FT-IR spectra of TAZnPcMip 0.01 g TAZnPc in DMF+TFA, pH=3;
(a) mica-titania, (b) TAZnPc, and (c) TAZnPcMip.
4.2.2 SEM and EDS
In order to display pigments on mica-titania pigment, SEM micrographs were
investigated. Figure 4.15 shows the mica-titania pigment samples at different
magnifications. Mica has plate structure and TiO2 crystals could be seen on the
surface.
5001000150020002500300035004000
Tran
smit
tan
ce (
%)
Wavenumber (cm-1)
(c)
(b)
(a)

61
Figure 4.15 SEM micrographs of mica-titania pigment; (a) high magnification
(×5000), (b) low magnification (×2000).
Figure 4.16 and Figure 4.17 shows SEM micrographs of the TAZnPcMip pigments
and TNZnPcMip pigments, respectively.
Figure 4.16 SEM micrographs of TAZnPcMip synthesized at 120°C in DMF+AA;
(a) low magnification (×4000), (b) high magnification (×10000).
a b
a b

62
It is seen from these SEM micrographs that TNZnPc and TAZnPc pigments
randomly deposited on mica-titania. Fine agglomerates of phthalocyanine pigments
are seen in small quantities on the surface of substrate.
Figure 4.17 SEM micrographs of TNZnPcMip synthesized at 50°C in CHCl3; (a)
low magnification (×12000), (b) high magnification (×30000).
The distribution of elemental content can be analyzed from EDX data. When the
signal was sent onto mica-titania plate where seems to be no deposition, little amount
of Zn elements was detected. However, when the signal was directed to the bright
and large particles, the amount of Zn showed a sharp increase. (See Figure 4.18 and
4.19)
a b

63
Figure 4.18 EDX results of on mica-titania TNZnPcMip sample synthesized at
50°C in CHCl3.

64
Figure 4.19 EDX results of on zinc pigment TNZnPcMip sample synthesized at
50°C in CHCl3.
According to these results, TNZnPc and TAZnPc pigments deposited on mica-titania
pigment with randomly and thin film form.

65
Figure 4.20 SEM micrographs of TNZnPcMip synthesized at 50°C in CHCl3 +TFA
(Magnification: ×18 000).
Under very high magnification (Figure 4.20) the surface seemed to be eroded, and it
may be due to use of trifluoro acetic acid.
4.2.3 Elemental Analysis
Elemental analysis was carried out to verify that TNZnPc and TAZnPc pigments
have deposited on mica-titania surface. The effect of the amount of phthalocyanine
pigments on the combination pigments under different solvents was investigated by
elemental analysis based on nitrogen, because, nitrogen is not expected to exist in
any other chemical except phthalocyanine pigments. The amount of deposited
phthalocyanine pigments on mica-titania surfaces were calculated by using mass
percent of nitrogen. Table 4.1 shows the results of deposition of TAZnPc pigments
on the substrate using, (i) DMF plus acetic acid, and (ii) DMF plus trifluoro acetic
acid. An example calculation of the weight percent of TAZnPc was given in
Appendix-B.

66
Table 4.1 Mass percent of N and TAZnPc on mica-titania.
Sample Solvent Amount of
TAZnPc (g) N % (wt.)
TAZnPc%
(wt.)
Mica-titania - 0 0 0
TAZnPcMip 1
(G-2_s2)* DMF+AA 0.01 0.24 0.91
TAZnPcMip 2
(G-3_s2) DMF+TFA 0.01 0.19 0.72
TAZnPcMip 3
(G-2_s4) DMF+AA 0.02 0.46 1.74
TAZnPcMip 4
(G-3_s4) DMF+TFA 0.02 0.23 0.87
TAZnPcMip 5
(G-2_s5) DMF+AA 0.04 0.49 1.86
TAZnPcMip 6
(G-3_s5) DMF+TFA 0.04 0.46 1.74
TAZnPcMip 7
(G-2_s6) DMF+AA 0.06 0.51 1.93
TAZnPcMip 8
(G-3_s6) DMF+TFA 0.06 0.61 2.31
* See Table – 3.1, 3.3, 3.4.
DMF: Dimethyl formamide, AA: Acetic acid, TFA: Trifluoro acetic acid.
According to the results, the deposition increases when the amount of TAZnPc
pigment increases in the medium. ‘DMF plus TFA’ solvent mixture is less efficient
than ‘DMF plus acetic acid’ mixture. The latter is better only at the last data point.
However, both of them have close results. Figure 4.21 shows the proportional change
of the experiments.

67
(a)
(b)
Figure 4.21 Relation between mass percent of N and TAZnPc for; (a) DMF+AA
samples, (b) DMF+TFA samples.
0.0
0.1
0.2
0.3
0.4
0.5
0.6
0.00 0.02 0.04 0.06 0.08
N%
TAZnPc (g)
0.0
0.1
0.2
0.3
0.4
0.5
0.6
0.00 0.02 0.04 0.06 0.08
N%
TAZnPc (g)

68
Table 4.2 indicates the results of deposition of TNZnPc pigments in the presence of
‘CHCl3 plus acetic acid’ and ‘CHCl3 plus trifluoro acetic acid’. An example
calculation of the weight percent of TNZnPc was given in Appendix-B.
Table 4.2 Mass percent of N and TNZnPc on mica-titania.
Sample Solvent Amount of
TNZnPc (g) N % (wt.)
TNZnPc%
(wt.)
Mica-titania - 0.00 0.00 0.00
TNZnPcMip 1
(G-6_s2)* CHCl3 0.01 0.88 3.98
TNZnPcMip 2
(G-7_s2) CHCl3+AA 0.01 0.62 2.83
TNZnPcMip 3
(G-8_s2) CHCl3+TFA 0.01 0.46 2.10
TNZnPcMip 4
(G-6_s4) CHCl3 0.02 1.52 6.95
TNZnPcMip 5
(G-7_s4) CHCl3+AA 0.02 0.57 2.60
TNZnPcMip 6
(G-8_s4) CHCl3+TFA 0.02 0.41 1.87
TNZnPcMip 7
(G-6_s5) CHCl3 0.04 3.26 14.71
TNZnPcMip 8
(G-7_s5) CHCl3+AA 0.04 1.21 5.44
TNZnPcMip 9
(G-8_s5) CHCl3+TFA 0.04 1.41 6.35
TNZnPcMip 10
(G-6_s6) CHCl3 0.06 4.41 19.88
TNZnPcMip 11
(G-7_s6) CHCl3+AA 0.06 1.16 5.25
TNZnPcMip 12
(G-8_s6) CHCl3+TFA 0.06 2.58 11.65
* See Table – 3.7, 3.8, 3.9.
CHCl3: Chloroform, AA: Acetic acid, TFA: Trifluoro acetic acid.
As expected, when the amount of phthalocyanine increases in the reaction,
deposition on mica-titania surfaces also increases. The best result is obtained in

69
CHCl3 experiments with unprotonated pigments. It is understood that, lower pH
value are not suitable for this experiment.
(a)
(b)
0
1
2
3
4
5
6
0.00 0.02 0.04 0.06 0.08
N%
TNZnPc (g)
0
1
2
0.00 0.02 0.04 0.06 0.08
N%
TNZnPc (g)

70
(c)
Figure 4.22 Relation between mass percent of N and TNZnPc for; (a) CHCl3, (b)
CHCl3+AA, (c) CHCl3+ TFA.
4.2.4 XPS
XPS measures elemental composition of the samples. Table 4.3 and Table 4.4 show
weight percent of nitrogen and zinc, respectively.
0
1
2
3
0.00 0.02 0.04 0.06 0.08
N%
TNZnPc (g)
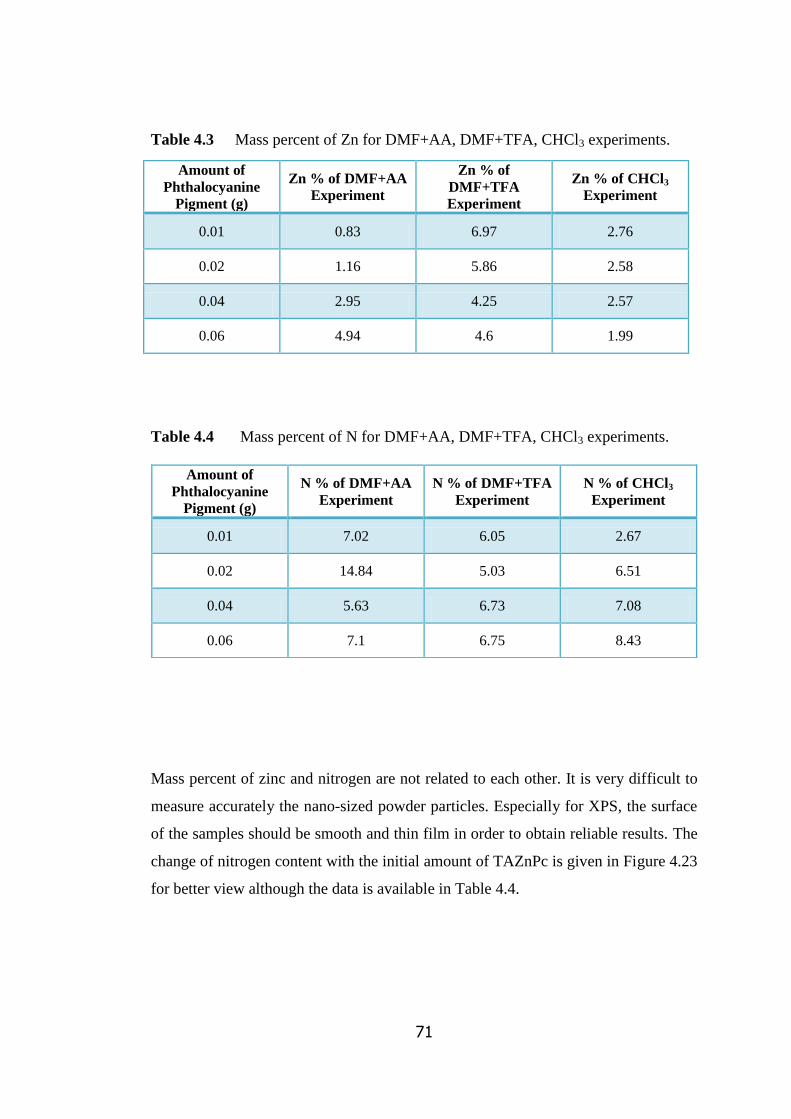
71
Table 4.3 Mass percent of Zn for DMF+AA, DMF+TFA, CHCl3 experiments.
Table 4.4 Mass percent of N for DMF+AA, DMF+TFA, CHCl3 experiments.
Mass percent of zinc and nitrogen are not related to each other. It is very difficult to
measure accurately the nano-sized powder particles. Especially for XPS, the surface
of the samples should be smooth and thin film in order to obtain reliable results. The
change of nitrogen content with the initial amount of TAZnPc is given in Figure 4.23
for better view although the data is available in Table 4.4.
Amount of
Phthalocyanine
Pigment (g)
Zn % of DMF+AA
Experiment
Zn % of
DMF+TFA
Experiment
Zn % of CHCl3
Experiment
0.01 0.83 6.97 2.76
0.02 1.16 5.86 2.58
0.04 2.95 4.25 2.57
0.06 4.94 4.6 1.99
Amount of
Phthalocyanine
Pigment (g)
N % of DMF+AA
Experiment
N % of DMF+TFA
Experiment
N % of CHCl3
Experiment
0.01 7.02 6.05 2.67
0.02 14.84 5.03 6.51
0.04 5.63 6.73 7.08
0.06 7.1 6.75 8.43

72
Figure 4.23 Relation between mass percent of N in DMF+AA, DMF+TFA, and
CHCl3 experiments.
4.2.5 Fluorescence
As mentioned in Section 4.1, TNZnPc and TAZnPc pigments have fluorescent
property which can be affected by different solvents or substituents. In these
experiments, TNZnPc and TNZnPc pigments have combined with mica-titania
pigments to observe mica-titania’s fluorescence property. Both positive and negative
contributions were observed.
In the first, fluorescence of mica-titania was measured in DMF. Mica-titania is
insoluble in this solution, so emission was measured after mixing for one minute.
The samples were prepared in the concentrations of 0.1, 0.05, 0.033, 0.025, 0.0125
mg/ml (mica-titania in mg/ DMF in ml). After that, the solution of combination
pigments was prepared. The amount of deposited pigments on the mica-titania was
calculated depending on the elemental analysis results. According to the elemental
analysis, the best result of deposition was obtained with TNZnPcMip in chloroform.
0
2
4
6
8
10
12
14
16
0 0.01 0.02 0.03 0.04 0.05 0.06 0.07
N %
pigment , g
N%, DMF+AA+ TAZnPc
N%, DMF+TFA+ TAZnPc
N%, CH+ TNZnPc

73
Thus, the fluorescent analysis of the combination pigment was done only for
TNZnPc in chloroform. Figure 4.24 shows the fluorescence spectrum of TNZnPcMip
in chloroform. The samples were excited at 385 nm. As expected, TNZnPcMip
samples have two emissions which are at 475 nm and 688 nm. After mixing for one
minute, the samples were measured before they precipitate.
Figure 4.24 Fluorescence spectra of TNZnPcMip in chloroform samples at different
ratios.
As seen in the Figure 4.24, emission peaks have shifted to the right as the amount of
TNZnPcMip is increased. In other words there is frequency shift (i.e. so called red-
shift) to lower frequencies. The increase of TNZnPcMip on the substrate decreases
the photon energies more effectively.
Figure 4.25 represents to fluorescence effect of TNZnPcMip, TNZnPc, and mica-
titania pigments. Fluorescence property of mica-titania is very low and fluorescence
of combination pigment is between that of TNZnPc and mica-titania pigment.
0
100
200
300
400 500 600 700
Inte
nsi
ty
Wavelenght (nm)
0.1000 mg/ml
0.0500 mg/ml
0.0330 mg/ml
0.0250 mg/ml
0.0125 mg/ml

74
Figure 4.25 Comparison of fluorescence effect of TNZnPcMip, TNZnPc, and
mica-titania.
In order to better interpret the consequences, experimental results were compared
with the expected fluorescence according to Rule of Mixtures (ROM) results.
Expected fluorescence according to Rule of Mixtures results were calculated as
shown below:
Expected Fluorescence expected fluorescence according to ROM =
[(Fluorescence of TNZnPc) × (mass % of TNZnPc)] + [(Fluorescence of
mica-titania) × (mass % of mica-titania)]
Detailed calculations and results were given in Appendix-C. According to these
calculations, the experimental fluorescence of deposition pigments has increased
synergistically when compared with the expected fluorescence according to Rule of
Mixtures. This situation indicates that the experiments have positive results, as
expected.
R² = 0.9901
R² = 0.9697
R² = 0.67730
100
200
300
400
500
0 0.02 0.04 0.06 0.08 0.1 0.12
Inte
nsi
ty
pigments, mmol
TNZnPcMip
calibration curve of TNZnPc
mica-titania

75
Figure 4.26 Comparison of experimental and expected fluorescence according to
Rule of Mixtures (ROM) value with respect to mass percent of TNZnPc
pigment.
Fluorescence increment was calculated as shown below:
Detailed calculations were given in Appendix-C. Accordingly, the fluorescence of
combination pigment increase about 50 % on the average compared to mica-titania
pigment.
0
100
200
300
400
500
0
100
200
300
400
500
0 20 40 60 80 100
Flu
ore
sce
nce
at 4
75
nm
TNZnPc, wt. %
expected
experimental
Fluorecense of 100% TNZnPc
Fluorescence of 100 % mica-titania

76
Figure 4.27 Percent increment of fluorescence.
4.2.6 Optical Properties of Paints Manufactured with Combination Pigments
Optical properties of combination pigments were investigated via styrene-acrylic
based paint formulations. Initially, standard paint was prepared and measured,
containing only mica-titania pigment. Then, other combination pigment samples
were measured and compared with the reference.
Color properties of the paints were characterized according to L*a*b values of the
samples. The L* term refers to the lightness of the paint while a* is for redness and
b* is for the yellowness. Positive a* values refer that the sample is less red than the
paint. Negative a* values indicate the greenish samples. As for positive b* values
means refer that the sample is less yellow than the paint and negative b* values
indicates the bluish samples. dL*, da*, and db* specify that the difference between
0
10
20
30
40
50
60
70
80
0 20 40 60 80 100
% In
cre
me
nt
of
flu
ore
sce
nce
TNZnPc, wt %
percent increment

77
the sample and the standard. dE* so-called Euclidian distance represents the
difference in the total color. It is given by the following formula.
1/22 2 2E* ( L*) ( a*) ( b*)
Table 4.5 and Table 4.6 list the values of the paints of the combination pigments.
Table 4.5 The L*a*b* values of the paints of TNZnPcMip.
Name of sample dL* da* db* dE*
Mica-titania (standard) 0.00 0.00 0.00 0.00
G-6_s2
(0.01g TNZnPc in CH3Cl) -0.57 0.01 0.35 0.07
G-6_s4
(0.02g TNZnPc in CH3Cl) -1.36 -0.11 -0.18 0.61
G-6_s5
(0.04g TNZnPc in CH3Cl) -0.6 -0.04 0.1 0.57
G-7_s4
(0.02g TNZnPc in
CH3Cl+TFA)
0.04 -0.18 0.32 0.89
G-7_s5
(0.04g TNZnPc in
CH3Cl+TFA)
0.58 -0.22 0.68 0.02

78
Table 4.6 The L*a*b* values of the paints of TAZnPcMip.
Name of sample dL* da* db* dE*
Mica-titania (standard) 0.00 0.00 0.00 0.00
G-2_s2
(0.01g TAZnPc in
DMF+AA)
-0.58 -0.19 0.22 0.44
G-2_s4
(0.02g TAZnPc in
DMF+AA)
0.51 -0.04 0.46 0.58
G-2_s5
(0.04g TAZnPc in
DMF+AA)
0.97 0.1 0.63 0.84
G-3_s2
(0.01g TAZnPc in
DMF+TFA)
1.03 -0.12 0.42 0.9
G-3_s4
(0.02g TAZnPc in
DMF+TFA)
-0.33 0.05 0.34 0.42
G-3_s5
(0.04g TAZnPc in
DMF+TFA)
0.58 0.19 0.63 0.83
Figure 4.28 shows the comparative color properties of the combination pigments
based on different TAZnPcMip and TNZnPcMip samples.

79
Figure 4.28 The comparative color properties of combination pigments based on
different phthalocyanine deposition.
According to Figure 4.28, samples have mostly been in green and yellow area. The
blue line samples represent G-3 pigments which shifts to yellow area while the red
line samples represent G-2 pigments which also shifts to green-yellow area. The
green line samples represent G-6 pigments which are in blue , green , and yellow
region , while the black line samples represents G-7 pigments which are in blue
region.
-0.8
-0.4
0
0.4
0.8
-0.8 -0.4 0 0.4 0.8
CH+ TNZnPc
DMF+ AA+TAZnPc
DMF+TFA+ TAZnPc
CH+TFA+TNZnPc
G-2_s2
G-2_s4
G-2_s5
G-6_s4
G-6_s5G-3_s2
G-3_s4
G-7_s4
red
yellow
blue
green G-6_s2
G-7_s5

80

81
CHAPTER 5
CONCLUSIONS
1. Tetranitro zinc phthalocyanines were synthesized by using nitrophthalic acid
precursors under microwave radiation. Tetraamino zinc phthalocyanines were
produced by reducing tetranitro groups of the phthalocyanines using sodium
sulfide in water.
2. While tetranitro zinc phthalocyanines were deposited onto mica-titania
pigment in chloroform solvent, tetraamino zinc phthalocyanines were
deposed onto mica-titania pigment in DMF.
3. Combination of tetranitro group pigment with mica-titania was achieved by
using trifluoro acetic acid by decreasing the pH. The best condition for the
experiment is the state of pH 5.
4. Combination of tetraamino group pigment with mica-titania was obtained by
using acetic acid and trifluoro acetic acid which decrease the pH. The
optimum value for the pH is 4.
5. Different amounts of the pigments were deposited onto mica-titania pigment
at different durations of reaction. With increasing initial amount of pigment,
the amount deposited also increases.
6. Tetranitro and tetraamino zinc phthalocyanine pigments were found to be in
amorphous form on the mica-titania substrate.

82
7. Tetra substituted zinc phthalocyanine pigments have fluorescent property,
and render pearlescent appearance when combined with mica-titania.
8. The fluorescent properties of mica-titania are improved by combining with
tetranitro zinc phthalocyanine pigment.

83
CHAPTER 6
RECOMMENDATIONS
1. Fluorescent measurements may have done in diverse ways such as changing
the morphology of the samples.
2. Different solvents could be used in deposition experiments, and their effects
on pH need can be examined.
3. TAZnPc pigments are soluble in water and a small color change was
observed. These experiments can be tried at different conditions such as
pressure, pH, and temperature.

84

85
REFERENCES
1. Pfaff, G., Special effect pigments: technical basics and applications. 2008:
Vincentz Network GmbH & C.
2. Tenório Cavalcante, P.M., Ceramic application of mica titania pearlescent
pigments. Dyes and Pigments, 2007. 74(1): p. 1-8.
3. Smith, H.M., High Performance Pigments. 2009: Wiley.
4. Ongarora, B.G., Syntheses and Characterization of Water-Soluble
Phthalocyanines for Diagnosis and Treatment of Cancer. 2012, Louisiana
State University.
5. Kobayashi, N., Ogata, H., Nonaka, N., Luk’yanets, E.A., Effect of peripheral
substitution on the electronic absorption and fluorescence spectra of metal-
free and zinc phthalocyanines. Chemistry, 2003. 9(20): p. 5123-34.
6. Christie, R.M. and R.S.o. Chemistry, Colour Chemistry. 2001: Royal Society
of Chemistry.
7. Brehmer, L., Molecular semiconductors. Photoelectrical properties and solar
cells. Acta Polymerica, 1986. 37(2): p. 129-129.
8. Zollinger, H., Color Chemistry: Syntheses, Properties, and Applications of
Organic Dyes and Pigments. 2003: Wiley.
9. Charvat, R.A., Coloring of Plastics: Fundamentals. 2005: Wiley.
10. Bamfield, P. and M.G. Hutchings, Chromic Phenomena: Technological
Applications of Colour Chemistry. 2010: Royal Society of Chemistry.

86
11. Maile, F.J., G. Pfaff, and P. Reynders, Effect pigments—past, present and
future. Progress in Organic Coatings, 2005. 54(3): p. 150-163.
12. Topuz, B.B., Gündüz, G., Maviş, B., Çolak, Ü., Synthesis and
characterization of copper phthalocyanine and tetracarboxamide copper
phthalocyanine deposited mica-titania pigments. Dyes and Pigments, 2013.
96(1): p. 31-37.
13. Kadish, K.M., K.M. Smith, and R. Guilard, The Porphyrin Handbook:
Inorganic, organometallic and coordination chemistry. Vol. 3. 2000:
Academic Press.
14. Rapulenyane, N., Antunes, E., Masilela, N., Nyokong, T., Synthesis and
photophysicochemical properties of novel zinc phthalocyanines mono
substituted with carboxyl containing functional groups. Journal of
Photochemistry and Photobiology A: Chemistry, 2012. 250: p. 18-24.
15. Saka, E.T., Göl, C., Durmuş, M., Kantekin, H., Bıyıklıoğlu, Z.,
Photophysical, photochemical and aggregation behavior of novel
peripherally tetra-substituted phthalocyanine derivatives. Journal of
Photochemistry and Photobiology A: Chemistry, 2012. 241: p. 67-78.
16. Vivo, P., Ojala, M., Chukharev, Efimov, A., Lemmetyinen, H., Role of a
phthalocyanine–fullerene dyad in multilayered organic solar cells. Journal of
Photochemistry and Photobiology A: Chemistry, 2009. 203(2–3): p. 125-130.
17. Samuely, T., STM Study of Self-assembled Phthalocyanine Derivatives and
Their Hosting Properties. 2008: Cuvillier.
18. Kobayashi, N., Phthalocyanines. Current Opinion in Solid State and
Materials Science, 1999. 4(4): p. 345-353.

87
19. Kadish, K.M., K.M. Smith, and R. Guilard, The Porphyrin Handbook:
Phthalocyanines : synthesis. Vol. 15. 2003: Academic Press.
20. Kim, S.H., Functional Dyes. 2006: Elsevier Science.
21. Fasiulla, K.R.., Venugopala, R., Keshavayya, J., Khan, M. H., Rao, A. V.,
Synthesis, Structural Investigations and Antifungal Studies on Symmetrically
Substituted Metal (II) Octa-1- (3-chlorophenyl) Methanimine
Phthalocyanine. Chem Sci Trans, 2013(2(3)): p. 761-770.
22. Herbst, W. and K. Hunger, Industrial Organic Pigments. 2006: Wiley.
23. Hohnholz, D., S. Steinbrecher, and M. Hanack, Applications of
phthalocyanines in organic light emitting devices. Journal of Molecular
Structure, 2000. 521(1–3): p. 231-237.
24. Jiang, J. and Ö. Bekaroğlu, Functional Phthalocyanine Molecular Materials.
2010: Springer.
25. McKeown, N.B., Phthalocyanine-Containing Dendrimers. Advanced
Materials, 1999. 11(1): p. 67-69.
26. McKeown, N.B., Budd, P.M., Msayib, K.J., Ghanem, B.S., Kingston, H.J.,
Tattershall, C.E., Makhseed, S., Reynolds, K.J., Fritsch, D., Polymers of
Intrinsic Microporosity (PIMs): Bridging the Void between Microporous and
Polymeric Materials. Chemistry – A European Journal, 2005. 11(9): p. 2610-
2620.
27. Moustafa, T.E.Y., Synthesis and Characterization of Some New
Phthalocyanines for Potential Industrial Applications, 2004,
Universitätsbibliothek Tübingen: Tübingen.

88
28. Neugebauer, H., Loi, M.A., Winder, C., Saricifci, N.S., Cerullo, G.,
Gouloumis, A., Vazquez, P., Torrez, T., Photophysics and photovoltaic
device properties of phthalocyanine–fullerene dyad:conjugated polymer
mixtures. Solar Energy Materials and Solar Cells, 2004. 83(2–3): p. 201-209.
29. Schneider, H.J. and A.K. Yatsimirsky, Principles and methods in
supramolecular chemistry. 2000: J. Wiley.
30. Sessler, J.L. and S.J. Weghorn, Expanded, Contracted & Isomeric
Porphyrins. 1997: Elsevier Science.
31. Yenilmez, H.Y., A.M. Sevim, and Z.A. Bayır, Synthesis and photophysics of
new metallo phthalocyanine complexes with thiazole groups and their
fluorescence quenching studies with benzoquinone. Synthetic Metals, 2013.
176: p. 11-17.
32. Safari, N., Jamaat, P.R., Pirouzmand, M., Shaabani, A., Synthesis of
metallophthalocyanines using microwave irradiation under solvent free and
reflux conditions. Journal of Porphyrins and Phthalocyanines, 2004. 08(10):
p. 1209-1213.
33. de la Torre, G., Christian G. Claessens, and T. Torres, Phthalocyanines: The
Need for Selective Synthetic Approaches. European Journal of Organic
Chemistry, 2000. 2000(16): p. 2821-2830.
34. Yukruk, F., Doğan, A.L, Canpınar, H., Güç, D., Akkaya, E.U., Water-soluble
green perylenediimide (PDI) dyes as potential sensitizers for photodynamic
therapy. Organic letters, 2005. 7(14): p. 2885-2887.
35. Gong, C.Y., Wang, Y.J., Wang, X.H., Wei, X.W., Wu, Q., Wang, B.L.,
Dong, P.W., Chen, L.J., Luo, F., Qian, Z.Y., Biodegradable self-assembled

89
PEG-PCL-PEG micelles for hydrophobic drug delivery, part 2: in vitro and
in vivo toxicity evaluation. Journal of Nanoparticle Research, 2011. 13(2): p.
721-731.
36. Soares, M.V., Lanzarini C.M., Oliveira, D.S, Ramos, P.R.S., Santos, E.,P.,
Improving the phototoxicity of the zinc phthalocyanine by encapsulation in
nanoparticles: preparation, characterization and phototherapy studies. Latin
Am. J. Pharm, 2010. 29: p. 5-12.
37. D'Souza, S., The Photophysical Properties of Low Symmetry Phthalocyanines
in Conjunction with Quantum Dots. 2011: Rhodes University.
38. Nemykin, V.N. and E.A. Lukyanets, Synthesis of substituted phthalocyanines.
Arkivoc, 2010. 1: p. 136-208.
39. McKeown, N.B., Cook, M.J., Thomson, A.J., New asymmetric substitution of
phthalocyanines: Derivatives designed for deposition as Langmuir-Blodgett
films. Thin Solid Films, 1988. 159(1–2): p. 469-478.
40. Achar, B.N. and K.S. Lokesh, Studies on tetra-amine phthalocyanines.
Journal of Organometallic Chemistry, 2004. 689(21): p. 3357-3361.
41. Alzeer, J., P.J.C. Roth, and N.W. Luedtke, An efficient two-step synthesis of
metal-free phthalocyanines using a Zn(ii) template. Chemical
Communications, 2009. 0(15): p. 1970-1971.
42. Korkut, S.E., Temel, G., Balta, D.K., Arsu, N., Şener, M.K., Type II
photoinitiator substituted zinc phthalocyanine: Synthesis, photophysical and
photopolymerization studies. Journal of Luminescence, 2013. 136: p. 389-
394.

90
43. Chidawanyika, W. and T. Nyokong, The synthesis and photophysicochemical
properties of low-symmetry zinc phthalocyanine analogues. Journal of
Photochemistry and Photobiology A: Chemistry, 2009. 206(2-3): p. 169-176.
44. Tedesco, A.C., J.C.G. Rotta, and C.N. Lunardi, Synthesis, Photophysical and
Photochemical Aspects of Phthalocyanines for Photodynamic Therapy.
Current Organic Chemistry, 2003. 7(2): p. 187-196.
45. Kadish, K.M., K.M. Smith, and R. Guilard, The Porphyrin Handbook:
Phthalocyanines : spectroscopic and electrochemical characterization. Vol.
16. 2003: Academic Press.
46. Lukyanets, E.A., Phthalocyanines as Photosensitizers in the Photodynamic
Therapy of Cancer. Journal of Porphyrins and Phthalocyanines, 1999. 03(06):
p. 424-432.
47. Zhang, X.-F. and H.-J. Xu, Influence of halogenation and aggregation on
photosensitizing properties of zinc phthalocyanine (ZnPC). Journal of the
Chemical Society, Faraday Transactions, 1993. 89(18): p. 3347-3351.
48. Martin, P.C., Gouterman, M., Pepich, B.V., Rezoni, G.E., Schindele, D.C.,
Effects of ligands, solvent, and variable sulfonation on dimer formation of
aluminum and zinc phthalocyaninesulfonates. Inorganic Chemistry, 1991.
30(17): p. 3305-3309.
49. Tabata, K.e.a., Selective aggregation of zinc phthalocyanines in the skin.
Journal of Porphyrins and Phthalocyanines, 2000. 04(03): p. 278-284.
50. Ogunsipe, A., D. Maree, and T. Nyokong, Solvent effects on the
photochemical and fluorescence properties of zinc phthalocyanine
derivatives. Journal of molecular structure, 2003. 650(1): p. 131-140.

91
51. Kadish, K.M., K.M., Smith, and R. Guilard, The Porphyrin Handbook: Past,
present and future. Vol. vol 6. 2000: Academic Press.
52. Jung, S.H., Choi, J.H., Yang, S.M., Cho, W.J., Ha, C.S., Syntheses and
characterization of soluble phthalocyanine derivatives for organic
electroluminescent devices. Materials Science and Engineering: B, 2001.
85(2–3): p. 160-164.
53. Karaoğlan, G.K., Gümrükçü, G., Koca, A., Gül, A., Avcıata, U., Synthesis
and characterization of novel soluble phthalocyanines with fused conjugated
unsaturated groups. Dyes and Pigments, 2011. 90(1): p. 11-20.
54. Nombona, N., E. Antunes, and T. Nyokong, The synthesis and fluorescence
behaviour of phthalocyanines unsymmetrically substituted with naphthol and
carboxy groups. Dyes and Pigments, 2010. 86(1): p. 68-73.
55. Müller, T.J.J. and U.H.F. Bunz, Functional Organic Materials: Syntheses,
Strategies and Applications. 2007: John Wiley & Sons.
56. Aratani, N., Osuka, A., Cho, H.S., Kim, D., Photochemistry of covalently-
linked multi-porphyrinic systems. Journal of Photochemistry and
Photobiology C: Photochemistry Reviews, 2002. 3(1): p. 25-52.
57. Nyokong, T., Effects of substituents on the photochemical and photophysical
properties of main group metal phthalocyanines. Coordination Chemistry
Reviews, 2007. 251(13-14): p. 1707-1722.
58. Gárate-Morales, J.L., F.S. Tham, and C.A. Reed, Do Sitting-Atop
Metalloporphyrin Complexes Exist? Observation of NH---π Bonding in Arene
Solvates of a Diprotonated Porphyrin Dication. Inorganic chemistry, 2007.
46(5): p. 1514-1516.
92
59. Fukuzumi, S., T. Honda, and T. Kojima, Structures and photoinduced
electron transfer of protonated complexes of porphyrins and
metallophthalocyanines. Coordination Chemistry Reviews, 2012. 256(21-22):
p. 2488-2502.
60. Beeby, A., S. FitzGerald, and C.F. Stanley, A photophysical study of
protonated (tetra-tert-butylphthalocyaninato) zinc. Journal of the Chemical
Society, Perkin Transactions 2, 2001(10): p. 1978-1982.
61. Ogunsipe, A. and T. Nyokong, Effects of substituents and solvents on the
photochemical properties of zinc phthalocyanine complexes and their
protonated derivatives. Journal of Molecular Structure, 2004. 689(1-2): p. 89-
97.
62. Topal, S.Z., Ertekin, K., Gürek, A.G., Yenigül, B., Ahsen, V., Tuning pH
sensitivities of zinc phthalocyanines in ionic liquid modified matrices.
Sensors and Actuators B: Chemical, 2011. 156(1): p. 236-244.
63. Albani, J.R., Principles and Applications of Fluorescence Spectroscopy.
2008: Wiley.
64. Valeur, B. and M.N. Berberan-Santos, Molecular Fluorescence: Principles
and Applications. 2013: Wiley.
65. Sauer, M., J. Hofkens, and J. Enderlein, Handbook of Fluorescence
Spectroscopy and Imaging: From Ensemble to Single Molecules. 2010:
Wiley.
66. Lewis, P.A., Pigment Handbook, 3 Volume Set. 1988: Wiley.
67. Gooch, J.W., Encyclopedic Dictionary of Polymers. 2010: Springer.

93
68. Durmuş, M., V. Ahsen, and T. Nyokong, Photophysical and photochemical
studies of long chain-substituted zinc phthalocyanines. Journal of
Photochemistry and Photobiology A: Chemistry, 2007. 186(2-3): p. 323-329.
69. Çamur, M., M. Durmuş, and M. Bulut, Synthesis, characterization and
comparative studies on the photophysical and photochemical properties of
metal-free and zinc(II) phthalocyanines with phenyloxyacetic acid
functionalities. Polyhedron, 2011. 30(12): p. 1935-1944.
70. Bevington, P.R. and D.K. Robinson, Data reduction and error analysis for
the physical sciences. Vol. 2. 1969: McGraw-Hill New York.
71. Rendell, D., Fluorescence and Phosphorescence 1987: Wiley India Pvt.
Limited.
72. Kahya, S.S., Synthesis and characterization of fluorescent zinc
phthalocyanine pigments and its combination pigment with mica titania
pigment. 2012, METU.

94

95
APPENDIX A
FT-IR RESULTS OF THE OTHER EXPERIMENTS
Figure A.1 FT-IR spectra of DMF with TNZnPc, DMF+AA with TNZnPc, and
DMF with TAZnPc.
5001000150020002500300035004000
Tran
smit
tan
ce (
%)
Wavenumber (cm-1)
mica-titania
DMF+TNZnPc
DMF+TNZnPc+AA
DMF+TAZnPc

96
Figure A.2 FT-IR spectra of CHCl3 with TAZnPc, CHCl3 +AA with TNZnPc, and
water with TAZnPc.
5001000150020002500300035004000
Tran
smit
tan
ce (
%)
Wavenumber (cm-1)
mica-titania
Water+TAZnPc
CH+TAZnPc
CH+TNZnPc+AA
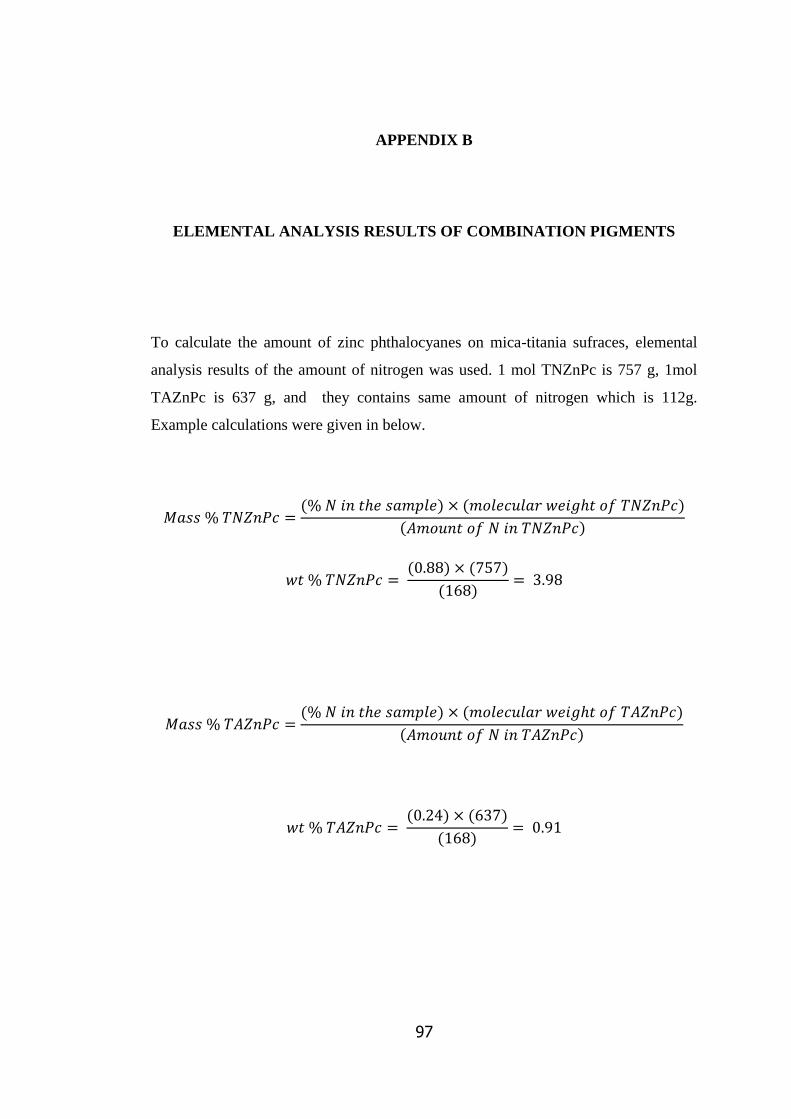
97
APPENDIX B
ELEMENTAL ANALYSIS RESULTS OF COMBINATION PIGMENTS
To calculate the amount of zinc phthalocyanes on mica-titania sufraces, elemental
analysis results of the amount of nitrogen was used. 1 mol TNZnPc is 757 g, 1mol
TAZnPc is 637 g, and they contains same amount of nitrogen which is 112g.
Example calculations were given in below.

98

99
APPENDIX C
EXPECTED FLUORESCENCE OF THE PIGMENTS CALCULATIONS
To calculate of expected fluorescence of the combination pigments, this equation
was used:
Expected Fluorescence = [(Fluorescence of TNZnPc) x (mass % of TNZnPc)] +
[(Fluorescence of mica-titania) x (mass % of mica-titania)]
An example calculation was given in below.
Expected fluorescence of 0.05 mg/mg TNZnPcMip = [( 243) x ( 14.7/100)] + [(30)
x ( 100-14.7)/100] = 92.33
The rest of calculations’ results were given in Table-C.

100
Table-C The expected fluorescence results of TNZnPcMip samples.
TNZnPc
wt %
TNZnPcMip
fluorescence
(experimental)
TNZnPcMip
Fluorescence
%
Mica-
Titania wt
%
Mica-T.
Fluorescence
%
Total
Fluorescence
(expected)
100.00
454 454.00 0.00 0.00 454.00
14.70
243 66.74 85.30 25.59 92.33
7.35
172 33.37 92.65 27.80 61.16
4.80
130 21.79 95.20 28.56 50.35
3.70
118 16.80 96.30 28.89 45.69
1.80
104 8.17 98.20 29.46 37.63
0.00
30
0.00 100.00 30.00 30.00

101
APPENDIX D
SYNTHESIS MATERIALS FOR PHTHALOCYANINES
Table-D Properties of materials used in this study.
Chemical Chemical formula Molecular
weight (g/mol)
Density (g/cm3)
(25 °C)
3-nitrophthalic acid O2NC6H3-1,2-(CO2H)2 211.13 1.671
Urea (NH2)2CO 60.16 1.32
Zinc chloride ZnCl2 136.3 2.91
Ammonium
heptamolybdate (NH4)6Mo7O24·4H2O 1235.9 2.5
Sodium sulfide Na2S 78.04 1.86
Dimethyl
formamide (DMF) (CH3)2NCHO 73.1 0.94
Chloroform CHCl3
119.4 1.48
Ethyl acetate CH3COOCH2CH3
88.11 0.897
Diethyl ether (C2H5)2O
74.12 0.71
Acetic acid CH3COOH
60.01 1.049
Trifluoro acetic
acid CF3COOH
114.02 1.489


![Galvaniz Kaplama - webdosya.csb.gov.tr · Banyo sıcaklığı 450 ˚C’de muhafaza edilir. Çinko çelikteki demir ile alaşım oluşturarak korozyona karşı koruma sağlar [2]](https://img.pdfslide.net/doc/110x75/5e202073c27b1c733d2b15c3/galvaniz-kaplama-banyo-scakl-450-cade-muhafaza-edilir-inko-elikteki.jpg)