Embed Size (px)
Citation preview
Synthesis and Characterization of
Ti3SiC2/Mg and Cr2AlC/Mg Composites
A Thesis
Submitted to the Faculty
of
Drexel University
By
Matthew Jared Nelson
in partial fulfillment of the
requirements for the degree
of
Master of Science in Materials Science and Engineering
June 2014

© Copyright 2014
Matthew Jared Nelson. All Rights Reserved.

ii
Acknowledgements
First and foremost I want to acknowledge my mother, aunt, uncle and step-mother for
always believing in me and knowing that I was destined to achieve more. Without their
unwavering patience, love and support, none of this may have been possible.
I want to share my appreciation for Dr. Michel Barsoum and his grace for offering me
such a wonderful opportunity to work in his group and offering support in so many
different ways.
I feel it’s important to acknowledge Dr. Babak Anasori and Darin Tallman for their
extensive training and help on so many conceptual challenges for the successful
completion of this work. Without hesitation, they were always willing to help and I owe
them a great deal of thanks.
Through my time and experience with the MAX phase group I have gained some of the
best friends I have in my life and consider Dr. Barsoum a treasured friend and confidant.
Lastly, this work would not have been possible without the funding coming from the
United States Army Research Office; Hoorah.
To family, friends and a life full of love, peace and happiness – cheers.
iii
Table of Contents
LIST OF TABLES .............................................................................................................. v
LIST OF FIGURES ........................................................................................................... vi
Abstract ............................................................................................................................... x
1. Introduction ................................................................................................................. 1
2. Background .................................................................................................................. 3
2.1 Magnesium .................................................................................................................... 3
2.2 Magnesium Alloys ........................................................................................................ 5
2.3 Metal Matrix Composites ............................................................................................. 9
2.4 Composite Matrix ....................................................................................................... 11
2.5 Composite Reinforcement .......................................................................................... 12
2.6 MMC Processing ........................................................................................................ 13
2.7 Previous Work: MMC................................................................................................. 14
2.8 The MAX Phases ........................................................................................................ 16
2.9 Previous Work on MAX/Mg-Alloy Composites ........................................................ 21
2.10 Objective of this Work .............................................................................................. 23
3. Materials .................................................................................................................... 26
3.1 Composite Matrix: Mg and Mg-alloys ....................................................................... 26
3.2 Composite Reinforcement: MAX phases ................................................................... 26
4. Processing & Experimental Methods ........................................................................ 27
4.1 Preparation of Carbide Powders ................................................................................. 27
4.2 Preparation of Carbide Preforms ................................................................................ 29
4.3 Pressureless Melt Infiltration ...................................................................................... 32
4.4 MMC Sample Preparation and Archimedes’ Principle .............................................. 34
4.5 Microstructural Characterization ................................................................................ 35
4.6 Vicker’s Microhardness .............................................................................................. 36
4.7 Compression Testing .................................................................................................. 36
4.8 Elastic Moduli and Yield Strength .............................................................................. 37
5. Results ....................................................................................................................... 40
5.1 XRD: In-house Synthesized Cr2AlC Powder ............................................................. 40
iv
5.2 XRD: Cr2AlC reinforced Mg Composites .................................................................. 41
5.3 XRD: Ti3SiC2 reinforced Mg Composites .................................................................. 42
5.4 Pre-stress Evaluation of Microstructure...................................................................... 43
5.5 Vickers Microhardness ............................................................................................... 47
5.6 Ultimate Compression Strength .................................................................................. 48
5.7 Elastic Moduli ............................................................................................................. 49
5.8 Yield Strength ............................................................................................................. 53
5.9 Cyclic Compression Testing ....................................................................................... 54
5.10 Effect of Preform Density on Mechanical Properties ............................................... 57
5.11 Machinability ............................................................................................................ 57
5.12 Post-stress Evaluation of Microstructure .................................................................. 58
6. Discussion .................................................................................................................. 65
6.1 XRD ............................................................................................................................ 65
6.2 Trends in Mechanical Properties ................................................................................ 66
6.3 Energy Dissipation ...................................................................................................... 69
6.4 MAX Phase Microstructure and Morphology on Fracture ......................................... 70
7. Summary and Conclusions ........................................................................................ 72
8. Future Work ............................................................................................................... 75
8.1 Effect of Preform Density on Mechanical Properties ................................................. 75
8.2 Mg2Si .......................................................................................................................... 75
9. Other Work Aspects .................................................................................................. 77
9.1 Safety .......................................................................................................................... 77
9.2 SOPS ........................................................................................................................... 78
9.3 MSDS .......................................................................................................................... 78
9.4 Standards ..................................................................................................................... 78
9.5 Budget ......................................................................................................................... 79
9.6 Ethics........................................................................................................................... 80
9.7 Time Management ...................................................................................................... 80
List of References ............................................................................................................. 82
v
LIST OF TABLES
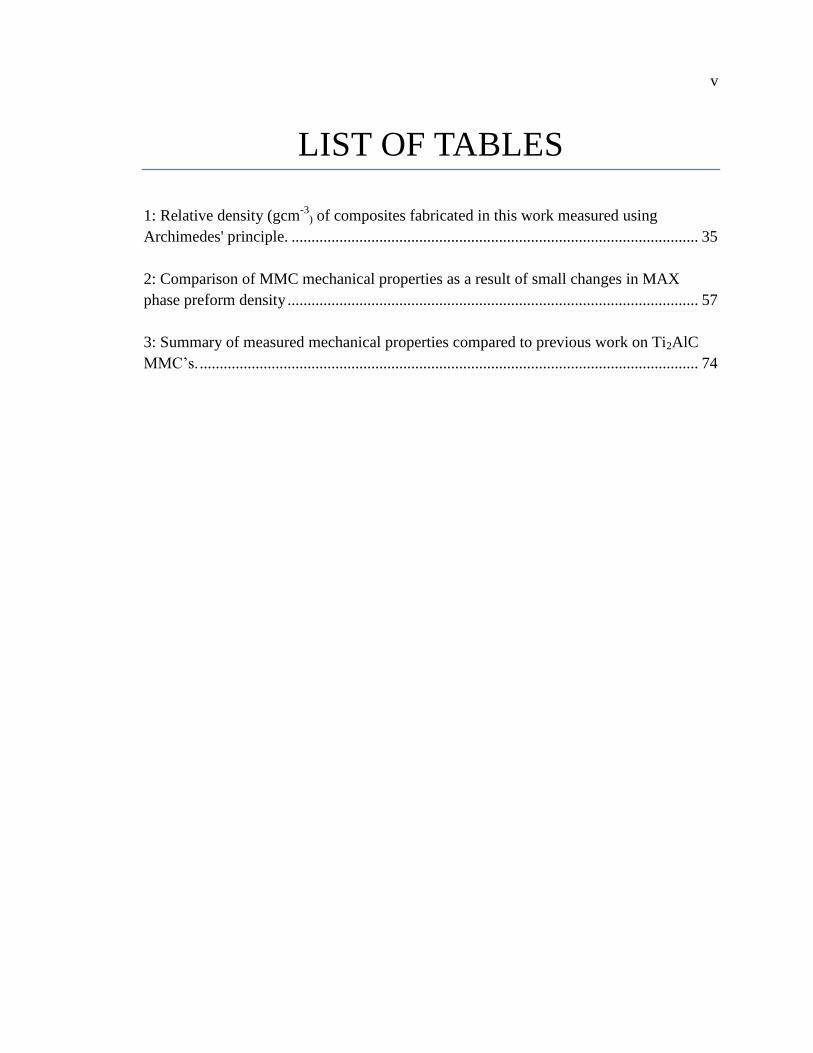
1: Relative density (gcm-3
) of composites fabricated in this work measured using
Archimedes' principle. ...................................................................................................... 35
2: Comparison of MMC mechanical properties as a result of small changes in MAX
phase preform density ....................................................................................................... 57
3: Summary of measured mechanical properties compared to previous work on Ti2AlC
MMC’s. ............................................................................................................................. 74
vi
LIST OF FIGURES
1: Mechanical properties of pure Mg from various processing techniques.2 ...................... 4
2: Comparison of mechanical properties of medical implant materials to that of human
bone and magnesium.2 ........................................................................................................ 4
3: Specific strengths of structural materials in comparison with casted Mg-alloy AZ91D.2
............................................................................................................................................. 5
4: Specific stiffness of structural materials in comparison with casted Mg-alloy AZ91D.26
5: Toyota Camry steering wheel core: 0.75 kg (A); Jaguar and Fiat model seat support:
2.6 kg (B); AZ91D rear transfer case: 2.7 kg (C).2 ............................................................. 7
6: Number of scientific articles which have terms AZ91 or AZ31 in the abstract.7 ........... 9
7: Majority of the currently known MAX phases.33
......................................................... 17
8: Elements of the periodic table that react to from MAX phases.30
................................ 18
9: The unit cells of the 211, 312 and 413 crystal structures each showing its respective c-
lattice parameter.34
............................................................................................................ 19
10: Nested hysteresis loops in a stress strain curve showing tell tale signs of energy
dissipation (A); dislocation loops which open and close during loading and unloading
(B); kinking material under stress (C); non-linear stress-strain behavior which exhibits
elasticity and no deformation (D). .................................................................................... 21
11: YS and UCS results from Anasori et al's work on fine and coarse reinforcement
particle grain size MMCs.26
.............................................................................................. 23
12: 7.62 cm diameter shell-inserted tungsten carbide mill ............................................... 29
13: Picture of graphite die with a 70mm high boron nitride coated punch extending out of
the die bore. ....................................................................................................................... 30
vii
14: MI prep schematic and actual set-up. ......................................................................... 33
15: UCS found by displacement testing (A); example showing how YS was found and the
closed hysteresis loops in cyclic compression testing (B). ............................................... 37
16: Fully reversible closed hysteresis loops being separated for exemplifying how
composite effective moduli were found. ........................................................................... 38
17: In-house synthesized Cr2AlC powder XRD pattern matched to the JADE XRD
database reference. ............................................................................................................ 40
18: Overlayed XRD patterns for the Cr/55/Mg composite before (bottom curve) and after
(top curve) annealing for 24 h at 750 °C. ......................................................................... 41
19: Overlayed XRD patterns of the Ti/55/Mg sample before (bottom curve) and after (top
curve) annealing for 24 h at 750 °C. ................................................................................. 42
20: Overlayed XRD patterns of the Ti/55/Mg sample (bottom curve) and Ti/54/91 (top
curve). ............................................................................................................................... 43
21: SE mode SEM images of Ti/55/31 (A) and Ti/55/Mg (B) composites displaying the
MAX phase reinforcement and matrix materials. ............................................................. 44
22: SEM images of Ti/55/Mg (A) and Ti/53/61 (B) composites revealing intact matrix
components and a severely kinked and delaminated microstructure. ............................... 45
23: EDS line scan confirming the presence of penetrated Mg into a Ti3SiC2 grain
nanofissure. ....................................................................................................................... 46
24: Cr2AlC un-kinked and non-delaminated circular microstructure and morphology. ... 46
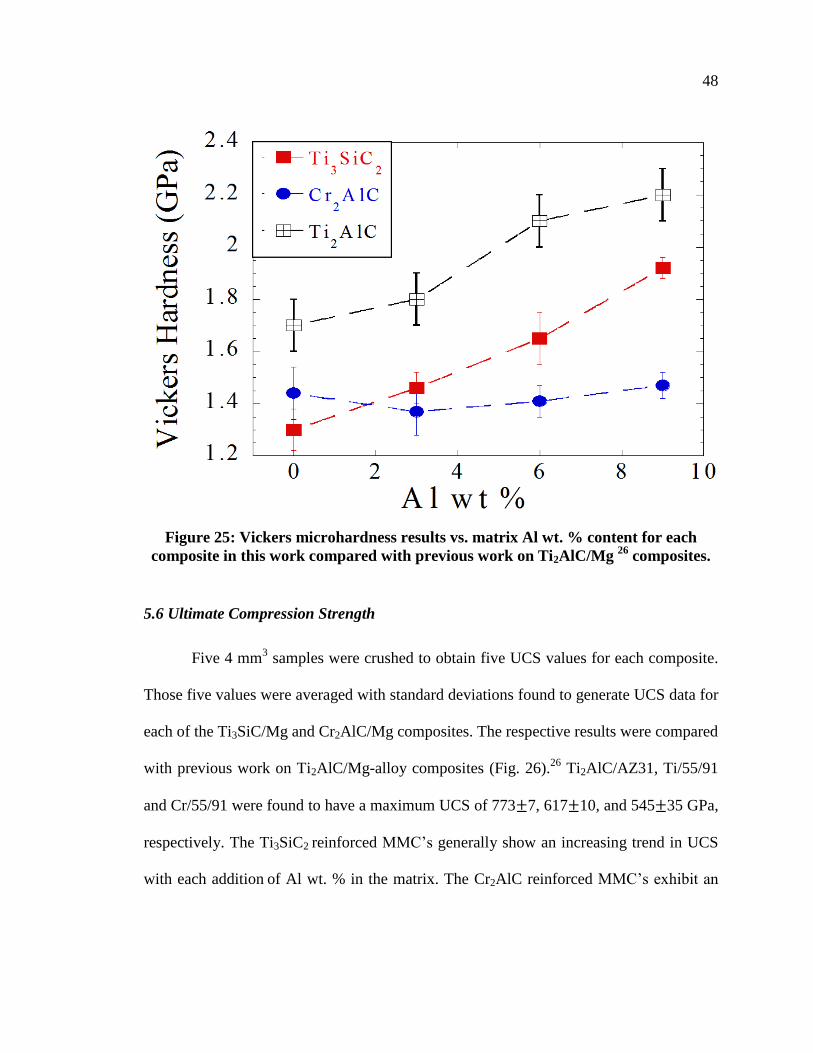
25: Vickers microhardness results vs. matrix Al wt. % content for each composite in this
work compared with previous work on Ti2AlC/Mg 26
composites................................... 48
26: Comparison of UCS testing results vs. Al wt% content for in for each composite in
this work compared with previous work on Ti2AlC/Mg 26
composites. ........................... 49
27: Effective moduli vs. compressive stress for every composite in this work. ............... 50
viii
28: The effect of small changes in MAX carbide preform volume % density (blue vs.
green curves) directly increases mechanical properties. ................................................... 51
29: Eeff(avg) as a function of Al wt. % content in the matrix for Ti3SiC2, Cr2AlC and
Ti2AlC 26
MMCs. .............................................................................................................. 52
30: E100(avg) as a function of Al. wt. % content in the matrix for Ti3SiC2, Cr2AlC and
Ti2AlC 26
MMCs. .............................................................................................................. 53
31: Yield strength as a function of Al wt. % content in the matrix of Ti2AlC 26
, Ti3SiC2
and Cr2AlC MMC's. .......................................................................................................... 54
32: Cyclic compression testing results of Cr2AlC reinforced MMCs displaying nested,
closed, fully reversible energy dissipating loops. ............................................................. 55
33: Cyclic compression testing results of Ti3SiC2 reinforced MMCs displaying nested,
closed, fully reversible energy dissipating loops. ............................................................. 56
34: SE mode image of the Ti/55/31 composite displaying four microhardness indents, the
homogenous MAX phase reinforcement landscape, and areas of intact matrix. .............. 58
35: SE mode SEM images of microhardness indents in Ti/54/31 (A) and Ti/57/31 (B)
composites revealing matrix areas outside the indent perimeter being pulled out, but
intact within the indent itself. ............................................................................................ 59
36: SE (A) and BSE mode (B) SEM images of a microhardness indent in the Cr/55/31
composite. ......................................................................................................................... 60
37: Schematic displaying directions transverse (red arrows) and longitudinal (green
arrows) surfaces to the applied compressive stress direction (left). One longitudinal and
one transverse stress direction UCS sample from each Ti3SiC2 (right: top) and Cr2AlC
reinforced composite (right: bottom). ............................................................................... 61
38: Kinked and delaminated Cr2AlC grains in the transverse to stress direction sample of
the Cr/55/31 composite. .................................................................................................... 62
39: Visual inspection revealing differences in the longitudinal (tensile) fracture surface
edge morphologies of the Ti and Cr based Mg-alloy composites. ................................... 63
ix
40: Curved fracture edge morphology of the Cr2AlC based composite (A); a curved and
jagged area of interest on the fracture edge (B); magnified area of interest displaying the
curved and jagged fracture morphology (C). .................................................................... 64
41: Linear and smooth fracture edge morphology of the Ti3SiC2 based composite (A);
linear and smooth area of interest on the fracture edge (B); magnified areas of interest of
the smooth linear fracture morphology (C, D).................................................................. 64
42: SEM image displaying the Ti/55/31 composite location where EDS has revealed the
appropriate atomic ratio consistent with Mg2Si. ............................................................... 76
43: Charge types and their related costs. .......................................................................... 79
44: Gantt chart displaying time management schedule for the successful completion of
this work............................................................................................................................ 81
x
Abstract
Synthesis and Characterization of the Mechanical Properties of
Ti3SiC2/Mg and Cr2AlC/Mg Alloy Composites
Matthew Jared Nelson
Dr. Michel Barsoum, Ph.D.
High strength, light-weight materials are in high demand in many applications;
especially aerospace and the military. The focus of this work is to report on the
fabrication and characterization of Ti3SiC2 and Cr2AlC MAX phase reinforced Mg and
Mg-alloy metal matrix composites synthesized by pressureless melt infiltration. Pure Mg
and Al-containing Mg-alloys (AZ31, AZ61 & AZ91) with varying Al content were
matrices with loadings of ~ 45 1 vol. %. The resulting microstructures and mechanical
properties were characterized by X-ray diffraction, scanning electron microscopy (SEM),
and compressive stress testing. SEM revealed kinked, delaminated, and elongated
Ti3SiC2 grain, and non-deformed, rounded Cr2AlC grain morphologies. Like in the
Ti2AlC/Mg composite system, increasing the Al wt. % content in the matrix enhanced the
mechanical properties of the Ti3SiC2 composite system, but had a deleterious effect on
the properties of the Cr2AlC composite system. At 1.9 0.1 GPa, 346 4 MPa and
617 10 MPa, the Vickers hardness, yield strength and ultimate compressive strength,
respectively, of the Ti3SiC2/AZ91 composite were the highest in this study. All
composites fabricated in this work exhibited fully and spontaneously reversible hysteresis
loops due to the back and forth motion of dislocations. A small change in reinforcement
volume fraction was found to affect the measured mechanical properties.

1
1. Introduction
Society’s expectations and demands for newer and better technology have never
been stronger than now. Society as a whole has become accustomed to having innovative
new products introduced continuously. Recognizably, many industries would be more
profitable and society would benefit from having stronger, lighter and cheaper materials.
From aerospace and automotive, to nuclear and military applications, the demand is
growing ever stronger for more innovative products consisting of materials that will
perform longer, provide a safer and more reliable experience and have better performance
overall. A major problem is that society, the military and various industries are
demanding the realization and creation of the next era of elite materials now.
The United States military is very interested in advanced materials such as hybrid
composites, metal matrix and ceramic matrix composites (MMCs and CMCs), and
polymer matrix composites. One concept is to plate a vehicle, or tank, in advanced armor
that is 1/3 the thickness, and 2/3 the weight, offering the same or better protection of
typical armor. Armor such as this provides a protection benefit and increases the odds
that military troops are brought home from battle safely. Reduced weight also enables
vehicles to expend less energy to travel the same distance, making them more efficient;
this is a highly revered quality for military vehicles.
Engineered armor, such as Dragon Skin made by Pinnacle Armor of Fresno,
California is comprised of advanced ceramic and titanium carbide ultra-light, linked,
2
small discs. Dragon Skin provides increased dexterity and mobility instead of large heavy
plates, or cumbersome vests, that restrict movement on infantry units.1 The armor
combines highly desirable characteristics: it is light weight with a high degree of
vibrational damping and is extremely tough. The armor has the ability to resist multiple
shots from steel-core shelled armor piecing rounds that can tear through quarter inch steel
plate with ease. Quarter inch steel plate is typically found on lightly armored vehicles
therefore, a dexterous, lightweight armor system which can protect soldiers from armor
piercing bullets is very desirable.
Globally, militaries are interested in advanced materials which offer the next level
of elite armor for soldier and vehicle protection. The military is not the only entity that is
interested in upper echelon materials. The aerospace and automotive industries invest
heavily in research and development for lighter, stronger materials that have a direct
impact on energy consumption. In the aerospace industry, lighter weights correspond to
enormous savings in fuel costs. Airline manufacturers would willingly spend extra money
on materials to further improve cost-to-benefit ratios. Fuel savings could be kicked-back
to the consumer in the form of cheaper flights which would equate to increased ticket
sales and higher profitability. Having these benefits is strongly favored especially with
the increasing costs and steady depletion of non-renewable fuels. The automotive
industry can benefit in the same way. This is especially true in the racing sector where
lighter cars equate to faster lap times and faster lap times increase the odds of winning
large sums of money and prestige.
3
2. Background
2.1 Magnesium
Magnesium is the sixth most abundant element representing 2.7% of the total
earth’s crust and it is the third most abundant dissolved mineral in seawater at 1.1 kgm-3
.2 Mg is not readily found in its elemental form; Mg is extracted from compounds such as
magnesite (MgCO3), dolomite (MgCO3-CaCO3), carnalite (KCl-MgCl2-6H2O), and also
seawater.2 Magnesium is the lightest of all structural materials, with a density of 1.74
gcm-3
making it 1/4 the density of steel and 2/3 the density of aluminum.2
Mg has good castability, can be milled at high speed, can be welded under
controlled atmosphere and has improved damping ability in comparison to Al.3,4
Despite
some of its very desirable properties, Mg is not used for structural applications when
compared to other engineered materials because of its low elastic modulus, low strengths
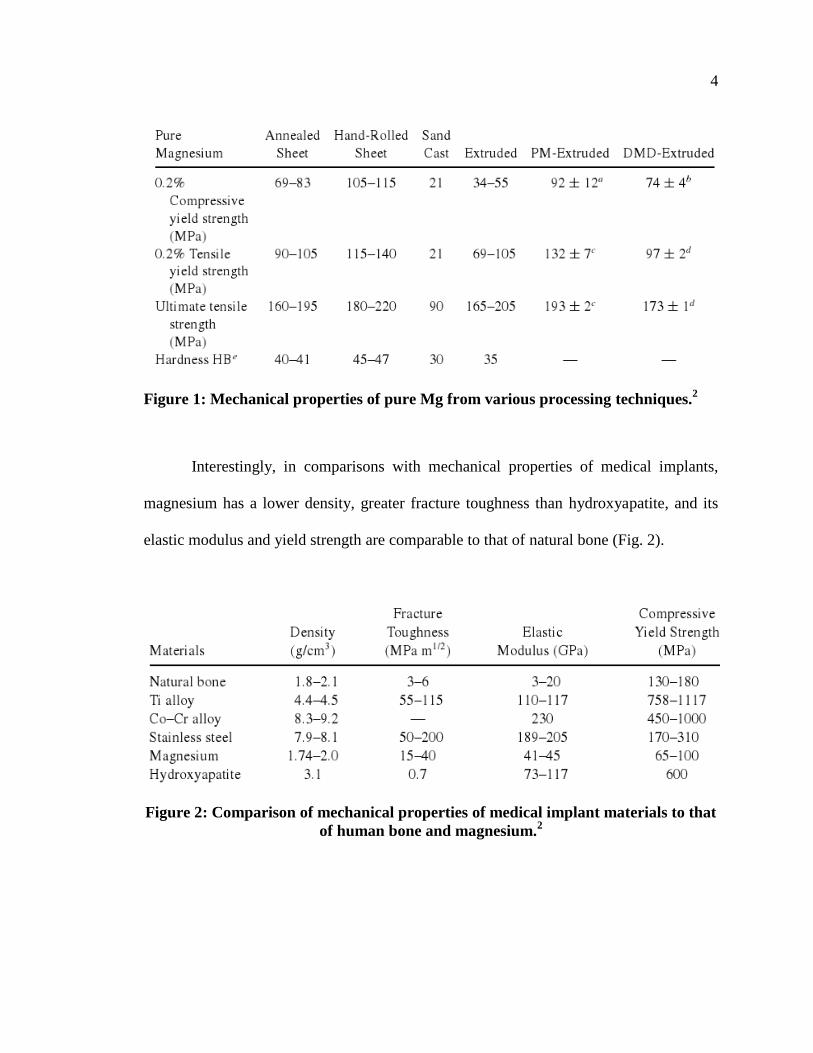
(Fig. 1), creep resistance at elevated temperatures, and high chemical reactivity.3
4
Figure 1: Mechanical properties of pure Mg from various processing techniques.
2
Interestingly, in comparisons with mechanical properties of medical implants,
magnesium has a lower density, greater fracture toughness than hydroxyapatite, and its
elastic modulus and yield strength are comparable to that of natural bone (Fig. 2).
Figure 2: Comparison of mechanical properties of medical implant materials to that
of human bone and magnesium.2
5
2.2 Magnesium Alloys
Magnesium and its alloys have been used in a wide variety of applications
ranging from automotive racing, spacecraft and missiles, medical devices and electronics,
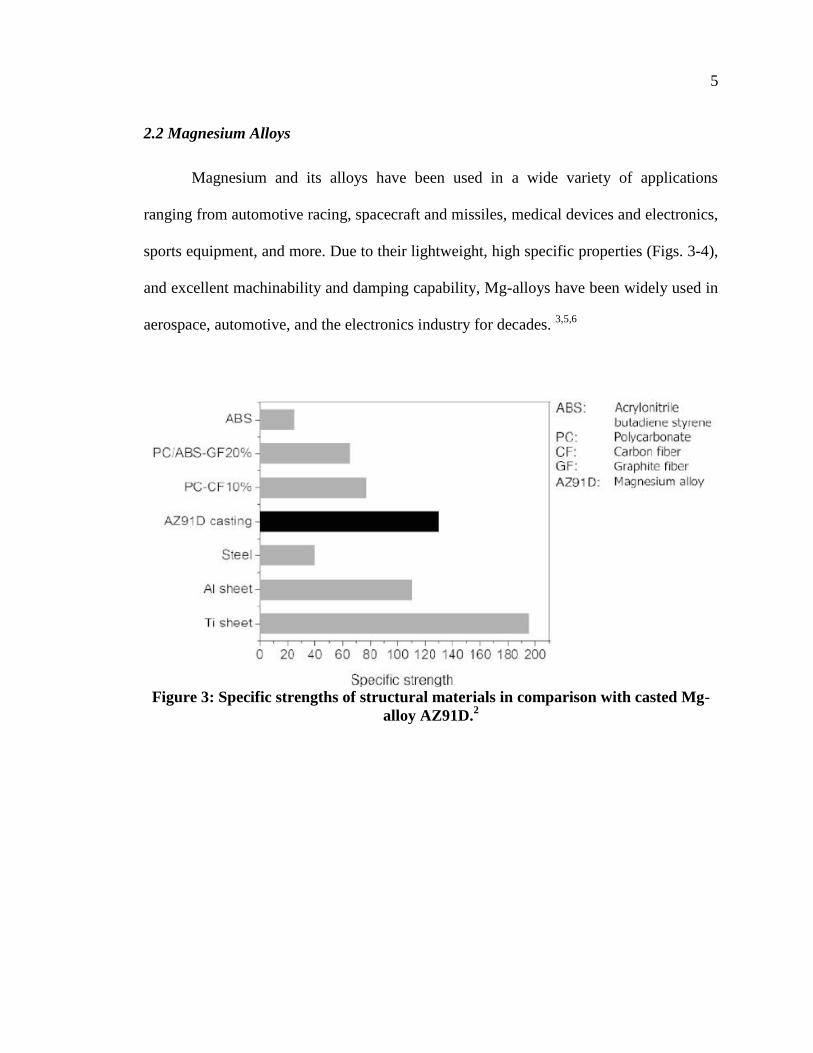
sports equipment, and more. Due to their lightweight, high specific properties (Figs. 3-4),
and excellent machinability and damping capability, Mg-alloys have been widely used in
aerospace, automotive, and the electronics industry for decades. 3,5,6
Figure 3: Specific strengths of structural materials in comparison with casted Mg-
alloy AZ91D.2
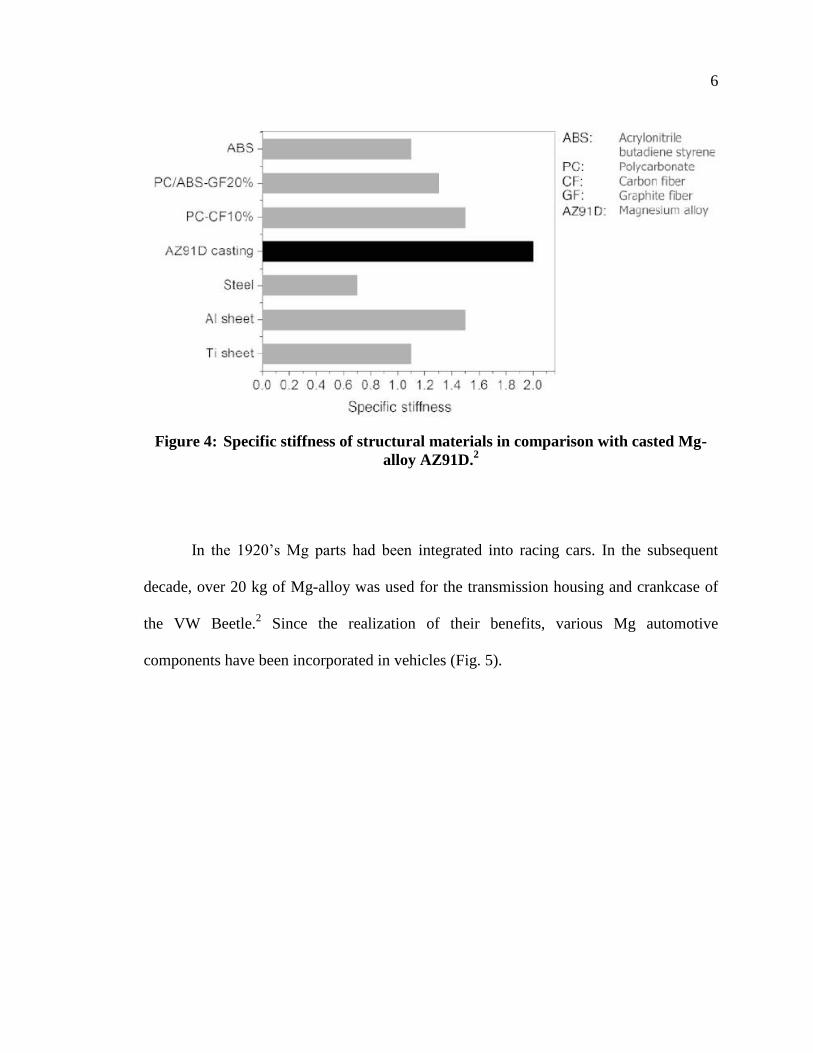
6
Figure 4: Specific stiffness of structural materials in comparison with casted Mg-
alloy AZ91D.2
In the 1920’s Mg parts had been integrated into racing cars. In the subsequent
decade, over 20 kg of Mg-alloy was used for the transmission housing and crankcase of
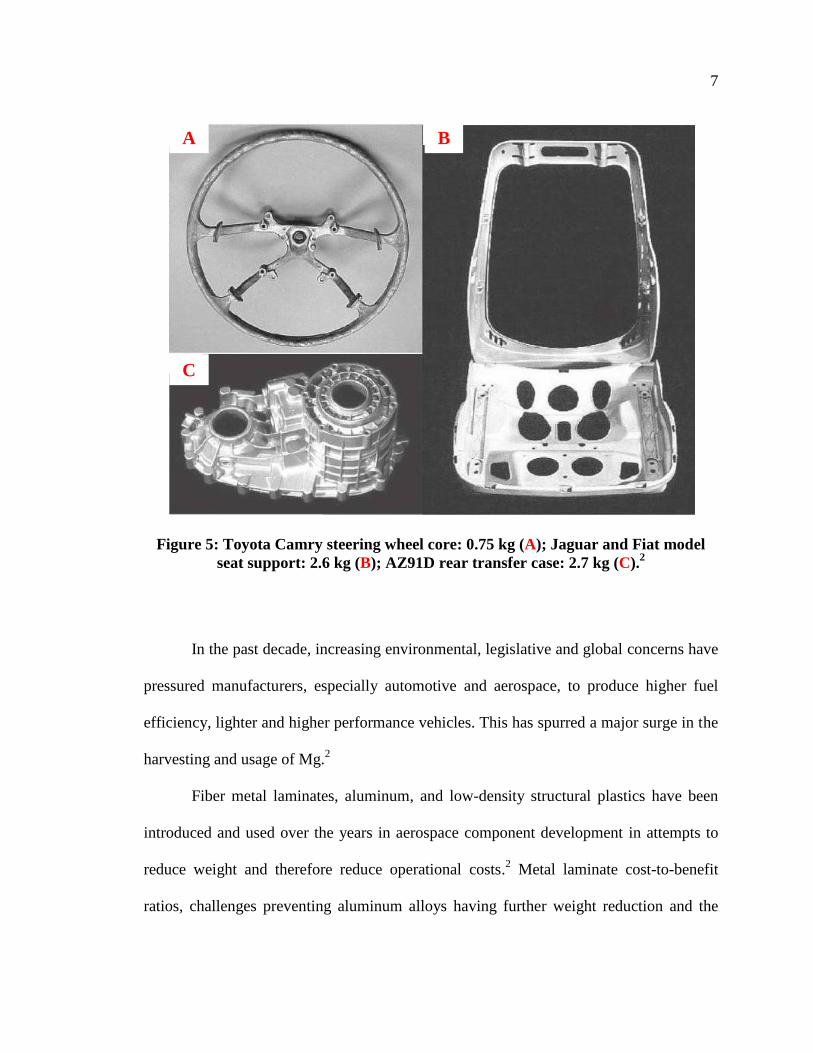
the VW Beetle.2 Since the realization of their benefits, various Mg automotive
components have been incorporated in vehicles (Fig. 5).
7
Figure 5: Toyota Camry steering wheel core: 0.75 kg (A); Jaguar and Fiat model
seat support: 2.6 kg (B); AZ91D rear transfer case: 2.7 kg (C).2
In the past decade, increasing environmental, legislative and global concerns have
pressured manufacturers, especially automotive and aerospace, to produce higher fuel
efficiency, lighter and higher performance vehicles. This has spurred a major surge in the
harvesting and usage of Mg.2
Fiber metal laminates, aluminum, and low-density structural plastics have been
introduced and used over the years in aerospace component development in attempts to
reduce weight and therefore reduce operational costs.2 Metal laminate cost-to-benefit
ratios, challenges preventing aluminum alloys having further weight reduction and the
A B
C
8
poor impact, damage tolerance and temperature resistance of low-density structural
plastics have made Mg-alloys an attractive weight reduction material.2
Mg-based materials have been used in both civil and military aircraft. Civil
applications include thrust reversers for the Boeing 737, 747, 757, and 767. Rolls-Royce
has used them in gearboxes, engines and helicopter transmission casings. Mg-alloys have
been also been used for Eurofighter Typhoon, Tornado and F16 military aircraft
transmission casings.2
Mg-alloy usage becomes especially significant for spacecraft and missiles where
lift-off weight requirements are strict and vibrational damping capability becomes
extremely beneficial. Large amounts of magnesium where used in intercontinental
ballistic missiles. Besides their reduced weight and damping properties, Mg-alloys are
attractive for space applications because of their high specific properties, elevated
temperature resistance, ease of fabrication, and their resilience to other issues such as
ozone, high energy particle and small meteorite bombardment.2
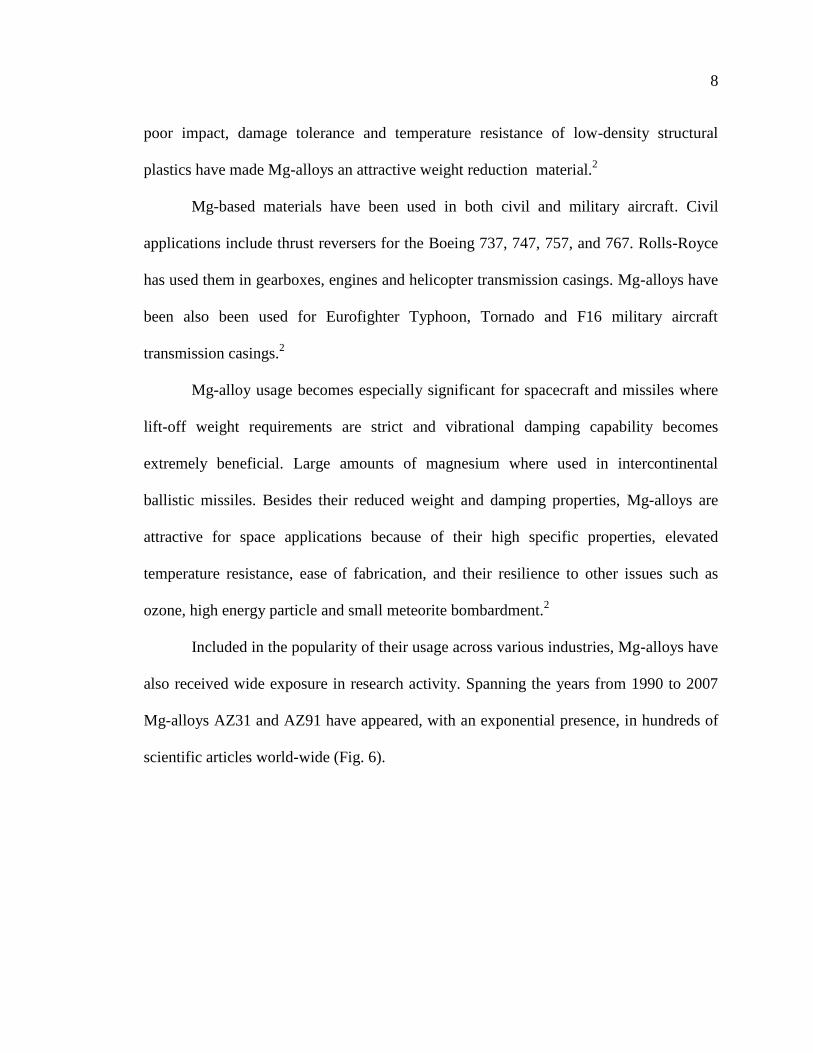
Included in the popularity of their usage across various industries, Mg-alloys have
also received wide exposure in research activity. Spanning the years from 1990 to 2007
Mg-alloys AZ31 and AZ91 have appeared, with an exponential presence, in hundreds of
scientific articles world-wide (Fig. 6).
9
Figure 6: Number of scientific articles which have terms AZ91 or AZ31 in the
abstract.7
2.3 Metal Matrix Composites
Developmental efforts on MMCs in the 1950s and early 1960s were driven by the
need to find materials that would dramatically extend structural efficiency of metallic
materials while retaining their advantages: chemical inertness, high shear strength, and
good property retention at high temperatures.8 Early work on sintered aluminum powder
was a precursor to discontinuously reinforced MMCs. Subsequent development of high-
strength monofilaments, first boron and then silicon carbide (SiC), enabled MMC
10
advancement throughout the 1960s and early 1970s.8 In the late 1960’s research on
MMCs was due to the high performance needs of the aerospace industry.9
Historically, steel-wire reinforced copper fibers were one of the first continuous-
fiber reinforced composites. These composites were used to study MMCs as a model
system9. It was during this time that performance was the main focus and cost was not the
primary concern. Soon after, boron filaments were used as the first high-strength, high-
modulus reinforcement that was developed for both MMC and organic matrix composites
(OMC).9 Processing issues associated with fiber damage, and fiber-matrix interactions
were identified and solved and new materials were realized.8 The new MMCs were
expensive with marginal reproducibility; however, their use had been incorporated into
243 structural components on the space shuttle orbiters.8 Recession in the early 1970s
spurred significant research and development funding cuts which lead to the end of MMC
discovery and development during this time.8
Development efforts were renewed on discontinuously reinforced MMCs using
SiC whisker reinforcements in the late 1970s.8 The idea of particulate reinforcement was
conceptualized due to processing issues and the high expense of whiskers.8 Particulate
reinforced MMCs provided nearly equivalent strength and stiffness, but with much lower
cost and easier processing.
Major advancement was made in the 1980s in both continuously and
discontinuously reinforced MMCs, “major efforts included particle-reinforced, whisker-
reinforced, and tow-based MMCs of aluminum, magnesium, iron, and copper for
applications in the automotive, thermal management, tribology, and aerospace
11
industries”.8 In general, MMCs possess low coefficients of thermal expansion (CTE),
high-temperature capabilities, high-specific stiffness, and high-thermal conductivity.
These MMC characteristics generated excitement and optimism in the late 1980’s for
critical space system applications.9 Monofilament-reinforced titanium MMCs were
subsequently developed for high-temperature aeronautical systems: critical rotating
components for advanced gas turbine engines and structures for high-mach airframes.8
Although these materials were successfully inserted into specialty applications, they did
not receive sufficient advertisement which prohibited a strong global impact of MMC
technology awareness.8
A U.S. Air Force Title III program provided a significant investment to establish
an MMC technology for the aerospace industry in the 1990s.8 The U.S. Air Force Title III
program inspired the production of several commercial aerospace and landmark military
applications of discontinuously reinforced aluminum.8 Additionally, new MMCs applied
to ground transportation, industrial, and thermal management/electronic packaging
industries experienced growth that rivaled that of the aerospace industry.8 The MMC
market for thermal management and electronic packaging was five times larger than the
aerospace market in 1999. This technology gap was expected to increase through 2005
due to accelerated growth in ground transportation and thermal management markets.8
2.4 Composite Matrix
The composite matrix’s cohesive and adhesive characteristics serve to bind the
reinforcement phase together, to transfer load to and between reinforcements, and to
protect the reinforcement phase from environments and handling.8 The matrix also
12
provides a solid form to the composite, which allows a production part to be machined or
finished in a stable manner. This is particularly necessary in discontinuously reinforced
composites; the reinforcement phase is typically very fragile and is not able to maintain
mechanical integrity for handling. From a structural perspective, since the reinforcement
phase is stronger and stiffer, the matrix is often referred to as the composite’s “weak
link”.8 Due to its continuous nature, the matrix controls the transverse properties,
interlaminar strength, and elevated-temperature strength of the composite.8 The matrix
also allows the reinforcement phase to be used to its maximum potential strength by
enabling loads to effectively transfer from external forces to the reinforcement.8
In fiber reinforced MMCs, the matrix holds fibers in the proper orientation and
position allowing intended loads to be carried and distributed evenly among the
reinforcement phase.8 Importantly, the matrix inherently provides an inelastic response
which dramatically reduces stress concentrations and redistributes internal stresses from
broken reinforcements.8
2.5 Composite Reinforcement
Low cost and readily available abrasive-grade ceramic grit is typical as the MMC
particulate reinforcement. SiC, alumina, and boron carbide particles are used most often.8
Titanium carbide (TiC) is commonly used for iron and titanium alloy matrices while SiC
offers the best strength and stiffness for aluminum matrices.8 “Green” SiC provides better
strength and thermal conductivity than “black” SiC.8 Alumina is slightly denser than SiC,
has a higher CTE, and is more chemically stable than SiC in molten aluminum.8
13
The usage of various reinforcements has been aimed at improving mechanical
properties. Nanotubes, ceramic particles, whiskers and fibers have been used as
reinforcement agents throughout the history of composite development.10-12
Many
different types of fibers have been used over the course of composite manufacturing
history: oxide and non-oxide type fibers such as alumina13
and silicon carbide,
respectively, tungsten or carbon substrate fibers coated with boron or silicon carbide via
chemical vapor deposition, and pitch based precursors such as ployacrylonitrile (PAN)
used for deriving carbon fibers.14
Complex fibers, such as Nicalon which consist of -
SiC crystals mixed with free carbon having a composition of SiCxOy, with x + y being
equal to four, were also used in attempts to create better composites.14
2.6 MMC Processing
MMCs have been fabricated using various processing techniques such as molten
metal (rheo, compo, stir, or squeeze casting and various MI procedures), as well as
powder metallurgy.15,16
Carbon fiber was found to have degraded fiber-strength and poor
wettability in molten Al alloys and their use was therefore limited to reinforcing OMC.9
Due to this fact, MMC processing was directed towards sintering and diffusion based
bonding9; giving rise to more popular processes such as melt infiltration (MI) and
vacuum hot pressing.
MI techniques have become very popular due to their simplicity, cost-
effectiveness, near-net shaping, homogeneous distribution of particulate reinforcement
within the matrix, and easy engineering of the volumetric fraction of ceramic
reinforcement products between 35 and 70 volume percent.15
Today, the most
14
sophisticated material systems utilizing complex processing methods produce CMCs for
high-temperature ultra-performance applications such as GE Aviation’s new jet engine
turbine blades. Recently, GE aviation invested $100 million dollars for a jet engine
assembly facility in Lafayette, Indiana17 based on this new generation of CMCs;
composites are big business.
2.7 Previous Work: MMC
The properties of composites are critically dependent on the strengths between the
matrices and reinforcing interfaces. Strong interfacial bonds are desirable as weak
interfaces may fail prior to any load transferring across the matrix and reinforcement
boundary. Weak interfaces may even reduce the overall matrix strength.18
In a recent study, two binary carbides were used to reinforce Mg-matrix
composites: SiC and TiC. Magnesium has a strong affinity to wet SiC and therefore a
strong, or even partially bonded, interface forms. Magnesium silicide (Mg2Si) has been
detected by X-ray diffraction (XRD) and has been previously reported as the result of a
reaction between Mg and SiC.19,20
In general, the Mg2Si reaction particles are small and
are not detected by SEM.19-22
In contrary to the Mg-SiC reaction, Mg and TiC do not
react; no Mg-Ti intermetallics exist.23,24
Additionally, it is known that MgC2 forms between 400 ºC and 600 ºC 25
and
becomes unstable at 680 ºC.26
At temperatures of 500 ºC to 700 ºC, the bicarbide
converts to sesquicarbide (Mg2C3) and at 600 ºC Mg2C3 decomposes into elemental Mg
and carbon; the decomposition process becomes almost instantaneous at 800 ºC.25 This
15
suggests that the presence MgC2 and/or Mg2C3 must be limited in SiC/Mg or TiC/Mg
composites because the MI temperatures are typically 750 ºC to 850 ºC.
Wetting phenomena of Mg and Al on TiC substrates was explored using the
sessile drop technique.24
A contact angle of ~120º was reported for pure Mg on TiC
substrates at 850 ºC. The contact angle was reduced to a minimum of 90º when the
temperature was held at 850 ºC for 30 minutes. Holding this temperature for longer
durations did not decrease the contact angle.24
The same experiment was repeated using
pure Al on TiC substrates.
The initial results of Al on TiC were similar to those of Mg on TiC. However,
after 90 minutes at 850 ºC, the contact angle was reduced to ~ 50º, suggesting that
Al-containing Mg alloys may lead to improved wettability and more robust interfaces in
TiC/Mg composites. It is worth noting that improved interface wettability stemming from
Al-containing Mg alloys may not solely be the result of a chemical reaction with TiC. 26
For example, it has been shown that TiC/AZ91 composites can be synthesized via in situ
reactive infiltration of AZ91 into an elemental mix of Ti and C, forming TiC as the only
reaction product. 27-29
MI has been used previously to synthesize Mg matrix composites with high
volume fractions of reinforcements. TiC/Mg composites of 56 vol.% were fabricated via
MI of pure Mg into porous TiC preforms.23
TiC/Mg composite samples were synthesized
under flowing Ar and temperatures of 850 ºC, 900 ºC and 950 ºC. Increasing the
infiltration temperature resulted in increases in elastic moduli, ultimate tensile strength
(UTS), and Vickers hardness from 123 to 136 GPa, 172 to 233 MPa and 183-191 to 205-
16
212, respectively.23
The improvement in mechanical properties with increasing
temperatures was related to Mg’s better wettability at higher temperatures. It was also
noted that matrix voiding and interfacial de-cohesion followed by growth and
coalescence of micro-voids, generated during maximum loading, were found to be the
major failure mechanism of the composites.23
In a similar study, 42.1 vol.% TiC/AZ91 composites were fabricated via in situ
reactive infiltration at 800 ºC of AZ91 into TiC preforms, which were synthesized from
elementally mixed Ti and C powders. These composites were reported to have a UTS of
~ 204 MPa, which was an increase of 16.2% from the AZ91 alloy without
reinforcement.27
At elevated temperatures (723 K) the UTS of the TiC/AZ91 composite
was ~ 95 MPa; 180 % stronger than AZ91 alone. The failure mechanism for these
composites originated from interface de-bonding27
, which mirrors Contreras et al.’s study
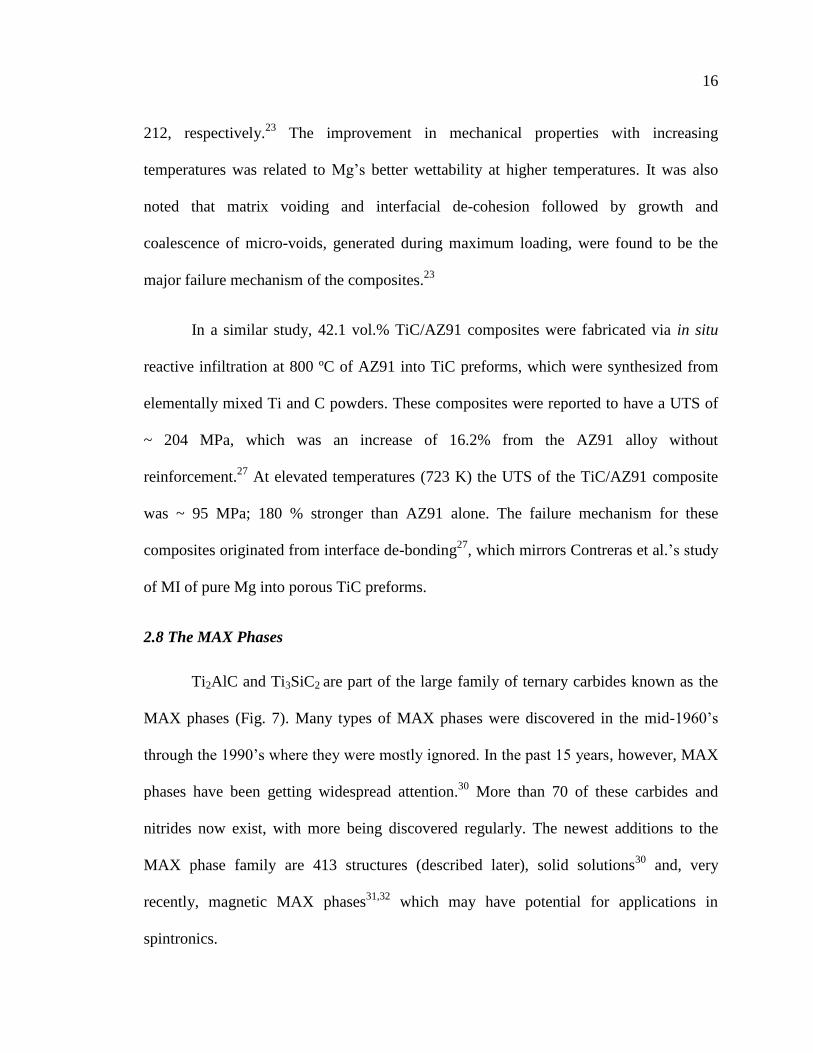
of MI of pure Mg into porous TiC preforms.
2.8 The MAX Phases
Ti2AlC and Ti3SiC2 are part of the large family of ternary carbides known as the
MAX phases (Fig. 7). Many types of MAX phases were discovered in the mid-1960’s
through the 1990’s where they were mostly ignored. In the past 15 years, however, MAX
phases have been getting widespread attention.30
More than 70 of these carbides and
nitrides now exist, with more being discovered regularly. The newest additions to the
MAX phase family are 413 structures (described later), solid solutions30
and, very
recently, magnetic MAX phases31,32
which may have potential for applications in
spintronics.
17
Figure 7: Majority of the currently known MAX phases.33
18
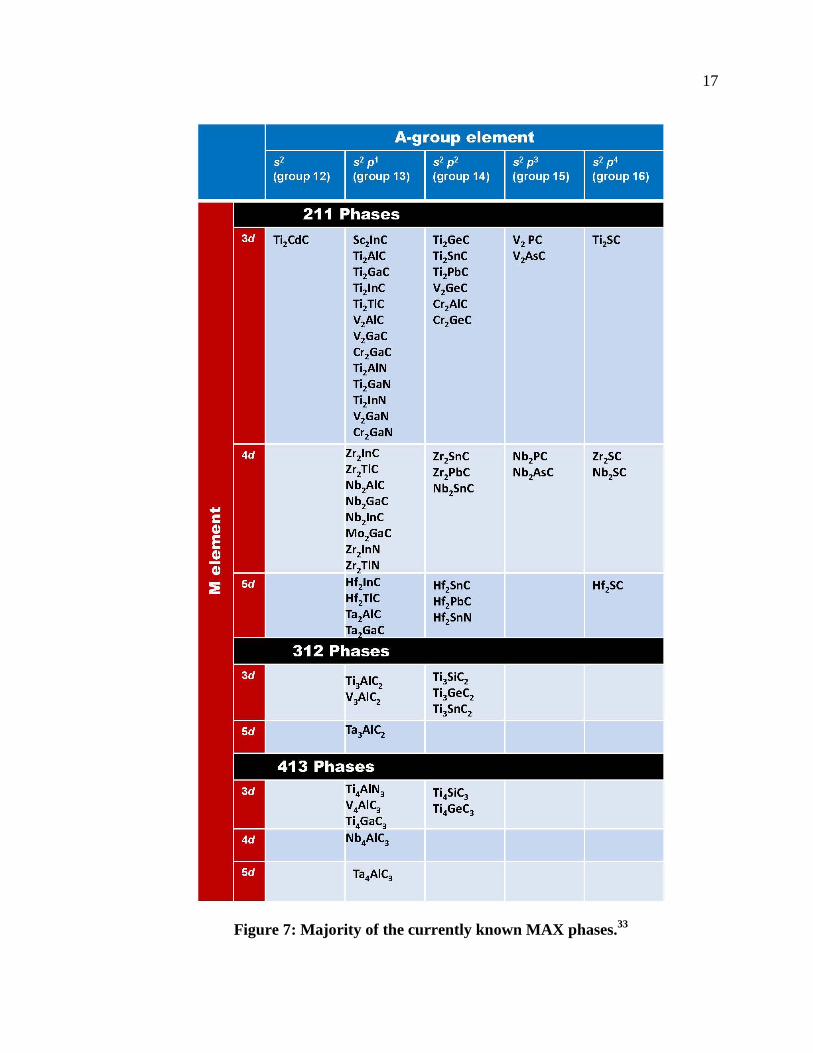
The M, A, and X groups which react to form MAX phases represent three groups
on the periodic table of elements (Fig. 8). The MAX phases are layered, hexagonal, early-
transition metal carbides and nitrides with a general formula, Mn+1AXn,where n = 1, 2, 3,
etc.; M is an early transition metal, A is an A-group element (mostly groups 13 and 14)
and X represents either carbon and/or nitrogen.30
Figure 8: Elements of the periodic table that react to from MAX phases.30
In each MAX phase, near-close packed M layers are interleaved with layers of the
pure group-A element, and the X atoms fill octahedral sites between M atoms. These
octahedrally coordinated M6X clusters are edge sharing and are identical to those found
in the rock salt structure.30
At the center of trigonal prisms, that are larger than the M6X
octahedra, the A-group elements have more space and are accommodated there.
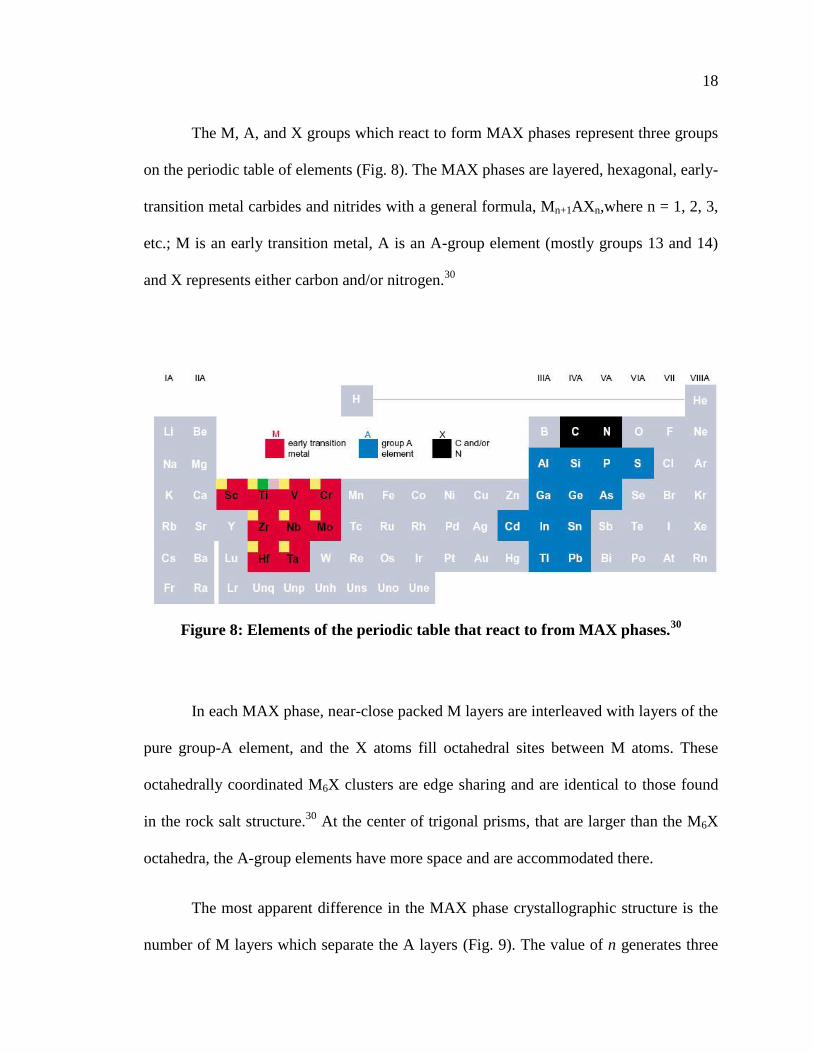
The most apparent difference in the MAX phase crystallographic structure is the
number of M layers which separate the A layers (Fig. 9). The value of n generates three
19
most common MAX crystal structures: M2AX, M3AX2, M4AX3 where there are two,
three and four M layers separating the A layers. These structures are also known as 211,
312 and 413, respectively, with the majority of MAX phases being of the 211 structure.30
Figure 9: The unit cells of the 211, 312 and 413 crystal structures each showing its
respective c-lattice parameter.34
The MAX phases set themselves apart as unique materials by bridging a
combination of properties that are typical of ceramics and metals. Like metals, most
MAX phases are readily machinable, electrically and thermally conductive, plastic at
high temperatures, highly damage tolerant and resistant to thermal shock.26,30
For
c c
c
20
example, Ti3SiC2 was so resistant to thermal shock that quenching in water from 1400 ºC
caused a slight increase to its flexural strength when in comparison to unquenched
samples.30
Some MAX phases compare with ceramics in that they are elastically rigid
(Young’s Moduli > 300 GPa), lightweight (~4 to ~5 Mg/m3), are oxidation resistant and
maintain their mechanical strengths to higher temperatures. Ti2AlC is also creep, fatigue
and oxidation resistant.26
Cr2AlC has become a material of interest due to its excellent
oxidation resistance and high CTE; NASA has ongoing work with hopes that it has
potential for applications in thermal barrier protective coatings.
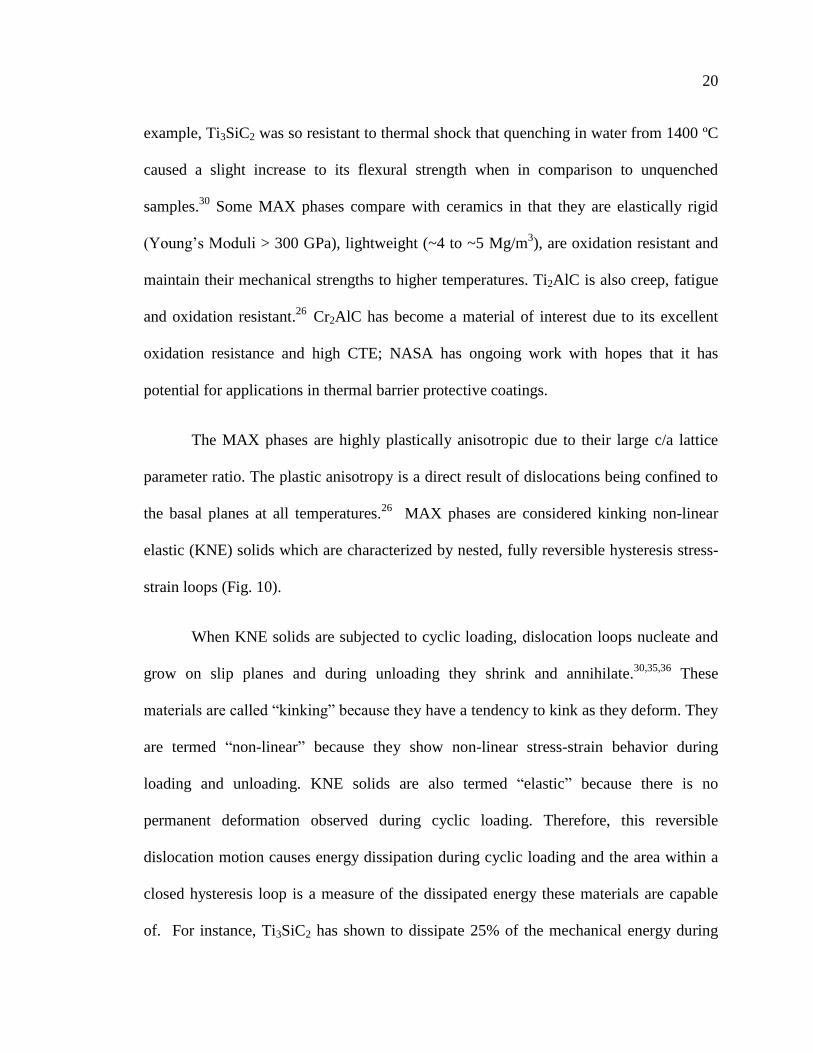
The MAX phases are highly plastically anisotropic due to their large c/a lattice
parameter ratio. The plastic anisotropy is a direct result of dislocations being confined to
the basal planes at all temperatures.26
MAX phases are considered kinking non-linear
elastic (KNE) solids which are characterized by nested, fully reversible hysteresis stress-
strain loops (Fig. 10).
When KNE solids are subjected to cyclic loading, dislocation loops nucleate and
grow on slip planes and during unloading they shrink and annihilate.30,35,36
These
materials are called “kinking” because they have a tendency to kink as they deform. They
are termed “non-linear” because they show non-linear stress-strain behavior during
loading and unloading. KNE solids are also termed “elastic” because there is no
permanent deformation observed during cyclic loading. Therefore, this reversible
dislocation motion causes energy dissipation during cyclic loading and the area within a
closed hysteresis loop is a measure of the dissipated energy these materials are capable
of. For instance, Ti3SiC2 has shown to dissipate 25% of the mechanical energy during
21
high stress (1 GPa) cyclical loading.35
As a result of this behavior, MAX phases are of
special interest for cyclic compressive applications.
Figure 10: Nested hysteresis loops in a stress strain curve showing tell-tale signs of
energy dissipation (A); dislocation loops which open and close during loading and
unloading (B); kinking material under stress (C); non-linear stress-strain behavior
which exhibits elasticity and no deformation (D).
2.9 Previous Work on MAX/Mg-Alloy Composites
More recent studies have taken advantage of MAX phases as the reinforcement
phase in MMCs. Pressureless MI of Mg into ~ 50 vol.% porous Ti2AlC preforms, leading
to the synthesis of Ti2AlC/Mg composites with excellent mechanical properties and good
dampening capability, was first fabricated by Amini et al. 37
The Ti2AlC (50 vol.%)/Mg
A B
C
D
22
composites have ultimate compression strength (UCS) and UTS of 700 10 and 345 40
MPa, respectively. The reported mechanical properties for the Ti2AlC (50 vol.%)/Mg
composites were higher than those reported for Ti3SiC2 (50 vol.%)/Mg and SiC (50
vol.%)/Mg composites. The Ti2AlC composites system also exhibited ultra-high damping
while being light (2.9g/cm3).
38 The Ti2AlC (50 vol.%)/Mg composite’s high mechanical
properties were attributed to the presence of nanocrystalline Mg grains within the
composite matrix as characterized by TEM.38
More current work by Anasori et al has shown Ti2AlC/Mg-alloy and TiC/Mg-
alloy composites to result with excellent mechanical properties. This work studied the
effect of the Al wt. % content in the composites matrix and the effect of coarse and fine
MAX phase reinforcement particle grain size. Maximum yield strengths (YSs) of 426 5
and 768 11 MPa were reported for the fine grained (FG) FG-Ti2AlC/AZ61 and FG-
TiC/AZ91 composites, respectively. Maximum UCSs of 773 and 1028 5 MPa were
reported for the FG-Ti2AlC/AZ31 and FG-TiC/AZ61 composites, respectively.26
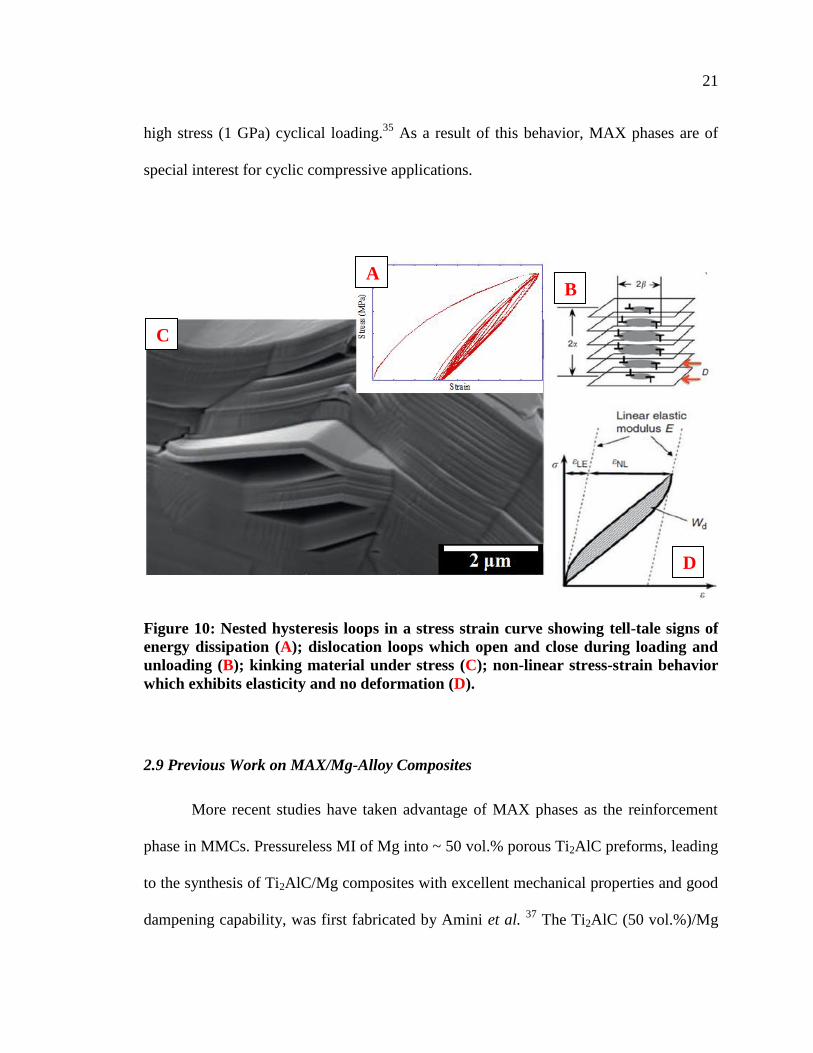
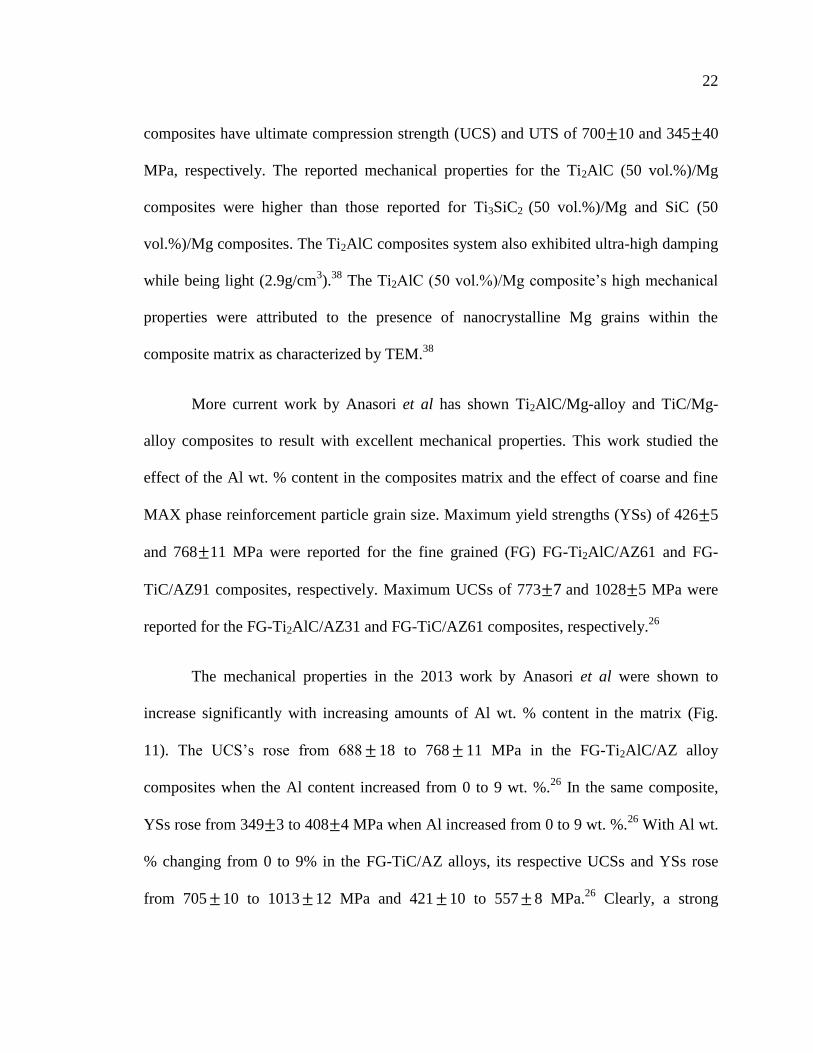
The mechanical properties in the 2013 work by Anasori et al were shown to
increase significantly with increasing amounts of Al wt. % content in the matrix (Fig.
11). The UCS’s rose from 688 18 to 768 11 MPa in the FG-Ti2AlC/AZ alloy
composites when the Al content increased from 0 to 9 wt. %.26
In the same composite,
YSs rose from 349 3 to 408 4 MPa when Al increased from 0 to 9 wt. %.26
With Al wt.
% changing from 0 to 9% in the FG-TiC/AZ alloys, its respective UCSs and YSs rose
from 705 10 to 1013 12 MPa and 421 10 to 557 8 MPa.26
Clearly, a strong
23
correlation between increasing mechanical properties and additions of Al wt. % in the
matrix exists.
Figure 11: YS and UCS results from Anasori et al's work on fine and coarse
reinforcement particle grain size MMCs.26
2.10 Objective of this Work
Coupling the evidence that Mg shows promise by being light weight with
exceptional damping capability, and that Al has been reported to promote stronger
interfaces in these composites, the AZ series Al-containing Mg-alloys were selected as
the matrix materials. Furthermore, previous work has shown Al-containing Mg-alloys to
have better mechanical properties in composites than pure Mg as the matrix.
Additionally, the AZ series alloys were chosen because they are commercially available
and popular in scientific literature.
24
MAX phases were chosen for two reasons: 1) previous work has shown increased
mechanical strengths with their use; 2) ease of machinability in comparison to SiC or
TiC. Therefore, it was desirable to consider alternative MAX phase reinforcements which
appeared attractive for this work. To most effectively probe the intriguing mechanical
phenomena at hand, careful consideration of MAX phases with different M-element and
A-group element MAX constituents other than Ti and Al, respectively, were selected to
be explored.
In Amini et al’s study, the UCS for Ti2AlC/Mg composites were reported at
700 10 MPa; higher in comparison to the UCS from the SiC/Mg and Ti3SiC2/Mg
composites reported at 500 25 MPa and 460 10 MPa, respectively.37
Although the
preliminary work on the Ti3SiC2/Mg composite has shown lower mechanical properties,
the Ti3SiC2 reinforcement showed promise strong enough for its consideration in this
work. Using Ti3SiC2 instead of Ti2AlC effectively changes the A-group element to Si
from Al. Additionally, Ti3SiC2 powder was chosen because it is commercially available
and quite stiff.39
It was an attractive idea to replace Ti with Cr as the M-element. Therefore,
Cr2AlC was chosen. Cr2AlC has a relatively high CTE (1.3X10⁻⁵
K-1
)40
when compared
to most other MAX phase cousins. Cr2AlC’s CTE is much closer to that of Mg’s
(2.6X10⁻⁵
K-1
) and it is thought that by using a MAX phase with a CTE, closer to the
CTE of Mg, there will be less interface mismatch resulting in less interfacial residual
strain. It is hypothesized that Cr2AlC/Mg-alloy composites may experience less issues
during elevated temperature environments. Because of these reasons, coupled with the
25
argument that no existing work regarding Cr2AlC/Mg-alloy composites is known of,
Cr2AlC was an appropriate choice.
Considering the choice of these materials and the direction paved by the previous
work, the objective for this work was been clearly defined: exploit melt infiltration of
Mg-alloys into porous MAX phase carbide preforms as an approach to develop advanced
materials which show promise to satisfy the stringent demands of the military and various
industrial sectors. This research on MAX phase/Mg-alloy composites is promising
because of their higher strengths and stiffness values, lighter weights and ease of
machinability. The primary goal of this work was to explore two new composite systems
that have never have been fabricated before. The hope of this work was to lessen the
amount of time necessary to identify and create new materials which satisfy the ever
increasing demands on a broad sector of industries. Additionally, it was hoped that this
work would shed light upon a deeper understanding between the connection of
mechanical properties and the MAX phase reinforcement particle’s interaction with the
Mg-alloy matrix.
26
3. Materials
3.1 Composite Matrix: Mg and Mg-alloys
This work is based on the following composites, all of which were at a matrix
loading of ~45 vol. %: Ti3SiC2/Mg, Ti3SiC2/AZ31, Ti3SiC2/AZ61, Ti3SiC2/AZ91,
Cr2AlC/Mg, Cr2AlC/AZ31, Cr2AlC/AZ61, Cr2AlC/AZ91. Pure Mg (99.8% pure), AZ31B
(3 wt.% Al, 1 wt.% Zn) both purchased from Alfa Aesar (Ward Hill, MA) and AZ61L (6
wt.% Al, 1 wt.% Zn, low Mn) and AZ91D (9 wt.% Al, 1 wt.% Zn) both supplied by
Thixomat (Livonia, MI) were used.
3.2 Composite Reinforcement: MAX phases
Powder Ti3SiC2 was purchased (Kanthal, Sweden). The Cr2AlC powders were
synthesized in-house. The Cr2AlC powder was synthesized starting with Cr powder (Alfa
Aesar, -325 mesh, 99% pure, stock # 10148) Al powder (Alfa Aesar, -325 mesh, 99.5%
pure, Stock # 11067), and graphite powder (Alfa Aesar, -300 mesh, 99.0% pure, stock #
10129).
27
4. Processing & Experimental Methods
4.1 Preparation of Carbide Powders
Approximately 500 g of the as-received -325 mesh Ti3SiC2 powder was placed
into a 500 mL plastic bottle (US Plastic, Lima, OH.) along with ~25 10 mm zirconia
milling balls (Inframat® Advanced Materials, Manchester, CT.). The 500 mL bottle was
capped and placed into a ball milling container and was subsequently milled for ~ 24 h at
60 rpm. The mixed powders were subsequently sieved and ball milling/sieving was
repeated until ~ 400 g of - 400 mesh powder was created to synthesize all four Ti3SiC2
reinforced MMC’s.
The Cr2AlC powder was synthesized by mixing elemental powders in the molar
ratio 2:1.1:1. The weight percentages used were: Cr (71.38%), Al (20.37%), C (8.24%).
Approximately 500 g of elemental powder was ball milled for ~24 h at 60 rpm using ~ 25
10 mm zirconia milling balls. The ball milled elemental powder was placed into a flat
bottomed cylindrical alumina crucible (AdValue Technology, Tucson, AZ) with inner
(I.D.) and outer diameters (O.D.) and height of 66, 74 and 150 mm, respectively. The
crucible was capped with a circular alumina lid of diameter ~ 80 mm and was placed into
a graphite heated, vacuum-atmosphere hot press (HP) (Series 3600, Centorr Vacuum
Industries, Somerville, MA). Subsequently, the crucible was heated at a rate of 300 °C/h
until 1400 °C where it was held at that temperature for 1 h. The furnace was cooled at
500 °C/h to ambient temperatures.
28
In making powders, it is important to keep the heating rate low. Too fast of a
heating rate can cause a self-propagating high temperature reaction – i.e. the powders
ignite. In extreme cases, this run away reaction can cause damage to laboratory
equipment. The heating rates also depended on the amount of material being reacted. For
450 g, 600 g and 700 g batches of elemental powders the heating rates were, 300 °C/h,
125 °C/h and 100 °C/h, respectively. The flat bottomed cylindrical alumina crucible with
inner and outer diameters and height of 66, 74 and 150 mm, respectively, was used.
Powder bed heights corresponding to the 450 g, 600 g and 700 g batches of elemental
powders were ~ 67, 90, and 105 mm, respectively. These heating rates resulted in the
production of high purity Cr2AlC bricks. The bricks were milled into a fine powder using
a semi-automated milling machine (Bridgeport Machines Inc., Brigdeport, CT.) equipped
with a 7.62 cm diameter shell-inserted tungsten carbide mill that swept across the MAX
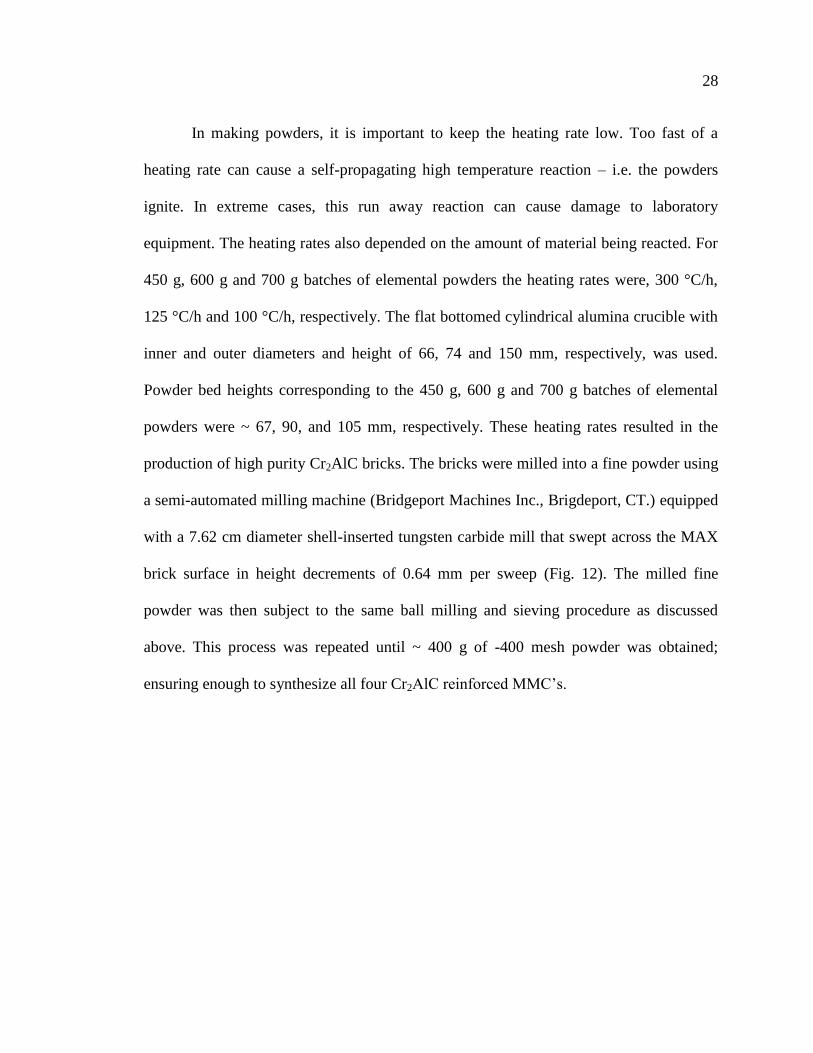
brick surface in height decrements of 0.64 mm per sweep (Fig. 12). The milled fine
powder was then subject to the same ball milling and sieving procedure as discussed
above. This process was repeated until ~ 400 g of -400 mesh powder was obtained;
ensuring enough to synthesize all four Cr2AlC reinforced MMC’s.
29
Figure 12: 7.62 cm diameter shell-inserted tungsten carbide mill
4.2 Preparation of Carbide Preforms
Porous Ti3SiC2 (54 ±1 vol. % dense) and Cr2AlC (55 ±1 vol. % dense) preforms
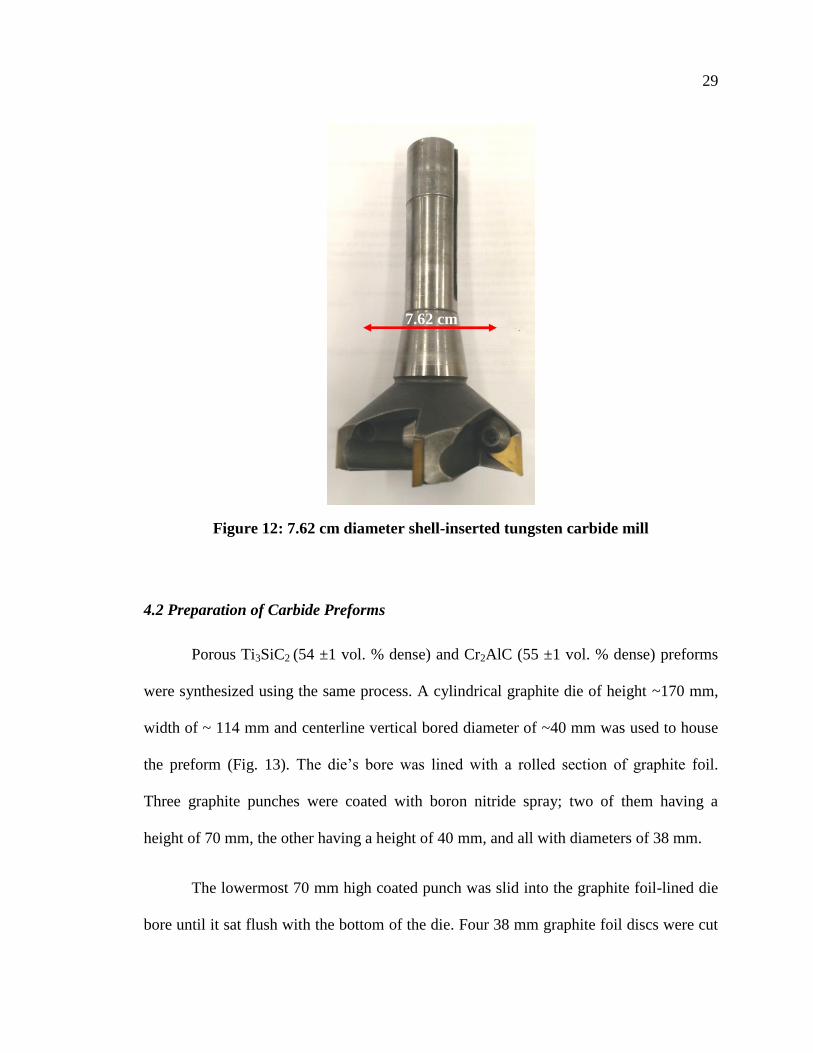
were synthesized using the same process. A cylindrical graphite die of height ~170 mm,
width of ~ 114 mm and centerline vertical bored diameter of ~40 mm was used to house
the preform (Fig. 13). The die’s bore was lined with a rolled section of graphite foil.
Three graphite punches were coated with boron nitride spray; two of them having a
height of 70 mm, the other having a height of 40 mm, and all with diameters of 38 mm.
The lowermost 70 mm high coated punch was slid into the graphite foil-lined die
bore until it sat flush with the bottom of the die. Four 38 mm graphite foil discs were cut
7.62 cm
30
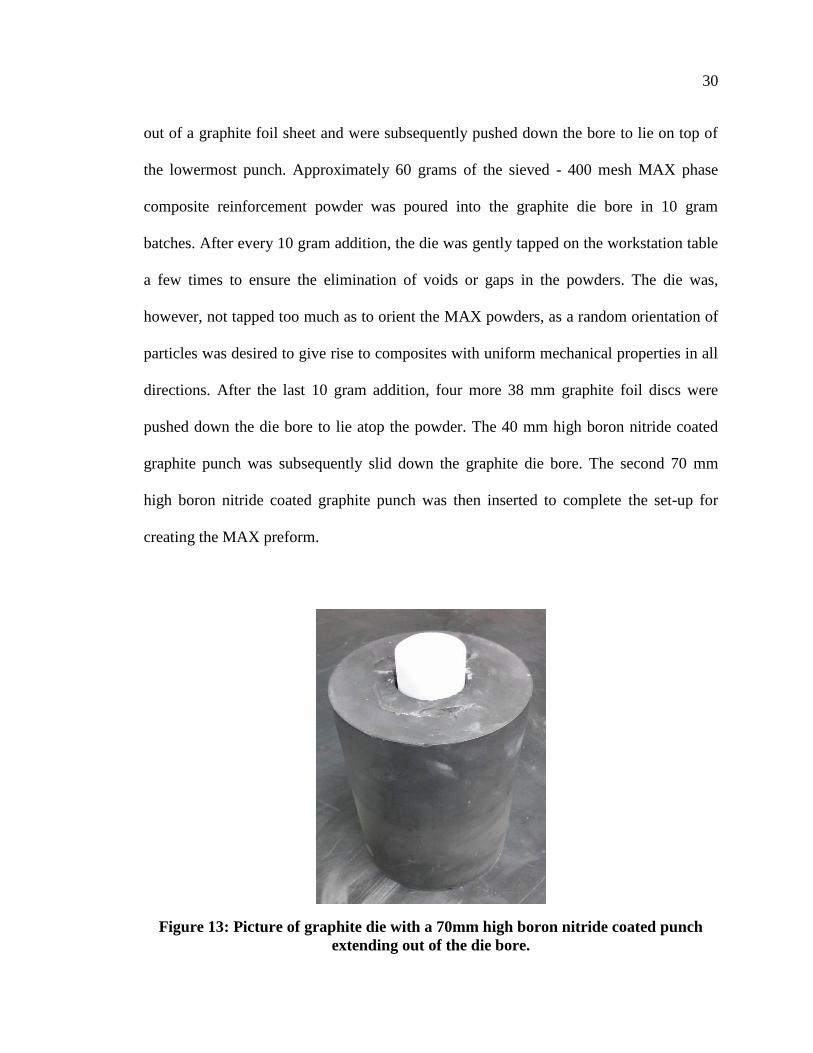
out of a graphite foil sheet and were subsequently pushed down the bore to lie on top of
the lowermost punch. Approximately 60 grams of the sieved - 400 mesh MAX phase
composite reinforcement powder was poured into the graphite die bore in 10 gram
batches. After every 10 gram addition, the die was gently tapped on the workstation table
a few times to ensure the elimination of voids or gaps in the powders. The die was,
however, not tapped too much as to orient the MAX powders, as a random orientation of
particles was desired to give rise to composites with uniform mechanical properties in all
directions. After the last 10 gram addition, four more 38 mm graphite foil discs were
pushed down the die bore to lie atop the powder. The 40 mm high boron nitride coated
graphite punch was subsequently slid down the graphite die bore. The second 70 mm
high boron nitride coated graphite punch was then inserted to complete the set-up for
creating the MAX preform.
Figure 13: Picture of graphite die with a 70mm high boron nitride coated punch
extending out of the die bore.
31
Once the die was prepped, it was placed in the HP. To synthesize Ti3SiC2
preforms, the HP was heated to 1100 °C, at a rate of 500 °C/h, and held at 1100 °C for
one hour. The application of pressure was programmed to ramp-up with loads
corresponding to a rate of ≈ 70 MPa per hour starting at approximately 900 °C, reaching
a maximum pressure of 13.8 MPa and holding this pressure throughout the peak
temperature holding time. The addition of pressure results in green-bodies with enhanced
strengths that are needed to prevent fracture during MI. This program produced porous
Ti3SiC2 (54±1 vol. % dense) preforms with heights and diameters of ≈ 18 mm and 38
mm, respectively. The density of a sintered preform was found by measuring the mass on
a calibrated scale and the height and diameter with a caliper to calculate the volume. Four
preforms were made and measured to get find the average and standard deviation.
To synthesize Cr2AlC preforms, the HP was heated to 900 °C at a rate of 500 °C/h
and held at 900 °C for one hour. This procedure produced porous Cr2AlC (55±1 vol. %
dense) preforms with heights and diameters of ≈ 18 mm and 38 mm, respectively.
Because no pressure was used to synthesize the Cr2AlC preforms, the sintered green
bodies were more fragile and careful handling was required during subsequent processing
steps.
Both HP programs were operated under ~10 Pa vacuum, and had a cooling rate of
500 °C/h. After the samples were relatively cool, the HP was turned off. A controlled and
slow cooling rate from peak temperature for the first few hours is important to let the
material relax; not shocking the sintered green-body preforms.
32
It should be mentioned that the composites synthesized herein will henceforth be
labeled according to the following convention: MAX phase reinforcement type/( MAX
phase reinforcement volume % density)/Matrix. For example, the 55 vol. % Cr2AlC/Mg
composite will be referred to as Cr/55/Mg; the 54 vol. % Ti3SiC2/AZ91 composite will be
referred to as Ti/54/91, etc.
One of the findings of this work is that the green body relative density is an
important factor which can have quite an effect on the mechanical properties in these
materials, as will be discussed and shown later.
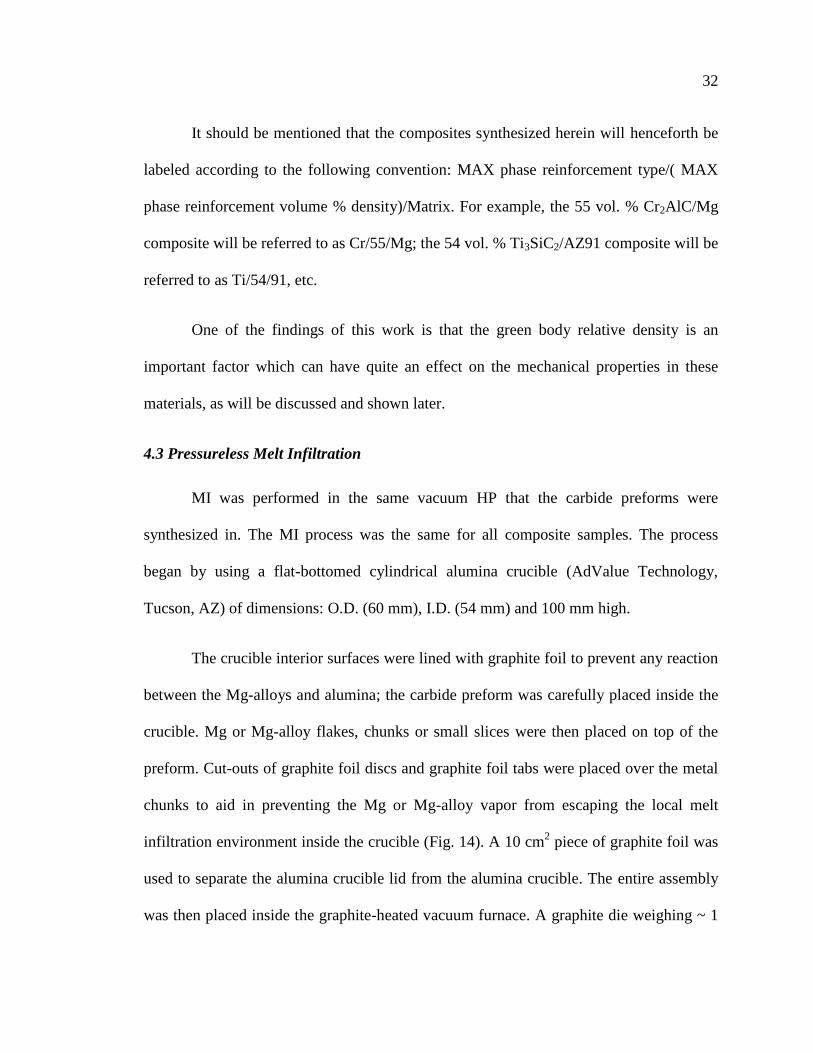
4.3 Pressureless Melt Infiltration
MI was performed in the same vacuum HP that the carbide preforms were
synthesized in. The MI process was the same for all composite samples. The process
began by using a flat-bottomed cylindrical alumina crucible (AdValue Technology,
Tucson, AZ) of dimensions: O.D. (60 mm), I.D. (54 mm) and 100 mm high.
The crucible interior surfaces were lined with graphite foil to prevent any reaction
between the Mg-alloys and alumina; the carbide preform was carefully placed inside the
crucible. Mg or Mg-alloy flakes, chunks or small slices were then placed on top of the
preform. Cut-outs of graphite foil discs and graphite foil tabs were placed over the metal
chunks to aid in preventing the Mg or Mg-alloy vapor from escaping the local melt
infiltration environment inside the crucible (Fig. 14). A 10 cm2 piece of graphite foil was
used to separate the alumina crucible lid from the alumina crucible. The entire assembly
was then placed inside the graphite-heated vacuum furnace. A graphite die weighing ~ 1
33
kg was put on top of the crucible lid and the HP hydraulic ram was lowered to put
pressure on the lid. This was done to ensure a reduced loss of Mg or Mg-alloy vapor. The
vacuum furnace door was closed and locked; vacuum was pulled until ~ 10 Pa pressure
was reached.
Figure 14: MI prep schematic and actual set-up.
The HP was heated at a rate of 500 °C/h to 750 °C and held at that temperature
for 1.5 h before the cooling sequence began at 500 °C/hl. The high vapor pressure of Mg,
or Mg-alloys, resulted in metal condensing on the graphite foil between the alumina
crucible lid and walls creating a good seal. Previously, the same procedure was
performed with no graphite foil sheet separating the crucible and its lid.26
This practice
frequently led to having to break the crucible open to extract the composite sample. The
34
purpose of the graphite foil separator allows the crucible lid to be taken off easily and
prevents having to break the crucible in order to remove the finished MMC.
4.4 MMC Sample Preparation and Archimedes’ Principle
Once the sample was removed from the crucible, any extraneous metal was
ground off (Struers Rotopol-22, Struers Rotoforce-4, Cleveland, OH) using 80 grit
sandpaper (Allied High Tech, Compton, CA.) and water. The sample was then vacuum
heat dried for one hour at ~ 140 °C. Archimedes' principle was subsequently performed
to confirm that the samples were 95 % dense or better.
To calculate the relative densities, the following densities were used: 4.52 gcm-3
and 5.24 gcm-3
, for Ti3SiC2 and Cr2AlC respectively.33
Magnesium has a density of 1.74
gcm-3
while AZ31, AZ61 and AZ91 have densities ranging from ~1.71 to ~1.81 gcm-3
,
respectively.41
Three equations were used to find composite relative densities:
ρA.P. = Mdry / (Msat – Mwet), 1
where ρA.P. is the Archimedes density, and Mdry, Msat and Mwet are the dry, saturated and
wet masses of the composite;
ρTheor. = VfMAX(ρMAX) + Vfmatrix(ρMatrix), 2
where ρTheor., ρMAX and ρMatrix are the composite’s theoretical, MAX phase, and matrix
densities, respectively. VfMAX and Vfmatrix are the respective MAX phase reinforcement
and matrix volume fractions in the composite. Lastly, the % density of the composite was
found by dividing the Archimedes and theoretical densities.
35
% Density = ρA.P. / ρTheor. 3.
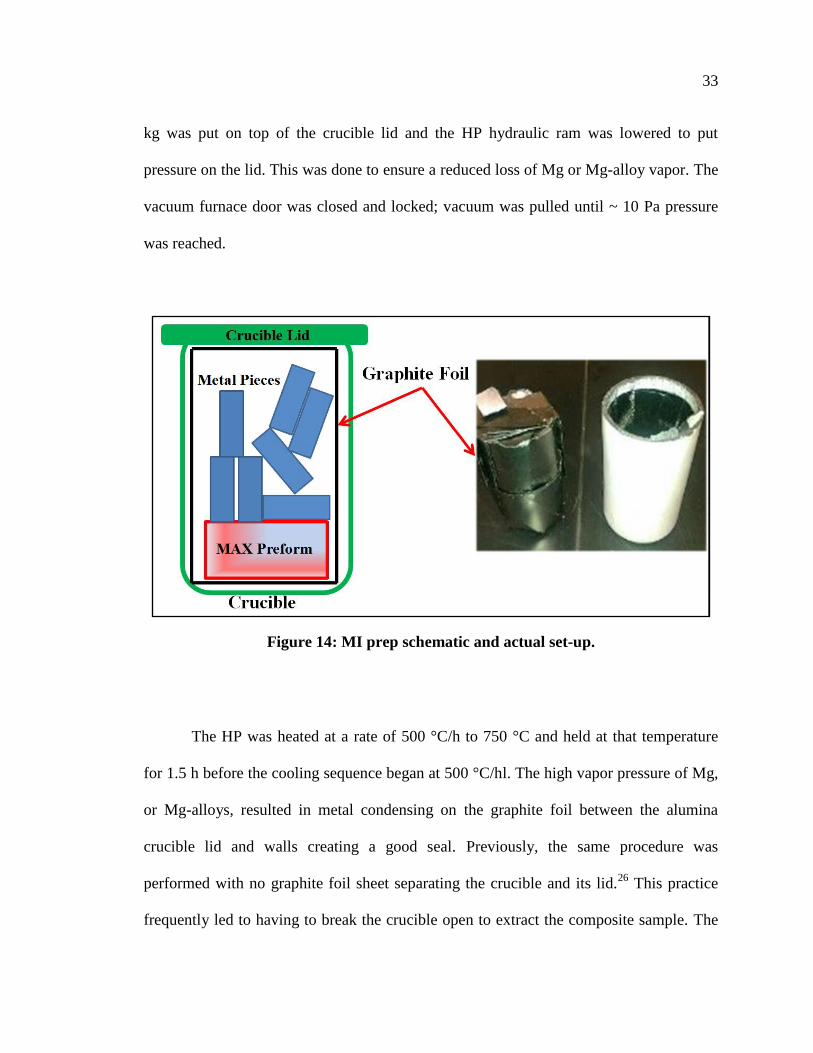
The relative densities of the composites fabricated in this work were tabulated
(Table 1). The error in the relative density is due to carried uncertainty associated with
caliper measurements on non-uniform heights and diameters used for calculating the
MAX phase preform volume % density.
Table 1: Relative density (gcm-3
) of composites fabricated in this work measured
using Archimedes' principle.
Sample Mg AZ31 AZ61 AZ91
Ti3SiC2 3.25 (99 1%) 3.29 (99 1%) 3.23 (99 1%) 3.27 (99 1%)
Cr2AlC 3.70 (99 1%) 3.64 (99 1%) 3.72 (99 1%) 3.71 (99 1%)
4.5 Microstructural Characterization
Each MMC was cross-sectioned (Struers Accutom-5, Cleveland, OH.) using a
diamond wafering blade (Allied High Tech products, #60-20080, Compton, CA.), hot
mounted (Struers LuboPress-3 Cleveland, OH.) in hard black epoxy (Allied High Tech
products, #150-10105, Compton, CA.), and subsequently polished down to a 1 μm
surface using diamond slurry (Allied High Tech, Compton, CA.). Polished surfaces were
imaged by SEM (Zeiss Supra 50VP, Germany) equipped with an energy dispersive
spectroscope (Oxford Inca X-Sight, Oxfordshire, UK).
The XRD patterns were obtained using a diffractometer (Rikagu Smartlab, Japan)
with step scans of 0.02° in the range of 5° to 80° 2-theta and a step time of 1 s, with a 10
36
mm2 window slit. Cu Kα radiation (40kV and 30mA) was used. The broad 2-theta range
was used in order to help identify any additional phases from reactions, such as
intermetallics or carbides, created during the MI process. Jade XRD pattern recognition
software (Materials Data, Inc., Livermore, CA.) was used to verify the XRD results.
4.6 Vickers Microhardness
Vickers microhardness measurements were made using a Vickers hardness
indenter (LECO Corp., St. Joseph, MI) under a 9.81 N force with a 10 s dwell period.
Ten indentations were made. These measurements were averaged and standard deviations
were found for each composite sample.
4.7 Compression Testing
Compression specimens were electro-discharge machined (EDM) from each
MMC sample. The orientation of each EDM burn can be considered as negligible since
the carbide powders were synthesized in a random orientation. Six cubes of dimension 4
mm3 for UCS testing and one cylinder with 9.7 mm diameter and 31 mm height for cyclic
compression testing were EDMd from each composite sample.
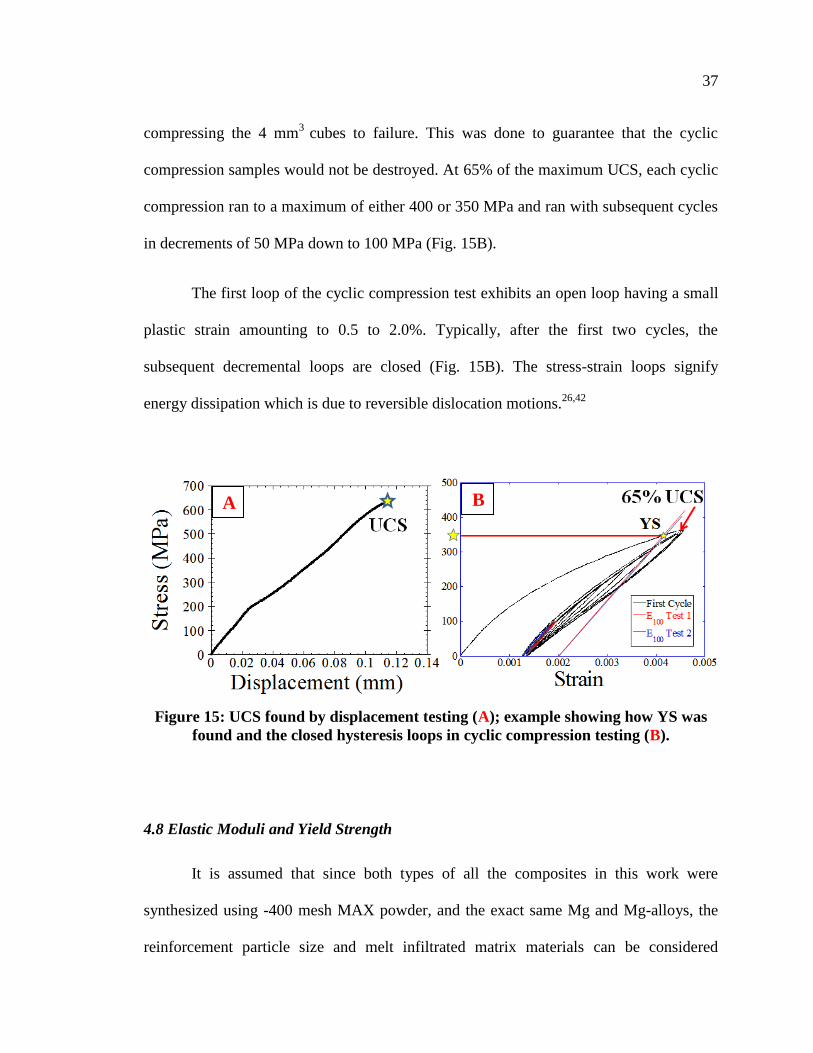
The cubes were loaded until fracture by displacement (Fig. 15A) on an
electromechanical testing machine (Instron 5600, Norwood, MA). Each EDM cylinder
was cyclically loaded in compression in order to determine yield strengths and effective
moduli. An extensometer (2620-603 Instron, 10 mm gauge length with a 10% full range)
was attached directly to the cylinder to measure strain. The starting stress for cyclic
testing was approximately 65% of the maximum UCS for each sample as determined by
37
compressing the 4 mm3
cubes to failure. This was done to guarantee that the cyclic
compression samples would not be destroyed. At 65% of the maximum UCS, each cyclic
compression ran to a maximum of either 400 or 350 MPa and ran with subsequent cycles
in decrements of 50 MPa down to 100 MPa (Fig. 15B).
The first loop of the cyclic compression test exhibits an open loop having a small
plastic strain amounting to 0.5 to 2.0%. Typically, after the first two cycles, the
subsequent decremental loops are closed (Fig. 15B). The stress-strain loops signify
energy dissipation which is due to reversible dislocation motions.26,42
Figure 15: UCS found by displacement testing (A); example showing how YS was
found and the closed hysteresis loops in cyclic compression testing (B).
4.8 Elastic Moduli and Yield Strength
It is assumed that since both types of all the composites in this work were
synthesized using -400 mesh MAX powder, and the exact same Mg and Mg-alloys, the
reinforcement particle size and melt infiltrated matrix materials can be considered
A B
38
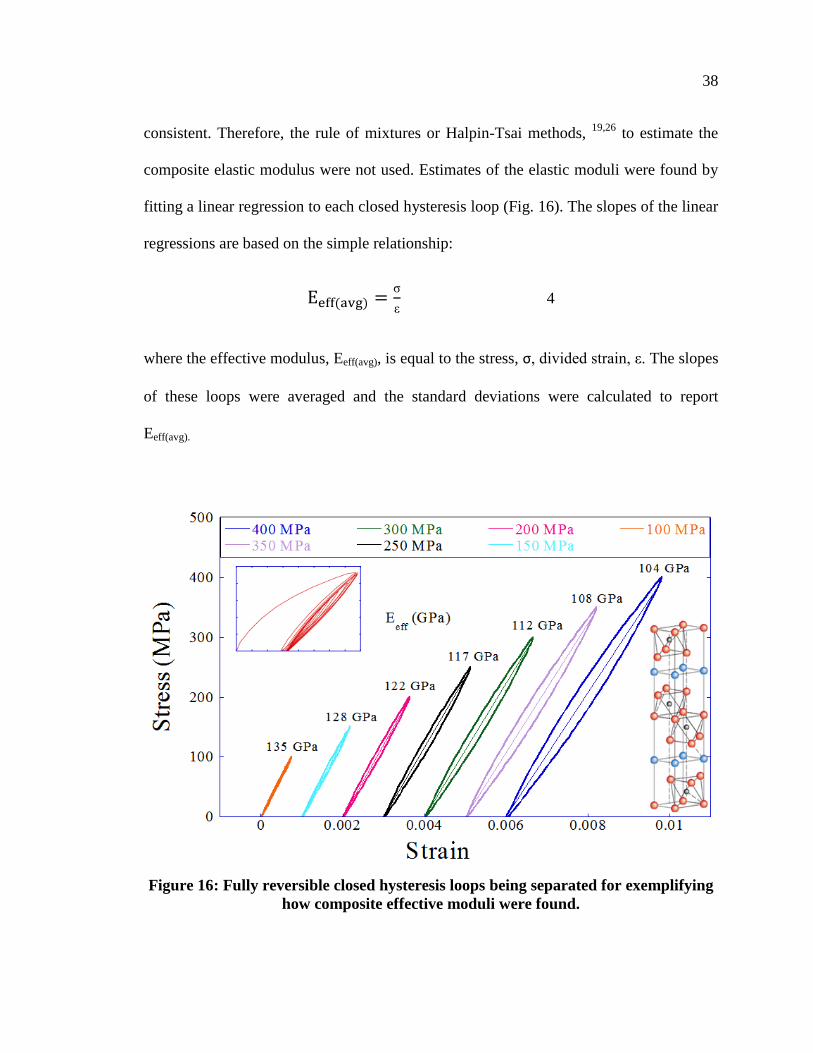
consistent. Therefore, the rule of mixtures or Halpin-Tsai methods, 19,26
to estimate the
composite elastic modulus were not used. Estimates of the elastic moduli were found by
fitting a linear regression to each closed hysteresis loop (Fig. 16). The slopes of the linear
regressions are based on the simple relationship:
4
where the effective modulus, Eeff(avg), is equal to the stress, σ, divided strain, . The slopes
of these loops were averaged and the standard deviations were calculated to report
Eeff(avg).
Figure 16: Fully reversible closed hysteresis loops being separated for exemplifying
how composite effective moduli were found.
39
Fully reversible hysteresis loops are only observed at stresses of 100 MPa or
higher; below these stresses, the stress-strain curves are linear.26
Due to kinking non-
linear elastic phenomena in the composite materials in this work, the linear elastic region
in a stress-strain curve is not identifiable. This is because dislocations begin to move,
resulting in micro-yielding, at the onset of applied stress. This eliminates any easily
identifiable linear elastic region at the beginning of the stress-strain curve. This slope of
the linear elastic region in common materials, such as metals, is taken as the materials
elastic modulus. This slope can also be transposed to 0.2% strain from where a yield
strength estimate can be found. In these micro-yielding materials, estimating YS in this
way is not possible and this is ultimately why the true moduli of these composites must
be estimated as effective moduli where the effective modulus is defined as the
combination of elastic and plastic effects in an overall stress-strain relationship service
structure.43
Due to the sensitivity of the Instron testing equipment, the slopes of the 100
MPa hysteric loops (Fig. 15B) were used as the best estimate to the true elastic modulus
and are reported as E100(avg).
Two cyclic tests were run at 65% of the maximum UCS on each composite
sample. The slope from each 100 MPa loop was transposed onto one stress strain curve at
0.2% strain (Fig. 15B). Where the slopes intersected the stress-strain curve provided the
estimate of the composite YS (Fig. 15B). Any difference between the intersections on the
stress-strain curve by the two slopes from the 100 MPa loops was used as the error
associated with the YS measurement.
40
5. Results
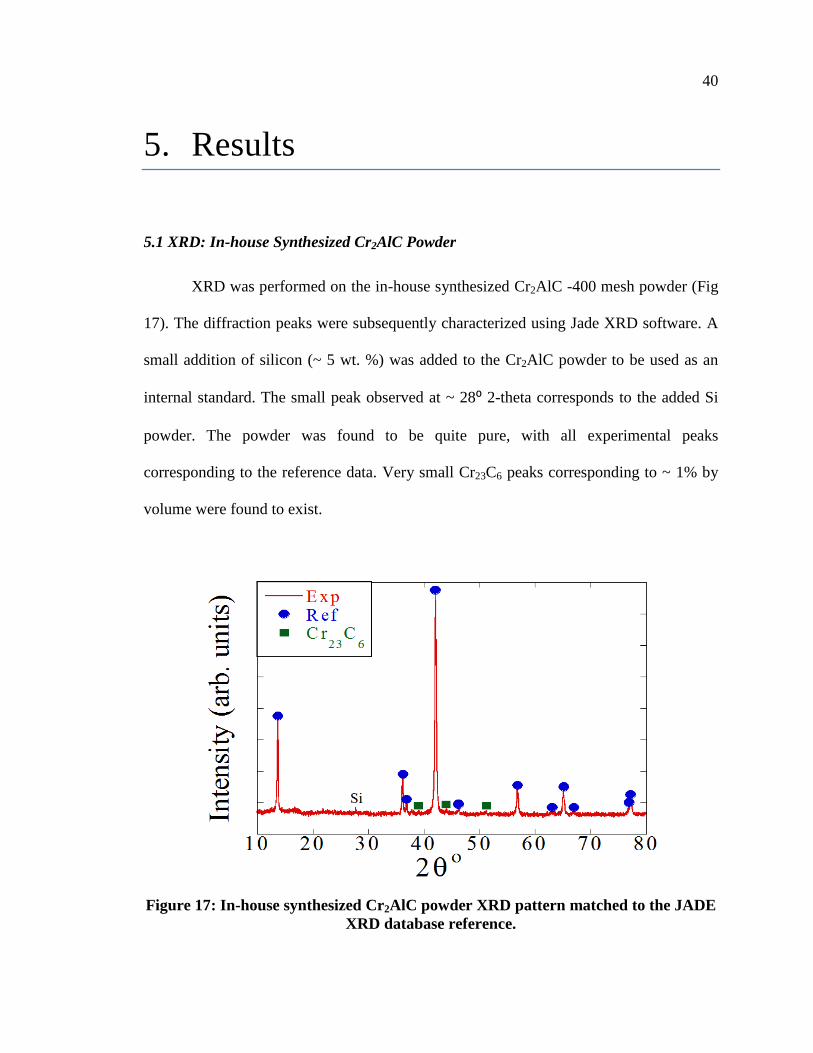
5.1 XRD: In-house Synthesized Cr2AlC Powder
XRD was performed on the in-house synthesized Cr2AlC -400 mesh powder (Fig
17). The diffraction peaks were subsequently characterized using Jade XRD software. A
small addition of silicon (~ 5 wt. %) was added to the Cr2AlC powder to be used as an
internal standard. The small peak observed at ~ 28⁰ 2-theta corresponds to the added Si
powder. The powder was found to be quite pure, with all experimental peaks
corresponding to the reference data. Very small Cr23C6 peaks corresponding to ~ 1% by
volume were found to exist.
Figure 17: In-house synthesized Cr2AlC powder XRD pattern matched to the JADE
XRD database reference.
41
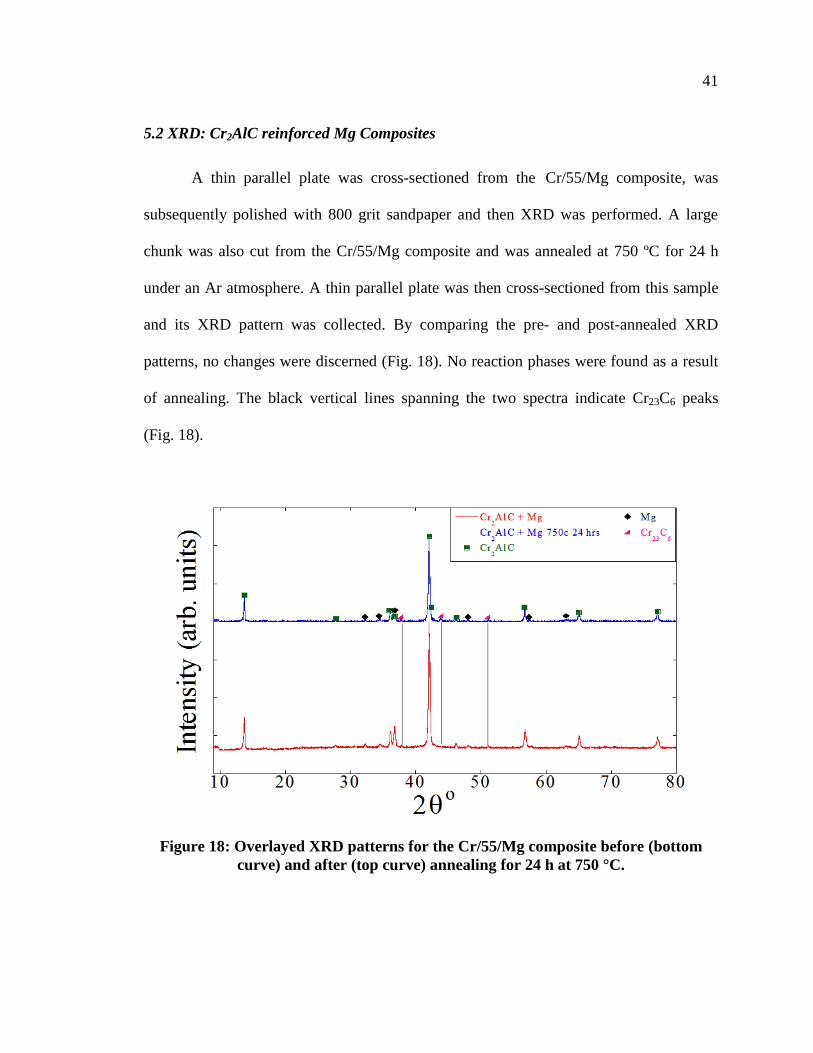
5.2 XRD: Cr2AlC reinforced Mg Composites
A thin parallel plate was cross-sectioned from the Cr/55/Mg composite, was
subsequently polished with 800 grit sandpaper and then XRD was performed. A large
chunk was also cut from the Cr/55/Mg composite and was annealed at 750 ºC for 24 h
under an Ar atmosphere. A thin parallel plate was then cross-sectioned from this sample
and its XRD pattern was collected. By comparing the pre- and post-annealed XRD
patterns, no changes were discerned (Fig. 18). No reaction phases were found as a result
of annealing. The black vertical lines spanning the two spectra indicate Cr23C6 peaks
(Fig. 18).
Figure 18: Overlayed XRD patterns for the Cr/55/Mg composite before (bottom
curve) and after (top curve) annealing for 24 h at 750 °C.
42
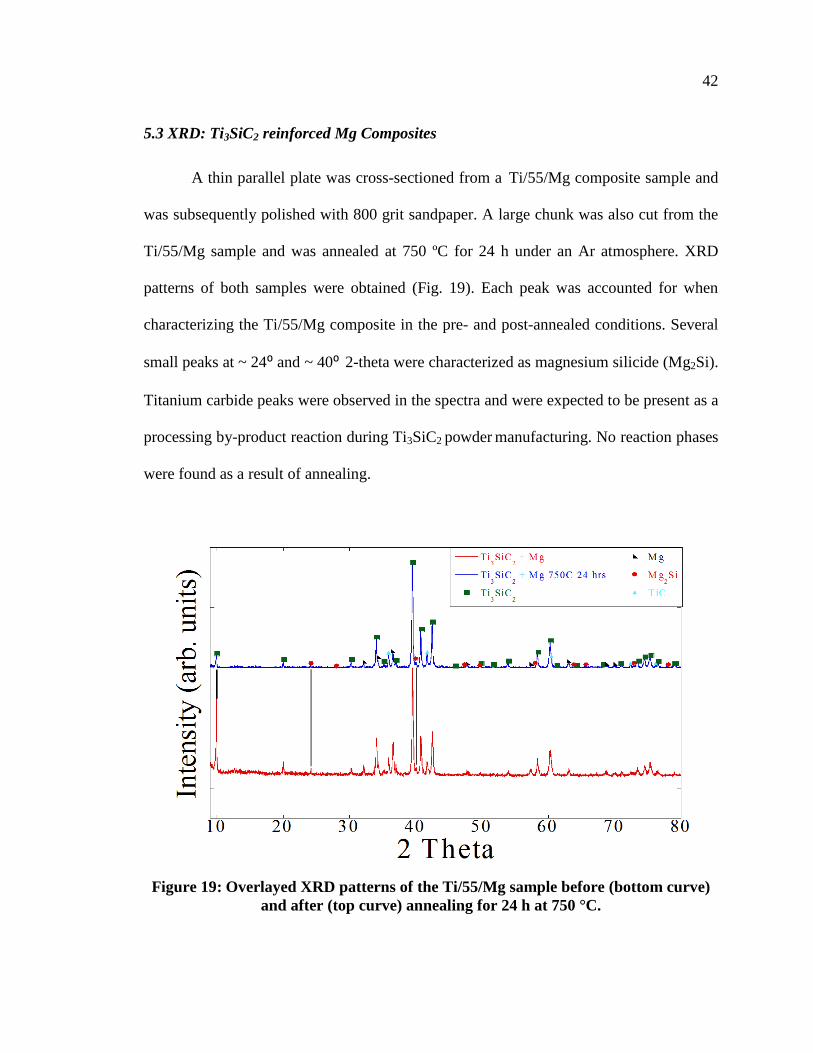
5.3 XRD: Ti3SiC2 reinforced Mg Composites
A thin parallel plate was cross-sectioned from a Ti/55/Mg composite sample and
was subsequently polished with 800 grit sandpaper. A large chunk was also cut from the
Ti/55/Mg sample and was annealed at 750 ºC for 24 h under an Ar atmosphere. XRD
patterns of both samples were obtained (Fig. 19). Each peak was accounted for when
characterizing the Ti/55/Mg composite in the pre- and post-annealed conditions. Several
small peaks at ~ 24⁰ and ~ 40⁰ 2-theta were characterized as magnesium silicide (Mg2Si).
Titanium carbide peaks were observed in the spectra and were expected to be present as a
processing by-product reaction during Ti3SiC2 powder manufacturing. No reaction phases
were found as a result of annealing.
Figure 19: Overlayed XRD patterns of the Ti/55/Mg sample before (bottom curve)
and after (top curve) annealing for 24 h at 750 °C.
43
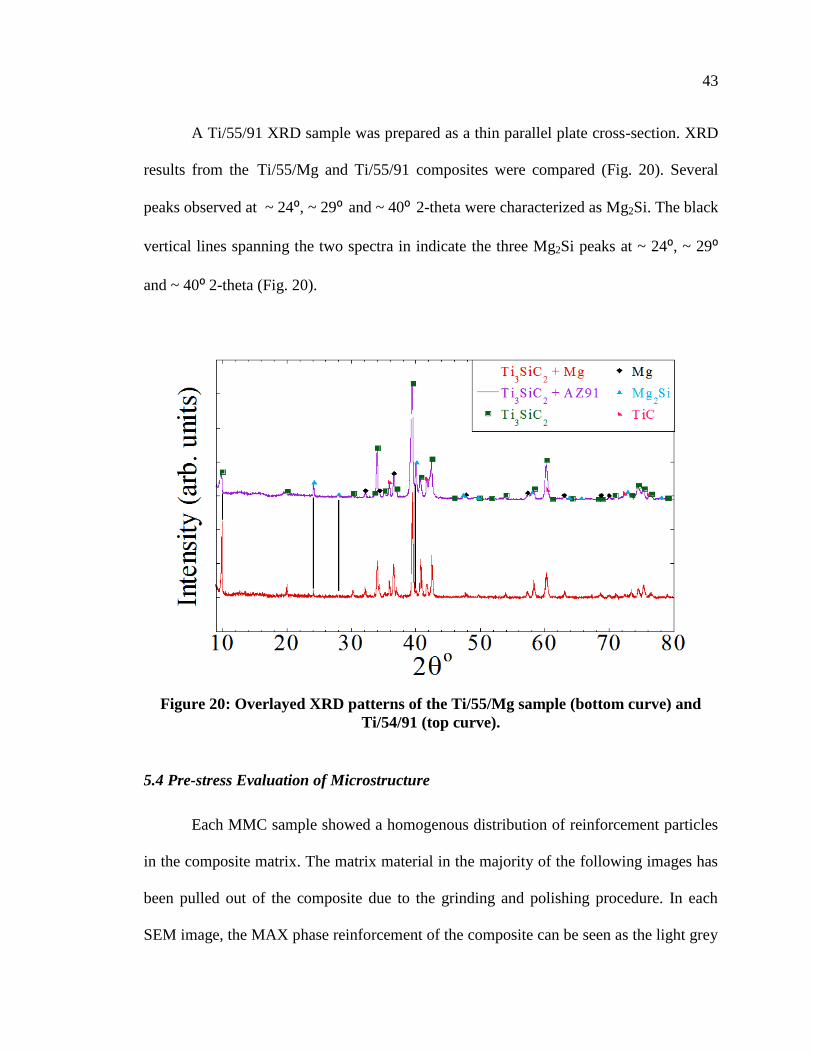
A Ti/55/91 XRD sample was prepared as a thin parallel plate cross-section. XRD
results from the Ti/55/Mg and Ti/55/91 composites were compared (Fig. 20). Several
peaks observed at ~ 24⁰, ~ 29⁰ and ~ 40⁰ 2-theta were characterized as Mg2Si. The black
vertical lines spanning the two spectra in indicate the three Mg2Si peaks at ~ 24⁰, ~ 29⁰
and ~ 40⁰ 2-theta (Fig. 20).
Figure 20: Overlayed XRD patterns of the Ti/55/Mg sample (bottom curve) and
Ti/54/91 (top curve).
5.4 Pre-stress Evaluation of Microstructure
Each MMC sample showed a homogenous distribution of reinforcement particles
in the composite matrix. The matrix material in the majority of the following images has
been pulled out of the composite due to the grinding and polishing procedure. In each
SEM image, the MAX phase reinforcement of the composite can be seen as the light grey
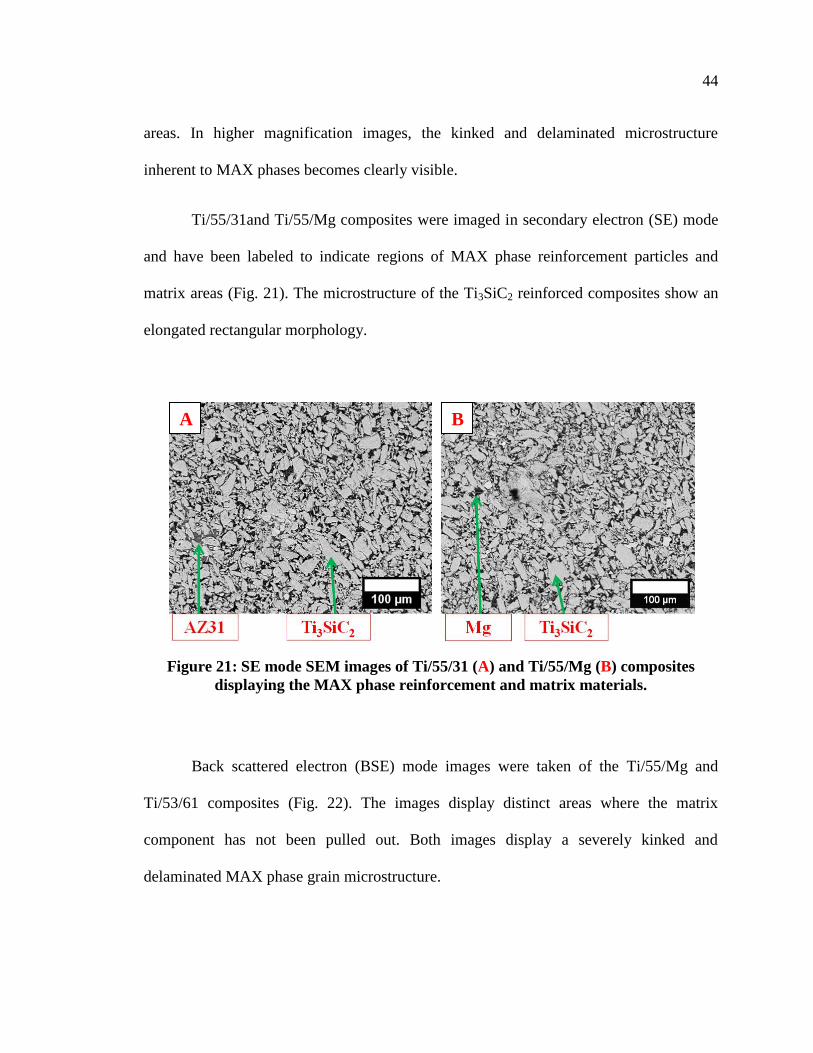
44
areas. In higher magnification images, the kinked and delaminated microstructure
inherent to MAX phases becomes clearly visible.
Ti/55/31and Ti/55/Mg composites were imaged in secondary electron (SE) mode
and have been labeled to indicate regions of MAX phase reinforcement particles and
matrix areas (Fig. 21). The microstructure of the Ti3SiC2 reinforced composites show an
elongated rectangular morphology.
Figure 21: SE mode SEM images of Ti/55/31 (A) and Ti/55/Mg (B) composites
displaying the MAX phase reinforcement and matrix materials.
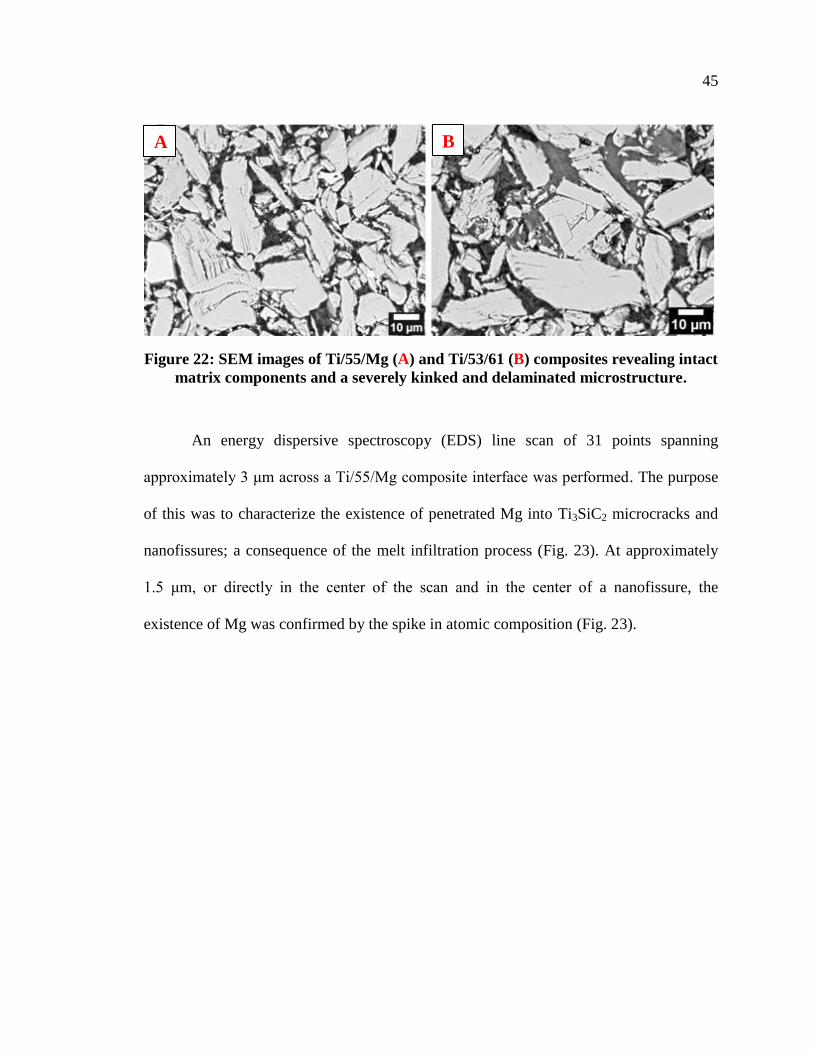
Back scattered electron (BSE) mode images were taken of the Ti/55/Mg and
Ti/53/61 composites (Fig. 22). The images display distinct areas where the matrix
component has not been pulled out. Both images display a severely kinked and
delaminated MAX phase grain microstructure.
A B
45
Figure 22: SEM images of Ti/55/Mg (A) and Ti/53/61 (B) composites revealing intact
matrix components and a severely kinked and delaminated microstructure.
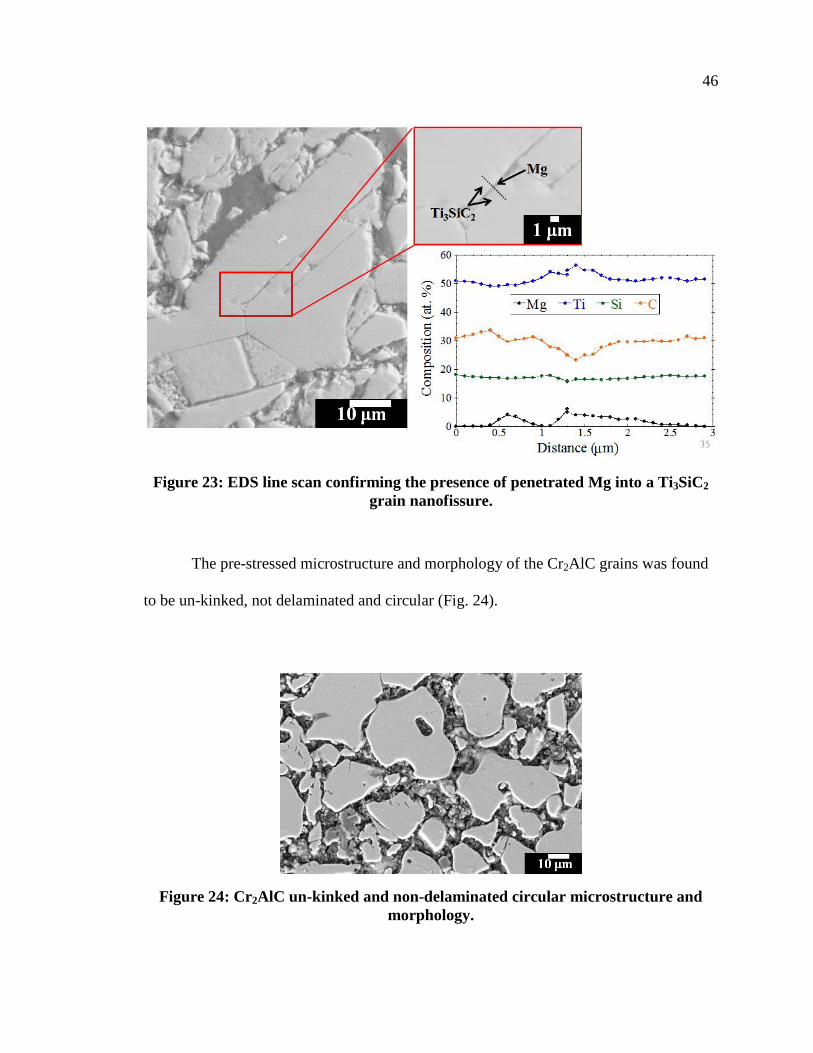
An energy dispersive spectroscopy (EDS) line scan of 31 points spanning
approximately 3 μm across a Ti/55/Mg composite interface was performed. The purpose
of this was to characterize the existence of penetrated Mg into Ti3SiC2 microcracks and
nanofissures; a consequence of the melt infiltration process (Fig. 23). At approximately
1.5 μm, or directly in the center of the scan and in the center of a nanofissure, the
existence of Mg was confirmed by the spike in atomic composition (Fig. 23).
A B
46
Figure 23: EDS line scan confirming the presence of penetrated Mg into a Ti3SiC2
grain nanofissure.
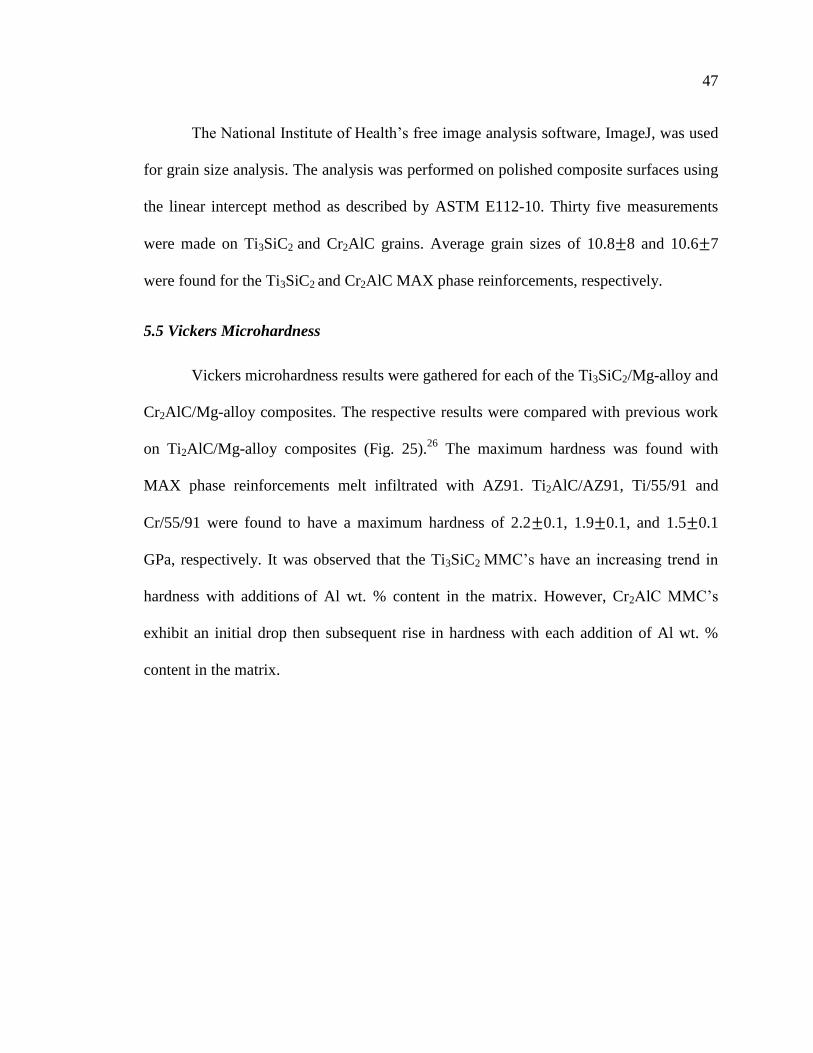
The pre-stressed microstructure and morphology of the Cr2AlC grains was found
to be un-kinked, not delaminated and circular (Fig. 24).
Figure 24: Cr2AlC un-kinked and non-delaminated circular microstructure and
morphology.
47
The National Institute of Health’s free image analysis software, ImageJ, was used
for grain size analysis. The analysis was performed on polished composite surfaces using
the linear intercept method as described by ASTM E112-10. Thirty five measurements
were made on Ti3SiC2 and Cr2AlC grains. Average grain sizes of 10.8 8 and 10.6 7
were found for the Ti3SiC2 and Cr2AlC MAX phase reinforcements, respectively.
5.5 Vickers Microhardness
Vickers microhardness results were gathered for each of the Ti3SiC2/Mg-alloy and
Cr2AlC/Mg-alloy composites. The respective results were compared with previous work
on Ti2AlC/Mg-alloy composites (Fig. 25).26
The maximum hardness was found with
MAX phase reinforcements melt infiltrated with AZ91. Ti2AlC/AZ91, Ti/55/91 and
Cr/55/91 were found to have a maximum hardness of 2.2 0.1, 1.9 0.1, and 1.5 0.1
GPa, respectively. It was observed that the Ti3SiC2 MMC’s have an increasing trend in
hardness with additions of Al wt. % content in the matrix. However, Cr2AlC MMC’s
exhibit an initial drop then subsequent rise in hardness with each addition of Al wt. %
content in the matrix.
48
Figure 25: Vickers microhardness results vs. matrix Al wt. % content for each
composite in this work compared with previous work on Ti2AlC/Mg 26
composites.
5.6 Ultimate Compression Strength
Five 4 mm3 samples were crushed to obtain five UCS values for each composite.
Those five values were averaged with standard deviations found to generate UCS data for
each of the Ti3SiC/Mg and Cr2AlC/Mg composites. The respective results were compared
with previous work on Ti2AlC/Mg-alloy composites (Fig. 26).26
Ti2AlC/AZ31, Ti/55/91
and Cr/55/91 were found to have a maximum UCS of 773 7, 617 10, and 545 35 GPa,
respectively. The Ti3SiC2 reinforced MMC’s generally show an increasing trend in UCS
with each addition of Al wt. % in the matrix. The Cr2AlC reinforced MMC’s exhibit an
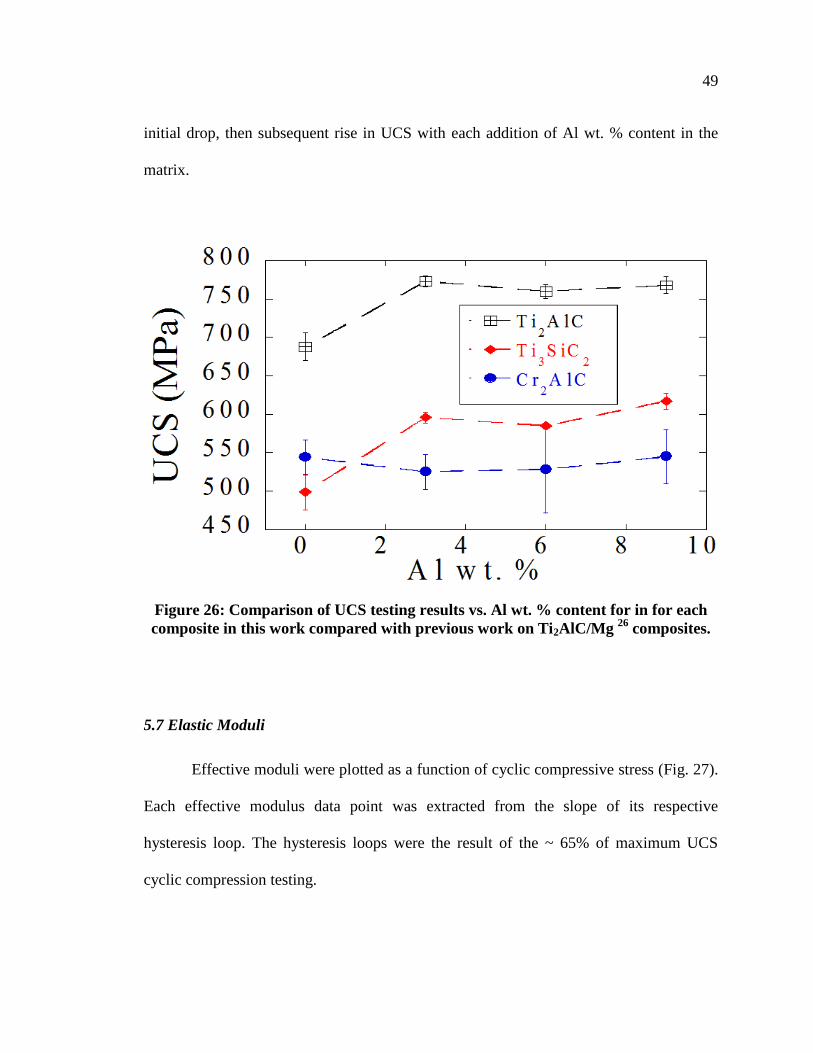
49
initial drop, then subsequent rise in UCS with each addition of Al wt. % content in the
matrix.
Figure 26: Comparison of UCS testing results vs. Al wt. % content for in for each
composite in this work compared with previous work on Ti2AlC/Mg 26
composites.
5.7 Elastic Moduli
Effective moduli were plotted as a function of cyclic compressive stress (Fig. 27).
Each effective modulus data point was extracted from the slope of its respective
hysteresis loop. The hysteresis loops were the result of the ~ 65% of maximum UCS
cyclic compression testing.
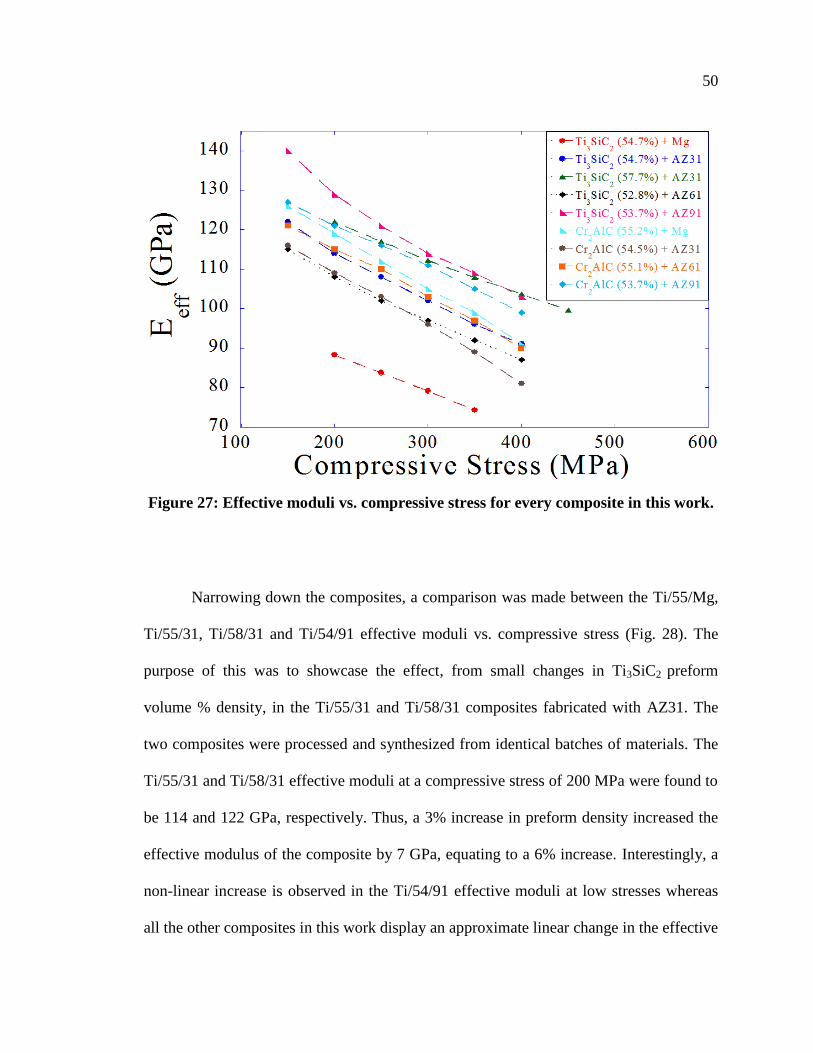
50
Figure 27: Effective moduli vs. compressive stress for every composite in this work.
Narrowing down the composites, a comparison was made between the Ti/55/Mg,
Ti/55/31, Ti/58/31 and Ti/54/91 effective moduli vs. compressive stress (Fig. 28). The
purpose of this was to showcase the effect, from small changes in Ti3SiC2 preform
volume % density, in the Ti/55/31 and Ti/58/31 composites fabricated with AZ31. The
two composites were processed and synthesized from identical batches of materials. The
Ti/55/31 and Ti/58/31 effective moduli at a compressive stress of 200 MPa were found to
be 114 and 122 GPa, respectively. Thus, a 3% increase in preform density increased the
effective modulus of the composite by 7 GPa, equating to a 6% increase. Interestingly, a
non-linear increase is observed in the Ti/54/91 effective moduli at low stresses whereas
all the other composites in this work display an approximate linear change in the effective
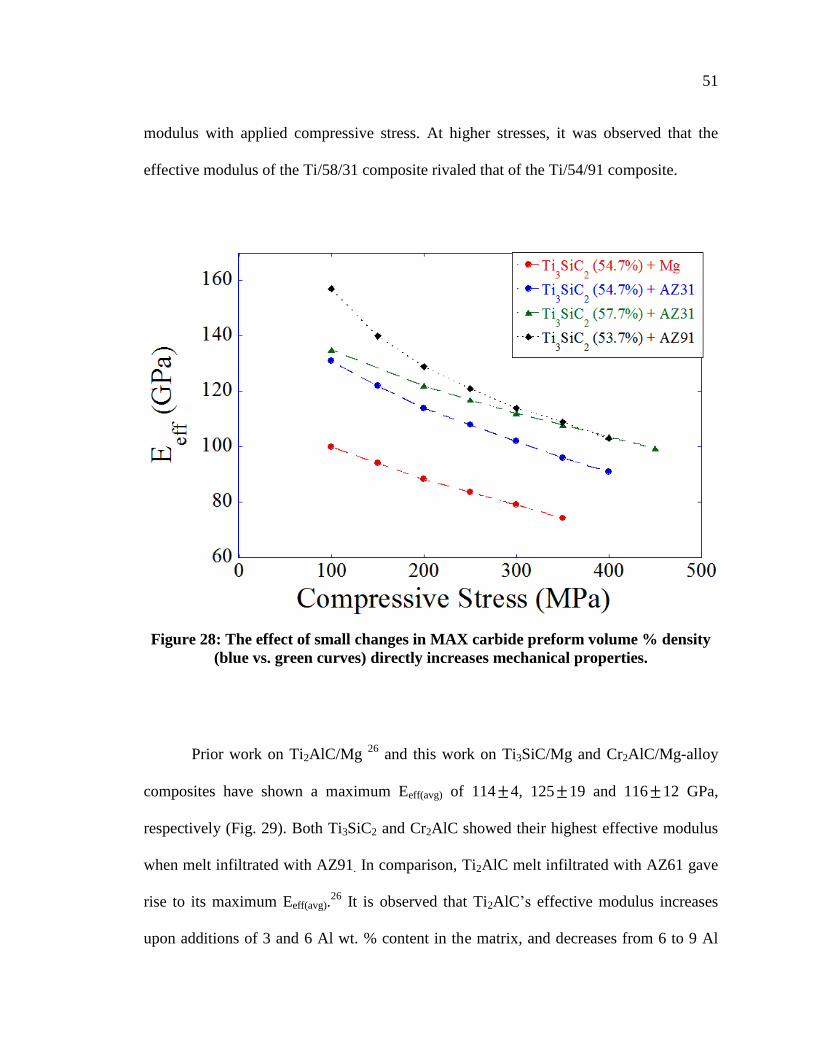
51
modulus with applied compressive stress. At higher stresses, it was observed that the
effective modulus of the Ti/58/31 composite rivaled that of the Ti/54/91 composite.
Figure 28: The effect of small changes in MAX carbide preform volume % density
(blue vs. green curves) directly increases mechanical properties.
Prior work on Ti2AlC/Mg 26
and this work on Ti3SiC/Mg and Cr2AlC/Mg-alloy
composites have shown a maximum Eeff(avg) of 114 4, 125 19 and 116 12 GPa,
respectively (Fig. 29). Both Ti3SiC2 and Cr2AlC showed their highest effective modulus
when melt infiltrated with AZ91. In comparison, Ti2AlC melt infiltrated with AZ61 gave
rise to its maximum Eeff(avg).26
It is observed that Ti2AlC’s effective modulus increases
upon additions of 3 and 6 Al wt. % content in the matrix, and decreases from 6 to 9 Al
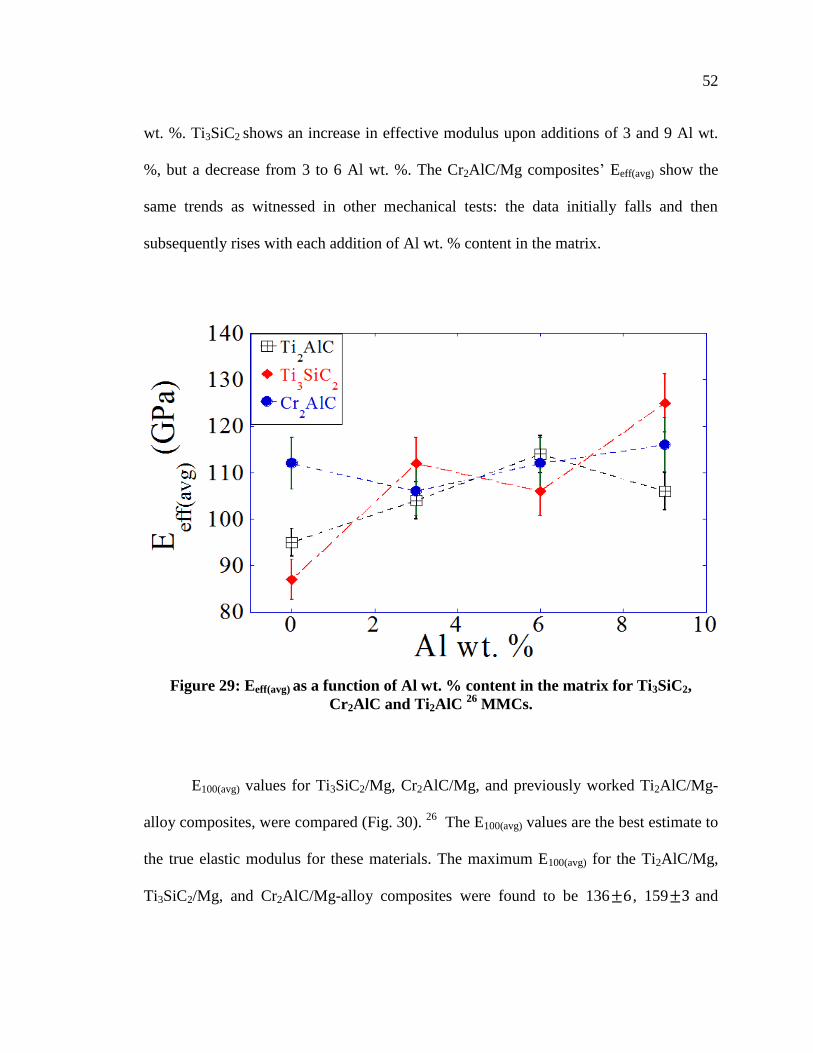
52
wt. %. Ti3SiC2 shows an increase in effective modulus upon additions of 3 and 9 Al wt.
%, but a decrease from 3 to 6 Al wt. %. The Cr2AlC/Mg composites’ Eeff(avg) show the
same trends as witnessed in other mechanical tests: the data initially falls and then
subsequently rises with each addition of Al wt. % content in the matrix.
Figure 29: Eeff(avg) as a function of Al wt. % content in the matrix for Ti3SiC2,
Cr2AlC and Ti2AlC 26
MMCs.
E100(avg) values for Ti3SiC2/Mg, Cr2AlC/Mg, and previously worked Ti2AlC/Mg-
alloy composites, were compared (Fig. 30). 26
The E100(avg) values are the best estimate to
the true elastic modulus for these materials. The maximum E100(avg) for the Ti2AlC/Mg,
Ti3SiC2/Mg, and Cr2AlC/Mg-alloy composites were found to be 136 , 159 and
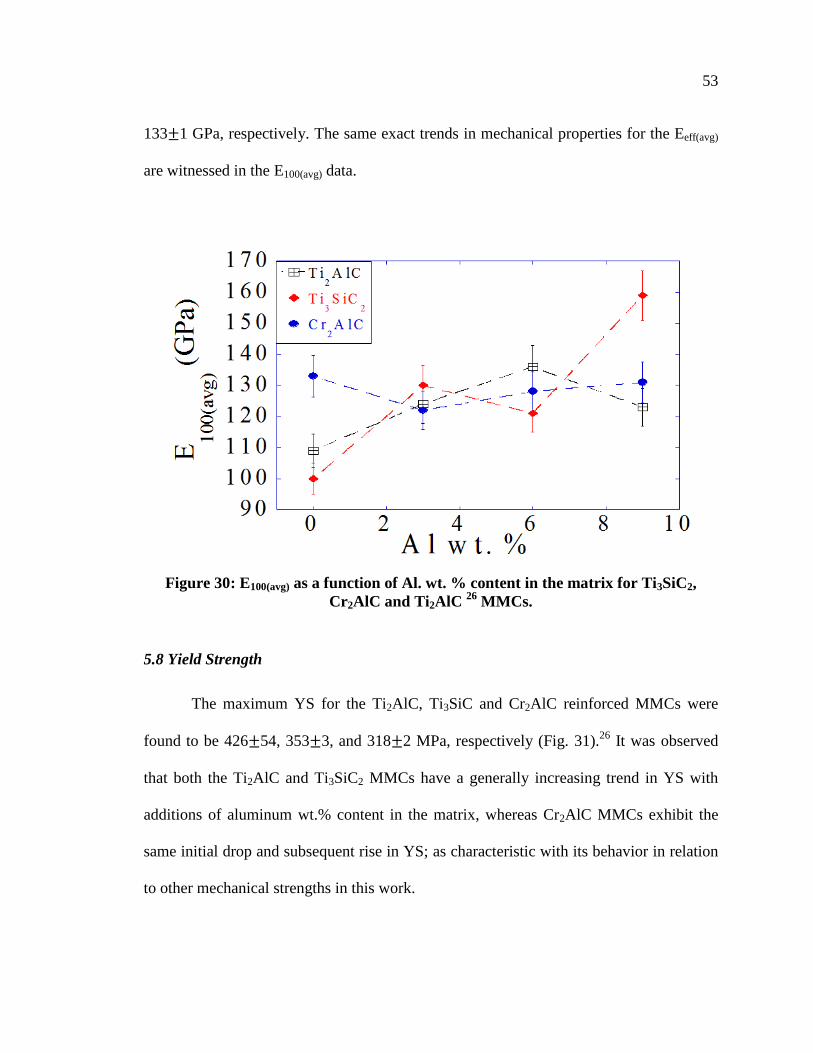
53
133 1 GPa, respectively. The same exact trends in mechanical properties for the Eeff(avg)
are witnessed in the E100(avg) data.
Figure 30: E100(avg) as a function of Al. wt. % content in the matrix for Ti3SiC2,
Cr2AlC and Ti2AlC 26
MMCs.
5.8 Yield Strength
The maximum YS for the Ti2AlC, Ti3SiC and Cr2AlC reinforced MMCs were
found to be 426 54, 353 3, and 318 2 MPa, respectively (Fig. 31).26
It was observed
that both the Ti2AlC and Ti3SiC2 MMCs have a generally increasing trend in YS with
additions of aluminum wt.% content in the matrix, whereas Cr2AlC MMCs exhibit the
same initial drop and subsequent rise in YS; as characteristic with its behavior in relation
to other mechanical strengths in this work.
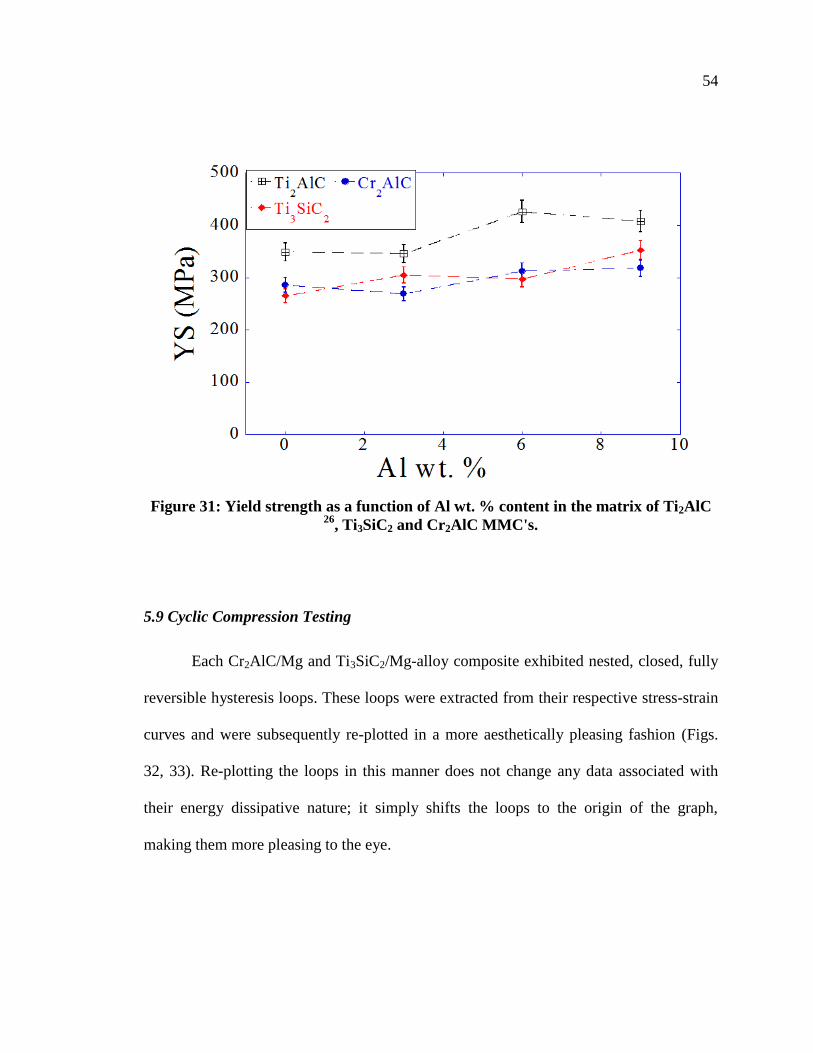
54
Figure 31: Yield strength as a function of Al wt. % content in the matrix of Ti2AlC 26
, Ti3SiC2 and Cr2AlC MMC's.
5.9 Cyclic Compression Testing
Each Cr2AlC/Mg and Ti3SiC2/Mg-alloy composite exhibited nested, closed, fully
reversible hysteresis loops. These loops were extracted from their respective stress-strain
curves and were subsequently re-plotted in a more aesthetically pleasing fashion (Figs.
32, 33). Re-plotting the loops in this manner does not change any data associated with
their energy dissipative nature; it simply shifts the loops to the origin of the graph,
making them more pleasing to the eye.
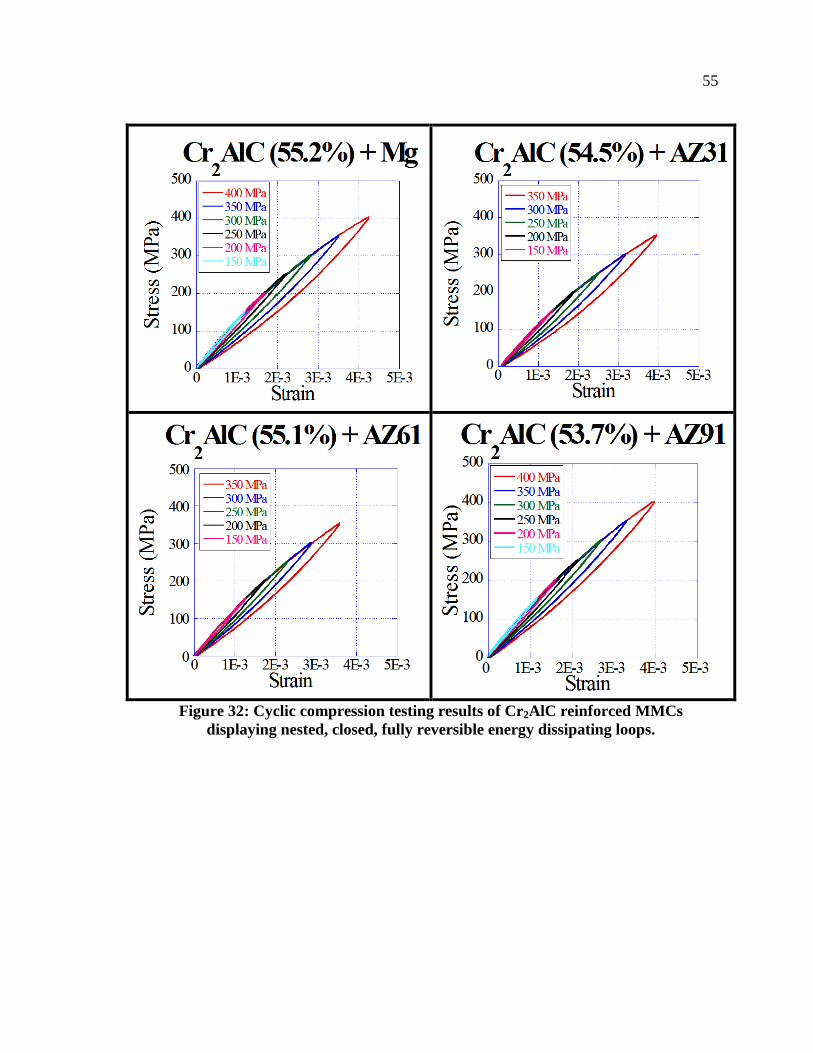
55
Figure 32: Cyclic compression testing results of Cr2AlC reinforced MMCs
displaying nested, closed, fully reversible energy dissipating loops.
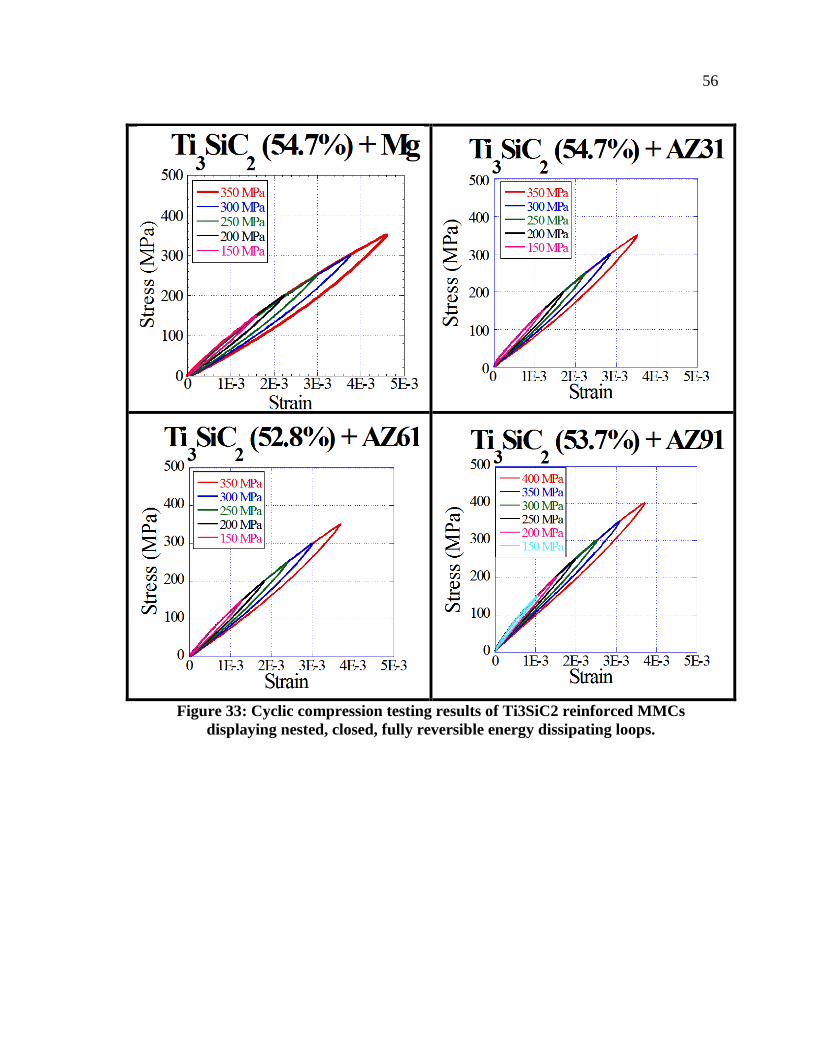
56
Figure 33: Cyclic compression testing results of Ti3SiC2 reinforced MMCs
displaying nested, closed, fully reversible energy dissipating loops.
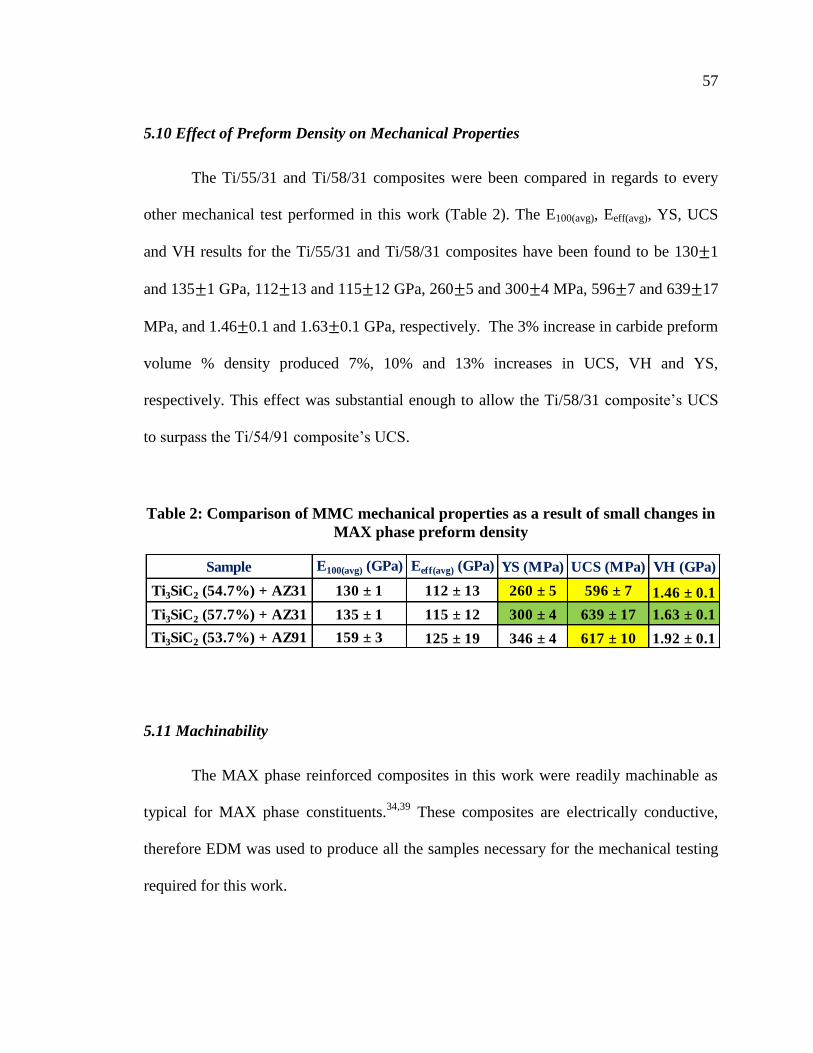
57
5.10 Effect of Preform Density on Mechanical Properties
The Ti/55/31 and Ti/58/31 composites were been compared in regards to every
other mechanical test performed in this work (Table 2). The E100(avg), Eeff(avg), YS, UCS
and VH results for the Ti/55/31 and Ti/58/31 composites have been found to be 130 1
and 135 1 GPa, 112 13 and 115 12 GPa, 260 5 and 300 4 MPa, 596 7 and 639 17
MPa, and 1.46 0.1 and 1.63 0.1 GPa, respectively. The 3% increase in carbide preform
volume % density produced 7%, 10% and 13% increases in UCS, VH and YS,
respectively. This effect was substantial enough to allow the Ti/58/31 composite’s UCS
to surpass the Ti/54/91 composite’s UCS.
Table 2: Comparison of MMC mechanical properties as a result of small changes in
MAX phase preform density
5.11 Machinability
The MAX phase reinforced composites in this work were readily machinable as
typical for MAX phase constituents.34,39
These composites are electrically conductive,
therefore EDM was used to produce all the samples necessary for the mechanical testing
required for this work.
Sample E100(avg) (GPa) Eeff(avg) (GPa) YS (MPa) UCS (MPa) VH (GPa)
Ti3SiC2 (54.7%) + AZ31 130 ± 1 112 ± 13 260 ± 5 596 ± 7 1.46 ± 0.1
Ti3SiC2 (57.7%) + AZ31 135 ± 1 115 ± 12 300 ± 4 639 ± 17 1.63 ± 0.1
Ti3SiC2 (53.7%) + AZ91 159 ± 3 125 ± 19 346 ± 4 617 ± 10 1.92 ± 0.1
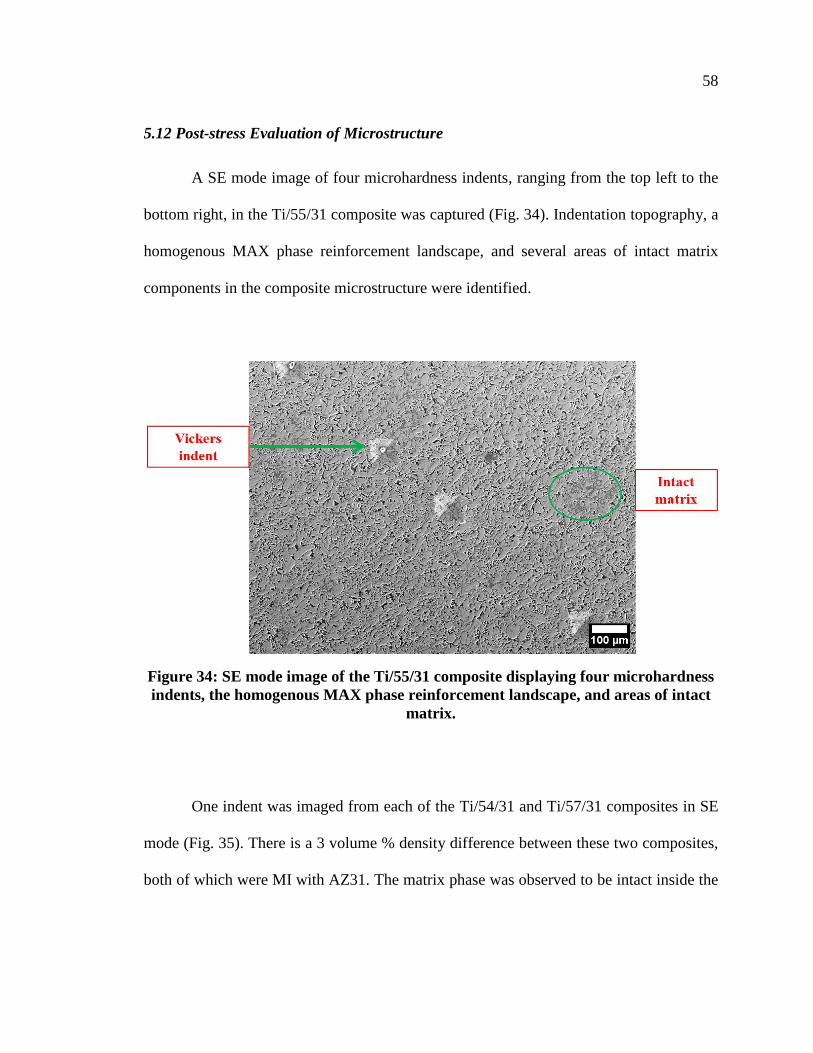
58
5.12 Post-stress Evaluation of Microstructure
A SE mode image of four microhardness indents, ranging from the top left to the
bottom right, in the Ti/55/31 composite was captured (Fig. 34). Indentation topography, a
homogenous MAX phase reinforcement landscape, and several areas of intact matrix
components in the composite microstructure were identified.
Figure 34: SE mode image of the Ti/55/31 composite displaying four microhardness
indents, the homogenous MAX phase reinforcement landscape, and areas of intact
matrix.
One indent was imaged from each of the Ti/54/31 and Ti/57/31 composites in SE
mode (Fig. 35). There is a 3 volume % density difference between these two composites,
both of which were MI with AZ31. The matrix phase was observed to be intact inside the
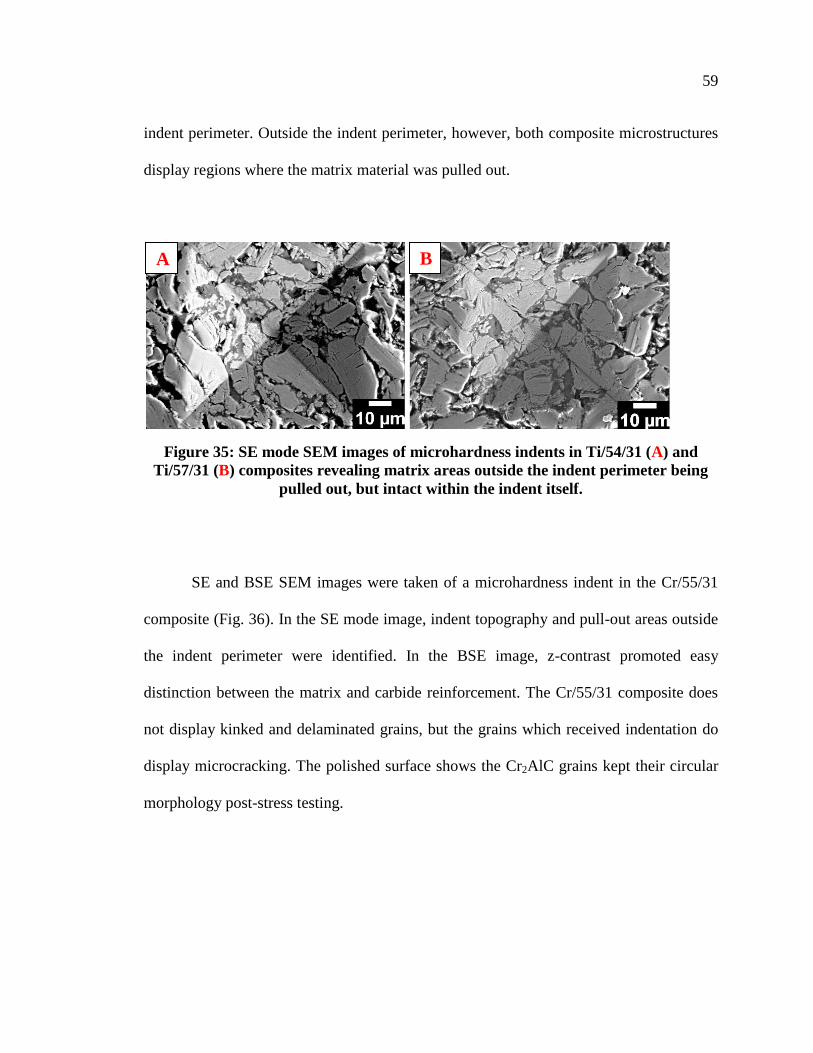
59
indent perimeter. Outside the indent perimeter, however, both composite microstructures
display regions where the matrix material was pulled out.
Figure 35: SE mode SEM images of microhardness indents in Ti/54/31 (A) and
Ti/57/31 (B) composites revealing matrix areas outside the indent perimeter being
pulled out, but intact within the indent itself.
SE and BSE SEM images were taken of a microhardness indent in the Cr/55/31
composite (Fig. 36). In the SE mode image, indent topography and pull-out areas outside
the indent perimeter were identified. In the BSE image, z-contrast promoted easy
distinction between the matrix and carbide reinforcement. The Cr/55/31 composite does
not display kinked and delaminated grains, but the grains which received indentation do
display microcracking. The polished surface shows the Cr2AlC grains kept their circular
morphology post-stress testing.
A B
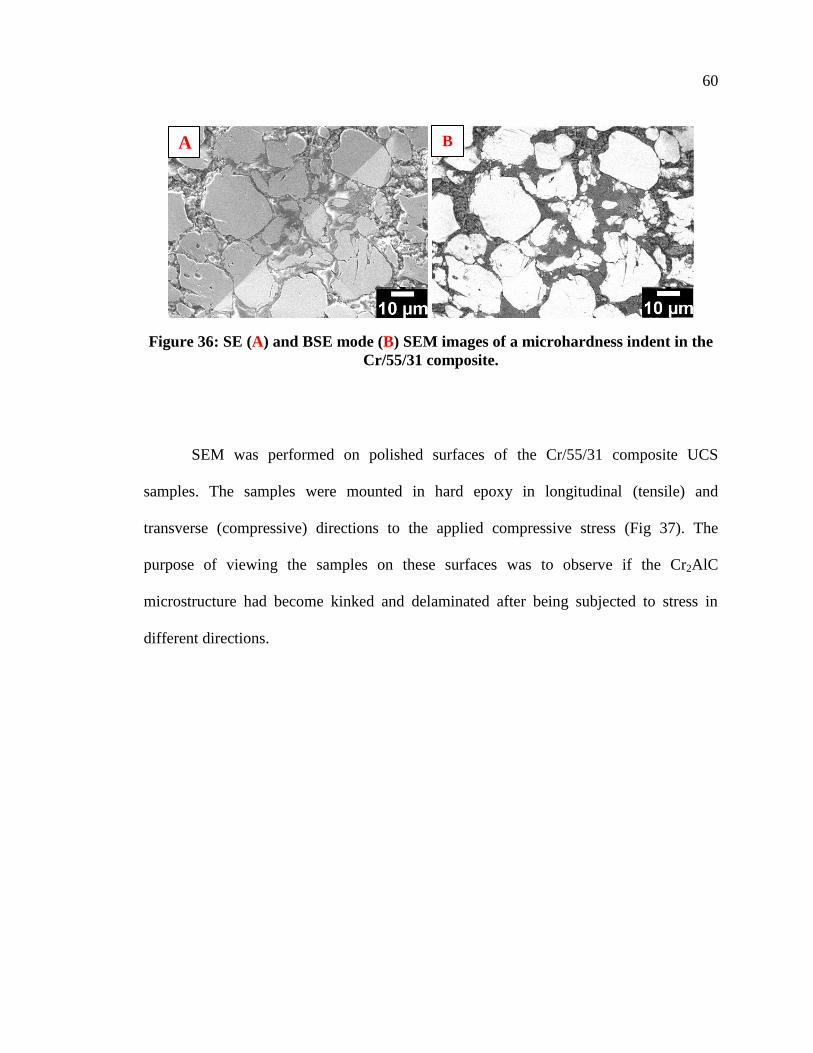
60
Figure 36: SE (A) and BSE mode (B) SEM images of a microhardness indent in the
Cr/55/31 composite.
SEM was performed on polished surfaces of the Cr/55/31 composite UCS
samples. The samples were mounted in hard epoxy in longitudinal (tensile) and
transverse (compressive) directions to the applied compressive stress (Fig 37). The
purpose of viewing the samples on these surfaces was to observe if the Cr2AlC
microstructure had become kinked and delaminated after being subjected to stress in
different directions.
A B
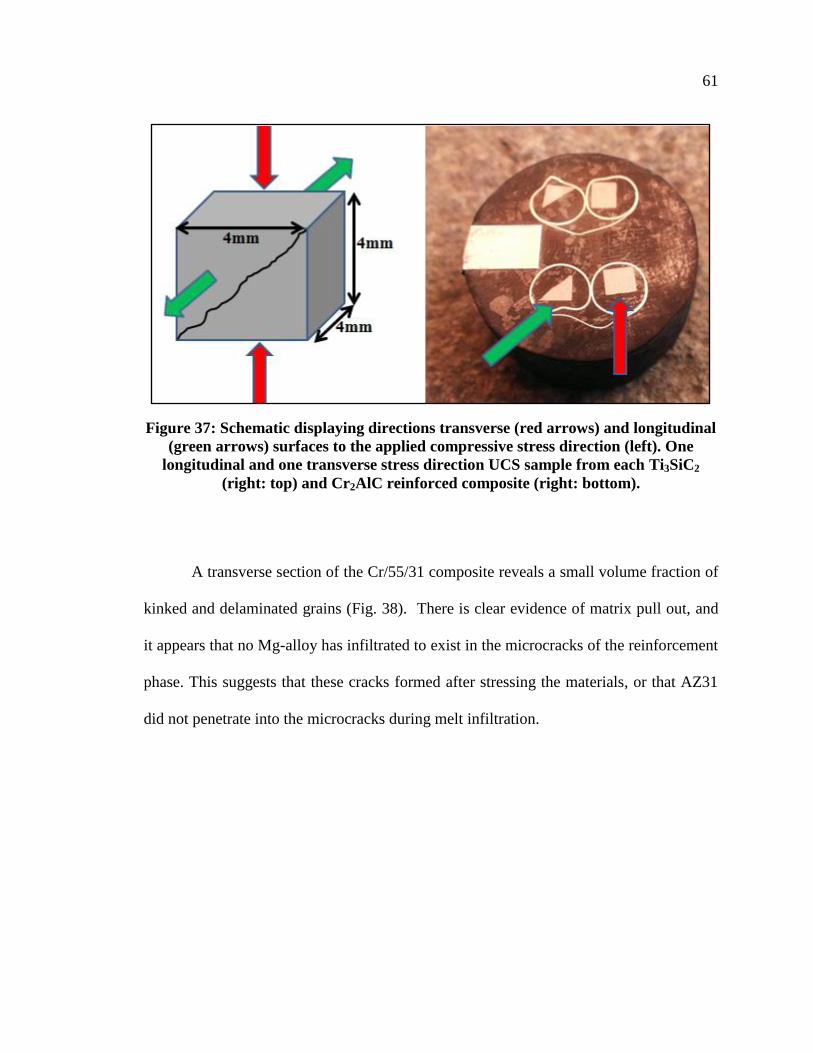
61
Figure 37: Schematic displaying directions transverse (red arrows) and longitudinal
(green arrows) surfaces to the applied compressive stress direction (left). One
longitudinal and one transverse stress direction UCS sample from each Ti3SiC2
(right: top) and Cr2AlC reinforced composite (right: bottom).
A transverse section of the Cr/55/31 composite reveals a small volume fraction of
kinked and delaminated grains (Fig. 38). There is clear evidence of matrix pull out, and
it appears that no Mg-alloy has infiltrated to exist in the microcracks of the reinforcement
phase. This suggests that these cracks formed after stressing the materials, or that AZ31
did not penetrate into the microcracks during melt infiltration.
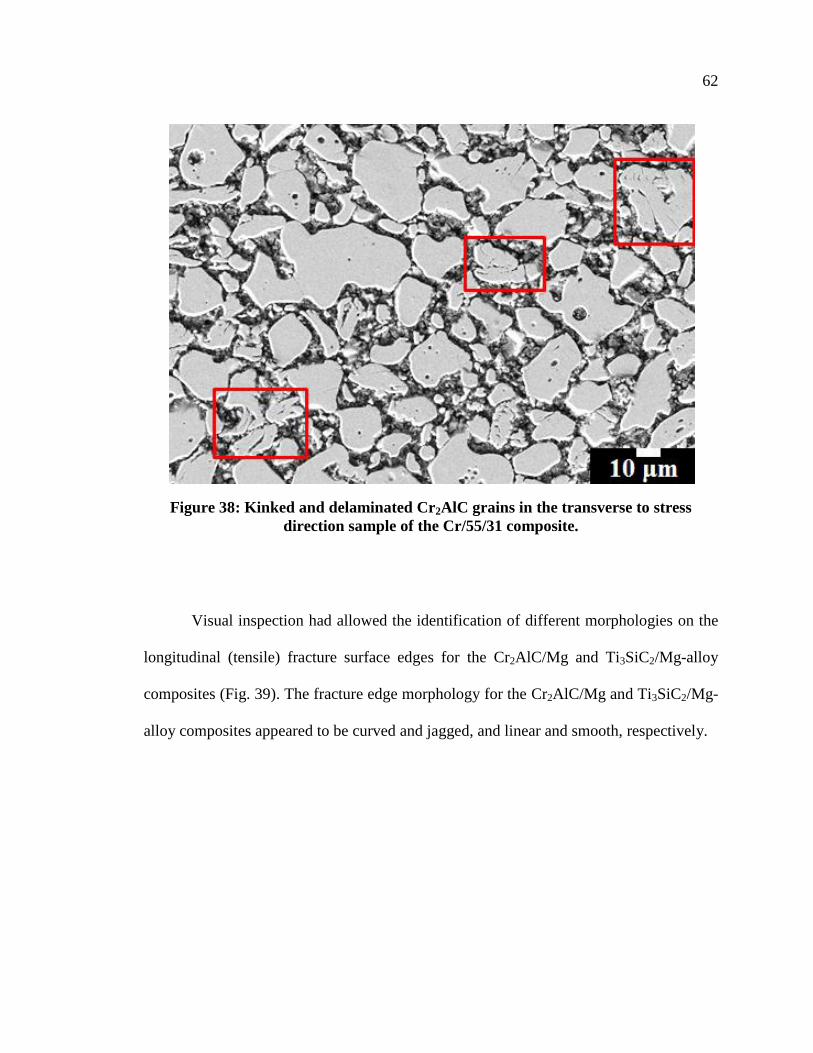
62
Figure 38: Kinked and delaminated Cr2AlC grains in the transverse to stress
direction sample of the Cr/55/31 composite.
Visual inspection had allowed the identification of different morphologies on the
longitudinal (tensile) fracture surface edges for the Cr2AlC/Mg and Ti3SiC2/Mg-alloy
composites (Fig. 39). The fracture edge morphology for the Cr2AlC/Mg and Ti3SiC2/Mg-
alloy composites appeared to be curved and jagged, and linear and smooth, respectively.
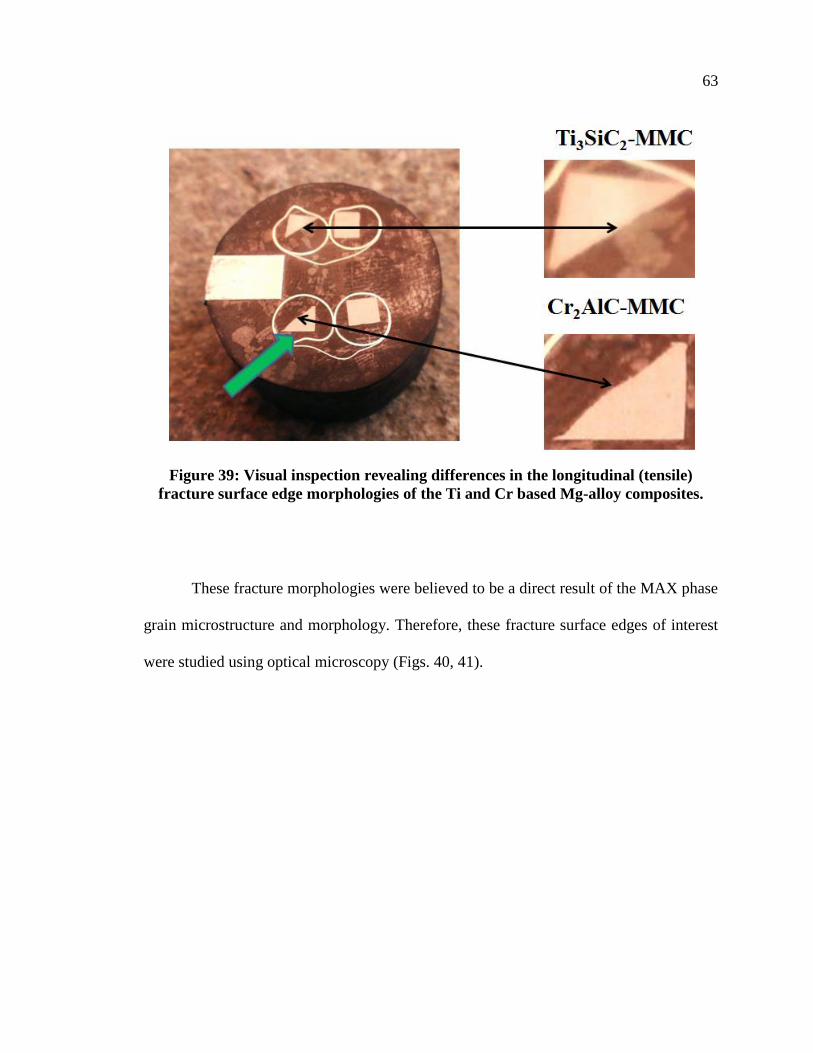
63
Figure 39: Visual inspection revealing differences in the longitudinal (tensile)
fracture surface edge morphologies of the Ti and Cr based Mg-alloy composites.
These fracture morphologies were believed to be a direct result of the MAX phase
grain microstructure and morphology. Therefore, these fracture surface edges of interest
were studied using optical microscopy (Figs. 40, 41).
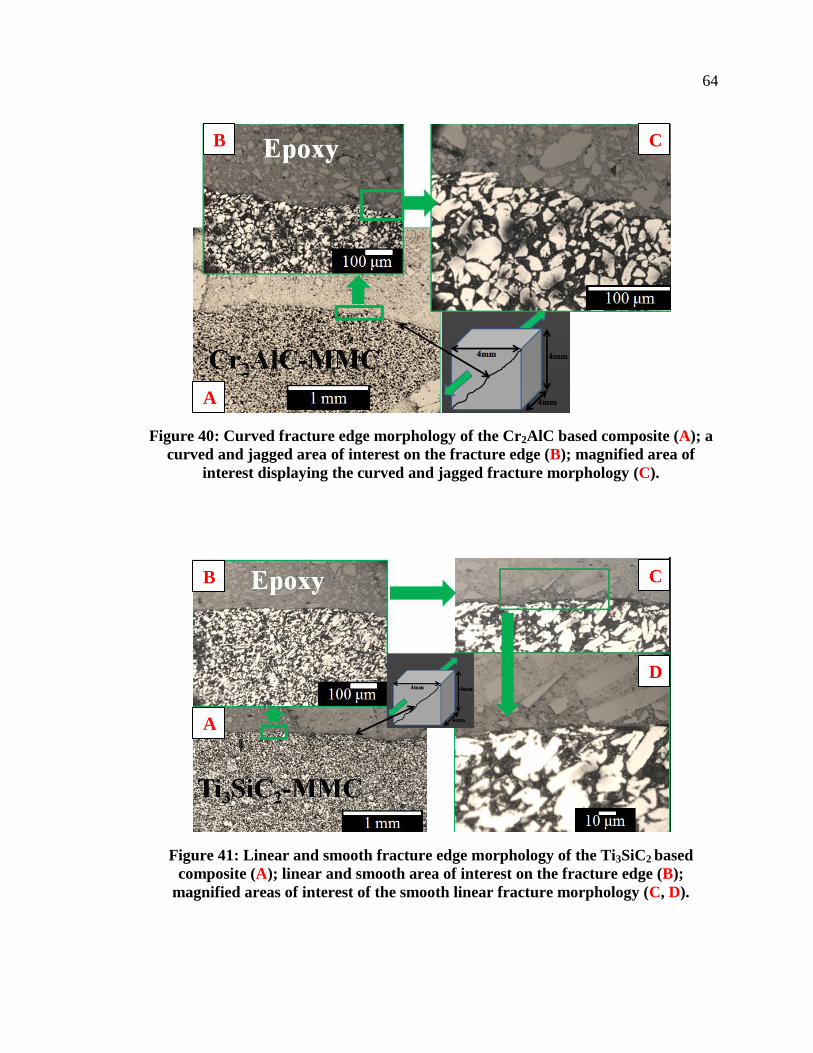
64
Figure 40: Curved fracture edge morphology of the Cr2AlC based composite (A); a
curved and jagged area of interest on the fracture edge (B); magnified area of
interest displaying the curved and jagged fracture morphology (C).
Figure 41: Linear and smooth fracture edge morphology of the Ti3SiC2 based
composite (A); linear and smooth area of interest on the fracture edge (B);
magnified areas of interest of the smooth linear fracture morphology (C, D).
A
B C
A
B C
D
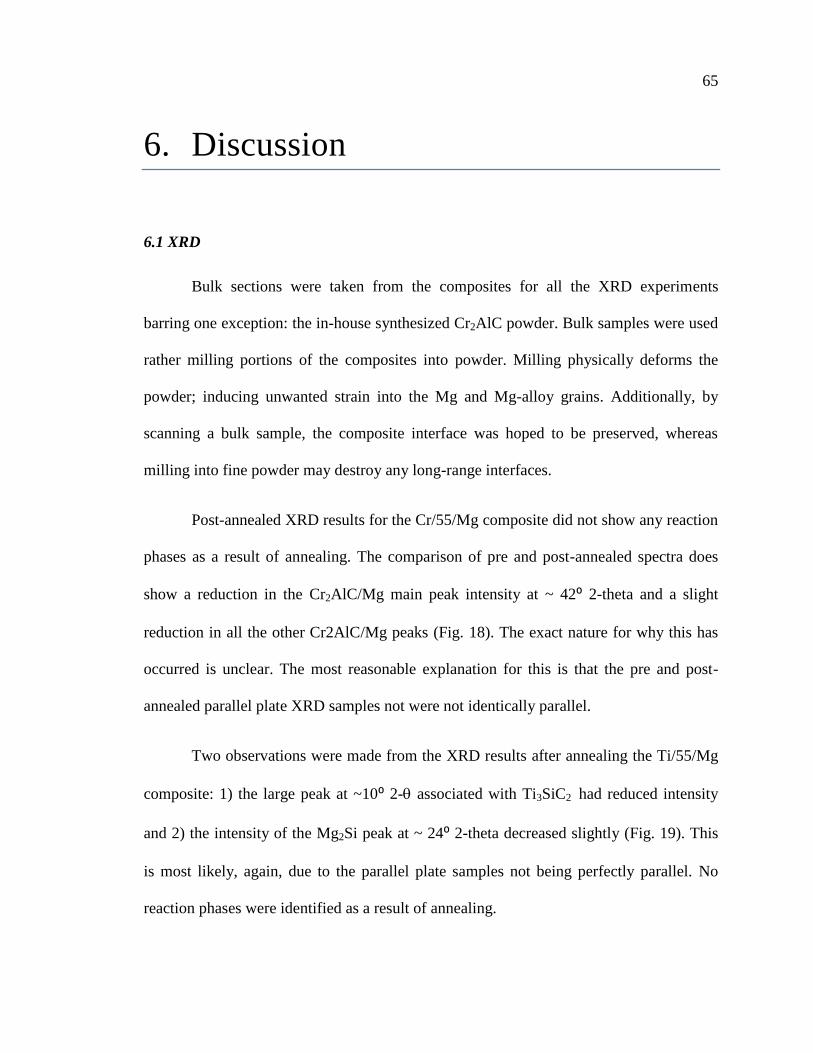
65
6. Discussion
6.1 XRD
Bulk sections were taken from the composites for all the XRD experiments
barring one exception: the in-house synthesized Cr2AlC powder. Bulk samples were used
rather milling portions of the composites into powder. Milling physically deforms the
powder; inducing unwanted strain into the Mg and Mg-alloy grains. Additionally, by
scanning a bulk sample, the composite interface was hoped to be preserved, whereas
milling into fine powder may destroy any long-range interfaces.
Post-annealed XRD results for the Cr/55/Mg composite did not show any reaction
phases as a result of annealing. The comparison of pre and post-annealed spectra does
show a reduction in the Cr2AlC/Mg main peak intensity at ~ 42⁰ 2-theta and a slight
reduction in all the other Cr2AlC/Mg peaks (Fig. 18). The exact nature for why this has
occurred is unclear. The most reasonable explanation for this is that the pre and post-
annealed parallel plate XRD samples not were not identically parallel.
Two observations were made from the XRD results after annealing the Ti/55/Mg
composite: 1) the large peak at ~10⁰ 2- associated with Ti3SiC2 had reduced intensity
and 2) the intensity of the Mg2Si peak at ~ 24⁰ 2-theta decreased slightly (Fig. 19). This
is most likely, again, due to the parallel plate samples not being perfectly parallel. No
reaction phases were identified as a result of annealing.
66
In comparison to the pre-annealed condition of the Ti/55/Mg composite, the
Ti/54/91 shows a less intense peak at ~ 10⁰ 2- associated with Ti3SiC2 (Fig. 20). On the
other hand the Mg2Si peak at ~ 24⁰ 2-theta appears to have increased when comparing
these two composites. Since no reaction phases were seen after annealing in this
composite, an appropriate explanation for the changes in peak intensity is indeed the thin
cross sectioned parallel plates not being exactly parallel.
It was initially hypothesized that Mg2Si would be found as a product of the
reaction during the melt infiltration processing step. XRD has proven the existence of
Mg2Si in the Ti3SiC2/Mg-alloy composites. As previously discussed, Mg2Si has been
shown to be present in composites due to a reaction between SiC and Mg.19,20
The true
effect of this reaction product on composite mechanical properties is unclear, however, it
is observed that Mg2Si does not inhibit an increase in mechanical properties for the
Ti3SiC2 reinforced MMCs.
Overall, none of the annealed composite samples displayed any reaction phases
when comparing XRD spectra of the pre and post-annealed condition. This suggests that,
to a certain limit, these composites are suitable for elevated temperature usage. Applying
these composites to elevated temperature environments would require further mechanical
testing to understand other strength limitations before use.
6.2 Trends in Mechanical Properties
This work on Ti3SiC2/Mg and previous work on Ti2AlC/Mg composites both
show trends of increasing mechanical properties with increases of Al wt. % content in the
67
matrix. It is believed that aluminum plays a strong role to enhance the matrix-to-
reinforcement interface.24,26
The absence of Al in the Ti/55/Mg composite suggests a
weaker interface than Ti3SiC2/Mg composites infiltrated with AZ31, AZ61 and AZ91.
This trend can be observed in the Ti3SiC2/Mg-alloy mechanical properties reported in the
results section.
The trend of increasing mechanical properties with increasing Al wt. % content is
not observed with the Cr2AlC based composites. An initial reduction in mechanical
properties is consistently observed for the Cr2AlC/Mg-alloy composites. Upon the first
contribution of Al, from pure Mg to AZ31, the mechanical strengths decrease. Increases
in the Al wt. % content in the matrix produced a small consistent rise in Cr2AlC MMC
mechanical strengths. Only when Cr2AlC was melt infiltrated with AZ91 were the
mechanical strengths either comparable to, or better than, those of Cr2AlC melt infiltrated
with pure Mg.
The trends in mechanical strengths of the Cr2AlC based composites suggest that
one of the constituents from the AZ series alloys has a deleterious effect on the matrix-
reinforcement interface. The hypothesis is that the interface is being weakened upon melt
infiltration via AZ alloys. Moving from AZ31 to larger amounts of Al wt. %’s in 3%
increments (AZ61 & AZ91) is consistently coupled with linearly increasing mechanical
strengths. Therefore it is suspected that the mechanical properties are being increased due
to solid solution strengthening by Al within the Mg-alloy grains. Since linear increases in
strengths are believed to be the result of increasing the Al wt. % content, Zn is believed
to be weakening the interface. This mechanical weakening is observed in all the
68
mechanical testing data when comparing the Cr2AlC/Mg and Cr2AlC/AZ31 composites
(Figs. 25, 26, 29-31).
The Ti/54/91 composite was found to have the highest mechanical strengths in
this work. Al’s affinity to wet Ti, coupled with Mg’s ability to infiltrate between the
micro and nanofissures of kinked and delaminated MAX particles may be the sole
explanation for the high mechanical properties witnessed in the Ti3SiC2/Mg-alloy
composites.
Microscopy images of Cr2AlC reinforcement grains did not have an abundant
amount of kinking and delamination (Figs. 24, 36, 38, 40). This provides two strong
points of argument for the reduced mechanical properties observed for the Cr2AlC/Mg-
alloy composite system: 1) Mg or Mg-alloys did not have opportunity to penetrate
between Cr2AlC particle microcracks and nanofissures to create the strong mechanical
interlocking witnessed in the Ti3SiC2 based composite system and; 2) Al may not wet the
Cr surface as well as it does with Ti. These two reasons, especially the first, may provide
fundamental insight into understanding physical mechanisms between the matrix and
reinforcement phases which creates the strong mechanical interlocking responsible for
resulting in MMCs with excellent mechanical properties. It is suspected that if the
Cr2AlC grains were kinked and delaminated, pure Mg and the AZ alloys would have
penetrated between the microcracks and nanofissures. If this was to occur, it is
hypothesized the mechanical strengths for the Cr2AlC/Mg-alloys would increase,
causing an upward shift of each line on each graph (Figs. 25, 26, 29-31). The trends in
69
the data would, however, not be affected and would remain the same due to the
deleterious effect of AZ alloy constituents on the matrix interface.
6.3 Energy Dissipation
Upon cyclic compression testing, nested and fully reversible hysteretic stress-
strain loops were seen for every MMC fabricated in this work. These results are identical
to previous with work on Ti3SiC2.42
It has been shown that the dissipated energy per unit
volume per cycle, Wd, increases as the square of the maximum applied stress: Wd ∝ 2.
Incipient kink bands (IKB) are the micromechanism responsible for the behavior
seen in the cyclic compression tests42
(Figs. 32, 33). The energy dissipative behavior
witnessed in these materials, and other MAX phase based composites, can be explained
by IKB mechanisms. IKB mechanisms have given rise to label materials such as these as
kinking non-linear elastic solids.42
The potential for dislocation loops isolated to the basal planes exits everywhere in
these materials. Upon receiving stress, these dislocations loops emerge from the basal
planes containing dislocations with opposite signs. When the material is stressed, the
dislocation loops move away from each other and cause the loop to grow or expand.
Upon stress relaxation, the dislocation loops move back together and annihilate. This
process of growing and annihilating dislocation loops occurs during every cycle and this
is what allows the reversible plastic deformation known as non-linear elastic deformation.
The cyclic hysteresis behavior that has been observed in these materials, and
others 26,42
, is promoted by the damping capability of the Mg-alloys and the MAX phase
70
reinforcements. The AZ series alloys, as well as other magnesium based alloys are
observed to have very good damping capability. Some alloys have better specific
damping capacity than others; AZ91 is one such alloy. AZ91D has an increasing specific
damping capacity in respect to increasing stress: at 7, 14, 20, 25 and 30 MPa, the
damping capacities are 2.67, 5.33, 12.0, 16.0 and 29.33%, respectively.44
It is unclear if
there is an upper bound to the increasing specific damping capability of the AZ alloys
with applied stress. Nonetheless, this behavior suggests increased energy dissipation at
higher stresses.
6.4 MAX Phase Microstructure and Morphology on Fracture
Fracture edge surfaces of Cr2AlC and Ti3SiC2 composites were observed and
compared using optical microscopy (Figs. 40, 41). Fracture edges for Cr2AlC reinforced
composites were shown to be wavy with jagged features at higher magnification. Fracture
edges for Ti3SiC2 reinforced composites were shown to be straight with smooth features
at higher magnification. The fracture edges in both composites can be described entirely
by the reinforcement grain microstructure and morphology.
In regards to the Cr2AlC reinforced composites, the wavy fracture edge appears to
be due to the circular grain morphology. The jagged features on the fracture edge can be
explained the lack of a kinked and delaminated microstructure: the propagating crack
front is, for the majority of the time, forced to travel around the reinforcement grains.
This gives rise to the propagating crack front leaving a jagged fracture edge.

71
In regards to the Ti3SiC2 reinforced composites, the straight fracture edge is most
reasonably due to the elongated and rectangular shaped grain morphology. It is believed
that the propagating cracked front can force these kinked and delaminated grains to shear
and fracture off, leaving a straight smooth fracture edge behind.
72
7. Summary and Conclusions
MAX phase reinforced MMCs have been synthesized using Cr2AlC and Ti3SiC2
preform reinforcements melt infiltrated with Mg and Mg-alloys. Mg and Mg-alloy
composites were reinforced with 55 1 and 54 1 vol. % dense preforms of Cr2AlC and
Ti3SiC2, respectively. Microstructural and mechanical properties of these composites
were explored and it has been concluded that:
1) Aluminum containing Mg-alloys show enhances mechanical strengths for Ti3SiC2
reinforced composites. Specifically, the Ti/54/91 composite displayed the highest
properties in every mechanical test in this work. In contrast, the Ti/55/Mg composite
had the lowest mechanical properties of the Ti3SiC2/Mg composites.
2) The VH, UCS, Eeff(avg), E100(avg), and YS testing results do not display substantial
increases in mechanical strengths from the addition of Al wt. % content in the matrix
of Cr2AlC reinforced composites. It is hypothesized that Zn from the AZ alloys is
giving rise to a deleterious effect on the composite interface, causing an initial drop in
mechanical properties when comparing Cr2AlC composites with pure Mg and AZ31.
3) Nested, closed, fully reversible hysteresis loops were observed for every sample
fabricated in this work. These loops are representative of the damping capability of
Mg-alloys and the KNE solid behavior inherent to the MAX phases. Interestingly,
without having a microstructure dominated by kinked and delaminated grains, cyclic
hysteresis behavior persisted in the Cr2AlC reinforced MMC’s. Therefore, the nested,
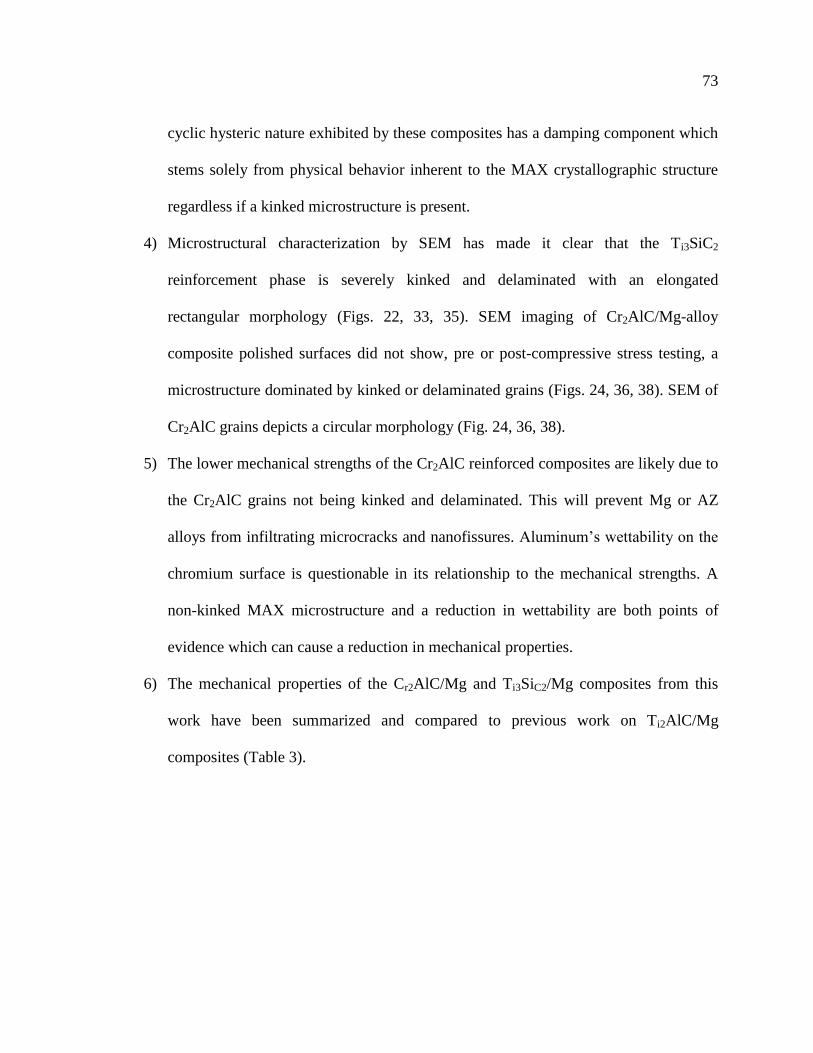
73
cyclic hysteric nature exhibited by these composites has a damping component which
stems solely from physical behavior inherent to the MAX crystallographic structure
regardless if a kinked microstructure is present.
4) Microstructural characterization by SEM has made it clear that the Ti3SiC2
reinforcement phase is severely kinked and delaminated with an elongated
rectangular morphology (Figs. 22, 33, 35). SEM imaging of Cr2AlC/Mg-alloy
composite polished surfaces did not show, pre or post-compressive stress testing, a
microstructure dominated by kinked or delaminated grains (Figs. 24, 36, 38). SEM of
Cr2AlC grains depicts a circular morphology (Fig. 24, 36, 38).
5) The lower mechanical strengths of the Cr2AlC reinforced composites are likely due to
the Cr2AlC grains not being kinked and delaminated. This will prevent Mg or AZ
alloys from infiltrating microcracks and nanofissures. Aluminum’s wettability on the
chromium surface is questionable in its relationship to the mechanical strengths. A
non-kinked MAX microstructure and a reduction in wettability are both points of
evidence which can cause a reduction in mechanical properties.
6) The mechanical properties of the Cr2AlC/Mg and Ti3SiC2/Mg composites from this
work have been summarized and compared to previous work on Ti2AlC/Mg
composites (Table 3).
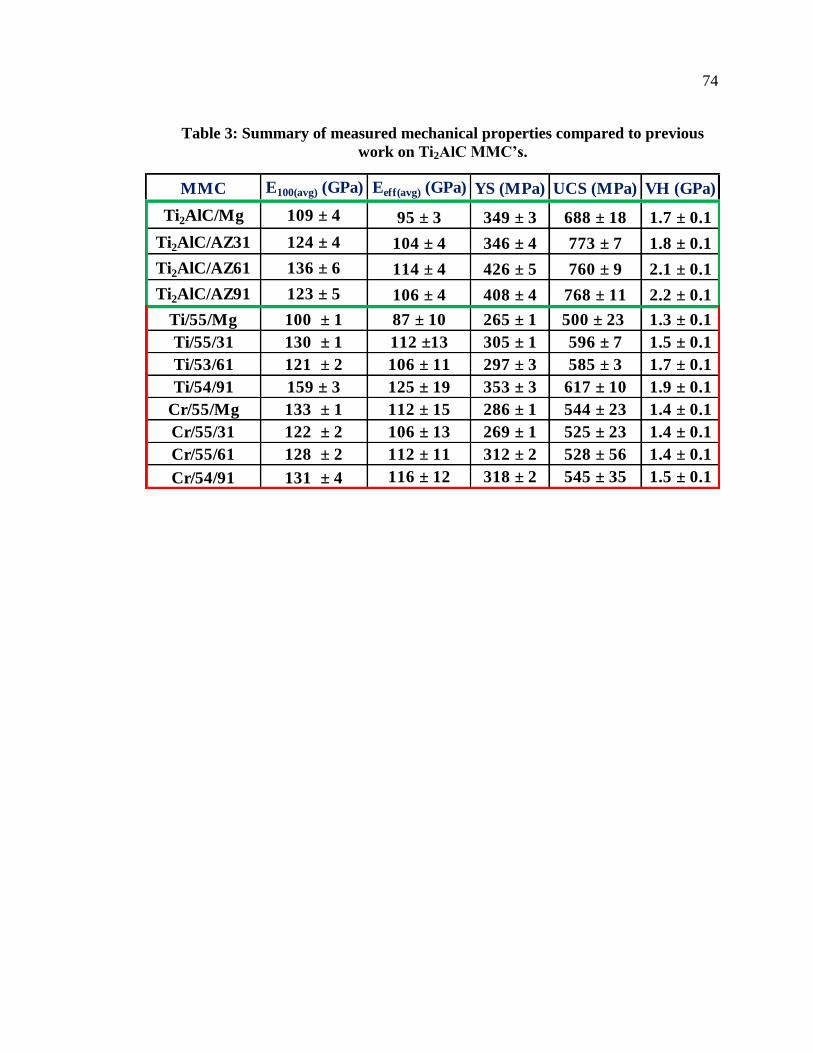
74
Table 3: Summary of measured mechanical properties compared to previous
work on Ti2AlC MMC’s.
MMC E100(avg) (GPa) Eeff(avg) (GPa) YS (MPa) UCS (MPa) VH (GPa)
Ti2AlC/Mg 109 ± 4 95 ± 3 349 ± 3 688 ± 18 1.7 ± 0.1
Ti2AlC/AZ31 124 ± 4 104 ± 4 346 ± 4 773 ± 7 1.8 ± 0.1
Ti2AlC/AZ61 136 ± 6 114 ± 4 426 ± 5 760 ± 9 2.1 ± 0.1
Ti2AlC/AZ91 123 ± 5 106 ± 4 408 ± 4 768 ± 11 2.2 ± 0.1
Ti/55/Mg 100 ± 1 87 ± 10 265 ± 1 500 ± 23 1.3 ± 0.1
Ti/55/31 130 ± 1 112 ±13 305 ± 1 596 ± 7 1.5 ± 0.1
Ti/53/61 121 ± 2 106 ± 11 297 ± 3 585 ± 3 1.7 ± 0.1
Ti/54/91 159 ± 3 125 ± 19 353 ± 3 617 ± 10 1.9 ± 0.1
Cr/55/Mg 133 ± 1 112 ± 15 286 ± 1 544 ± 23 1.4 ± 0.1
Cr/55/31 122 ± 2 106 ± 13 269 ± 1 525 ± 23 1.4 ± 0.1
Cr/55/61 128 ± 2 112 ± 11 312 ± 2 528 ± 56 1.4 ± 0.1
Cr/54/91 131 ± 4 116 ± 12 318 ± 2 545 ± 35 1.5 ± 0.1
75
8. Future Work
8.1 Effect of Preform Density on Mechanical Properties
The difference in mechanical properties between the two Ti3SiC2/AZ31
composites stemming from the vol. % density of the porous Ti3SiC2 sintered preforms is
considerable. The effect of a small change in preform density (+3%) shows a
considerable increase in mechanical properties. A full evaluation of mechanical
properties for the two Ti3SiC2/AZ31 MMCs also compared with the Ti/54/91 composite
which had the highest mechanical properties in this work (Table 2).
Although there was only a 3% increase in the effective modulus at 200 MPa, there
are large increases in the VH, YS and UCS. Therefore it is suggested that future work
investigating the mechanical properties with 60 vol.% reinforcement and 40 vol.% matrix
composites should be investigated; especially for the work involving Ti2AlC/AZ91 and
TiC/AZ91 composites.
8.2 Mg2Si
It is thought that the Mg2Si reactant product creates a bonded Ti3SiC2
reinforcement and Mg matrix interface. If this is true, it may serve as the primary reason
for observing the low mechanical strengths seen in the Ti3SiC2/pure-Mg composite. In
contrary the Ti/54/91 composite, which showed the highest mechanical properties in this
work, also displays Mg2Si in its XRD spectra. Therefore it is unclear if the Mg2Si in the
Ti3SiC2/Mg composite plays an enhancing or detrimental role in regards to mechanical
76
properties. It has, however, been concluded that Mg2Si does indeed exist in between the
Ti3SiC2 reinforcement particles as confirmed by energy dispersive spectroscopy (Fig. 42).
The existence of Mg2Si needs to be further confirmed by surveying more areas of the
Ti3SiC2/Mg and Ti3SiC2/Mg-alloy composites in order to develop a solid foundation in
understanding how prevalent its volume fraction is in the composite microstructure.
Figure 42: SEM image displaying the Ti/55/31 composite location where EDS has
revealed the appropriate atomic % ratio consistent with Mg2Si.
77
9. Other Work Aspects
9.1 Safety
This work concerned itself with several aspects requiring safety considerations. In
general, the safety requirements to satisfy this work were always considered with strict
guidelines always being abided to and followed. The appropriate personal protective
equipment (PPE) for each work environment was always worn. In some circumstances,
the work environment demanded additional PPE.
Fine powder handling and mixing was a consistent activity in this work. Careful
consideration of handling and storage of metal and MAX phase powders was practiced.
Fine powders can be toxic if inhaled or ingested, and can be highly flammable or even
explosive if exposed to flame, spark, or locally increased temperatures. Metal and MAX
phase powders were stored in a flammable cabinet. A dust mask, gloves, safety glasses
and lab coat were always worn when working with metal or MAX phase powders. In the
case of milling MAX phase bricks at the Drexel Machine shop, a half-face respirator with
the appropriate filtration cartridges was worn in addition to the required PPE.
The vacuum hot press has high operating temperature (1600⁰C) capability and
uses electronically controlled hydraulics capable of pressing to 100 tons. The hot press
runs on low voltage and high amperage making it a potential deadly hazard. Taking the
necessary precautions to work in this environment was always practiced. Gloves, a lab
coat and safety glasses were always worn in this environment.
78
Instron mechanical testing equipment was used to gather all necessary data for the
analysis in this work. The Instron testing environment can cause serious injuries if it is
not respected. It is a heavy equipment environment with pinch points and the possibility
of shattered debris. Injuries such as crushed fingers or limbs can be the result of
inappropriate safety considerations. The proper PPE was always worn in this testing
environment. A thick plastic shield was always placed in front of the equipment during
testing to negate any sample shattering effects.
9.2 SOPS
All standard operating procedures and instructional training videos can be found
through accessing the password protected MAX Phase and MXene Research Group
website at http://max.materials.drexel.edu/.
9.3 MSDS
A complete list of MSDS for materials used in this work can be found can be
found through accessing the password protected MAX Phase and MXene Research
Group website at http://max.materials.drexel.edu/.
9.4 Standards
It has been reported previously in this work that the linear intercept method as
described by ASTM E112-10 was used for grain size analysis. Unique, specifically
designed ultimate compression and cyclic compression tests for this work have no
documented standard. However, there are similar standards for testing composites such as
the ASTM C1358 series of standards. Although these standards can be observed as
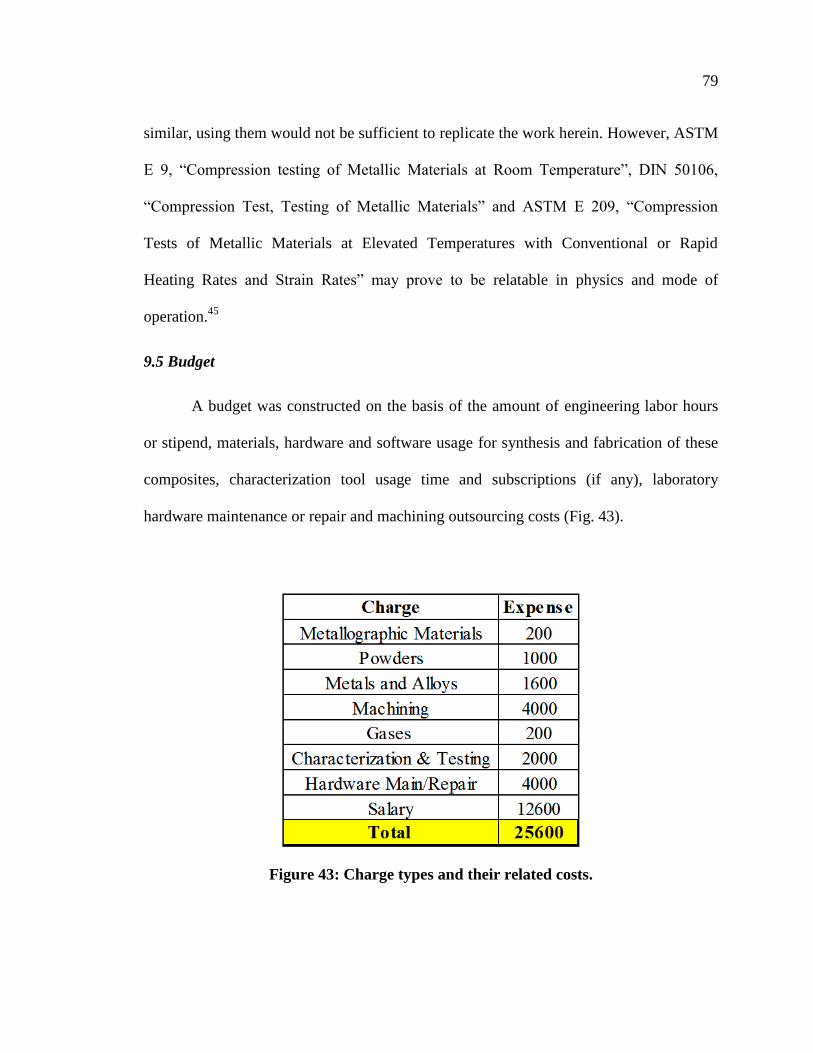
79
similar, using them would not be sufficient to replicate the work herein. However, ASTM
E 9, “Compression testing of Metallic Materials at Room Temperature”, DIN 50106,
“Compression Test, Testing of Metallic Materials” and ASTM E 209, “Compression
Tests of Metallic Materials at Elevated Temperatures with Conventional or Rapid
Heating Rates and Strain Rates” may prove to be relatable in physics and mode of
operation.45
9.5 Budget
A budget was constructed on the basis of the amount of engineering labor hours
or stipend, materials, hardware and software usage for synthesis and fabrication of these
composites, characterization tool usage time and subscriptions (if any), laboratory
hardware maintenance or repair and machining outsourcing costs (Fig. 43).
Figure 43: Charge types and their related costs.
80
9.6 Ethics
No studies on toxicity were performed on the materials in this work. It is however
to be assumed that Cr2AlC may have toxic or carcinogenic effects as chromium is already
considered carcinogenic and a hazard to human health. The final composite products
synthesized in this work have no odor, leave no residue behind and are completely stable
at ambient conditions.
These composites, which show improved mechanical properties to that of the AZ
alloys used as their matrices, may offer a better safety figure of merit for applications in
aircraft and automotive industries. This is one of the positive outcomes of creating these
materials: envisioning their usage one day in important applications for society’s use.
The current processing techniques to create these composites have a very low
environmental impact: waste is on a low scale and any waste products have a good
possibility to be recycled and reused again or used for other applications. The energy
consumption of vacuum hot pressing of such small scale materials, however, is not a
sustainable process for industrial use. A more effective and efficient one-step processing
method would need to be developed in order to industrialize these materials for use.
9.7 Time Management
A careful assessment of time management was necessary in order to complete a
quality thesis successfully. A Gantt chart was created early in the fall quarter of the 2013-
2014 academic year to provide target dates, give clarity on progress and ultimately stay
on schedule for graduation (Fig 44).
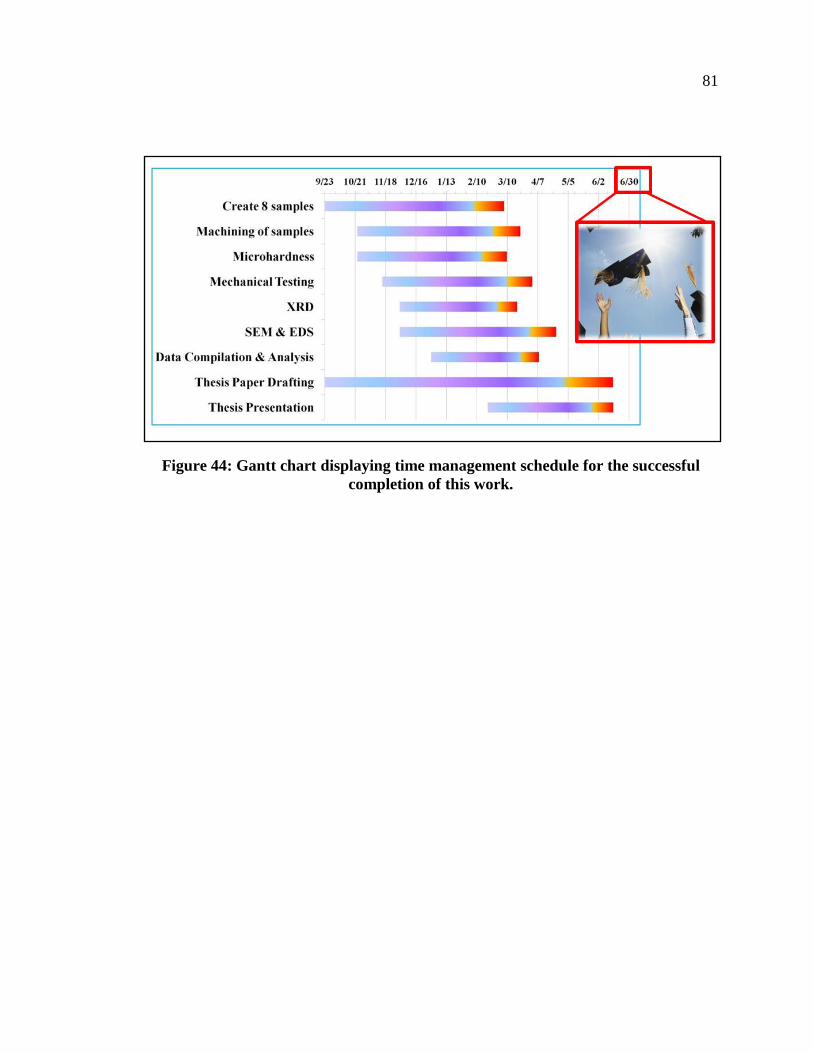
81
Figure 44: Gantt chart displaying time management schedule for the successful
completion of this work.
82
List of References
1 Fridell, J. Military Technology. 20-25 (Lerner Publications Co., 2008).
2 Gupta, M. & Sharon, N. M. L. 277 (Wiley, Honoken, NJ, USA, 2010).
3 Mordike, B. L. & Ebert, T. Magnesium: Properties — applications — potential.
Materials Science and Engineering: A 302, 37-45 (2001).
4 Barrena, M. I., de Salazar, J. M. G., Matesanz, L. & Soria, A. Effect of heat
treatments on oxidation kinetics in AZ91 and AM60 magnesium alloys. Materials
Characterization 62, 982-986, doi:10.1016/j.matchar.2011.07.001 (2011).
5 Friedrich, H. & Schumann, S. Research for a "new age of magnesium" in the
automotive industry. Journal of Materials Processing Technology 117, 276-281
(2001).
6 Furuya, H., Kogiso, N., Matunaga, S. & Senda, K. Applications of Magnesium
Alloys for Aerospace Structure Systems. Trans Tech Publ, 341-348 (2000).
7 (ed Number of scientific articles which have terms AZ91 or AZ31 in the
abstract) (Cambridge Scientific Abstracts Database, 2009).
8 Miracle, D. B. & Donaldson, S. L. in ASM Handbook Vol. 21 3-17 (ASM
International, 2001).
9 Rawal, S. Metal-matrix composites for space applications. Jom-Journal of the
Minerals Metals & Materials Society 53, 14-17, doi:10.1007/s11837-001-0139-z
(2001).
10 Ye, H. & Liu, X. Review of recent studies in magnesium matrix composites.
Journal of Materials Science 39, 6153-6171,
doi:10.1023/b:jmsc.0000043583.47148.31 (2004).
11 Thakur, S. K., Srivatsan, T. S. & Gupta, M. Synthesis and mechanical behavior of
carbon nanotube-magnesium composites hybridized with nanoparticles of
alumina. Materials Science and Engineering a-Structural Materials Properties
Microstructure and Processing 466, 32-37, doi:10.1016/j.msea.2007.02.122
(2007).
83
12 Yoo, S. J., Han, S. H. & Kim, W. J. Magnesium matrix composites fabricated by
using accumulative roll bonding of magnesium sheets coated with carbon-
nanotube-containing aluminum powders. Scripta Materialia 67, 129-132,
doi:10.1016/j.scriptamat.2012.03.040 (2012).
13 Babu, J. S. S., Nair, K. P., Unnikrishnan, G., Kang, C. G. & Kim, H. H.
Fabrication and Properties of Magnesium (AM50)-based Hybrid Composites with
Graphite Nanofiber and Alumina Short Fiber. Journal of Composite Materials 44,
971-987, doi:10.1177/0021998309349548 (2010).
14 Chawla, N. & Chawla, K. K. (Spring Science+Business Media, Inc., New
York, NY, 2006).
15 Kevorkijan, V. Mg AZ80/SiC composite bars fabricated by infiltration of porous
ceramic preforms. Metallurgical and Materials Transactions a-Physical
Metallurgy and Materials Science 35A, 707-715, doi:10.1007/s11661-004-0381-4
(2004).
16 Wang, H. Y., Jiang, Q. C., Wang, Y., Ma, B. X. & Zhao, F. Fabrication of TiB2
particulate reinforced magnesium matrix composites by powder metallurgy.
Materials Letters 58, 3509-3513,
doi:http://dx.doi.org/10.1016/j.matlet.2004.04.038 (2004).
17 Information, G. A. P. C. O. n. GE Aviation selects Indiana for $100 million jet
engine assembly factory,
<http://www.geaviation.com/press/other/other_20140326.html> (2014).
18 Lloyd, D. J. Partilce reinforced aluminum magnesium matrix composites.
International Materials Reviews 39, 1-23 (1994).
19 Reddy, S. U., Srikanth, N., Gupta, M. & Sinha, S. K. Enhancing the properties of
magnesium using SiC particulates in sub-micron length scale. Advanced
Engineering Materials 6, 957-964 (2004).
20 Ugandhar, S., Gupta, M. & Sinha, S. K. Enhancing strength and ductility of
Mg/SiC composites using recrystallization heat treatment. Composite Structures
72, 266-272, doi:http://dx.doi.org/10.1016/j.compstruct.2004.11.010 (2006).
21 Saravanan, R. A. & Surappa, M. K. Fabrication and characterisation of pure
magnesium-30 vol.% SiCP particle composite. Materials Science and
Engineering: A 276, 108-116, doi:http://dx.doi.org/10.1016/S0921-
5093(99)00498-0 (2000).
84
22 Gupta, M., Lai, M. O. & Saravanaranganathan, D. Synthesis, microstructure and
properties characterization of disintegrated melt deposited Mg/SiC composites.
Journal of Materials Science 35, 2155-2165 (2000).
23 Contreras, A., López, V. H. & Bedolla, E. Mg/TiC composites manufactured by
pressureless melt infiltration. Scripta Materialia 51, 249-253,
doi:http://dx.doi.org/10.1016/j.scriptamat.2004.04.007 (2004).
24 Contreras, A., Leon, C. A., Drew, R. A. L. & Bedolla, E. Wettability and
spreading kinetics of Al and Mg on TiC. Scripta Materialia 48, 1625-1630,
doi:10.1016/s1359-6462(03)00137-4 (2003).
25 Osetzky, D. Macrocrystalline Graphite From Magnesium Carbide. Carbon 12,
517-523 (1974).
26 Anasori, B., Caspi, N. & Barsoum, M. W. Fabrication and Mechanical Properties
of Pressureless Melt Infiltrated Magnesium Alloy Composites Reinforced with
TiC and Ti2AlC Particles. Submitted for publication (2014).
27 Wang, J.-j., Guo, J.-h. & Chen, L.-q. TiC/AZ91D composites fabricated by in situ
reactive infiltration process and its tensile deformation. Transactions of
Nonferrous Metals Society of China 16, 892-896,
doi:http://dx.doi.org/10.1016/S1003-6326(06)60346-4 (2006).
28 Cao, W., Zhang, C. F., Fan, T. X. & Zhang, D. In Situ Synthesis and Compressive
Deformation Behaviors of TiC Reinforced Magnesium Matrix Composites.
Materials Transactions 49, 2686-2697, doi:10.2320/matertrans.MRA2008157
(2008).
29 Chen, L. Q., Dong, Q., Zhao, M. J., Bi, J. & Kanetake, N. Synthesis of TiC/Mg
composites with interpenetrating networks by in situ reactive infiltration process.
Materials Science and Engineering a-Structural Materials Properties
Microstructure and Processing 408, 125-130, doi:10.1016/j.msea.2005.07.036
(2005).
30 Barsoum, M. W. MAX Phases: Properties of Machinable Ternary Carbides and
Nitrides. 436 (Wiley-VCH, 2013).
31 Liu, Z., Waki, T., Tabata, Y. & Nakamura, H. Mn-doping-induced itinerant-
electron ferromagnetism in Cr2GeC. Physical Review B 89,
doi:10.1103/PhysRevB.89.054435 (2014).
32 Ingason, A. S. et al. A Nanolaminated Magnetic Phase: Mn2GaC. Materials
Research Letters 2, 89-93, doi:10.1080/21663831.2013.865105 (2013).
85
33 Anasori, B. Table of the known Mn+1AXn phases,
<http://max.materials.drexel.edu/research-areas/max-phases/> (2013).
34 Barsoum, M. W. & El-Raghy, T. The MAX phases: Unique new carbide and
nitride materials - Ternary ceramics turn out to be surprisingly soft and
machinable, yet also heat-tolerant, strong and lightweight. American Scientist 89,
334-343, doi:10.1511/2001.28.736 (2001).
35 Barsoum, M. W., Zhen, T., Kalidindi, S. R., Radovic, M. & Murugaiah, A. Fully
reversible, dislocation-based compressive deformation of Ti3SiC2 to 1GPa.
Nature Materials 2, 107-111, doi:10.1038/nmat814 (2003).
36 Zhou, A. G. & Barsoum, M. W. Kinking nonlinear elastic deformation of
Ti3AlC2, Ti2AlC, Ti3Al(C-0.5,N-0.5)(2) and Ti2Al(C-0.5,N-0.5). Journal of
Alloys and Compounds 498, 62-70, doi:10.1016/j.jallcom.2010.03.099 (2010).
37 Amini, S., Ni, C. & Barsoum, M. W. Processing, microstructural characterization
and mechanical properties of a Ti2AlC/nanocrystalline Mg-matrix composite.
Composites Science and Technology 69, 414-420,
doi:http://dx.doi.org/10.1016/j.compscitech.2008.11.007 (2009).
38 Amini, S. et al. On the Stability of Mg Nanograins to Coarsening after Repeated
Melting. Nano Letters 9, 3082-3086, doi:10.1021/nl9015683 (2009).
39 Barsoum, M. W. & El-Raghy, T. Synthesis and Characterization of a Remarkable
Ceramic: Ti3SiC2. Journal of the American Ceramic Society 79, 1953-1956,
doi:10.1111/j.1151-2916.1996.tb08018.x (1996).
40 Zhou, W. B., Mei, B. C. & Zhu, J. Q. On the synthesis and properties of bulk
ternary Cr2AlC ceramics. Materials Science-Poland 27, 973-980 (2009).
41 Alloy Data: Magnesium Alloys,
<http://www.tcdcinc.com/media/2009_NADCA_Alloy_Data.pdf> (2009).
42 Barsoum, M. W. & Basu, S. in Encyclopedia of Materials: Science and
Technology (eds K.H.J. Buschow et al.) 1-23 (Elsevier, Oxford, 2010).
43 Staff, M. E. RSMeans Illustrated Construction Dictionary. (John Wiley & Sons,
2012).
44 Housh, S., Mikucki, B. & Stevenson, A. in ASM Vol. 2 Ch. Selection and
Application of Magnesium and Magnesium Alloys, (ASM International, 2005).
45 Kuhn, H. A. Uniaxial Compression Testing. Vol. 8 (ASM International, 2005).