Embed Size (px)
Citation preview
Synthesis and Comparison of Baseline Avian and Bat Use, Raptor Nesting and Mortality Information from Proposed and Existing Wind Developments
FINAL
Prepared for:
Bonneville Power Administration PO Box 3621
Portland, Oregon 97208-3621
Prepared by:
Wally Erickson Greg Johnson David Young
Dale Strickland Rhett Good
Michelle Bourassa Kim Bay
Karyn Sernka
WEST, Inc. 2003 Central Ave.
Cheyenne, WY 82001
Foote Creek Rim, WY. photo by David Young
December 2002
AVIAN AND BAT BASELINE DATA AND MORTALITY SYNTHESIS WEST, Inc. i
TABLE OF CONTENTS
EXECUTIVE SUMMARY .......................................................................................................... 1
INTRODUCTION....................................................................................................................... 10
METHODS .................................................................................................................................. 13
AVIAN MORTALITY ............................................................................................................. 13
AVIAN USE ............................................................................................................................. 13
RAPTOR NESTING................................................................................................................. 15
BAT USE AND MORTALITY................................................................................................ 16
RESULTS AND DISCUSSION ................................................................................................. 16
AVIAN MORTALITY AND USE........................................................................................... 16 All Raptors/Vultures ............................................................................................................... 19
Agricultural Landscapes ................................................................................................... 19 Native Landscapes ............................................................................................................ 20 Summary/Impact Prediction ............................................................................................. 21
Buteos ..................................................................................................................................... 22 Agricultural Landscapes ................................................................................................... 22 Native Landscapes ............................................................................................................ 23 Summary/Impact Prediction ............................................................................................. 23
Golden Eagles ......................................................................................................................... 24 Agricultural Landscapes ................................................................................................... 24 Native Landscapes ............................................................................................................ 24 Summary/Impact Prediction ............................................................................................. 26
Large Falcons.......................................................................................................................... 27 Agricultural Landscapes ................................................................................................... 27 Native Landscapes ............................................................................................................ 27 Summary/Impact Prediction ............................................................................................. 27
Small Falcons.......................................................................................................................... 28 Agricultural Landscapes ................................................................................................... 29 Native Landscapes ............................................................................................................ 29 Summary/Impact Prediction ............................................................................................. 29
Northern Harriers .................................................................................................................... 30 Agricultural Landscapes ................................................................................................... 30 Native Landscapes ............................................................................................................ 30 Summary/Impact Prediction ............................................................................................. 31
Accipiters ................................................................................................................................ 31 Agricultural Landscapes ................................................................................................... 31 Native Landscapes ............................................................................................................ 32 Summary/Impact Prediction ............................................................................................. 32
Waterfowl/Waterbirds............................................................................................................. 32 Agricultural Landscapes ................................................................................................... 32 Native Landscapes ............................................................................................................ 33

AVIAN AND BAT BASELINE DATA AND MORTALITY SYNTHESIS WEST, Inc. ii
Summary/Impact Prediction ............................................................................................. 33 Passerines................................................................................................................................ 34 Other Species/Bird Groups ..................................................................................................... 36
RAPTOR NESTING................................................................................................................. 36
BAT MORTALITY AND USE AT WIND PLANTS ............................................................. 37
OVERALL CONCLUSIONS .................................................................................................... 46
ACKNOWLEDGEMENTS ....................................................................................................... 49
LITERATURE CITED .............................................................................................................. 50
APPENDIX A. REVIEWERS COMMENTS AND RESPONSES...................................... 109
AVIAN AND BAT BASELINE DATA AND MORTALITY SYNTHESIS WEST, Inc. iii
LIST OF TABLES
Table 1. List of studies/study areas and data components used in this report for sites categorized as within agricultural landscapes. ................................................................... 61
Table 2. List of studies/study areas and data components used in this report for sites categorized as within predominantly native landscapes. ................................................... 62
Table 3. Description of raptor nest survey methods for relevant study areas........................ 63 Table 4. Description of study areas of avian mortality used for species composition or
fatality estimates................................................................................................................. 64 Table 5. Composition of fatalities from U.S. wind projects. ................................................. 66 Table 6. Estimates of avian collision mortality by wind resource areas................................ 67 Table 7. Mean raptor/vultures use estimates (estimated #/20-min survey) by study areas. .. 68 Table 8. Pearson correlations among all raptor/vulture seasonal use estimates. ................... 69 Table 9. Mean buteo use estimates (estimated #/20-min survey) for several study areas. .... 70 Table 10. Pearson correlations among buteo seasonal use estimates. ................................... 71 Table 11. Mean golden eagle use estimates (estimated #/20-min survey) for several study
areas. .................................................................................................................................. 72 Table 12. Pearson correlations among golden eagle seasonal use estimates. ........................ 73 Table 13. Mean large falcon use estimates (estimated #/20-min survey) for several study
areas. .................................................................................................................................. 74 Table 14. Pearson correlations among large falcon seasonal use estimates. ......................... 75 Table 15. Mean small falcon use estimates (estimated #/20-min survey) for several study
areas. .................................................................................................................................. 76 Table 16. Pearson correlations among small falcon seasonal use estimates.......................... 77 Table 17. Mean northern harrier use estimates (estimated #/20-min survey) for several study
areas. .................................................................................................................................. 78 Table 18. Pearson correlations among northern harrier seasonal use estimates. ................... 79 Table 19. Mean accipiter use estimates (estimated #/20-min survey) for several study areas.
............................................................................................................................................ 80 Table 20. Pearson correlations among accipiter seasonal use estimates. .............................. 81 Table 21. Mean waterfowl/waterbird use estimates (estimated #/20-min survey) for several
study areas.......................................................................................................................... 82 Table 22. Pearson correlations among waterfowl/waterbird seasonal use estimates............. 83 Table 23. Number of active nests and estimated density (excluding inconspicuous ground
nesting species) for cultivated agriculture wind projects. .................................................. 84 Table 24. Nesting information for raptors (excluding inconspicuous ground nesting species)
for native wind projects in native landscapes. ................................................................... 85 Table 25. Bat mortality estimates at U.S. wind plants........................................................... 86 Table 26. Timing of bat collision mortality at U.S. wind plants ........................................... 87 Table 27. Composition of bat collision fatalities at U.S. wind plants ................................... 88 Table 28. Habitat at U.S. wind plants with bat mortality. ..................................................... 89
AVIAN AND BAT BASELINE DATA AND MORTALITY SYNTHESIS WEST, Inc. iv
LIST OF FIGURES
Figure 1. Timing of avian fatality discoveries for the Foote Creek Rim (WY) and Buffalo Ridge (MN) wind projects. ................................................................................................ 90
Figure 2. Total raptor/vulture use (standardized to #/20-minute survey) for study areas in agricultural landscapes. ...................................................................................................... 91
Figure 3. Total raptor/vulture use (standardized to #/20-minute survey) for study areas in native landscapes................................................................................................................ 92
Figure 4. Total buteo use (standardized to #/20-minute survey) for study areas in agricultural landscapes. ......................................................................................................................... 93
Figure 5. Total buteo use (standardized to #/20-minute survey) for study areas in native landscapes. ......................................................................................................................... 94
Figure 6. Total eagle use (standardized to #/20-minute survey, primarily golden eagles) for study areas in agricultural landscapes. ............................................................................... 95
Figure 7. Total eagle use (standardized to #/20-minute survey, primarily golden eagles) for study areas in native landscapes......................................................................................... 96
Figure 8. Total large falcon use (standardized to #/20-minute survey) for study areas in agricultural landscapes. ...................................................................................................... 97
Figure 9. Total large falcon use (standardized to #/20-minute survey) for study areas in native landscapes. ......................................................................................................................... 98
Figure 10. Total small falcon use (standardized to #/20-minute survey) for study areas in agricultural landscapes. ...................................................................................................... 99
Figure 11. Total small falcon use (standardized to #/20-minute survey) for study areas in native landscapes.............................................................................................................. 100
Figure 12. Total northern harrier use (standardized to #/20-minute survey) for study areas in agricultural landscapes. .................................................................................................... 101
Figure 13. Total northern harrier use (standardized to #/20-minute survey) for study areas in native landscapes.............................................................................................................. 102
Figure 14. Total accipiter use (standardized to #/20-minute survey) for study areas in agricultural landscapes. .................................................................................................... 103
Figure 15. Total accipiter use (standardized to #/20-minute survey) for study areas in native landscapes. ....................................................................................................................... 104
Figure 16. Total waterfowl use (standardized to #/20-minute survey) for study areas in agricultural landscapes. .................................................................................................... 105
Figure 17. Total waterfowl/waterbird use (standardized to #/20-minute survey) for study areas in native landscapes. ............................................................................................... 106
Figure 18. Percent composition of annual bird mortality estimates from various anthropogenic sources (Erickson et al. 2001) .................................................................. 107
Figure 19. Bird fatality rates at wind projects in the U.S. (Erickson et al. 2001)............... 108

AVIAN AND BAT BASELINE DATA AND MORTALITY SYNTHESIS WEST, Inc. 1
EXECUTIVE SUMMARY
Purpose/Need
Primarily due to concerns generated from observed raptor mortality at the Altamont Pass (CA)
wind plant, one of the first commercial electricity generating wind plants in the U.S., new
proposed wind projects both within and outside of California have received a great deal of
scrutiny and environmental review. A large amount of baseline and operational monitoring data
have been collected at proposed and existing U.S. wind plants. The primary use of the avian
baseline data collected at wind developments has been to estimate the overall project impacts
(e.g., very low, low, moderate, and high relative mortality) on birds, especially raptors and
sensitive species (e.g., state and federally listed species). In a few cases, these data have also
been used for guiding placement of turbines within a project boundary. This new information
has strengthened our ability to accurately predict and mitigate impacts from new projects.
This report should assist various stakeholders in the interpretation and use of this large
information source in evaluating new projects. This report also suggests that the level of
baseline data (e.g., avian use data) required to adequately assess expected impacts of some
projects may be reduced. This report provides an evaluation of the ability to predict direct
impacts on avian resources (primarily raptors and waterfowl/waterbirds) using less than an entire
year of baseline avian use data (one season, two seasons, etc.). This evaluation is important
because pre-construction wildlife surveys can be one of the most time-consuming aspects of
permitting wind power projects.
For baseline data, this study focuses primarily on standardized avian use data usually collected
using point count survey methodology and raptor nest survey data. In addition to avian use and
raptor nest survey data, other baseline data is usually collected at a proposed project to further
quantify potential impacts. These surveys often include vegetation mapping and state or federal
sensitive-status wildlife and plant surveys if there is a likelihood of these species occurring in the
vicinity of the project area. This report does not address these types of surveys, however, it is
assumed in this document that those surveys are conducted when appropriate to help further
quantify potential impacts.

AVIAN AND BAT BASELINE DATA AND MORTALITY SYNTHESIS WEST, Inc. 2
The amount and extent of ecological baseline data to collect at a wind project should be
determined on a case-by-case basis. The decision should use information gained from this
report, recent information from new projects (e.g., Stateline OR/WA), existing project site data
from agencies and other knowledgeable groups/individuals, public scoping, and results of
vegetation and habitat mapping. Other factors that should also be considered include the
likelihood of the presence of sensitive species at the site and expected impacts to those species,
project size and project layout.
Data Used in This Analysis
Erickson et al. (2001) recently summarized the operational fatality monitoring data available
through the middle of 2001. This report contains a meta-analysis1 that extends the Erickson et
al. (2001) mortality summary to include both baseline data on avian and bat use2, raptor nesting3,
and operational avian and bat fatality monitoring data, including recently collected data at the
Foote Creek Rim (WY), Stateline (OR/WA), Klondike (OR), and Buffalo Mountain (TN) wind
plants. Over 30 study areas from 15 Wind Resource Areas (WRA) were used in at least one of
the following components of this synthesis: avian mortality, avian use, raptor nesting, bat
mortality and bat use.
Results
Raptor Mortality at Altamont Pass (CA) - Reported raptor mortality at Altamont Pass (CA),
has ranged from 0.05 to 0.10 fatalities per turbine per year (Erickson et al. 2001). Pre-
construction raptor use is generally lower at other wind projects compared to the Altamont area.
Approximately 50% of the turbines currently in operation at Altamont Pass (CA) (approximately
3,000 out of 5,400) are Kenetech 56-100 turbines equipped on 18 m lattice towers, with rotor
diameters of 18 m, down-wind blades spinning at approximately 60 revolutions per
minute (rpm), with tips within 9 meters of the ground. These turbines are located in a high
1 combining or synthesizing information 2 use or utilization refers to a measure of relative abundance of a site by a species or group of species as measured by a standard
survey methodology 3 nest surveys targeting species that are efficiently surveyed from the air

AVIAN AND BAT BASELINE DATA AND MORTALITY SYNTHESIS WEST, Inc. 3
density and clustered arrangement within the 60 mi2 WRA. Recent studies suggest the 56-100
turbines may cause higher golden eagle mortality than other turbine types (Hunt 2002). The
cause of the higher raptor mortality at Altamont is likely a combination of several factors
including those listed above (turbine types and configurations), as well as raptor use of the area.
Raptor use and prey availability are very high at Altamont Pass (CA), relative to the surrounding
area. These fatality rates (an estimated 30 to 70 golden eagle fatalities per year), coupled with
the large number of turbines in one area (approximately 5,400 within a 60 mile2 tract), have
contributed to the concerns over possible population level effects on golden eagles (Orloff and
Flannery 1992, Hunt 2002).
Raptor Mortality at New Generation Wind Projects - In contrast to Altamont Pass (CA),
raptor mortality has been absent to relatively low at all newer generation wind plants in the U.S.
These wind plants are made up of fewer larger, slower moving turbines (greater than 40 m rotor
diameter, with less than 30 blade rpm’s) (Erickson et al. 2001). Fatality estimates expressed as
the number of raptor fatalities per turbine per year have ranged from 0 to 0.04 for new generation
wind turbines. In addition, it would take approximately 3 to 8 average Altamont Pass (CA)
turbines4 to make up the same rotor swept area as a single typical new generation wind turbine
(600 kW – 1.5 MW per turbine). The 0.04 raptor fatalities per turbine per year for the 42-44 m
rotor diameter turbines at Foote Creek Rim (WY), which is the upper range of raptor fatality
rates for new generation wind projects, would equate to 3 raptor fatalities/100,000 m2 rotor swept
area (RSA). This estimate is approximately 3-7 times lower than at Altamont (CA; 9-22 raptor
fatalities/100,000 m2 RSA).
Raptor Nesting - There has been low raptor mortality observed at new wind projects, especially
for the species that are targeted during the aerial nest surveys (buteos and other species visible
from the air). Empirical data relating raptor nest density to mortality are insufficient to detect
any relationship between these measures. Raptors nesting closest to turbines are likely to have
higher probabilities of being impacted from disturbance (construction and operation) or from
collision with turbines, but data on nests very close to turbines (e.g., within ½ mile) is currently
4 Assumes an average Altamont turbine is 150 kW; the Kenetech 56-100 turbine is a 100 kW machine.
AVIAN AND BAT BASELINE DATA AND MORTALITY SYNTHESIS WEST, Inc. 4
inadequate to determine the level of these impacts. The golden eagle fatalities at Altamont Pass
(CA) have been comprised primarily of non-breeders (subadults5 and floaters6) that tend to have
larger home ranges. The population of golden eagles studied by Hunt (2002) appears to be
increasing even with the estimated 30 to70 annual golden eagle fatalities from the Altamont Pass
(CA) wind plant, although the population effects from sustained mortality over a longer period of
time is not known. Occupancy rates of established and known golden eagle territories have been
100% in most years. The existing wind plant with the highest nest density of target raptors
(species that are effectively sampled from the air) is Foote Creek Rim (WY), with red-tailed
hawks the most common nesting raptor within two miles of the turbines. No red-tailed hawk
fatalities have been observed at this site.
Waterfowl Mortality - Some waterfowl mortality has been documented at several wind plants,
although in relatively low numbers. Wind plants with significant sources of open water near
turbines (San Gorgonio (CA) and Buffalo Ridge (MN)) have the highest documented waterfowl
mortality, with 10 to 20% of all fatalities consisting of waterfowl and waterbirds. We are aware
of only one Canada goose fatality documented at wind projects. Waterfowl and waterbird use at
sites within native landscapes, with the exception of San Gorgonio, was relatively low.
Waterfowl and waterbird use at the sites within agricultural landscapes, with the exception of
Buffalo Ridge, was low except during winter, with some sites showing higher use during this
season primarily due to occasional observations of large flocks of Canada geese.
Passerine Mortality – Protected passerines7 have been the most common group of birds killed at
new wind plants, comprising over 80% of the fatalities reported. The mortality involves both
resident and migrant species (Erickson et al. 2001). It is estimated that about half of the
passerine fatalities involve nocturnal migrants, although no large episodic mortality event has
been known to occur (the largest single incident reported was 14 migrants found at two turbines
during a single search). Many passerine species are represented in the fatality lists, and data do
not suggest distinct patterns indicating a particular species or groups of species (e.g., flycatchers)
5 1-3 year-olds (non-breeders) 6 non-breeding adults 7 “perching” birds; includes songbirds and a few other species that are protected by the Migratory Bird Treaty Act.

AVIAN AND BAT BASELINE DATA AND MORTALITY SYNTHESIS WEST, Inc. 5
are more susceptible to collision. The level of nocturnal migrant mortality observed appears
very low relative to nocturnal passage rates of birds at the wind plants where both mortality and
nocturnal radar studies were conducted (San Gorgonio [CA], Buffalo Ridge [MN], and Stateline
[OR/WA]).
Bat Mortality - Some bat mortality can be expected at most wind plants, with a very large
majority of the fatalities involving migratory tree and foliage roosting bats such as hoary and
silver-haired bats in the western U.S., and hoary and eastern red bats in the Midwest and eastern
U.S. Bat collision mortality during the breeding season is virtually non-existent, despite the fact
that relatively large populations of some bat species have been documented in close proximity to
wind plants. These data suggest that wind plants do not currently impact resident breeding bat
populations in the U.S. All available evidence indicates that most of the bat mortality at U.S.
wind plants involves migrant or dispersing bats in the late summer and fall.
Bat echolocation and collision mortality studies indicate that only a small fraction of detected bat
passes near turbines result in collisions, and that there appears to be little relationship between
bat activity at turbines and subsequent collision mortality. This relationship may not exist
because many of the migrant species involved may either not be echolocating, or they are flying
too high for the bat detectors (Anabat®) to record, but still may be within the zone of collision
risk. One of the largest estimates of bat fatalities is from the wind plant at Buffalo Ridge (MN).
Preliminary data from this site collected during a five-year study suggest that the numbers of bats
susceptible to turbine collisions is large, but the observed mortality is not sufficient to cause
population declines of potentially affected bat species based on relatively stable fatality rates
over time. However, the effect on migrant populations of sustained collision mortality over
several years is not known.
Seasonal Avian Use - The relative abundance of raptors and other groups of birds at a site
appears to be an important contributing factor to the direct impacts of a wind plant on these
species. High correlations between seasonal use by a particular avian group, such as raptors,
and use estimates based on four seasons combined would suggest that use predictions using less
than four seasons would be similar to predictions from the four season study. These high

AVIAN AND BAT BASELINE DATA AND MORTALITY SYNTHESIS WEST, Inc. 6
correlations would indicate that sites with higher use in a single season or combination of
seasons typically have higher overall use. These use estimates, in combination with habitat and
nesting information, are compared to use estimates (and habitat and nesting information) from
other projects where mortality has been estimated. These comparisons have served as the basis
for making predictions such as the expected annual number of wind turbine collision fatalities for
a proposed wind plant.
In most cases we investigated (e.g., most raptor groups), baseline avian use data collected during
one season (usually spring, summer or fall) appear adequate for making overall wind plant direct
impact predictions (e.g., low, moderate or high relative mortality). Moderate to high correlations
between seasonal use estimates and overall use estimates exist for most of the raptor groups
considered, especially all raptors/vultures combined, buteo8, golden eagle9, northern harrier and
large falcons10. Sites can be accurately ranked in terms of use by these groups/species
reasonably well based on one season of data. Information regarding habitat, raptor nesting, and
other factors (e.g., project size and layout) strengthen these predictions. Buteo use at some
newer projects such as Buffalo Ridge (MN) is similar to buteo use at Altamont Pass (CA), where
a relatively large number of red-tailed hawk and other buteo fatalities have been documented.
Buteo mortality at most new projects, including Buffalo Ridge (MN) has been very low. Buffalo
Ridge (MN) is the only newer generation wind plant with any observed buteo mortality11. Using
Buffalo Ridge (MN) as a basis, we estimate only approximately one buteo fatality per year for
every 300 turbines.
Estimates of small falcon12 use tend to vary more among seasons and study areas with weaker
correlations between seasonal and overall estimates. Winter small falcon use in most areas
tended to be lower than during other seasons. American kestrels have been one of the most
commonly observed raptors at most wind projects, and typically are one of the most commonly
8 any of a genus of large, broad-winged hawks; broad winged hawk, red-tailed hawk, ferruginous hawk, rough-legged hawk,
Swainson’s hawk, that prey mainly on rodents 9 includes both bald and golden eagles, although golden eagles in these data sets comprise 95% of the observations 10 peregrine falcon, prairie falcon 11 based on available data through March 31, 2002 12 American kestrel, merlin
AVIAN AND BAT BASELINE DATA AND MORTALITY SYNTHESIS WEST, Inc. 7
observed raptor fatalities (Erickson et al. 2001).
Baseline raptor use has also been used in some cases to guide placement of turbines and facilities
(“micro-siting13”) within a wind project. Some proposed turbine locations were voluntarily
moved or dropped by developers based on patterns in raptor use at the Foote Creek Rim (WY),
Condon (OR), and Stateline (OR/WA) wind plants. The ability to identify concentration areas or
patterns in raptor use on a site is related to several factors, including topography, habitat types,
amount of bird use, and amount of data that are collected. The ability to micro-site turbines to
reduce mortality is improved as more data are collected, although distinct patterns are not always
apparent, even with multiple years of information. Sites with high raptor use, and comprised of
large tracts of high quality native habitat with high topographic relief (e.g., distinct ridges) and/or
containing other features (e.g., significant water sources, high prey base) that may lead to distinct
patterns in raptor use, are the strongest candidates for effective micro-siting. Many of the
project sites within agricultural landscapes do not typically meet any of these criteria and are
therefore not strong candidates for effective micro-siting.
Overall Conclusions
1. Raptor mortality has been absent to very low at all newer generation wind plants studied
in the U.S. This and other information regarding wind turbine design and wind
plant/wind turbine siting strongly suggests that the level of raptor mortality observed at
Altamont Pass is quite unique (e.g., unique likely because of the number and arrangement
of turbines in small area, turbine types, prey availability, raptor use) and can be avoided
at other locations.
2. The amount and extent of ecological baseline data to collect at a wind project should be
determined on a case-by-case basis. The decision should use information gained from
this report, recent information from new projects (e.g., Stateline OR/WA), existing
project site data from agencies and other knowledgeable groups/individuals, public
scoping, and results of vegetation and habitat mapping. Other factors that should also be
considered include the likelihood of the presence of sensitive species at the site and
13 Location or placement of turbines within a wind project

AVIAN AND BAT BASELINE DATA AND MORTALITY SYNTHESIS WEST, Inc. 8
expected impacts to those species, project size and project layout. 3. In the majority of the raptor groups we investigated (all raptors combined, buteos, golden
eagles, northern harriers, large falcons), baseline avian use data collected during one
season (spring, summer or fall) appear adequate for making overall wind plant direct
impact predictions (e.g., low, moderate or high relative mortality). This appears to be
especially true for sites in agricultural settings. Correlation analyses, in general, suggest
overall use predictions for these groups based on one or two seasons of information
would be similar to predictions from a four-season study. As a result, sites can be ranked
in terms of overall raptor, buteo, golden eagle and large falcon use reasonably well based
on one season of data collection (spring, summer or fall), compared to four seasons of
data collection. 4. In cases where baseline data or other information (e.g., historic data or habitat) indicate a
site has levels of raptor use considered high (regionally high, or in comparison to use at
other projects considered high (e.g., Altamont Pass (CA) and Foote Creek Rim (WY)
golden eagle use estimates), we recommend collecting more than one season of baseline
data to refine predictions and to make micro-siting decisions that might reduce impacts.
Sites with high raptor use, and comprised of large tracts of high quality native habitat
with high topographic relief (e.g., distinct ridges) and/or containing other features (e.g.,
significant water sources) that may lead to distinct patterns in raptor use are likely
candidates for effective micro-siting. Many of the project sites within agricultural
landscapes do not typically meet any of these criteria and are therefore not strong
candidates for effective micro-siting. 5. Raptor use (e.g., golden eagle use) may be a predictor of raptor risk (e.g., likelihood of
mortality) when comparing several sites and when comparing different areas within a
site. However, low raptor mortality at newer generation wind plants has resulted in low
correlation between use and fatality rates at these new projects. It is possible that the new
turbine designs and turbine-siting decisions made on avian use patterns have resulted in
reduced avian mortality. However, this has not been experimentally tested. 6. Wind plants with year-round waterfowl use have shown the highest waterfowl mortality,
although the levels of waterfowl/waterbird mortality appear very low compared to the
waterfowl/waterbird use of the sites. Sites within native landscapes have shown very low

AVIAN AND BAT BASELINE DATA AND MORTALITY SYNTHESIS WEST, Inc. 9
waterfowl use, except when significant water sources are available (e.g., San Gorgonio
[CA]). No waterfowl mortality has been documented at the Klondike (OR) wind plant
between January 1 and March 31 2002, although several Canada goose flocks have been
observed during surveys; and only one Canada goose fatality has been reported at any
U.S. wind plant.
7. Passerines comprise a large proportion of the fatalities at new wind plants, and involve
both residents and migrant species. Studies of nocturnal migration at several wind plants
suggest the mortality appears very low compared to the rates of bird targets passing
through the area.
8. Since few raptor species targeted during nest surveys (i.e., those visible from helicopter
surveys) have been observed as fatalities at newer wind plants, correlations are very low
between fatalities and overall raptor nest density (nest density within 2 miles of project
facilities). Raptors nesting closest to turbines likely have higher probabilities of being
impacted from disturbance (construction and operation) or from collision with turbines,
but data on nests very close to turbines (e.g., within ½ mile) are currently inadequate to
determine the level of these impacts. The existing wind plant with the highest reported
nest density is Foote Creek Rim (WY). Most of the nests within 2 miles of the wind
plant are red-tailed hawks, but no red-tailed hawk fatalities have been documented at this
site.
9. Bat collision mortality during the breeding season is virtually non-existent, despite the
fact that relatively large numbers of some bat species have been documented in close
proximity to wind plants. These data suggest that wind plants do not currently impact
resident breeding bat populations where they have been studied in the U.S.
10. All available evidence indicates that most of the bat mortality at U.S. wind plants
involves migrant or dispersing bats in the late summer and fall.
11. Bat echolocation and collision mortality studies suggest that only a small fraction of
detected bat passes near turbines result in collisions, and that there appears to be little
relationship between bat activity at turbines and subsequent collision mortality. This lack
of relationship between activity and mortality is probably because many of the migrant
species involved are either not echolocating or are flying too high for the bat detectors
(Anabat®) to record but still within the zone of collision risk.

AVIAN AND BAT BASELINE DATA AND MORTALITY SYNTHESIS WEST, Inc. 10
INTRODUCTION
Although generally considered environmentally friendly, wind power has been associated with
the death of birds colliding with turbines and other wind plant structures, especially in California
(Orloff and Flannery 1992, Erickson et al. 2001). Early wind energy facilities in the U.S. were
often constructed in areas without an understanding of the level of avian use at those locations.
Consequently some of these facilities are located where birds are abundant and the risk of turbine
collisions is high (AWEA 1995).
High raptor mortality documented at Altamont Pass (CA) (Howell and Didonato 1991, Orloff
and Flannery 1992, Orloff and Flannery 1996) has resulted in a great deal of scrutiny of other
wind plant developments. In the mid 1990’s, development of wind projects were delayed,
sometimes to a point that the project was not developed, due in part to avian collision concerns.
Wind plant design has changed significantly since the first large wind plants were developed in
California; many of these changes have appeared to reduce risk to birds. Turbines are now
typically installed on tubular steel towers instead of lattice towers and without open platforms at
the top of the tower, eliminating perching opportunities for raptors and other birds. We are
aware of only one occasion of a raptor perched on a new turbine (tubular, unguyed) based on
studies at Foote Creek Rim (WY) (Johnson et al. 2000a), Buffalo Ridge (MN) (Johnson et al.
2000b), Vansycle (OR) (Erickson et al. 2000b) and Stateline (OR/WA) (Jeffrey 2002, pers.
comm.). The nacelle, which houses the generator, drive train and gearbox on top of the tower, is
typically completely enclosed in the newer wind turbines. American kestrels were observed
nesting inside the nacelle of older turbines at one project in California, and kestrel mortality was
high, likely due to this increased use near the turbines (Howell 1997). Electrical lines between
turbines and from the turbine strings to substations in new generation wind plants are often
buried underground to eliminate perching opportunities, collisions with wires, and
electrocutions. Collisions with wires and electrocutions have been a common source of avian
mortality at Altamont Pass (CA) (Orloff and Flannery 1992) and other older wind projects.
Overhead lines within the wind plant have often been designed to minimize risk of raptor
electrocutions and anti-perching devices are often installed (e.g., Stateline [OR/WA] wind plant
AVIAN AND BAT BASELINE DATA AND MORTALITY SYNTHESIS WEST, Inc. 11
[Walla Walla Regional Planning Department 2000]). Turbines are much larger, with blades
moving at lower revolutions per minute (rpm) and are presumably more visible than blades on
the smaller older turbines. For example, the blades of the 1.5 MW turbines installed at the
Klondike (OR) wind plant turn at approximately 20 rpm’s, contrasted to approximately 60 rpm’s
for the Kenetech 56-100 downwind turbine, the most common turbine at the Altamont Pass (CA)
wind plant. Blade tip speeds of both large and small turbines are still fast (often 200+ mph).
Studies by Howell (1997) and Hunt (2002) provide some evidence indicating the Kenetech 56-
100 turbines (100 kW) have a higher associated raptor mortality rate than other turbine types,
including larger turbines. Hunt (2002) attributes the higher risk in part to the blade proximity to
the ground and the low altitude foraging behavior of golden eagles. The 56-100 model is a
downwind turbine, with the blades on the downwind side of the nacelle, which some researchers
believe may also increase risk of collision of birds that perch on the turbine. Birds perched on
this downwind turbine may be blown towards the blades when leaving the perch.
In addition to changes in technology, significant effort has been devoted to developing
standardized methods for siting wind plants (NWCC 2002), and monitoring for avian impacts
resulting from the wind plants (Anderson et al. 1999, Erickson et al. 2000a). Primarily due to
the avian collision concerns and through the development of siting and monitoring guidelines,
baseline avian use, raptor nesting and operational monitoring data (Erickson et al. 2001) have
been collected at many of the new developments outside California. The data have been used for
prediction of impacts of wind projects on wildlife and habitats, and in some cases, for micro-
siting14 wind turbines at a particular site. This large and significant source of information has
greatly improved our ability to predict impacts for new projects and to aid in wind plant/wind
turbine siting. Raptor mortality at these new wind projects has been absent or low in all cases.
Intensive monitoring programs in place at newly constructed wind projects such as the Stateline
(OR/WA), Klondike (OR), and the Buffalo Mountain (TN), continue to add to the already
available information for other new wind projects (e.g., Buffalo Ridge (MN), Foote Creek Rim
(WY), and Vansycle (OR)). Other wind projects such as Nine Canyon (WA) and Condon (OR),
will add more information in the near future.
14 Placement of turbines within a wind plant
AVIAN AND BAT BASELINE DATA AND MORTALITY SYNTHESIS WEST, Inc. 12
Erickson et al. (2001) recently summarized the operational avian fatality data available through
the middle of 2001. This report contains a “meta-analysis15” that extends the mortality summary
to include both baseline data (avian use and raptor nesting) and operational avian and bat fatality
monitoring data, including very recently collected fatality data at projects mentioned above.
This report also provides an evaluation of the ability to predict direct impacts on avian resources
using less than an entire year of baseline avian use data (one season, two seasons, etc.). This
report should assist the various stakeholders in the interpretation and use of this large
information source in evaluating new projects. This report also suggests that the level of
baseline data required to adequately assess expected impacts of some projects may be reduced.
The current industry-push for a more expedited process for permitting wind plants relates to the
renewable energy production tax credit (PTC). This federal tax credit is designed as an incentive
to produce more of our nation's electricity from renewable sources. The tax credit accrues to the
owner of renewable energy generating plants and is currently 1.8 cents per kWh of electricity
produced. The PTC extends for 10 years on a project to which it applies. It is indexed to
inflation via the consumer price index (CPI). The tax credit was originally passed a decade ago
and has been renewed several times since. Renewal of this tax credit is somewhat uncertain and
financial backing of a project can be affected by this uncertainty.
The combination of this uncertainty and the long lead time for equipment orders for wind
turbines and substation transformers complicates the permitting schedule for wind projects.
Most wind turbine manufacturers require up to six months after an order is placed to deliver
equipment; sub-station transformers can take up to 9 months. Without a permit in hand, few
developers are willing to risk ordering millions of dollars worth of equipment. Finally, weather
conditions and environmental constraints (e.g., the need to avoid construction during calving or
nesting periods, etc.) can dictate that construction of wind projects take place only during
summer and fall months, further reducing the window of opportunity for projects built before the
expiration of the PTC.
15 The combining or synthesis of information

AVIAN AND BAT BASELINE DATA AND MORTALITY SYNTHESIS WEST, Inc. 13
METHODS
We included primarily standardized avian and bat mortality and use data that was collected using
approximately the same methods at many proposed and existing wind projects. The avian use
data we included consisted of diurnal point count observations that typically targeted large birds
such as raptors, waterfowl and corvids (i.e. common raven). At some projects, additional
species-specific data may have been collected that targeted a particular sensitive species. For
example, mountain plover surveys were conducted on Foote Creek Rim prior to and following
construction. Winter bald eagle surveys have been conducted at some projects where this
species was present at levels of concern. This meta-analysis does not attempt to synthesize these
species/project specific data sets, although we acknowledge that often these targeted surveys are
required.
Avian Mortality
Complete descriptions of most of the fatality data used in this meta-analysis are provided in
Erickson et al. (2001). In addition, we include some very recent information from the Foote
Creek Rim (WY), Stateline (OR/WA), Klondike (OR), and Buffalo Mountain (TN) wind plants.
Fatality data collected using systematic carcass searches for 14 U.S. wind plants are included in
this meta-analysis. Most of the fatality data has been collected in the western and midwestern
U.S., with some fatality data collected at a few small projects in the east.
Avian Use
A total of 27 different avian use data sets from 13 WRA’s were used in this meta-analysis
(Tables 1 and 2). Several WRA’s had multiple study areas. For example, two reference areas
(Morton Pass [WY] and Simpson Ridge [WY]) were studied to compare to the Foote Creek Rim
(WY) wind plant, and all are designated for this report as part of the Foote Creek Rim WRA.
Original avian baseline data were used in all but two cases; data for these two cases were
generated from graphs and tables in reports (Altamont Pass (CA) and Columbia Hills (WA)).
One additional WRA, Montezuma Hills (CA), was included only for qualitative comparisons,
because original data were unavailable, and the report summarizing the results did not provide
standardized comparable data.
AVIAN AND BAT BASELINE DATA AND MORTALITY SYNTHESIS WEST, Inc. 14
Point count surveys were conducted to describe the relative abundance of bird species within
each study area. Survey methodologies differed in duration of survey (e.g., 5-minute versus
20-minute surveys) and radius of viewshed (unlimited versus fixed distance). For most of the
analyses, data were standardized to an 800 m viewshed and 20-minute survey by limiting
observations to those recorded within 800 m of the observer, and by standardizing the use
estimates up to or down to a 20-minute period.
These standardization methods were applied to make data reasonably comparable among
projects. Some biases still likely exist. For example, avian use from a 40-minute survey like
Foote Creek Rim (WY) standardized to 20 minutes is likely conservative, since one would
expect fewer new observations on average later in the survey, especially for stationary bird
observations (e.g., perched). Likewise, use from a 5-minute survey standardized to 20-minutes
might be liberal (overestimate) for the very same reasons. Biases such as these are likely
reduced by comparing sites using ranks instead of standardized estimates. Furthermore,
evaluating seasonal differences at a study area is not subject to the same biases, since methods
for a particular project did not vary among seasons.
We concentrated on raptors and the waterfowl/waterbird group because survey methodologies
would appear to be most appropriate for those larger birds. Study areas were classified into two
general landscape scale classes: cultivated agriculture, or native habitat landscape. Most of the
sites in the agricultural landscapes have some component of native habitat within their
boundaries, and in some cases there may have been some agricultural component within the
boundaries of the sites within the native landscapes.
Pearson correlations were used to evaluate relationships between:
• spring, summer, fall and winter study area use estimates (i.e., correlations among
seasonal use of the study areas);
• seasonal study area use (spring, summer, fall or winter) estimates and overall (four
season) study area use estimates (i.e., correlations between seasonal use and four
season use estimates of the study areas);
AVIAN AND BAT BASELINE DATA AND MORTALITY SYNTHESIS WEST, Inc. 15
• ranks of sites based on spring only, spring-summer, or spring-fall and ranks based on
four seasons combined (i.e., correlations between ranks (based on use) of study areas
using less than 4 seasons of data and ranks using 4 seasons of data).
Different patterns in the data can lead to high correlations for any of these categories. One
season (e.g., spring) or a combination of two seasons (e.g., spring and summer) might show
consistently higher use among the study areas, and also show high correlations with overall use.
That pattern would suggest use estimates in that season (or combination of seasons) are typically
higher than other seasons, but that the relative ordering of sites based on use (or ranks of use) for
a four-season study would be similar to orderings using only one season. Other indicators of
predictability of overall use across habitats or by habitat from less than a full year of data would
be a pattern of low variability in seasonal use estimates among study areas considered.
Seasons for this meta-analysis were defined by the following dates:
Spring March 16 – May 15
Summer May 16 – August 15
Fall August 16 – October 31
Winter November 1 – March 15
Raptor Nesting
Active raptor nest density was estimated based on summary data typically provided in reports in
the form of maps and tables for 10 study areas (Table 3). We included raptor species that are
efficiently surveyed from the air (e.g., buteos, eagles, great horned owl nests in trees) and
eliminated those that are inconspicuous ground nesting species (e.g., northern harriers, short-
eared owls, burrowing owls). We did not account for differences in survey effort, although effort
varied by study area as well (Table 3). Some surveys were only conducted once, but in other
cases, surveys were conducted twice, supplemented by ground visits. Survey timing (e.g., April
versus May) could also affect results due to variations in nest timing for different species, or
differences in amount of foliage on trees.

AVIAN AND BAT BASELINE DATA AND MORTALITY SYNTHESIS WEST, Inc. 16
Bat Use and Mortality
We summarized the data on bat use and mortality at wind plants, and also provided a literature
review of behavior and other characteristics of the bats typically observed as wind turbine
fatalities. Some data on bat use and/or mortality have been intentionally collected at nine
WRA’s in the U.S. A small amount of anecdotal information on bat mortality is also available
for some California wind plants. All available data were used in this meta-analysis (Tables 1 and
2). Most of the available data on timing and species composition of bat fatalities have come
from bat carcasses picked up while searching turbines for avian fatalities. Major studies
conducted specifically to examine bat collision issues have been conducted at Buffalo Ridge
(MN), Foote Creek Rim (WY), the WPSC site (WI) (only the mortality data from 1999 field
season are currently available); and Buffalo Mountain (TN). These studies have combined
mortality surveys for bats with collection of bat use data using bat echolocation detectors and
mist nets. Minor efforts (1-2 nights) to examine bat use have taken place at the Stateline
(OR/WA) wind plant and the Condon (OR) wind plant.
RESULTS AND DISCUSSION
Tables 1 and 2 list study areas and data types used in the meta-analysis. Over 30 study areas
from 15 WRA’s were used in the analyses in at least one of the following five categories: avian
use, avian mortality, raptor nesting, bat use, and bat mortality. Each of these categories is
discussed below. We discuss avian use and mortality in general and then specific to several
taxonomic groups (all raptors/vultures, buteos, golden eagles, large falcons, small falcons,
northern harriers, accipiters, waterfowl and waterbirds).
Avian Mortality and Use
We present some tables from the publication Erickson et al. (2001), updated to include recent
results for the Buffalo Mountain (TN), the Stateline (OR/WA), and the Klondike (OR) wind
plants. Table 4 contains descriptions of wind projects with mortality data available, and
summarizes all birds and raptor casualties observed. Of 841 avian fatalities reported from the
California studies (>70% from Altamont Pass (CA)), 39% were diurnal raptors, 19% were

AVIAN AND BAT BASELINE DATA AND MORTALITY SYNTHESIS WEST, Inc. 17
passerines (excluding house sparrows and European starlings), 12% were owls. (Table 5). Non-
protected birds including house sparrows, European starlings, and rock doves comprised 15% of
the fatalities. Waterfowl, waterbirds, shorebirds and gamebirds cumulatively comprised less
than 5% of the fatalities. Outside of California, diurnal raptor fatalities comprised only 2% of
the wind plant-related fatalities. Passerines (excluding house sparrows and European starlings)
were the most common collision victims, comprising 82% of the 225 fatalities documented
(Table 5). No other group (e.g., raptors, waterfowl) comprised more than 5% of the fatalities.
For all avian species combined, estimates of the number of bird fatalities per turbine per year
from individual studies have ranged from 0 at the Searsburg, Vermont (Kerlinger 1997) and
Algona, Iowa sites (Demastes and Trainer 2000) to 4.45 on the Buffalo Ridge (MN) Phase III
site (Johnson et al. 2000b). The Phase III Buffalo Ridge (MN) site estimate was based on one
field season (1999) and was greatly influenced by a fatality event involving 14 migrants,
comprised of warblers, vireos and flycatchers, observed during a May 17 carcass search of two
turbines (Johnson et al. 2000b). Avian fatality rates were much lower at the Buffalo Ridge (MN)
Phase I and II sites, where several years of data were collected (Osborn et al. 2000, Johnson et
al. 2000b). Throughout the entire U.S., the average number of avian collision fatalities per
turbine is 2.19 per year (Table 6). We are unaware of any other fatality incident in the U.S. like
the one recorded at Buffalo Ridge (MN; 14 migrants at 2 turbines during a single search).
Typical casualty searches usually yield no fatalities, and when fatalities are discovered on a plot,
usually only one fatality is found. We are also not aware of any raptor fatality incident where
several raptors were killed at one time during migration.
To the best of our knowledge, reference or background mortality has been estimated only once
during baseline studies of new wind plants. During a four-year study at Buffalo Ridge (MN),
2,482 fatality searches were conducted on study plots without turbines to estimate reference
mortality in the study area, and 31 avian fatalities comprised of 15 species were found.
Reference mortality consisted of eight upland gamebirds, seven doves, five sparrows, three
waterfowl, three raptors, two blackbirds, one waterbird, one shorebird, and one unidentified bird.
The exact cause of death of many birds found in reference plots could not be determined;
however, most birds appeared to have been killed by predators or vehicles. Reference mortality

AVIAN AND BAT BASELINE DATA AND MORTALITY SYNTHESIS WEST, Inc. 18
was estimated to average 1.1 per plot per year, compared to 0.98, 2.27 and 4.45 fatalities per
turbine search plot per year in the Phase 1, 2 and 3 wind plants, respectively (Johnson et al.
2000a). These numbers indicate that estimates of turbine mortality likely include some fatalities
not related to turbine collision, and therefore the estimates should be considered conservative
(over-estimates) of true avian collision mortality at wind plants.
Figure 1 contains timing of avian fatalities discoveries from the multi-year studies conducted at
Buffalo Ridge (MN) and Foote Creek Rim (WY) wind plants. Except for the one spike related to
the 14 migrants found at two turbines during one search in spring migration, a relatively
consistent number of birds were found at Buffalo Ridge (MN) during the spring, summer and
fall. Very little winter data were collected (November 1-15th), due to the expected very low bird
use and bird mortality during this period and the difficult winter conditions for accessing the site
and conducting surveys. Foote Creek Rim (WY) also shows fairly consistent all bird fatality
rates in the spring, summer, and fall, with a significant drop-off in fatalities during the winter
months (Figure 1).
Baseline bird use (especially raptor use) has been used in some cases to guide placement of
turbines within a wind project. For example, some proposed turbine locations were voluntarily
moved or dropped by developers based on patterns in raptor use at the Foote Creek Rim (WY),
Condon (OR), and Stateline (OR/WA) wind plants. The ability to identify concentration areas or
patterns in utilization on a site is related to several factors, including topography of a site, habitat
types, levels of bird use, and amount of baseline data that are collected. The ability to micro-site
turbines to reduce mortality is improved as more data are collected, although distinct use patterns
are not always apparent, even with multiple years of information. The strongest candidates for
effective micro-siting are sites with high raptor use, and are comprised of large tracts of high
quality native habitat with high topographic relief (e.g., distinct ridges), and/or containing other
features (e.g., significant water sources, high prey base) that may lead to distinct patterns in
raptor use. Many of the project sites within agricultural landscapes do not typically meet any of
these criteria and are therefore not strong candidates for effective micro-siting.
AVIAN AND BAT BASELINE DATA AND MORTALITY SYNTHESIS WEST, Inc. 19
All Raptors/Vultures
Estimated and standardized total raptor/vulture use varied by study area and season. The study
area with by far the highest standardized and estimated raptor/vulture use is Altamont Pass (CA)
(Table 7). Columbia Hills (WA)16, the Stateline Reference Area (OR), Foote Creek Rim (WY)
and the Middle Ridge of the Tehachapi Pass (CA) WRA have the next highest estimates. The
relatively high raptor use of the Stateline Reference Area (OR) was greatly influenced by a kettle
of 40 Swainson’s hawks observed in the spring of 1995. The Stateline Reference Area (OR) is
located within an agricultural setting and the other four plants are located within native
landscapes.
Using the data reported in Table 7, high correlations (>0.7) exist between seasonal use estimates
for each site relative to other sites (Table 8). Furthermore, total raptor use in any one season is
highly correlated with overall use estimates for the entire year for each site relative to other sites,
indicating total raptor use in any one season is indicative of overall raptor use for all seasons
(Table 8). We investigated how the rank of sites based on use estimates varied if only spring
data were collected, if only spring/summer data were collected, if only spring/summer/fall data
were collected, and if data were collected all four seasons. Study area ranks based on mean
raptor use from only one or two seasons varied only slightly (Table 7) and were highly correlated
with ranks using all four seasons (Table 8), indicating overall raptor use predictions relative to
other sites typically would not vary when using less than one year of data.
Agricultural Landscapes
Within agricultural landscapes, average total raptor/vulture seasonal use estimates (averages
across the study areas) were highest in the spring (0.598), followed by followed by fall (0.525),
summer (0.413), and winter (0.385), suggesting low variability among average seasonal
estimates. Average use for individual study areas ranged from 0.258 to 0.602 raptors/20-minute
survey, suggesting relatively low variability in four-season use estimates among study areas as
well. For the Pacific Northwest sites in agricultural landscapes, seasonal estimates tend to vary
less, with winter estimates similar to other seasons, especially spring. However, raptor
16 we used average winter use from the CARES project for Columbia Hills, since no standardized winter use data were collected

AVIAN AND BAT BASELINE DATA AND MORTALITY SYNTHESIS WEST, Inc. 20
assemblages during the winter are typically different from the other seasons. Winter use is often
influenced more by northern harriers and rough-legged hawks, whereas use during the other
seasons is influenced more by red-tailed hawks, Swainson’s hawks, American kestrels, and
some other species depending on the location.
Raptor mortality has been very low for all new generation wind plants located in agricultural
settings (Tables 4, 5 and 6). The only reported raptor fatality was one red-tailed hawk found
during a 4-year study at the Buffalo Ridge (MN) wind plant (Johnson et al. 2000b) based on
studies conducted prior to March 31, 2002.
Native Landscapes
More variability exists in raptor use among study areas comprised primarily of native habitat,
likely due to the high variability in habitats within this category (Table 7, Figure 3). Raptor use
is estimated to be very high at Altamont Pass (CA) and very low at San Gorgonio Pass (CA).
Estimates of raptor use at Montezuma Hills (CA) are likely higher than at Altamont Pass (CA),
although data for Montezuma Hills were unavailable at a level of detail comparable to the other
studies (Howell and Noone 1992). Average raptor/vulture use estimates were highest in the fall
for all sites, although average estimates for all seasons were between 0.3 and 0.6 raptors/20-
minute survey. Average four-season raptor use estimates for all of these study areas ranged from
0.02 to 2.4/20-minute survey.
Raptor and other bird mortality estimates for wind projects where standardized data have been
collected are summarized in Tables 4, 5 and 6. Comparison of mortality on a per turbine basis
between older and newer wind plants is difficult due to differences in turbine sizes and study
methodologies. For example, most of the older generation wind plants in California are
composed of small turbines (average size typically less than 200 kW machines), whereas newer
turbines are typically much larger. Estimates of annual raptor mortality at Altamont Pass (CA)
averages 0.048 per turbine, with the most recent study conducted by Thelander (2000 pers.
comm.) providing an estimate of 0.10 fatalities per turbine. Raptor mortality estimates from
during the study.

AVIAN AND BAT BASELINE DATA AND MORTALITY SYNTHESIS WEST, Inc. 21
Montezuma Hills (CA) also averaged 0.048 fatalities per turbine. These estimates are higher
than those reported for Foote Creek Rim (WY), the only new wind plant where more than one
raptor fatality has been documented (based on studies conducted prior to March 31, 2002). It
would take approximately 3 to 8 average Altamont Pass (CA) turbines17 to equal the rotor swept
area of a single typical new generation wind turbine (600 kW – 1.5 MW per turbine). The 0.04
raptor fatalities per turbine per year for the 42-44 m rotor diameter turbines at Foote Creek Rim
(WY), which is the upper range of raptor fatality rates for new generation wind projects, would
equate to 3 raptor fatalities/100,000 m2 rotor swept area (RSA). This estimate is approximately
3-7 times lower than at Altamont (CA; 9-22 raptor fatalities/100,000 m2 RSA). In addition,
recent information collected in 2001 at Foote Creek Rim (WY) will reduce the average annual
raptor mortality estimate. No raptor fatalities were observed on Phase I of the Foote Creek Rim
(WY) wind plant based on searches conducted from May through December 31, 2001 (Garrett
2002, pers. comm.). Information gained regarding wind energy siting and design at both old and
new wind plants strongly suggests that the level of raptor mortality at Altamont is quite unique
and can be avoided at other locations.
Although not directly comparable to other wind projects because of the 3-month interval
between searches, the West Ridge of Tehachapi Pass (CA), which has the highest raptor use
compared to the other areas within Tehachapi Pass (CA), also had much higher raptor mortality
than the other two areas (Anderson et al. 2000). Very few raptor mortalities have been
documented at the San Gorgonio (CA) wind plant, and raptor use at this site is very low
(Anderson et al. 2000).
Summary/Impact Prediction
Projecting overall impacts to raptors as a group such as the estimated number of raptor fatalities
per year is typically based on several factors, including habitat, raptor nesting, raptor use, project
size and project layout. Based on the correlation analyses provided above for raptor use, and
assuming habitat and raptor nesting surveys are conducted, overall impact prediction for all
raptors combined would typically be similar after collection of one season of raptor use data
17 Assumes an average Altamont turbine is 150 kW; the Kenetech 56-100 turbine is a 100 kW machine.

AVIAN AND BAT BASELINE DATA AND MORTALITY SYNTHESIS WEST, Inc. 22
compared to a full year of data collection. This appears to especially be the case in agricultural
landscape settings, where use estimates do not vary much among seasons, micro-siting based on
patterns of raptor use is not likely feasible, and mortality data at new wind projects indicate
absent to very low raptor mortality. We recommend more than one season of data if a site
appears to have relatively high raptor use, especially if micro-siting is practical. Other factors
such as project size should also be considered in determining the baseline data requirements.
Buteos
Buteos were typically the most abundant raptor group observed in the studies included in the
meta-analysis, especially for sites within agricultural settings. The study area with the highest
standardized estimated buteo use is Altamont Pass (CA) (Table 9), followed by several
agricultural sites. The relatively high buteo use for the Stateline Reference Area (OR) was
greatly influenced by a kettle of 40 Swainson’s hawks observed in the spring of 1995. Using the
data reported in Table 9, moderate to high correlations exist between use estimates among
seasons (0.4 to 0.8, Table 10), with the lowest correlation occurring between summer and winter
estimates. Correlations between a single season use estimate and overall use for a site are high
(0.8 – 0.9), indicating that estimates from any one season are relatively strong predictors of
overall annual buteo use (Table 10). Study area ranks based on mean buteo use from only one
or two seasons were highly correlated with ranks using all four seasons (Table 10). These
correlations indicate, in general, overall buteo use predictions based on one or two seasons of
information would be similar to predictions from a four-season study.
Agricultural Landscapes
For study areas within agricultural landscapes, buteo use averaged across all study areas was
very similar among seasons (0.2 to 0.3/20-min survey, Table 9, Figure 4), although this pattern
was not consistent within study areas. Buteo use was highest in the fall at the Buffalo Ridge
(MN) WRA, and typically highest in the winter for the Pacific Northwest sites, with the
exception of the Stateline Reference Area (OR; spring Swainson’s hawk observations). The
winter buteo use in these agricultural settings is typically dominated by rough-legged hawks.
Eight of the nine study areas (Altamont Pass (CA) is the one exception) with the highest buteo
use occurred in agricultural landscapes.

AVIAN AND BAT BASELINE DATA AND MORTALITY SYNTHESIS WEST, Inc. 23
Buteo mortality has been very low for all wind projects considered in this category, which are all
“new generation” wind plants, even though high buteo use at many of the study areas (e.g.,
Buffalo Ridge (MN)) would indicate greater potential for buteo collision mortality. One red-
tailed hawk fatality was observed during the course of a 4-year study at the Buffalo Ridge (MN)
wind plant. Otherwise, no other raptor mortality has been reported at wind plants located in
agricultural settings (Tables 4 and 5) based on studies through March 31, 2002.
Native Landscapes
Average use across study areas by buteos was also fairly similar among seasons classified
primarily as native habitat, where use ranged from 0.107 to 0.167 per 20-minute period (Table 9;
Figure 5). For all 4 seasons combined, buteo use was over twice as high at Altamont Pass (CA;
0.64/20-minute survey), than the area with the next highest use (Columbia Hills18 (WA; 0.24/20-
minute survey). The third highest buteo use occurred at Foote Creek Rim (WY; 0.22). The
highest level of buteo mortality has also occurred at Altamont Pass (CA), where at least 193
buteo fatalities have been documented (Erickson et al. 2001). In contrast, Foote Creek Rim
(WY), with the 3rd highest buteo use of wind plants in native landscapes, has no documented
buteo fatalities. The turbines at Foote Creek Rim (WY) are the newer-generation turbines, and
the lack of mortality there compared to Altamont Pass (CA) provides additional evidence that
suggests lower buteo collision risk associated with the newer generation larger turbines.
Summary/Impact Prediction
Very little buteo mortality has been documented at new wind plants outside California, even at
sites that appear to have moderate to high buteo use compared to Altamont Pass (e.g., Foote
Creek Rim [WY]). Based on the correlation analyses provided above for buteo use, and
assuming habitat and raptor nesting surveys are conducted, overall impact prediction for buteos
would typically be similar after one season of data collection compared to a full year of raptor
use data. This appears to especially be the case in agricultural landscape settings, where use
estimates do not vary much among seasons, micro-siting based on patterns of raptor use is not
likely feasible, and mortality data at new wind projects indicate absent to very low raptor
18 there are currently no turbines built at this site

AVIAN AND BAT BASELINE DATA AND MORTALITY SYNTHESIS WEST, Inc. 24
mortality. We recommend more than one season of data if a site appears to have relatively high
buteo use, especially if micro-siting is practical.
Golden Eagles
We include both bald and golden eagle observations, although approximately 95% of the eagle
observations in these data sets are of golden eagles. The study area with the highest standardized
estimated golden eagle use is Altamont Pass (CA; Table 11), followed by several of the study
areas associated with the Foote Creek Rim (WY) wind plant. Site ranks based on golden eagle
use showed the least variability as the number of seasons used was varied. Relatively high
correlations exist between use estimates among seasons (0.66 to 0.98), and between seasonal and
overall estimates (0.76 to 0.98), indicating golden eagle use in one season is indicative of golden
eagle use in other seasons and for the entire year (Table 12).
Agricultural Landscapes
In general, golden eagle use was low on the sites in the agricultural settings, although all but the
Zintel Canyon site (WA) had some documented eagle use during the studies (Table 11,
Figure 6). Average golden eagle use was lowest in the summer, likely due to the lack of nesting
habitat and prey for golden eagles in these landscapes. Average golden eagle use was similar in
the spring, fall and winter. No eagle mortality (bald or golden) has been reported at any of the
wind plants located in the agricultural landscapes (Erickson et al. 2001).
Native Landscapes
More variability exists in golden eagle use among study areas located within native landscapes,
likely due to the high variability in golden eagle nesting and foraging habitat at sites within this
category (Table 11, Figure 7). Very high golden eagle use is estimated for Altamont Pass (CA;
0.333/20-min survey) and Foote Creek Rim (WY; 0.234/20-min survey), followed by the other
studies/study areas associated with Foote Creek Rim (WY; Simpson Ridge, Morton Pass
Reference Area)19. Average use for all of these study areas ranged from 0 to 0.334/20-minute
survey.
19 it is unclear what the effective viewshed was at Altamont. Points were ½ mile apart to avoid overlap

AVIAN AND BAT BASELINE DATA AND MORTALITY SYNTHESIS WEST, Inc. 25
No bald eagle mortality has been reported at any wind plant in the U.S. (Erickson et al. 2001),
although none of the projects studied were located near large concentrations of bald eagles.
Golden eagle mortality at Altamont (CA) has been well publicized, with estimates made in the
early 1990’s of 30 to 70 golden eagle fatalities per year. That is approximately equivalent to 1
golden eagle fatality per year for every 100 to 200 turbines at Altamont Pass (CA), or 1 to 2
golden eagle fatalities per year for approximately every 100,000 m2 RSA20. The turbines at
Foote Creek Rim have a rotor swept area approximately 5 times larger than the average rotor
swept area of turbines at Altamont. Based on the one golden eagle fatality reported for Foote
Creek Rim (WY; Young et al. 2002), we estimate approximately 1 golden eagle fatality for
every 200 turbines at that site, 0.3 golden eagle fatalities/100,000 m2 RSA), or approximately 3-7
times lower than at Altamont (CA). The golden eagle fatality rate at Foote Creek Rim is the
highest estimate reported for new generation wind projects, and golden eagle use of Foote Creek
Rim is apparently similar to golden eagle use at Altamont. This result suggests there may be a
difference in risk to eagles based differences in turbine characteristics (size, type, blade rpm’s,
proximity of blade to ground), which has also been suggested by Hunt (2002), although there are
other factors as well that likely contribute to these differences (micro-siting, prey availability,
project size). One golden eagle fatality has been reported at both San Gorgonio (CA) and
Tehachapi Pass (CA), where golden eagle use is much lower than Altamont Pass (CA) and Foote
Creek Rim (WY). Standardized estimates are not easily obtained for those California projects,
due to the 3-month interval between fatality searches. No golden eagle (or bald eagle) mortality
has been reported at any other wind plant in the U.S. (Erickson et al. 2001).
One factor likely related to the high mortality of golden eagles (and other raptors) at Altamont
Pass (CA) is the high density and year-round activity of California ground squirrels, the principal
prey of many of the raptor species at the site (Hunt 2002). The population of golden eagles near
the Altamont Pass (CA) is apparently increasing, even with the 30-70 wind plant-related
fatalities each year (Hunt 2002), although the population effects from sustained mortality over a
longer period of time is not known. Most of the fatalities are sub-adults (1 to 3 year-olds) and
20 assumes average size turbine is 200 kW

AVIAN AND BAT BASELINE DATA AND MORTALITY SYNTHESIS WEST, Inc. 26
“floaters” (non-breeding adults) that have larger home ranges than breeders. Very few juvenile
fatalities have been reported, likely because juveniles do not typically hunt live prey (Hunt
2002). Occupancy rates of known golden eagle territories have been 100% in almost every year
of the study. There are also several prairie dog towns near the Foote Creek Rim (WY) wind
project, likely contributing to the high use of golden eagles at that site.
Summary/Impact Prediction
Foote Creek Rim (WY) is the only wind plant outside California with any golden eagle
mortality, with estimates of 1 golden eagle fatality per year for every 200 turbines, or 0.3 golden
eagle fatalities per 100,000 m2 RSA. Foote Creek Rim (WY) golden eagle use is estimated to be
fairly similar to Altamont (CA), and golden eagle use at Altamont (CA) is estimated to be higher
than at any other wind plant studied in the U.S.
Based on the correlation analyses provided above for golden eagle use, and assuming habitat and
raptor nesting surveys are conducted, overall impact prediction for golden eagles would typically
be similar after one season of data collection compared to a full year of data collection. This
appears to especially be the case in agricultural landscape settings, where use estimates of golden
eagles are very low in all seasons. We recommend more than one season of data if a site appears
to have relatively high golden eagle use, and other factors exist on the site that might enhance the
ability to effectively micro-site turbines using baseline data (e.g., factors such as high
topographic relief, active raptor nests and nest habitat, prey availability). Patterns observed at
other projects include flight patterns parallel to the upwind side of ridges (Johnson et al. 2001,
Erickson et al. 1999).
Some observations of bald eagles were included in this grouping, although these observations
comprised less than 5% of the total number of observations. If bald eagles winter in
concentrations near proposed projects, we would typically recommend specific surveys to
document their use of the project during that season.

AVIAN AND BAT BASELINE DATA AND MORTALITY SYNTHESIS WEST, Inc. 27
Large Falcons
This group consists primarily of prairie falcons, with rare observations of peregrine falcons; large
falcons comprise a very small proportion of the raptor use of these study areas. The study area
with the highest standardized estimated large falcon use is the Morton’s Pass Reference (WY;
0.032/20-min survey), followed by Phase II San Gorgonio Water Area (CA; 0.029), Maiden
(WA; 0.029) and Foote Creek Rim (WY; 0.024) (Table 13). Correlations between spring,
summer and fall seasonal use estimates for large falcons were moderate to high (0.44 to 0.79).
Correlations of use estimates in winter compared to the other seasons were low (-0.06 to 0.44).
Correlations of any one season to overall large falcon use were moderate to high (0.58 to 0.89).
Agricultural Landscapes
Average large falcon use of the study areas in agricultural settings (0.004/survey) was more than
three times lower than average use in native landscapes (0.014/survey) (Table 13, Figure 8).
Based on averages within a season but across study areas, mean use was lowest in the summer
(0.001/survey) and spring (0.002/survey), and highest in the winter (0.007/survey) and fall
(0.005). All 10 study areas had estimated overall large falcon use less than 0.014/survey, which
was the average for study areas in native landscapes. No large falcon mortality has been
reported at any of the agricultural wind plants (Erickson et al. 2001).
Native Landscapes
Based on averages within a season but across study areas, large falcon use was highest in the fall
(0.020) and summer (0.016), and lowest in the spring (0.010) and winter (0.009). Mortality of
large falcons has been low at U.S. wind plants (Erickson et al. 2001), with two prairie falcon
fatalities documented at Altamont Pass (CA) and one prairie falcon documented at Tehachapi
Pass (CA) and Foote Creek Rim (WY). No peregrine falcon mortality has been documented at
any U.S. wind plant (Erickson et al. 2001), while some peregrine use has been documented at
Altamont Pass (CA), Tehachapi Pass (CA), San Gorgonio (CA) and Foote Creek Rim (WY).
Summary/Impact Prediction
Large falcon use was generally very low on the study areas compared to other raptor
groups/species. Foote Creek Rim (WY) is the only windplant outside California with any large

AVIAN AND BAT BASELINE DATA AND MORTALITY SYNTHESIS WEST, Inc. 28
mortality of large falcons, with estimates of approximately 1 prairie falcon fatality per year for
every 200 turbines, or 0.3 prairie falcons per 100,000 m2 RSA. Foote Creek Rim (WY;
including the other associated study areas like the Morton Pass Reference [WY]) had high large
falcon use relative to the other study areas considered. Overall impact prediction for large
falcons would typically be similar after one season of avian use data collection compared to a
full year of data collection primarily for the following three reasons: 1) compared to other raptor
groups, large falcons comprise a small proportion of the avian use at all the sites considered, 2)
the correlation analyses indicate moderate to high correlations of estimates of overall use with
estimates of seasonal use, and 3) habitat mapping and raptor nesting surveys should provide
information on presence of large falcons in the study area.
Small Falcons
This group consists primarily of American kestrels, with rare observations of merlins. The study
area with the highest standardized estimated small falcon use was Columbia Hills (WA;
0.192/survey), followed by Tehachapi Pass (CA; 0.162), Zintel Canyon (WA; 0.140) and
Condon (WY; 0.104) (Table 15). Small falcon use between seasons was highly variable. The
only significant positive correlation was that between spring and summer use (0.62); the other
season correlations ranged from –0.20 to 0.22 (Table 16). These correlations indicate that while
spring and summer use data are similar to each other, they cannot be used to predict small falcon
use at other times of the year. Similarly, data collected in the fall and winter cannot be used to
predict spring or summer use. Correlations of any one season to overall falcon use were
moderate (0.48 to 0.69). The low correlations between seasons likely reflect range and behavior
of the species in this group. American kestrels, which make up most of the use in this group,
often breed locally in spring and summer but then migrate in the fall and are either absent or
occur at very low densities during the winter (except for in some CA study areas).

AVIAN AND BAT BASELINE DATA AND MORTALITY SYNTHESIS WEST, Inc. 29
Agricultural Landscapes
The mean small falcon use of the study areas in agricultural settings (0.059/survey) was similar
to average use in native landscapes (0.058/survey) (Table 13, Figure 8). Mean falcon use was
lowest in the winter (0.030/survey), highest in the fall (0.099/survey) and similar in the spring
(0.072) and summer (0.061). Of the 10 study areas in agricultural landscapes, falcon use was
highest at Zintel Canyon (WA; 0.140/survey) and Condon (OR; 0.104/survey); use at the other 8
areas was <0.08/survey. No falcon mortality has been reported at any of the agricultural wind
plants (Erickson et al. 2001).
Native Landscapes
Extensive variability existed in small falcon use among study areas comprised primarily of
native habitats likely due to the high variability in suitability of habitats for falcon nesting and
foraging within this category (Table 15, Figure 9). Falcon use was highest at the Columbia
Hills21 (WA; 0.192/survey) followed by the Middle Ridge of Tehachapi Pass (CA; 0.162),
CARES22 (WA; 0.100/survey) and Altamont Pass (CA; 0.089/survey). Average small falcon
use calculated across study areas was fairly similar among seasons (0.046 – 0.072). Mortality of
small falcons has been high at Altamont Pass (CA), where 49 American kestrel fatalities were
documented (Erickson et al. 2001). Tehachapi Pass (CA) has the second highest number of
falcon fatalities (11 American kestrels) documented. Three American kestrels have been
documented at Foote Creek Rim (WY; Young et al. 2001, Young et al. 2002) based on over
three year’s of study.
Summary/Impact Prediction
Small falcon use consisted primarily of American kestrels. American kestrels were listed as one
of the four raptor species with the highest use at every study area considered except for the
Stateline/Vansycle Reference area, where it had the fifth highest raptor use estimate. The
American kestrel is also one of the most common raptor species observed as fatalities at U.S.
wind plants. American kestrels were the most frequently observed raptor fatality at Altamont
Pass (CA), Tehachapi Pass (CA), San Gorgonio (CA) and Foote Creek Rim (WY), although no
21 there are currently no turbines built at this site

AVIAN AND BAT BASELINE DATA AND MORTALITY SYNTHESIS WEST, Inc. 30
American kestrel fatalities have been observed at other new U.S. wind plants. Very high
variability existed in seasonal use estimates within certain study areas. Impact predictions for
this common raptor species would likely be the most variable compared to impact predictions for
other raptor species, due to the high seasonal use variability and likely high year-to-year
variability.
Northern Harriers
The study area with the highest estimated use by northern harriers is the Buffalo Ridge (MN)
Phase II site where use was 0.163/survey. Other areas with relatively high use by this species
were the Buffalo Ridge Reference Area (0.116/survey), Nine Canyon (0.110/survey) the Buffalo
Ridge Phase 3 site (0.107 survey) and Stateline/Vansycle (0.110/survey) (Table 17). Rankings
of use as the number of seasons was varied were fairly similar for all study areas. Moderately
high correlations (>0.6) occurred between spring-summer (0.71) and spring-winter (0.65), with
lower positive correlations between spring-fall (0.49), summer-winter (0.42) and fall-winter
(0.43) use (Table 18). Correlations between use in any one season and overall use were all high
(>0.75). The correlation of overall ranks and ranks based on data from spring only, spring-
summer only, and spring-fall only were all greater than 0.90, indicating good predictability of
northern harrier use with one or two seasons of data.
Agricultural Landscapes
Northern harrier use of the study areas in agricultural settings (0.099/survey) was greater than 5
times that of native landscapes (0.019/survey) (Table 17, Figure 10). Mean use averaged across
the study areas was much higher in the spring (0.187/survey) than the other 3 seasons, when use
ranged from 0.069-0.099/survey. Of the 10 study areas in agricultural landscapes, northern
harrier use was highest at the Buffalo Ridge Phase II (MN) site. No mortality of northern
harriers has been reported at any of the agricultural wind plants (Erickson et al. 2001).
Native Landscapes
Use of native landscapes by northern harriers was very low. The highest use occurred at Maiden
site (WA; 0.089), followed by the CARES (WA; 0.084) and Columbia Hills (WA; 0.062) sites
(Table 17, Figure 11). Based on averages across study areas, northern harrier use was lowest in

AVIAN AND BAT BASELINE DATA AND MORTALITY SYNTHESIS WEST, Inc. 31
the winter (0.011) and spring (0.013), and highest in the fall (0.036). Northern harrier mortality
has been very low at U.S. wind plants, with two reported at Altamont Pass (CA) and one
reported at Foote Creek Rim (WY; Erickson et al. 2001).
Summary/Impact Prediction
Very little northern harrier mortality has been documented at U.S. wind plants, even at sites that
appear to have relatively high northern harrier use (e.g., Buffalo Ridge). Based on the
correlation analyses provided above for northern harriers and the low mortality observed of this
relatively common species, overall impact prediction for northern harriers would typically be
similar after one season of data collection compared to a full year of data collection. Collision
risk for northern harriers would appear to be higher at most sites in agricultural landscapes due to
a typical pattern of higher use at those sites compared to use in native landscapes.
Accipiters
Accipiter use in general comprised a very small proportion of the raptor use on the study areas
considered (Table 19). The Columbia Hills (WA) and CARES (WA) sites had the highest
estimated accipiter use (0.060 and 0.041/survey respectively), followed by all four of the Buffalo
Ridge (MN) sites. Correlations among spring and summer use estimates was moderate (0.68),
with low correlations among the other seasons use estimates (-0.14 to 0.38). Spring, summer and
fall use estimates correlated reasonably well with overall use (>0.70), but winter did not (0.21).
The low correlation in winter is due to the very low abundance of accipiters during this season.
The correlation of overall ranks and ranks based on data from spring only or spring-summer only
was moderate (>0.60) and high with spring-fall only (0.94).
Agricultural Landscapes
Accipiter use at study areas in agricultural landscapes was very low, with occasional
observations made primarily during fall and spring migration (Table 19, Figure 14). The highest
accipiter use occurred at the Buffalo Ridge (MN) sites, although no accipiter mortality has been
documented based on five years of monitoring (Erickson et al. 2001).
AVIAN AND BAT BASELINE DATA AND MORTALITY SYNTHESIS WEST, Inc. 32
Native Landscapes
Accipiter use at study areas in native landscapes was low, with the highest estimated use
occurring within the fall migration period (Table 19, Figure 15). No accipiter mortality has been
documented at any of the U.S. wind plants located in native landscapes (Erickson et al. 2001).
Summary/Impact Prediction
No accipiter mortality has been documented at U.S. wind plants (Erickson et al. 2001).
Accipiter use at all these sites comprises a very small proportion of the total raptor use. Overall
impacts for accipiters can be expected to be very low at most new wind projects.
Waterfowl/Waterbirds
Waterfowl and waterbird use is highly variable among study sites, primarily due to the larger
flock sizes (Table 21). A few large flocks can greatly influence the magnitude of use estimates.
The San Gorgonio (CA) and the Buffalo Ridge (MN) study areas tend to have the highest year
round waterfowl/waterbird use, primarily due to proximity to open water. Two other agricultural
study areas (Zintel Canyon (WA) and Klondike (OR)) have higher use than most other study
areas due to a few large flocks of Canada geese observed during winter, typically flying above
the expected heights of the turbine blades. Correlations between seasonal use estimates were
highly variable from a low of 0.32 between fall and winter, to a high of 0.86 between spring and
summer (Table 18). Correlations between seasonal use estimates and overall use estimates were
highest for winter (0.97), and lowest for fall (0.52). The correlation of overall ranks and ranks
based on data from spring only and spring-summer only was approximately 0.7, but increased to
0.98 by including fall data, indicating moderate predictability of waterfowl use based on two
seasons of data, and good predictability of overall use with 3 seasons of data.
Agricultural Landscapes
All sites within agricultural landscapes had some waterfowl/waterbird use. Overall
waterfowl/waterbird use was slightly higher in agricultural settings (4.510/20-minute survey)
than in native settings (3.123), although this difference would be much larger except for the high
waterfowl/waterbird use near the water area at San Gorgonio (CA; Table 21, Figure 16). Mean
AVIAN AND BAT BASELINE DATA AND MORTALITY SYNTHESIS WEST, Inc. 33
use was highest in the winter (8.611), and lowest in the summer (0.369). Occasional
waterfowl/waterbird mortality has been documented at some of the agricultural wind plants
(Table 5), including the Wisconsin site (3 fatalities, 15% of total), and Buffalo Ridge (MN; 5
fatalities, 14% of total). One Canada goose wind turbine collision fatality was documented this
past winter at the Stateline (OR/WA) wind plant by maintenance personnel. That is the only
Canada goose mortality reported based on the studies we reviewed. No goose mortality has been
observed at the 16 Klondike turbines since January (January – April 15, 2002), although several
observations of Canada geese have been made in the vicinity of the project area.
Native Landscapes
Waterfowl/waterbird use is low at most sites within this category, except for the areas near the
recharge ponds at San Gorgonio (Table 21, Figure 17). Waterfowl/waterbirds comprise 26% of
the total observed mortality at San Gorgonio (10 of 42 total fatalities); otherwise very few
waterfowl/waterbird fatalities have been recorded at existing wind plants (Table 5).
Summary/Impact Prediction
Waterfowl and waterbird mortality has occurred at several wind projects, but apparently in very
low numbers relative to the waterfowl/waterbird use of those sites. Correlations of seasonal use
to overall use were moderate. At many of the Pacific Northwest sites in agricultural settings,
most waterfowl use (especially Canada geese) occurred during the winter. If impacts to
waterfowl are considered important at these sites, then surveys should be concentrated during the
winter.

AVIAN AND BAT BASELINE DATA AND MORTALITY SYNTHESIS WEST, Inc. 34
Passerines
The magnitude of passerine22 and other avian mortality due to collisions with human-made
structures such as buildings and windows, vehicles, powerlines, communication towers and wind
turbines has received quite a bit of attention recently (Erickson et al. 2001, Kerlinger 2000).
Using the annual avian collision mortality estimate of 200-500 million (a very large portion of
which are passerines), it is estimated that at the current level of development, wind turbines
constitute 0.01 to 0.02% (1 to 2 out of every 10,000) of the avian collision fatalities (Figure 18).
Communication tower fatality estimates make up 1 to 2% (1 to 2 out of every 100) using the
conservative estimates of 4 million annual avian fatalities due to collisions with these structures.
The low range estimate from buildings/windows of 98 million (Klem 1991) would comprise
approximately 25 to 50% of the collision fatalities. The low range estimate of 60 million vehicle
collision fatalities comprises 15 to 30% of the total estimated collision fatalities. Powerline
collisions are also likely a significant source of collision mortality.
Protected passerines (excludes house sparrows, European starlings and rock doves) have been
the most common group of birds killed at wind plants outside California, comprising over 80%
of the fatalities reported (Table 5) and involves both resident and migrant species (Erickson et al.
2001). Forty-two passerine fatalities representing 21 different species were observed at Buffalo
Ridge (MN) during the 4-year study. The largest number of fatalities of any one species was
seven (common yellowthroat). Seven out of the 10 fatalities at Vansycle (OR) were passerines,
including four white-crowned sparrows. Eighty-seven passerine fatalities representing 26
different species were observed at Foote Creek Rim (WY), with horned lark by far the most
commonly observed fatality (32%) and most commonly observed bird during point count
surveys (Johnson et al. 2000a). Horned lark was also the most common observed fatality at
Ponnequin (CO; 5 out of 8 passerine fatalities). Only three species were observed more than
once as fatalities at the Wisconsin wind plant (2 golden-crowned kinglets, 2 savannah sparrows,
2 tree swallows), based on 14 passerine fatalities (Howe 2001, pers. comm.). Recent studies at
Stateline (OR/WA) between July and December 31, 2001 documented 10 passerines representing
5 species during standardized carcass searches (Table 5). Horned lark was the most abundant
22 “perching” birds; primarily songbirds

AVIAN AND BAT BASELINE DATA AND MORTALITY SYNTHESIS WEST, Inc. 35
casualty found (3), followed by golden-crowned kinglet (2). Horned lark was also the most
abundant passerine species based on point count surveys (URS Corporation and WEST 2001).
Nocturnal migrants are estimated to comprise approximately 50% of the fatalities at new wind
projects (estimated range 34 to 59%) based on timing and species (Erickson et al. 2001). Some
nighttime surveys using radar equipment have been conducted at wind plants and results have
been compared to fatalities. Radar studies at Buffalo Ridge (MN; Hawrot and Hanowski 1997)
indicate that as many as 3.5 million birds per year may migrate over the wind development area
(Johnson et al. 2000b). The largest single mortality event reported at a U.S. wind plant was 14
nocturnal migrating passerines at two turbines at Buffalo Ridge (MN) during spring migration.
We are not aware of any other mortality events greater than a few birds at single or adjacent
turbines found during a single search at any U.S. wind plant.
Researchers estimated 6,800 birds were killed annually at the San Gorgonio (CA) wind facility
based on 38 dead birds found while monitoring nocturnal migrants. The 38 avian fatalities
included 15 passerine species. McCrary et al. (1983,1984) estimated that 69 million birds pass
through the Coachella Valley annually during migration; 32 million in the spring and 37 million
in the fall. Considering the high number of passerines migrating through the area relative to the
number of passerine fatalities, the authors concluded that this level of mortality was biologically
insignificant (McCrary et al. 1986). Three seasons of nocturnal radar surveys at the Stateline
(OR/WA) and Vansycle wind plants (OR; Mabee and Cooper 2002) indicate moderate passage
rates compared to other studies, with approximately 90% of the radar targets (flocks of birds)
estimated flying above the turbine blades. Low passerine mortality was observed at the
Vansycle Ridge (OR) wind plant in 1999 (Erickson et al. 2000), and at the Stateline wind plant
between mid-July 2001 and March 31, 2002 with a few likely nocturnal migrant fatalities
observed. The last season of radar data was gathered concurrently with the recent Stateline
mortality data, providing some evidence that mortality relative to passage rates is very low.
The low avian mortality due to wind turbines compared with communication towers (Erickson et
al. 2001) can probably be attributed to the fact that the majority of wind turbines currently range
from 200-400 feet (60-133 m) in height, whereas television and radio communication towers are

AVIAN AND BAT BASELINE DATA AND MORTALITY SYNTHESIS WEST, Inc. 36
generally much taller. Many of the existing communication towers are guyed structures,
whereas nearly all of the newer generation wind turbines are unguyed structures. There are
relatively few reports of single mortality events (greater than a few birds) at communication
structures less than 500 feet (150 m) in height (Kerlinger 2000) or at wind plants.
We are unaware of any studies that directly compare communication tower mortality to wind
turbine mortality; although, there is limited information on guyed meteorological (met) tower
mortality compared with wind turbine mortality at Foote Creek Rim (WY; Young et al. 2001).
At this site, searches were conducted both wind turbines (600-kW, approximately 200-ft (60-m)
towers) and guyed met towers (200-ft (60 m) in height) once a month during the study. During
this period of study, the met towers had estimates of 7.5 bird fatalities per tower per year,
whereas the turbines had estimates of 1.8 bird fatalities per turbine per year (Young et al. 2001).
Estimates of total bird mortality have ranged between 0 to 3 birds per turbine per year at new
wind projects in the U.S. (Figure 19).
Other Species/Bird Groups
We did not present results for certain large bird species/groups due to the relatively low
abundance observed at most sites (e.g., shorebirds), or because mortality data indicate the
species/group is not very susceptible to collision. For example, common ravens are common at
many of the study areas considered, but mortality data included in our analysis suggest these
species that primarily forage by scavenging, do not appear very susceptible to collision (Erickson
et al. 2001, Orloff and Flannery 1992). Bald eagles were combined with golden eagles although
they make up very few of the observations, and have very different foraging behaviors than
golden eagles. If bald eagles winter in concentrations near projects, we would recommend some
site-specific surveys that target this federally threatened species.
RAPTOR NESTING
The number of active raptor nests observed and estimated raptor nest density within 2 miles of
the wind projects in agricultural [Condon (OR), Buffalo Ridge (MN), Klondike (OR), Zintel
Canyon (WA), Stateline (OR/WA)] and native [Columbia Hills (WA), Foote Creek Rim (WY),
Maiden (WA), Ponnequin (CO)] landscapes are reported in Tables 23 and 24. We did not find

AVIAN AND BAT BASELINE DATA AND MORTALITY SYNTHESIS WEST, Inc. 37
comparable data for the other WRA’s, especially the older California WRA’s. Raptor nest
surveys at wind projects have been used to aid in understanding potential impacts such as
collision, disturbance and displacement to breeding raptors, especially sensitive species. The
methods for surveying may also have differed among studies (e.g., one aerial survey versus two).
The lowest estimated raptor nest density occurred at Nine Canyon (WA), with one active raptor
nest within 2 miles of the project area. There was a historically active Swainson’s hawk nest just
over two miles from the Nine Canyon (WA) wind turbine locations. Columbia Hills (WA) and
Foote Creek Rim (WY) have the highest estimated raptor nest densities (0.320 and 0.270 per
square mile, respectively). A large majority of the nests within 2 miles of the Foote Creek Rim
(WY) turbines are red-tailed hawks, although no red-tailed hawk fatalities have been reported to
date. One golden eagle nest within approximately one-half mile of the wind turbines was active
and successfully fledged two young the first year of wind plant operation in 1999. The nest site
was inactive in 2000, but active again in 2001 (Johnson et al. 2000c, Young pers. comm. 2002).
Hunt (2002) studied the golden eagle population near the Altamont Pass (CA) WRA from 1994-
1997. Golden eagle nest density within 2 miles of the WRA is one active nest per 11.3 miles2.
The most recent models indicate an increasing population, even with the wind plant related
golden eagle fatalities. Raptors nesting closest to turbines likely have higher probabilities of
being impacted from disturbance (construction and operation) or from collision with turbines,
but data on nests very close to turbines (e.g., within ½ mile) is currently inadequate to determine
the level of these impacts.
BAT MORTALITY AND USE AT WIND PLANTS
The primary source of information in this section comes from recent research conducted by
Johnson et al. (2002). Bat collision mortality is not unique to wind plants. Previous studies have
documented bats colliding with other man-made structures. The first report was that by
Saunders (1930), who reported that five bats comprised of three species (red, hoary, and silver-
haired) were killed at a lighthouse in Ontario, Canada. Five eastern red bats were reported killed
by colliding with a television (TV) tower in Kansas (Van Gelder 1956). During 25 years of
monitoring a television tower in Florida, Crawford and Baker (1981) found 54 bat collision
victims representing seven species. Twelve dead hoary bats were picked up underneath another
TV tower in Florida over an 18-year period (Zinn and Baker 1979). Similarly, small numbers

AVIAN AND BAT BASELINE DATA AND MORTALITY SYNTHESIS WEST, Inc. 38
(<5) of bats have been killed by colliding with communication towers in Missouri (Anonymous
1961), North Dakota (Avery and Clement 1972), Tennessee (Ganier 1962), Saskatchewan,
Canada (Gollop 1965), and Florida (Taylor and Anderson 1973). Over an 8-year period, 50
eastern red, 27 silver-haired, 1 hoary, and 1 little brown bat collision victims were found
underneath large windows at a convention center in Chicago, Illinois (Timm 1989). Four eastern
red bats were killed by colliding with the Empire State Building in New York City (Terres 1956)
and other studies have documented eastern red bat fatalities at tall buildings (Mumford and
Whitaker 1982). Bats have also been documented to collide with powerlines (Dedon et al. 1989)
and fences (Iwen 1958, Denys 1972, Wisely 1978, Fenton 2001).
Wind plant-related bat mortality was first documented in Australia, where 22 white-striped
mastiff-bats (Tadarida australis) were found at the base of turbines over a 4-year period (Hall
and Richards 1972). At Buffalo Ridge (MN), 362 dead bats were collected at turbines from 1994
through 2001 (Osborn et al. 1996, Krenz and McMillan 2000, Johnson et al. 2000a, 2002).
Mortality estimates for the three phases at Bufflalo Ridge wind plant combined average 613 per
year (Table 25). From 1999 to 2001, 123 dead bats were found at the Foote Creek Rim (WY)
wind plant, resulting in a mean annual mortality estimate of 138 (Young et al. 2001). Ten dead
bats were found in 1999 at the Vansycle Ridge (OR) wind plant, resulting in a mortality estimate
of 28 (Erickson et al. 2000a). Thirty-four dead bats were found within the 31-turbine Wisconsin
wind plant (Keeley et al. 2001). In 2001, 30 dead bats were found at the Stateline wind plant
(OR/WA) (WEST and Northwest Wildlife Consultants Inc. 2002a) and several dead bats were
found over a 3-year period at the Ponnequin (CO) wind plant (Curry and Kerlinger 2002,
unpublished data). The highest mortality reported yet on a per turbine basis was at a 3-turbine
wind plant on top of Buffalo Mountain (TN), where 32 bats were found over a 15-month period
(Tennessee Valley Authority 2002). Small numbers of dead bats have also been found at several
wind plants in California (Howell and Didonato 1991, Orloff and Flannery 1992, Howell 1997,
Anderson et al. 2000, Thelander and Rugge 2000) and a small wind plant in Pennsylvania (Curry
and Kerlinger, unpublished data).
Most bat mortality documented at wind plants occurred in late summer and early fall. We found
AVIAN AND BAT BASELINE DATA AND MORTALITY SYNTHESIS WEST, Inc. 39
data for 536 bat collision fatalities in the U.S. where the approximate date of the collision was
reported (Table 26). Nearly 90% of all bat fatalities occurred from mid-July through mid-
September. Over 50% of the fatalities occurred in August. Most of the fatalities were comprised
of migratory tree bats. A total of 616 carcasses were identified to species. The hoary bat was by
far the most prominent species, comprising 61.7% of all fatalities (Table 27). Eastern red bats
comprised 17.2% and silver-haired bats comprised 7.1% of the fatalities. The remaining
fatalities were comprised of small numbers of big brown bat, little brown bat, and eastern
pipistrelle.
The hoary bat is a migratory species with the widest distribution of any bat in North America,
ranging from just below the Canadian tree line to South America (Shump and Shump 1982a).
Hoary’s are solitary bats that roost primarily in deciduous trees (Barbour and Davis 1969,
Nordquist 1997). Red and silver haired bats are similar to the hoary bat in that they also migrate.
Red bats are solitary tree bats (Carter 1950, Izor 1979, Shump and Shump 1982b, Kunz 1982,
Barclay et al. 1988). Historically, silver-haired bats were believed to roost alone under loose
bark, but more recent studies have documented maternal colonies of silver-haired bats (e.g.,
Betts (1996)). The other species (little brown bat, big brown bat, eastern pipistrelle) are colonial
species that roost in buildings, hollow trees, wood piles, and other structures (Fenton and Barclay
1980, Kurta and Baker 1990).
It is unlikely that resident bats comprise the bulk of the collision mortality. If residents were
involved, then the collisions should have occurred while bats were commuting from roosting to
foraging areas or were foraging within the wind plant. In most cases, there is no pattern in the
distribution of fatalities among turbines (Johnson et al. 2000a, Young et al. 2001). If the bulk of
the collision victims were local bats commuting from roosting to foraging areas, defined flight
corridors between these areas would be expected, and a widespread random distribution of
fatalities would seem unlikely. It also seems unlikely that bats would spend significant time
foraging at turbine rotor-swept heights within habitats where most wind plants occur. Most
turbines in the U.S. are situated within crop fields, pastures, grasslands, short-grass prairie, and
shrublands (Table 28). Although hoary bats have been known to occasionally forage in
agricultural areas when insect abundance at preferred feeding areas was low (Hickey and Fenton

AVIAN AND BAT BASELINE DATA AND MORTALITY SYNTHESIS WEST, Inc. 40
1996), most bats prefer to forage near trees or water (e.g., Carter et al. 1999, Everette et al.
2001). Both hoary and eastern red bats prefer to forage over sites with woody plant cover and
are positively associated with edge situations (Furlonger et al. 1987), neither of which are
present in most areas where turbines are located; therefore, they would not be expected to
frequently forage in habitats where the turbines are placed. At Buffalo Ridge (MN), bat activity
recorded at turbines (i.e., 2.2 passes per night), was very low compared to more suitable habitats
such as woodlands and wetlands, where bat activity was 15 times higher (i.e., 33.1 passes per
night) (Johnson et al. 2002).
Resident bats sometimes do fly at heights making them susceptible to turbine collision. Clark
and Stromberg (1987) reported that hoary bats observed feeding over hayfields in Wyoming
occasionally circled to high altitudes while feeding, and the eastern red bat is known for erratic
flight behavior upon first flight in the evening, when it will often fly at altitudes of 100 to 200 m
(LaVal and LaVal 1979). In Missouri, both hoary and eastern red bats were observed “foraging
high above trees and pastures” (LaVal et al. 1977), and in Florida, hoary bats were observed
foraging from 5 to 30 m above rivers and swamps (Zinn and Baker 1979). In general, however,
bats forage at heights well below the space occupied by turbine blades. Hoary and eastern red
bats typically forage from treetop level to within a meter of the ground, silver-haired bats spend
most of their time foraging at heights less than 6 m, and big brown bats forage from 7 m to 10 m
above ground (Barclay 1984, Fitzgerald et al. 1994). Little brown bats forage almost exclusively
less than 5 m above the ground; much of their foraging is done from 1 m to 2 m above ground
(Fenton and Bell 1979). It seems unlikely that foraging bats would routinely forage above 25 m,
which is the lowest height of the blade on most new generation turbines.
Foraging bats locate their prey primarily through echolocation (Simmons et al. 1979). Bats have
the ability to navigate through constructed clutter zones made of staggered vertical strands of
twine 3 mm in diameter spaced 1 m apart (Mackey and Barclay 1989, Brigham et al. 1997).
Bats are also able to detect large landscape and background features by echolocation out to
100 m (Griffin 1970, Suthers 1970). Surprisingly, studies with captive bats have shown that they
can avoid colliding with moving objects more successfully than stationary ones, presumably
because their foraging habits program them to detect moving objects (Jen and McCarty 1978). It

AVIAN AND BAT BASELINE DATA AND MORTALITY SYNTHESIS WEST, Inc. 41
seems unlikely that foraging bats using echolocation to locate prey would be unable to detect the
turbines, especially given the hoary bat’s ability to detect prey at long distances (Simmons and
Stein 1980, Belwood and Fullard 1984, Barclay 1985, Barclay 1986). As evidence that foraging
bats can detect turbines, bats were observed foraging within 1 meter of an operating wind turbine
in Europe, yet no mortality was documented (Bach et al. 1999). Similarly, during a study of bat
use at the National Wind Technology Center in Golden, Colorado, several bats were observed
foraging around research wind turbines, many of which were at heights similar to those occupied
by turbine blades, but no mortality was documented during routine carcass searches (U.S.
Department of Energy 2002).
At one study area in Ontario, Canada, both hoary and eastern red bats spent most of their
foraging time near street lights (Hickey and Fenton 1990, Hickey 1992), where moth abundance
is much higher than areas away from the lights (Hickey and Fenton 1990). Other studies have
also shown high foraging activity around lights by hoary, red and big brown bats (Wilson 1965,
Hamilton and Whitaker 1979, Fenton et al. 1983, Belwood and Fullard 1984, Geggie and Fenton
1985, Barclay 1985, Furlonger et al. 1987, Fullard 1989); therefore, lights on turbines may
increase the probability of bat collisions, assuming that the Federal Aviation Administration
lighting attracts nocturnal insects. At Buffalo Ridge (MN) Phase III site, however, 42 (48%) of
the 87 bat fatalities were found at lighted turbines and 45 (52%) were found at unlit turbines, and
approximately half of the turbines sampled were lighted, suggesting that presence of lighting had
no bearing on numbers of collision fatalities at that site.
Adults of some species of bats have been shown to change foraging patterns and locations once
juveniles are capable of flying, presumably due to the increased competition for food (Adams
1996, Adams 1997). However, this was documented only for colonial bats that occur in high
densities and has not been shown to occur in solitary species such as the hoary, red or silver-
haired bat. Therefore, the late summer increase in mortality is not likely explained by a
concurrent shift in diet or habitat use of resident adult bats. Recently fledged juvenile bats have
been reported to have reduced abilities to echolocate and fly compared to adults (Gould 1955,
Buchler 1980, Timm 1989, Rolseth et al. 1994); thus they may be more susceptible to colliding
with turbines or other objects (Manville 1963). Juvenile bats also change diets and increase

AVIAN AND BAT BASELINE DATA AND MORTALITY SYNTHESIS WEST, Inc. 42
home range size over the first several weeks post fledging (Rolseth et al. 1994), thereby possibly
making them more susceptible to turbine collision during post fledging. However, the increase
in mortality during late summer cannot be explained by a shift in habitat use by juveniles or an
increase in the number of young, inexperienced bats that had recently begun flying. In
Minnesota, 68% of all bat collision victims were adults (Johnson et al. 2000a, 2002) and at the
Foote Creek Rim (WY), all 21 bat collision victims aged in 2000 were adults (Young et al.
2001).
Based on all available evidence, it does not appear that bat mortality involves resident bats
foraging within the wind plant or commuting between foraging and roosting areas. In virtually
all cases of bat collision mortality documented at other structures, the timing suggested that
migrant bats were involved (e.g., Van Gelder 1956, Zinn and Baker 1979, Crawford and Baker
1981, Timm 1989). Data collected at wind plants in the U.S. also suggest that fall migrants
comprise most of the bat collision mortality (Keeley et al. 2001). Findley and Jones (1964)
reported that fall migration of hoary bats begins in August, and that migratory concentrations of
hoary bats in August have been observed throughout North America, including Nevada,
Massachusetts, and New York. At Delta Marsh along the southern end of Lake Manitoba,
Canada, hoary bats started migrating south in mid July (Koehler and Barclay 2000, Koehler
2002, pers. comm.), and the latest date for hoary bat captures was 3 September (Barclay 1984).
Hoary bats are thought to migrate through Badlands National Park in southern South Dakota in
mid-August (Bogan et al. 1996). Migrant hoary bats reach Florida as early as late September
(Hallman 1968). Similar timing of migration has been documented on the west coast, where
migrant hoary bats were found on the Farallon Islands, California, from 30 August to 6
September (Tenaza 1966), and museum records indicated a fall migration period of August and
September (Dalquest 1943).
LaVal and LaVal (1979) reported that eastern red bats migrate south from September through
November. Silver-haired bats are thought to migrate through Wyoming (Clark and Stromberg
1987) and Illinois (Izor 1979) in August and September. At Delta Marsh, Manitoba, both red
and silver-haired bats began migrating through the area in mid July (Koehler 2002, pers. comm.),
and the last capture date at Delta Marsh was 10 September for silver-haired bat and

AVIAN AND BAT BASELINE DATA AND MORTALITY SYNTHESIS WEST, Inc. 43
19 September for both red and little brown bats (Barclay 1984). The big brown bat, little brown
bat and eastern pipistrelle spend the winter in hibernacula, but the little brown and eastern
pipistrelle may migrate several hundred kilometers to hibernate (Davis and Hitchcock 1965,
Griffin 1970, Humphrey and Cope 1976), and the big brown bat may migrate up to 80 km to
hibernate (Mills et al. 1975). Autumn migration of little brown bats in Indiana and north-central
Kentucky occurred from the last week of July to mid-October (Humphrey and Cope 1976), and
little brown bats departed from central Iowa to areas near hibernacula after late August (Kunz
1971). Dispersal of summer colonies of eastern pipistrelles and big brown bats also occurs as
early as August (Barbour and Davis 1969). The timing of migratory or dispersal movements by
species other than hoary bat also corresponds to the timing of collision mortality that has
occurred at most wind plants.
Based on the timing of spring migration (e.g., Koehler and Barclay 2000), hoary, red and silver-
haired bats are assumed to be migrating north through North America in mid to late May.
However, very few collision fatalities have been found in the spring at U.S. wind plants. Of 536
bat collision mortalities at wind plants across the U.S., only 2 were killed in May (Table 26).
Spring migrants have also rarely been found at other structures; of 50 dead eastern red bats
collected at a building in Chicago, 48 were found in the fall and 2 in the spring (Timm 1989).
Why spring migrants are not as susceptible to colliding with turbines as fall migrants is not clear.
Several species of birds are known to follow different migration routes in the spring and fall
(e.g., Cooke 1915, Lincoln 1950, Richardson 1974, 1976), and perhaps some bat populations
may follow similar patterns. Behavioral differences between migrating hoary bats in the spring
and fall may be related to mortality patterns. Such differences have been reported; in Florida,
autumn migration occurred in waves whereas the spatial distribution of bats during spring
migration appeared to be far more scattered (Zinn and Baker 1979).
At the Foote Creek Rim (WY) wind plant, data from Anabat® bat detectors indicated 2.6 bat
passes per turbine per night during the summer and fall (Gruver 2002, pers. comm.). At Buffalo
Ridge (MN), the number of bat passes recorded with an Anabat® detector averaged 2.2 per
turbine per night. The number of passes decreased as distance to woodland increased (p=0.017),
and the number of passes increased with increases in the proportion of residential woodlots

AVIAN AND BAT BASELINE DATA AND MORTALITY SYNTHESIS WEST, Inc. 44
within 100 m of the turbine (p=0.012). Based on Anabat® and mortality data, the authors
estimated that one collision fatality occurred for every 70 bat passes recorded (Johnson et al.
2002), with an unknown number of passes not detected. There was no statistical relationship
between bat activity at turbines and the number of bat fatalities, as the mean number of bat
passes at turbines with no mortality (2.29) was not significantly different from the mean number
of passes at turbines with mortality (1.60) (t=0.33, p=0.7412, df=133). At the Buffalo Mountain
(TN) wind plant, bat activity as measured with Anabat® was also not correlated with collision
mortality (Nicholson 2001). The migrant species observed as fatalities may not be echolocating
or are flying too high for the bat detectors to pick up.
Although there are at least 39 species of bats in the U.S., only 6 species comprise all known bat
fatalities at U.S. wind plants. In Minnesota, sampling with Anabat® and mist nets indicated that
there are relatively large breeding populations of big brown and little brown bats in close
proximity to the wind plant that experience little to no wind plant-related collision mortality. At
the Foote Creek Rim (WY) wind plant, mist net studies indicated the presence of large numbers
of long-eared myotis, little brown bat, and long-legged myotis near the wind plant, yet none of
these populations appeared susceptible to collision mortality (Gruver 2002, pers. comm.).
Similarly, at Buffalo Mountain (TN), two species of bats (little brown and eastern big-eared bat)
were detected near the wind plant with Anabat® and mist nets, yet neither species was among
the 32 bat fatalities documented the first year of operation (Nicholson 2001). The factors that
account for the differential susceptibility to turbine collisions are unknown. Because they have
high wing loading and aspect ratio (Norberg and Rayner 1987) hoary bats fly rapidly but are not
very maneuverable (Farney and Fleharty 1969, Barclay 1985) compared to other bat species in
the U.S. These characteristics may make hoary bats more susceptible to turbine collision than
other species. There is little information available on flight heights of migrating bats, however,
Altringham (1996) reported that at least some groups of bats are known to migrate much higher
than 100 m in altitude, and bats migrating during the day over Washington, D.C. were reported
flying from 46 to 140 m (Allen 1939). Many species of bats make extensive use of linear
features in the landscape while commuting (Limpens and Kapteyn 1991) and migrating
(Humphrey and Cope 1976, Timm 1989), and perhaps linear features such as ridges or rivers are
followed by migrating bats.

AVIAN AND BAT BASELINE DATA AND MORTALITY SYNTHESIS WEST, Inc. 45
The cause of bat collisions with wind turbines or other man-made structures is not well
understood (Osborn et al.1996, Johnson et al. 2000a). According to Van Gelder (1956), most bat
collisions at other man-made structures occur during migration and are normally associated with
inclement weather and avian collision mortalities. Based on this, he hypothesized that inclement
weather forced migrating birds to fly lower, and the birds somehow confused the migrating bats.
However, at a communication tower in Florida, bat fatalities were found largely in the absence of
associated avian mortalities (Crawford and Baker 1981), and there appeared to be no relationship
in the number of bat and bird fatalities found during previous studies of wind plants in the U.S.
(Osborn et al. 1996, Erickson et al. 2000, Johnson et al. 2000a, 2000b, Young et al. 2001).
Even though echolocation in flying bats does not require additional energy expenditures
(Speakman and Racey 1991), evidence suggests that migrating bats may navigate without use of
echolocation (Van Gelder 1956, Griffin 1970, Crawford and Baker 1981, Timm 1989). Despite
the common phrase “blind as a bat”, bats have good visual acuity (Suthers 1966, 1970) and
evidence indicates that bats depend on vision, rather than echolocation, for long-distance
orientation (Mueller 1968, Williams and Williams 1970, Fenton 2001). If bats are flying through
wind farms by sight only, then causes of bat mortality could be similar to causes of avian
collision mortality at wind plants.
Potential population effects of wind power-related mortality cannot be quantified with available
data. At Buffalo Ridge (MN), circumstantial evidence suggests that the mortality may not be
great enough to cause population declines of bat populations migrating over the study area. Most
bats have very slow population growth rates for a small mammal (Fitzgerald et al. 1994). As a
result, high mortality rates should result in population declines (Humphrey and Cope 1976,
Keeley et al. 2001). If bat mortality associated with wind power development at Buffalo Ridge
(MN) has significantly impacted the affected bat “population”, then one might expect lower
mortality each subsequent year simply because there would be fewer bats present to collide with
turbines. However, based on data collected from 1998 through 2001 (Johnson et al. 2000a,
Krenz and McMillan 2000, Johnson et al. 2002), mortality has not decreased for at least 4
consecutive years at one wind plant and 3 successive years at another. Potential effects on
populations of sustained collision mortality at these levels over several years are not known, but

AVIAN AND BAT BASELINE DATA AND MORTALITY SYNTHESIS WEST, Inc. 46
preliminary data suggest that the number of bats migrating through the Buffalo Ridge (MN) area
may be substantial (Johnson et al. 2002), and that wind plant-related mortality is apparently not
large enough to cause measurable population declines.
Few studies have attempted to examine bat use of WRA’s prior to development. Efforts were
made to estimate bat use of the Stateline (OR/WA) wind plant (Hayes and Waldien 2000a) and
the Condon (OR) wind development area (Hayes and Waldien 2000b). Potential roost structures
(trees, rock outcrops, buildings) were scarce throughout both areas. Few water sites were also
available in the study areas, especially during late summer when bats are migrating through the
study areas. Very limited surveying with mist nets and bat echolocation detectors did not detect
any bat activity at the Stateline (OR/WA) project area. At the Condon (OR) site, bat activity was
low at upland sites; 9 bat passes were recorded during 10 detector nights in September. There
was considerable activity recorded at the stream and pond sites. For most of these sites, bat
activity was nearly continual for portions of the night when bat activity was monitored. All bats
recorded at stream and pond sites were Myotis bats. Based on results of the surveys, the authors
concluded that the impacts of the proposed development on resident bats would likely be low but
that completion of the proposed project would likely result in increased mortality of migratory
bats.
OVERALL CONCLUSIONS
1. Raptor mortality has been absent to very low at all newer generation wind plants studied
in the U.S. This and other information regarding wind turbine design and wind
plant/wind turbine siting strongly suggests that the level of raptor mortality observed at
Altamont Pass is quite unique (e.g., unique likely because of the number and arrangement
of turbines in small area, turbine types, prey availability, raptor use) and can be avoided
at other locations.
2. The amount and extent of ecological baseline data to collect at a wind project should be
determined on a case-by-case basis. The decision should use information gained from
this report, recent information from new projects (e.g., Stateline OR/WA), existing
project site data from agencies and other knowledgeable groups/individuals, public
scoping, and results of vegetation and habitat mapping. Other factors that should also be
considered include the likelihood of the presence of sensitive species at the site and

AVIAN AND BAT BASELINE DATA AND MORTALITY SYNTHESIS WEST, Inc. 47
expected impacts to those species, project size and project layout. 3. In the majority of the raptor groups we investigated (all raptors combined, buteos, golden
eagles, northern harriers, large falcons), baseline avian use data collected during one
season (spring, summer or fall) appear adequate for making overall wind plant direct
impact predictions (e.g., low, moderate or high relative mortality). This appears to be
especially true for sites in agricultural settings. Correlation analyses, in general, suggest
overall use predictions for these groups based on one or two seasons of information
would be similar to predictions from a four-season study. As a result, sites can be ranked
in terms of overall raptor, buteo, golden eagle and large falcon use reasonably well based
on one season of data collection (spring, summer or fall), compared to four seasons of
data collection. 4. In cases where baseline data or other information (e.g., historic data or habitat) indicate a
site has levels of raptor use considered high (regionally high, or in comparison to use at
other projects considered high (e.g., Altamont Pass (CA) and Foote Creek Rim (WY)
golden eagle use estimates), we recommend collecting more than one season of baseline
data to refine predictions and to make micro-siting decisions that might reduce impacts.
Sites with high raptor use, and comprised of large tracts of high quality native habitat
with high topographic relief (e.g., distinct ridges) and/or containing other features (e.g.,
significant water sources) that may lead to distinct patterns in raptor use are likely
candidates for effective micro-siting. Many of the project sites within agricultural
landscapes do not typically meet any of these criteria and are therefore not strong
candidates for effective micro-siting. 5. Raptor use (e.g., golden eagle use) may be a predictor of raptor risk (e.g., likelihood of
mortality) when comparing several sites and when comparing different areas within a
site. However, low raptor mortality at newer generation wind plants has resulted in low
correlation between use and fatality rates at these new projects. It is possible that the new
turbine designs and turbine-siting decisions made on avian use patterns have resulted in
reduced avian mortality. However, this has not been experimentally tested. 6. Wind plants with year-round waterfowl use have shown the highest waterfowl mortality,
although the levels of waterfowl/waterbird mortality appear very low compared to the
waterfowl/waterbird use of the sites. Sites within native landscapes have shown very low

AVIAN AND BAT BASELINE DATA AND MORTALITY SYNTHESIS WEST, Inc. 48
waterfowl use, except when significant water sources are available (e.g., San Gorgonio
[CA]). No waterfowl mortality has been documented at the Klondike (OR) wind plant
between January 1 and March 31 2002, although several Canada goose flocks have been
observed during surveys; and only one Canada goose fatality has been reported at any
U.S. wind plant.
7. Passerines comprise a large proportion of the fatalities at new wind plants, and involve
both residents and migrant species. Studies of nocturnal migration at several wind plants
suggest the mortality appears very low compared to the rates of bird targets passing
through the area.
8. Since few raptor species targeted during nest surveys (i.e., those visible from helicopter
surveys) have been observed as fatalities at newer wind plants, correlations are very low
between fatalities and overall raptor nest density (nest density within 2 miles of project
facilities). Raptors nesting closest to turbines likely have higher probabilities of being
impacted from disturbance (construction and operation) or from collision with turbines,
but data on nests very close to turbines (e.g., within ½ mile) are currently inadequate to
determine the level of these impacts. The existing wind plant with the highest reported
nest density is Foote Creek Rim (WY). Most of the nests within 2 miles of the wind
plant are red-tailed hawks, but no red-tailed hawk fatalities have been documented at this
site.
9. Bat collision mortality during the breeding season is virtually non-existent, despite the
fact that relatively large numbers of some bat species have been documented in close
proximity to wind plants. These data suggest that wind plants do not currently impact
resident breeding bat populations where they have been studied in the U.S.
10. All available evidence indicates that most of the bat mortality at U.S. wind plants
involves migrant or dispersing bats in the late summer and fall.
11. Bat echolocation and collision mortality studies suggest that only a small fraction of
detected bat passes near turbines result in collisions, and that there appears to be little
relationship between bat activity at turbines and subsequent collision mortality. This lack
of relationship between activity and mortality is probably because many of the migrant
species involved are either not echolocating or are flying too high for the bat detectors
(Anabat®) to record but still within the zone of collision risk.
AVIAN AND BAT BASELINE DATA AND MORTALITY SYNTHESIS WEST, Inc. 49
ACKNOWLEDGEMENTS
We would like to thank Bonneville Power Administration (BPA) for funding this meta-analysis
effort. We would also like to thank the many developers and organizations that funded the
studies and provided data that are included in this report. The extensive literature review in the
bat section has been adapted from a study supported by EPRI, XCEL Energy, and Minnesota
DNR. We also want to thank Deb Malin from BPA, Karen Kronner from Northwest Wildlife
Consultants Inc., Andy Linehan of CH2MHILL, Tom Meehan from Oregon Office of Energy,
Gail McEwen and staff from Oregon Department of Fish and Wildlife, David Mudd and Jeff
Bernowitz from Washington Department of Fish and Wildlife, Lynn Sharp of URS Corporation,
and Two Ravens Inc. for providing comments on an earlier draft of this document.

AVIAN AND BAT BASELINE DATA AND MORTALITY SYNTHESIS WEST, Inc. 50
LITERATURE CITED
Adams, R.A. 1996. Size specific resource use in juvenile little brown bats, Myotis lucifugus (Chiroptera: Vespertilionidae): Is there an ontogenetic shift? Canadian Journal of Zoology 74:1204-1210.
Adams, R.A. 1997. Onset of volancy and foraging patterns of juvenile little brown bats, Myotis
lucifugus. Journal of Mammalogy 78:239-246. Allen, G.M. 1939. Bats. Dover Publications, Inc., New York, New York. 358pp. Altringham, J.D. 1996. Bats: Biology and Behaviour. Oxford University Press, Inc., New York.
262 pp. Anderson, R. 2000a. Personal communication. Composition data collected during phase I
studies at San Gorgonio (1996-1998). Anderson, R. 2000b. Personal communication. Composition data collected during pilot and
phase I studies at Tehachapi Pass (1995-1998). Anderson, R., M. Morrison, K. Sinclair and D. Strickland. 1999. Studying wind energy/bird
interactions: A guidance document. National Wind Coordinating Committee/RESOLVE, Washington, D.C. 87pp.
Anderson, R.L., D. Strickland, J. Tom, N. Neumann, W. Erickson, J. Cleckler, G. Mayorga, G.
Nuhn, A. Leuders, J. Schneider, L. Backus, P. Becker and N. Flagg. 2000. Avian monitoring and risk assessment at Tehachapi Pass and San Gorgonio Pass wind resource areas, California: Phase 1 preliminary results. Proceedings of the National Avian-Wind Power Planning Meeting 3:31-46. National Wind Coordinating Committee, Washington, D.C.
Anonymous. 1961. Large bird kills at TV towers. Bluebird 28:9. Avery, M. and T. Clement. 1972. Bird mortality at four towers in eastern North Dakota: Fall
1972. Prairie Naturalist 4:87-95. American Wind Energy Association (AWEA). 1995. Avian interactions with wind energy
facilities: a summary. Prepared by Colson & Associates for AWEA, Washington, D.C. Bach, L., R. Brinkman, H.J.G.A. Limpens, U. Rahmel, M. Reichenbach, and A. Roschen. 1999.
Bewertung und planerische Umsetzung von Fledermausdaten im Rahmen der Windkraftplanung. - Bremer Beitraege fuer Naturkunde und Naturschutz, Band 4. Themenheft “Voegel und Windkraft”: 163-170.
Barbour, R.A. and W.H. Davis. 1969. Bats of America. Univ. of Kentucky, Lexington.

AVIAN AND BAT BASELINE DATA AND MORTALITY SYNTHESIS WEST, Inc. 51
Barclay, R.M.R. 1984. Observations on the migration, ecology and behaviour of bats at Delta Marsh, Manitoba. Canadian Field-Naturalist 98:331-336.
Barclay, R.M.R. 1985. Long- versus short-range foraging strategies of hoary (Lasiurus cinereus)
and silver-haired (Lasionycteris noctivagans) bats and the consequences for prey selection. Canadian Journal of Zoology 63:2507-2515.
Barclay, R.M.R. 1986. The echolocation calls of hoary (Lasiurus cinereus) and silver-haired
(Lasionycteris noctivagans) bats as adaptations for long- versus short-range foraging strategies and the consequences for prey selection. Canadian Journal of Zoology 64:2700-2705.
Barclay, R.M.R., P.A. Faure, and D.R. Farr. 1988. Roosting behavior and roost selection by
migrating silver-haired bats (Lasionycteris noctivagans). Journal of Mammalogy 69:821-825.
Belwood, J.J. and J.H. Fullard. 1984. Echolocation and foraging behaviour in the Hawaiian
hoary bat, Lasiurus cinereus semotus. Canadian Journal of Zoology 62:2113-2120. Betts, B. J. 1996. Roosting behaviour of silver--haired bats (Lasionycteris noctivagans) and big
brown bats (Eptesicus fuscus) in northeast Oregon. Pp. 55-61, in Bats and forests symposium (R. M. R. Barclay and R. M. Brigham, eds.). British Columbia Ministry of Forests, Victoria, Canada, 292pp.
Bogan, M.A., J.G. Osborne, and J.A. Clarke. 1996. Observations on bats at Badlands National
Park, South Dakota. Prairie Naturalist 28:115-123. Brigham, R.M., S.D. Grindal, M.C. Firman, and J.L. Morissette. 1997. The influence of
structural clutter on activity patterns of insectivorous bats. Canadian Journal of Zoology 75:131-136.
Buchler, E.R. 1980. The development of flight, foraging, and echolocation in the little brown bat
(Myotis lucifugus). Behavioral Ecology and Sociobiology 6:211-218. California Energy Commission (CEC). 1989. Avian mortality at large wind energy facilities in
California: identification of a problem. California Energy Commission staff report P700-89-001.
Carter, T.D. 1950. On the migration of the red bat, Lasiurus borealis borealis. Journal of
Mammalogy 31:349-350. Carter, T.C., M.A. Menzel, B.R. Chapman, K.V. Miller, and J.R. Lee. 1999. A new method to
study bat activity patterns. Wildlife Society Bulletin 27:598-602.
Clark, T.W. and M.R. Stromberg. 1987. Mammals in Wyoming. Univ. of Kansas Museum of Natural History. 314pp.

AVIAN AND BAT BASELINE DATA AND MORTALITY SYNTHESIS WEST, Inc. 52
Cooke, W.W. 1915. Bird migration. U.S. Department of Agriculture Bulletin 185:1-47. Crawford, R.L. and W.W. Baker. 1981. Bats killed at a north Florida television tower: a 25-year
record. Journal of Mammalogy 62:651-652. Dalquist, 1943. Seasonal distribution of the hoary bat along the Pacific coast.
Murrelet 24:21-24.
Davis, W.H. and H.B. Hitchcock. 1965. Biology and migration of the bat, Myotis lucifugus, in New England. Journal of Mammalogy 46:296-313.
Dedon, M., S. Byrne, J. Aycrigg, and P. Hartman. 1989. Bird mortality in relation to the Mare
Island 115-kV transmission line: progress report 1988/1989. Department of the Navy, Western Division, Naval Facilities Engineering Command, Office of Environmental Management, San Bruno, California. Report 443-89.3. 150pp.
Demastes, J. W. and J. M. Trainer. 2000. Avian risk, fatality, and disturbance at the IDWGP
Wind Farm, Algona, Iowa. Final report submitted by University of Northern Iowa, Cedar Falls, IA. 21pp.
Denys, G.A. 1972. Hoary bat impaled on barbed wire. Jack-Pine Warbler 50:63. Erickson, W.P., G. D. Johnson, M. D. Strickland, D. P. Young, Jr., K.J. Sernka and R.E. Good.
2001. Avian collisions with wind turbines: A summary of existing studies and comparisons to other sources of avian collision mortality in the United States. National Wind Coordinating Committee Publication. http://www.nationalwind.org/pubs/default.htm
Erickson, W.P., M.D. Strickland, G.D. Johnson, and J.W. Kern. 2000a. Examples of statistical
methods to assess risk of impacts to birds from wind plants. Proceedings of the National Avian-Wind Power Planning Meeting III. National Wind Coordinating Committee, c/o RESOLVE, Inc., Washington, D.C.
Erickson, W.P., G.D. Johnson, M.D. Strickland, and K. Kronner. 2000b. Avian and bat
mortality associated with the Vansycle Wind Project, Umatilla County, Oregon: 1999 study year. Technical Report prepared by WEST, Inc. for Umatilla County Department of Resource Services and Development, Pendleton, Oregon. 21pp.
Erickson W.P., G. D. Johnson, M. D. Strickland, and K. Kronner. 1999. Avian baseline study at
the proposed CARES Wind plant, Goldendale WA. NREL/SR-500-259. Everette, A.L., T.J. O’Shea, L.E. Ellison, L.A. Stone, and J.L. McCance. 2001. Bat use of a high-
plains urban wildlife refuge. Wildlife Society Bulletin 29:967-973. Farney, J. and E.D. Fleharty. 1969. Aspect ratio, loading, wing span, and membrane areas of
bats. Journal of Mammalogy 50:362-367.

AVIAN AND BAT BASELINE DATA AND MORTALITY SYNTHESIS WEST, Inc. 53
Fenton, M.B. 2001. Bats, Revised Edition. Checkmark Books, New York, NY. 224 pp. Fenton, M.B. and R.M.R. Barclay. 1980. Myotis lucifugus. Mammalian Species 142:1-8. Fenton, M.B. and G.P. Bell. 1979. Echolocation and feeding behaviour in four species of
Myotis (Chiroptera). Canadian Journal of Zoology 57:1271-1277. Fenton, M.B., H.G. Merriam, and G.L. Holryod. 1983. Bats of Kootenay, Glacier, and Mount
Revelstoke national parks in Canada: identification by echolocation calls, distribution, and biology. Canadian Journal of Zoology 61:2503-2508.
Findley, J.S. and C. Jones. 1964. Seasonal distribution of the hoary bat. Journal of Mammalogy
45:461-470. Fitzgerald, J.P., C.A. Meaney, and D.M. Armstrong. 1994. Mammals of Colorado. University
Press of Colorado, Niwot, CO. 467pp. Fullard, J.H. 1989. Echolocation survey of the distribution of the Hawaiian hoary bat (Lasiurus
cinereus semotus) on the island of Kaua’i. Journal of Mammalogy 70:424-426. Furlonger, C.L., H.J. Dewar, and M.B. Fenton. 1987. Habitat use by foraging insectivorous bats.
Canadian Journal of Zoology 65:284-288. Ganier, A.F. 1962. Bird casualties at a Nashville TV tower. Migrant 33:58-60. Garrett, M. 2002. Personal communication regarding bird fatalities on Foote Creek Rim in
2001. Geggie, J.F. and M.B. Fenton. 1985. A comparison of foraging by Eptesicus fuscus (Chiroptera:
Vespertilionidae) in urban and rural environments. Canadian Journal of Zoology 63:263-267.
Gollop, M.A. 1965. Bird migration collision casualties at Saskatoon. Blue Jay 23:15-17. Gould, E. 1955. The feeding efficiency of insectivorous bats. Ibid 36:399-407. Griffin, D.R. 1970. Migrations and homing of bats. Pages 233-264 in W.A. Wimsatt, ed.
Biology of bats. Vol. 1. Academic Press, New York. 406pp. Gruver, J. 2002. University of Wyoming. Personal communication regarding his bat research
progress at the Foote Creek Rim wind plant. Hall, L.S. and G.C. Richards. 1972. Notes on Tadarida australis (Chiroptera:molossidae).
Australian Mammalogy 1:46.

AVIAN AND BAT BASELINE DATA AND MORTALITY SYNTHESIS WEST, Inc. 54
Hallman, R.C. 1968. Hoary bat (Lasiurus cinereus) in Bay County, Florida. Florida Naturalist 41:36.
Hamilton, W.J., Jr. and J.O. Whitaker, Jr. 1979. Mammals of the eastern United States. Cornell
Univ. Press, Ithaca, NY. 346pp. Hawrot, R. Y. and J. M. Hanowski. 1997. Avian assessment document: avian population
analysis for wind power generation regions. NRRI Technical Report No. NRRI/TR-97-23, Center for Water and the Environment, Natural Resources Research Institute, Duluth, MN. 14pp.
Hayes, J.P. and D.L. Waldien. 2000a. Potential influences of the Stateline wind project on bats.
Unpublished report prepared for CH2MHILL, Portland, Oregon. Hayes, J.P. and D.L. Waldien. 2000b. Potential influences of the proposed Condon wind project
on bats. Unpublished report prepared for CH2MHILL, Portland, Oregon. Hickey, M.B.C. 1992. Effect of radiotransmitters on the attack success of hoary bats, Lasiurus
cinereus. Journal of Mammalogy 73:344-346. Hickey, M.B.C. and M.B. Fenton. 1996. Behavioural and thermoregulatory responses of female
hoary bats, Lasiurus cinereus (Chiroptera: Vespertilionidae), to variations in prey availability. Ecoscience 3:414-422.
Hickey, M.B.C. and M.B. Fenton. 1990. Foraging by red bats (Lasiurus borealis): do
intraspecific chases mean territoriality? Canadian Journal of Zoology 68:2477-2482. Howe, R. 2001. Personal communication on avian fatalities observed at two Wisconsin wind
plants. Howell, J.A. 1997. Bird mortality at rotor swept area equivalents, Altamont Pass and
Montezuma Hills, California. Transactions of the Western Section of the Wildlife Society 33:24-29.
Howell, J.A. and J.E. Didonato. 1991. Assessment of avian use and mortality related to wind
turbine operations, Altamont Pass, Alameda and Contra Costa Counties, California, September 1988 through August 1989. Final report submitted to U.S. Windpower, Inc.
Howell, J. A. and J. Noone. 1992. Examination of avian use and mortality at a U.S. Windpower
wind energy development site, Solano County, California. Final Report to Solano County Department of Environmental Management, Fairfield, CA. 41pp.
Howell, J. A., J. Noone and C. Wardner. 1991a. Avian use and mortality study, U.S.
Windpower, wind energy site development, Montezuma Hills, Solano County, California, post construction, spring, 1990 to spring, 1991. Prepared for Solano County Department of Environmental Management, Fairfield, California.

AVIAN AND BAT BASELINE DATA AND MORTALITY SYNTHESIS WEST, Inc. 55
Howell, J. A., J. Noone and C. Wardner. 1991b. Visual experiment to reduce avian mortality
related to wind turbine operations, Altamont Pass, Alameda and Contra Costa counties, California, April 1990 through March 1991. Final report prepared for Kenetech Windpower.
Hunt, W.G., 2002. Golden eagles in a perilous landscape: predicting the effects of mitigation
for energy-related mortality. Report to the California Energy Commission, PIER Grant No. 500-97-4033 to the University of California, Santa Cruz, CA.
Humphrey, S.R. and J.B. Cope. 1976. Population ecology of the little brown bat, Myotis
lucifugus, in Indiana and north-central Kentucky. American Society of Mammalogists Special Publication No. 4. 81pp.
Iwen, F.A. 1958. Hoary bat, the victim of a barbed wire fence. Journal of Mammalogy 39:438. Izor, R.J. 1979. Winter range of the silver-haired bat. Journal of Mammalogy 69:641-643. Jeffrey, J. 2002. Personal communication regarding bird behaviors at the Stateline Wind Plant. Jen, P.H.S. and J.K. McCarty. 1978. Bats avoid moving objects more successfully than
stationary ones. Nature 275:743-744. Johnson, G.D. 2002. Personal communication regarding Klondike wind project monitoring. Johnson, G.D., W.P. Erickson, D.A. Shepherd, M. Perlik, M.D. Strickland, and C. Nations.
2002. Bat interactions with wind turbines at the Buffalo Ridge, Minnesota wind resource area: 2001 field season. Electric Power Research Institute, Palo Alto, California.
Johnson, G. D., D. P. Young, Jr., W. P. Erickson, C. E. Derby, M. D. Strickland, and R. E. Good.
2000a. Wildlife Monitoring Studies: SeaWest Wind Power Project, Carbon County, Wyoming: 1995-1999. Tech. Report prepared by WEST, Inc. for SeaWest Energy Corporation and Bureau of Land Management. 195pp.
Johnson, G.D., W.P. Erickson, M.D. Strickland, M.F. Shepherd and D.A. Shepherd. 2000b.
Avian Monitoring Studies at the Buffalo Ridge Wind Resource Area, Minnesota: Results of a 4-year study. Technical report prepared for Northern States Power Co., Minneapolis, MN. 212pp.
Johnson, G.D., D.P. Young, Jr., W.P. Erickson, M.D. Strickland, R.E. Good and P. Becker.
2000c. Avian and bat mortality associated with the initial phase of the Foote Creek Rim Wind Power Project, Carbon County, Wyoming: November 3, 1998 - October 31, 1999. Technical report prepared for SeaWest Energy Corporation and Bureau of Land Management. 32pp.
Jones & Stokes Associates, Inc. 1995. Technical report: Avian use of proposed Kenetech and

AVIAN AND BAT BASELINE DATA AND MORTALITY SYNTHESIS WEST, Inc. 56
Cares Wind Farm Sites in Klickitat County, Washington. Keeley, B., S. Ugoretz, and D. Strickland. 2001. Bat ecology and wind turbine considerations.
Proceedings of the National Avian-Wind Power Planning Meeting, 4:135-146. National Wind Coordinating Committee, Washington, D.C.
Kerlinger, P. 2000. Avian mortality at communication towers: a review of recent literature,
research, and methodology. Unpublished report prepared for the U.S. Fish and Wildlife Service, Office of Migratory Bird Management. http://migratorybirds.fws.gov/issues/towers/review.pdf
Kerlinger, P. 1997. A study of avian fatalities at the Green Mountain Power Corporation’s
Searsburg, Vermont, wind power facility – 1997. Prepared for Vermont Department of Public Service, Green Mountain Power Corporation, National Renewable Energy Laboratory and Vermont Environmental Research Associates. 12pp.
Kerlinger, P., R. Curry, and R. Ryder. 2000. Ponnequin wind energy project: reference site
avian study, January 1, 1998 – December 31, 1998. NREL/SR-500-27546. Kerlinger, P. 2000. Curry and Kerlinger, Inc. Personal communication regarding avian
mortality data from Ponnequin, Colorado, Somerset Pennsylvania and Searsburg, Vermont.
Klem, D., Jr. 1991. Glass and bird kills: an overview and suggested planning and design
methods of preventing a fatal hazard. Pp.99-103 in Wildlife Conservation in Metropolitan Environments. NIUW Symp. Ser. 2, L.W. Adams and D.L. Leedy, eds. Natl. Inst. for Urban Wildlife, Columbia, MD.
Koehler, C.E. and R.M.R. Barclay. 2000. Post-natal growth and breeding biology of the hoary
bat (Lasiurus cinereus). Journal of Mammalogy 81:234-244. Koehler, C.E. 2002. Personal communication regarding bat research. Univ. Calif. Riverside. Krenz, J.D., and B.R. McMillan. 2000. Final Report: Wind-turbine related bat mortality in
southwestern Minnesota. Minnesota Department of Natural Resources, St. Paul. Kunz, T.H. 1971. Reproduction of some Vespertilionid bats in central Iowa. American Midland
Naturalist 86:477-486. Kunz, T.H. 1982. Lasionycteris noctivagans. Mammalian Species 172:1-5. Kurta, A. and R.H. Baker. 1990. Eptesicus fuscus. Mammalian Species 356:1-10. LaVal, R.K. and M.L. LaVal. 1979. Notes on reproduction, behavior, and abundance of the red
bat, Lasiurus borealis. Journal of Mammalogy 60:209-212.

AVIAN AND BAT BASELINE DATA AND MORTALITY SYNTHESIS WEST, Inc. 57
LaVal, R.K., R.L. Clawson, M.L. LaVal, and W. Caire. 1977. Foraging behavior and nocturnal activity patterns of Missouri bats, with emphasis on the endangered species Myotis grisescens and Myotis sodalis. Journal of Mammalogy 58:592-599.
Limpens, H.J.G.A. and K. Kapteyn. 1991. Bats, their behaviour and linear landscape elements.
Myotis 29:39-47. Lincoln, F.C. 1950. Migration of birds. U.S. Fish and Wildlife Service, Circular No. 16,
Washington, D.C. Mabee, T. J. and B. A. Cooper. 2002. Nocturnal bird migration at the Stateline and Vansycle
wind energy projects, 2000-2001. Final report prepared for CH2MHILL and FPL Energy Vansycle, LLC, by ABR Inc., Forest Grove, OR.
Mackey, R.L. and R.M.R. Barclay. 1989. The influence of physical clutter and noise on the
activity of bats over water. Canadian Journal of Zoology 67:1167-1170. Manville, R.H. 1963. Accidental mortality in bats. Mammalia 27:361-366. McCrary, M. D., R. L. McKernan, R. E. Landry, W. D. Wagner and R. W. Schreiber. 1983.
Nocturnal avian migration assessment of the San Gorgonio wind resource study area, spring 1982. Report prepared for Research and Development, Southern California Edison Company. 121pp.
McCrary, M. D., R. L. McKernan and R. W. Schreiber. 1986. San Gorgonio wind resource
area: Impacts of commercial wind turbine generators on birds, 1985 data report. Prepared for Southern California Edison Company. 33pp.
McCrary, M. D., R. L. McKernan, W. D. Wagner and R. E. Landry. 1984. Nocturnal avian
migration assessment of the San Gorgonio wind resource study area, fall 1982. Report prepared for Research and Development, Southern California Edison Company; report #84-RD-11. 87pp.
Mills, R.S., G.W. Barrett, and M.P. Farrell. 1975. Population dynamics of the big brown bat
(Eptesicus fuscus) in southwestern Ohio. Journal of Mammalogy 56:591-604. Mueller, H.C. 1968. The role of vision in vespertilionid bats. American Midland Naturalist
79:524-525. Mumford, R.E. and J.O. Whitaker, Jr. 1982. Mammals of Indiana. Indian Univ. Press,
Bloomington, IN. 537pp. National Wind Coordinating Committee (NWCC). 2002. Permitting of wind energy facilities:
A handbook. Revised. NWCC c/o RESOLVE, Washington, D.C. Nicholson, C.P. 2001. Buffalo Mountain Windfarm bird and bat mortality monitoring report:

AVIAN AND BAT BASELINE DATA AND MORTALITY SYNTHESIS WEST, Inc. 58
October 2000 - September 2001. Tennessee Valley Authority, Knoxville. Norberg, U.M. and J.M.V. Rayner. 1987. Ecological, morphology and flight in bats (Mammalia:
Chiroptera): wing adaptations, flight performance, foraging strategy and echolocation. Philosophical Transactions Royal Society London 316:335-427.
Nordquist, G.E. 1997. Bats in Minnesota. James Ford Bell Museum of Natural History Natural
History Leaflet. Univ. of Minnesota. Orloff, S. and A. Flannery. 1992. Wind turbine effects on avian activity, habitat use, and
mortality in Altamont Pass and Solano County Wind Resource Areas, 1989-1991. Final Report to Alameda, Costra Costa and Solano Counties and the California Energy Commission by Biosystems Analysis, Inc., Tiburon, CA.
Orloff, S. and A. Flannery. 1996. A continued examination of avian mortality in the Altamont
Pass Wind Resource Area. Final Report to the California Energy Commission by Biosystems Analysis, Inc., Tiburon, CA.
Osborn, R. G., K. F. Higgins, R. E. Usgaard, C. D. Dieter and R. G. Neiger. 2000. Bird
mortality associated with wind turbines at the Buffalo Ridge Wind Resource Area, Minnesota. Am. Midl. Nat. 143:41-52.
Osborn, R.G., K.F. Higgins, C.D. Dieter, and R.E. Usgaard. 1996. Bat collisions with wind
turbines in southwestern Minnesota. Bat Research News 37:105-108. Richardson, W.J. 1974. Spring migration over Puerto Rico and the western Atlantic: a radar
study. Ibis 116:172-193. Richardson, W.J. 1976. Autumn migration over Puerto Rico and the western Atlantic: a radar
study. Ibis 118:309-332. Rolseth, S.L., C.E. Koehler, and R.M.R. Barclay. 1994. Differences in the diets of juvenile and
adult hoary bats, Lasiurus cinereus. Journal of Mammalogy 75:394-398. Saunders, W.E. 1930. Bats in migration. Journal of Mammalogy 11:225. Shump, K.A., Jr. and A.U. Shump. 1982a. Lasiurus cinereus. Mammalian Species 185:1-5. Shump, K.A., Jr. and A.U. Shump. 1982b. Lasiurus borealis. Mammalian Species 183:1-6. Simmons, J.A., M.B. Fenton, and M.J. O’Farrell. 1979. Echolocation and the pursuit of prey by
bats. Science 203:16-21. Simmons, J.A. and R.A. Stein. 1980. Acoustic imaging in bat sonar: echolocation signals and
the evolution of echolocation. Journal of Comparative Physiology 135:61-84.
AVIAN AND BAT BASELINE DATA AND MORTALITY SYNTHESIS WEST, Inc. 59
Speakman, J.R. and P.A. Racey. 1991. No cost of echolocation for bats in flight. Nature 350:421-423.
Suthers, R.A. 1970. Vision, olfaction, and taste. Pages 265-309 in W.A. Wimsatt, ed. Biology of
bats. Vol. 2. Academic Press, New York. 477pp. Suthers, R.A. 1966. Optomotor responses by echolocating bats. Science 152:1102-1104. Taylor, W.K. and B.H. Anderson. 1973. Nocturnal migrants killed at a central Florida TV tower:
autumns 1969-1971. Wilson Bulletin 85:42-51. Tenaza, R.H. 1966. Migration of hoary bats on South Farallon Island, California. Journal of
Mammalogy 47:533-535. Tennessee Valley Authority. 2002. Draft Environmental Assessment - 20-MW Windfarm and
Associated Energy Storage Facility. Tennessee Valley Authority, Knoxville, Tennessee. Terres, J.K. 1956. Migration records of the red bat, Lasiurus borealis. Journal of Mammalogy
37:442. Thelander, C. G. 2000. Bioresource Consultants Inc. Personal communication. Species
composition data from National Renewable Energy Laboratory funded Altamont Studies (1999-2000).
Thelander, C.G. and L. Rugge. 2000. Bird risk behaviors and fatalities at the Altamont Wind
Resource Area. Pp. 5-14 in Proceedings of the National Avian-Wind Power Planning Meeting III. National Wind Coordinating Committee/RESOLVE. Washington, D.C.
Timm, R.M. 1989. Migration and molt patterns of red bats. Illinois Bull. Chicago Academy of
Science. URS Corporation, WEST, Inc. and Northwest Wildlife Consultants. 2001. Final Report:
Ecological Baseline Study for the Condon Wind Project. URS Corporation and WEST Inc. 2001. Avian baseline study for the Stateline Project,
Vansycle Ridge, Oregon and Washington. Technical report prepared for ESI Vansycle Partners, L.P.
U.S. Department of Energy. 2002. Draft Site-Wide Environmental Assessment of National
Renewable Energy Laboratory's National Wind Technology Center. U.S. Department of Energy, Golden, Colorado.
Van Gelder, R.G. 1956. Echo-location failure in migratory bats. Transactions of the Kansas
Academy of Science 59:220-222. Walla Walla County Regional Planning Department. 2000. Final Environmental Impact
AVIAN AND BAT BASELINE DATA AND MORTALITY SYNTHESIS WEST, Inc. 60
Statement on FPL Energy’s Proposal for the Stateline Wind Project. WEST, Inc. and Northwest Wildlife Consultants, Inc. 2002a. Technical report on progress of
the Stateline Wind plant. July-December 31, 2001. Technical report prepared by Western EcoSystems Technology, Inc., Cheyenne, Wyoming and Northwest Wildlife Consultants Inc., Pendleton, OR.
WEST, Inc. and Northwest Wildlife Consultants, Inc. 2002b. In preparation. Ecological
baseline study for the Zintel Canyon Wind Project. Technical report prepared for Energy Northwest.
WEST, Inc. and Northwest Wildlife Consultants, Inc. 2001a. Interim Report, Avian Baseline
Study for the Maiden Wind Power Project, Yakima and Benton Counties, Washington. April-October 2001. Technical report prepared by Western EcoSystems Technology, Inc., Cheyenne, Wyoming.
WEST, Inc. and Northwest Wildlife Consultants, Inc. 2001b. Baseline ecological studies for the
proposed Klondike wind project, Sherman County, Oregon. WEST, Inc. and Northwest Wildlife Consultants, Inc. 2001c. Wildlife baseline study for the
Nine Canyon Wind Project. Technical report prepared for Energy Northwest. Williams, T.C. and J.M. Williams. 1970. Radio tracking of homing and feeding flights of a
neotropical bat. Animal Behavior 18:302-309. Wilson, N. 1965. Red bats attracted to insect light traps. Journal of Mammalogy 46:704-705. Wisely, A.N. 1978. Bat dies on barbed wire fence. Blue Jay 36:53. Young, D.P. Jr., Johnson, G. D., W. P. Erickson, M. D. Strickland, R. E. Good and P. Becker.
2001. Avian and bat mortality associated with the initial phase of the Foote Creek Rim Wind Power Project, Carbon County, Wyoming: November 3, 1998 - October 31, 2000. Tech. Report prepared by WEST, Inc. for SeaWest Energy Corporation and Bureau of Land Management. 32pp.
Young, D.P. Jr., W.P. Erickson, M.D. Strickland, and R.E. Good. 2002 in review. Comparison
of avian effects from UV light reflective paint applied to wind turbines. Foote Creek Rim Wind Plant, Carbon County, Wyoming.
Young, D. 2002. Personal communication regarding raptor nesting near Foote Creek Rim in
2001. Zinn, T.L. and W.W. Baker. 1979. Seasonal migration of the hoary bat, Lasiurus cinereus,
through Florida. J. Mamm. 60:634-635.

AVIAN AND BAT BASELINE DATA AND MORTALITY SYNTHESIS WEST, Inc. 61
Table 1. List of studies/study areas and data components used in this report for sites categorized as within agricultural landscapes.
Primary
WRA/Study Area State Habitat1 Data2 References
Buffalo Ridge Phase I MN AG, GR AU, MO, RN, BU
Johnson et al. (2000a), Johnson et al. (2002)
Buffalo Ridge Phase II MN AG, GR AU, MO, BU Same as above
Buffalo Ridge Phase III MN AG, GR AU, MO, BU Same as above
Buffalo Ridge Reference SD AG, GR AU, MO, BU Same as above
Nine Canyon WA AG, GR AU, RN WEST and Northwest Wildlife Consultants (2001c)
Zintel Canyon WA AG, GR AU, RN, MO WEST and Northwest Wildlife Consultants (2002b)
Klondike OR AG, GR AU, RN, MO WEST and Northwest Wildlife Consultants (2001b)
Condon OR AG, GR AU, RN, BU URS Corporation et al. (2001)
Stateline/Vansycle OR/WA AG, GR AU, MO, RN, BU
URS Corporation and WEST (2001)
Stateline/Vansycle Reference OR AG,GR AU Same as above
MG&E & WPSC WI AG, GR MO Howe (2001, pers. comm.)
Algona IA AG MO Demastes and Trainer (2000)
1 AG=cultivated agriculture, GR=native and/or CRP grasslands, SS=shrub steppe, DS=desert scrub, UN=unknown at this time
2 list of data types used in this report. AU=diurnal avian use surveys, RN=aerial raptor nest surveys, BU=bat use surveys,
MO=mortality surveys

AVIAN AND BAT BASELINE DATA AND MORTALITY SYNTHESIS WEST, Inc. 62
Table 2. List of studies/study areas and data components used in this report for sites categorized as within predominantly native landscapes.
Primary Primary
WRA/Study Area State Habitat1 Data2 Reference
Cares WA GR AU Erickson et al. (1999)
Columbia Hills WA GR AU, RN Jones and Stokes (1995)
Ponnequin CO GR MO, RN Kerlinger et al. (1999)
Kerlinger pers. comm. (2000)
Maiden WA SS AU, RN WEST and Northwest Wildlife Consultants (2001a)
Foote Creek Rim WY GR, SS AU, RN, MO, BU Johnson et al. (2000a)
Young et al. (2001) Simpson Ridge WY SS AU Johnson et al. (2000a)
Morton Pass Reference WY SS, GR AU Johnson et al. (2000a)
Tehachapi Pass CA SS AU, MO Anderson et al. (2000)
San Gorgonio CA DS, SS AU, MO Anderson et al. (2000)
Altamont Pass CA GR AU, MO Orloff and Flannery (1992)
Orloff and Flannery (1996)
Somerset County PA UN MO Kerlinger pers. comm. (2000)
Searsburg VT UN MO Kerlinger (1997)
Montezuma Hills CA GR, AG AU, MO Howell (1997)
Howell and Noone (1992) Buffalo Mountain TN FO MO Nicholson (2001) 1 AG=cultivated agriculture, GR=native and/or CRP grasslands, SS=shrub steppe, DS=desert scrub, UN=unknown at this time
2 list of data types used in this report. AU=diurnal avian use surveys, RN=aerial raptor nest surveys, BU=bat use surveys,
MO=mortality surveys

AVIAN AND BAT BASELINE DATA AND MORTALITY SYNTHESIS WEST, Inc. 63
Table 3. Description of raptor nest survey methods for relevant study areas.
WRA/Study Area # aerial surveys1 # ground surveys2
Foote Creek Rim 1 at least 1
Condon 1 0
Nine Canyon 2 0
Zintel Canyon 2 0
Columbia Hills ? 0
Maiden 2 0
Stateline 2 0
Klondike 2 0
Buffalo Ridge 0 at least 1
Ponnequin 1 0
1 # of annual aerial surveys conducted (max number in any one year) 2 typical # ground visits

AVIAN AND BAT BASELINE DATA AND MORTALITY SYNTHESIS WEST, Inc. 64
Table 4. Description of study areas of avian mortality used for species composition or fatality estimates. WRA/Study Area
Turbine Types
Dates of Study
# of Turbines In WRA
# of Turbines Searched
Search Interval
Total # Observed Fatalities1
# of Raptor
Fatalities
Reference
Buffalo Ridge, MN Phase I
Kenetech Model 33-MVS
4/94-12/95
73 50 7 days 12 0 Osborn et al. (2000)
Buffalo Ridge, MN Phase I
Kenetech Model 33-MVS
3/96-11/99
73 21 14 days 13 1 Johnson et al. (2000b)
Buffalo Ridge, MN Phase II
Zond Z-750
3/98-11/99
143 40 14 days 22 0 Same as above
Buffalo Ridge, MN Phase III
Zond Z-750
3/99-11/99
138 30 14 days 20 0 Same as above
Foote Creek Rim, WY Phase I
Mitsubishi 600 kW tubular
11/98-12/00
69 69 28 days 95
5 Young et al. (2001)
Foote Creek Rim, WY Phase II&III
3 Mitsubishi 600 kW, 33 NEG 750
7/99-12/00
36 36 28 days 13 2 Young et al. (2002, in review)
Green Mountain Searsburg, VT
Zond Z-40 6/97-10/97
11 11 Weekly-monthly
0 0 Kerlinger (1997)
IDWGP Algona, IA
Zond Z-50 10/99-7/00
3 3 14 days 0 0 Demastes and Trainer (2000)
Ponnequin, CO
NEG/MICON750 kW
11/98-11/00
29 29 3 days-1.5 mo.
9
0 Kerlinger et al. (2000)
Somerset County, PA
6/00 -1/00
8 8 Weekly-monthly
0 0 Kerlinger (2000, pers. comm...)
Vansycle Ridge, OR
660 kW Vestes 1/99-12/99
38 38 28 days 12
0 Erickson et al. (2000b).
Stateline, OR/WA
660 kW Vestes 7/01-present
399 125 14-28 days 20 0 WEST and Northwest Wildlife Consultants (2002)
Klondike, OR 1.5 MW 01/02-present
16 16 28 days 1 0 Johnson (2002, pers. comm.)
Buffalo Mtn., TN
~660 kW 10/00-9/01
3 3 2/week-weekly
12 0 Nicholson (2001)
Wisconsin Vestes 660 kW Spring 98-12/00
31 31 Daily- weekly
21 0 Howe pers. comm. (2001)
1types of fatalities often varied by study. For example, in some studies, feather spots were included or electrocutions were included. In other studies only fresh carcasses that were likely turbine kills were included. Sometimes incidental discoveries were included, other times they were not.

AVIAN AND BAT BASELINE DATA AND MORTALITY SYNTHESIS WEST, Inc. 65
Table 4 (cont.). Description of studies of avian mortality used for species composition or fatality estimates.
WRA/Study Area
Turbine Types
Dates of Study
# of Turbines Searched
Search Interval
Total # Observed Fatalities1
# of Raptor
Fatalities
Reference
Altamont Pass, CA and Tehachapi
<250 kW turbines
1984-1988
Incidental discoveries
Incidental discoveries
Raptor reports
63 (Alt) 9 (Teh)
California Energy Commission (1989)
Altamont Pass, CA <250 kW turbines
9/88-8/89 359 2/week 42
18 Howell and DiDonato (1991)
Altamont Pass, CA <250 kW turbines
4/90-3/91 150 2/week 10 1 Howell et al. (1991b)
Altamont Pass, CA <250 kW turbines
1989-1991
1169 1-2/week 182 74 Orloff and Flannery (1992)
Altamont Pass, CA <250 kW turbines
1/1994 1169 one time search
20 15 Orloff and Flannery (1996)
Altamont Pass, CA KVS –33 & 56-100
12/93-8/95
165 2/week 72
44 Howell (1997)
Altamont Pass, CA Mostly <250 kW turbines
4/98-3/00 785 1/5 weeks 256
117 Thelander pers. comm. (2000)
Montezuma Hills, CA
<250 kW turbines
4/90-5/92 237 Weekly 22 14 Howell and Noone (1992)
Montezuma Hills, CA
KVS –33 & 56-100
11/94-9/95
76 2/Week 13 10 Howell (1997)
San Gorgonio, CA <250 kW turbines
1985 Not available
not available
38 1 McCrary et al. (1986)
San Gorgonio, CA Mostly <250 kW turbines
3/97-5/98 ~360 Quarterly 42 7 Anderson (2000a, pers. comm.)
Tehachapi Pass, CA
mostly < 250 kW turbines
5/95-5/98 640-760 Quarterly 147 46 Anderson (2000b, pers. comm.)
1 types of fatalities often varied by study. For example, in some studies, feather spots were included or electrocutions were included. In other studies only fresh carcasses that were likely turbine kills were included. Sometimes incidental discoveries were included, other times they were not.
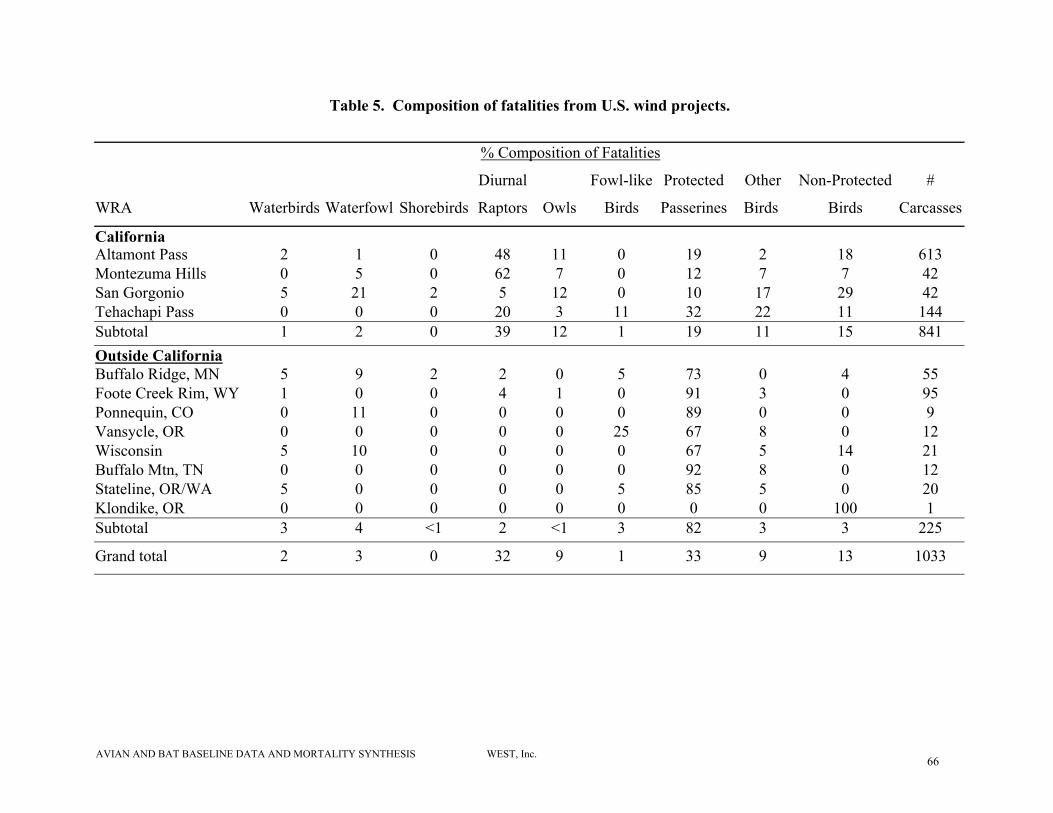
AVIAN AND BAT BASELINE DATA AND MORTALITY SYNTHESIS WEST, Inc. 66
Table 5. Composition of fatalities from U.S. wind projects.
% Composition of Fatalities
Diurnal Fowl-like Protected Other Non-Protected #
WRA Waterbirds Waterfowl Shorebirds Raptors Owls Birds Passerines Birds Birds Carcasses
California Altamont Pass 2 1 0 48 11 0 19 2 18 613 Montezuma Hills 0 5 0 62 7 0 12 7 7 42 San Gorgonio 5 21 2 5 12 0 10 17 29 42 Tehachapi Pass 0 0 0 20 3 11 32 22 11 144 Subtotal 1 2 0 39 12 1 19 11 15 841 Outside California Buffalo Ridge, MN 5 9 2 2 0 5 73 0 4 55 Foote Creek Rim, WY 1 0 0 4 1 0 91 3 0 95 Ponnequin, CO 0 11 0 0 0 0 89 0 0 9 Vansycle, OR 0 0 0 0 0 25 67 8 0 12 Wisconsin 5 10 0 0 0 0 67 5 14 21 Buffalo Mtn, TN 0 0 0 0 0 0 92 8 0 12 Stateline, OR/WA 5 0 0 0 0 5 85 5 0 20 Klondike, OR 0 0 0 0 0 0 0 0 100 1 Subtotal 3 4 <1 2 <1 3 82 3 3 225
Grand total 2 3 0 32 9 1 33 9 13 1033

AVIAN AND BAT BASELINE DATA AND MORTALITY SYNTHESIS WEST, Inc. 67
Table 6. Estimates of avian collision mortality by wind resource areas
# raptor fatalities
Wind Resource Area
Turbines in
WRA
end of 2001
Turbines in
WRA
during study
# bird fatalities/
turbine/year /turbine/year
Outside California
Buffalo Ridge, MN ~450 ~400 2.834 0.002
Foote Creek Rim, WY 133 69 1.750 0.036
Green Mountain, Searsburg, VT 11 11 0.000 0.000
IDWGP, Algona, IA 3 3 0.000 0.000
Ponnequin, CO 44 29 naa 0.000
Somerset County, PA 8 8 0.000 0.000
Vansycle/Stateline,OR/WA 437 38 0.630 0.000
Wisconsin (MG&E and PSC) 31 31 naa 0.000
Subtotal 1,117 589 1.825 0.006
California
Altamont Pass, CA ~5,400 ~7,340 naa 0.048
Montezuma Hills,CA 600 600 naa 0.048
San Gorgonio, CA ~2,900 2,900 2.307 0.010
Grand Total 10,017 11,429 2.19 0.033
a not applicable (not calculated or not appropriate).

AVIAN AND BAT BASELINE DATA AND MORTALITY SYNTHESIS WEST, Inc. 68
Table 7. Mean raptor/vultures use estimates (estimated #/20-min survey) by study areas.
Mean Use (#/20-minute survey)1 Ranks Wind Resource Area Study Area Spr Sum Fall Win Avg2 13 24 35 46
Agricultural Landscapes Buffalo Ridge Phase I 0.646 0.431 0.761 0.133 0.424 8 9 10 12 Buffalo Ridge Phase II 0.841 0.694 0.827 0.100 0.523 4 3 7 7 Buffalo Ridge Phase III 0.638 0.537 0.845 0.181 0.484 9 8 8 9 Buffalo Ridge Reference 0.681 0.524 0.690 0.444 0.555 7 7 6 6 Condon Condon 0.528 0.325 0.293 0.453 0.400 11 14 15 15 Klondike Klondike 0.468 0.389 0.386 0.566 0.468 14 12 12 10 Nine Canyon Nine Canyon 0.354 0.199 0.156 0.312 0.258 17 18 19 19 Stateline/Vansycle Reference 1.104 0.401 0.336 0.662 0.602 2 5 3 4 Stateline/Vansycle Stateline/Vansycle 0.524 0.333 0.260 0.494 0.410 12 13 16 14 Zintel Canyon Zintel Canyon 0.194 0.299 0.700 0.507 0.443 20 19 11 11 Average 0.598 0.413 0.525 0.385 0.457 10.4 10.8 10.7 10.7 Native Landscapes Altamont Pass Altamont Pass 2.125 2.375 3.375 2.063 2.424 1 1 1 1 Cares Cares 0.577 0.632 0.813 0.263 0.522 10 6 9 8 Columbia Hills Columbia Hills 0.935 1.335 0.775 0.263 0.750 3 2 4 2 Foote Creek Rim Foote Creek Rim 0.735 0.702 0.839 0.239 0.562 6 4 5 5 Foote Creek Rim Foote Creek Rim UV 0.464 0.518 0.608 0.224 0.417 15 10 13 13 Foote Creek Rim Morton's Pass Reference 0.480 0.329 0.287 0.153 0.279 13 15 17 18 Foote Creek Rim Simpson's Ridge 0.373 0.280 0.261 0.123 0.233 16 17 20 20 Maiden Maiden 0.280 0.398 0.617 0.288 0.382 18 16 14 16 San Gorgonio Pass Phase I High Elevation 0.000 0.103 0.133 0.162 0.114 26 24 23 23 San Gorgonio Pass Phase I Low Elevation 0.024 0.024 0.030 0.232 0.103 25 25 25 24 San Gorgonio Pass Phase I Medium Elevation 0.119 0.175 0.050 0.143 0.128 22 20 24 22 San Gorgonio Pass Phase I Water Area 0.231 0.024 0.132 0.150 0.128 19 22 21 21 San Gorgonio Pass Phase II Low Elevation 0.000 0.011 0.052 0.006 0.016 26 27 27 27 San Gorgonio Pass Phase II Water Area 0.167 0.000 0.084 0.130 0.094 21 23 22 25 Tehachapi Pass East Slope 0.031 0.013 0.075 0.096 0.060 24 26 26 26 Tehachapi Pass Middle Ridge 0.084 0.160 0.203 0.545 0.301 23 21 18 17 Tehachapi Pass West Ridge 0.756 0.218 2.080 0.297 0.725 5 11 2 3 Average 0.434 0.429 0.613 0.316 0.426 16.1 15.9 15.9 15.9 1 some biases may exist in comparisons of study areas due to differences in quality of viewsheds out to 800 m and durations of surveys 2 overall four season average weighted by the length of each season 3 rank (lower number indicates higher use estimate) of study area using spring data 4 rank (lower number indicates higher use estimate) of study area using spring and summer data 5 rank (lower number indicates higher use estimate) of study area using spring, summer and fall data 6 rank (lower number indicates higher use estimate) of study area using all four seasons of data

AVIAN AND BAT BASELINE DATA AND MORTALITY SYNTHESIS WEST, Inc. 69
Table 8. Pearson correlations among all raptor/vulture seasonal use estimates.
Correlation of Study Area Ranks Correlation of Seasonal Use Estimates
Spr Spr-Sum Spr-Fall Overall Spr Sum Fall Win Overall
Spr 1.00 Spr 1.00 Spr-Sum 0.95 1.00 Sum 0.89 1.00 Spr-Fall 0.92 0.92 1.00 Fall 0.83 0.81 1.00
Win 0.75 0.76 0.73 1.00 Overall 0.91 0.93 0.99 1.00 Overall 0.93 0.93 0.92 0.90 1.00

AVIAN AND BAT BASELINE DATA AND MORTALITY SYNTHESIS WEST, Inc. 70
Table 9. Mean buteo use estimates (estimated #/20-min survey) for several study areas.
Mean Use (#/20-minute survey)1 Ranks
Wind Resource Area Study Area Spr Sum Fall Win Avg2 13 24 35 46
Agricultural Landscapes Buffalo Ridge Phase I 0.381 0.289 0.622 0.133 0.316 3 6 3 4 Buffalo Ridge Phase II 0.372 0.341 0.561 0.033 0.277 4 3 4 6 Buffalo Ridge Phase III 0.313 0.264 0.519 0.118 0.271 6 8 5 7 Buffalo Ridge Reference 0.287 0.396 0.414 0.264 0.332 7 4 6 3 Condon Condon 0.139 0.079 0.108 0.211 0.144 15 19 15 16 Klondike Klondike 0.230 0.232 0.200 0.401 0.288 11 11 7 5 Nine Canyon Nine Canyon 0.083 0.071 0.037 0.191 0.111 20 20 18 18 Stateline/Vansycle Reference 0.805 0.268 0.227 0.531 0.447 1 1 2 2 Stateline/Vansycle Stateline/Vansycle 0.253 0.179 0.136 0.287 0.223 8 13 9 9 Zintel Canyon Zintel Canyon 0.083 0.139 0.233 0.285 0.204 19 18 11 11 Average 0.295 0.226 0.306 0.245 0.261 9.4 10.3 8.0 8.1 Native Landscapes Altamont Pass Altamont Pass 0.636 0.375 0.876 0.699 0.644 2 2 1 1 Cares Cares 0.247 0.225 0.258 0.103 0.190 10 10 12 12 Columbia Hills Columbia Hills 0.370 0.327 0.319 0.103 0.248 5 5 8 8 Foote Creek Rim Foote Creek Rim 0.253 0.336 0.336 0.039 0.211 9 7 10 10 Foote Creek Rim Foote Creek Rim UV 0.165 0.263 0.237 0.032 0.155 13 12 16 15 Foote Creek Rim Morton's Pass Reference 0.152 0.135 0.064 0.024 0.081 14 16 19 20 Foote Creek Rim Simpson's Ridge 0.123 0.115 0.060 0.012 0.066 17 17 22 22 Maiden Maiden 0.212 0.274 0.204 0.081 0.177 12 9 14 14 San Gorgonio Pass Phase I High Elevation 0.000 0.056 0.058 0.143 0.079 24 22 21 21 San Gorgonio Pass Phase I Low Elevation 0.017 0.000 0.000 0.040 0.018 23 25 25 24 San Gorgonio Pass Phase I Medium Elevation 0.095 0.175 0.000 0.143 0.113 18 15 20 17 San Gorgonio Pass Phase I Water Area 0.000 0.000 0.000 0.010 0.004 24 26 26 26 San Gorgonio Pass Phase II Low Elevation 0.000 0.000 0.000 0.000 0.000 24 26 27 27 San Gorgonio Pass Phase II Water Area 0.056 0.000 0.000 0.011 0.014 21 23 24 25 Tehachapi Pass East Slope 0.000 0.013 0.046 0.052 0.032 24 24 23 23 Tehachapi Pass Middle Ridge 0.047 0.063 0.141 0.136 0.104 22 21 17 19 Tehachapi Pass West Ridge 0.137 0.157 0.240 0.193 0.184 16 14 13 13 Average 0.148 0.148 0.167 0.107 0.137 16.4 16.1 17.5 17.5 1 some biases may exist in comparisons of study areas due to differences in quality of viewsheds out to 800 m and durations of surveys 2 overall four season average weighted by the length of each season 3 rank (lower number indicates higher use estimate) of study area using spring data 4 rank (lower number indicates higher use estimate) of study area using spring and summer data 5 rank (lower number indicates higher use estimate) of study area using spring, summer and fall data 6 rank (lower number indicates higher use estimate) of study area using all four seasons of data

AVIAN AND BAT BASELINE DATA AND MORTALITY SYNTHESIS WEST, Inc. 71
Table 10. Pearson correlations among buteo seasonal use estimates.
Correlation of Study Area Ranks Correlation of Seasonal Use Estimates
Spr Spr-Sum Spr-Fall Overall Spr Sum Fall Win Overall Spr 1.00 Spr 1.00 Spr-Sum 0.96 1.00 Sum 0.77 1.00 Spr-Fall 0.92 0.92 1.00 Fall 0.72 0.81 1.00
Win 0.67 0.41 0.48 1.00 Overall 0.91 0.92 0.99 1.00 Overall 0.90 0.82 0.86 0.82 1.00

AVIAN AND BAT BASELINE DATA AND MORTALITY SYNTHESIS WEST, Inc. 72
Table 11. Mean golden eagle use estimates (estimated #/20-min survey) for several study areas.
Mean Use (#/20-minute survey)1 Ranks
Wind Resource Area Study Area Spr Sum Fall Win Avg2 13 24 35 46
Agricultural Landscapes Buffalo Ridge Phase I 0.007 0.000 0.008 0.000 0.003 14 18 19 20 Buffalo Ridge Phase II 0.015 0.000 0.002 0.017 0.009 13 16 14 15 Buffalo Ridge Phase III 0.040 0.000 0.000 0.014 0.012 9 10 12 12 Buffalo Ridge Reference 0.030 0.000 0.000 0.028 0.015 10 11 11 11 Condon Condon 0.000 0.012 0.043 0.020 0.020 15 15 10 10 Klondike Klondike 0.000 0.008 0.000 0.000 0.002 15 17 20 21 Nine Canyon Nine Canyon 0.000 0.000 0.015 0.000 0.003 15 19 18 19 Stateline/Vansycle Reference 0.029 0.000 0.010 0.010 0.011 11 12 13 14 Stateline/Vansycle Stateline/Vansycle 0.000 0.000 0.006 0.019 0.008 15 19 16 16 Zintel Canyon Zintel Canyon 0.000 0.000 0.000 0.000 0.000 15 19 20 22 Average 0.012 0.002 0.008 0.011 0.008 13.2 15.6 15.3 16.0 Native Landscapes Altamont Pass Altamont Pass 0.438 0.063 0.500 0.375 0.333 1 2 1 1 Cares Cares 0.128 0.031 0.035 0.101 0.075 5 7 6 7 Columbia Hills Columbia Hills 0.040 0.142 0.050 0.101 0.091 8 4 7 5 Foote Creek Rim Foote Creek Rim 0.301 0.194 0.311 0.187 0.234 2 1 2 2 Foote Creek Rim Foote Creek Rim UV 0.214 0.122 0.287 0.189 0.197 3 3 3 3 Foote Creek Rim Morton's Pass Reference 0.141 0.073 0.121 0.123 0.113 4 5 4 4 Foote Creek Rim Simpson's Ridge 0.122 0.036 0.067 0.104 0.082 6 6 5 6 Maiden Maiden 0.000 0.000 0.000 0.031 0.012 15 19 15 13 San Gorgonio Pass Phase I High Elevation 0.000 0.048 0.075 0.000 0.028 15 8 9 9 San Gorgonio Pass Phase I Low Elevation 0.000 0.000 0.000 0.000 0.000 15 19 20 22 San Gorgonio Pass Phase I Medium Elevation 0.024 0.000 0.000 0.000 0.004 12 14 17 18 San Gorgonio Pass Phase I Water Area 0.042 0.000 0.000 0.067 0.032 7 9 8 8 San Gorgonio Pass Phase II Low Elevation 0.000 0.000 0.000 0.000 0.000 15 19 20 22 San Gorgonio Pass Phase II Water Area 0.000 0.000 0.000 0.000 0.000 15 19 20 22 Tehachapi Pass East Slope 0.000 0.000 0.000 0.000 0.000 15 19 20 22 Tehachapi Pass Middle Ridge 0.000 0.000 0.000 0.000 0.000 15 19 20 22 Tehachapi Pass West Ridge 0.000 0.018 0.000 0.000 0.004 15 13 20 17 Average 0.085 0.043 0.085 0.075 0.071 9.9 10.9 11.6 11.9 1 some biases may exist in comparisons of study areas due to differences in quality of viewsheds out to 800 m and durations of surveys 2 overall four season average weighted by the length of each season 3 rank (lower number indicates higher use estimate) of study area using spring data 4 rank (lower number indicates higher use estimate) of study area using spring and summer data 5 rank (lower number indicates higher use estimate) of study area using spring, summer and fall data 6 rank (lower number indicates higher use estimate) of study area using all four seasons of data

AVIAN AND BAT BASELINE DATA AND MORTALITY SYNTHESIS WEST, Inc. 73
Table 12. Pearson correlations among golden eagle seasonal use estimates.
Correlation of Study Area Ranks Correlation of Seasonal Use Estimates
Spr Spr-Sum Spr-Fall Overall Spr Sum Fall Win Overall Spr 1.00 Spr 1.00 Spr-Sum 0.91 1.00 Sum 0.66 1.00 Spr-Fall 0.90 0.93 1.00 Fall 0.96 0.69 1.00
Winter 0.97 0.66 0.94 1.00 Overall 0.87 0.93 0.99 1.00 Overall 0.98 0.76 0.98 0.98 1.00

AVIAN AND BAT BASELINE DATA AND MORTALITY SYNTHESIS WEST, Inc. 74
Table 13. Mean large falcon use estimates (estimated #/20-min survey) for several study areas. Mean Use (#/20-minute survey)1 Ranks
Wind Resource Area Study Area Spr Sum Fall Win Avg2 13 24 35 46
Agricultural Landscapes Buffalo Ridge Phase I 0.000 0.000 0.000 0.000 0.000 9 14 19 22 Buffalo Ridge Phase II 0.000 0.000 0.000 0.000 0.000 9 14 19 22 Buffalo Ridge Phase III 0.000 0.000 0.012 0.000 0.002 9 14 16 19 Buffalo Ridge Reference Area 0.000 0.000 0.000 0.028 0.010 9 14 19 12 Condon Condon 0.000 0.000 0.014 0.000 0.003 9 14 14 17 Klondike Klondike 0.000 0.008 0.000 0.018 0.009 9 13 18 14 Nine Canyon Nine Canyon 0.021 0.000 0.000 0.000 0.003 7 10 13 16 Stateline/Vansycle Reference Area 0.000 0.000 0.000 0.002 0.001 9 14 19 21 Stateline/Vansycle Stateline/Vansycle 0.000 0.000 0.000 0.005 0.002 9 14 19 20 Zintel Canyon Zintel Canyon 0.000 0.000 0.022 0.021 0.012 9 14 11 10 Average 0.002 0.001 0.005 0.007 0.004 8.8 13.5 16.7 17.3 Native Landscapes Altamont Altamont 0.000 0.020 0.021 0.010 0.013 9 8 9 8 Cares Cares 0.024 0.014 0.004 0.010 0.012 5 6 10 11 Columbia Hills Average 0.030 0.037 0.020 0.010 0.022 3 3 4 6 Foote Creek Rim Foote Creek Rim 0.034 0.029 0.037 0.010 0.024 1 4 3 4 Foote Creek Rim Foote Creek Rim UV 0.024 0.044 0.034 0.001 0.023 4 2 2 5 Foote Creek Rim Morton's Pass Reference 0.030 0.061 0.052 0.003 0.032 2 1 1 1 Foote Creek Rim Simpson's Ridge 0.009 0.016 0.031 0.002 0.013 8 7 7 9 Maiden Maiden 0.000 0.010 0.038 0.050 0.029 9 11 8 3 San Gorgonio Pass Phase I High Elevation 0.000 0.000 0.000 0.000 0.000 9 14 19 22 San Gorgonio Pass Phase I Low Elevation 0.000 0.014 0.000 0.016 0.010 9 9 12 13 San Gorgonio Pass Phase I Medium Elevation 0.000 0.000 0.000 0.000 0.000 9 14 19 22 San Gorgonio Pass Phase I Water Area 0.021 0.024 0.032 0.000 0.016 6 5 5 7 San Gorgonio Pass Phase II Low Elevation 0.000 0.000 0.010 0.006 0.004 9 14 17 15 San Gorgonio Pass Phase II Water Area 0.000 0.000 0.065 0.042 0.029 9 14 6 2 Tehachapi Pass East Slope 0.000 0.000 0.000 0.000 0.000 9 14 19 22 Tehachapi Pass Middle Ridge 0.000 0.000 0.000 0.000 0.000 9 14 19 22 Tehachapi Pass West Ridge 0.000 0.010 0.000 0.000 0.003 9 12 15 18 Average 0.010 0.016 0.020 0.009 0.014 7.0 8.9 10.3 11.2

AVIAN AND BAT BASELINE DATA AND MORTALITY SYNTHESIS WEST, Inc. 75
Table 14. Pearson correlations among large falcon seasonal use estimates.
Correlation of Study Area Ranks Correlation of Seasonal Use Estimates Spr Spr-Sum Spr-Fall Overall Spr Sum Fall Win Overall
Spr 1.00 Spr 1.00 Spr-Sum 0.88 1.00 Sum 0.79 1.00 Spr-Fall 0.76 0.87 1.00 Fall 0.44 0.57 1.00
Win -0.17 -0.06 0.44 1.00 Overall 0.61 0.72 0.92 1.00 Overall 0.58 0.72 0.89 0.59 1.00
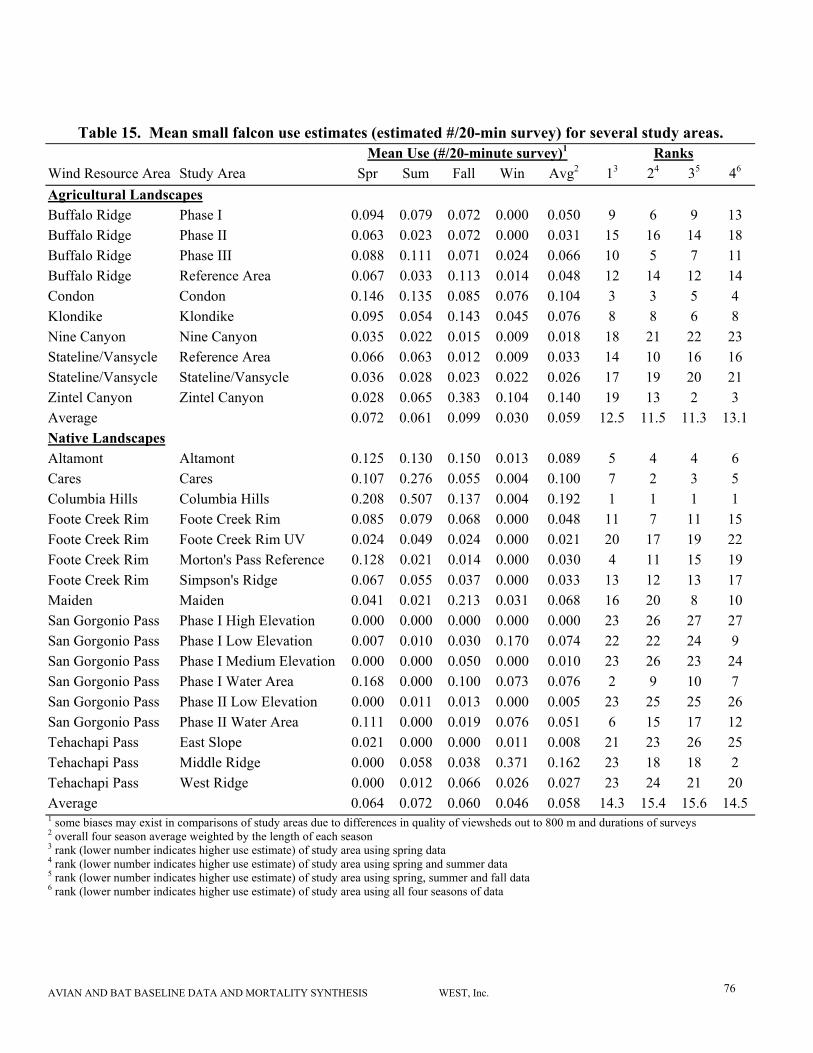
AVIAN AND BAT BASELINE DATA AND MORTALITY SYNTHESIS WEST, Inc. 76
Table 15. Mean small falcon use estimates (estimated #/20-min survey) for several study areas. Mean Use (#/20-minute survey)1 Ranks
Wind Resource Area Study Area Spr Sum Fall Win Avg2 13 24 35 46 Agricultural Landscapes Buffalo Ridge Phase I 0.094 0.079 0.072 0.000 0.050 9 6 9 13 Buffalo Ridge Phase II 0.063 0.023 0.072 0.000 0.031 15 16 14 18 Buffalo Ridge Phase III 0.088 0.111 0.071 0.024 0.066 10 5 7 11 Buffalo Ridge Reference Area 0.067 0.033 0.113 0.014 0.048 12 14 12 14 Condon Condon 0.146 0.135 0.085 0.076 0.104 3 3 5 4 Klondike Klondike 0.095 0.054 0.143 0.045 0.076 8 8 6 8 Nine Canyon Nine Canyon 0.035 0.022 0.015 0.009 0.018 18 21 22 23 Stateline/Vansycle Reference Area 0.066 0.063 0.012 0.009 0.033 14 10 16 16 Stateline/Vansycle Stateline/Vansycle 0.036 0.028 0.023 0.022 0.026 17 19 20 21 Zintel Canyon Zintel Canyon 0.028 0.065 0.383 0.104 0.140 19 13 2 3 Average 0.072 0.061 0.099 0.030 0.059 12.5 11.5 11.3 13.1 Native Landscapes Altamont Altamont 0.125 0.130 0.150 0.013 0.089 5 4 4 6 Cares Cares 0.107 0.276 0.055 0.004 0.100 7 2 3 5 Columbia Hills Columbia Hills 0.208 0.507 0.137 0.004 0.192 1 1 1 1 Foote Creek Rim Foote Creek Rim 0.085 0.079 0.068 0.000 0.048 11 7 11 15 Foote Creek Rim Foote Creek Rim UV 0.024 0.049 0.024 0.000 0.021 20 17 19 22 Foote Creek Rim Morton's Pass Reference 0.128 0.021 0.014 0.000 0.030 4 11 15 19 Foote Creek Rim Simpson's Ridge 0.067 0.055 0.037 0.000 0.033 13 12 13 17 Maiden Maiden 0.041 0.021 0.213 0.031 0.068 16 20 8 10 San Gorgonio Pass Phase I High Elevation 0.000 0.000 0.000 0.000 0.000 23 26 27 27 San Gorgonio Pass Phase I Low Elevation 0.007 0.010 0.030 0.170 0.074 22 22 24 9 San Gorgonio Pass Phase I Medium Elevation 0.000 0.000 0.050 0.000 0.010 23 26 23 24 San Gorgonio Pass Phase I Water Area 0.168 0.000 0.100 0.073 0.076 2 9 10 7 San Gorgonio Pass Phase II Low Elevation 0.000 0.011 0.013 0.000 0.005 23 25 25 26 San Gorgonio Pass Phase II Water Area 0.111 0.000 0.019 0.076 0.051 6 15 17 12 Tehachapi Pass East Slope 0.021 0.000 0.000 0.011 0.008 21 23 26 25 Tehachapi Pass Middle Ridge 0.000 0.058 0.038 0.371 0.162 23 18 18 2 Tehachapi Pass West Ridge 0.000 0.012 0.066 0.026 0.027 23 24 21 20 Average 0.064 0.072 0.060 0.046 0.058 14.3 15.4 15.6 14.5 1 some biases may exist in comparisons of study areas due to differences in quality of viewsheds out to 800 m and durations of surveys 2 overall four season average weighted by the length of each season 3 rank (lower number indicates higher use estimate) of study area using spring data 4 rank (lower number indicates higher use estimate) of study area using spring and summer data 5 rank (lower number indicates higher use estimate) of study area using spring, summer and fall data 6 rank (lower number indicates higher use estimate) of study area using all four seasons of data

AVIAN AND BAT BASELINE DATA AND MORTALITY SYNTHESIS WEST, Inc. 77
Table 16. Pearson correlations among small falcon seasonal use estimates.
Correlation of Study Area Ranks Correlation of Seasonal Use Estimates Spr Spr-Sum Spr-Fall Overall Spr Sum Fall Win Overall
Spr 1.00 Spr 1.00 Spr-Sum 0.87 1.00 Sum 0.62 1.00 Spr-Fall 0.74 0.87 1.00 Fall 0.18 0.22 1.00
Win -0.20 -0.10 0.10 1.00 Overall 0.56 0.70 0.80 1.00 Overall 0.48 0.69 0.56 0.54 1.00

AVIAN AND BAT BASELINE DATA AND MORTALITY SYNTHESIS WEST, Inc. 78
Table 17. Mean northern harrier use estimates (estimated #/20-min survey) for several study areas. Mean Use (#/20-minute survey)1 Ranks
Wind Resource Area Study Area Spr Sum Fall Win Avg2 13 24 35 46
Agricultural Landscapes Buffalo Ridge Phase I 0.130 0.063 0.025 0.000 0.042 9 9 13 13 Buffalo Ridge Phase II 0.282 0.301 0.119 0.042 0.163 1 1 1 1 Buffalo Ridge Phase III 0.188 0.135 0.183 0.010 0.107 6 2 2 4 Buffalo Ridge Reference Area 0.267 0.074 0.101 0.083 0.116 2 3 3 2 Condon Condon 0.229 0.030 0.033 0.114 0.095 3 7 10 6 Klondike Klondike 0.143 0.087 0.043 0.103 0.093 8 8 8 7 Nine Canyon Nine Canyon 0.215 0.069 0.089 0.102 0.110 4 4 4 3 Stateline/Vansycle Reference Area 0.174 0.069 0.071 0.051 0.080 7 6 7 10 Stateline/Vansycle Stateline/Vansycle 0.189 0.076 0.083 0.084 0.099 5 5 6 5 Zintel Canyon Zintel Canyon 0.056 0.084 0.061 0.097 0.080 11 10 12 11 Average 0.187 0.099 0.081 0.069 0.099 5.6 5.5 6.6 6.2 Native Landscapes Altamont Pass Altamont Pass 0.031 0.001 0.040 0.001 0.014 12 17 16 16 Cares Cares 0.030 0.064 0.228 0.042 0.084 13 13 5 9 Columbia Hills Average 0.069 0.072 0.083 0.042 0.062 10 11 11 12 Foote Creek Rim Foote Creek Rim 0.022 0.024 0.037 0.001 0.018 16 15 15 15 Foote Creek Rim Foote Creek Rim UV 0.007 0.014 0.016 0.000 0.008 18 18 18 18 Foote Creek Rim Morton's Pass Reference 0.012 0.018 0.032 0.000 0.013 17 16 17 17 Foote Creek Rim Simpson's Ridge 0.029 0.052 0.036 0.001 0.025 14 14 14 14 Maiden Maiden 0.028 0.092 0.125 0.094 0.089 15 12 9 8 San Gorgonio Pass Phase I High Elevation 0.000 0.000 0.000 0.000 0.000 19 19 20 21 San Gorgonio Pass Phase I Low Elevation 0.000 0.000 0.000 0.005 0.002 19 19 20 20 San Gorgonio Pass Phase I Medium Elevation 0.000 0.000 0.000 0.000 0.000 19 19 20 21 San Gorgonio Pass Phase I Water Area 0.000 0.000 0.000 0.000 0.000 19 19 20 21 San Gorgonio Pass Phase II Low Elevation 0.000 0.000 0.000 0.000 0.000 19 19 20 21 San Gorgonio Pass Phase II Water Area 0.000 0.000 0.000 0.000 0.000 19 19 20 21 Tehachapi Pass East Slope 0.000 0.000 0.000 0.000 0.000 19 19 20 21 Tehachapi Pass Middle Ridge 0.000 0.000 0.010 0.005 0.004 19 19 19 19 Tehachapi Pass West Ridge 0.000 0.000 0.000 0.000 0.000 19 19 20 21 Average 0.013 0.020 0.036 0.011 0.019 16.8 16.9 16.7 17.4 1 some biases may exist in comparisons of study areas due to differences in quality of viewsheds out to 800 m and durations of surveys 2 overall four season average weighted by the length of each season 3 rank (lower number indicates higher use estimate) of study area using spring data 4 rank (lower number indicates higher use estimate) of study area using spring and summer data 5 rank (lower number indicates higher use estimate) of study area using spring, summer and fall data 6 rank (lower number indicates higher use estimate) of study area using all four seasons of data

AVIAN AND BAT BASELINE DATA AND MORTALITY SYNTHESIS WEST, Inc. 79
Table 18. Pearson correlations among northern harrier seasonal use estimates.
Correlation of Study Area Ranks Correlation of Seasonal Use Estimates Spr Spr-Sum Spr-Fall Overall Spr Sum Fall Win Overall
Spr 1.00 Spr 1.00 Spr-Sum 0.96 1.00 Sum 0.71 1.00 Spr-Fall 0.90 0.95 1.00 Fall 0.49 0.64 1.00
Win 0.65 0.42 0.43 1.00 Overall 0.94 0.96 0.98 1.00 Overall 0.88 0.85 0.76 0.77 1.00

AVIAN AND BAT BASELINE DATA AND MORTALITY SYNTHESIS WEST, Inc. 80
Table 19. Mean accipiter use estimates (estimated #/20-min survey) for several study areas. MEAN USE (#/20-minute survey) Ranks
wind resource area subarea SPR SUM FALL WIN OVER 1 2 3 4 Agricultural Landscapes Buffalo Ridge Phase I 0.033 0.000 0.033 0.000 0.013 3 4 4 6 Buffalo Ridge Phase II 0.059 0.000 0.037 0.000 0.018 2 2 3 4 Buffalo Ridge Phase III 0.000 0.000 0.036 0.014 0.013 12 12 8 5 Buffalo Ridge Reference Area 0.007 0.000 0.034 0.028 0.019 8 10 6 3 Condon Condon 0.000 0.000 0.010 0.000 0.002 12 12 13 14 Klondike Klondike 0.000 0.000 0.000 0.000 0.000 12 12 17 18 Nine Canyon Nine Canyon 0.000 0.000 0.000 0.000 0.000 12 12 17 18 Stateline/Vansycle Reference Area 0.000 0.000 0.017 0.011 0.008 12 12 11 10 Stateline/Vansycle Stateline/Vansycle 0.000 0.000 0.013 0.022 0.011 12 12 12 7 Zintel Canyon Zintel Canyon 0.028 0.011 0.000 0.000 0.007 4 3 9 11 Average 0.013 0.001 0.018 0.007 0.009 8.9 9.1 10.0 9.6 Native Landscapes Altamont 0.002 Cares Cares 0.013 0.000 0.180 0.003 0.041 5 6 2 2 Columbia Hills Average 0.068 0.129 0.076 0.003 0.060 1 1 1 1 Foote Creek Rim Foote Creek Rim 0.009 0.004 0.033 0.000 0.009 7 5 5 8 Foote Creek Rim Foote Creek Rim UV 0.005 0.000 0.002 0.000 0.001 9 11 16 17 Foote Creek Rim Morton's Pass Reference 0.005 0.002 0.001 0.000 0.001 10 8 15 16 Foote Creek Rim Simpson's Ridge 0.004 0.002 0.013 0.003 0.005 11 9 10 13 Maiden Maiden 0.000 0.000 0.038 0.000 0.008 12 12 7 9 San Gorgonio Pass Phase I High Elevation 0.000 0.000 0.000 0.000 0.000 12 12 17 18 San Gorgonio Pass Phase I Low Elevation 0.000 0.000 0.000 0.000 0.000 12 12 17 18 San Gorgonio Pass Phase I Medium Elevation 0.000 0.000 0.000 0.000 0.000 12 12 17 18 San Gorgonio Pass Phase I Water Area 0.000 0.000 0.000 0.000 0.000 12 12 17 18 San Gorgonio Pass Phase II Low Elevation 0.000 0.000 0.000 0.000 0.000 12 12 17 18 San Gorgonio Pass Phase II Water Area 0.000 0.000 0.000 0.000 0.000 12 12 17 18 Tehachapi Pass East Slope 0.010 0.000 0.000 0.000 0.002 6 7 14 15 Tehachapi Pass Middle Ridge 0.000 0.000 0.000 0.000 0.000 12 12 17 18 Tehachapi Pass West Ridge 0.000 0.000 0.000 0.017 0.006 12 12 17 12 Average 0.007 0.009 0.021 0.002 0.008 9.8 9.7 12.9 13.7 1 some biases may exist in comparisons of study areas due to differences in quality of viewsheds out to 800 m and durations of surveys 2 overall four season average weighted by the length of each season 3 rank (lower number indicates higher use estimate) of study area using spring data 4 rank (lower number indicates higher use estimate) of study area using spring and summer data 5 rank (lower number indicates higher use estimate) of study area using spring, summer and fall data 6 rank (lower number indicates higher use estimate) of study area using all four seasons of data

AVIAN AND BAT BASELINE DATA AND MORTALITY SYNTHESIS WEST, Inc. 81
Table 20. Pearson correlations among accipiter seasonal use estimates.
Correlation of Study Area Ranks Correlation of Seasonal Use Estimates
Spr Spr-Sum Spr-Fall Overall Spr Sum Fall Win Overall
Spr 1.00 Spr 1.00 Spr-Sum 0.96 1.00 Sum 0.68 1.00 Spr-Fall 0.76 0.75 1.00 Fall 0.38 0.29 1.00
Win -0.14 -0.04 0.09 1.00 Overall 0.65 0.61 0.94 1.00 Overall 0.71 0.76 0.80 0.21 1.00

AVIAN AND BAT BASELINE DATA AND MORTALITY SYNTHESIS WEST, Inc. 82
Table 21. Mean waterfowl/waterbird use estimates (estimated #/20-min survey) for several study areas.
Mean Use (#/20-minute survey)1 Ranks
Wind Resource Area Study Area Spr Sum Fall Win Avg2 13 24 35 46
Agricultural Landscapes Buffalo Ridge Phase I 7.298 0.303 5.839 10.300 6.371 5 5 6 5 Buffalo Ridge Phase II 8.086 1.997 10.129 4.681 5.713 4 4 5 6 Buffalo Ridge Phase III 6.165 0.942 8.979 0.583 3.352 6 6 8 9 Buffalo Ridge Reference 6.112 0.264 8.460 2.375 3.738 7 7 7 8 Condon Condon 0.014 0.000 0.029 0.000 0.008 17 19 19 20 Klondike Klondike 0.000 0.019 0.357 30.125 11.376 18 18 4 3 Nine Canyon Nine Canyon 0.417 0.043 0.017 0.907 0.424 11 12 13 13 Stateline/Vansycle Reference 0.028 0.000 0.000 2.258 0.852 16 17 11 11 Stateline/Vansycle Stateline/Vansycle 0.350 0.083 0.000 0.000 0.079 13 13 16 16 Zintel Canyon Zintel Canyon 0.056 0.042 0.422 34.875 13.186 14 15 3 2 Average 2.853 0.369 3.423 8.611 4.510 11.1 11.6 9.2 9.3 Native Landscapes Cares Cares 0.000 0.007 0.017 0.077 0.034 18 20 17 19 Foote Creek Rim Foote Creek Rim 0.416 0.224 0.056 0.224 0.221 12 11 15 14 Foote Creek Rim Foote Creek Rim UV 0.858 0.032 0.000 0.002 0.151 9 9 14 15 Foote Creek Rim Morton's Pass Reference 0.036 0.049 0.007 0.041 0.035 15 16 18 18 Foote Creek Rim Simpson's Ridge 0.600 0.978 0.901 0.043 0.549 10 8 12 12 Maiden Maiden 0.000 0.156 0.000 0.000 0.039 18 14 21 17 San Gorgonio Pass Phase I High Elevation 0.000 0.000 0.000 0.000 0.000 18 21 21 22 San Gorgonio Pass Phase I Low Elevation 11.001 0.600 0.060 4.917 3.840 3 3 9 7 San Gorgonio Pass Phase I Medium Elevation 0.000 0.000 0.000 0.000 0.000 18 21 21 22 San Gorgonio Pass Phase I Water Area 30.771 4.942 8.221 57.693 29.712 1 1 1 1 San Gorgonio Pass Phase II Low Elevation 0.904 0.000 0.000 2.804 1.202 8 10 10 10 San Gorgonio Pass Phase II Water Area 13.973 0.122 15.129 14.779 11.053 2 2 2 4 Tehachapi Pass East Slope 0.000 0.000 0.000 0.000 0.000 18 21 21 22 Tehachapi Pass Middle Ridge 0.000 0.000 0.000 0.000 0.000 18 21 21 22 Tehachapi Pass West Ridge 0.000 0.000 0.000 0.007 0.003 18 21 20 21 Average 3.904 0.474 1.626 5.372 3.123 12.4 13.3 14.9 15.1 1 some biases may exist in comparisons of study areas due to differences in quality of viewsheds out to 800 m and durations of surveys 2 overall four season average weighted by the length of each season 3 rank (lower number indicates higher use estimate) of study area using spring data 4 rank (lower number indicates higher use estimate) of study area using spring and summer data 5 rank (lower number indicates higher use estimate) of study area using spring, summer and fall data 6 rank (lower number indicates higher use estimate) of study area using all four seasons of data

AVIAN AND BAT BASELINE DATA AND MORTALITY SYNTHESIS WEST, Inc. 83
Table 22. Pearson correlations among waterfowl/waterbird seasonal use estimates.
Correlation of Study Area Ranks Correlation of Seasonal Use Estimates
Spr Spr-Sum Spr-Fall Overall Spr Sum Fall Win Overall
Spr 1.00 Spr 1.00 Spr-Sum 0.97 1.00 Sum 0.86 1.00 Spr-Fall 0.76 0.75 1.00 Fall 0.68 0.47 1.00
Win 0.68 0.66 0.32 1.00 Overall 0.73 0.76 0.98 1.00 Overall 0.83 0.77 0.52 0.97 1.00

AVIAN AND BAT BASELINE DATA AND MORTALITY SYNTHESIS WEST, Inc. 84
Table 23. Number of active nests and estimated density (excluding inconspicuous ground nesting species) for cultivated agriculture wind projects.
STATELINE, OR/WA (area = 89 mi2) (NW Wildlife Consultants and WEST 2001)
Species Number within 2 mi Density (#/mi2) Ferruginous Hawk 3 0.034 Swainson’s Hawk 3 0.034 Red-tailed Hawk 7 0.079 Great Horned Owl 6 0.067 TOTAL 19 0.213
CONDON, OR (area = 50 mi2) (URS Corporation et al. 2001) Species Number within 2 mi Density (#/mi2) Red-tailed Hawk 2 0.040 Unidentified Raptor 1 0.020 TOTAL 3 0.060
KLONDIKE, OR (area = 24 mi2) (WEST and NW Wildlife Consultants 2001a) Species Number within 2 mi Density (#/mi2) Red-tailed Hawk 2 0.083 Swainson’s Hawk 1 0.042 Great Horned Owl 1 0.042 TOTAL 4 0.158
NINE CANYON, WA (area = 30 mi2) (WEST and NW Wildlife Consultants 2001b) Species Number within 2 mi Density (#/mi2) Swainson’s Hawk 1 0.033 TOTAL 1 0.033
ZINTEL CANYON, WA (area=~50 mi2) Species Number within 2 mi Density (#/mi2) Swainson’s Hawk 2 0.040 Red-tailed Hawk 1 0.020 Ferruginous Hawk 1 0.020 TOTAL 4 0.080
BUFFALO RIDGE, MN Species Number within 2 mi Density (#/mi2) Swainson’s Hawk Unk 0.074 Red-tailed Hawk Unk 0.059 Ferruginous Hawk Unk 0.005 Great Horned Owl Unk 0.015 TOTAL Unk 0.153
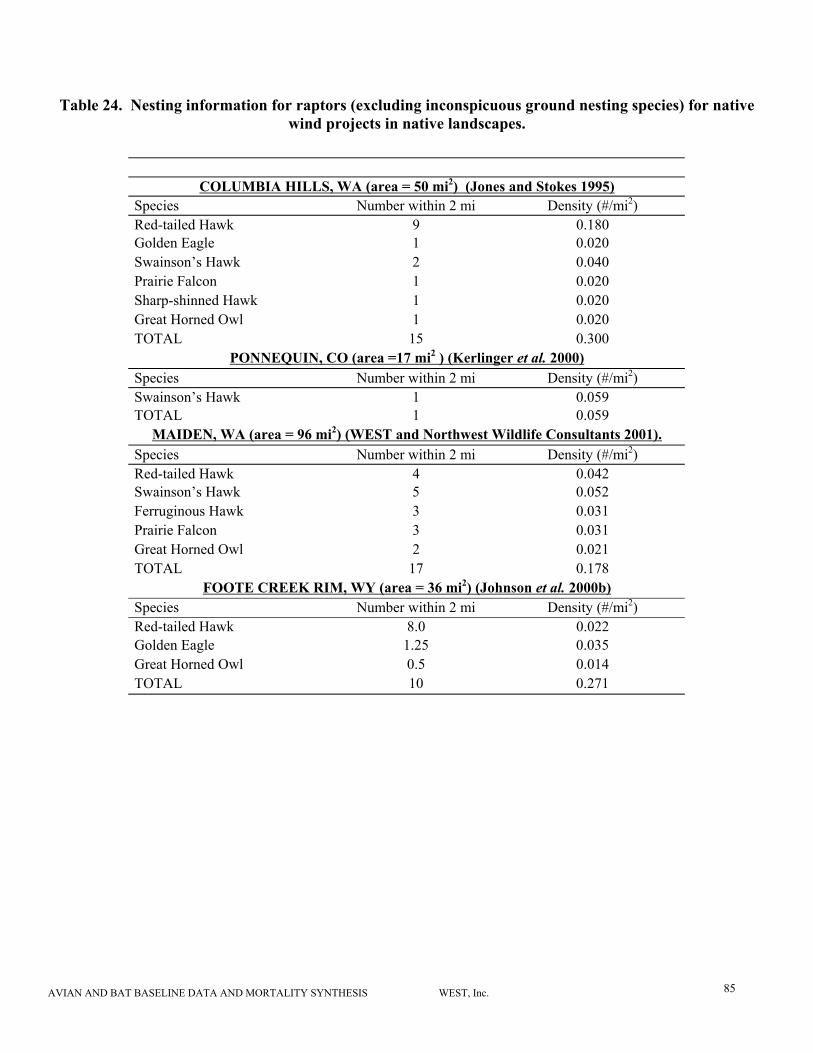
AVIAN AND BAT BASELINE DATA AND MORTALITY SYNTHESIS WEST, Inc. 85
Table 24. Nesting information for raptors (excluding inconspicuous ground nesting species) for native wind projects in native landscapes.
COLUMBIA HILLS, WA (area = 50 mi2) (Jones and Stokes 1995)
Species Number within 2 mi Density (#/mi2) Red-tailed Hawk 9 0.180 Golden Eagle 1 0.020 Swainson’s Hawk 2 0.040 Prairie Falcon 1 0.020 Sharp-shinned Hawk 1 0.020 Great Horned Owl 1 0.020 TOTAL 15 0.300
PONNEQUIN, CO (area =17 mi2 ) (Kerlinger et al. 2000) Species Number within 2 mi Density (#/mi2) Swainson’s Hawk 1 0.059 TOTAL 1 0.059
MAIDEN, WA (area = 96 mi2) (WEST and Northwest Wildlife Consultants 2001). Species Number within 2 mi Density (#/mi2) Red-tailed Hawk 4 0.042 Swainson’s Hawk 5 0.052 Ferruginous Hawk 3 0.031 Prairie Falcon 3 0.031 Great Horned Owl 2 0.021 TOTAL 17 0.178
FOOTE CREEK RIM, WY (area = 36 mi2) (Johnson et al. 2000b) Species Number within 2 mi Density (#/mi2) Red-tailed Hawk 8.0 0.022 Golden Eagle 1.25 0.035 Great Horned Owl 0.5 0.014 TOTAL 10 0.271
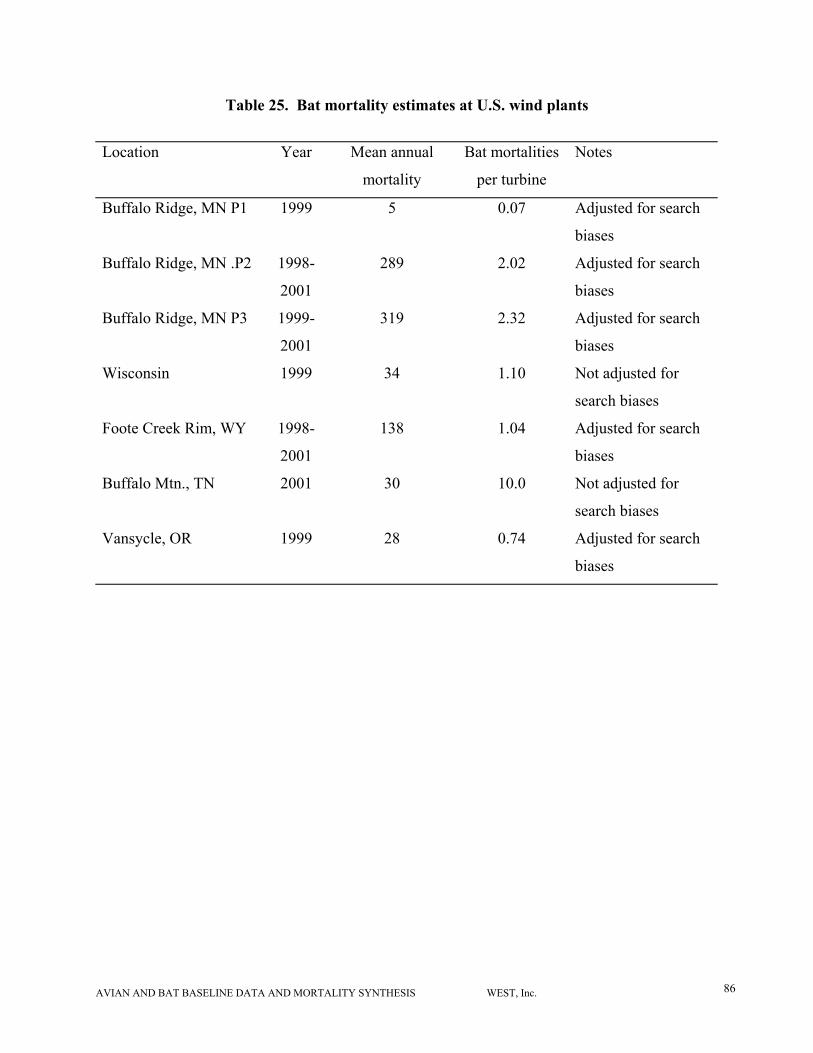
AVIAN AND BAT BASELINE DATA AND MORTALITY SYNTHESIS WEST, Inc. 86
Table 25. Bat mortality estimates at U.S. wind plants
Location Year Mean annual
mortality
Bat mortalities
per turbine
Notes
Buffalo Ridge, MN P1 1999 5 0.07 Adjusted for search
biases
Buffalo Ridge, MN .P2 1998-
2001
289 2.02 Adjusted for search
biases
Buffalo Ridge, MN P3 1999-
2001
319 2.32 Adjusted for search
biases
Wisconsin 1999 34 1.10 Not adjusted for
search biases
Foote Creek Rim, WY 1998-
2001
138 1.04 Adjusted for search
biases
Buffalo Mtn., TN 2001 30 10.0 Not adjusted for
search biases
Vansycle, OR 1999 28 0.74 Adjusted for search
biases

AVIAN AND BAT BASELINE DATA AND MORTALITY SYNTHESIS WEST, Inc. 87
Table 26. Timing of bat collision mortality at U.S. wind plants
Date Buffalo
Ridge,
MN
Vansycle,
OR
Buffalo
Mtn.,
TN
Stateline,
OR/WA
Foote Creek
Rim, WY
TOTAL Percent
May 1-15 0 0 0 - 0 0 0
May 16-31 1 0 0 - 1 2 0.4
June 1-15 0 0 0 - 1 1 0.2
June 16-30 3 0 0 - 2 5 0.9
July 1-15 9 0 9 0 2 15 2.8
July 16-31 88 0 0 0 26 119 22.2
Aug 1-15 127 0 10 0 19 151 28.2
Aug 16-31 75 4 0 11 33 128 23.9
Sep 1-15 52 4 8 0 21 81 15.1
Sep 16-30 4 2 10 0 20 3.7
Oct 1-15 1 0 0 8 2 11 2.1
Oct 16-31 2 0 0 0 0 2 0.4
Nov 1-15 0 0 0 1 0 1 0.2

AVIAN AND BAT BASELINE DATA AND MORTALITY SYNTHESIS WEST, Inc. 88
Table 27. Composition of bat collision fatalities at U.S. wind plants
Location n HOBA REBA SHBA BBBA LBBA EAPI UNID
Buffalo Ridge, MN 362 229 64 19 12 7 7 24
Buffao Mtn., TN 32 1 21 1 1 0 8 0
Wisconsin 34 8 20 2 4 0 0 0
Vansycle, OR 10 5 0 3 0 1 0 1
Ponnequin, CO ~18 ~14 0 0 0 0 0 ~4
Foote Creek Rim, WY 123 107 0 5 2 6 0 3
Stateline, OR/WA 30 14 0 14 0 2 0 0
Green Mtn., PA 1 0 0 0 0 1 0 0
California 6 2 1 0 0 0 0 3
Total
Percent(%)
616 380
61.7%
106
17.2%
44
7.1%
19
3.1%
17
2.8%
15
2.4%
35
5.7%

AVIAN AND BAT BASELINE DATA AND MORTALITY SYNTHESIS WEST, Inc. 89
Table 28. Habitat at U.S. wind plants with bat mortality.
Location Habitat
Buffalo Ridge, MN Crop fields, CRP fields, pasture
Buffalo Mtn., TN Mountain top in deciduous forest
Wisconsin Crop fields, pasture
Vansycle, OR Crop fields, grassland
Ponnequin, CO Short grass prairie on low ridges
Foote Creek Rim, WY Short grass prairie on prominent rim, aspens along east edge, shrubs
along west edge
Stateline, OR/WA Crop fields, grassland
Green Mtn, PA Deciduous woodland
California Desert shrub on hills

AVIAN AND BAT BASELINE DATA AND MORTALITY SYNTHESIS WEST, Inc. 90
Figure 1. Timing of avian fatality discoveries for the Foote Creek Rim (WY) and Buffalo Ridge (MN) wind projects.
1 2 3 4 5 6 7 8 9 10 11 12 13 14 15 16 17 18 19 20 21 22 23 24 25 26 27 28 0
5
10
15
20
25
30
winter spring summer fall winter spring summer fall
# F A T A L I T I E S
0
10
20
30
40
50
60
1 2 3 4 5 6 7 8 9 10 11 12 13 14 15 16
spring summer fall winter
Buffalo Ridge Fatalities 4-year study
Foote Creek Rim (WY) Fatalities 2-year study
# F A T A L I T I E S

AVIAN AND BAT BASELINE DATA AND MORTALITY SYNTHESIS WEST, Inc. 91
1 2 3 4 6 7 8 9 10 11 All 0.0
0.5
1.0
1.5
Use n=15 n=15
n=14 n=14
n=3 n=3 n=4
n=4
n=4
n=3
n=10
Spring
1 2 3 4 6 7 8 9 10 11 All 0.0
0.5
1.0
1.5
Use
n=24
n=24 n=24 n=24
n=6 n=6 n=9
n=6 n=6 n=6
n=11
Summer
1 2 3 4 6 7 8 9 10 11 All 0.0
0.5
1.0
1.5
Use n=20 n=20 n=19
n=19
n=5 n=5
n=5
n=5 n=5
n=5
n=11
Fall
1 2 3 4 6 7 8 9 10 11 All 0.0
0.5
1.0
1.5
Use
n=5 n=5 n=4
n=4 n=9 n=4
n=9
n=9 n=9 n=4
n=10
Winter
Figure 2. Total raptor/vulture use (standardized to #/20-minute survey) for study areas in agricultural landscapes.
Agricultural Landscapes
1=Buffalo Ridge Phase I
2=Buffalo Ridge Phase II
3=Buffalo Ridge Phase III
4=Buffalo Ridge Reference
6=Condon
7=Klondike
8=Nine Canyon
9=Stateline/Vansycle Reference
10=Stateline/Vansycle
11=Zintel Canyon
n=# survey periods
bars=+/- 1 standard error
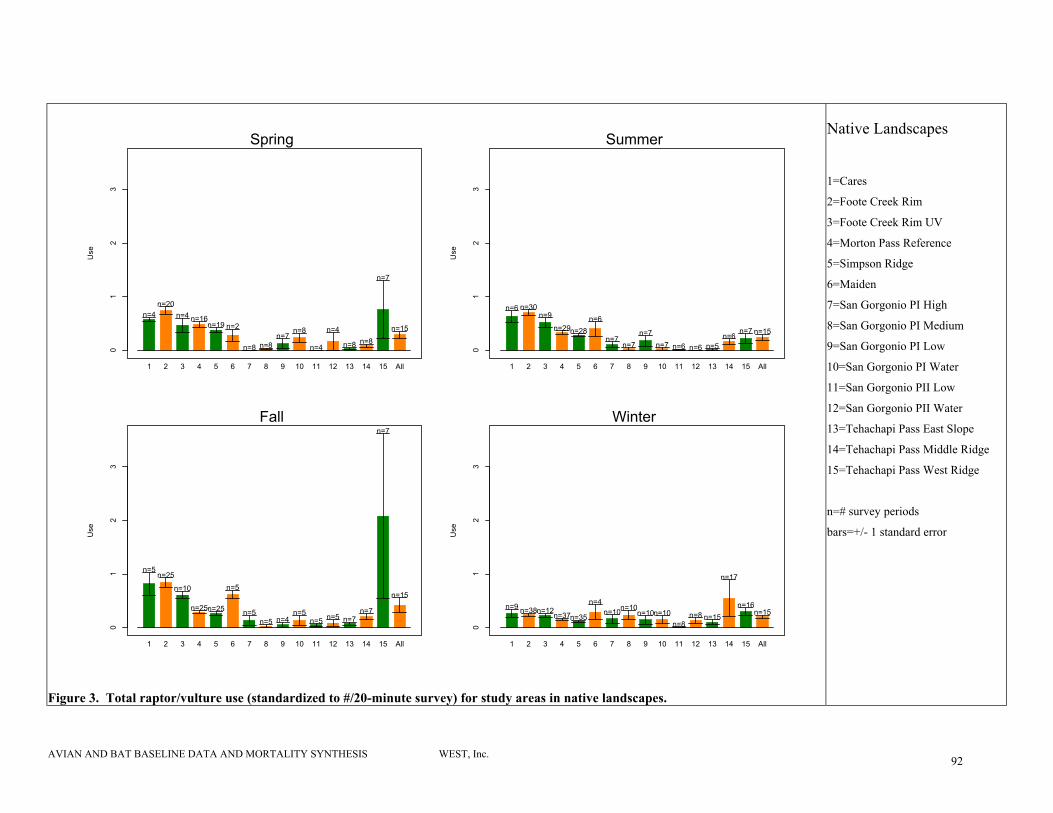
AVIAN AND BAT BASELINE DATA AND MORTALITY SYNTHESIS WEST, Inc. 92
1 2 3 4 5 6 7 8 9 10 11 12 13 14 15 All
01
23
Use
n=4n=20
n=4 n=16n=19 n=2
n=8 n=8n=7
n=8
n=4
n=4
n=8 n=8
n=7
n=15
Spring
1 2 3 4 5 6 7 8 9 10 11 12 13 14 15 All
01
23
Use
n=6 n=30n=9
n=29n=28n=6
n=7n=7
n=7n=7 n=6 n=6 n=5
n=6n=7 n=15
Summer
1 2 3 4 5 6 7 8 9 10 11 12 13 14 15 All
01
23
Use
n=5n=25
n=10
n=25n=25
n=5
n=5n=5 n=4
n=5n=5 n=5 n=7
n=7
n=7
n=15
Fall
1 2 3 4 5 6 7 8 9 10 11 12 13 14 15 All
01
23
Use
n=9 n=38n=12n=37n=35
n=4n=10n=10
n=10n=10n=8
n=8 n=15
n=17
n=16n=15
Winter
Figure 3. Total raptor/vulture use (standardized to #/20-minute survey) for study areas in native landscapes.
Native Landscapes
1=Cares
2=Foote Creek Rim
3=Foote Creek Rim UV
4=Morton Pass Reference
5=Simpson Ridge
6=Maiden
7=San Gorgonio PI High
8=San Gorgonio PI Medium
9=San Gorgonio PI Low
10=San Gorgonio PI Water
11=San Gorgonio PII Low
12=San Gorgonio PII Water
13=Tehachapi Pass East Slope
14=Tehachapi Pass Middle Ridge
15=Tehachapi Pass West Ridge
n=# survey periods
bars=+/- 1 standard error

AVIAN AND BAT BASELINE DATA AND MORTALITY SYNTHESIS WEST, Inc. 93
1 2 3 4 6 7 8 9 10 11 All 0.0
0.2
0.4
0.6
0.8
1.0
1.2
Use n=15
n=15 n=14 n=14
n=3 n=3
n=4
n=4
n=4
n=3
n=10
Spring
1 2 3 4 6 7 8 9 10 11 All 0.0
0.2
0.4
0.6
0.8
1.0
1.2
Use
n=24 n=24 n=24
n=24
n=6
n=6
n=9
n=6 n=6
n=6 n=11
Summer
1 2 3 4 6 7 8 9 10 11 All 0.0
0.2
0.4
0.6
0.8
1.0
1.2
Use n=20 n=20
n=19 n=19
n=5 n=5
n=5
n=5 n=5
n=5 n=11
Fall
1 2 3 4 6 7 8 9 10 11 All 0.0
0.2
0.4
0.6
0.8
1.0
1.2
Use
n=5 n=5
n=4 n=4
n=9
n=4
n=9
n=9
n=9 n=4
n=10
Winter
Figure 4. Total buteo use (standardized to #/20-minute survey) for study areas in agricultural landscapes.
Agricultural Landscapes
1=Buffalo Ridge Phase I
2=Buffalo Ridge Phase II
3=Buffalo Ridge Phase III
4=Buffalo Ridge Reference
6=Condon
7=Klondike
8=Nine Canyon
9=Stateline/Vansycle Reference
10=Stateline/Vansycle
11=Zintel Canyon
n=# survey periods
bars=+/- 1 standard error

AVIAN AND BAT BASELINE DATA AND MORTALITY SYNTHESIS WEST, Inc. 94
1 2 3 4 5 6 7 8 9 10 11 12 13 14 15 All
0.0
0.1
0.2
0.3
0.4
Use
n=4
n=20
n=4
n=16
n=19
n=2
n=8
n=8
n=7
n=8 n=4
n=4
n=8
n=8
n=7
n=15
Spring
1 2 3 4 5 6 7 8 9 10 11 12 13 14 15 All
0.0
0.1
0.2
0.3
0.4
Use
n=6
n=30
n=9
n=29n=28
n=6
n=7
n=7
n=7
n=7 n=6 n=6n=5
n=6
n=7
n=15
Summer
1 2 3 4 5 6 7 8 9 10 11 12 13 14 15 All
0.0
0.1
0.2
0.3
0.4
Use
n=5
n=25
n=10
n=25n=25
n=5
n=5
n=5 n=4 n=5 n=5 n=5
n=7
n=7
n=7
n=15
Fall
1 2 3 4 5 6 7 8 9 10 11 12 13 14 15 All
0.0
0.1
0.2
0.3
0.4
Use
n=9
n=38n=12n=37n=35
n=4
n=10
n=10
n=10
n=10n=8
n=8
n=15
n=17
n=16
n=15
Winter
Figure 5. Total buteo use (standardized to #/20-minute survey) for study areas in native landscapes.
Native Landscapes
1=Cares
2=Foote Creek Rim
3=Foote Creek Rim UV
4=Morton Pass Reference
5=Simpson Ridge
6=Maiden
7=San Gorgonio PI High
8=San Gorgonio PI Medium
9=San Gorgonio PI Low
10=San Gorgonio PI Water
11=San Gorgonio PII Low
12= San Gorgonio PII Water
13=Tehachapi Pass East Slope
14=Tehachapi Pass Middle Ridge
15=Tehachapi Pass West Ridge
n=# survey periods
bars=+/- 1 standard error

AVIAN AND BAT BASELINE DATA AND MORTALITY SYNTHESIS WEST, Inc. 95
1 2 3 4 6 7 8 9 10 11 All 0.0
0.02
0.04
0.06
Use
n=15
n=15
n=14
n=14
n=3 n=3 n=4
n=4
n=4 n=3
n=10
Spring
1 2 3 4 6 7 8 9 10 11 All 0.0
0.02
0.04
0.06
Use
n=24 n=24 n=24 n=24
n=6 n=6
n=9 n=6 n=6 n=6 n=11
Summer
1 2 3 4 6 7 8 9 10 11 All 0.0
0.02
0.04
0.06
Use
n=20
n=20 n=19 n=19
n=5
n=5
n=5
n=5 n=5
n=5
n=11
Fall
1 2 3 4 6 7 8 9 10 11 All 0.0
0.02
0.04
0.06
Use
n=5
n=5 n=4
n=4
n=9
n=4 n=9
n=9
n=9
n=4
n=10
Winter
Figure 6. Total eagle use (standardized to #/20-minute survey, primarily golden eagles) for study areas in agricultural landscapes.
Agricultural Landscapes
1=Buffalo Ridge Phase I
2=Buffalo Ridge Phase II
3=Buffalo Ridge Phase III
4=Buffalo Ridge Reference
6=Condon
7=Klondike
8=Nine Canyon
9=Stateline/Vansycle Reference
10=Stateline/Vansycle
11=Zintel Canyon
n=# survey periods
bars=+/- 1 standard error

AVIAN AND BAT BASELINE DATA AND MORTALITY SYNTHESIS WEST, Inc. 96
1 2 3 4 5 6 7 8 9 10 11 12 13 14 15 All
0.0
0.1
0.2
0.3
Use n=4
n=20
n=4
n=16n=19
n=2 n=8 n=8
n=7
n=8
n=4 n=4 n=8 n=8 n=7
n=15
Spring
1 2 3 4 5 6 7 8 9 10 11 12 13 14 15 All
0.0
0.1
0.2
0.3
Use
n=6
n=30
n=9
n=29
n=28
n=6
n=7
n=7 n=7 n=7 n=6 n=6 n=5 n=6
n=7n=15
Summer
1 2 3 4 5 6 7 8 9 10 11 12 13 14 15 All
0.0
0.1
0.2
0.3
Use
n=5
n=25
n=10
n=25
n=25
n=5
n=5
n=5 n=4 n=5 n=5 n=5 n=7 n=7 n=7
n=15
Fall
1 2 3 4 5 6 7 8 9 10 11 12 13 14 15 All
0.0
0.1
0.2
0.3
Use
n=9
n=38n=12
n=37n=35
n=4
n=10n=10n=10
n=10
n=8 n=8 n=15n=17n=16
n=15
Winter
Figure 7. Total eagle use (standardized to #/20-minute survey, primarily golden eagles) for study areas in native landscapes.
Native Landscapes
1=Cares
2=Foote Creek Rim
3=Foote Creek Rim UV
4=Morton Pass Reference
5=Simpson Ridge
6=Maiden
7=San Gorgonio PI High
8= San Gorgonio PI Medium
9= San Gorgonio PI Low
10=San Gorgonio PI Water
11=San Gorgonio PII Low
12=San Gorgonio PII Water
13=Tehachapi Pass East Slope
14=Tehachapi Pass Middle
Ridge
15=Tehachapi Pass West Ridge
n=# survey periods
bars=+/- 1 standard error

AVIAN AND BAT BASELINE DATA AND MORTALITY SYNTHESIS WEST, Inc. 97
1 2 3 4 5 6 7 8 9 10 11 All
0.0
0.01
0.02
0.03
0.04
0.05
Use
n=15 n=15 n=14 n=14 n=0 n=3 n=3
n=4
n=4 n=4 n=3
n=10
Spring
1 2 3 4 5 6 7 8 9 10 11 All
0.0
0.01
0.02
0.03
0.04
0.05
Use
n=24 n=24 n=24 n=24 n=5 n=6
n=6
n=9 n=6 n=6 n=6 n=11
Summer
1 2 3 4 5 6 7 8 9 10 11 All
0.0
0.01
0.02
0.03
0.04
0.05
Use
n=20 n=20
n=19
n=19
n=5
n=5
n=5 n=5 n=5 n=5
n=5
n=11
Fall
1 2 3 4 5 6 7 8 9 10 11 All
0.0
0.01
0.02
0.03
0.04
0.05
Use
n=5 n=5 n=4
n=4
n=0 n=9
n=4
n=9
n=9
n=9
n=4
n=10
Winter
Figure 8. Total large falcon use (standardized to #/20-minute survey) for study areas in agricultural landscapes.
Agricultural Landscapes
1=Buffalo Ridge Phase I
2=Buffalo Ridge Phase II
3=Buffalo Ridge Phase III
4=Buffalo Ridge Reference
6=Condon
7=Klondike
8=Nine Canyon
9=Stateline/Vansycle Reference
10=Stateline/Vansycle
11=Zintel Canyon
n=# survey periods
bars=+/- 1 standard error

AVIAN AND BAT BASELINE DATA AND MORTALITY SYNTHESIS WEST, Inc. 98
1 2 3 4 5 6 7 8 9 10 11 All
0.0
0.1
0.2
0.3
Use n=15
n=15
n=14
n=14
n=0
n=3n=3
n=4
n=4
n=4
n=3
n=10
Spring
1 2 3 4 5 6 7 8 9 10 11 All
0.0
0.1
0.2
0.3
Use
n=24
n=24
n=24
n=24
n=5
n=6
n=6n=9 n=6
n=6n=6 n=11
Summer
1 2 3 4 5 6 7 8 9 10 11 All
0.0
0.1
0.2
0.3
Use
n=20
n=20
n=19
n=19
n=5
n=5n=5
n=5
n=5 n=5n=5 n=11
Fall
1 2 3 4 5 6 7 8 9 10 11 All
0.0
0.1
0.2
0.3
Use
n=5
n=5
n=4
n=4
n=0
n=9
n=4n=9
n=9
n=9
n=4
n=10
Winter
Figure 9. Total large falcon use (standardized to #/20-minute survey) for study areas in native landscapes.
Native Landscapes
1=Cares
2=Foote Creek Rim
3=Foote Creek Rim UV
4=Morton Pass Reference
5=Simpson Ridge
6=Maiden
7=San Gorgonio PI High
8=San Gorgonio PI Medium
9=San Gorgonio PI Low
10=San Gorgonio PI Water
11=San Gorgonio PII Low
12=San Gorgonio PII Water
13=ehachapi Pass East Slope
14=Tehachapi Pass Middle Ridge
15=Tehachapi Pass West Ridge
n=# survey periods
bars=+/- 1 standard error

AVIAN AND BAT BASELINE DATA AND MORTALITY SYNTHESIS WEST, Inc. 99
1 2 3 4 5 6 7 8 9 10 11 All
0.0
0.1
0.2
0.3
0.4
0.5
Use
n=15
n=15n=14
n=14
n=0
n=3
n=3
n=4
n=4
n=4 n=3n=10
Spring
1 2 3 4 5 6 7 8 9 10 11 All
0.0
0.1
0.2
0.3
0.4
0.5
Use
n=24
n=24
n=24
n=24
n=5n=6
n=6
n=9
n=6
n=6
n=6
n=11
Summer
1 2 3 4 5 6 7 8 9 10 11 All
0.0
0.1
0.2
0.3
0.4
0.5
Use
n=20 n=20 n=19
n=19
n=5 n=5
n=5
n=5 n=5n=5
n=5
n=11
Fall
1 2 3 4 5 6 7 8 9 10 11 All
0.0
0.1
0.2
0.3
0.4
0.5
Use
n=5 n=5
n=4 n=4n=0
n=9n=4
n=9 n=9n=9
n=4
n=10
Winter
Figure 10. Total small falcon use (standardized to #/20-minute survey) for study areas in agricultural landscapes.
Agricultural Landscapes
1=Buffalo Ridge Phase I
2=Buffalo Ridge Phase II
3=Buffalo Ridge Phase III
4=Buffalo Ridge Reference
6=Condon
7=Klondike
8=Nine Canyon
9=Stateline/Vansycle Reference
10=Stateline/Vansycle
11=Zintel Canyon
n=# survey periods
bars=+/- 1 standard error

AVIAN AND BAT BASELINE DATA AND MORTALITY SYNTHESIS WEST, Inc. 100
1 2 3 4 5 6 7 8 9 10 11 All
0.0
0.1
0.2
0.3
Use n=15
n=15
n=14
n=14
n=0
n=3n=3
n=4
n=4
n=4
n=3
n=10
Spring
1 2 3 4 5 6 7 8 9 10 11 All
0.0
0.1
0.2
0.3
Use
n=24
n=24
n=24
n=24
n=5
n=6
n=6n=9 n=6
n=6n=6 n=11
Summer
1 2 3 4 5 6 7 8 9 10 11 All
0.0
0.1
0.2
0.3
Use
n=20
n=20
n=19
n=19
n=5
n=5n=5
n=5
n=5 n=5n=5 n=11
Fall
1 2 3 4 5 6 7 8 9 10 11 All
0.0
0.1
0.2
0.3
Use
n=5
n=5
n=4
n=4
n=0
n=9
n=4n=9
n=9
n=9
n=4
n=10
Winter
Figure 11. Total small falcon use (standardized to #/20-minute survey) for study areas in native landscapes.
Native Landscapes
1=Cares
2=Foote Creek Rim
3=Foote Creek Rim UV
4=Morton Pass Reference
5=Simpson Ridge
6=Maiden
7=San Gorgonio PI High
8=San Gorgonio PI Medium
9=San Gorgonio PI Low
10=San Gorgonio PI Water
11=San Gorgonio PII Low
12=San Gorgonio PII Water
13=Tehachapi Pass East Slope
14=Tehachapi Pass Middle Ridge
15=Tehachapi Pass West Ridge
n=# survey periods
bars=+/- 1 standard error

AVIAN AND BAT BASELINE DATA AND MORTALITY SYNTHESIS WEST, Inc. 101
1 2 3 4 5 6 7 8 9 10 11 All
0.0
0.1
0.2
0.3
Use n=15
n=15
n=14
n=14
n=0
n=3n=3
n=4
n=4
n=4
n=3
n=10
Spring
1 2 3 4 5 6 7 8 9 10 11 All
0.0
0.1
0.2
0.3
Use
n=24
n=24
n=24
n=24
n=5
n=6
n=6n=9 n=6
n=6n=6 n=11
Summer
1 2 3 4 5 6 7 8 9 10 11 All
0.0
0.1
0.2
0.3
Use
n=20
n=20
n=19
n=19
n=5
n=5n=5
n=5
n=5 n=5n=5 n=11
Fall
1 2 3 4 5 6 7 8 9 10 11 All
0.0
0.1
0.2
0.3
Use
n=5
n=5
n=4
n=4
n=0
n=9
n=4n=9
n=9
n=9
n=4
n=10
Winter
Figure 12. Total northern harrier use (standardized to #/20-minute survey) for study areas in agricultural landscapes.
Agricultural Landscapes
1=Buffalo Ridge Phase I
2=Buffalo Ridge Phase II
3=Buffalo Ridge Phase III
4=Buffalo Ridge Reference
6=Condon
7=Klondike
8=Nine Canyon
9=Stateline/Vansycle Reference
10=Stateline/Vansycle
11=Zintel Canyon
n=# survey periods
bars=+/- 1 standard error

AVIAN AND BAT BASELINE DATA AND MORTALITY SYNTHESIS WEST, Inc. 102
1 2 3 4 5 6 7 8 9 10 11 All
0.0
0.1
0.2
0.3
Use n=15
n=15
n=14
n=14
n=0
n=3n=3
n=4
n=4
n=4
n=3
n=10
Spring
1 2 3 4 5 6 7 8 9 10 11 All
0.0
0.1
0.2
0.3
Use
n=24
n=24
n=24
n=24
n=5
n=6
n=6n=9 n=6
n=6n=6 n=11
Summer
1 2 3 4 5 6 7 8 9 10 11 All
0.0
0.1
0.2
0.3
Use
n=20
n=20
n=19
n=19
n=5
n=5n=5
n=5
n=5 n=5n=5 n=11
Fall
1 2 3 4 5 6 7 8 9 10 11 All
0.0
0.1
0.2
0.3
Use
n=5
n=5
n=4
n=4
n=0
n=9
n=4n=9
n=9
n=9
n=4
n=10
Winter
Figure 13. Total northern harrier use (standardized to #/20-minute survey) for study areas in native landscapes.
Native Landscapes
1=Cares
2=Foote Creek Rim
3=Foote Creek Rim UV
4=Morton Pass Reference
5=Simpson Ridge
6=Maiden
7=San Gorgonio PI High
8=San Gorgonio PI Medium
9=San Gorgonio PI Low
10=San Gorgonio PI Water
11=San Gorgonio PII Low
12=San Gorgonio PII Water
13=Tehachapi Pass East Slope
14=Tehachapi Pass Middle Ridge
15=Tehachapi Pass West Ridge
n=# survey periods
bars=+/- 1 standard error

AVIAN AND BAT BASELINE DATA AND MORTALITY SYNTHESIS WEST, Inc. 103
1 2 3 4 5 6 7 8 9 10 11 All
0.0
0.02
0.04
0.06
0.08
0.10
Use
n=15
n=15
n=14
n=14
n=0 n=3 n=3 n=4 n=4 n=4
n=3
n=10
Spring
1 2 3 4 5 6 7 8 9 10 11 All
0.0
0.02
0.04
0.06
0.08
0.10
Use
n=24 n=24 n=24 n=24 n=5 n=6 n=6 n=9 n=6 n=6
n=6
n=11
Summer
1 2 3 4 5 6 7 8 9 10 11 All
0.0
0.02
0.04
0.06
0.08
0.10
Use n=20 n=20 n=19
n=19
n=5
n=5
n=5 n=5
n=5n=5
n=5
n=11
Fall
1 2 3 4 5 6 7 8 9 10 11 All
0.0
0.02
0.04
0.06
0.08
0.10
Use
n=5 n=5
n=4
n=4
n=0 n=9 n=4 n=9
n=9
n=9
n=4
n=10
Winter
Figure 14. Total accipiter use (standardized to #/20-minute survey) for study areas in agricultural landscapes.
Agricultural Landscapes
1=Buffalo Ridge Phase I
2=Buffalo Ridge Phase II
3=Buffalo Ridge Phase III
4=Buffalo Ridge Reference
6=Condon
7=Klondike
8=Nine Canyon
9=Stateline/Vansycle Reference
10=Stateline/Vansycle
11=Zintel Canyon
n=# survey periods
bars=+/- 1 standard error

AVIAN AND BAT BASELINE DATA AND MORTALITY SYNTHESIS WEST, Inc. 104
1 2 3 4 5 6 7 8 9 10 11 12 13 14 15 All
0.0
0.05
0.10
0.15
0.20
Use
n=4 n=20 n=4 n=16n=19n=2 n=8 n=8 n=7 n=8 n=4 n=4
n=8
n=8 n=7 n=15
Spring
1 2 3 4 5 6 7 8 9 10 11 12 13 14 15 All
0.0
0.05
0.10
0.15
0.20
Use
n=6n=30
n=9 n=29n=28 n=6 n=7 n=7 n=7 n=7 n=6 n=6 n=5 n=6 n=7 n=15
Summer
1 2 3 4 5 6 7 8 9 10 11 12 13 14 15 All
0.0
0.05
0.10
0.15
0.20
Use
n=5
n=25
n=10n=25
n=25
n=5
n=5 n=5 n=4 n=5 n=5 n=5 n=7 n=7 n=7
n=15
Fall
1 2 3 4 5 6 7 8 9 10 11 12 13 14 15 All
0.0
0.05
0.10
0.15
0.20
Use
n=9n=38n=12n=37n=35 n=4 n=10n=10n=10n=10 n=8 n=8 n=15n=17
n=16
n=15
Winter
Figure 15. Total accipiter use (standardized to #/20-minute survey) for study areas in native landscapes.
Native Landscapes
1=Cares
2=Foote Creek Rim
3=Foote Creek Rim UV
4=Morton Pass Reference
5=Simpson Ridge
6=Maiden
7=San Gorgonio PI High
8=San Gorgonio PI Medium
9=San Gorgonio PI Low
10=San Gorgonio PI Water
11=San Gorgonio PII Low
12=San Gorgonio PII Water
13=Tehachapi Pass East Slope
14=Tehachapi Pass Middle Ridge
15=Tehachapi Pass West Ridge
n=# survey periods
bars=+/- 1 standard error

AVIAN AND BAT BASELINE DATA AND MORTALITY SYNTHESIS WEST, Inc. 105
1 2 3 4 6 7 8 9 10 11 All 0
20
40
60
Use
n=15 n=15 n=14 n=14 n=3 n=3 n=4 n=4 n=4 n=3
n=10
Spring
1 2 3 4 6 7 8 9 10 11 All 0
20
40
60
Use
n=24 n=24 n=24 n=24 n=6 n=6 n=9 n=6 n=6 n=6 n=11
Summer
1 2 3 4 6 7 8 9 10 11 All 0
20
40
60
Use
n=20 n=20 n=19 n=19
n=5 n=5 n=5 n=5 n=5 n=5n=11
Fall
1 2 3 4 6 7 8 9 10 11 All 0
20
40
60
Use
n=5
n=5 n=4
n=4 n=9
n=4
n=9 n=9 n=9
n=4
n=10
Winter
Figure 16. Total waterfowl use (standardized to #/20-minute survey) for study areas in agricultural landscapes.
Agricultural Landscapes
1=Buffalo Ridge Phase I
2=Buffalo Ridge Phase II
3=Buffalo Ridge Phase III
4=Buffalo Ridge Reference
6=Condon
7=Klondike
8=Nine Canyon
9=Stateline/Vansycle Reference
10=Stateline/Vansycle
11=Zintel Canyon
n=# survey periods
bars=+/- 1 standard error

AVIAN AND BAT BASELINE DATA AND MORTALITY SYNTHESIS WEST, Inc. 106
1 2 3 4 5 6 7 8 9 10 11 12 13 14 15 All
020
4060
80
Use
n=4 n=20 n=4 n=16n=19 n=2 n=8
n=8
n=7
n=8
n=4
n=4
n=8 n=8 n=7
n=15
Spring
1 2 3 4 5 6 7 8 9 10 11 12 13 14 15 All
020
4060
80
Use
n=6 n=30 n=9 n=29n=28 n=6 n=7 n=7 n=7
n=7
n=6 n=6 n=5 n=6 n=7 n=15
Summer
1 2 3 4 5 6 7 8 9 10 11 12 13 14 15 All
020
4060
80
Use
n=5 n=25n=10n=25n=25 n=5 n=5 n=5 n=4
n=5
n=5
n=5
n=7 n=7 n=7n=15
Fall
1 2 3 4 5 6 7 8 9 10 11 12 13 14 15 All
020
4060
80
Use
n=9 n=38n=12n=37n=35 n=4 n=10
n=10
n=10
n=10
n=8
n=8
n=15n=17n=16
n=15
Winter
Figure 17. Total waterfowl/waterbird use (standardized to #/20-minute survey) for study areas in native landscapes.
Native Landscapes
1=Cares
2=Foote Creek Rim
3=Foote Creek Rim UV
4=Morton Pass Reference
5=Simpson Ridge
6=Maiden
7=San Gorgonio PI High
8=San Gorgonio PI Medium
9=San Gorgonio PI Low
10=San Gorgonio PI Water
11=San Gorgonio PII Low
12=San Gorgonio PII Water
13=Tehachapi Pass East Slope
14=Tehachapi Pass Middle Ridge
15=Tehachapi Pass West Ridge
n=# survey periods
bars=+/- 1 standard error

AVIAN AND BAT BASELINE DATA AND MORTALITY SYNTHESIS WEST, Inc. 107
Figure 18. Percent composition of annual bird mortality estimates from various anthropogenic sources (Erickson et al. 2001)
% Composition of Fatalities by Source
0 10 20 30 40 50 60
buildings/windowscats
other
high tension linesvehicles
pesticidescommunication towers
wind turbines
% Composition
<1 per 10000 fatalities
250 per 10000 fatalities
700 per 10000 fatalities
700 per 10000 fatalities
1000 per 10000 fatalities 5500 per 10000 fatalities
800 per 10000 fatalities
1000 per 10000 fatalities

AVIAN AND BAT BASELINE DATA AND MORTALITY SYNTHESIS WEST, Inc. 108
Bird Fatality Rates from New Wind Plants
0 0.5 1 1.5 2 2.5 3
Algona, IA
Buffalo Ridge, MN
Foote Creek Rim, WY
Ponnequin, CO
Searsburg, VT
Somerset County, PA
Vansycle (OR)
Wisconsin
Overall Average
# Bird Fatalities/turbine/year
Note: estimates adjusted for scavenging and searcher efficiency in cases when some fatalities were observed.
Figure 19. Bird fatality rates at wind projects in the U.S. (Erickson et al. 2001).

AVIAN AND BAT BASELINE DATA AND MORTALITY SYNTHESIS WEST, Inc. 109
APPENDIX A. REVIEWERS COMMENTS AND RESPONSES.
Note: In most cases, page number references have been modified to reflect the current draft. It
is stated in parentheses if the page number reference is from the original draft.

AVIAN AND BAT BASELINE DATA AND MORTALITY SYNTHESIS WEST, Inc. 110
Comments from Dr. Tom Meehan, Biologist, OOE Note: comments were received from Tom Meehan over the phone. Comment TM-1: The use of term “indicate”. Recommends that WEST review all places where the term “indicate” is used, and evaluates whether the term “suggest” is more accurate. Response TM-1: We replaced the term “indicate” with the term “suggest” in most places. We agree that the term “indicate” was too strong in most cases.
Comment TM-2: Check use of “native” and “agricultural” before the term site. Response TM-2: we modified the statements of concern throughout the document. For example, see last two sentences in Executive Summary under waterfowl mortality. Comment TM-3: Throughout the document, use the specific range of dates that data was collected instead of using the term “since” (e.g., since January should say “between January and March, 2002). Response TM-3: Suggestion made throughout the document. Comment TM-4: Results section. Correlations indicate “use predictions”, not “impact predictions”, would not vary much with one or two seasons worth of data. Impact prediction is based on “use data” and other information such as habitat, raptor nesting, and mortality information. Response TM-4: See comment TM-5 and response TM-5. Comment TM-5: Results section. Relates to Comment TM-4 above. Add a summary section for each raptor group that includes a discussion of the ability to make impact predictions with less than a year of data for each bird group. Response TM-5: Suggested summaries added throughout the document. Comment TM-6: Use same # digits of numbers in the text as they are in the tables. Response TM-6: Suggested changes made throughout the results section. Comment TM-7: Use “[“ instead of “(“ in cases where more than one set of parentheses are found in a sentence. Response TM-7: Suggested change made. Comment TM-8: Page 5, Executive Summary: Clarify paragraph sentence beginning with “Bat echolocation and collision mortality...” Break up into two sentences. Response TM-8: Paragraph rewritten below:
“Bat echolocation and collision mortality studies indicate that only a small fraction of detected bat passes near turbines result in collisions, and that there appears to be little relationship between bat activity at turbines and subsequent collision mortality. This relationship may not exist because many of the migrant species involved may either not be echolocating, or they are flying too high for the bat detectors (Anabat®) to record, but still may be within the zone of collision risk.”

AVIAN AND BAT BASELINE DATA AND MORTALITY SYNTHESIS WEST, Inc. 111
Comment TM-9: Page 6, Executive Summary, under Seasonal Avian Use, 2nd paragraph. Clarify that the cases where one season appears adequate is for “all raptors” as a group, and buteos and golden eagles. Response TM-9: 1st two sentences of paragraph now reads:
“In most cases we investigated (e.g., most raptor groups), baseline avian use data collected during one season (usually spring, summer or fall) appear adequate for making overall wind plant direct impact predictions (e.g., low, moderate or high relative mortality). Moderate to high correlations between seasonal use estimates and overall use estimates exist for most of the raptor groups considered, especially all raptors/vultures combined, buteo, golden eagle, northern harrier and large falcons.”
Comment TM-10 and TM-11: Page 8, Executive Summary, Overall Conclusions, #3, change term “most” to “many”. Change term “eagles” to “golden eagles”. Response TM-10: Conclusion #3 now reads:
“3. In the majority of the raptor groups we investigated (all raptors combined, buteos, golden eagles, northern harriers, large falcons), baseline avian use data collected during one season (spring, summer or fall) appear adequate for making overall wind plant direct impact predictions (e.g., low, moderate or high relative mortality). This appears to be especially true for sites in agricultural settings. Correlation analyses, in general, suggest overall use predictions for these groups based on one or two seasons of information would be similar to predictions from a four-season study. As a result, sites can be ranked in terms of overall raptor, buteo, golden eagle and large falcon use reasonably well based on one season of data collection (spring, summer or fall), compared to four seasons of data collection.”
Comment TM-12: Page 8, Executive summary, Overall Conclusions, #4: Use the term “most” instead of “many”. Get rid of term “between” in parentheses. Add term “baseline” before “data to refine predictions”. Response TM-12: Conclusion #4 has been reworded based on several reviewers suggestions:
“In cases where baseline data or other information (e.g., historic data or habitat) indicate a site has levels of raptor use considered high (regionally high, or in comparison to use at other projects considered high (e.g., Altamont Pass (CA) and Foote Creek Rim (WY) golden eagle use estimates), we recommend collecting more than one season of baseline data to refine predictions and to make micro-siting decisions that might reduce impacts. Sites with high raptor use, and comprised of large tracts of high quality native habitat with high topographic relief (e.g., distinct ridges) and/or containing other features (e.g., significant water sources) that may lead to distinct patterns in raptor use are likely candidates for effective micro-siting. Many of the project sites within agricultural landscapes do not typically meet any of these criteria and are therefore not strong candidates for effective micro-siting.”
Comment TM-13: Reorder the bat conclusions. Move overall conclusion #10 before #9. Response TM-13: Suggestion made. Comment TM-14: Introduction, page 10, 3rd paragraph, 1st sentence. Add the terms “appear to” before reduced. Response TM-14: Suggestion made. Comment TM-15: Page 16-17, RESULTS AND DISCUSSION, Avian Mortality and Use. Check % composition results against table. Response TM-15: Made corrections to the text.

AVIAN AND BAT BASELINE DATA AND MORTALITY SYNTHESIS WEST, Inc. 112
Comment TM-16: Page 19, All Raptors/Vultures, 2nd paragraph, add reference to Table 8 at end of first sentence. Response TM-16: Suggested change made. Comment TM-17: Page 22, Buteos, Agricultural Landscapes. Clarify first sentence. Response TM-17: Sentence now reads:
“For study areas within agricultural landscapes, buteo use averaged across all study areas was very similar among seasons (0.2 to 0.3/20-min survey, Table 9, Figure 4), although this pattern was not consistent within study areas.”
Comment TM-18: Page 26, Falcons, towards bottom of page, give a reference to “(e.g., 0-0.03 American kestrels per turbine per year)”. Response TM-18: We added a new section for small falcons. The statement was only for illustration. We removed the statement. Comment TM-19: Page 37, 1st partial paragraph, Clarify sentence that starts with “Eagle nest density”. Response TM-19: Sentence now reads:
“Golden eagle nest density within 2 miles of the WRA is one active nest per 11.3 miles2.”

AVIAN AND BAT BASELINE DATA AND MORTALITY SYNTHESIS WEST, Inc. 113
Comments from Lynn Sharp, Project Manager, URS Corporation Note: comments were handwritten on a hard copy of the document. Comment LS-1: Executive Summary, Page 5. Change term “potential” to “potentially”. Response LS-1: Change made. Comment LS-2: Page 7, Overall Conclusions, #5. Use term “low” instead of “little”. Response LS-2: Change made. Comment LS-3: Need a disclaimer that none of the other wind plants have been sufficiently studied to indicate whether mortality may be affecting local populations. Response LS-3: Specified that data from only Buffalo Ridge is the basis for the conclusion. Comment LS-4: Page 18, add “per year” after reference mortality estimates. Response LS-4: Change made. Comment LS-5: Page 19, clarify first two sentences. Response LS-5: Sentences now read:
“Within agricultural landscapes, average total raptor/vulture seasonal use estimates (averages across the study areas) were highest in the spring (0.598), followed by followed by fall (0.525), summer (0.413) and winter (0.385), suggesting low variability among average seasonal estimates. Average use for individual study areas ranged from 0.258 to 0.602 raptors/20-minute survey, suggesting relatively low variability in four-season use estimates among study areas as well.”
Comment LS-6: Page 22, Buteos, Agricultural Landscapes. Clarify first sentence. Response LS-6: Sentence now reads:
“For study areas within agricultural landscapes, buteo use averaged across all study areas was very similar among seasons (0.2 to 0.3/20-min survey, Table 9, Figure 4), although this pattern was not consistent within study areas.”
Comment LS-7: Page 27, Falcons. Given their different lifestyles, why combine falcons? What happens when you do things separate? Response LS-7: We have now separated analyses for small falcons from large falcons. Comment LS-8: Page 27, Falcons, first sentence. Tehachapi Pass should be study area with 2nd highest falcon use. Response LS-8: Correction acknowledged. The new sections on small falcons and large falcons contain the correct information. Comment LS-9: Page 28, Falcons: Suggest changes to the following sentence: “At likely all of the wind development areas summarized in this report, the most abundant falcon is the American kestrel, which often breeds locally in spring and summer but then migrates in the fall and is either absent or occurs at very low densities during the winter.” Response LS-9: Sentence reworked in small falcon section on page 28. One sentence now reads:
“American kestrels, which make up most of the use in this group, often breed locally in spring and summer but then migrate in the fall and are either absent or occur at very low densities during the winter (except for in some CA study areas).”

AVIAN AND BAT BASELINE DATA AND MORTALITY SYNTHESIS WEST, Inc. 114
Comment LS-10: Falcon section. Need a better transition beginning with sentence “Impact projections (# fatalities per turbine per year)...” Response LS-10: Removed those statements. Comment LS-11: Accipiter/Harrier section. Why combine accipiters and harriers? Response LS-11: These were combined out of convenience. Harriers make up >95% of observations. We have now separated out northern harriers from accipiters and provided results for both. Comment LS-12: Page 34, Passerines. Why don’t you present “Passerine” use like you do “raptors”. Response LS-12: Surveys and methods used for gathering avian use is most reliable for large birds such as raptors, waterfowl and waterbirds, and observers only recorded large birds at several projects. Comment LS-13: Be consistent with using “%” and “percent”, and number reporting (four-year versus 4-year). Response LS-13: Changes were made throughout the document for consistency.

AVIAN AND BAT BASELINE DATA AND MORTALITY SYNTHESIS WEST, Inc. 115
Comments from Gail McEwen, ODFW, Acting Land Resources Program Manager, Habitat Division Note: comments were included in a letter to WEST. Comment GM-1: The Department agrees that in some cases, particularly for sites in agricultural settings, the level of baseline data needed to adequately assess the expected impacts of a project on certain species may be reduced. However, the wording of Conclusion 2 (Conclusion 3 in this version), which states that baseline avian use data collected during one season appears adequate for making overall wind plant direct impact predictions in “most’ cases appears to overstate the data in the Meta-Analysis. Here are some examples: 1. Eagles. Page 23 of the Meta-Analysis states “Relatively high correlations exist between use
estimates among seasons (0.66 to 0.98), indicating eagle use in one season is indicative of eagle use in other seasons and for the entire year”.
This statement would not hold true for all species of eagles in all locations in Oregon. The report notes that approximately 95% of the eagle observations in these data sets are of golden eagles (page 23). Because bald eagles forage close to water they may be more concentrated in a given area than golden eagles. In addition, certain areas of Oregon (such as the Klamath Basin) have higher concentrations of bald eagles during winter and spring. In areas with high bald eagle concentrations during winter and spring, surveys conducted during the summer or fall would not be indicative of bald eagle use.
Response GM-1: We have changed the heading from “eagles” to “golden eagles”, so that it is understood the results are relevant to golden eagles and not bald eagles. See response 2 for additional changes to the details. Comment GM-2: Similar concern as in comment 1, but focused on falcons. 2. Falcons Section. Page 25 (draft) of the Meta-Analysis states:
“Falcons had the greatest variability in rankings of use as the number of seasons used in the calculations was varied. The only significant correlation was that between spring and summer use (0.70); the other season correlations ranged from –0.18 to 0.23 (Table 14). These correlations indicate that while spring and summer use data are similar to each other, they cannot be used to indicate falcon use at other times of the year. Similarly, data collected in the fall and winter can not be used to predict spring or summer use. Correlations of any one season to overall falcon use were moderate (0.55 to 0.69).”
Response GM- 2: We have separated the analysis of falcons into two groups, small falcons (primarily American kestrels) and large falcons (primarily prairie falcons) because of the difference in behavior and abundance of the two groups. The results for small falcons follow the previous results for all falcons (i.e., high variability). The results for large falcons show much less variability, and this group makes up a very small percentage of total falcon use. We have also added the list of groups the results are most relevant to (see below) Conclusion 3 (see response GM-1, originally conclusion 2).

AVIAN AND BAT BASELINE DATA AND MORTALITY SYNTHESIS WEST, Inc. 116
Comment GM-3: Similar concern as in comment 1 and 2, but focused on Waterfowl/Waterbirds.
Waterfowl/Waterbirds. Page 32 (28 in draft) of the Meta-Analysis states that “The correlation of overall ranks and ranks based on data from spring only and spring-summer only was approximately 0.7, but increased to 0.98 by including fall data, indicating moderate predictability of waterfowl use based on two seasons of data and good predictability of overall use with 3 seasons of data.” This information suggests that in cases where waterfowl or waterbirds are species of concern (due to the proximity of a project to open water for example), one season of baseline data might not be sufficient to assess a project’s potential impact on waterfowl.”
In addition, if a site contains multiple species of concern one season of baseline data might not adequately predict impacts for all species (for example, winter surveys might be best to predict a project’s impacts on Species A, but spring surveys might be best to predict a project’s impacts on Species B.) Response GM-3: See response GM-1 and GM-2 above, and we added two paragraphs to emphasize the need for targeted species/group surveys at some projects: Methods Section: “At some projects, additional species-specific data may have been collected that targeted a particular sensitive species. For example, mountain plover surveys were conducted on Foote Creek Rim prior to and after construction. Winter bald eagle surveys have been conducted at some projects where this species was of concern. This meta-analysis does not attempt to synthesize these species/project specific data sets, although we acknowledge that often these targeted surveys are required.” Results Section, Waterfowl/Waterbird Summary/Impact Projections: “Waterfowl and waterbird mortality has occurred at several wind projects, but apparently in very low numbers relative to the waterfowl/waterbird use of those sites. Correlations of seasonal use to overall use were moderate. At many of the Pacific Northwest sites in agricultural settings, most waterfowl use (especially Canada geese) occurred during the winter. If impacts to waterfowl are considered important at these sites, then surveys should be concentrated during the winter.” Comment GM-4: Page 1 of the Meta-Analysis states, “This report also suggests that the level of baseline data required to adequately assess expected impacts of some projects may be reduced.” We believe this statement is more consistent with the data in the Meta-Analysis than the wording of Conclusion 2. We recommend that Conclusion 2 be amended to be consistent with this statement. Response GM-4: Conclusion 2 has been reworded (see responses GM-1, GM-2 and GM-3).

AVIAN AND BAT BASELINE DATA AND MORTALITY SYNTHESIS WEST, Inc. 117
Comment GM-5: Conclusion 3 (now conclusion 4) reads (in part): “In many cases where baseline data or other information (e.g., historic data or habitat) indicate a
site has levels of raptor use considered high (e.g., between Foote Creek Rim and Altamont Pass estimates), we recommend collecting more than one season of data to refine predictions and to make micro-siting decisions.”
The Department agrees that more than one season of data may be needed in some cases to refine predictions and to make micro-siting decisions. We also agree that the amount of raptor use should be one of the factors considered to determine if micro-siting is warranted. Our concern is with using Foote Creek Rim and Altamont Pass estimates as benchmarks for determining whether raptor use at an Oregon project site is “high”. “High” raptor use should be determined by considering raptor use in the locality or state, not by comparison to raptor use in Wyoming and California. For example, the Klamath Basin has high winter raptor use. Birds have been observed following the ridgelines because of the juxtaposition between the ridges and lakes. If wind projects are proposed along these ridgelines, micro-siting (i.e. guiding placement of turbines within a project boundary) may be appropriate to reduce the potential for impacts on raptors, regardless of whether raptor use of the site reaches the level of use at Foot Creek Rim and Altamont Pass. We recommend that the reference to Foote Creek Rim and Altamont Pass estimates be deleted from Conclusion 3 (now 4). Response GM-5: Conclusion 4 (3 in original draft) now reads:
“In cases where baseline data or other information (e.g., historic data or habitat) indicate a site has levels of raptor use considered high (regionally high, or in comparison to use at other projects considered high [e.g., Altamont Pass (CA) and Foote Creek Rim (WY) golden eagle use estimates]), we recommend collecting more than one season of baseline data to refine predictions and to make micro-siting decisions that might reduce impacts....” We have furthermore added a new conclusion (2) that states:
2. “The amount and extent of ecological baseline data to collect at a wind project should be determined on a case-by-case basis. The decision should use information gained from this report, recent information from new projects (e.g., Stateline OR/WA), existing project site data from agencies and other knowledgeable groups/individuals, public scoping, and results of vegetation and habitat mapping. Other factors that should also be considered include the likelihood of the presence of sensitive species at the site and expected impacts to those species, project size and project layout.”

AVIAN AND BAT BASELINE DATA AND MORTALITY SYNTHESIS WEST, Inc. 118
Comments from David Mudd, WDFW, large projects
Note: comments were received via an email message. Comment DM-1: I would be interested in your thoughts about whether you intended this study to be interpreted as the final definitive word about seasonal vs. a year round survey. My reply has been if the proponents want to shift more uncertainty and risk to the public's wildlife resources, the proponents should be willing to offer up greater contingencies if monitoring results show the impacts are greater than expected. Response DM-1: We did not intend this report to be the final word regarding seasonal vs. a year round survey. We have synthesized the available data, and made some general recommendations regarding the level of baseline data that is likely sufficient to make relatively accurate impact predictions in a lot of cases. The data that is available now greatly enhances our ability to predict impacts at new projects. We have much less uncertainty because of the baseline and monitoring data collected at several new wind projects. Without this large source of information, we likely would be recommending more than one season worth of baseline data for predicting impacts. We do believe that an adaptive management approach should be used after the project is built and some operational monitoring data is collected. If the predictions of impacts are lower than what is estimated from operational monitoring data, then additional mitigation/monitoring may be appropriate. This adaptive management approach is recommended in cases where a full year of baseline data is collected, or one season is collected. We should also note that projects proposed in Kittitas County, Klickitat County, and Columbia County are collecting more than one season worth of data because of the recommendations made in the meta-analysis document. We have added a new conclusion that reinforces that the need for and the level of baseline data should be evaluated on a case-by-case basis.

AVIAN AND BAT BASELINE DATA AND MORTALITY SYNTHESIS WEST, Inc. 119
Jeff Bernowitz, WDFW, habitat biologist, Yakima Note: comments were received via an email message. Comment JB-1: As stated at the June 4th meeting, in my opinion, a rough analysis of the degree of threat to the species population needs to be incorporated. The number of birds killed doesn't mean much unless you have an idea of the initial population size, survival and reproductive potential, etc. If a wind project is expected to kill 20 buteos, some are likely to say this is a significant impact and the project shouldn't go through. If the 20 buteo's are red-tailed hawks, and the population is 5 million adults producing and estimated 5 million juv's with an 80% survival, I'd be inclined to think the mortality is insignificant or compensatory. Through such an analysis, we could hopefully get agreement on where to focus survey effort and/or mitigation. Response JB-1: We agree that the significance of the mortality should be evaluated by taking into account the population in question. In most cases, a “population level” impact can reasonably be excluded as a possibility because of the expected very low mortality and because of what is known regarding the abundance of the species. In most cases, this determination can be made with very little new data. When impacts to a “population” are even remotely possible, some evaluation of the likelihood of such impacts should be made based on the baseline data collected (e.g., raptor nesting) and other existing information.

AVIAN AND BAT BASELINE DATA AND MORTALITY SYNTHESIS WEST, Inc. 120
Comments from Dr. Burr Betts, Eastern Oregon College Comment BB-1: Bat Use and Mortality Section. Recent studies of silver-haired bats documented that reproductive females will roost in cavities in colonies. Response BB-1: Correction made and citation added.
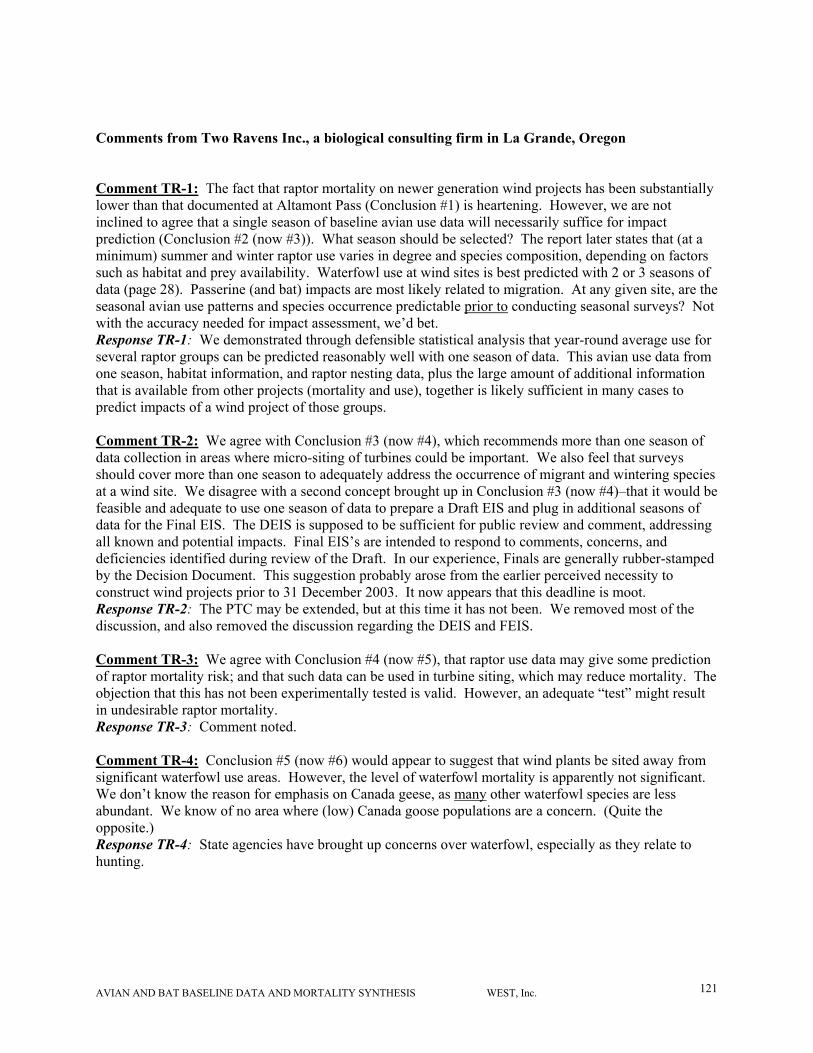
AVIAN AND BAT BASELINE DATA AND MORTALITY SYNTHESIS WEST, Inc. 121
Comments from Two Ravens Inc., a biological consulting firm in La Grande, Oregon Comment TR-1: The fact that raptor mortality on newer generation wind projects has been substantially lower than that documented at Altamont Pass (Conclusion #1) is heartening. However, we are not inclined to agree that a single season of baseline avian use data will necessarily suffice for impact prediction (Conclusion #2 (now #3)). What season should be selected? The report later states that (at a minimum) summer and winter raptor use varies in degree and species composition, depending on factors such as habitat and prey availability. Waterfowl use at wind sites is best predicted with 2 or 3 seasons of data (page 28). Passerine (and bat) impacts are most likely related to migration. At any given site, are the seasonal avian use patterns and species occurrence predictable prior to conducting seasonal surveys? Not with the accuracy needed for impact assessment, we’d bet. Response TR-1: We demonstrated through defensible statistical analysis that year-round average use for several raptor groups can be predicted reasonably well with one season of data. This avian use data from one season, habitat information, and raptor nesting data, plus the large amount of additional information that is available from other projects (mortality and use), together is likely sufficient in many cases to predict impacts of a wind project of those groups. Comment TR-2: We agree with Conclusion #3 (now #4), which recommends more than one season of data collection in areas where micro-siting of turbines could be important. We also feel that surveys should cover more than one season to adequately address the occurrence of migrant and wintering species at a wind site. We disagree with a second concept brought up in Conclusion #3 (now #4)–that it would be feasible and adequate to use one season of data to prepare a Draft EIS and plug in additional seasons of data for the Final EIS. The DEIS is supposed to be sufficient for public review and comment, addressing all known and potential impacts. Final EIS’s are intended to respond to comments, concerns, and deficiencies identified during review of the Draft. In our experience, Finals are generally rubber-stamped by the Decision Document. This suggestion probably arose from the earlier perceived necessity to construct wind projects prior to 31 December 2003. It now appears that this deadline is moot. Response TR-2: The PTC may be extended, but at this time it has not been. We removed most of the discussion, and also removed the discussion regarding the DEIS and FEIS. Comment TR-3: We agree with Conclusion #4 (now #5), that raptor use data may give some prediction of raptor mortality risk; and that such data can be used in turbine siting, which may reduce mortality. The objection that this has not been experimentally tested is valid. However, an adequate “test” might result in undesirable raptor mortality. Response TR-3: Comment noted. Comment TR-4: Conclusion #5 (now #6) would appear to suggest that wind plants be sited away from significant waterfowl use areas. However, the level of waterfowl mortality is apparently not significant. We don’t know the reason for emphasis on Canada geese, as many other waterfowl species are less abundant. We know of no area where (low) Canada goose populations are a concern. (Quite the opposite.) Response TR-4: State agencies have brought up concerns over waterfowl, especially as they relate to hunting.
AVIAN AND BAT BASELINE DATA AND MORTALITY SYNTHESIS WEST, Inc. 122
Comment TR-5: Proximity of nesting raptors does not appear to be predictive of collision mortality (Conclusion #7). However, we feel that nest surveys should be conducted at wind sites to allow tower siting decisions that minimize raptor nest disturbance. Response TR-5: Raptor nest surveys are conducted at most new wind projects to identify locations of nests in relationship to location of project facilities. This information is used in siting turbines and in possible construction timing restrictions. Comment TR-6: Regarding bats (Conclusions #8 through 11 in original, now #9-11), we are not convinced that wind generating facilities are not having a substantial impact on bats. Although resident bats do not appear to be affected, mortality of migrants could certainly be affecting populations somewhere. The period of record for bat mortality data (3-4 years?) may not be long enough to register the kind of massive decline that might need to occur to actually decrease the number of migrant bats killed in successive years. As noted in the text, bats have a relatively low reproductive rate. Unlike the case of birds, or larger mammals, there are no solid distribution or abundance data for bats. This leaves bats as a vexing problem. If we don’t know how many we have, where they live, or what their habits are, how are we to adequately assess impacts? We have no answer for this concern. As noted in Conclusion #9, most bats being killed are probably high-flying, non-echo-locating migrants. There is currently no way to survey such animals. Response TR-6: We have qualified the conclusion regarding bat population impacts so that it is clear the statement pertains to Buffalo Ridge and that it is a preliminary result based on 5 years of bat mortality data. Some studies are being conducted to better understand the wind turbine/bat interactions as noted in the text. Comment TR-7: We found the report somewhat repetitive. The 8+ page Executive Summary includes (verbatim) the same two pages of Overall Conclusions that appear at the end of the report. Response TR-7: We included the conclusions in both the Executive Summary and the main body of the report because some may only read the Executive Summary. Comment TR-8: We appreciate the vast amount of data summarized by the report, but found many instances of overly complex, confusing, or poor wording. This was especially evident in the raptor sections, during discussion of average and overall, seasonal and site-specific, use indices. Response TR-8: We attempted to clarify some of the text when discussing seasonal raptor use data, although the large amount of data used in the report makes it difficult to present the results in much more of a reduced form. We believe the Executive Summary provides that reduced form. Comment TR-9: The PTC discussion should be revised or removed if recent Congressional action has rendered the 31 December 2003 deadline moot. Response TR-9: The PTC may be extended, but at this time it has not been. We have removed most of the discussion of the PTC. Comment TR-10: We disagree with the statement that great horned owls are among the species efficiently surveyed from the air. Nests in inconspicuous potholes and abandoned buildings are quite common. Plus nesting chronology frequently puts their fledging date ahead of normal buteo survey timing. Response TR-10: More than one survey is often conducted to better represent the variations in timing of nesting. We agree with the comment regarding great horned owl nest locations and have changed the wording of the text to: “We included raptor species that are efficiently surveyed from the air (e.g., buteos, eagles, great horned owl nests in trees)...”
AVIAN AND BAT BASELINE DATA AND MORTALITY SYNTHESIS WEST, Inc. 123
Comment TR-11: The attempt to define biologically-based (rather than calendar-based) “seasons” is admirable. Even so, these may not apply equally well in the wide variety of regions covered in this report. Response TR-11: Comment noted, but we felt the approach was reasonable. Comment TR-12: It would be appropriate to note in Methods that “correlations” of seasonal avian use estimates are Pearson correlation factors. This bit of information must otherwise be discovered in Table 8. Response TR-12: We added the term “Pearson” correlations in the methods. Comment TR-13: We dispute the assertion that “the typical flight heights of diurnal raptors have been found to be lower than the rotor-sweep height of the new-generation turbine blades...” (later given as 25 meters). In our experience, typical raptor flights (except for northern harriers) often include periods at heights equal to or greater than 25 meters. Response TR-13: The statement was removed. The intent was to emphasize the stooping and hunting behaviors of golden eagles observed at Altamont, but that was not conveyed by the statement. Comment TR-14: There is an apparent contradiction in falcon discussion. Page 25 (original draft) states that American kestrels migrate out of WRAs in fall, but Page 26 (original draft) states that highest mean falcon use is in fall, and this is attributed to American kestrels. Response TR-14: Statement clarified:
“American kestrels, which make up most of the use in this group, often breed locally in spring and summer but then migrate in the fall and are either absent or occur at very low densities during the winter (except for some CA study areas).”
Comment TR-15: We question the value of combining and averaging the seasonal estimates of raptor use at all sites in all regions. Impacts need to be assessed on a case-by-case or site-by-site basis. When the locations of sites in the analysis range from CA÷WA÷OR÷WY÷MN÷TN, there will certainly be regional (and probably site-specific) differences in raptor species and use levels. We do not find the average across the various regions terribly meaningful. However, the range of use among the sites gives one an idea of the range in impacts that might be expected. Response TR-15: Impact assessment is made on a site-by-site or case by case basis using all available information, including data on raptor use and mortality (e.g., for buteos) from other projects. The average use, ranges and variability are discussed throughout the document and all three parameters as well as direct mortality estimates from projects are useful for predicting impacts at a new project. Comment TR-16: Were accipiters and harriers combined (Page 27 original draft) merely because they were raptors of relatively minor occurrence? There are no behavioral or biological reasons to lump these species–flight habits, prey, and habitat use differ greatly. Response TR-16: We combined accipiters and harriers out of convenience, but these have been separated in the final version.

AVIAN AND BAT BASELINE DATA AND MORTALITY SYNTHESIS WEST, Inc. 124
Comment TR-17: A short description of the method of calculating estimated avian and bat mortality would be appropriate. We assume the estimate is based on the number of carcasses found, adjusted for search bias factors (as noted for bats on Table 21). We would also assume some adjustment factor for the probability that scavengers and predators carry off some carcasses. If this latter factor is not included, mortality estimates are probably very conservative. Response TR-17: The bird mortality estimates include adjustments for searcher efficiency and scavenging. For a discussion of the estimators see (Erickson et al. 2000a) and other references in the document. We have included some discussion of the conservative nature of the estimates (over estimate of true fatality rates), because fatalities where cause of death cannot be determined are often included in the estimates. Comment TR-18: The details and history of bat collisions (Page 32 original draft), while interesting, could probably be reduced to a couple of sentences indicating that the phenomenon has been known to exist. Response TR-18: We are glad you feel the discussions of details and history of bat collisions are interesting. We decided to include this discussion because this information is likely not readily available, and because we were asked to provide detail on the interactions of bats and wind turbines from Oregon Department of Fish and Wildlife. Comment TR-19: We are told in the bat results section that bat mortality at lighted and unlighted turbines at Buffalo Ridge was roughly equal. Were the proportions of lighted and unlighted turbines roughly equal as well? If so, say so. Response TR-19: We clarified that approximately half of the turbines sampled were lighted, and the other half were not lighted.