Embed Size (px)
Citation preview

SYNTHESIS AND OPTIMIZATION OF APPLICATION-SPECIFICINTRANETS
by
Sami J. Habib
A Dissertation Presented to the
FACULTY OF THE GRADUATE SCHOOL
UNIVERSITY OF SOUTHERN CALIFORNIA
In Partial Ful�llment of the
Requirements for the Degree
DOCTOR OF PHILOSOPHY
(Computer Engineering)
August 2001
Copyright 2001 Sami J. Habib


Dedication
In memory of my father.
ii

Acknowledgments
I would like to take this opportunity to recognize the guidance, support, friend-ship and love of many people that made this dissertation into a reality. I am greatlyfortuned to know and work with Professor Alice C. Parker, who has guided meto develop my technical skills as a design automation researcher but also for herunyielding encouragement and advices throughout the years.
I would like to thank Professor B. Cli�ord Neuman for his insightful discussionsthat helped me to understand a lot of issues in distributed systems, for his valuablecomments on my proposal and dissertation and for serving on my guidance anddissertation committees. I also would like to thank Professor James E. Moore forhis interest in my thesis problem, for his feedbacks on dissertation and for servingon my guidance and dissertation committees.
I also would like to thank Professor Daniel C. Lee for his insightful discussionsthat helped me to understand a lot of issues in network design and performance,and for serving on my guidance committee. I also would like to thank ProfessorJohn Silvester for many discussions, which helped me to understand a lot of issuesin network design and for serving on my guidance committee. I also thank ProfessorJean-Luc Gaudiot for serving on my guidance committee.
I would like to express my sincere gratitude to my mother, sisters and brothersfor their love and continuous support through years.
I am very indebted to my wife Amal and my son Fouad for their unlimited loveand patient so that I can purse my graduate study.
This research is supported in part by a scholarship from Kuwait University, inpart by a USC Zumberge funding, and in part by the Advanced Research ProjectAgency (DARPA) under contract 53-4503-9319 and monitored by the Federal Bu-reau of Investigation (FBI) under contract J-FBI-94-161. The information reportedin this dissertation does not necessarily re ect the position or the policy of theseorganizations. I would like to thank these organizations for their �nancial supports.
iii
Contents
Dedication ii
Acknowledgments iii
List Of Figures ix
List Of Tables xi
Abstract xiii
1 Introduction 11.1 Background : : : : : : : : : : : : : : : : : : : : : : : : : : : : : : : : 11.2 The Intranet Integration Problem : : : : : : : : : : : : : : : : : : : : 21.3 i -CAD: A Capacity Planning Tool : : : : : : : : : : : : : : : : : : : : 41.4 Motivation Behind i -CAD : : : : : : : : : : : : : : : : : : : : : : : : 61.5 Thesis Organization : : : : : : : : : : : : : : : : : : : : : : : : : : : : 10
2 An Overview of Intranet Design Model 122.1 Background : : : : : : : : : : : : : : : : : : : : : : : : : : : : : : : : 122.2 Intranet Model : : : : : : : : : : : : : : : : : : : : : : : : : : : : : : 132.3 Example: Animation Production Studio : : : : : : : : : : : : : : : : 14
3 Related Research 183.1 Background : : : : : : : : : : : : : : : : : : : : : : : : : : : : : : : : 183.2 Network Synthesis : : : : : : : : : : : : : : : : : : : : : : : : : : : : 18
3.2.1 Classical Network Synthesis : : : : : : : : : : : : : : : : : : : 193.2.1.1 Abstract Network Solution Approach : : : : : : : : : 203.2.1.2 Concrete Network Solution Approach : : : : : : : : : 26
3.2.2 Teleprocessing Network Synthesis : : : : : : : : : : : : : : : : 323.2.3 Combined File Allocation and Network Synthesis : : : : : : : 33
3.3 Design Automation Tools : : : : : : : : : : : : : : : : : : : : : : : : 343.3.1 Synthesis Tools for the System Level : : : : : : : : : : : : : : 353.3.2 Evolutionary Computations as Optimization Techniques : : : 37
iv

3.4 Multimedia Systems : : : : : : : : : : : : : : : : : : : : : : : : : : : 373.4.1 Data Caching : : : : : : : : : : : : : : : : : : : : : : : : : : : 38
4 The Design Problem Model 404.1 Background : : : : : : : : : : : : : : : : : : : : : : : : : : : : : : : : 404.2 Network Design Constraints : : : : : : : : : : : : : : : : : : : : : : : 42
4.2.1 Group Network Constraints : : : : : : : : : : : : : : : : : : : 464.2.2 Site Network Constraints : : : : : : : : : : : : : : : : : : : : : 484.2.3 Backbone Network Constraints : : : : : : : : : : : : : : : : : 52
4.3 Network Design Objective Function : : : : : : : : : : : : : : : : : : : 594.3.1 Network Hardware Component Cost : : : : : : : : : : : : : : 60
4.3.1.1 Group Network Cost : : : : : : : : : : : : : : : : : : 614.3.1.2 Site Network Cost : : : : : : : : : : : : : : : : : : : 614.3.1.3 Backbone Network Cost : : : : : : : : : : : : : : : : 62
4.3.2 Network Interconnection Cost : : : : : : : : : : : : : : : : : : 634.3.2.1 Group Interconnection Cost : : : : : : : : : : : : : : 644.3.2.2 Site Interconnection Cost : : : : : : : : : : : : : : : 64
4.3.3 Network Wire Cost : : : : : : : : : : : : : : : : : : : : : : : : 654.3.3.1 Group Wire Cost : : : : : : : : : : : : : : : : : : : : 654.3.3.2 Site Wire Cost : : : : : : : : : : : : : : : : : : : : : 664.3.3.3 Backbone Wire Cost : : : : : : : : : : : : : : : : : : 66
4.4 Data Management Design Constraints : : : : : : : : : : : : : : : : : 664.4.1 Data Management Hardware Placement Constraints : : : : : : 704.4.2 File Allocation Constraints : : : : : : : : : : : : : : : : : : : : 73
4.5 Data Management Design Objective Function : : : : : : : : : : : : : 744.6 Intranet Integration Objective Function : : : : : : : : : : : : : : : : : 75
5 The Performance Model 765.1 Background : : : : : : : : : : : : : : : : : : : : : : : : : : : : : : : : 765.2 Network Performance Constraints : : : : : : : : : : : : : : : : : : : : 78
5.2.1 Network Capacity Constraints : : : : : : : : : : : : : : : : : : 785.2.2 Average Network Delay Constraint : : : : : : : : : : : : : : : 82
5.3 The Network Delay Model : : : : : : : : : : : : : : : : : : : : : : : : 835.4 Data Management Performance Constraint : : : : : : : : : : : : : : : 885.5 Monte Carlo Simulation : : : : : : : : : : : : : : : : : : : : : : : : : 89
6 i -CAD: Intranet Computer-Aided Design Tool 926.1 Background : : : : : : : : : : : : : : : : : : : : : : : : : : : : : : : : 926.2 Overview of Genetic Algorithms : : : : : : : : : : : : : : : : : : : : : 93
6.2.1 Advantages of Genetic Algorithms : : : : : : : : : : : : : : : : 956.3 i -CAD Implementation : : : : : : : : : : : : : : : : : : : : : : : : : : 97
6.3.1 Chromosome Representation : : : : : : : : : : : : : : : : : : : 976.3.2 Initial Population : : : : : : : : : : : : : : : : : : : : : : : : : 102
v

6.3.3 Fitness of A Chromosome : : : : : : : : : : : : : : : : : : : : 103
6.3.4 Selection Mechanism : : : : : : : : : : : : : : : : : : : : : : : 104
6.3.5 Mutation Operator : : : : : : : : : : : : : : : : : : : : : : : : 104
6.3.6 Crossover Operator : : : : : : : : : : : : : : : : : : : : : : : : 106
6.3.7 Termination Condition : : : : : : : : : : : : : : : : : : : : : : 109
6.4 Avoiding Sub-Optimal Solutions : : : : : : : : : : : : : : : : : : : : : 109
7 Experimental Results 111
7.1 Background : : : : : : : : : : : : : : : : : : : : : : : : : : : : : : : : 111
7.2 A Partial Animation Studio: Network Design : : : : : : : : : : : : : 112
7.2.1 Experiment 1: Partial Animation Studio with Local Backbone
Topology : : : : : : : : : : : : : : : : : : : : : : : : : : : : : : 113
7.2.2 Experiment 2: Partial Animation Studio with Wide Backbone
Topology : : : : : : : : : : : : : : : : : : : : : : : : : : : : : : 121
7.3 Complete Intranet Integration for A Partial Animation Studio : : : : 128
7.3.1 Experiment 3: Partial Animation Studio with Local Backbone
Topology : : : : : : : : : : : : : : : : : : : : : : : : : : : : : : 132
7.3.2 Experiment 4: Partial Animation Studio with Wide Backbone
Topology : : : : : : : : : : : : : : : : : : : : : : : : : : : : : : 140
7.4 Complete Intranet Integration for A Full Animation Studio : : : : : : 147
7.4.1 Experiment 5: Full Animation Studio with Local Backbone
Topology : : : : : : : : : : : : : : : : : : : : : : : : : : : : : : 151
7.4.2 Experiment 6: Full Animation Studio with Wide Backbone
Topology : : : : : : : : : : : : : : : : : : : : : : : : : : : : : : 155
8 Conclusions and Future Work 160
8.1 Conclusion : : : : : : : : : : : : : : : : : : : : : : : : : : : : : : : : : 160
8.2 Contributions : : : : : : : : : : : : : : : : : : : : : : : : : : : : : : : 162
8.2.1 Thesis Contributions : : : : : : : : : : : : : : : : : : : : : : : 162
8.2.2 Related Contributions : : : : : : : : : : : : : : : : : : : : : : 164
8.3 Future Research : : : : : : : : : : : : : : : : : : : : : : : : : : : : : : 165
8.3.1 Intranet Model Enhancements : : : : : : : : : : : : : : : : : : 165
8.3.2 i-CAD Re�nement : : : : : : : : : : : : : : : : : : : : : : : : 165
8.3.3 Intranet Redesign : : : : : : : : : : : : : : : : : : : : : : : : : 166
8.3.4 i -CAD: Complete Synthesis and Analysis Tool : : : : : : : : : 166
Reference List 167
Appendix A
i -CAD Outputs : : : : : : : : : : : : : : : : : : : : : : : : : : : : : : : : : 175
A.1 Experiment 1 : : : : : : : : : : : : : : : : : : : : : : : : : : : : : : : 175
A.2 Experiment 2 : : : : : : : : : : : : : : : : : : : : : : : : : : : : : : : 189
A.3 Experiment 3 : : : : : : : : : : : : : : : : : : : : : : : : : : : : : : : 206
vi

A.4 Experiment 4 : : : : : : : : : : : : : : : : : : : : : : : : : : : : : : : 224
A.5 Experiment 5 : : : : : : : : : : : : : : : : : : : : : : : : : : : : : : : 242
A.6 Experiment 6 : : : : : : : : : : : : : : : : : : : : : : : : : : : : : : : 251
Appendix B
The Design Libraries : : : : : : : : : : : : : : : : : : : : : : : : : : : : : : 262
vii

List Of Figures
1.1 The view of the basic structure of i -CAD. : : : : : : : : : : : : : : : 5
2.1 Full task ow graph for an example animation �lm studio. : : : : : : 162.2 Partial task ow graph for an example animation �lm studio. : : : : : 17
4.1 An overview of the data management model. : : : : : : : : : : : : : : 414.2 An overview of the network model. : : : : : : : : : : : : : : : : : : : 424.3 Group network allocation and binding variables. : : : : : : : : : : : : 474.4 Site network allocation and binding variables. Only one allocation
and binding will be selected per site task. : : : : : : : : : : : : : : : : 504.5 Backbone network allocation and binding variables. Only one option
will be selected for the backbone task. : : : : : : : : : : : : : : : : : 554.6 Local network interfaces between site networks and backbone networks. 594.7 Wide network interfaces between site networks and backbone networks. 604.8 The possible data management system design structures. : : : : : : : 67
5.1 The Monte Carlo Simulation. : : : : : : : : : : : : : : : : : : : : : : 91
6.1 The overall structure of i -CAD tool. : : : : : : : : : : : : : : : : : : 936.2 The structure of genetic algorithms. : : : : : : : : : : : : : : : : : : : 946.3 Searching the design space with genetic algorithms. : : : : : : : : : : 966.4 A tree representation of an intranet application in Figure 2.2. : : : : 986.5 Embedded network design array for a backbone node. : : : : : : : : : 1006.6 Embedded network design array for a site node. : : : : : : : : : : : : 1016.7 Embedded network and data management design arrays for a group
node. : : : : : : : : : : : : : : : : : : : : : : : : : : : : : : : : : : : : 1026.8 Flow diagram for the mutation operator. : : : : : : : : : : : : : : : : 1056.9 One possible example of a crossover. : : : : : : : : : : : : : : : : : : 1076.10 Flow diagram for the crossover operator. : : : : : : : : : : : : : : : : 108
7.1 Optimization process for 3-level network design with TND = 60.0seconds. : : : : : : : : : : : : : : : : : : : : : : : : : : : : : : : : : : 115
7.2 Optimization process for 3-level network design with TND = 5.0 sec-onds. : : : : : : : : : : : : : : : : : : : : : : : : : : : : : : : : : : : : 116
viii

7.3 A 3-level network for partial animation studio intranet (TND = 60.0seconds). : : : : : : : : : : : : : : : : : : : : : : : : : : : : : : : : : : 117
7.4 A 3-level network for partial animation studio intranet (TND = 5.0seconds). : : : : : : : : : : : : : : : : : : : : : : : : : : : : : : : : : : 118
7.5 Network design cost versus threshold network delay. : : : : : : : : : : 1207.6 Locations of the four site tasks within the City of Los Angeles, Cali-
fornia, USA. : : : : : : : : : : : : : : : : : : : : : : : : : : : : : : : : 1227.7 Optimization process for 3-level network design with a tree backbone
topology when TDN = 60.0 seconds. : : : : : : : : : : : : : : : : : : 1237.8 Optimization process for 3-level network design with a tree backbone
topology when TDN = 6.0 seconds. : : : : : : : : : : : : : : : : : : : 1247.9 Network design cost versus threshold network delay. : : : : : : : : : : 1257.10 A partial animation studio intranet (TND = 60.0 seconds). : : : : : : 1267.11 A partial animation studio intranet (TND = 6.0 seconds). : : : : : : 1277.12 Optimization curves for the partial animation intranet with TND =
60.0 seconds and four servers. : : : : : : : : : : : : : : : : : : : : : : 1337.13 Optimization curves for the partial animation intranet with TND =
20.0 seconds and four servers. : : : : : : : : : : : : : : : : : : : : : : 1347.14 A partial animation studio intranet with TND = 60.0 seconds and
four servers. : : : : : : : : : : : : : : : : : : : : : : : : : : : : : : : : 1377.15 A partial animation studio intranet with TND = 20.0 seconds and
four servers. : : : : : : : : : : : : : : : : : : : : : : : : : : : : : : : : 1387.16 Intranet design cost versus delay. : : : : : : : : : : : : : : : : : : : : 1397.17 Optimization curves for the partial animation intranet with TND =
50.0 seconds and three servers. : : : : : : : : : : : : : : : : : : : : : : 1417.18 Optimization curves for the partial animation intranet with TND =
10.0 seconds and three servers. : : : : : : : : : : : : : : : : : : : : : : 1437.19 A partial animation studio intranet with TND = 50.0 seconds and
three servers. : : : : : : : : : : : : : : : : : : : : : : : : : : : : : : : 1457.20 A partial animation studio intranet with TND = 10.0 seconds and
three servers. : : : : : : : : : : : : : : : : : : : : : : : : : : : : : : : 1467.21 Intranet design cost versus threshold network delay. : : : : : : : : : : 1477.22 Optimization curves for the full animation intranet with TND = 180.0
seconds and �ve servers. : : : : : : : : : : : : : : : : : : : : : : : : : 1527.23 Optimization curves for the partial animation intranet with TND =
20.0 seconds and four servers. : : : : : : : : : : : : : : : : : : : : : : 1537.24 Locations of the six site tasks within the City of Los Angeles, Cali-
fornia, USA. : : : : : : : : : : : : : : : : : : : : : : : : : : : : : : : : 1557.25 Optimization process for a full animation studio with a tree backbone
topology when TDN = 60.0 seconds and 7 servers. : : : : : : : : : : : 1567.26 Optimization process for a full animation studio with a tree backbone
topology when TDN = 30.0 seconds and 7 servers. : : : : : : : : : : : 158
ix

List Of Tables
3.1 Summary of abstract approach papers. : : : : : : : : : : : : : : : : : 253.2 Summary of concrete approach papers. : : : : : : : : : : : : : : : : : 313.3 The design automation hierarchy. : : : : : : : : : : : : : : : : : : : : 35
4.1 A client location table (CLT). : : : : : : : : : : : : : : : : : : : : : : 434.2 A data request table (DRT). : : : : : : : : : : : : : : : : : : : : : : : 69
5.1 A client tra�c matrix (CTM), where a CT denotes a client task. : : : 77
7.1 Client and group clustering information. : : : : : : : : : : : : : : : : 1127.2 Tra�c ow among site and group tasks. : : : : : : : : : : : : : : : : 1137.3 A site tra�c matrix (STM). : : : : : : : : : : : : : : : : : : : : : : : 1147.4 Hand-computed 3-level network designs. : : : : : : : : : : : : : : : : 1197.5 i -CAD run-time for Experiment 1. : : : : : : : : : : : : : : : : : : : 1217.6 i -CAD run-time for Experiment 2. : : : : : : : : : : : : : : : : : : : 1287.7 A data request table (DRT) for the partial animation studio. : : : : : 1307.8 Data management tra�c ow within group tasks. : : : : : : : : : : : 1317.9 Data management system with TND = 20.0 seconds. : : : : : : : : : 1397.10 Data management system with TND = 30.0 seconds. : : : : : : : : : 1407.11 Client and group clustering information. : : : : : : : : : : : : : : : : 1487.12 Tra�c ow assignment for experiments 5 and 6. : : : : : : : : : : : : 1497.13 A site tra�c matrix (STM) for the full animation studio. : : : : : : : 1497.14 The rest of data request table (DRT) for the full animation studio. : 1507.15 Data management tra�c ow within group tasks 9 to 14. : : : : : : : 151
B.1 Server library. : : : : : : : : : : : : : : : : : : : : : : : : : : : : : : : 262B.2 Hard Disk library. : : : : : : : : : : : : : : : : : : : : : : : : : : : : : 263B.3 Wire/cable library. : : : : : : : : : : : : : : : : : : : : : : : : : : : : 263B.4 Bridge library. : : : : : : : : : : : : : : : : : : : : : : : : : : : : : : : 264B.5 Ethernet Hub library. : : : : : : : : : : : : : : : : : : : : : : : : : : : 265B.6 ATM switch library. : : : : : : : : : : : : : : : : : : : : : : : : : : : 266B.7 Router library. : : : : : : : : : : : : : : : : : : : : : : : : : : : : : : 267B.8 T-carrier library. : : : : : : : : : : : : : : : : : : : : : : : : : : : : : 268B.9 SONET library. : : : : : : : : : : : : : : : : : : : : : : : : : : : : : : 268
x

B.10 Virtual Private Network (VPN) library. : : : : : : : : : : : : : : : : : 269B.11 Group-site interconnection network cost matrix. : : : : : : : : : : : : 270B.12 Site-backbone interconnection network cost matrix. : : : : : : : : : : 270
xi

Abstract
E�ective and e�cient content-distribution networks are a requirement for data-intensive applications like multimedia, which are not only characterized by massivedata storage and communication bandwidth requirements, but how these charac-teristics are integrated. This thesis describes the computer-aided design of largenetworked systems, including the data management and the network architecture.In particular, the systems focused on are intranets supporting speci�c applicationdomains like animated feature production or telemedicine. We de�ne and solve thecomplete intranet integration problem to be automated as a combination of twointerdependent sub-problems: data management system design and network archi-tecture design.
Data management system design consists of server placement and �le allocation.The server placement problem is to determine the number, type, storage capacity,and process capacity of servers, while minimizing their placement costs. In addition,the problem includes binding each client to a server and uniting all servers as onelogical distribution data system. The �le allocation problem is to �nd locations tostore copies of the �les most frequently accessed by the clients in their local servers,while minimizing the storage and retrieval costs. The network architecture designproblem is to determine the network topology along with the network technology thatenables all clients to communicate and access servers e�ciently, while minimizingthe network cost.
The intranet integration problem is a large combinatorial optimization problem.Guaranteeing to �nd optimal solutions would require a prohibitive amount of time.The solution presented in the thesis is a custom-built genetic computer-aided designtool, i -CAD, that attempts to optimize the intranet design, but does not guaran-tee optimality. i -CAD is a novel software tool that is based on an evolutionaryapproach to search the design space for minimal intranet integration cost while sat-isfying both design and performance constraints. From the experimental results onseveral animation production studios' intranets, i -CAD demonstrates the feasibilityof automatic intranet design in a short time.
xii

Chapter 1
Introduction
1.1 Background
This thesis describes a new direction for design automation by focusing on the design
of large hardware systems that involve a data management system and a network ar-
chitecture. This new direction moves system-level synthesis from designing a system
that consists of processors, memory and input/output, which all are integrated into a
single multiprocessor; into a system that consists of many geographically-distributed
network nodes (clients and servers), which need a communication network and a
database system in order to perform a number of cooperative periodic tasks. This
thesis addresses only the hardware design of application-speci�c intranets in order
to reduce the problem to a form amenable to solution in a limited time, rather than
including the intranet protocol con�guration, and other related software problems.
A designer/planner of an enterprise's intranet must choose from literally millions
of data management system and network architecture integration possibilities for
a given intranet multimedia application. Applications supported by intranets have
certain requirements, such as high communication bandwidth, large storage space,
high transfer rate and delay bounds. Moreover, infrastructures designed for intranets
have certain characteristics that must be determined by the designer, including a
network topology, type of network technology (such as switch, multiaccess device,
1

bridge, router, T-carrier, SONET and/or virtual private network) and data manage-
ment system (the number, type, locations, process capacity, and storage capacity of
servers/proxies, and the allocation of �les into the servers/proxies). In many cases,
the design space is too large for intranet designers/planners to determine manually
which intranet integration can satisfy the enterprise application requirements with
minimal design cost. Automated capacity planning tools are needed.
1.2 The Intranet Integration Problem
The automatic integration of a complete intranet has not been attempted previously,
and has not been reported in the research literature, to our knowledge. The de�-
nition of the problem itself had never been performed previously, and constituted a
research e�ort spanning more than three years. The intranet integration problem
has three aspects that distinguish our research problem. These aspects are network
heterogeneity, network hierarchy and data management. Our capacity planning tool
is able to integrate a mix of network topologies and technologies (heterogeneity),
design a multi-level network (hierarchy), and place storage locations for �les (data
management). All these aspects are performed simultaneously.
We de�ne the intranet integration problem as a combination of two interdepen-
dent sub-problems: data management system design and network architecture
design. The data management system problem consists of the server placement
problem and the �le allocation problem. The server placement problem is to
determine the number, type, locations, storage capacity and process capacity of
servers/proxies, while minimizing their placement costs. In addition, the problem
includes binding each client to a server and uniting all servers as one logical dis-
tribution data system. The �le allocation problem is to �nd a number of storage
locations (servers) to store copies of the most frequently accessed �les by clients in
their local servers, while minimizing the storage and retrieval costs. The solution for
the data management system design problem can be used by the intranet's clients
2

to store/retrieve shared �les; moreover, the database manager of an intranet can
use such information for content distribution. The network architecture problem
includes determining network topology along with the network technology, such as
switch, multiaccess device, router, bridge, T-carrier, VPN and/or SONET, that en-
ables all clients to communicate and access �le servers e�ciently, while minimizing
the network hardware cost.
The outcomes of the two sub-problems, data management system design and
network architecture design, are interrelated; therefore, we formulate them as one
combined optimization problem. For example, if we design the network architecture
without considering the number of �le servers and their tra�c ow, then the designed
network may not handle the �le servers due to the lack of network connection ports
and/or network bandwidth capacity. Otherwise, for example if we place the �le
servers without considering the network's constraints, then we may not achieve a
feasible network design because we cannot access the data to meet performance
constraints. If we place the �le servers without considering the number and size of the
�les, then the allocated �le servers may not be able to store and process all the �les,
for example. Also, we cannot allocate the �les without placing the �le servers �rst.
However, the combined optimization problem is a very complicated combinatorial
optimization problem. Therefore, guaranteeing to �nd optimal solutions would may
require a prohibitive amount of time, since there are literally millions of possible
data management systems and network architectures for a given intranet.
In summary, the following are the problem inputs and outputs:
� The problem inputs include
{ A client location matrix, client tra�c matrix and data request matrix.
{ An objective function specifying the overall intranet infrastructure cost.
{ A set of constraints specifying the network and data management design
requirements.
3

{ A set of constraints specifying the network and data management perfor-
mance requirements.
{ design libraries specifying all available network and server resources in-
cluding their characteristics, such as capability, cost and performance
parameters.
� The problem output is an optimized intranet infrastructure, including
{ the number, type, locations, processing capacity, and storage capacity of
all �le servers,
{ the storage locations for all �les, and
{ the number, type and capacity of all network hardware devices, such as
switch, multiaccess device, router, bridge, leased line, SONET leased line
and virtual private connector.
1.3 i-CAD: A Capacity Planning Tool
To �nd a good solution for the intranet integration optimization problem, we de-
veloped an intranet computer-aided design tool, i -CAD, based on evolutionary ap-
proach [HP00, HPL01]. i -CAD is a suite of techniques and a software tool that
can automatically synthesize data management systems and network architectures
together as an application-speci�c intranet, while minimizing the design cost and
satisfying the design and performance constraints. i -CAD uses a genetic algorithm,
a probabilistic algorithm maintaining a population of possible intranets for each iter-
ation of the algorithm. Each intranet is evaluated to give some measure of its �tness.
Then, a new population is formed by selecting the more �t intranets. Some members
of the new population undergo transformation by means of genetic operators to form
new intranets.
4

The basic structure of i -CAD consists of three main procedures as depicted in
Figure 1.1. The �rst procedure creates the initial intranet population by selecting all
network and data management hardware resources randomly. The �rst procedure
executes only once. The second procedure validates and evaluates each intranet
in the current population. The third procedure selects the �t intranets, modi�es
some and discards the rest. The second and third procedures execute inde�nitely
until all the design and performance constraints are satis�ed and either the cost is
acceptable to the user or the cost improvements are diminishing and insigni�cant.
All the design and performance constraints, and the objective function are encoded
within the internal structure of i -CAD.
network design libraries
threshold data management performance (TDMP)data management design libraries
optimized intranet population
Procedure 1: initial intranet generation
Procedure 2: intranet validation and evaluation
Procedure 3: intranet selection and optimization
loop untilall constraintsare satisfied
client location table (CLT)client traffic matrix (CTM)data request table (DRT)
threshold network delay (TND)
Figure 1.1: The view of the basic structure of i -CAD.
5

The inputs to i -CAD are application inputs that are speci�c to the problem
and tool inputs that represent data independent of the application. The applica-
tion inputs include the following: client location table (CLT), client tra�c matrix
(CTM), data request table (DRT), threshold network delay (TND), and threshold
data management performance (TDMP). The client location table (CLT) represents
the physical location of each client within the intranet. The client tra�c matrix
(CTM) represents the average tra�c requirements between all clients. The data
request table (DRT) represents the access rate of each �le by all clients. The CLT,
CTM and DRT vary from application to application. The threshold network delay
(TND) is a real number given by the designer to insure that the average network
delay (AND) of a synthesized intranet's network never exceeds the TND. The thresh-
old data management performance (TDMP) is a real number given by the designer
to insure that each placed server/proxy can minimally achieve TDMP.
The tool inputs are the design libraries and genetic algorithm's parameters.
There are nine design libraries attached to i -CAD: Ethernet, ATM, bridge, router,
T-carrier, SONET, VPN, server and hard disk. Each library contains speci�c infor-
mation about all its components, such as cost, and capacity. The genetic algorithm's
parameters refer to the population size (PS), number of generations (NG), crossover
rate (CR), and mutation rate (MR). The output of the i -CAD tool is a population
of optimized intranet infrastructures.
1.4 Motivation Behind i-CAD
The motivation behind this work is the need for an automatic capacity planning
tool, such as i -CAD, to design application-speci�c intranets. We list some of the
bene�ts and features of i -CAD; moreover, we describe some of the applications that
may be executed by intranets. i -CAD is a novel software packages, which o�er the
following:
6

� Fast consideration of many network architectures,
� Fast consideration of server placement and �le allocation,
� Rapid feedback to the designer as performance is evaluated,
� Rapid feedback to the designer as application inputs, such as client tra�c
matrix, are varied,
� Rapid adaptation to new network and data management technologies and de-
sign styles, and
� Feedback to the designer on how to modify existing intranet infrastructures.
i -CAD creates an intranet, based on the application requirements, out of many
possible designs in less time and cost than the manual design process. For example,
consider an enterprise with six physical sites, where each site contains four local area
networks (LAN) for a total of 24 LANs. Each LAN contains a number of client nodes
that need to communicate among themselves and with other clients, and access �le
servers. This optimization problem has exponential computational complexity. For
example to connect all clients within a LAN, all LANs within a site, and all sites
within the enterprise's backbone by considering only two possible network technolo-
gies (switch and multiaccess device), we have 2(24 LANs + 6 sites + 1 backbone) =
231 possible infrastructures. If each infrastructure takes one second to be synthe-
sized and evaluated for example, then it is impossible to �nd the optimal solution
manually without lots of domain experience. On the other hand, to search for the
optimal solution by a computer using brute force is also not feasible due to the
enormous design space of the problem, even if obviously bad design decisions could
be eliminated prior to search. For this reason we use a randomized algorithm, in
particular a genetic algorithm, to search for a near-optimal solution.
i -CAD can accurately manage many more design decisions than the manual
design process. These decisions include determining data management resources and
7
allocating all �les into �le servers. In the previous example, there are 231 possible
intranet infrastructures, and each infrastructure has many possible combinations of
additional design decisions posed in our problem. The i -CAD gives the network
designers insight into the synthesized intranet and its resources that can help to
estimate the performance of the intranet without an actual physical implementation.
i -CAD enables the network designers to study and analyze the e�ects of di�erent
input parameters on the network design parameters. For example, if the type and
amount of data tra�c are changed due to clients' requests, i -CAD can redesign
the intranet to satisfy the new tra�c. This provides the network designers with
a comparison between the redesign and old intranet infrastructures. i -CAD o�ers
many other features such as studying and analyzing the e�ects of di�erent data
management system styles such as centralized or distributed.
Also, in the future, i -CAD will be capable of guiding network managers on how
to tune or adapt the intranet resources to the application's tasks, by indicating when
and where to add additional speci�c resources to the current intranet's infrastruc-
ture, or by restructuring the current infrastructure without additional resources.
These features can be added in the future without changing the main underlying
techniques or introducing large amounts of new code.
Our research is motivated by the high demand for application-speci�c intranets.
As of 1999, intranets were being used by nearly 23 million employees worldwide and
International Data Corporation (IDC) had predicted that number would grow to
180 million in the year 2000 [Ken97]. Applications supported by intranets include
� video/audio-on-demand,
� teleconferencing,
� tele-education,
� electronic transactions,
� telemedicine, and
8

� cinema-television animation.
Video/audio-on-demand describes an interactive television (radio) that allows
people to interact with programs and control the time to watch (or listen to) them.
In some cases, a client can interact with a server through a set-top-box located at
the client site and all requests and replies are transmitted via high-speed networks.
This application typically requires high bandwidth, an asymmetrical link and low
transmission cost as the main intranet characteristics.
Teleconferencing is an information exchange system for people to conduct meet-
ings e�ectively without leaving their o�ces. For example, users can see each other
via real-time video on their multimedia workstations displays, talk and listen to
all the conversation via real-time audio and watch presentations via an online elec-
tronic whiteboard. This application typically requires mobility, high bandwidth and
a symmetrical link as the main intranet characteristics.
Tele-education involves a virtual learning and training campus for students and
instructors to interact with each other without all being in the same classroom.
In some implementations, students and instructors can see each other via real-time
video on their multimedia laptops' displays, talk and listen to all discussions via real-
time audio and watch lectures via an online electronic whiteboard. This application
typically requires broadband transmission, mobility, low transmission cost and a
symmetrical link as the main intranet characteristics.
An electronic transactions' intranet application mainly involves a �nancial insti-
tution that needs a secure in-house network. This application typically requires high
security, reliability and connectivity as the main intranet characteristics.
Telemedicine refers often to a virtual hospital or other medical facility that pro-
vides essential services such as a rapid consultation between physicians and patients
or physicians and specialists, health delivery services between hospitals and rural
clinics, access to patients' records anywhere and anytime by medical personnel and
9

a database containing the availability of organ donations. This application typi-
cally requires low transmission delay, bidirectional transmission, a symmetrical link,
broadband transmission and high bandwidth as the main intranet characteristics.
An animation �lm studio is an online post production system for directors, writ-
ers and animators, where animated sequences of drawings as well as integrate and
edit the prerecorded video, background, special-e�ect frames and audio samples
together to produce an animated �lm. This application typically requires a sym-
metrical link, high bandwidth and broadband transmission as the main intranet
characteristics.
1.5 Thesis Organization
The rest of the thesis is organized in seven chapters. Chapter 2 presents an overview
of our intranet model and examples. Chapter 3 surveys the related research in the
areas of network synthesis, design automation tools and multimedia systems. Chap-
ter 4 describes a comprehensive mathematical formulation of the intranet design
problem. The formulation includes a large set of network and data management de-
sign constraints and an objective function representing the total intranet integration
cost. Chapter 5 describes an analytical performance model for evaluating the inte-
grated network architecture for satisfying a given threshold delay. Also, we describe
a Monte Carlo simulator for evaluating the data management system to determine
how many clients' requests can be satis�ed within a given threshold duration period.
Chapter 6 describes the intranet computer-aided design tool, i -CAD, which is a suite
of techniques and software that are used for automatically designing and integrating
data management systems and network architectures. A genetic algorithm used by
i -CAD for selecting and integrating the optimized set of network and data manage-
ment components that minimize the total intranet integration cost, while satisfying
the design and performance constraints, is described. Chapter 7 presents the results
of using i -CAD to integrate data management systems and network architectures for
10

several instances of the animation production studio problem. Chapter 8 contains
the conclusions and contributions of our research, and future research directions in
large system-level synthesis.
11

Chapter 2
An Overview of Intranet Design Model
2.1 Background
In the past half decade, there has been a rapid expansion in the use of networks,
particularly intranets. As of 1999, intranets were being used by nearly 23 million
employees worldwide and International Data Corporation (IDC) had predicted that
number would grow to 180 million in the year 2000 [Ken97]. An intranet is a private
network that is contained within an enterprise. It may consist of many interlinked
local area networks (LAN) and also use leased lines in the wide area network that con-
nects the LANs. The main purpose of an intranet is to share company information
and computing resources among employees. An intranet can facilitate distributed
groups of an enterprise's employees to work on common tasks. However, there is no
uniform infrastructure that is appropriate for all intranets. The intranet's infras-
tructure depends on many factors, for examples the type of application (continuous
media or non-continuous media), the number of nodes (clients and servers), and
the physical dimensions between the clients. We view the intranets as the building
blocks of the global Internet. Therefore, an intranet can be as small as a household
network connecting a few components (such as PCs, printer, and smart appliances),
or as large as a global enterprise network connecting o�ces around the world. In
this thesis, we suggest a simple model that can capture both the data management
12

and network aspects of an intranet. Our goal is to show that it is feasible to au-
tomatically synthesize a complete intranet infrastructure by using such an intranet
model.
2.2 Intranet Model
We model an intranet application as a hierarchy of three tasks. The backbone task
refers to the entire intranet application. The backbone task consists of a number of
subtasks performed at physical sites, each of which is referred to as a site task. A site
task consists of a number of distinct group tasks, where each group task comprises
a number of distinct client tasks (performed on workstations). In order to perform
all the collaborative group and site tasks within an acceptable time, clients must
communicate and share data among themselves. These three tasks (backbone, site
and group) can be associated with three network levels. The communication within
a group task can utilize the lowest-level of network (local area network, LAN) that
connects a set of clients (workstations). The site task can use the intermediate-level
network that contains a set of LANs. The backbone task needs to use highest-level
network that connects all sites. The physical dimension of an intranet's backbone
network can be either a local or wide depending on the physical distance between
sites. A local topology refers to the close physical locations of all sites. For example,
when all sites are located within a university campus or studio lot, we consider such
topology as local. A wide topology refers to the scattered physical locations of all
sites. For example, when all sites are located across a city, state or country, we
consider such topology as wide. The di�erence between the two topologies is in the
selection of network technologies.
This thesis de�nes an intranet as a three-level network (backbone, site and group)
and the data management system is constrained at the group level to keep the data
close to the high-demand clients. Then, the intranet integration problem is to con�g-
ure simultaneously a data management system and three-level network architecture
13

for the given application's tasks, in order to perform all tasks in a certain order
and within a time bound, while minimizing the total intranet integration cost. Our
intranet model is one of many intranet model possibilities that can be explored in
the future by increasing or decreasing the number of network levels or placing the
data management system at di�erent network levels, for example.
2.3 Example: Animation Production Studio
An animation production studio is an online post production system for directors,
writers and animators that can create, integrate and edit the live-action frames,
background frames, special-e�ect frames, animation frames and audio samples to-
gether to produce an animation �lm. According to Weinberg [Wei95], digital media
production has rapidly become a highly distributed collaborative activity involving
teams of people and digital resources in di�erent locations.
A typical animation �lm studio's activity consists of multi-collaborative site tasks
such as live-action, audio, background, special-e�ect, management and drawing,
where each site task is composed of many distinct group tasks. Thus, a studio needs
a data management system and a network architecture to enable all its sites to
communicate with each other and access the same �le servers e�ciently. Such an
application has certain network and data management requirements, such as high
communication bandwidth, high-transfer rate, massive data storage and low delay
bounds. For example, the �lm Toy Story 2 has 122,699 frames of up to 4 gigabytes
per frame [Sla99]. This data re ects the �nished �lm, which means that an enormous
quantity of data is created within all tasks to develop the �nished �lm. Budget
limitations can disallow the choice of the fastest possible networking hardware for
the entire installation, forcing heterogeneous solutions with components that vary
in cost and performance across the network. Literally millions of possible network
architectures could be used for a given animation studio intranet, and this number
is magni�ed by possible variations in the number, type, locations and capacity of
14

the �le servers. It would be impossible for a human network designer to examine
all possibilities for typical large installations. This makes the animation production
studio a good realistic intranet example to be integrated. Plus, studios expect their
intranets to be upgraded periodically so that their products (�lms) reach the market
on time.
To clarify the presentation of the animation's tasks, we model the group tasks
and their communications as a task ow graph (TFG), where a node represents
a group task and an edge represents the communication between two group tasks
as shown in Figure 2.1. The graph shows an example of a full task ow graph
for the animation �lm studio's group tasks. This graph has two attributes: it is
hierarchical and is a hyper-graph. It is a hierarchical graph, since each node (group
task) contains a set of distinct client tasks, where each client task performs part of
the group task. A collection of related group tasks forms a site task that represents
a task performed at a physical site location. Then, all the site tasks constitute a
backbone task, which represents the entire intranet's application. It is a hyper-graph,
since each edge represents the communication among an arbitrary subset of clients
of the two group tasks.
The full example animation task ow graph has 14 group tasks (nodes in the
graph), which are involved in creating, managing, integrating and editing the ani-
mation �lm's shots [SC95]; moreover, the graph shows the data ow order per shot
between the 14 group tasks. These 14 groups are clustered into six sites and a total
of 150 client tasks (performed on 150 workstations) are used to perform all group
tasks. The �rst eight groups tasks (GT1 to GT8) perform the creation of the skele-
ton shot, which contains all video frames, audio samples, background frames, and
special-e�ect frames except the animated drawing frames, as shown in Figure 2.2.
In the partial animation task ow graph, the eight group tasks are clustered into
four site tasks and a total of 65 client tasks (performed on 65 workstations) are
used to perform the eight tasks. The full and partial animation task ow graphs are
15

GT11analyzetime &space
GT10draw
last frame ofall sub-shots
for shot i
GT9draw
first frame ofall sub-shots
for shot i
GT2createanimated
characters’voices
GT1create
live-actionGT3
chooseshot i
GT7create
special effectsshot i
GT6create
backgroundsshot i
GT4retrieve
live-actionshot i
GT5retrieveanimated
voices shot i
GT8combineskeleton
shot i
GT13join
shot i
GT12drawin-between
frames of allsub-shots for
shot i
GT14edit
shot i
GT: Group TaskST: Site TaskGT1 and GT4 are contained within ST1.GT2 and GT5 are contained within ST2.GT3 and GT8 are contained within ST3.GT6 and GT7 are contained within ST4.GT9, GT10, and GT12 are contained
within ST5.GT11, GT13, and GT14 are contained
within ST6.
GT1 contains 10 client tasks.GT2 contains 5 client tasks.GT3 contains 10 client tasks.
GT4 contains 5 client tasks.GT5 contains 10 client tasks.GT6 contains 7 client tasks.GT7 contains 8 client tasks.GT8 contains 10 client tasks.GT9 contains 10 client tasks.GT10 contains 10 client tasks.
GT11 contains 15 client tasks.GT12 contains 20 client tasks.GT13 contains 15 client tasks.GT14 contains 15 client tasks.
Figure 2.1: Full task ow graph for an example animation �lm studio.
used as our examples to integrate application-speci�c intranets. In the future, we
intend to use the task ow graph as an input to provide additional time-dependent
information to be used during intranet design. However, to simplify the problem
currently as an input to i -CAD we simply describe the tasks' information within the
task ow graph by a matrix and two tables, omitting the ordering of tasks:
� A client tra�c matrix (CTM) represents the average tra�c ow requirements
between each pair of clients in term of bits per second,
16

GT2createanimated
characters’voices
GT1create
live-actionGT3
chooseshot i
GT7create
special effectsshot i
GT6create
backgroundsshot i
GT4retrieve
live-actionshot i
GT5retrieveanimated
voices shot i
GT8combineskeleton
shot i
GT: Group Task
ST: Site Task
GT1 and GT4 are contained within ST1.
GT2 and GT5 are contained within ST2.
GT3 and GT8 are contained within ST3.
GT6 and GT7 are contained within ST4.
GT1 contains 10 client tasks.GT2 contains 5 client tasks.GT3 contains 10 client tasks.
GT4 contains 5 client tasks.GT5 contains 10 client tasks.GT6 contains 7 client tasks.GT7 contains 8 client tasks.GT8 contains 10 client tasks.
Figure 2.2: Partial task ow graph for an example animation �lm studio.
� A client location table (CLT) represents the physical location of each client
within the intranet and its allocation to a group task and a site task, and
� A data request table (DRT) represents the access rate of each �le by all clients.
The client tra�c matrix and task ow graph are not compatible representations
of the application's tasks. The client tra�c matrix provides a non-hierarchical in-
formation about the application's tasks (focused on the client to client relationship),
where the task ow graph provides a hierarchical information about all three levels
(group, site and backbone), along with data-precedence relationships.
17

Chapter 3
Related Research
3.1 Background
The intranet integration problem is a multidisciplinary problem with related research
in three broad categories: network synthesis, design automation tools, and multime-
dia systems. In this chapter, we examine each category and outline the fundamental
concepts and relevant work related to our research.
3.2 Network Synthesis
Network synthesis is a broad expression that is used by many researchers in many
di�erent �elds. In this thesis, we refer to the process of designing the hardware
comprising a computer network as network synthesis. Research in network synthesis
can be divided into three areas: classical network synthesis, teleprocessing network
synthesis and combined network synthesis with �le allocation. Next, we review the
research e�orts in these areas.
18

3.2.1 Classical Network Synthesis
In this section, we present some of the early and recent research e�orts in network
synthesis and analysis. The classical network synthesis problem is to determine an
unconstrained1 physical network topology and a link capacity requirement.
The early works on network analysis [EFS56, FF56, DF56] were performed in
the late 1950s. In the analysis problem, the physical network topology and the link
capacity matrix (LCM) are given and the objective is to �nd the maximum possible
ow between nodes, which is the node capacity matrix. The maximum ow analysis
is based on �nding the minimum value among all simple cut-sets. A cut-set is a set
of links such that when removed from the network, then the network falls into two
or more unconnected subnetworks. A simple cut-set means a cut-set such that if
any link is removed it is no longer a cut-set.
The automatic synthesis of communication networks is not a new problem; it has
been researched since the early 1960s. A systematic synthesis method [Chi60] and re-
alization conditions [May60] were developed to synthesize a communication network
from its node capacity matrix (NCM), where each entry in the NCM represents the
maximum possible communication capacity between two nodes in the network. The
outcome is an unconstrained physical topology with a minimum weighted sum of
all links' capacity. However, this synthesis method gives a non-unique topology and
sometimes it is impossible to realize a topology from a nonrealizable node capacity
matrix.
These early e�orts in network synthesis and analysis serve as a foundation for our
problem that consists of similar basic problems such as �nding a constrained physical
network topology, allocating network capacity and analyzing network performance.
The rest of the classical network synthesis papers are divided into two sets based
on the solution approach. The papers in the �rst set provide abstract solutions to
the network synthesis problem. An abstract solution means determining only a set
1Nodes are connected together in an arbitrary pattern.
19

of links and their capacity without specifying the type of network technology. The
papers in the second set provide concrete solutions to the network synthesis problem.
A concrete solution means that at least one type of network technology is used to
synthesize a network architecture. Next, we review the abstract and the concrete
approaches for synthesizing a computer network.
3.2.1.1 Abstract Network Solution Approach
An abstract network solution means determining only a set of links and their capac-
ities to connect a set of nodes without specifying the type of network technology.
The following papers [GK77, Sak89, PK95, KTC+97, BMM+, TH, PL98] describe
several abstract approaches to synthesize a computer network. In contrast to our
problem and approach, the techniques described in these papers are either limited
to designing a logical network topology on top of a pre-existing physical network
topology, limit the number of network levels to one or two, or use rigid design styles.
Gerla and Kleinrock [GK77] classify the topological design of distributed com-
puter networks into four general optimization problems, which are the link capacity
assignment problem, the routing problem, the capacity and ow assignment problem
and the topological design problem.
In the link capacity assignment problem, the objective function to be minimized
is the communication cost, subject to the capacity constraint and the total average
delay constraint. Given are a topology, a tra�c requirement matrix and a routing
policy. The variable to be determined is the link capacity.
In the routing problem, the objective function to be minimized is the average
delay, subject to the link ow constraint and the capacity constraint. Given are a
topology, a tra�c requirement matrix and link capacities. The unknown variable is
the tra�c ow on each link.
In the capacity and ow assignment problem, the objective function to be min-
imized is the communication cost, subject to the link ow constraint, the capacity
20

constraint and the total average delay constraint. Given are a topology, a tra�c
requirement matrix and a link cost per unit capacity. The unknown variables are
the link capacity and tra�c ow.
In the topological design problem, the objective function to be minimized is the
communication cost, subject to the link ow constraint, the capacity constraint, the
total average delay constraint and the k-connected reliability constraint. A tra�c
requirement matrix is given. The unknown variables are the set of links and their
capacity. Our network design problem is similar to the fourth problem, the topolog-
ical design problem. However, we extend their problem by simultaneously designing
a hierarchical heterogeneous network infrastructure and mapping heterogeneous net-
work technologies to each level of the network's infrastructure. Their problem is to
determine a nonhierarchical topology design. Their solution approach is to come up
with an abstract topology without considering any type of network technology that
can implement such an abstract solution.
Saksena [Sak89] describes a heuristic algorithm to determine the number of
trunks2 for connecting a set of classi�ed nodes in a two-level hierarchical mesh topol-
ogy. Each node is classi�ed either as a low or a high, where a high node forms a
cluster of a set of low nodes. The objective function to be minimized is the total
trunk network cost, subject to a delay constraint, a path3 length constraint and the
number of paths in a route4 constraint. The variables to be determined are the
set of links and their capacity. The author developed a heuristic algorithm that
initially creates a network with all tra�c routed on direct paths. In each iteration,
the algorithm performs the following steps: identifying the utilized and underuti-
lized trunks, eliminating the underutilized trunks, and re-constructing the network
while satisfying all constraints. The algorithm keeps iterating until a certain cost is
achieved. The paper presents a problem and an algorithm for a classical network
2A group of trunks comprises one link, where each trunk has a �xed bandwidth.3A path is a set of one or more concatenated links connecting node pairs.4A route is a set of one or more paths, not necessarily disjoint, between node pairs.
21

problem, which is to determine only a set of links. Our problem deals with more
network levels and our tool speci�es speci�c network hardware resources to connect
all nodes.
Palmer and Kershenbaum [PK95] describe a methodology based on a genetic
algorithm for �nding a minimum-cost logical spanning tree network. Given are a
complete graph, a tra�c requirement matrix and a link cost per unit capacity. The
authors focused on showing the e�ectiveness of genetic algorithm in minimizing the
weighted sum of all the shortest paths between all pairs of nodes. The authors tried
several encoding chromosomes to represent the spanning tree such as characteris-
tic vector, predecessors, pr�ufer numbers and bias node/edge representation. This
methodology assumes that the network consists of one level and this assumption
does not re ect today networks.
A paper by a group of researchers fromHong Kong [KTC+97] describes a method-
ology based on a genetic algorithm for designing a mesh communication network
topology, while minimizing the topology cost. The problem is given as a 10-node
network with the tra�c requirements among the 10 nodes, a cost structure propor-
tional to the distance among nodes, and a maximum allowable packet delay. The
authors used a binary string to represent the mesh network topology and an M/M/1
queue as their delay model. This paper provides a design technique for a speci�c
problem, where their technique may not scale for a large problem with a multi-level
network and a large number of nodes.
A paper by a group of researchers from Australia [BMM+] describes a method-
ology based on combining a genetic algorithm and linear programming (GA-LP) for
�nding a minimum-cost mesh network topology. Given are a node-to-node cost ma-
trix, tra�c requirement matrix, maximum link and node capacity matrix, and node
minimum and maximum degree vectors. The authors used linear programming to
determine the �tness function within the genetic algorithm and a binary string to
represent the mesh topology. Their methodology cannot handle a large population,
22

since linear programming consumes many CPU cycles. With a small population, the
genetic algorithm cannot insure �nding a good solution due to the small population
and its lack of diversity.
The x-bone project is currently in progress at USC/Information Sciences Insti-
tute [TH]. x-bone is a software tool for a rapid, automated deployment and man-
agement of overlay networks. An overlay network is another name for a small scale
virtual private network, where a pre-existing physical network topology is used to
virtually con�gure and manage a number of overlay networks for restricted purposes.
This project is not involved in any physical network design. Unlike x-bone, our pro-
posed tool does not assume that a physical network topology is given. Therefore,
our short-term objective is to design an application-speci�c intranet (three-level net-
work infrastructure and data management system) and the long-term objective is to
automatically manage the intranet's resources after they are synthesized.
Pierre and Legault [PL98] describe an optimization problem for the topological
design of distributed networks. The inputs of the problem are node locations, node-
to-node tra�c demands, link capacity options with their cost, maximum average
delay and degree of node connectivity. The objective function to be minimized
is the link communication cost for a backbone k-connectivity network, subject to
delay and reliability constraints. The cost of a link comprises two components: a
permanent cost related to the capacity of the link and a variable cost related to
the physical length of the link. The average delay is computed by summing all the
links' delays, where a link delay is modeled as an M/M/1 queue. The reliability is
measured in terms of k-connectivity. A network that remains functional despite one
link or node breakdown is said to be 2-connected. The variables to be determined
are the set of links and their capacity. This optimization problem is known to be
NP-complete; therefore, the authors used a genetic algorithm to search for good
backbone topologies. Their solutions are encoded in the form of chromosomes made
up of a sequence of 1s and 0s that symbolize the existence or nonexistence of a
23

link. The length of a chromosome depends on the number of nodes in the network.
Thus, a network composed of N nodes is represented by chromosome of length N (N -
1)/2. The initial population is generated by selecting a link whose Euclidean distance
between nodes is the shortest, until all nodes have at least k incident links. For their
computational experiments, they used the following parameter values: 1000 bits as
an average packet size, 5 packets per second as a uniform tra�c ow, 3 as a degree of
connectivity, 80 chromosomes as a population size, 0.95 as a crossover probability,
0.12 as a mutation probability and 40 as a number of generations. According to
their experiments, the genetic algorithm appears to work better on the average for
networks of 15 nodes or more, and takes 40 seconds of CPU time to �nd a solution
for a 25 node network, for example. This paper shows us a strong evidence that
the topological design problem can be solved by a genetic algorithm, even through
our problem deals with more network levels than just a backbone level. Table 3.1
summarizes all papers related to the abstract network solution approach.
24

Table 3.1: Summary of abstract approach papers.
Reference Authors Brief Description
[GK77] M. Gerlaand L.Kleinrock
The topological network design is classi�ed into 4 gen-eral problems: link capacity assignment, routing as-signment, capacity and ow assignment, and topologydesign; moreover, a survey of mathematical program-ming and heuristic approaches is presented.
[Sak89] V. Saksena A heuristic algorithm to determine the number oftrunks for connecting a set of classi�ed nodes in a two-level hierarchical mesh topology is described.
[PK95] C. Plamerand A.Kershenbaum
A methodology based on a genetic algorithm for �nd-ing a minimum-cost logical spanning tree networkwithin a given complete graph is described.
[KTC+97] K. Ko, K.Tang, C.Chan, K.Man and S.Kwong
A methodology based on a genetic algorithm for de-signing a 10-node mesh network topology, while min-imizing the topology cost, is described.
[BMM+] L. Berry, B.Murtagh, G.McMahon,S. Sugdenand L.Welling
A methodology based on combining a genetic algo-rithm and linear programming (GA-LP) for �nding aminimum-cost mesh network topology is described.
[TH] J. Touch andS. Hotz
A software tool, X-bone, is presented and its goal isto automatically deploy and manage overlay networksover pre-existing physical networks.
[PL98] S. Pierre andG. Legault
An optimization problem for backbone topologicalnetwork design is described and a genetic algorithmis used to search for good backbone topologies.
25

3.2.1.2 Concrete Network Solution Approach
We use the term concrete solution to convey that at least one type of network
technology is used to synthesize a network topology. The following papers [GW90,
EP93, CDSW95, FD95, ES96, DDH95, DFlH+97, MMR98] describe several non-
abstract approaches to synthesize a computer network. In contrast to our problem
and approach, the techniques described in these papers are either limited to designing
a logical network topology on top of a pre-existing physical network topology, use
one speci�c network technology, limit the number of network levels to one or two,
or use rigid design styles.
A paper by researchers from GTE Laboratories [GW90] presents a network de-
sign model based on a mixed integer-linear programming (MILP) formulation that
combines the topological design problem and facility selection problem. The facility
selection problem is to determine the type of network technology for each link in
the topology. Each facility type (�ber-optic, T1 carrier, copper, microwave, etc.) is
represented by a di�erent link cost function. Their goal is to design a mesh net-
work topology that minimizes the total network cost while selecting facility types,
allocating capacity and routing tra�c to accommodate demand and performance
requirements. The researchers focused on a at network (one level) and their MILP
formulation is only valid for a small network design problem.
Ersoy and Panwar [EP93] describe a methodology for designing logical spanning
tree topologies to interconnect LAN/MAN networks, while minimizing the average
network delay. The givens are a topology, a tra�c requirement matrix, a LAN
capacity and a bridge capacity. The overall LAN/MAN topology is decomposed by
the researchers into a set of clusters and a backbone MAN in order to reduce the
problem complexity. A cluster contains a number of distinct LANs; moreover, all
the LANs are pre-connected in a physical topology. The topology is modeled as a
graph, where a node represents a LAN and an edge represents a bridge connecting
two LANs. The MAN's backbone is modeled as a central node and each cluster is
26
connected to the central node by one LAN/MAN bridge. The design methodology,
which is based on simulated annealing, has two phases. The �rst phase �nds a
minimum-delay logical spanning tree topology for each cluster and then calculates
the cluster access delay for the found logical spanning tree topology. The cluster
access delay is the maximum delay between any LAN in the cluster and the MAN
in either direction; moreover, the delay model is based on an M/M/1 queue with
batch Poisson arrivals. If the cluster access delay exceeds the given threshold delay,
the second phase proceeds by splitting that cluster into two subtrees, allowing each
subtree to have a LAN/MAN bridge and repeating the �rst phase. Otherwise, the
methodology proceeds to the next cluster. In contrast, we design each LAN and we
don't limit the type of network technology to Ethernet with bridge as in the paper
by Ersoy. Also, we use a non-geometric search (genetic algorithm) for selecting
solutions. This will avoid most of the local minima that may be selected by a
geometric search (simulated annealing).
A paper by a group of researchers from Bellcore [CDSW95] presents a SONET
Toolkit, which is decision support software to design robust �ber-optic backbone net-
works that protect services against the consequences of a cable cut (link) or an equip-
ment failure (node). The SONET toolkit takes the following inputs: the physical
network topology, its capacity, the available equipment, the customer demands and
the protection requirements for the services. It produces SONET self-healing rings
on the physical network topology. The SONET Toolkit is based on a divide-and-
conquer approach, where an experienced network planner decomposes the mapping
of the customer's demands on the physical network into a sequence of subproblems,
such as checking the feasibility of the demands, assigning the demands as possi-
ble to the pre-existing capacities, determining the overall ring and self-healing ring,
determining the cost and generating reports. The Toolkit is only available to Bell-
core client companies. In contrast to our proposed tool, we synthesize a three-level
physical network topology and use more than one network technology.
27

Fahmy and Dougligeris [FD95] present END5, which is a rule-based expert sys-
tem combined with a commercial network simulation tool, OPNET, to con�gure
and simulate computer networks. This tool, END, interacts with the user by ask-
ing several questions about the network to be built, such as the number of network
sites, type of interconnectivity between the sites, the number of buildings in each
site, the number of oors in each building, type of applications, and the number
of workstations and servers in each LAN. The tra�c demand is not required as an
input by END, since it can establish the tra�c pattern from the type of application
for which the network will be used. The rule-based expert system has two limita-
tions: The �rst limitation is that the design can be biased toward a speci�c network
technology, since the design rules may re ect the personal opinions of the network
designers. The second limitation is the heuristic design rules, which need revision
from time to time.
Elbaum and Sidi [ES96] describe a methodology based on a genetic algorithm for
�nding a minimum-average-delay topological design of a local area network (LAN).
The problem assumes that a local area network is partitioned into a number of
segments (clusters), and the upper bound on the number of segments is given by
the network designer. The unknown variables are the number of LAN segments, the
allocation of the users to the segments and the interconnection among the segments
as a spanning tree. The authors estimate the average delay by summing the delays
of all segments and bridges; furthermore, they modeled the average delay based on
an M/M/1 queue. The authors used a Hu�man tree structure to represent the entire
LAN chromosome. In contrast to our problem, the paper is limited to the design of
one LAN and one type of network technology (Ethernet with bridges).
Two papers by group of researchers from AT&T [DDH95, DFlH+97] present
an Integrated Network Design Tool (INDT). The goal of the INDT is to design
integrated multimedia networks on a variety of network platforms. The network
5END stands for Expert Network Designer.
28

platforms considered are mesh networks, interconnected SONET ring networks and
hybrid mesh/ring networks. The �rst paper [DDH95] describes a network design
algorithm that searches for an optimized network cost for a two-level mesh topology.
The inputs to the algorithm are node locations, node-to-node tra�c demands, and
cost structure for links as well as nodes. The network design algorithm consists
of four steps. In the �rst step, the algorithm begins by selecting an initial set of
nodes, serving nodes (SNs), that will comprise the backbone network. The selection
is based on the high tra�c demands as well as span of the geographical locations
between all nodes. In the second step, the algorithm assigns the rest of the nodes,
access nodes (ANs), to the serving nodes. Each AN is assigned to only one SN.
After it assigns all ANs, the network is divided into a set of local networks AN-
SNs and one backbone network SN-SN. In the third step, the algorithm selects a
set of links and their capacity to meet the backbone network tra�c demand. Also,
it optimizes the number of backbone links by deleting the underutilized ones and
rerouting the tra�c carried on them on the remaining links. Therefore, the objective
of the �rst three steps is to come up with a good initial design. In the fourth step,
a simulated annealing algorithm is used to improve the selection of SNs and repeat
the entire process, until the best selection of SNs is achieved. The capability of
INDT is extended to SONET ring network design [DFlH+97], where a ring design
algorithm is developed to determine an optimal ow through a network of rings
while satisfying a capacity constraint. In this extension, the researchers have divided
the SONET ring design problem into many subproblems and developed innovative
heuristic algorithms for each problem. As described in these two papers, the INDT
consists of a suite of programs, where each program is intended for the design of a
speci�c network infrastructure based on the AT&T network technology. Also, the
INDT is focused on a large-scale backbone network, where our tool is focused on a
hierarchical heterogeneous application-speci�c intranet.
29

A paper by a group of researchers from Bell Labs [MMR98] presents a VPN
DESIGNER, which is a software tool for the design of virtual private networks on a
service provider's infrastructure. This tool is intended to be used by internet service
providers (ISP) to allocate and manage virtual private connections to outsourcing
enterprises. The VPN design problem is modeled as a nonlinear optimization prob-
lem to maximize the weighted aggregate measure of carried bandwidth over the
provider's infrastructure, subject to the optimal allocating and routing of all cus-
tomers' tra�c. The VPN DESIGNER employs an iterative algorithm, where each
iteration requires a reallocation of each link's bandwidth to VPN. This reallocation
is based on a linearization of the total network bandwidth and the linearized capac-
ity costs. After each reallocation, the optimal routing problem is solved for each of
the newly resized VPNs. This tool maps customers' demand on a given network,
where there is no physical network design involved. Also, their tool is concentrated
on a backbone logical network design, where our tool is focused on designing local
and backbone physical networks. Table 3.2 summarizes all papers related to the
concrete network solution approach.
30

Table 3.2: Summary of concrete approach papers.
Reference Authors Brief Description
[GW90] A. Gresht andR. Weihmayer
A network design model based on a MILP formu-lation is presented. The model combines the topo-logical design problem and facility selection (�ber-optic, T1 carrier, copper, microwave) problem.
[EP93] C. Ersoy and S.Panwar
A methodology for designing logical spanning treetopologies to interconnect LAN/MAN networks,while minimizing the average network delay, is de-scribed. A simulated annealing is used to searchthe design space.
[CDSW95] S. Cosares,D. Deutsch, ISaniee, and OWasem
The paper presents a SONET Toolkit, which is de-cision support software to design robust �ber-opticbackbone networks that protect services against theconsequences of a cable cut (link) or an equipmentfailure (node).
[FD95] H. Fahmy andC. Douligeris
A rule-based expert system, END, is combinedwitha commercial network simulation tool, OPNET, tocon�gure and simulate computer networks.
[ES96] R. Elbaum andM. Sidi
A methodology based on a genetic algorithm for�nding a minimumaverage delay topological designof an Ethernet LAN is described.
[DDH95] B. Doshi, S.Dravida and P.Harshavardhana
An Integrated Network Design Tool (INDT) con-tains a network design algorithm searching foran optimized network cost for a two-level meshtopology.
[DFlH+97] B. Doshi, C.Funka-Lea, P.Harshavard-hana, J. Gong,R. Nagarajan,S
The capability of INDT is extended to SONET ringnetwork design, where a ring design algorithm is de-veloped to determine an optimal ow through a net-work of rings while satisfying a capacity constraint.
[MMR98] D. Mitra,J. Morri-son and K.Ramakrishnan
A software tool, VPN DESIGNER, is used for thedesign of virtual private networks on an internetservice provider's (ISP) infrastructure. This toolis intended to be used by ISP to allocate andmanage virtual private connections to outsourcingenterprises.
31
3.2.2 Teleprocessing Network Synthesis
We have found in the literature a problem similar to our problem, which combines
network design with data management. The problem, teleprocessing network syn-
thesis, is to �nd an optimal topological network design for a set of clients' locations,
tra�c magnitudes between these clients and a single common service center. In other
words, the synthesis of a teleprocessing network problem assumes that the number
of the service centers is given as one, where in our problem the number of service
centers is a decision variable. Also, we can synthesize two types of data management
systems depending on the application requirements: centralized server with proxies
or distributed servers. We cite the following papers [EW66, RG71, TWB78, KB83],
which show us some ideas on how to design a network with classi�ed nodes, such as
clients and servers.
The earliest work on designing a teleprocessing network was performed by Esau
and Williams [EW66], where they proposed an iterative method to connect low-
speed terminals at great distances from the computing center. The method starts by
connecting all terminals to the computing center in a point-to-point network, then it
tries to reduce the direct unshared links from the computing center to some terminals
by creating multipoint linkages between some terminals. Thus, it transforms a star
topology into a tree. Their iterative method is limited by the network technology
selection and it does not consider a distributed network with multiple service centers,
where we consider all of that in our problem.
Rothfarb and Goldstein [RG71] consider a network synthesis problem with a
nonlinear cost function that is neither concave nor convex, but piecewise linear.
They solve a network problem that arises in the context of leasing long-distance
telephone facilities from common carriers, where the lessee has certain voice and
data communication needs. This problem is known as the TELPAK problem and its
design is limited to an unconstrained logical circuit switch channel topology. This
method does not consider the design of the physical network topology.
32

Tang, Woo and Bahl [TWB78] describe a method for �nding an optimal num-
ber of concentrators within a teleprocessing network. The paper is concerned with
�nding the optimal number and locations of the concentrators and the optimal as-
signment of terminals to a given set of concentrators. The authors developed a
heuristic matching algorithm to connect terminals to concentrators, while minimiz-
ing the installing cost of concentrators and the communication link cost between
terminals and the installed concentrators. However, the authors did not consider
data tra�c requirements and link capacity when they developed their algorithm.
The network hardware option is limited to concentrators only, where in our tool we
consider many options, such as bridges and routers.
Designing a centralized teleprocessing network as a minimum spanning tree was
performed by Kershenbaum and Boorstyn [KB83]. Their approach is based on
branch and bound techniques where they develop two algorithms. The �rst one
is based on generating subproblems by restricting nodes and the second one is based
on generating subproblems by restricting arcs. This paper concentrates on �nding
a spanning tree topology for a classical network synthesis problem.
3.2.3 Combined File Allocation and Network Synthesis
The �le allocation problem (FAP) was introduced by Chu [Chu69] in 1969. The
problem is given a number of computers that process common �les and allocate the
�les to the computers so that the allocation yields minimum storage and transmis-
sion costs, subject to constraints. Constraints are the following: the expected time
to access each �le is less than a given bound and the amount of storage needed at
each computer does not exceed the available storage capacity. The idea of combining
the �le allocation problem with network synthesis problem is not done, except for
some early research e�orts by Professor Keki Irani and his students Whitney and
Khabbaz from the University of Michigan [Whi70, IK82]. They focused on combin-
ing the network synthesis problem with the �le allocation problem. The thesis of
33

Whitney [Whi70] addresses two problems: determine the number and locations of
�le sites and determine a number of links and their capacity to construct a spanning
tree. Then, Khabbaz [IK82] expanded on Whitney's work and he did not restrict
himself to a tree network topology. He used maximally connected network topologies
with minimum diameter, which is a special case of an unconstrained topology with
limit on the path length. Our problem is di�erent from the above works because
we identify the type of the �le storage locations (server or proxy) and determine
the amount of their storage space. Also, our network design is not constrained to a
speci�c network technology. This re ects a realistic computer network that uses o�-
the-shelf components, where a network can contain a combination of technologies.
Their techniques may not work for today network design process, because today a
network design problem is more complex and it has many possible infrastructures
and network technology options.
3.3 Design Automation Tools
The design automation tools relevant to this work consist of techniques and software
tools to automatically design and analyze better computational structures faster,
cheaper and more reliably than human designers. We are interested in tools for
network architecture and data management system design and analysis.6 However,
most of the research and commercial network tools are focused on network analysis
because automatic network and data management synthesis is a complex problem
due to the large design space, and the in exibility of design techniques.
The design automation �eld has several levels, where a problem can be tackled.
Table 3.3 compares all levels based on components involved in each level. Our
application-speci�c intranet hardware infrastructure problem lies in the distributed-
level of the design automation hierarchy. At this level, we are dealing with the
6The network and data management design and analysis tools can also be called capacity plan-ning tools.
34
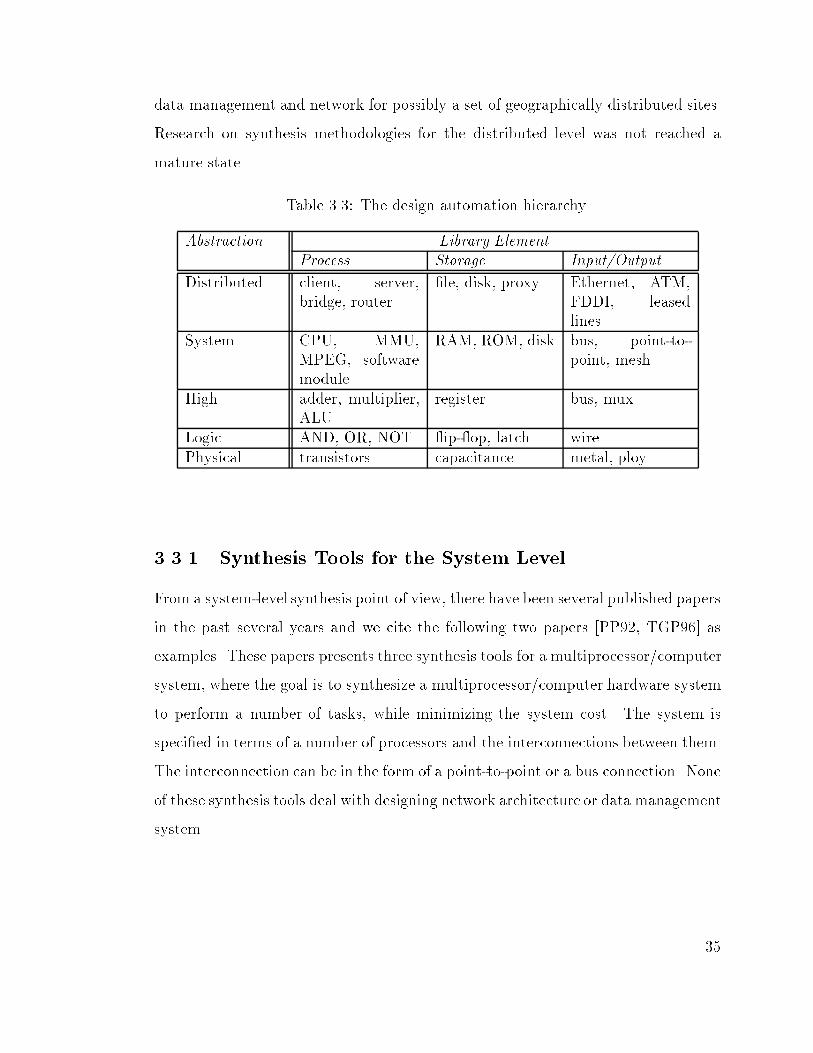
data management and network for possibly a set of geographically distributed sites.
Research on synthesis methodologies for the distributed level was not reached a
mature state.
Table 3.3: The design automation hierarchy.
Abstraction Library ElementProcess Storage Input/Output
Distributed client, server,bridge, router
�le, disk, proxy Ethernet, ATM,FDDI, leasedlines
System CPU, MMU,MPEG, softwaremodule
RAM, ROM, disk bus, point-to-point, mesh
High adder, multiplier,ALU
register bus, mux
Logic AND, OR, NOT ip- op, latch wirePhysical transistors capacitance metal, ploy
3.3.1 Synthesis Tools for the System Level
From a system-level synthesis point of view, there have been several published papers
in the past several years and we cite the following two papers [PP92, TGP96] as
examples. These papers presents three synthesis tools for a multiprocessor/computer
system, where the goal is to synthesize a multiprocessor/computer hardware system
to perform a number of tasks, while minimizing the system cost. The system is
speci�ed in terms of a number of processors and the interconnections between them.
The interconnection can be in the form of a point-to-point or a bus connection. None
of these synthesis tools deal with designing network architecture or data management
system.
35

The �rst tool by Prakash and Parker [PP92] describes SOS7, which is a synthe-
sis tool for application-speci�c heterogeneous deterministic multiprocessor systems.
Given are a task ow graph, a processor library and some cost and performance
constraints. The task ow graph represents the problem executed by the multipro-
cessor. The library consists of general and special-purpose processors. The authors
developed a formal model of multiprocessor synthesis using mixed integer linear pro-
gramming (MILP). By solving the MILP formulation, SOS synthesizes non-inferior
designs, which satisfy the timing and sequencing constraints de�ned on the task
ow graph, while minimizing the system cost. The synthesis results of SOS include
selecting the number and types of processors which best handle the given tasks, and
synthesizing a multiprocessor architecture by determining the interconnection style.
SOS schedules tasks in the task ow graph on the selected processors as well as the
data transfer activities among processors. Also, SOS computes the amount of local
memory, which is used as a storage for the code and temporary computation result
for each processor in the synthesized multiprocessor system.
The second tool by Tirat-Gefen and Parker [TGP96, TGSP97] describes an ex-
tension to SOS which is called MEGA to synthesize heterogeneous multiprocessor
systems with task-level pipelining. A genetic programming paradigm was used in
MEGA to search for good solutions. The authors considered two other computing
models in addition to the traditional deterministic computing model: a probabilistic
and an imprecise model. In the probabilistic model, the execution time of a task
on a given processor is treated as a random variable rather than a constant. In the
imprecise model, the execution time of a task is divided into two parts: a mandatory
part and an optional part.
7SOS stands for Synthesis Of Systems.
36

3.3.2 Evolutionary Computations as Optimization Techniques
Evolutionary computations, based on genetic algorithms, are becoming important
techniques for solving many hard optimization problems, such as optimization of
functions with linear and nonlinear constraints, the traveling salesman problem, and
problems of scheduling, partitioning, and control [Mic94]. The concept of genetic al-
gorithms is based on the natural evolution of Darwin (survival of the �ttest) [For93].
Professor John Holland at the University of Michigan �rst proposed genetic algo-
rithms as heuristic search techniques in the early 1970s [SP94]. Theoretical foun-
dations of genetic algorithms have been developed as shown by the following pa-
pers [BD93, BV93, AC93, Fog94, Rud94].
Genetic algorithms emulate a design process that is suited for the intranet in-
tegration problem by alternating between design and optimization processes. This
is how a data management system and network architecture are designed in reality.
For example, a designer places one server in a certain location and if it yields a
good client-server performance, then there is no need to relocate the server. Oth-
erwise, the designer either places a new server in a di�erent location or relocates
the old server to improve the client-server performance. As another example, a
designer selects one type of a network hub in an ad hoc manner. If the selection
yields a good network design, then there is no need to modify the network hub.
Otherwise, the designer selects another choice, until a good design is produced.
Use of genetic algorithms in network synthesis has already begun with promising
results [PK95, KTC+97, ES96, BMM+, PL98].
3.4 Multimedia Systems
Development of multimedia systems has attracted a great deal of academic and com-
mercial interest in past few years. Most of the published papers focus on a speci�c
area of multimedia systems, such as server and client characteristics [BC95, CBC95],
37

memory management for multimedia applications [DSST95, RV91, Pan97], network
protocol with resource reservation [DSST95, MCKA95, ZDE+93], multimedia �le
systems [RV91], operating systems for multimedia environments [RVG+95], multime-
dia synchronization [LG90, All83], data compression [Fox91] and data caching [Koz97,
KWW97, OCAV97, HRP97, HPRdSJ97].
3.4.1 Data Caching
The problem most relevant to this research is data caching, which is related to
the server/proxy placement problem and the �le allocation problem, where data
(�le) is needed to be stored closer to the users so that the network services are
reduced/eliminated. The placement problem is to determine the number, type loca-
tions, process and storage requirements of all needed servers/proxies, as well as the
type of binding between the placed proxies and the pre-existing servers. The recent
work by Kozuck [KWW97, Koz97] presents a distributed algorithm for determining
locations in a tree-network topology where cached copies of video documents should
be placed. The authors modi�ed the �le allocation problem into a branch library
allocation problem. The branch library is a special proxy that only maintains copies
of documents from a single server (one-to-one binding), where a regular proxy main-
tains copies from several servers (one-to-many binding) which is a harder problem
to solve for. In our problem, we are dealing with a regular proxy that can bind
with several servers. This way a proxy can forward a request to a number of servers
for faster reply. One-to-many binding generates more tra�c on the network than
one-to-one binding.
A soft caching management technique for image �les over a slow link is described
in [OCAV97], where a proxy maintains low resolution image �les that can be deliv-
ered to users faster. If the users want to render the high resolution image �le, then
the proxy retrieves the rest of the �le from the server. A soft cache assumes that the
38

data management structure (server, proxy and their storage space) is already pre-
placed. In our problem, we synthesize the data management system by determining
the number, locations, and storage space of the �le servers/proxies.
We considered the problem of caching multimedia web documents to clients in
real time while placing the least demands on network resources such as network
bandwidth and intermediate storage [HRP97]. We proposed two hierarchical mod-
els to specify the multimedia web document presentation requirements. In the �rst
model, an object ow can be modeled as an object ow graph (OFG). A node rep-
resents an object type and an edge represents a data ow. Each node is associated
with four di�erent operations: fetch performs the retrieving of the requested ob-
ject within the server storage hierarchies, transmit performs the transmission of the
requested object from a server to client(s) via a network, process performs any pre-
rendering services on the object such as decoding, and render performs the display
of the object. All these operations must be done in sequence with respect to each
node in OFG. These operations may be performed at di�erent locations. In the sec-
ond more detailed model, an extended object ow graph (EOFG) contains the four
operations embedded within each node in the OFG. The goal of an is to illustrate
the dependencies associated with the object ow and the operations.
We expanded on [HRP97] by developing a multimedia object scheduler that can
schedule multimedia system resources for optimal or near optimal performance. The
scheduler takes the execution time of each operation and the presentation time con-
straints as inputs. It produces a timing diagram as an output, illustrating the time of
each operation occurrence. We modeled the synchronization of multimedia objects
into two levels of abstraction. At the higher level (OFG), media objects are related
according to their client timing requirements. At the lower level (EOFG), the opera-
tions can be modeled as a system of di�erence constraints, which is a special case of
linear programming. Our scheduler used the Bellman-Ford algorithm, single-source
shortest-path, to �nd a solution for the system of di�erence constraints [HPRdSJ97].
39

Chapter 4
The Design Problem Model
4.1 Background
The intranet integration design problem consists of the underlying three-level net-
work architecture design problem and data management system design problem.
The two design problems are not independent and good solutions are not guaranteed
when these two problems are solved separately. The design decisions of the three-
level network design problem involve the numbers, types, locations and capacities
of network resources for each level. The design decisions of the data management
system design problem involve the numbers, locations, processing capacities and
storage capacities of �le servers, and the storage allocation for �les.
To achieve good solutions for these problems, we have formulated them as one
combined optimization problem. We have used informal mixed integer non-linear
programming notation to represent the intranet integration problem. This model
gives us a clear picture and easy way to verify or change some aspects of the prob-
lem. This model also gives us a precise and comprehensive set of design rules that
i -CAD must check when performing mutation and crossover. These rules have in-
formally been incorporated into the i -CAD code. However, we are not using any
mathematical programming techniques to search for the optimal solutions due to
40

the complexity and the large design space of the problem. Instead, we are using a
genetic algorithm to search for good solutions.
The research methodology we followed was to create the network design model
and network design software �rst. Solving this simpli�ed model allowed us to test
our network design strategy independently of our data management design strategy.
We followed a similar methodology for data management, testing the data manage-
ment model and software independently. Then, the software was combined, and a
comprehensive solution for data management and network design produced for sev-
eral examples. The model description here is decomposed into two sets of constraints
and two objective functions, one for data management, as shown in Figure 4.1, and
one for network, as shown in Figure 4.2. This decomposition mirrors our method-
ology. In order to further simplify presentation of the model, design constraints
are presented in this chapter, while performance constraints are presented later, in
Chapter 5.
ServerConstraints
Hard DiskConstraints
FileAllocationConstraints
DataManagement
DesignConstraints
ServerPerformanceConstraint
DataManagementPerformanceConstraints
ServerCost
Hard diskCost
DataManagement
ObjectiveFunction
Data ManagementSystem Model
Figure 4.1: An overview of the data management model.
The rest of this chapter is organized into �ve sections. Section 4.2 describes the
formulation of the three-level network design constraints. Section 4.3 describes the
network design objective function. Section 4.4 describes the formulation of the data
41

NetworkDesign
Constraints
GroupNetwork
Constraints
SiteNetwork
Constraints
BackboneNetwork
Constraints
NetworkPerformanceConstraints
NetworkCapacity
Constraints
NetworkDelay
Constraint
NetworkObjectiveFunction
NetworkComponent
Cost
NetworkInterconnection
Cost
NetworkWireCost
Network ArchitectureModel
Figure 4.2: An overview of the network model.
management system design constraints. Section 4.5 describes data management sys-
tem design objective function. Section 4.6 describes the overall intranet integration
objective function.
4.2 Network Design Constraints
The network design constraints consist of three sets: group network constraints, site
network constraints and backbone network constraints. Our goals for the group,
site and backbone design constraints are to guide i -CAD to synthesize a correct and
complete three-level network architecture, provide a model for simultaneous synthe-
sis of all network levels, and form a model for the network synthesis problem. This
model can then be scaled or adapted with respect to a given problem or the future
availability of new network technology. To describe the constraints and objective
function mathematically, we need to de�ne the input parameters, the design pa-
rameters, and the binary variables that are related to the network design problem.
The main input parameter, a client location table, is input by the network planners
to i -CAD to specify in detail the physical locations of all clients and their alloca-
tion with respect to group tasks and site tasks. Other input parameters related to
performance (client tra�c matrix, data request table, threshold network delay, and
42

threshold data management performance) are not included in this model since they
don't relate to structure.
� The client location table (CLT) is a D � 5 matrix, where D indicates the
total number of client tasks. Each row indicates a client task's (workstation)
physical location information. The �rst column (CT) represents all the client
tasks in the intranet's application, ranging from 1 to D. The second, third
and fourth columns indicate the client's �xed location in X, Y, Z space, which
represents the physical width, height and depth of a building respectively. The
coordinates are measured in feet (or meters). The fourth and �fth columns
indicate the allocation of a client task (CT) within a group task (GT) and
a site task (ST) respectively. A client task is located within one group task;
moreover, a group task is located within one site task. Table 4.1 shows an
example of a client location table.
Table 4.1: A client location table (CLT).
CT X Y Z GT ST
1 10 20 1 2 12 8 45 15 1 23 30 5 30 6 1. . . . . .. . . . . .D 40 10 1 4 10
The Design parameters represent the outputs of i -CAD: the numbers, types, lo-
cations, and capacities of network hardware resources, such as switches, multiaccess
devices, routers, bridges, leased lines, SONET and virtual private connections.
The Binary variables are 0-1 variables that represent the implementation deci-
sions regarding the network design problem (use = 1, don't use = 0). There are
three types of binary variables de�ned:
43

� Allocation variables: The variables of this type specify the network hardware
resources that are being included in the intranet infrastructure. The list of
all network allocation variables includes the following (de�nitions and use of
these variables are explained in later sections in this chapter):
1. group network-connector �o,
2. site network-connector u,
3. site router Xt,
4. site-group bridge �r,
5. backbone network-connector �z ,
6. backbone router �y,
7. backbone leased line Lh,
8. backbone optical line Ok,
9. backbone virtual private line Vq, and
10. backbone-site bridge �w.
� Binding variables: The variables of this type assign the allocated network
hardware resources to the application's tasks. These variables are used mostly
to bind a network connector to a group, site, or backbone, for example. The
list of all network binding variables includes the following (de�nitions and use
of these variables are explained in later sections in this chapter):
1. client task (workstation) to group task �d;e,
2. group task to site task Ge;f ,
3. site task to backbone task �f;BT ,
4. group network-connector to group task �o;e,
5. site network-connector to site task �u;f ,
44

6. site router to site task �t;f ,
7. backbone network-connector to backbone task z;BT ,
8. backbone router to backbone task !y;BT ,
9. backbone leased line to backbone tree's link �h;i,
10. backbone optical line to backbone tree's link �k;i, and
11. backbone virtual private line to backbone tree's link �q;i.
� Connection variables: The variables of this type indicate a physical connection
between the hardware resources. These variables are used to show a connection
between a workstation and a network connector's port, for example. The list
of all network connection variables includes the following (de�nitions and use
of these variables are explained in later sections in this chapter):
1. device (workstation, server) to group network 'dt;di;gnt;gnpi,
2. group network to site network �gnt;gnpi;snt;snpi,
3. bridge interface between group network and site network �r;gnt;gnpi;snt;snpi,
4. site network to backbone local network �snt;snpi;bnt;bnpi,
5. site network to backbone wide network �snt;snpi;blt;bli, and
6. bridge interface between site network and backbone network �w;snt;snpi;bnt;bnpi.
In this model, we separate the problem of allocating and binding of network
hardware resources into two smaller problems only for the initial design generation
so that the problem becomes more understandable. Also, this decomposition could
facilitate a separate solution to the allocation and binding problems, allowing them
to be solved at separate stages in the design process. It allows the i -CAD software to
explore many di�erent possible bindings without changing the resources allocated.
45

4.2.1 Group Network Constraints
The group network constraints insure that all the client tasks (workstations) within
a group task can communicate with each other e�ciently so that they can carry
out the group task. Each client task is bound to one workstation and vice versa.
The design decision here is to select one network component, which can be either
a switch or multiaccess device. A switch protocol is based on a virtual circuit
setup, where a multiaccess device protocol is based on either randomly sharing
a single media (such as Ethernet) or perfectedly scheduled access (such as Token
Ring). The selected group network connector must handle all group task's design
and performance requirements.
The reason we limit each group task to one switch or multiaccess device is to
reduce the infrastructure cost and simplify the problem. Client tasks with signif-
icantly di�erent communication requirements should be placed in di�erent groups
ideally. In our future research, we will select multiple group network connectors to
connect all the workstations within a group task. Next, we describe three group
network constraints:
1. group-network-connector (GNCo) selection constraint: only one group network
connector GNCo can be allocated and bound to a group task GTe, as shown
in Figure 4.3. Thus, for each group task GTe, the following must be satis�ed:
X
8GNCo
�o � �o;e = 1, For each GTe (4.1)
Constraint 4.1 insures that only one group network connector GNCo is allo-
cated (�o) and bound (�o;e) to a group task GTe. GNCo is a design parameter
and the index o indicates the group network connector number. GTe is a group
task, which is an input parameter, and the index e indicates the group task
number. �o is an allocation variable; �o = 1 indicates that a group network
connector GNCo is being included in the synthesized intranet infrastructure.
46

�o;e is a binding variable; �o;e = 1 indicates that an allocated group network
connector GNCo is bound to a group task GTe.
GroupTaskGTe
GroupNetwork
ConnectorGNCo
allocation
binding φo,e
o
Figure 4.3: Group network allocation and binding variables.
2. group-network-connector-port constraint: a group network connector GNCo
must not connect more workstationsWd than its maximumnumber of available
ports NPGNCo . Thus, for each allocated group network connector GNCo, the
following must be satis�ed:
X
Wd2GTe
�d;e � (NPGNCo � G) (4.2)
Constraint 4.2 insures that the total number of all workstations Wd (client
tasks) within a group task GTe must not exceed the maximum number of
ports of its allocated and bound group network connector GNCo. �d;e is a
binding variable; �d;e = 1 indicates that a workstation Wd is located in (bound
to) group task GTe. NPGNCo is an integer value that refers to the maximum
number of available ports within the group network connector GNCo. This
value is given in the network connector design library. G is an integer variable
which is subtracted from the right-hand-side of 4.2 and indicates one or more
ports may be dedicated to a site network and server. G is de�ned by another
constraint given later.
47

3. workstation to group-network connection constraint: a workstation Wd must
be connected to a group network connector GNCo, where Wd and GNCo are
bound to the same group task GTe. Thus, for each workstation Wd within
GTe, the following must be satis�ed:
X
8gnpi2gnt
'dt;di;gnt;gnpi = 1 For dt = Wd 2 GTe and di = d (4.3)
Constraint 4.3 insures that a workstation is connected to one and only one
port of the allocated and bound group network connector. 'dt;di;gnt;gnpi is a
connection variable. dt is the device type (workstation, server), di is the
device identi�cation (in the case of a workstation, di has a range of values
between 1 to D, where D refers to the total number of workstations within
the intranet)1, gnt is the group network type (Ethernet, ATM), and gnpi is
the group network port identi�cation (1 to NPGNCo). NPGNCo represents the
maximumnumber of available ports within a group network connector GNCo.
4.2.2 Site Network Constraints
The site network constraints insure that all the group tasks within a site can com-
municate among themselves e�ciently so that they can carry out the site task. The
design decision here is to select one network component, which can be either a
switch, multiaccess device, or router. The constraints are provided to resolve the
inter-group routing problem, since a site network is a complex problem because each
site interfaces between a set of group LANs and the backbone. The complexity is
due to the heterogeneity of the network technologies used within each group, where
each technology might use a di�erent communication protocol. A group network
connector can be either a switch or multiaccess device. On the other hand, a site
1In the case of a server, the range of di is given in Section 4.4, Data Management DesignConstraints.
48

can contain either a router, switch or multiaccess device. A router is used to connect
two or more network connectors that may or may not be similar. A router employs
the Internet Protocol (IP) to move the packets through the network. Based on the
selected site and group network components, the intranet integration cost may incur
an interconnection cost. This cost re ects the installing of a protocol translator so
that both site and group network components can communicate with each other.
The reason we limit each site task to either one switch, one multiaccess device
or one router is to reduce the cost and simplify the problem. In our future research,
we will select multiple routers or site network connectors to connect all the group
tasks within a site task. The next four constraints are formulated to insure a correct
heterogeneous network design between a site and its groups.
1. site network selection constraint: only one site router SRt or one site network
connector SNCu can be allocated and bound to a site task STf , as shown in
Figure 4.4. Thus, for each site task STf , the following must be satis�ed:
X
8SNCu
(u � �u;f) + (1 �u)X
8SRt
(Xt � �t;f) = 1 (4.4)
Constraint 4.4 limits the allocation and binding of either one site network con-
nector or one site router per site task. This forces a star topology on a site
network, where the centralized hub represents a site network connector (site
router); moreover, the nodes represent all group network connectors and back-
bone network connections. STf is a site task, which is an input parameter, and
the index f indicates the site task number. SNCu is a site network connector,
which is a design parameter, and the index u indicates the site network connec-
tor number. u is an allocation variable; u = 1 indicates that a site network
connector SNCu is being included in the synthesized intranet infrastructure.
�u;f is a binding variable; �u;f = 1 indicates that an allocated site network
49
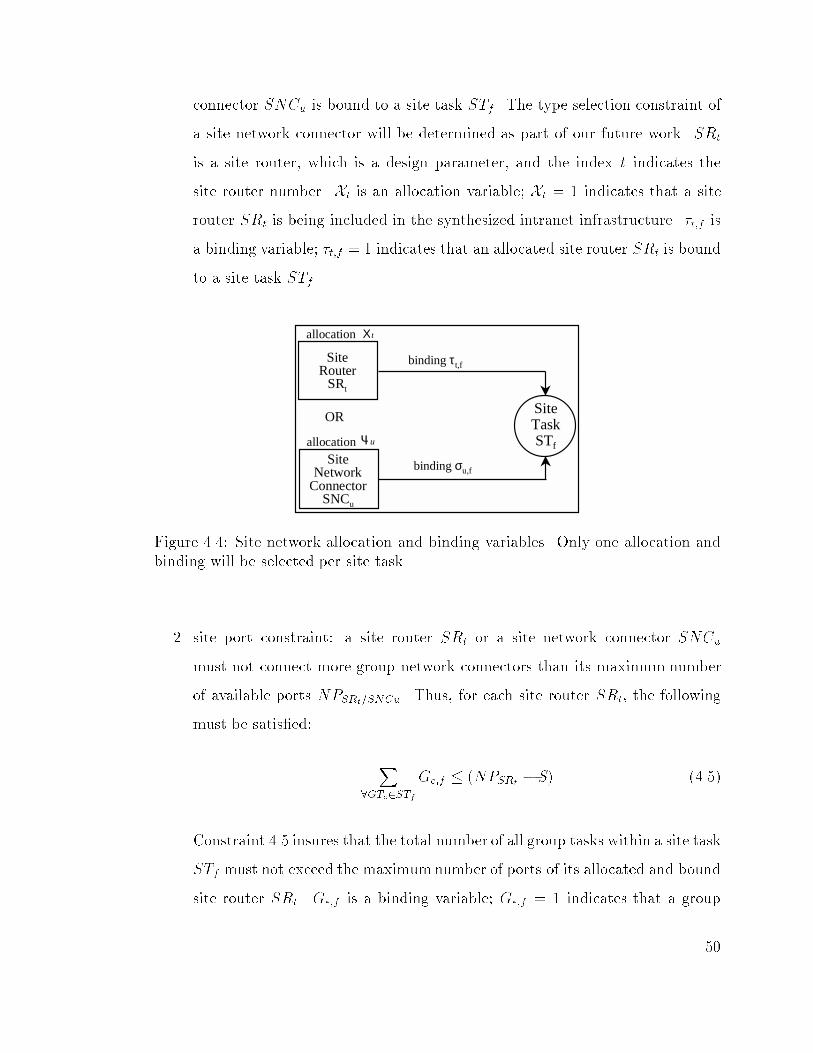
connector SNCu is bound to a site task STf . The type selection constraint of
a site network connector will be determined as part of our future work. SRt
is a site router, which is a design parameter, and the index t indicates the
site router number. Xt is an allocation variable; Xt = 1 indicates that a site
router SRt is being included in the synthesized intranet infrastructure. �t;f is
a binding variable; �t;f = 1 indicates that an allocated site router SRt is bound
to a site task STf .
SiteTaskSTf
OR
uΨallocation
binding σu,fSite
NetworkConnector
SNCu
SiteRouter
SRt
tΧallocation
binding τt,f
Figure 4.4: Site network allocation and binding variables. Only one allocation andbinding will be selected per site task.
2. site port constraint: a site router SRt or a site network connector SNCu
must not connect more group network connectors than its maximum number
of available ports NPSRt=SNCu. Thus, for each site router SRt, the following
must be satis�ed:
X
8GTe2STf
Ge;f � (NPSRt � S) (4.5)
Constraint 4.5 insures that the total number of all group tasks within a site task
STf must not exceed the maximumnumber of ports of its allocated and bound
site router SRt. Ge;f is a binding variable; Ge;f = 1 indicates that a group
50
task GTe is located in site task STf . NPSRt is an integer value that refers to
the maximum number of ports within a site router SRt. This value is given
in the router design library. S is an integer variable, which is subtracted from
the right-hand-side of 4.5 and indicates one or more ports may be dedicated to
backbone network connections. S is de�ned by another constraint. A similar
constraint for a site network connector is described by Constraint 4.5a, which
insures that the total number of all group tasks within a site task STf must not
exceed the maximum number of ports of its allocated and bound site network
connector SNCu. NPSNCu is an integer value that refers to the maximum
number of ports within a site network connector SNCu. This value is given in
the network connector design library.
X
8GTe2STf
Ge;f � (NPSNCu � S) (4.5a)
3. group-network to site network connection constraint: a group network must be
connected to a site network. Thus, for each group network connector GNCo
within a site task STf , the following constraint must be satis�ed:
X
8snpi2snt
�gnt;gnpi;snt;snpi = 1, For gnt = GNCo 2 STf and gnpi = o
(4.6)
Constraint 4.6 insures that an allocated and bound group network connector
GNCo is connected to one port of a site network. �gnt;gnpi;snt;snpi is a connection
variable that connects group networks to site networks. gnt is the group net-
work type (Ethernet, ATM), gnpi is the group network port identi�cation (1
to NPGNCo), snt is the site network type (Ethernet, ATM, Router), and snpi
is the site network port identi�cation (range from 1 to NPSNCu or NPSRt).
51

4. site-bridge constraint: if both the group and site network connectors are based
on multiaccess network technology, then a site bridge (SBr) must be installed
between them. A bridge performs the moving and routing of addressed packets
from a group network connector to a site network connector and vice versa,
when both site and group networks use an identical transmission medium and
access control. A bridge operates at the data-link layer of the Open System
Interconnection (OSI) model. The constraint below insures that a bridge is
used as an interface between a group network connector and a site network
connector, in the case when both the group and site networks are based on
multiaccess network technology (such as an Ethernet).
X
8SBr
X
8gnpi2gnt
X
8snpi2snt
(�r � �r;gnt;gnpi;snt;snpi) = 1 (4.7)
Constraint 4.7 insures that an allocated and bound group network connector
GNCo and an allocated and bound site network connector SNCu are connected
by an allocated (�r) site bridge SBr. �r is an allocation variable; �r = 1
indicates that a site bridge SBr is being included in the synthesized intranet
infrastructure. The index r represents the bridge identi�cation. �r;gnt;gnpi;snt;snpi
is a connection variable. gnt is the group network type (Ethernet), gnpi is the
group network port identi�cation (1-NPGNCo ), snt is the site network type
(Ethernet), and snpi is the site network port identi�cation (1-NPSNCu ).
4.2.3 Backbone Network Constraints
The backbone network constraints insure that all the site tasks within the backbone
can communicate among themselves e�ciently so that they can carry out the enter-
prise's application. The design decision here is to determine the type of backbone
topology and to select a network technology. The physical dimension of an enter-
prise's backbone network is a factor in selecting a network technology to connect all
52

the sites, since all sites may be located either across a campus, city, state or country.
The constraints are provided to determine the backbone topology, select the network
technology, and resolve the inter-site routing problem, which is very similar to the
inter-group routing problem within a site.
The backbone topology can be either a local star topology or a wide tree topology.
A local star topology is selected when the physical locations of all site tasks are
located very close to each other, for example when all site tasks are located within
a university campus. On the other hand, a wide tree topology is selected when
the physical locations of all site tasks are located across a city, state or country.
The network technology options that are considered for a backbone network design
are: private leased lines (T-carrier systems), optical leased lines (SONET), virtual
private connections (internet service provider (ISP) connections), IP routers, and
network connectors (switch or multiaccess device). Each technology o�ers di�erent
characteristics such as protocol, installation cost, monthly cost and capacity. The
�rst three options: T-carrier systems, SONET and VPC connections are used when
the sites are geographically located across a city, state or country. In this case, the
backbone network is con�gured as a wide tree topology. The reason we select a tree
topology is to reduce the backbone network cost, since a tree uses a minimumnumber
of links to connect all its nodes. When one of the last two options (IP routers and
network connector) is selected, the backbone is con�gured as a local star topology.
The reason we select a star topology is to reduce the cost and simplify the problem
by selecting either one router or one network connector to connect all the sites. In
the future other backbone topologies will be considered.
Base on the selected backbone and site network components, the intranet inte-
gration cost may include an interconnection cost. This cost re ects the installing
of a protocol translator so that both backbone and site network components can
communicate with each other. The next �ve constraints are formulated to govern
the backbone network design.
53

1. backbone topology constraint: a backbone topology can be either a local star
topology or a wide tree topology. If the center of mass between all site tasks
within the backbone is less than or equal to a backbone distance threshold
(BDT), then the backbone is considered as a local star topology. Otherwise,
the backbone topology is considered a wide tree topology, T(N,L). BDT is a
real number given as an input and it is set to equal one mile (5,200 feet). N
and L represent site-task STf nodes and backbone links BLi respectively. f
and i indicate the identi�cations of site task and backbone link respectively.
2. backbone network technology selection constraint: only one network technol-
ogy is allocated and bound for the backbone network. The option is either
backbone leased lines (BLLh), backbone optical leased lines (BOLLk), back-
bone virtual private connections (BV PCq), a backbone router (BRy) or a
backbone network connector (BNCz), as shown in Figure 4.5. We separate
the backbone network selection into �ve constraints for presentation clarity
only, but only one of them must be satis�ed depending on which backbone
technology is chosen.
X
8i2L
Lh � �h;i =X
8STf2BT
�f;BT � 1 (4.8)
For each Backbone Leased Line BLLh
Constraint 4.8 limits the number of allocated and bound backbone leased lines
to the total number of site tasks in the backbone network, subtracted by one.
This forces a tree topology on the backbone network. BLLh is a backbone
leased line, which is a design parameter, and the index h indicates the back-
bone leased line number. Lh is an allocation variable; Lh = 1 indicates that a
backbone leased line BLLh is being included in the synthesized intranet con�g-
uration. �h;i is a binding variable; �h;i = 1 indicates that an allocated backbone
leased line BLLh is bound to a link i within the synthesized backbone tree.
54

�f;BT is a binding variable; �f;BT = 1 indicates that a site task STf is bound to
the backbone task BT. The next four constraints present the other options for
BackboneTaskBT
OR
OR
OR
qV
y∆
zΓBackboneNetwork
ConnectorBNCz
BackboneRouter
BRy
BTz ,γ
allocation
binding
Backbonevirtual private
connectionBVPCq
BackboneOptical
Leased LineBOLLk
BackboneLeasedLineBLLh
OR
allocation
binding ωy,BT
allocation
binding iq ,δ
allocation
binding
ih ,ε
allocation
binding
kΟ
ik ,α
hL
Figure 4.5: Backbone network allocation and binding variables. Only one optionwill be selected for the backbone task.
the backbone network design. Constraint 4.8a limits the number of allocated
and bound backbone optical leased lines (SONET) to the total number of site
tasks in the backbone network, subtracted by one. This forces a tree topology
on the backbone network. BOLLk is a backbone optical leased line, which is
a design parameter, and the index k indicates the backbone optical leased line
number. Ok is an allocation variable; Ok = 1 indicates that a backbone optical
leased line BOLLk is being included in the synthesized intranet con�guration.
55

�k;i is a binding variable; �k;i = 1 indicates that an allocated backbone optical
leased line BOLLk is bound to a link i within the synthesized backbone tree.
X
8i2L
Ok � �k;i =X
8STf2BT
�f;BT � 1 (4.8a)
For each SONET BOLLk
Constraint 4.8b limits the number of allocated and bound backbone virtual
private connections to the total number of site tasks (F) in the backbone net-
work, subtracted by one. This forces a tree topology on the backbone network.
BV PCl is a backbone virtual private connection, which is a design parame-
ter, and the index l indicates the backbone virtual private connection number.
Vl is an allocation variable; Vl = 1 indicates that a backbone virtual private
connection BV PCl is being included in the synthesized intranet con�guration.
�l;i is a binding variable; �l;i = 1 indicates that an allocated backbone virtual
private connection BV PCl is bound to a link within the synthesized backbone
tree.
X
8i2L
Vl � �l;i =X
8STf2BT
�f;BT � 1 (4.8b)
For each virtual private connection BV PCl
Constraint 4.8c limits the number of allocated and bound backbone routers to
one. This forces a star topology on the backbone network, where the central-
ized hub represents an allocated and bound backbone router; moreover, the
nodes represent all site network connections. BRy is a backbone router which
is a design parameter, and the index y indicates the backbone router number.
�y is an allocation variable; �y = 1 indicates that a backbone router BRy is
being included in the synthesized intranet con�guration. !y;BT is a binding
56

variable; !y;BT = 1 indicates that an allocated backbone router BRy is bound
to the backbone task (BT).
X
8BRy
�y � !y;BT = 1 for IP router (4.8c)
Constraint 4.8d limits the number of allocated and bound backbone network
connector to one. This forces a star topology on the backbone network, where
the centralized hub represents an allocated and bound backbone network con-
nector; moreover, the nodes represent all site network connections. BNCz is a
backbone network connector, which is a design parameter, and the index z in-
dicates the backbone network connector number. �z is an allocation variable;
�z = 1 indicates that a backbone network connector BNCz is being included
in the synthesized intranet con�guration. z;BT is a binding variable; z;BT =
1 indicates that an allocated backbone network connector BNCz is bound to
the backbone task (BT).
X
8BNCz
�z � z;BT = 1 for backbone network connector
(4.8d)
3. backbone port constraint: a backbone router BRy (or a backbone network
connector BNCz) must not connect more site network connections than its
maximum number of ports NPBRy=BNCz. Thus, for a backbone router BRy,
the following must be satis�ed:
X
8STf2BT
�f;BT � NPBRy (4.9)
Constraint 4.9 insures that the total number of site tasks within the backbone
task must not exceed the maximum number of available ports within its allo-
cated and bound backbone router BRy. �f;BT is a binding variable; �f;BT = 1
57

indicates that a site task is bound within the backbone task (BT). NPBRy is an
integer value that refers to the maximum number of ports within a backbone
router BRy. This value is given in the router design library. A similar con-
straint for a backbone network connector is described by the constraint 4.9a,
which insures that the total number of site tasks within the backbone task
must not exceed the maximum number of ports of its allocated and bound
backbone network connector BNCz. NPBNCz is an integer value that refers to
the maximum number of ports within a backbone network connector BNCz.
This value is given in the network connector design library.
X
8STf2BT
�f;BT � NPBNCz (4.9a)
4. site-network to backbone-local-network connection constraint: this constraint
insures that each site network is connected to the backbone local network.
Figure 4.6 shows all possible connections between site and backbone networks,
when the backbone network is a local star topology. �snt;snpi;bnt;bnpi is a con-
nection variable. snt is the site network type (Ethernet, ATM, Router), snpi
is the site network port identi�cation (1 to NPSNCu or NPSRt), bnt is the
backbone network type (Ethernet, ATM, Router), and bnpi is the backbone
network network port identi�cation (1 to NPBNCz or NPBRy). When both site
and backbone network connectors are identical (Ethernet), a backbone bridge
BBw is installed between the identical site and backbone network connectors.
�w is an allocation variable; �w = 1 indicates that a backbone bridge is being
included in the synthesized intranet con�guration. �w;snt;snpi;bnt;bnpi is a connec-
tion variable. snt is the site network type (Ethernet), and bnt is the backbone
local network type (Ethernet).
5. site-network to backbone-wide-network connection constraint: this constraint
insures that each site network is connected within the wide backbone tree
58

SiteRouter
SRt
SiteNetwork
ConnectorSNCu
BackboneRouter
BRy
BackboneNetwork
ConnectorBNCz
OR
BackboneBridgeBBW
port l
port b
port g
port a
π snt,b
,bnt
,g
πsnt,b,bnt,a
ηw,snt,b,bnt,a
connection variables
πsnt,l,bnt,a
πsnt,l,bnt,g
Figure 4.6: Local network interfaces between site networks and backbone networks.
topology. Figure 4.7 shows all possible connections between site and backbone
networks, when the backbone network is a wide tree topology. �snt;snpi;blt;bli is
a connection variable. snt is the site network type (Ethernet, ATM, Router),
snpi is the site network port identi�cation (1 to NPSNCu or NPSRt), blt is the
backbone link type (T-carrier, SONET, VPN), and bli is the backbone link
identi�cation (1 to (F-1)), where F is the total number of site tasks within the
intranet.
4.3 Network Design Objective Function
The objective function is the network architecture cost (NAC), which consists of the
summation cost of component, interconnection and wire costs as shown in Equa-
tion 4.10. The network hardware component cost (NHCC) re ects all network
hardware resources needed to integrate the three-level network. The network in-
terconnection cost (NIC) re ects the cost of protocol translators that are needed
to enable distinct group and site networks to communicate with each other, and
59

SiteRouter
SRt
SiteNetwork
ConnectorSNCu
BackboneLeased line
BLLh
BackboneOptical
Leased LineBOLLk
ORport l
port b
ρ snt,b
,blt,h
connection variables
BackboneVirtual
NetworkConnection
BVPCq
ORρsnt,b,blt,q
ρsnt,b,blt,k
ρsnt,l,blt,h
ρsnt,l,blt,kρ
snt,l,blt,q
Figure 4.7: Wide network interfaces between site networks and backbone networks.
distinct site and backbone networks to communicate with each other. The network
wire cost (NWC) re ects the cost of wires/cables that are needed to connect all
network hardware components.
NAC = NHCC +NIC +NWC (4.10)
4.3.1 Network Hardware Component Cost
The network hardware component cost (NHCC) re ects all network components that
are allocated and bound for the three network levels: group, site, and backbone. The
term NHCC can be expressed by summing the costs of a group network cost, a site
network cost and a backbone network cost.
60

4.3.1.1 Group Network Cost
The group network cost can be expressed as the sum of all group network connectors,
as shown in Equation 4.11.
group network cost =X
8GNCo
(�o �Co) (4.11)
Equation 4.11 sums all group network components in the synthesized intranet.
GNCo is a design parameter and the index o indicates the group network connector
identi�cation. �o is an allocation variable; �o = 1 indicates that a group network
connector GNCo is being included in the synthesized intranet infrastructure. Co is a
real number that refers to the cost of an allocated (�o = 1) group network connector
GNCo. Co is given by the group network connector design library.
4.3.1.2 Site Network Cost
The site network cost can be expressed as the sum of all site network connectors
and site routers, as shown in Equation 4.12.
site network cost =X
8SNCu
(u �Cu) +X
8SRt
(Xt �Ct) (4.12)
Equation 4.12 sums all site network components in the synthesized intranet. SNCu
is a design parameter and the index u indicates the site network connector identi�-
cation. u is an allocation variable; u = 1 indicates that a site network connector
SNCu is being included in the synthesized intranet infrastructure. Cu is real number
that refers to the cost of an allocated (u = 1) site network connector SNCu. Cu
is given by the site network connector design library. The other half of equation
represents the site router cost. SRt is a design parameter and the index t indicates
the site router identi�cation. Xt is an allocation variable; Xt = 1 indicates that a
site router SRt is being included in the synthesized intranet infrastructure. Ct is
61

real number that refers to the cost of an allocated (Xt = 1) site router SRt. Ct is
given by the site router design library.
4.3.1.3 Backbone Network Cost
The backbone network cost can be expressed as the sum of either backbone leased
lines, backbone optical leased lines, backbone virtual private connections, backbone
router or backbone network connector, as shown in Equation 4.13.
(�z � Cz) + (4.13)
(�y � Cy) +
backbone network cost =X
8BLLh
(Lh � (Ch +MSFBLLh)) +
X
8BOLLk
(Ok � (Ck +MSFBOLLk)) +
X
8VPNCq
(Vq � (Cq +MSFBVPCq ))
Equation 4.13 sums all backbone network components in the synthesized intranet.
BNCz is a design parameter and the index z indicates the backbone network con-
nector identi�cation. �z is an allocation variable; �z = 1 indicates that a backbone
network connector BNCz is being included in the synthesized intranet infrastruc-
ture. Cz is a real number that refers to the cost of an allocated (�z = 1) backbone
network connector BNCz. Cz is given by the backbone network connector design
library. BRy is a design parameter and the index y indicates the backbone router
identi�cation. �y is an allocation variable; �y = 1 indicates that a backbone router
BRy is being included in the synthesized intranet infrastructure. Cy is a real number
that refers to the cost of an allocated (�y = 1) backbone router BRy. Cy is given
by the backbone router design library.
62

BLLh is a design parameter and the index h indicates the backbone leased line
identi�cation. Lh is an allocation variable; Lh = 1 indicates that a backbone leased
line BLLh is being included in the synthesized backbone tree structure. Ch is a real
number that refers to the cost of an allocated (Lh = 1) backbone leased-line BLLh.
MSFBLLh refers to the monthly subscription fee of a backbone leased line. Both
Ch and MSFBLLh are given by the backbone leased line design library. BOLLk
is a design parameter and the index k indicates the backbone optical leased-line
identi�cation. Ok is an allocation variable; Ok = 1 indicates that a backbone optical
leased-line BOLLk is being included in the synthesized backbone tree structure.
Ck is a real number that refers to the cost of an allocated (Ok = 1) backbone
optical leased-line BOLLk. MSFBOLLk refers to the monthly subscription fee of a
backbone optical leased-line. Both Ck and MSFBOLLk are given by the backbone
leased-line design library. BV PCq is a design parameter and the index q indicates
the backbone virtual private connection identi�cation. Vq is an allocation variable;
Vq = 1 indicates that a backbone virtual private connectionBV PCq is being included
in the synthesized backbone tree structure. Cq is a real number that refers to the cost
of an allocated (Vq = 1) backbone virtual private connection BV PCq. MSFBVPCq
refers to the monthly subscription fee of a backbone virtual private connection. Both
Cq and MSFBVPCq are given by the backbone virtual private connection design
library.
4.3.2 Network Interconnection Cost
The network interconnection cost (NIC) re ects the cost of protocol translators that
are needed to enable distinct group and site networks to communicate with each
other, and distinct site and backbone networks to communicate with each other. The
63

network interconnection cost (NIC) can be expressed as the summation of group-
site interconnection cost (GSIC) and site-backbone interconnection cost (SBIC) as
shown in Equation 4.14.
NIC = GSIC + SBIC (4.14)
4.3.2.1 Group Interconnection Cost
The group-site interconnection cost (GSIC) re ects all group-site interconnection
cost after all network components are allocated and bound to group and site tasks.
GSIC =X
8STf
(X
8GTe2STf
ICe;f) (4.15)
Equation 4.15 sums all the interconnection costs between group networks and site
networks. ICe;f is a real number that indicates the cost to interconnect the network
component within a group task GTe to the network component within a site task
STf . ICe;f is given by the interconnection table cost, which is provided by the
designer to i -CAD.
4.3.2.2 Site Interconnection Cost
The site-backbone interconnection cost (SBIC) re ects all site-backbone interconnec-
tion cost after all network components are allocated and bound to site and backbone
tasks.
SBIC =X
8STf2BT
ICf;BT (4.16)
Equation 4.16 sums all the interconnection costs between site networks and backbone
network. ICf;BT is a real number that indicates the cost to interconnect the network
component within a site task STf to the network component within the backbone
64

task BT. ICe;BT is given by the interconnection table cost, which is provided by the
designer to i -CAD.
4.3.3 Network Wire Cost
The network wire cost (NWC) re ects the cost of wires/cables that are needed to
connect all client tasks within a group task, all group tasks within a site tasks
and all site tasks within the backbone task. The network wire cost (NWC) can be
expressed as the summation of group network wire cost (GNWC), site network wire
cost (SNWC) and backbone network wire cost (BNWC) as shown in Equation 4.17.
NWC = GNWC + SNWC +BNWC (4.17)
4.3.3.1 Group Wire Cost
The group network wire cost (GNWC) re ects all wire connections between client
tasks to a group network connector.
GNWC =X
8CTi2GTe
[Distance(loc(CTi); loc(GNCo))�WCPLwt]
(4.18)
Equation 4.18 sums the distance between client tasks and a group network connector
and multiplies it by the wire cost per unit length WCPLwt. Distance() is a function
that determines the physical distance between two locations. loc() is a function
that �nds the physical location of a task. WCPLwt is a real number that refers
to the wire cost per unit length (given by the wire design library). The index wt
refers to the wire type that is used to connect a workstation with the group network
connector. It can be either twisted pair, coaxial cable or �ber optic cable.
65

4.3.3.2 Site Wire Cost
The site network wire cost (SNWC) re ects all wire connections between group
networks to a site network.
SNWC =X
8GNCo2STf
[Distance(loc(GNCo); loc(SNCu=SRt))�WCPLwt]
(4.19)
Equation 4.19 sums the distance between group tasks and site network and multiplies
it by the wire cost per unit length WCPLwt.
4.3.3.3 Backbone Wire Cost
The backbone network wire cost (BNWC) re ects all wire connections between site
networks to a backbone network, when the backbone network is a local star topology.
BNWC =X
8SNCu=SRt2BT
[Distance(loc(SNCu=SRt); loc(BNCz=BRy))�WCPLwt]
(4.20)
Equation 4.20 sums the distance between site network components and backbone
network component and multiplies it by the wire cost per unit length (in case of a
local backbone topology). In case of a wide backbone topology, there is a monthly
subscription fee that replaces the wire cost, as indicated in Equation 4.13.
4.4 Data Management Design Constraints
The design decisions of the data management system design problem are the number,
locations, processing capacities and storage capacities of servers, and the storage al-
location for �les. A data management system can be either centralized or distributed
as shown in Figure 4.8. A centralized data management system can be comprised
of a single main frame server or a farm of servers, where one location within the
66

intranet is selected to house either approach. On the other hand, a distributed data
management system can be comprised of a number of distributed servers or a num-
ber of proxies attached to servers. The main di�erent between the distributed data
management system approaches is the content of servers and proxies. A server's
or proxy's content refers to the number and type of �les that are stored within a
server's or proxy's storage space. In the distributed servers approach, the content
of a server may not be a subset of other servers. In the distributed proxies attached
to servers approach, the content of a proxy is a subset of its binding server(s) and
also a proxy's content is directly related to its clients' requests.
CentralizedData Management
System
DistributedData Management
System
Concept ofData Management
System
mainframeserver
serverfarm
distributedservers
distributedservers with
proxies
Figure 4.8: The possible data management system design structures.
The centralized or distributed data management system has its advantages and
disadvantages, for example a centralized server can be easy to manage, but it may
cause a network congestion since all clients' requests and the server's replys are
concentrated in one spot (server location). On the other hand, distributed servers
may prevent network congestion since all clients' requests and servers' replies are
handled by a number of geographically distributed servers, for example. However,
distributed servers can be harder to manage, especially when there are proxies at-
tached. In this thesis, we focus on two data management systems: a centralized
67

server and distributed servers as shown in the shaded boxes in Figure 4.8. In our
future work, we plan to include the other two approaches.
The data management design constraints consist of two sets: the data manage-
ment hardware placement constraints and the �le allocation constraints. Our goals
for the data management design constraints are to guide i -CAD to place a number
of �le servers, allocate the �les into the allocated �le servers and form a model for
the data management system design problem. This model can then be scaled up
or down with respect to a given problem or availability of new data management
technology. To describe the constraints and objective function mathematically, we
need to de�ne the input parameters, the design parameters, and the binary variables
that are related to the data management design problem.
The Input parameter, a data request table, is given by the intranet planners to
i -CAD to specify in detail the requests of each �le by all client tasks.
� The data request table (DRT) is a A� (2D+3) matrix, where A indicates the
total number of �les. Each row indicates the access rate of a �le by all the
client tasks (CTs). The �rst column (F) represents all the shared �les in the
intranet's application, ranging from 1 to A. The second column (FS) represents
the �le size in megabytes (MB). The third column (FT) represents the �le type,
which can be a text, image, audio or video. The rest of the columns represent
all the client tasks' requests of the shared �les. Each client task (CTi) has two
input parameters: a �le request rate (FRRCTi;j) and a delay bound (DBCTi;j).
The �le request rate FRRCTi;j represents the average hourly request rate of a
�le j by a client task CTi. The delay bound DBCTi;j represents the maximum
time in seconds that a client task CTi is willing to waiting for the retrieval of
a �le j. Table 4.2 shows an example of a data request table. In this thesis,
we are only looking at the �le retrieval problem (read only) and we assume
no creation of new �les (no write). In our future work, we plan to include the
68

problem of writing �les into the servers. There is no fundamental di�erence in
the problem when writing to the server(s) in included.
Table 4.2: A data request table (DRT).
Fj FSj FTj CT1 . . CTDFRRCT1 ;j DBCT1 ;j . . . . FRRCTD ;j DBCTD;j
1 1 image 2 30 . . . . 0 02 10 video 0 0 . . . . 1 1003 0.5 text 0 0 . . . . 5 40. . . . . . . . . .. . . . . . . . . .A 8 audio 1 90 . . . . 0 0
The information given in the data request table is provided by the intranet user.
Such information is probably approximated, and can be changed interactively, to
produce a range of intranets. A sensitivity analysis can be performed by varying the
information and analyzing the resulting intranet architectures and costs.
The Design parameters that represent the outputs of i -CAD specify in detail the
number, locations, processing capacities, and storage capacities of servers.
The Binary variables are 0-1 variables that represent the implementation deci-
sions regarding the data management system design problem (use = 1, don't use =
0). There are three types of binary variables de�ned:
� Allocation variables: The variables of this type specify the data management
hardware resources that are being included in the intranet. The list of data
management allocation variables includes the following (de�nitions and use of
these variables are explained in later sections in this chapter):
1. server �n, and
2. hard disk m.
69
� Binding variables: The variables of this type assign the allocated data man-
agement hardware resources to the application's tasks. These variables are
used mostly to bind a �le server to a group task, for example. The list of data
management binding variables includes the following (de�nitions and use of
these variables are explained in later sections in this chapter):
1. server to group task "n;e,
2. client task to server &d;n,
3. hard disk to server �m;n,
4. �le to server j;i;n, and
5. �le to hard disk %j;i;q.
� Connection variable: This variable indicates a physical connection between
a �le server to a group network connector's port (de�nition and use of this
variable is explained in later sections in this chapter).
1. server to group network connector 'dt;di;gnt;gnpi.
In this model, we separate the problem of allocating and binding of data man-
agement hardware resources into two small problems only for the initial design gen-
eration so that the problem becomes more understandable. Also, this decomposition
could facilitate a separate solution to the allocation and binding problems, allowing
them to be solved at separate stages in the design process. It allows the i -CAD
software to explore many di�erent possible bindings without changing the resources
allocated.
4.4.1 Data Management Hardware Placement Constraints
The data management hardware placement constraints insure that all the client
tasks within the intranet can have access to �le servers. We limit the �le server
70

placement to the group tasks only, where each group task can have at most one �le
server. In our future research, we will place a number of application-speci�c servers,
such as an email server, web server, video server and audio server in a given intranet;
moreover, we will allocate proxies to ease the main servers' workload. Also, we will
place servers at the site task and backbone task other than the group task. We
formulate three data management hardware placement constraints:
1. server placement constraint: the number of possible group server GSn place-
ments must be bounded by the total number of group tasks in the intranet's
application. Thus, for an intranet, the following must be satis�ed:
1 �X
8GSn
�n �X
8STf2BT
X
8GTe2STf
Ge;f (4.21)
Constraint 4.21 insures that there is at least one allocated (�n) group server
GSn in the intranet and the total number of allocated group servers must not
exceed the total number of group tasks GTe in the intranet's application. GSn
is a group server, and the index n indicates the group server number. �n is an
allocation variable; �n = 1 indicates that a group server GSn is being included
in the synthesized intranet. Ge;f is a binding variable; Ge;f = 1 indicates that
a group task GTe is located within a site task STf .
2. server to group task constraint: a group task can have at most one placed
server. Thus, for each group task GTe, the following must be satis�ed:
X
8n
"n;e � 1, For GTe (4.22)
Constraint 4.22 insures that at most one allocated server GSn is placed within
a group task GTe. "n;e is a binding variable; "n;e = 1 indicates that an allocated
server is bound to a group task.
71

3. client task to server constraint: a client task is assigned to one placed server
to retrieve its requests. Thus, for each client task CTd, the following must be
satis�ed:
X
8n
&d;n = 1, For CTd (4.23)
Constraint 4.23 insures that each client task is bound to one allocated server.
&d;n is a binding variable; &d;n = 1 indicates that a client task CTd is bound to
a server GSn.
4. server to group-network connection constraint: an allocated group server must
be connected to a group network. Thus, for a server GSn within a group task
GTe, the following must be satis�ed:
X
8gnpi2gnt
'dt;di;gnt;gnpi = 1, For dt = GSn 2 GTe and di = n
(4.24)
Constraint 4.24 insures that an allocated group server GSn is located and
connected to one port of an allocated and bound group network connector
GNCo. 't;i;g;gp is a connection variable. dt is the device type (server), di is
the device identi�cation (1 toP8STf2BT
P8GTe2STf Ge;f , which represents the
total number of group tasks within the intranet), gnt is the group network
type (Ethernet, ATM), and gnpi is the group network port identi�cation (1-
NPGNCo).
5. hard disk constraint: the number of hard disks to be allocated to a placed
server is constrained. Thus, for each placed server GSn, the following must be
satis�ed:
1 �X
8m
(m � �m;n) � 10, For GSn (4.25)
72

Constraint 4.25 insures that a placed server can have at most ten hard disks.
m is an allocation variable; m = 1 indicates that a hard disk HDm is being
allocated within the synthesized data management system. �m;n is a binding
variable; �m;n = 1 indicates that a hard disk HDm is bound only to a group
server GSn.
6. group-server-hard-disk constraint: each allocated group server GSn must have
a storage space, where its capacity must be bounded by the size of the appli-
cation's �les. Thus, for each group server GSn, the following must be satis�ed:
max(FSj) � (HDCGSn + S) �X
8j
FSj (4.26)
Constraint 4.26 insures that the total hard disk capacity HDCGSn of a group
server GSn is bound by the maximum �le size in the application and the
cumulative size of all application's �les. FSj indicates the �le size of the j th
�le and this value is an input parameter. HDCGSn is a design parameter
representing the total hard disk capacity of the nth group server. S represent
slack storage space which can be used for context switching, for example. This
value is an input parameter.
4.4.2 File Allocation Constraints
The �le allocation constraints insure that all �les are stored in the allocated group
servers, and each �le must maintain its number of stored instances under an upper
bound.
73

1. �le server allocation constraint: a �le Fj can allocate at most one instance
within a group server GSn. Thus, for each �le Fj and group server GSn, the
following must be satis�ed:
0 �X
8i
j;i;n � 1, For Fj and GSn (4.27)
Constraint 4.27 insures that at most one instance of a �le is stored in a group
server. j;i;n is a binding variable; moreover, j;i;n = 1 indicates that an
instance i of the j th �le is stored in the group server GSn.
2. �le-instance constraint: the number of �le instances must be bounded by the
maximum number of placed servers. Thus, for each �le Fj, the following must
be satis�ed:
1 �X
8GSn
X
8i
j;i;n �X
8STf2BT
X
8GTe2STf
Ge;f (4.28)
Constraint 4.28 insures that at least one instance of a �le is stored in a group
server; moreover, the total number of �le instances is bound by the total
number of group tasks within the intranet's application.
4.5 Data Management Design Objective Function
The data management system cost (DMSC) consists of the costs of all group servers
and their hard disks.
DMSC =X
8GSn
[(�n � Cn) +X
8HDm2GSn
(m � Cm)] (4.29)
Equation 4.29 sums the cost of all placed servers and their hard disks. GSn is a
group server (design parameter) and the index n indicates the group server identi-
�cation. �n is an allocation variable; �n = 1 indicates that a group server GSn is
74

being included in the synthesized intranet. Cn refers to the cost of an allocated (�n
= 1) group server GSn. Cn is given by the server design library. HDm is a design
parameter representing the hard disk and the index m indicates the hard disk iden-
ti�cation. Cm refers to the cost of the allocated hard disk (m = 1) and it is given
by the hard disk design library.
4.6 Intranet Integration Objective Function
The overall objective function is to minimize the intranet integration cost (IIC),
which can be expressed as the sum of the network architecture cost (NAC) and the
data management system cost (DMSC), as shown in Equation 4.30. We can sum
NAC and DMSC, since both are in term of dollars.
Minimize ICC, where IIC = NAC +DMSC (4.30)
The constraints described in this chapter form the basis for the i -CAD code that
insures that designs in the evolving population are correctly constructed.
75

Chapter 5
The Performance Model
5.1 Background
To determine the \goodness of �t" of each solution produced by the genetic algo-
rithm, performance must be approximated rapidly during optimization. Therefore,
the performance model consists of two methods: a quick method and a detailed
method. The quick method is included during optimization, and the detailed method
is run after synthesis and optimization has been completed. The detailed method
provides more performance information and allows �nal tuning of an intranet ar-
chitecture. It provides the intranet user with a greater level of con�dence that the
system will perform as planned. In this thesis, we present the quick performance
evaluation method, and for our future work we will produce a detailed performance
evaluation method or use commercial software. We used the quick performance tech-
nique to evaluate both the three-level network infrastructure and the data manage-
ment system. These quick performance techniques are embedded within the i -CAD
tool to increase the likelihood that the intranet integration solutions can satisfy the
network and data management performance constraints.
76

The performance constraints consist of two sets: network performance constraints
and data management performance constraints. To describe the performance con-
straints mathematically, we need to de�ne the input parameters, and the perfor-
mance variables that are related to the performance problem.
The Input parameters: client tra�c matrix, the threshold network delay and
threshold data management performance are given by the intranet planners to the
i -CAD tool to specify in detail the client tra�c between all pair of client tasks, the
delay bound on each synthesized three-level network and the lower-bound on the
data management system performance.
� The client tra�c matrix (CTM) is a D�D matrix, where each element ti;j in
TFM indicates the mean tra�c ow from a client i to a client j in megabits
per second (Mbps). The sum of all elements in a row ti;1:::D represents the
mean client outgoing tra�c COTi of a client i. The sum of all elements in a
column t1:::D;i represents the mean client incoming tra�c CITi of a client i.
Table 5.1 shows an example of a client tra�c matrix.
Table 5.1: A client tra�c matrix (CTM), where a CT denotes a client task.
CT/CT 1 2 3 . . D
1 0 20 2 1 10 0.52 8 0 0.1 9 15 73 16 0.5 0 1 0 6. . . . 0 . .. . . . . 0 .D 40 10 0 1 2 0
� The threshold network delay (TND) is a real number given by the designer/planner
and used by the i -CAD tool to bound the estimated the average network delay
(AND).
77

� The threshold data management performance (TDMP) is a real number given
by the designer/planner and used by the i -CAD tool to bound the estimated
server performance.
5.2 Network Performance Constraints
The network performance constraints consist of two types: the network capacity
constraints and the average intranet delay constraint. In the next two sections, we
describe these two types.
5.2.1 Network Capacity Constraints
The network capacity constraints insure that the network capacity of each allocated
and bound network hardware component is su�cient to handle all the clients' tra�c.
We formulate three network capacity constraints:
1. group-bandwidth constraint: The group total tra�c GTTGTe must not ex-
ceed the group network connector maximum bandwidth capacity BWGNCo.
GTTGTe is the summation of the group local tra�c GLTGTe, group outgo-
ing tra�c GOTGTe , group incoming tra�c GITGTe, group local request (�les)
tra�c GLRQTGTe, group local reply (servers) tra�c GLRPTGTe , data man-
agement tra�c for other group tasks DMTGTe , and group missing �le tra�c
for other group tasks GMFTGTe. The term GLTGTe represents the summation
of all group's clients local tra�c within a group task GTe. The term GOTGTe
represents the summation of all group's clients outgoing tra�c to other groups'
clients. The term GITGTe represents the summation of all group's clients in-
coming tra�c from other groups' clients. All the above three terms are calcu-
lated from the client tra�c matrix (CTM). The term GLRQTGTe represents
the summation of all clients' requests for �les within a group task GTe. The
term GLRPTGTe represents the summation of all servers' replies for all clients'
78

requests within a group task GTe. GLRQTGTe and GLRPTGTe are calculated
directly from the data request table (DRT) for each group task. The term
DMTGTe represents the summation of all requests and replies for �les within a
group task GTe to other group tasks within the intranet. The term GMFTGTe
represents the summation of all requests and replies for missing �les within a
group task GTe to other group tasks. DMTGTe and GMFTGTe can be calcu-
lated from DRT, but after all �les are allocated into the placed servers. Thus,
for each group task GTe and group network connector GNCo, the following
must be satis�ed:
GTTGTe =GLTGTe +GOTGTe +GITGTe + (5.1)
GLRQTGTe +GLRPTGTe +DMTGTe +GMFTGTe
GTTGTe <BWGNCo (5.2)
BWGNCo is an integer value that refers to the maximum network capacity of
a group network connector GNCo in term of communication bandwidth (bits
per second). This value is given in the network connector design library, and
varies depending on the network connector allocated to the group.
2. site-bandwidth constraint: Constraint 5.4 insures that the site total tra�c
STTSTf (Equation 5.4) must not exceed the site network connector maximum
bandwidth capacity BWSNCu. STTSTf is the summation of the site local tra�c
SLTSTf , site outgoing tra�c SOTSTf , site incoming tra�c SITSTf , site total
data management tra�c STDMTSTf , and site missing �le tra�c SMFTSTf .
The term SLTSTf represents the summation of all site's clients local tra�c
within a site. The term SOTSTf represents the summation of all site's clients
outgoing tra�c to other sites' clients. The term SITSTf represents the sum-
mation of all site's clients incoming tra�c from other sites' clients. All the
above three terms are calculated from the client tra�c matrix (CTM). The
79

term STDMTSTf represents the summation of requests and replies of �les go-
ing through site task STf . The term SMFTSTf represents the summation of
all missing �le tra�c going through site task STf . STDMTSTf and SMFTSTf
can be calculated from DRT, but after all �les are allocated into the placed
servers. Thus, for each site task STf and site network connector SNCu, the
following must be satis�ed:
STTSTf =SLTSTf + SOTSTf + SITSTf + (5.3)
STDMTSTf + SMFTSTf
STTSTf <BWSNCu (5.4)
BWSNCu is an integer value that refers to the maximum network capacity of
the site network connector SNCu in term of communication bandwidth (bits
per second). This value is given in the network connector design library.
3. backbone-bandwidth constraint: The backbone total tra�c BTT must not ex-
ceed the backbone network maximum bandwidth capacity. The total tra�c
within the backbone is the summation of the inter-site tra�c, which is called
the backbone local tra�c BLOT, backbone total data management tra�c BT-
DMT, and backbone missing �le tra�c BMFT. The term BLOT represents
the summation of all inter-site' clients tra�c which are calculated from the
client tra�c matrix (CTM). The term BTDMT represents the summation of
requests and replies of �les going through the backbone task. The term BMFT
represents the summation of all missing �le tra�c going through the backbone
task. BTDMT and BMFT can be calculated from DRT, but after all �les are
80

allocated into the placed servers. We separate the backbone bandwidth into
four constraints for presentation clarity, but only one of themmust be satis�ed.
BTTlocal = BLOT +BTDMT +BMFT (5.5)
BTTlocal < BWBNCz for BNCz (5.6)
Constraint 5.6 insures that the sum of all tra�c of the backbone task BTTlocal
must not exceed the backbone network connector maximum bandwidth ca-
pacity BWBNCz. BWBNCz is an integer value that refers to the maximum
network capacity of the backbone network connector BNCz in term of com-
munication bandwidth (bits per second). This value is given in the network
connector design library. The next three constraints present the other options
for the backbone tree topology performance. A wide tree topology T(N,L)
consists of N site-task STf nodes and L backbone links BLi, where f and i
represent the identi�cations of site task and backbone link respectively. Con-
straint 5.6a insures that the client-to-client tra�c and data management traf-
�c going through a link must not exceed its allocated and bound backbone
leased line maximum bandwidth capacity BWBLLh. A link tra�c consists of
backbone individual link tra�c BILTBLi, backbone individual link data man-
agement tra�c BILDMTBLi, and backbone individual link missing �le tra�c
BILMFTBLi. BWBLLh is an integer value that refers to the maximumnetwork
capacity of a backbone leased line BLLh in term of communication bandwidth
(bits per second). This value is given in the leased line design library.
(BILTBLi +BILDMTBLi +BILMFTBLi) < BWBLLh
(5.6a)
Constraint 5.6b insures that total tra�c going through a backbone link BLi
must not exceed the backbone optical leased line maximumbandwidth capacity
81

BWBOLLk. BWBOLLk is an integer value that refers to the maximum network
capacity of the backbone optical leased line BOLLk in terms of communication
bandwidth (bits per second). This value is given in the optical leased line
design library.
(BILTBLi +BILDMTBLi +BILMFTBLi) < BWBOLLk
(5.6b)
Constraint 5.6c insures that total tra�c going through a backbone BLi must
not exceed the backbone virtual private connection maximum bandwidth ca-
pacity BWBVPCq . BWBV PCq is an integer value that refers to the maximum
network capacity of the backbone virtual private connectionBV PCq in term of
communication bandwidth (bits per second). This value is given in the virtual
private connection design library.
(BILTBLi +BILDMTBLi +BILMFTBLi) < BWBVPCq
(5.6c)
5.2.2 Average Network Delay Constraint
The network delay estimation is based on a well-known formulation [GK77]. This
formulation views the intranet as a network of M/M/1 queues, where each group,
site and backbone is modeled as an M/M/1 queue. Summing all delays generated
by all group tasks, site tasks and the backbone task represents the average network
delay (AND). Thus, intranet's AND must satisfy the threshold con�guration delay
82
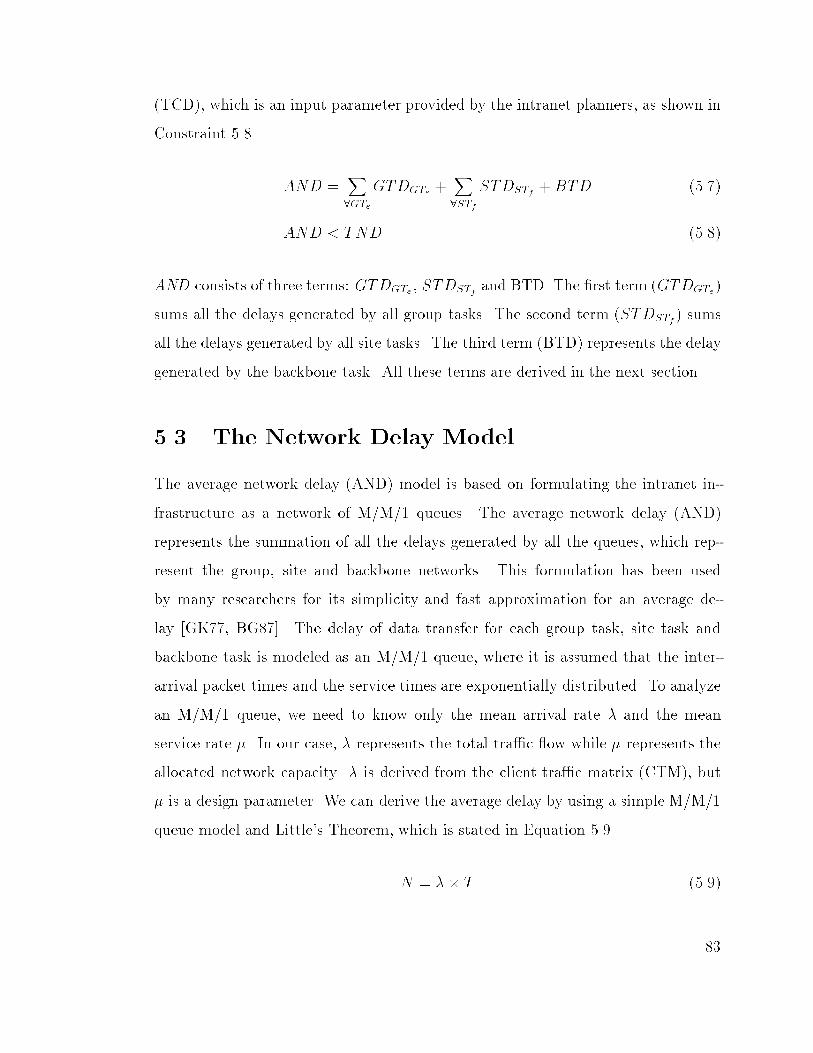
(TCD), which is an input parameter provided by the intranet planners, as shown in
Constraint 5.8.
AND =X
8GTe
GTDGTe +X
8STf
STDSTf +BTD (5.7)
AND < TND (5.8)
AND consists of three terms: GTDGTe , STDSTf and BTD. The �rst term (GTDGTe)
sums all the delays generated by all group tasks. The second term (STDSTf ) sums
all the delays generated by all site tasks. The third term (BTD) represents the delay
generated by the backbone task. All these terms are derived in the next section.
5.3 The Network Delay Model
The average network delay (AND) model is based on formulating the intranet in-
frastructure as a network of M/M/1 queues. The average network delay (AND)
represents the summation of all the delays generated by all the queues, which rep-
resent the group, site and backbone networks. This formulation has been used
by many researchers for its simplicity and fast approximation for an average de-
lay [GK77, BG87]. The delay of data transfer for each group task, site task and
backbone task is modeled as an M/M/1 queue, where it is assumed that the inter-
arrival packet times and the service times are exponentially distributed. To analyze
an M/M/1 queue, we need to know only the mean arrival rate � and the mean
service rate �. In our case, � represents the total tra�c ow while � represents the
allocated network capacity. � is derived from the client tra�c matrix (CTM), but
� is a design parameter. We can derive the average delay by using a simple M/M/1
queue model and Little's Theorem, which is stated in Equation 5.9.
N = �� T (5.9)
83

N is the mean number of packets in a network at any point in time. � is the packet
arrival rate. T is the mean time a packet spends in a network. The state of an
M/M/1 queue is given by the number of active packets in a network and it is similar
to that of birth-death processes with the following correspondence:
�i = �; i = 0,1,2,...,1
�i = �; i = 0,1,2,...,1
The steady-state probability SSPi of the ith packet being active in a network is given
by Equation 5.10:
SSPi = (�
�)i � SSP0 (5.10)
The index i is equal to 1,2,3,...,1, and SSP0 is the steady-state probability of no
packet in the network. Since all probabilities should add to one, the probability of
no packet in the network, SSP0, is given by Equation 5.11:
SSP0 = (1
(1 + ��+ (�
�)2 + � � � + (�
�)i) = 1 � (
�
�) (5.11)
Then, substituting Equation 5.11 into Equation 5.10, we get the steady-state prob-
ability, SSPi, in terms of � and �, as expressed in Equation 5.12:
SSPi = (�
�)i � (1 � (
�
�)); i = 1,2,3,...,1 (5.12)
We derive the group task delay (GTDGTe) �rst by �nding the expected number of
packets E[i] in a group-level network, as given by Equation 5.13:
E[i] =1X
i=1
i� SSPi =1X
i=1
i(�
�)i(1 � (
�
�)) =
(��)
1 � (��)
(5.13)
84

Then, the average packet delay (APD) is computed using Equation 5.13 and Little's
Theorem, as expressed in Equation 5.14:
APD =E[i]
�=
(��)
1�(��)
�=
1
� � �(5.14)
Last, the group task data delayGTDGTe is derived by multiplying the average packet
delay for a group task GTe with the total tra�c load of a group task GTTGTe, as
expressed in Equation 5.15 (we substitute � amd � notations with GTTGTe and
BWGNCo respectively.):
GTDGTe =1
IT T[
GTTGTeBWGNCo �GTTGTe
] (5.15)
Equation 5.15 is the delay for an M/M/1 queue [GK77, BG87] at the bit level,
where GTTGTe and BWGNCo are in terms of bits per second. IT T represents the
total o�ered tra�c within the intranet. BWGNCo represents the network maximum
capacity of GNCo. GTTGTe represents the total tra�c load of GTe. To derive the site
task delay (STDSTf ), we need to consider the delay resulting from all site routers,
site network connectors and site bridges as stated in Equation 5.16.
STDSTf =1
IT T[u(
STTSTfBWSNCu � STTSTf
) +
(1 �u)(STTSTf
SRPDSRt � STTSTf) +
(X
8r
�r � SBLDSBr)] (5.16)
u = 1 represents the allocation of a site network connector SNCu. BWSNCu rep-
resents the site network connector maximum capacity. STTSTf represents the total
tra�c load of a site task STf . Xt = 1 represents the allocation of a site router
SRt. SRPDSRt represents a site router processing delay, which is given by the
router library. �r = 1 represents the allocation of a site bridge SBr. SBLDSBr
85

represents a site bridge lookup delay, which is given by the bridge design library. To
derive the backbone task delay (BTD), we consider the delay resulting from either all
backbone leased lines, all backbone optical leased lines, all backbone virtual private
connections, a backbone router, or a backbone network connector and backbone
bridges. Equations 5.17-5.18 represent the delays for local backbone topology and
wide backbone topology respectively.
BTDlocal =1
IT T[�y � (
BTTlocalBRPDBRy �BTTlocal
) +
�z � (BTTlocal
BWBNCz �BTTlocal) +
X
8BBw
(�w � BBLDBBw)] (5.17)
BTTlocal represents the backbone total tra�c (local star topology). �y = 1 represents
the allocation of a backbone router BRy. BRPDBRy represents a backbone router
processing delay, which is given by the router design library. �z = 1 represents
the allocation of a backbone network connectionBNCz. BWBNCz represents the
maximum network capacity of a backbone network connector. �w = 1 represents
the allocation of a backbone bridge BBw. BBLDBBw represents a backbone bridge
lookup delay, which is given by the bridge design library. On the other hand, the
backbone network delay for a wide tree topology is the summation of all links' delay.
86

BTDwide =1
IT T[
(Lh
X
8BLi2L
BILTBLi +BILDMTBLi +BILMFTBLiBWBLLh � (BILTBLi +BILDMTBLi +BILMFTBLi)
+ PDBLi) +
(Ok
X
8BLi2L
BILTBLi +BILDMTBLi +BILMFTBLiBWBOLLk � (BILTBLi +BILDMTBLi +BILMFTBLi)
+ PDBLi) +
(VqX
8BLi2L
BILTBLi +BILDMTBLi +BILMFTBLiBWBVPCq � (BILTBLi +BILDMTBLi +BILMFTBLi)
+ PDBLi)]
(5.18)
BILTBLi represents the backbone individual link tra�c for a backbone link BLi,
which is one of the link constructing the backbone tree topology. BILDMTBLi
represents the backbone individual link data management tra�c going through a
backbone link BLi. BILMFTBLi represents the backbone individual link missing
�le tra�c going through a backbone link BLi. Lh = 1 represents the allocation of a
backbone leased line BLLh. BWBLLh represents the maximum network capacity of
a backbone leased line. PDBLi represents the propagation delay of a backbone link
BLi. Ok = 1 represents the allocation of a backbone optical leased line BOLLk.
BWBOLLk represents the maximum network capacity of a backbone optical leased
line. Vq = 1 represents the allocation of a backbone virtual private connection
BV PCq. BWBVPCq represents the maximumnetwork capacity of a backbone virtual
private connection.
The average network delay (AND), which represents the summation of Equa-
tions 5.15 to 5.18, is stated in Equation 5.19. This value is constrained by the thresh-
old network delay (TND). The term BTD is either equal to BTDlocal or BTDwide
depending on the backbone topology type.
AND = (X
8GTe
GTDGTe +X
8STf
STDSTf +BTD) � TND (5.19)
87

5.4 Data Management Performance Constraint
The data management system performance constraint insures that all placed group
servers can execute most of the clients' requests. On regular basis, a client sends a
request to a server to retrieve common �les shared with other clients. The number
of clients exceeds the number of placed servers by several magnitudes. The placed
servers try to execute as many as possible of the clients' requests during a given
duration period. To evaluate the performance of a placed server, we use a quick
estimation method, which is based on a quick simulation technique known as Monte
Carlo simulation. This simulation emulates the server by trying to schedule all
requests linearly within a given duration period (DP). Requests are generated at
random times. Each set of requests is scheduled, and the success or failure of the
schedule to meet the deadline DP is recorded. For each trial a new set of request
times is generated randomly. After n trials, a probability of success (meeting all
clients' requests in the duration period) is computed. DP is a real number given
by the intranet planner. The simulator is embedded within the i -CAD tool. The
outcome of Monte Carlo simulation is a real numerical value (SPGSn) indicating
the percentage of the clients' requests that are executed during the duration period
(DP). Then, SPGSn is compared with the threshold data management performance
(TDMP).
SPGSn � TDMP (5.20)
Constraint 5.20 insures that the performance of each group server GSn in the synthe-
sized intranet meets the minimumthreshold data management performance (TDMP)
parameter. SPGSn is the estimated performance for the group server GSn. TDMP
is a real number given by the intranet planners to i -CAD. In the next section, we
explain the performance estimation method.
88

5.5 Monte Carlo Simulation
Monte Carlo simulation is based on modeling probabilistic situations that are sta-
tionary (don't change characteristics with time) [Jai91], and can be used for evaluat-
ing server performance. The arrival of each client's request to the server is unknown
(not deterministic values) and these values can be either guessed by the intranet
designer or estimated by prediction tools. In such situation, the intranet designer
may be interested not only in the worst-case scenario, but the intranet designer may
prefer a data management system design that meets the performance constraint with
a certain probability. A worst-case scenario is when all clients' requests arrive at the
same time to the server, the satisfaction of which would lead to an expensive data
management system design. A probabilistic approach would trade-o� a non-zero
probability (SPGSn ) of not satisfying all clients' requests for a less expensive design.
i -CAD is able to produce di�erent data management systems for di�erent values of
SPGSn that meets the threshold data management performance (TDMP), as stated
in Constraint 5.20.
The algorithm that is used to perform the Monte Carlo simulation is depicted in
Figure 5.1. The simulation evaluates each placed server separately. The inputs to
the simulation are the server's attributes and a list of all requests intended for the
evaluated server. The server's attributes are processing capacity (PCGSn) in terms
of CPU clock cycle, the hard disk's seek time (SKTGSn) and the hard disk's retrieval
rate (RRGSn ) (bits per second). All these values are given by the server and hard
disk design libraries. Each client's request contains the client's identi�cation, client's
network address, and requested �le's identi�cation.
The algorithm starts by initializing several internal parameters that are used
within the simulation, including time-line, counter, and request-counter in lines 2-
4. The time-line is a real number that keeps track of schedule requests within the
server. The counter is an integer number that is used as an index to the list of
clients' requests. The request-counter is an integer number which is used to count
89

the number of executed requests by the server. The for loop in lines 5-8 assigns
a random request time and calculates processing time and retrieval time for each
client's request in the list CR[] of size R. The random number generator selects
a real number between zero and the duration period. A sort function is called in
line 9 to order the list in ascending order with respect to a randomly generated
request time. The while loop in lines 10-28 repeatedly tries to schedule all requests
within the sort list CR[] until the time-line exceeds the duration period (DP). The if
statement in lines 12-14 insures that a scheduled request does not exceed the duration
period; otherwise the simulator tries another request to schedule by incrementing
the counter in line 25. Line 15 increments the request-counter when a request is
scheduled for execution in the server. The if statement in line 16 insures that
scheduling a new request does not overlap with the currently executed request. The
time-line is updated in lines 17-20 when there is no overlap (the server is idle in
this case). On the other hand, when the two requests overlap, the new request
waits until the server �nishes executing the old request and the time-line is update
accordingly in lines 21-24. The server performance ratio is evaluated in line 27 by
dividing the total scheduled requests over the total requests in the list CR[]. Results
of performance estimates using this technique are described in Chapter 7.
90

Monte Carlo Simulator:1 begin2 time-line = 0;3 counter = 1;4 request-counter = 0;5 For i = 1 to R6 CR[i].request-time = random-generation[0,DP);7 CR[i].process-time = CR[i].request-packet * PCGSn ;8 CR[i].retrieval-time = (CR[i].�le-size * RRGSn ) + SKTGSn;9 SORT(CR[]);10 while (time-line � DP) do11 begin12 if((CR[counter].request-time +13 CR[counter].process-time +14 CR[counter].retrieval-time) � DP)15 request-counter = request-counter + 1;16 if(CR[counter].request-time � time-line)17 time-line = CR[counter].request-time +18 CR[counter].process-time +19 CR[counter].retrieval-time;20 else21 time-line = time-line +22 CR[counter].request-time +23 CR[counter].process-time +24 CR[counter].retrieval-time;25 counter = counter + 1;26 end27 SPGSn = request-counter � R;28 end
Figure 5.1: The Monte Carlo Simulation.
91

Chapter 6
i-CAD: Intranet Computer-Aided Design Tool
6.1 Background
The i -CAD tool consists of three main procedures: initial intranet generation, in-
tranet validation and evaluation, and intranet selection and optimization, as depicted
in Figure 6.1. The initial intranet generation procedure creates a population of
initial intranet designs by selecting all network and data management hardware
resources randomly. This procedure executes only one time. The intranet valida-
tion and evaluation procedure validates and evaluates each intranet design. The
intranet selection and optimization procedure selects the �t intranet designs,
modi�es some and discards the rest. The second and third procedures execute many
times until the intranet designer/planner is satis�ed with the intranet integration
cost (IIC) and all the design and performance constraints are met.
The rest of this chapter is organized into four sections. Section 6.2 gives an
overview of the genetic algorithms and presents the some of the advantages of using
genetic algorithms to search for intranet integration solutions. Section 6.3 describes
in detail the implementation of the i -CAD tool, such as the chromosome represen-
tation, initial population, �tness function, selection mechanism, mutation operator,
crossover operator, and termination condition. Section 6.4 describes four aspects
92

network design libraries
threshold data management performance (TDMP)data management design libraries
optimized intranet population
Procedure 1: initial intranet generation
Procedure 2: intranet validation and evaluation
Procedure 3: intranet selection and optimization
loop untilall constraintsare satisfied
client location table (CLT)client traffic matrix (CTM)data request table (DRT)
threshold network delay (TND)
Figure 6.1: The overall structure of i -CAD tool.
that are considered within i -CAD to avoid inferior solutions while using genetic
algorithms.
6.2 Overview of Genetic Algorithms
Genetic algorithms (GA) emulate the evolution process in nature [Mic94], as shown
in Figure 6.2. The genetic algorithms start with an initial population P(t=0) of
solutions encoded as chromosomes (line 3). An initial population is most often
generated randomly but a heuristic can be used. Each chromosome is made of a
sequence of genes and every gene controls the inheritance of speci�c attributes of
the solution's characteristics. A �tness function in lines 4 and 11 measures the qual-
ity of the chromosome in terms of various design variables of the solution. A more
93

�t chromosome suggests a better solution. The while loop in lines 5-12 represents
the evolution process, where relatively �t designs reproduce new designs and inferior
designs die. This process continues until a design with desirable �tness is found.
Line 8 selects the best designs within the current generation based on their �tness
values. These selected designs, known as parents, are used to reproduce the next
generation of designs, known as o�spring. The evolution process involves two ge-
netic operations namely, mutation in line 9 and crossover in line 10. A mutation
operator arbitrarily alters one or more genes of a randomly selected chromosome.
The intuition behind the mutation operator is to introduce a missing feature in the
population. A crossover operator combines features of two selected chromosomes
(parents) to form two similar chromosomes (o�spring) by swapping genes of the
parent chromosomes. The intuition behind the crossover operator is to exchange
information between di�erent potential solutions.
Genetic Algorithm:1 begin2 t = 0;3 initialize P(t);4 evaluate P(t);5 while (termination conditions are unsatis�ed) do6 begin7 t = t + 1;8 select P(t) from P(t-1);9 mutate some of P(t);10 crossover some of P(t);11 evaluate P(t);12 end13 end
Figure 6.2: The structure of genetic algorithms.
94

6.2.1 Advantages of Genetic Algorithms
Genetic algorithms o�er several advantages for a large design space problem such as
the intranet integration problem. Genetic algorithms are very exible, and a lot of
its functions are a natural �t to our problem. These functions are the initial popu-
lation generation, the selection mechanism, the crossover operator and the mutation
operator, where there are many options on how to implement solutions.
Intuitively, genetic algorithms are suited to design problems since the process
of evolution is similar to a real design process. In the early stage of the design
process, the designer reviews a number of possible architectures and selects one
that is believed to be the best (evaluation and selection), then the designer tries to
improve the selected architecture by making a few changes (mutation). Also, the
designer can try to design a better architecture by retaining the good characteristics
of two designs (crossover).
Genetic algorithms emulate a design process that is suited for our problem by
alternating between design and optimization processes. This is how a data man-
agement system and network architecture are designed in reality. For example, a
designer places one server in a certain location and if it yields a good client-server
performance, then there is no need to relocate the server. Otherwise, the designer
either places a new server in a di�erent location or relocates the old server in order
to improve the client-server performance. As another example, a designer selects one
type of a network hub in an ad hoc manner. If the selection yields a good network
design, then there is no need to modify the network hub. Otherwise, the designer
selects another choice, until a good design is produced.
Genetic algorithms can handle nonlinear constraints, while some other optimiza-
tion techniques such as MILP cannot, and the constraints must be linearized. Ge-
netic algorithms are capable of moving from one solution to another, which is sig-
ni�cantly di�erent from other techniques. This is called a non-geometric search,
because it can avoid a local minima or maxima solution.
95

For the previous reason, many researchers would rather use genetic algorithms
over simulated annealing, since the latter uses a geometric search technique. While
the temperature is high, simulated annealing with a geometric search can avoid local
minima or maxima. However, when the temperature is cooling down, then the search
may get stuck in a local minimum or maximum. The concept of a non-geometric
search can be illustrated in Figure 6.3. Genetic algorithms can avoid local minima
solutions (dot-circles 1-2) and get possibly closer to global minima solution (dot-
circle 3) by crossing two chromosomes from di�erent regions of the design space.
Also, genetic algorithms have been applied successfully to synthesize and optimize
large design space problems like heterogeneous multiprocessor synthesis [TGP96],
multi-chip system synthesis [Heo97] and others well-known problems [Mic94]. Ge-
netic algorithms have been shown to �nd near-optimal solutions to these problems
in shorter time than other optimal optimization techniques.
designparameter
objectivefunction
XX
X1
2
3
Figure 6.3: Searching the design space with genetic algorithms.
96

6.3 i-CAD Implementation
In order to apply genetic algorithms to the intranet integration optimization prob-
lem e�ciently, we need to customize a genetic algorithm to work well with our
problem. The overall framework of genetic algorithms is well-known; however, an
improper implementation of a genetic algorithm can easily nullify its advantages.
The primary di�culty comes from the complex structure (chromosome) of the in-
tranet integration problem, which involves both data management system design
and also network architecture design. The intranet chromosome encodes all appli-
cation inputs, data management system design decisions and network architecture
design decisions. The structural complexity of the intranet chromosome can a�ect
the speed and the quality of the crossover and mutation outcomes.
In the next section, we detail the chromosome representation of an intranet,
the initial population, the �tness of a chromosome, the selection mechanism, the
mutation operator, the crossover operator, and the termination condition.
6.3.1 Chromosome Representation
Each design is represented by a single chromosome with a tree structure. Since
we model an intranet application as a hierarchy of tasks, we selected a tree data
structure to represent the intranet's tasks rather than classical encoding schemes
such as a binary string, which requires a very long binary vector. This, in turn,
generates complicated genetic mutation and crossover operators and a huge search
space. The tree structure representation has three levels. The �rst level (root node)
corresponds to the backbone task (BT). The second level corresponds to the set of
site tasks (ST) within the backbone. The third level (leaf) corresponds to the set of
group tasks (GT) within each site task. The tree representation is implemented in
an object-oriented manner such that a tree is composed of hierarchically organized
97

classes of objects at di�erent abstraction levels, as depicted in Figure 6.4. This tree
structure does not represent the intranet network topology.
backbone_node
site_child_pointer
site_node1
site_sibling_pointergroup_child_pointer
site_node2
site_sibling_pointergroup_child_pointer
site_node3
site_sibling_pointergroup_child_pointer
site_node4
site_sibling_pointergroup_child_pointer
group_node1
group_sibling_pointerclient_child_pointer
NULL
group_node4
group_sibling_pointerclient_child_pointer
group_node5
group_sibling_pointerclient_child_pointer
group_node2
group_sibling_pointerclient_child_pointer
group_node3
group_sibling_pointerclient_child_pointer
group_node8
group_sibling_pointerclient_child_pointer
group_node6
group_sibling_pointerclient_child_pointer
group_node7
group_sibling_pointerclient_child_pointer
NULLNULLNULLNULL
Figure 6.4: A tree representation of an intranet application in Figure 2.2.
Each node in the chromosome's tree is an instance of a class, and as shown in
Figure 6.4 there are three types of classes: backbone, site and group. Each class
instance contains speci�c input information and design decisions about the its task
type. Although the genetic algorithm maintains a number of possible solutions
(chromosomes) at each iteration, duplicating the chromosome's tree would not be
e�cient due to redundancy of similar data, such as the input information. To avoid
such a costly duplication of the chromosome's tree, we use one chromosome's tree
to represent the input information of all intranet's tasks, and embed a special array
of pointers in each class instance to represent the data management and network
design information for all candidate solutions in the population.
98

A backbone node contains an array of pointers to the population of backbone
network designs, b net pop[], as shown in Figure 6.5. Each entry in the array rep-
resents the backbone network of a chromosome in the population. PS is an integer
number that is given by the designer to indicate the population size. There are four
pointers in each entry of the array: ethernet ptr, atm ptr, router ptr, and tree ptr to
four di�erent instances of classes. These four pointers represents the possible net-
work technologies that are available to connect all site networks within the backbone.
Only one pointer out of the four backbone network technology pointers is valid for
given candidate design, while the rest are pointing to null. A valid pointer points to
a speci�c instance of network type, for example an ethernet ptr points to an instance
of an Ethernet network class which contains the attributes of the allocated Ethernet
hub, as shown in Figure 6.5. This allocated Ethernet hub represents the backbone
network design decision for one of the candidate solutions. Input information about
the backbone is included within the backbone node. This information includes the
inter-site tra�c, the type of backbone (local or wide) and the data management
tra�c ow.
A site node contains an array of pointers to the population of site network designs,
s net pop[], as shown in Figure 6.6. Each entry in the array represents the site
network of a design in the population. PS is an integer number that is given by the
designer to indicate the population size. There are three pointers in each entry of the
array: ethernet ptr, atm ptr, and router ptr to three di�erent instances of classes.
These three pointers represent the possible network technologies that are available
to connect all group networks within a site. Only one pointer out of the three site
network technology pointers is valid for given candidate design, while the rest are
pointing to null. A valid pointer points to a speci�c instance of network type, for
example a router ptr points to an instance of a router network class which contains
the attributes of the allocated router, as shown in Figure 6.6. This allocated router
represents the site network design decision for one of the candidate solutions. The
99

backbone_node
site_child_pointer
b_net_pop[]
ethernet identificationphysical locationmodelprotocolbandwidth capacitytype of wirenumber of portscostport-assignment[]bridge_ptr
ethernet_node
ethernet_ptratm_ptrrouter_ptrtree_ptr
design1 2 ……PS
........
....null
Figure 6.5: Embedded network design array for a backbone node.
site's input information is included within the site node. These inputs are the site's
identi�cation, the site tra�c ow, and the data management tra�c ow.
A group node contains two arrays of pointers to the population of group network
designs and group data management designs: g net pop[] and g dm pop[] as shown
in Figure 6.7. The array g net pop[] includes all network design decisions. Each
entry in g net pop[] represents the group network of a design in the population.
PS is an integer number that is given by the designer to indicate the population
size. There are two pointers in each entry of the array: ethernet ptr, and atm ptr to
two di�erent instances of classes. These two pointers represents the possible network
technologies that are available to connect all clients within a group. Only one pointer
out of the two group network technology pointers is valid for given candidate design,
while the other one is pointing to null. A valid pointer points to a speci�c instance
of network type, for example an atm ptr points to an instance of an ATM switch
100

site_node
site_sibling_pointergroup_child_pointer
s_net_pop[]
ethernet_ptratm_ptrrouter_ptr
design1 2 ….. PS
......
...
router identificationphysical locationmodelprotocolprocessing capacitytype of wirenumber of portscostport-assignment[]
router_node null
Figure 6.6: Embedded network design array for a site node.
network class which contains the attributes of the allocated ATM switch as shown in
Figure 6.7. This allocated ATM switch represents the group network design decision
for one of the candidate solutions. The array g dm pop[] includes all possible data
management design decisions and each entry in g dm pop[] represents a design in
the population. There is one pointer in each entry of the array: server ptr to an
instance of server class. server ptr points either to a possible placement of servers
for a given candidate design or null as shown in Figure 6.7. The input information
for a group task includes the group's identi�cation, the group tra�c ow, the data
management tra�c ow, and the client linked list (pointed by client child pointer).
Each node in the client linked list contains client's identi�cation, client's location,
client tra�c ow, and pattern of requested �les by the client.
101

group_node
group_sibling_pointerclient_child_pointer
g_net_pop[]g_dm_pop[]
atm identificationphysical locationmodelprotocolbandwidth capacitytype of wirenumber of portscostport-assignment[]
atm_nodenull
ethernet_ptratm_ptr
.. .. ..
design1 2 …. PS
design1 2 …. PS
server_ptr .. ..server_ptr
server identificationphysical locationmodelnumber of CPUsclock cyclemain memory capacityinternal disk capacitycosthard_disk_ptr
server_node null
Figure 6.7: Embedded network and data management design arrays for a groupnode.
6.3.2 Initial Population
A genetic algorithm starts with a population of intranet infrastructures, PII(t=0) =
fII t1, IIt2,...,II
ti,...,II
tPSg. t represents the current generation number and PS repre-
sents the population size. This initial population, PII(t=0), represents the randomly
synthesized intranet infrastructure solutions that will start the evolutionary process.
We developed a bottom-up randomized heuristic algorithm for generating valid
intranet infrastructure solutions. The bottom-up algorithm consists of �ve proce-
dures. The �rst procedure designs the data management system by allocating and
binding data management hardware components for the group tasks in a solution.
The second procedure designs the group network by allocating and binding a network
hardware component for each group task within a design. All clients and a possible
102

data management component within the group task are to be connected using the
allocated group network connector. The third procedure designs the site network
by allocating and binding a network hardware component for each site task within
a candidate design. All group network components within a site are to be con-
nected using either the allocated site network connector or the allocated site router.
The fourth procedure designs either a local backbone network or a wide backbone
network. For a local local backbone network, this procedure allocates and binds
a network hardware component for the backbone task in a design, so that all site
network components are connected to either the allocated backbone network connec-
tor or the allocated backbone router. For a wide backbone network, this procedure
creates a tree topology to connect all site network components within the backbone
task. The �fth procedure insures that the synthesized intranet infrastructure passes
all design and performance constraints. Otherwise, procedures 1-4 are repeated until
all the constraints of the intranet infrastructure design are met.
The bottom-up algorithm continues to run until all the initial intranet infras-
tructures (candidate designs) in the population are designed correctly. Also, the
bottom-up algorithm insures the diversity of the initial population. For example,
the bottom-up algorithmmodi�es Constraint 5.19 by comparing the average network
delay (AND) to twice threshold network delay (TND). This creates a diverse popu-
lation with high and low performance designs, which can help the genetic algorithm
to converge to a good �nal design faster.
6.3.3 Fitness of A Chromosome
The �tness of an intranet design is measured by the intranet integration cost (IIC),
as stated in Equation 4.30. The intranet integration cost (IIC) can be expressed as
the sum of the network architecture cost (NAC) and the data management system
cost (DMSC).
103

6.3.4 Selection Mechanism
The selection mechanism used in i -CAD is based on the proportionate selection
scheme [Mic94]. The probability that an intranet infrastructure II ti will be selected
for the next generation PII(t+1) has to satisfy the following constraint:
IIC(II ti) �
PPSi=1 IIC(II
ti)
PS(6.1)
Constraint 6.1 insures that the total intranet integration cost IIC() of an intranet
infrastructure II ti to be selected has to be less than or equal to the average cost of
the whole population. IIC() is the �tness function as described in Equation 4.30.
II ti represents the identi�cation of the ith intranet infrastructure design during the
tth generation. PS is an integer number that is given by the designer to indicate
the population size.
6.3.5 Mutation Operator
The mutation operator performs unary transformations by changing a single gene in
the intranet infrastructure chromosome. There are six types of genes in the intranet
chromosome that can be randomly selected for mutation, as shown in Figure 6.8.
The ow diagram illustrates all six gene mutations: group network, site network,
local backbone network, wide backbone network, group server and hard disk. The
number of designs to be selected for mutation depends on the mutation rate, MR.
This mutation rate indicates the probability of selecting chromosomes within a given
population size, and it is a real number given by the designer. The mutation operator
performs only one type of gene mutation during a generation, so that its e�ect can
be examined more clearly to determine whether it improves the �tness of these
candidate solutions or not.
104

startmutationoperator
endmutationoperator
selectchromosome
networkor
datamanagement
group,site, or
backboneserver, orhard disk
selectgroup
mutategroup
network
mutatebackbone
local network
local, orwideselect
site
mutatesite
network
selectlink
mutatelink
validate and evaluatechromosome
selectgroupserver
mutategroupserver
selecthard disk
mutategroupserver
2
1
validchromosome
yes
1
counterexceeded
no
no
yes
1 1
1
1 1
2
Figure 6.8: Flow diagram for the mutation operator.
The mutation operator starts by selecting a candidate design from the population
randomly. During a generation, the mutation operator performs either a network
mutation or a data management mutation. The case selection is determined ran-
domly. In either case, a gene is selected and its hardware component is replaced
by a new one. Then, the mutated chromosome is examined to see if it has violated
any design or performance constraints. If it does violate any constraint, then the
mutation operator repeats the same gene mutation, as indicated by the circled 1 in
the ow diagram. The mutation operator tries to insure that the new o�spring is a
105

valid design. Otherwise, it selects another chromosome as indicated by the circled 2
in the ow diagram.
6.3.6 Crossover Operator
The crossover operator performs higher order transformations by exchanging parts
from two \good" intranet solutions (parent) to replace two \bad" intranet solutions
with o�spring. Based on the selection mechanism and crossover rate, the intranet
population is divided into two sets. This crossover rate indicates the probability
of selecting solutions to crossover. The crossover rate is a real number given by
the designer. The \good" set contains all intranet designs that satisfy all design
and performance constraints. The costs of these designs are equal to or less than
the average cost of the entire population as stated in Equation 6.1. The \bad" set
contains all intranet designs that may satisfy all design and performance constraints
but their costs are greater than the average cost of the entire population as stated
in Equation 6.1.
A purely random crossover that mixes the network or data management genes
from di�erent levels (such as site and backbone, site and group or group and back-
bone) in an arbitrary fashion is not appropriate. For example, crossing a backbone
level with a group level or vice versa leads to a lot of network and data management
design violations. The network violation occurs due to the di�erent sets of network
constraints and network technology options that are de�ned for a backbone network,
as stated in Section 4.2.3, and a group network, as stated in Section 4.2.1. The data
management violation occurs due to the restriction of placing servers only at the
group level, where a server is not allowed to be placed at the backbone task. Similar
violations may occur when a group level is crossed with a site level or a site level
is crossed with a backbone level. Because a purely random crossover violates the
design constraints at each level that may generate a large number of invalid intranet
designs. To repair all the invalid designs generated by a purely random crossover
106

operator, this will be a complex task due to the large number of constraints that
are involved. Also, the time to repair all invalid designs may be intolerably long.
Therefore, we consider a more intelligent crossover operator that mixes the genes at
the same level only, as shown in Figure 6.9.
crossover
cut-linecut-linetiII t
jII
1+tkII 1+t
lII
backbone level
site level
Figure 6.9: One possible example of a crossover.
Our crossover operator starts by selecting two o�spring chromosomes randomly
from the pool of the non-selected chromosomes, as shown in Figure 6.10. Next, two
parent chromosomes are selected randomly from the pool of the selected chromo-
somes. To perform the crossover operation on the two parent chromosomes, two
cuts are needed, one at the backbone level and one at the site level. Let II ti and
II tj be the chromosome tree representations of two intranet infrastructures and let
II t+1k and II t+1l be the chromosome tree representations of the new o�spring intranet
infrastructures. Figure 6.9 depicts one possible cut between II ti and IItj out of many
possibilities.
The �rst cut depends on the type of backbone network topology: local star or
wide tree. If it is a local star topology, then crossing the two backbone network com-
ponents (parent) is manageable. At random, one of the parent's backbone network
components is assigned to one of the o�spring's backbone network component, and
the other parent's backbone network component is assigned to the other o�spring's
107

startcrossoveroperator
endcrossoveroperator
select twooffspring chromosomes
merge two parents’trees as a graph
cross site networkscross group networks
cross data management systems
local, orwide
backbonetopology
validate and evaluatechromosomes
validchromosomes
yes
select twoparent chromosomes
selectbackbone
cut
crossbackbonenetwork
find two valid treesfrom the graph
selectsitecut
local wide
2
1
counterexceeded
no
no
yes
1
1
2
Figure 6.10: Flow diagram for the crossover operator.
backbone network component (simple swap). Otherwise, if the backbone network
topology is a wide tree topology, then crossing the two backbone networks (parent)
is more complicated. The problem of crossing two valid tree topologies (parent) and
producing two valid tree topologies (o�spring) is an open complex problem, as indi-
cated by the following research papers [ASW94, ASW95, DAS97b, DAS97a, Che97,
LLX98, ZL99, KC00]. These papers suggest several approaches in using genetic algo-
rithm to design a tree topology network. One of these suggestions [ASW94, Che97]
is not to use a crossover operator and only use a mutation operator to avoid all
108

the repairs. The other papers suggest several crossover heuristic algorithms with
several cut points, for example. In our problem, we develop a procedure to merge
the two parent trees as one graph, and then �nd two valid trees from the graph to
be considered for the o�spring's backbone networks.
The second cut is performed at the site level. If the number of site tasks is even,
then the cut happens at the middle. Otherwise, the site tasks are divided into two
sets, one set is larger than the other one by one. Then, all site networks, group
network and data management systems are crossed, the new o�spring chromosomes
are validated and evaluated. If the new o�spring chromosomes satisfy all design and
performance constraints, then the crossover operator stops. Otherwise, the crossover
operator tries several crosses between the same parent chromosomes as indicated by
the circled 1, before it selects new parent chromosomes as indicated by circled 2.
6.3.7 Termination Condition
The maximum generation limit is the termination condition used within i -CAD.
This limit sets an upper bound on the number of generations (NG), given as an
integer. i -CAD repeats the optimization loop until the generation counter reaches
its upper limit.
6.4 Avoiding Sub-Optimal Solutions
To avoid converging prematurely to sub-optimal solutions, either local minima or
maxima, we are aware of four aspects of genetic algorithm (GA) that can help us
resolve such a problem. The �rst aspect is the coding of the problem. Although
the overall framework of GA is well-known, an inappropriate implementation of
GA for a problem can easily nullify the advantages of GA. The primary di�culty
comes from the representation of the solution intranet infrastructure. The binary
109

representation traditionally used in GA has some drawbacks when applied to mul-
tidimensional problems, since it requires a very long binary solution vector. This,
in turn, generates complicated genetic operators and a huge search space. Thus, we
encode each solution as a tree data structure, which gives us a better representation
of the network and data management hardware infrastructure than a binary repre-
sentation. The second aspect is the initial population generation. Because of the
complexity of our problem, we develop techniques to create the initial population
and insure its diversity. This, in turn, converges to a good solution faster. The third
aspect is the selection process. We monitor the member selection process so that the
population diversity is consistent for each generation and the best member of each
generation is preserved. An increase in the selective pressure decreases the diversity
of the population, and vice versa. This, in turn, generates an improved new genera-
tion in every iteration of GA. The fourth aspect is the number of generations. This
number re ects the iteration of the selection and optimization task, which should
either produce better solutions or retain the same solutions. Therefore, we try to
experiment with a set of large numbers that can avoid premature convergence and
at the same time reduce the number of cycles of design. Designs produced using the
genetic algorithm are presented in the following chapter.
110

Chapter 7
Experimental Results
7.1 Background
In our experiments we considered two intranet integration problems: a partial
animation production studio and a full animation production studio. i -
CAD automatically integrated data management systems and network architectures
for both these problems. Although the examples are speci�c to our model of a typical
animation production studio, the i -CAD code is generic, and can design intranets
in any application domain that is data intensive.
This chapter is organized into three sections. Section 7.2 contains the results
of two experiments that concentrated on designing optimized network architectures
for a partial animation studio intranet. Section 7.3 contains the results of two
experiments involving the design of combined optimized data management systems
and network architectures for the partial animation studio intranet. Section 7.4
contains the results of two experiments concerning the design of optimized data
management systems and also network architectures for the full animation studio
intranet.
The results of the six experiments were generated by i -CAD, which was imple-
mented in C++. The software contains about 22,000 lines of code. The purpose of
111

these experiments was �rst to show that automatic intranet synthesis and integra-
tion is feasible, second to observe the optimization process, and last to observe the
trade-o� between cost and performance.
7.2 A Partial Animation Studio: Network Design
The partial animation studio example consists of four site tasks, eight group tasks
and 65 client tasks, as shown in Figure 2.2. The goal here is to design a three-level
network architecture that enables all 65 client tasks (performed on 65 workstations)
to perform their tasks while satisfying all design and performance constraints. Ta-
ble 7.1 provides information about the clients and groups in the intranet.
Table 7.1: Client and group clustering information.
Site Group ClientTask Task Task(ST) (GT) (CT)
1 1 1-104 11-15
2 2 16-205 21-30
3 6 51-577 58-65
4 3 31-408 41-50
The tra�c ow within a group or site is summarized by three parameters: local
tra�c, outgoing tra�c and incoming tra�c, all of which are calculated from the
client tra�c matrix (CTM). The local tra�c represents all the tra�c ow within a
task. The outgoing tra�c represents all the tra�c ow leaving a task to all other
tasks. The incoming tra�c represents all the tra�c ow coming into a task from
all other tasks. Table 7.2 shows a possible tra�c ow assignment, where the tra�c
ow is measured in megabits per second (Mbps).
112

Table 7.2: Tra�c ow among site and group tasks.
Local Outgoing IncomingTask Tra�c Tra�c Tra�c
(Mbps) (Mbps) (Mbps)
site task 1 0.0 55.625 2.5site task 2 0.0 15.0 21.25site task 3 0.0 15.0 33.75site task 4 4.2 7.5 35.625group task 1 27.0 7.5 0.0group task 2 2.0 2.5 2.5group task 3 9.0 15.0 7.5group task 4 8.0 48.125 2.5group task 5 9.0 12.5 18.75group task 6 4.2 7.7 16.625group task 7 5.6 4.0 23.2group task 8 9.0 0.0 26.25
The tra�c ow within the backbone task can be summarized by one parameter
(backbone local tra�c, BLOT) or site tra�c matrix (STM) depending on which
topology is used. For a local star topology, the backbone local tra�c (BLOT)
represents all the tra�c ow between all sites. For our example, BLOT is equal
to 93.125 Mbps. For a wide tree topology, a site-to-site tra�c ow is needed to
determine each link's capacity. Table 7.3 shows a possible site tra�c matrix (STM).
Each entry in the STM, STi;j, represents the tra�c ow from site task i to site
task j. The value STi;j is measured in megabits per second (Mbps). The site tra�c
matrix is not symmetric and is based on the data ow within the task ow graph.
7.2.1 Experiment 1: Partial Animation Studio with Local
Backbone Topology
In this experiment we present the results of designing optimized three-level network
architectures, where all four sites are located within a studio lot. Thus, the backbone
113

Table 7.3: A site tra�c matrix (STM).
site site site sitetask 1 task 2 task 3 task 4
site task 1 0.0 16.25 18.75 20.625site task 2 0.0 0.0 7.5 7.5site task 3 2.5 5.0 0.0 7.5site task 4 0.0 0.0 7.5 0.0
network is a local star topology. The goal is to synthesize a communication network
to enable all tasks to be performed in order and within a delay bound. We ran i -
CAD with several threshold network delays (TND) ranging from �ve seconds to one
minute. In addition, we used the following parameters: population size (PS) = 250,
number of generations (NG) = 3000, mutation rate (MR) = 0.05, and crossover rate
(CR) = 0.80. Figures 7.1 and 7.2 show two plots of the same three-level network
design problem with two di�erent TND values: 60.0 and 5.0 seconds respectively.
The plot in Figure 7.1 depicts three curves:
1. The average design cost curve (TND = 60.0 seconds) represents the average
3-level network design cost of the entire network design population for one
generation, where TND is equal to 60.0 seconds.
2. The best design cost per generation curve (TND = 60.0 seconds) represents the
lowest 3-level network design cost from the entire network design population
for one generation, where TND is equal to 60.0 seconds.
3. The best design overall represents the lowest 3-level network design cost since
the beginning of the optimization process.
These three curves demonstrate the optimization process. For example the cost
of the initial best 3-level network design, when TND is equal to 60.0 seconds, is
$332,430.25. During 2.24 minutes of total run time, i -CAD found a design costing
$78,960.13, which is four times lower in cost than the initial best design. In a second
114

6000065000700007500080000850009000095000
100000105000110000115000120000125000130000135000140000145000150000155000160000165000170000175000180000185000190000195000200000
0 250 500 750 1000 1250 1500 1750 2000 2250 2500 2750
Generations
Net
wor
kD
esig
nC
ost,
$
average design cost (TND = 60.0 sec)
best design cost per generation (TND = 60.0 sec)
best design overall
Figure 7.1: Optimization process for 3-level network design with TND = 60.0 sec-onds.
example as depicted by the three curves in Figure 7.2, the cost of the initial best
3-level network design, when TND is equal to 5.0 seconds, is $533,531.13. During
2.46 minutes of total run time, i -CAD found a design costing $167,815.00, which is
three times lower in cost than initial best design. The three curves in Figure 7.2
represent the following:
1. The average design cost curve (TND = 5.0 seconds) represents the average
3-level network design cost of the entire network design population for one
generation, where TND is equal to 5.0 seconds.
2. The best design cost per generation curve (TND = 5.0 seconds) represents the
lowest 3-level network design cost from the entire network design population
for one generation, where TND is equal to 5.0 seconds.
3. The best design overall represents the lowest 3-level network design cost since
the beginning of the optimization process.
115

150000155000160000165000170000175000180000185000190000195000200000205000210000215000220000225000230000235000240000245000250000255000260000265000270000275000280000285000290000295000300000
0 250 500 750 1000 1250 1500 1750 2000 2250 2500 2750
Generations
Net
wor
kD
esig
nC
ost,
$ average design cost (TND = 5.0 sec)
best design cost per generation (TND = 5.0 sec)best design overall
Figure 7.2: Optimization process for 3-level network design with TND = 5.0 seconds.
The di�erent design decisions that are made by i -CAD for a three-level network
when TND is varied from 60.0 seconds to 5.0 seconds are illustrated in Figures 7.3
and 7.4 respectively. For example, for site task one (ST1), there are three network
resources that must be allocated and bound to two group tasks (GT1 and GT4) and
the site task (ST1). To reduce the total network components' delay from 60.0 seconds
to 5.0 seconds, di�erent network components must be replaced. In this case all the
network components are replaced so that the new TND can be satis�ed. When i -
CAD replaces a network component, it not only changes certain attributes such as
bandwidth, number of ports, and cost. i -CAD deletes the old network component
and allocates and binds a new network component.
116

IP router100Kpps5 ports
$7K
live-action tasks IP router50Kpps5 ports
$3K
ST1
GT1ATM switch
45Mbps, 15 ports, $9K
CT3
CT2
CT1
CT4CT5 CT6 CT7 CT8 CT10CT9
GT4
ATM switch75Mbps, 10 ports, $8K
CT11
CT12
CT13 CT14 CT15
IP router50Kpps5 ports
$3K
GT5
ST2
management tasksIP router50Kpps5 ports
$3K
GT3
CT40
ATM switch45Mbps, 15 ports, $9K
CT39 CT38 CT37CT36 CT35
CT31
CT32
CT33
CT34
ATM switch45Mbps, 15 ports, $9KGT8
CT49 CT48 CT47 CT46 CT45
CT41
CT42
CT43
CT50 CT44
ST3
IP router50Kpps5 ports
$3K
GT7
GT6ATM switch
45Mbps, 10 ports, $6K
CT53 CT54 CT55 CT56 CT57
CT51
CT52
ST4
CT58
CT59
CT60
ATM switch45Mbps, 10 ports, $6K
CT61
CT62 CT63 CT64 CT65
background andspecial-effect tasks
Network hardware component cost = $75,200.00,Network interconnection cost = $0,Network wire cost = $3,760.13,Average network delay = 37.5259 seconds, andNetwork homogeneity factor = 0.538462 ( 1 Ethernet hub, 8 ATM switches, 5 routers).
audio tasks
GT2Ethernet Hub
10Mbps, 6 ports, $200CT11
CT12CT13CT14CT15
ATM switch45Mbps, 15 ports, $9K
CT3
CT2
CT1
CT4
CT5CT6CT7CT8CT10 CT9
Figure 7.3: A 3-level network for partial animation studio intranet (TND = 60.0seconds).
117

The network homogeneity factor (HF) is an output parameter in the range (0,1.0];
HF = 1.0 indicates that all the allocated network hardware components are based
on the same technology. Otherwise, HF indicates the ratio of the maximum number
of allocated network technology components of the same technology over the total
allocated network hardware components within the intranet.
audio tasks
GT2ATM switch
75Mbps, 10 ports, $8K
CT11
CT12
CT13CT14CT15
GT5Ethernet Hub
100Mbps, 12 ports, $13K
CT3
CT2
CT1
CT4
CT5CT6CT7CT8CT10 CT9
management tasksIP router150Kpps5 ports$11K
GT3
CT40
Ethernet Hub100Mbps, 12 ports, $13K
CT39 CT38 CT37CT36 CT35
CT31
CT32
CT33
CT34
Ethernet Hub100Mbps, 12 ports, $13K
GT8
CT49 CT48 CT47 CT46 CT45
CT41
CT42
CT43
CT50 CT44
ST3
live-action tasks IP router150Kpps5 ports$11K
ST1
GT1ATM switch
100Mbps, 15 ports, $15K
CT3
CT2
CT1
CT4CT5 CT6 CT7 CT8 CT10CT9
GT4Ethernet Hub
1Gbps, 6 ports, $13K
CT11
CT12 CT13 CT14 CT15
IP router100Kpps5 ports
$7K
GT7
GT6Ethernet Hub
100Mbps, 8 ports, $9.2K
CT53 CT54 CT55 CT56 CT57
CT51
CT52
ST4
CT58
CT59
CT60
Ethernet Hub1Gbps, 10 ports, $25K
CT61
CT62 CT63 CT64 CT65
background andspecial-effect tasks
IP router150Kpps5 ports$11K
IP router100Kpps5 ports
$7K
ST2
Network hardware component cost = $156,200.00,Network interconnection cost = $0,Network wire cost = $11,615.00,Average network delay = 4. 9135 seconds, andNetwork homogeneity factor = 0.451538 (6 Ethernet hubs, 2 ATM switches, 5 routers).
Figure 7.4: A 3-level network for partial animation studio intranet (TND = 5.0seconds).
118

Comparing the outcomes of i -CAD for this experiment with hand-computed
designs is shown in Table 7.4, where each of the 3 hand-computed designs satis�es
certain constraints. The �rst design satis�es only the connectivity constraint, where
all allocated and bound network components have the lowest cost and at the same
time they have su�cient number of ports to connect all workstations within a group,
all groups within a site and all sites within the backbone. This design costs $3400.00,
but it has an in�nite network delay. The second design satis�es both the connectivity
and capacity constraints, where all allocated and bound network components have
su�cient number of ports and communication bandwidth to satisfy all groups', sites'
and backbone' ports and tra�c ow. This design costs $75200.00 with a 37.525
seconds network delay, and was also found by i -CAD as the best 3-level network
design when TND is set to 60.0 seconds. The third design, in Table 7.4, satis�es
both the connectivity and capacity constraints, with all the allocated and bound
network components having the highest communication bandwidth available in the
network design libraries. Details of the design libraries are found in Appendix B.
Table 7.4: Hand-computed 3-level network designs.
Design Type of Component and AverageNumber Design Interconnection Network
Costs, $ Delay, seconds
1 connectivity 3,400.00 1
connectivity2 and 75,200.00 37.525
capacityconnectivity
3 with highest 629,000.00 0.830performance
The relationship between the network design cost and the threshold network
delay (TND) can be shown in Figure 7.5. The seven points in the plot represent seven
network designs with TND set to 5.0, 10.0, 20.0, 30.0, 40.0, 50.0 and 60.0 seconds
119

respectively. The 3-level network design cost is reduced by more than half, from
$167,815.00 to $78,960.10, when TND increases from 5.0 seconds to 60.0 seconds.
This plot illustrates the inverse relationship between the network cost and delay.
Details of the designs are found in Appendix A.
400005000060000700008000090000
100000110000120000130000140000150000160000170000180000
5 10 15 20 25 30 35 40 45 50 55 60 65
Thrshold Network Delay, sceonds
Netw
ork
Desi
gn
Co
st,$
Figure 7.5: Network design cost versus threshold network delay.
The run-time of this experiment is shown in Table 7.5, when i -CAD is executed on
a shared SUN Enterprise server E4500/E5500. The �rst column, Threshold Network
Delay, is an input to the tool, and the rest of the columns are measured by i -CAD
using the C++ library function, clock(). This function returns the processor time
used by the program since the beginning of execution. Each row in the run-time table
re ects an average of ten runs by i -CAD. The table shows the measured times to
perform all the initial network designs, the crossover operation over all generations,
and the mutation operation over all generations. The last column indicates the time
that took i -CAD to design and optimize three-level network architectures for this
experiment.
120

Table 7.5: i -CAD run-time for Experiment 1.
Threshold Initial Crossover Mutation TotalNetwork Design Operation Operation RunDelay Time Time Time Time
in seconds in seconds in seconds in seconds in seconds
60.0 2.59 12.50 26.96 134.5450.0 2.54 12.49 27.16 134.9340.0 2.56 12.42 27.39 135.0530.0 2.56 12.45 27.96 136.3320.0 2.57 12.54 28.56 135.5410.0 2.96 12.55 30.78 140.035.0 4.29 12.69 37.47 147.84
7.2.2 Experiment 2: Partial Animation Studio with Wide
Backbone Topology
In this experiment we present the results of designing optimized three-level network
architectures, where all four sites are located in Southern California, United States.
The �rst site task (live-action) is located in Burbank, the second site task (audio)
is located in Pasadena, the third site task (management) is located in Hollywood
and the fourth site task (background and special-e�ect) is located in Santa Monica.
Figure 7.6 depicts a map of the Los Angeles basin and distance chart between the
four sites in miles.
The objective is to synthesize a 3-level network, where the backbone network
is constrained to a tree topology that must allow all site tasks to communicate
with each other according to the site tra�c matrix (STM) while satisfying some
design and performance requirements. The tree topology has two cost functions:
initial cost (IC) and monthly cost (MC). The initial cost refers to the total cost of
network and interconnection components that are needed to connect all sites. This
cost is considered once. The monthly cost refers to total monthly subscription fee
for operating and maintaining such a tree topology network. We ran the i -CAD
121

Malibu
Santa Monica
Anaheim
PacificOcean
Hollywood
Burbank
Pasadena
LongBeach
Marina del ReyLAX Airport
Pasadenasite 2
Santa Monicasite 4
Burbanksite 1
Hollywoodsite 3
Burbanksite 1
Pasadenasite 2
Hollywoodsite 3
Santa Monicasite 4
0.0
0.0
0.0
0.0
10.0 8.0 18.0
8.0
18.0
10.0 12.0 22.0
10.012.0
22.0 10.0
Distance chart between the four sites in miles.
Los Angeles Mapnot on scale
Figure 7.6: Locations of the four site tasks within the City of Los Angeles, California,USA.
tool with several threshold network delays (TND) ranging from six seconds to one
minute. In addition, we used the following parameters: population size (PS) = 250,
number of generations (NG) = 3000, mutation rate (MR) = 0.05, and crossover
rate (CR) = 0.80. Figures 7.7 and 7.8 show two plots of the same network design
problem with two di�erent TND values: 60.0 and 6.0 seconds respectively. The plot
in Figure 7.7 depicts three curves:
1. The average design cost curve (TND = 60.0 seconds) represents the average
3-level network design cost of the entire network design population for one
generation (including a 12-month lease for a tree topology connecting the four
sites), when TND is equal to 60.0 seconds.
2. The best design cost per generation curve (TND = 60.0 seconds) represents the
lowest 3-level network design cost from the entire network design population
for one generation (including a 12-month lease for a tree topology connecting
the four sites), when TND is equal to 60.0 seconds.
122

200000215000230000245000260000275000290000305000320000335000350000365000380000395000410000425000440000455000470000485000500000
0 250 500 750 1000 1250 1500 1750 2000 2250 2500 2750
Generations
Net
wor
kD
esig
nC
ost,
$
average design cost (TND = 60.0 sec)
best design cost per generation (TND = 60.0 sec)
best design overall
Figure 7.7: Optimization process for 3-level network design with a tree backbonetopology when TDN = 60.0 seconds.
3. The best design overall represents the lowest 3-level network design cost with
a tree backbone topology since the beginning of the optimization process.
These three curves demonstrate the optimization process. For example, the cost
of the initial best 3-level network design, when TND is equal to 60.0 seconds, is
$753,702.19. During 2.50 minutes of total run time, i -CAD found a design costing
$272,261.31, which is about three times lower in cost than the initial best design.
In the second example as depicted in Figure 7.8, the cost of the initial best 3-level
network design, when TND is equal to 6.0 seconds, is $1,406,604.63. During 3.08
minutes of total run time, i -CAD found a design costing $666,357.20, which is two
times lower in cost than initial best design.
1. The average design cost curve (TND = 6.0 seconds) represents the average
3-level network design cost of the entire network design population for one
generation (including a 12-month lease for a tree topology connecting the four
sites), when TND is equal to 6.0 seconds.
123

550000575000600000625000650000675000700000725000750000775000800000825000850000875000900000925000950000975000
1000000
0 250 500 750 1000 1250 1500 1750 2000 2250 2500 2750
Generations
Net
wor
kD
esig
nC
ost,
$ average design cost (TND = 6.0 sec)
best design cost per generation (TND = 6.0 sec)
best design overall
Figure 7.8: Optimization process for 3-level network design with a tree backbonetopology when TDN = 6.0 seconds.
2. The best design cost per generation curve (TND = 6.0 seconds) represents the
lowest 3-level network design cost from the entire network design population
for one generation (including a 12-month lease for a tree topology connecting
the four sites), when TND is equal to 6.0 seconds.
3. The best design overall represents the lowest 3-level network design cost with
a tree backbone topology since the beginning of the optimization process.
The di�erent designs that are produced by i -CAD when TND is varied from 60.0
seconds to 6.0 seconds are shown in Figures 7.10 and 7.11 respectively. To connect
four site tasks as a tree, there are three links that must be allocated and bound to
connect all sites. To reduce the total network components' delay from 60.0 seconds
to 6.0 seconds, all the link types are replaced to satisfy the new TND.
The relationship between the network design cost and the threshold network
delay (TND) can be shown in Figure 7.9. The eight points in the plot represent
eight network designs with TND set to 6.0, 7.5, 10.0, 20.0, 30.0, 40.0, 50.0 and 60.0
124
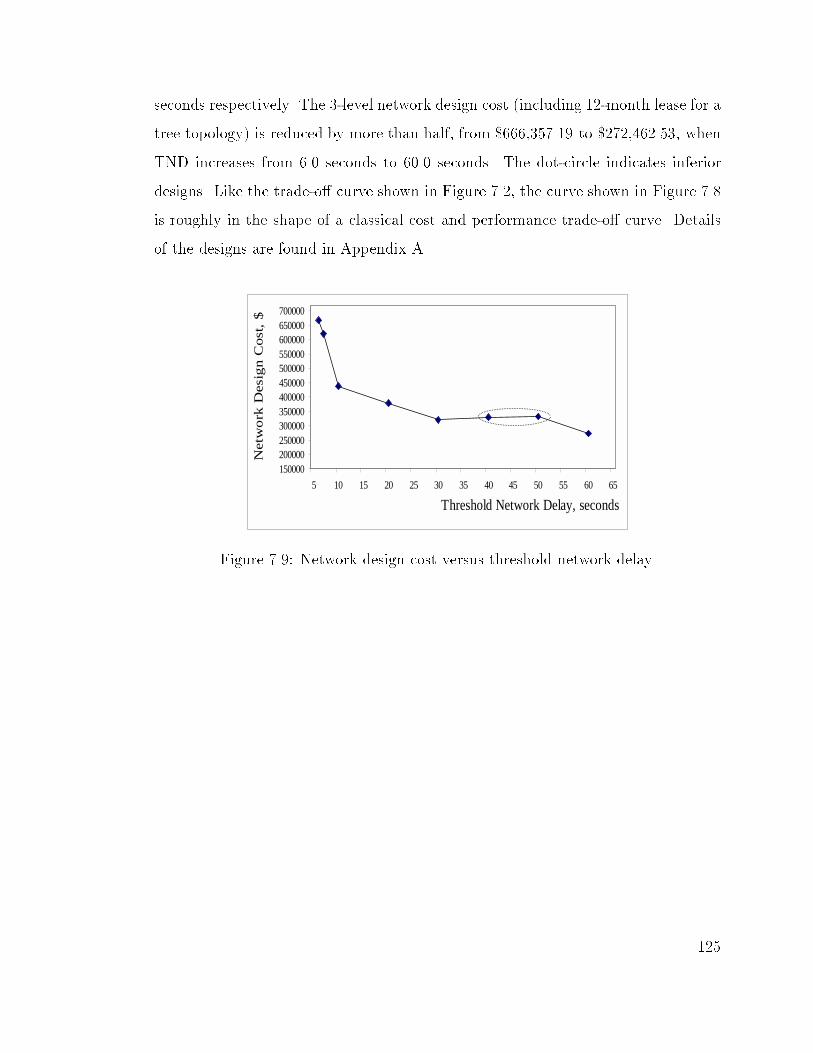
seconds respectively. The 3-level network design cost (including 12-month lease for a
tree topology) is reduced by more than half, from $666,357.19 to $272,462.53, when
TND increases from 6.0 seconds to 60.0 seconds. The dot-circle indicates inferior
designs. Like the trade-o� curve shown in Figure 7.2, the curve shown in Figure 7.8
is roughly in the shape of a classical cost and performance trade-o� curve. Details
of the designs are found in Appendix A.
150000200000250000300000350000400000450000500000550000600000650000700000
5 10 15 20 25 30 35 40 45 50 55 60 65
Threshold Network Delay, seconds
Net
wo
rkD
esig
nC
ost
,$
Figure 7.9: Network design cost versus threshold network delay.
125

Initial Network hardware component cost = $110,900.00,Monthly Network cost (12-month lease) = $132,200.00,Network interconnection cost = $26,000.00,Network wire cost = $3,561.31,Average network delay = 48.8868 seconds, andNetwork homogeneity factor = 0.53333 ( 1 Ethernet hub, 8 ATM switches, 3 routers, 2 VPN links, 1 SONET link).
live-action tasks ATM switch75Mbps5 ports
$5K
ST1
GT1ATM switch
45Mbps, 15 ports, $9K
CT3
CT2
CT1
CT4CT5 CT6 CT7 CT8 CT10CT9
GT4
ATM switch75Mbps, 10 ports, $8K
CT11
CT12
CT13 CT14 CT15
management tasksIP router100Kpps5 ports
$7K
GT3
CT40
ATM switch75Mbps, 15 ports, $11K
CT39 CT38 CT37CT36 CT35
CT31
CT32
CT33
CT34
ATM switch45Mbps, 15 ports, $9KGT8
CT49 CT48 CT47 CT46 CT45
CT41
CT42
CT43
CT50 CT44
ST3
IP router50Kpps5 ports
$3K
GT7
GT6ATM switch
45Mbps, 10 ports, $6K
CT53 CT54 CT55 CT56 CT57
CT51
CT52
ST4
CT58
CT59
CT60
ATM switch45Mbps, 10 ports, $6K
CT61
CT62 CT63 CT64 CT65
background andspecial-effect tasks
IP router50Kpps5 ports
$3K
GT5
ST2
audio tasks
GT2Ethernet Hub
10Mbps, 12 ports, $400CT11
CT12CT13CT14CT15
ATM switch75Mbps, 15 ports, $11K
CT3
CT2
CT1
CT4
CT5CT6CT7CT8CT10 CT9
link 1VPN
(shared OC3)38.88MbpsIC = $7.5K
MC = $2.5K
link 3VPN
(shared OC3)77.76MbpsIC = $15K
MC = $5.5K
link 2SONET(OC1)
51.84MbpsIC = $10KMC = $3K
Figure 7.10: A partial animation studio intranet (TND = 60.0 seconds).
126

IP router100Kpps5 ports
$7K
GT7
GT6Ethernet Hub
100Mbps, 8 ports, $9.2K
CT53 CT54 CT55 CT56 CT57
CT51
CT52
ST4
CT58
CT59
CT60
ATM Hub150Mbps, 10 ports, $15K
CT61
CT62 CT63 CT64 CT65
background andspecial-effect tasks
live-action tasks IP router150Kpps5 ports$11K
ST1
GT1ATM switch
100Mbps, 15 ports, $15K
CT3
CT2
CT1
CT4CT5 CT6 CT7 CT8 CT10CT9
GT4Ethernet Hub
1Gbps, 6 ports, $13K
CT11
CT12 CT13 CT14 CT15
IP router150Kpps5 ports$11K
CT40 CT39 CT38 CT37CT36 CT35
ST3
management tasks
GT3ATM switch
75Mbps, 15 ports, $11K
CT31
CT32
CT33
CT34
ATM switch150Mbps, 15 ports, $20KGT8
CT49 CT48 CT47 CT46 CT45
CT41
CT42
CT43
CT50 CT44
audio tasksEthernet Hub1Gbps4 ports
$8KGT2
Ethernet Hub100Mbps, 8 ports, $9.2K
CT11
CT12
CT13CT14CT15
GT5Ethernet Hub
1Gbps, 12 ports, $33K
CT3
CT2
CT1
CT4
CT5CT6CT7CT8CT10 CT9
ST2 Bridge80Kpps$260.00
Bridge70Kpps$240.00
link 2VPN
(shared OC3)116.64MbpsIC = $22.5KMC = $7K
link 1T-carrier
(DS4)264.24MbpsIC = $30K
MC = $13K
link 3T-carrier
(DS4)264.24MbpsIC = $30K
MC = $13K
Initial Network hardware component cost = $245,400.00,Monthly Network cost (12-month lease) = $396, 000.00,Network interconnection cost = $10,000.00,Network wire cost = $14,957.20,Average network delay = 5.98882 seconds, andNetwork homogeneity factor = 0.03333 ( 5 Ethernet hubs, 4 ATM switches, 3 routers, 1 VPN link, 2 T-carrier links).
Figure 7.11: A partial animation studio intranet (TND = 6.0 seconds).
127

The run-time of this experiment is shown in Table 7.6, when i -CAD is executed on
a shared SUN Enterprise server E4500/E5500. The �rst column, Threshold Network
Delay, is an input to the tool, and the rest of the columns are measured by i -CAD
using the C++ library function, clock(). Each row in the run-time table re ects
an average of ten runs by i -CAD. The table shows the measured times to perform
all the initial network designs, the crossover operation over all generations, and the
mutation operation over all generations. The last column indicates the time that
took i -CAD to design and optimize the three-level network architectures for this
experiment.
Table 7.6: i -CAD run-time for Experiment 2.
Threshold Initial Crossover Mutation TotalNetwork Design Operation Operation RunDelay Time Time Time Time
in seconds in seconds in seconds in seconds in seconds
60.0 2.80 26.63 29.02 170.4550.0 2.94 30.32 29.46 172.2440.0 2.84 30.55 29.91 173.0730.0 2.91 30.88 28.84 172.1620.0 3.21 29.41 30.01 172.7710.0 3.53 30.37 33.37 177.307.5 3.75 25.27 44.27 190.996.0 4.70 26.20 42.03 187.99
7.3 Complete Intranet Integration for A Partial
Animation Studio
In this section we present the results of two experiments. The �rst experiment is
to integrate a complete intranet infrastructure that consists of a data management
system and a network architecture, where the backbone network is a local star
topology. The second experiment is to integrate a complete intranet infrastructure
128

that also consists of a data management system and a network architecture, but the
backbone network is a wide tree topology. As stated in Section 7.2 the partial
animation studio consists of four site tasks, eight group tasks and 65 client tasks, as
shown in Figure 2.1.
The goal here is to design and integrate an optimized data management system
and a three-level network architecture so that all 65 client tasks (performed on 65
workstations) can communicate with each other and access �le servers while satis-
fying all design and performance constraints. All the input information regarding
the client and group clustering information, the tra�c ow among site and group
tasks, and the site tra�c matrix are the same as presented in Tables 7.1-7.3. The
input information regarding the data management system is given by Table 7.7. The
�rst three columns of Table 7.7 identify the �le identi�cation, the �le media-type
(such as text, still image, audio or video), and the �le size in megabytes respectively.
The fourth and �fth columns identify the group task and client task that are re-
questing the retrieval of such a �le. The last column indicates the total number of
requests per hour that are made by the client tasks. This data request table presents
a possible pattern of requests by the 65 client tasks that execute 501 �le retrieval
requests during the duration period (DP) of one hour (an average of 7.7 requests per
client task). The tra�c generated from requesting and retrieving �les in Table 7.7
is listed in Table 7.8. This table shows the data management tra�c ow at a group
task (column 1) when the client tasks within the group are requesting �le retrieval
from servers. Otherwise, there is no data management tra�c ow at the group task
level. The second column represents the tra�c ow generated by sending all clients'
requests within the group task to servers. This tra�c is in addition to the tra�c
between clients shown in the client tra�c matrix, Table 7.2. This group request
tra�c RQTGTe is expressed in Equation 7.1.
RQTGTe =TRGTe �RQPS
3600(7.1)
129
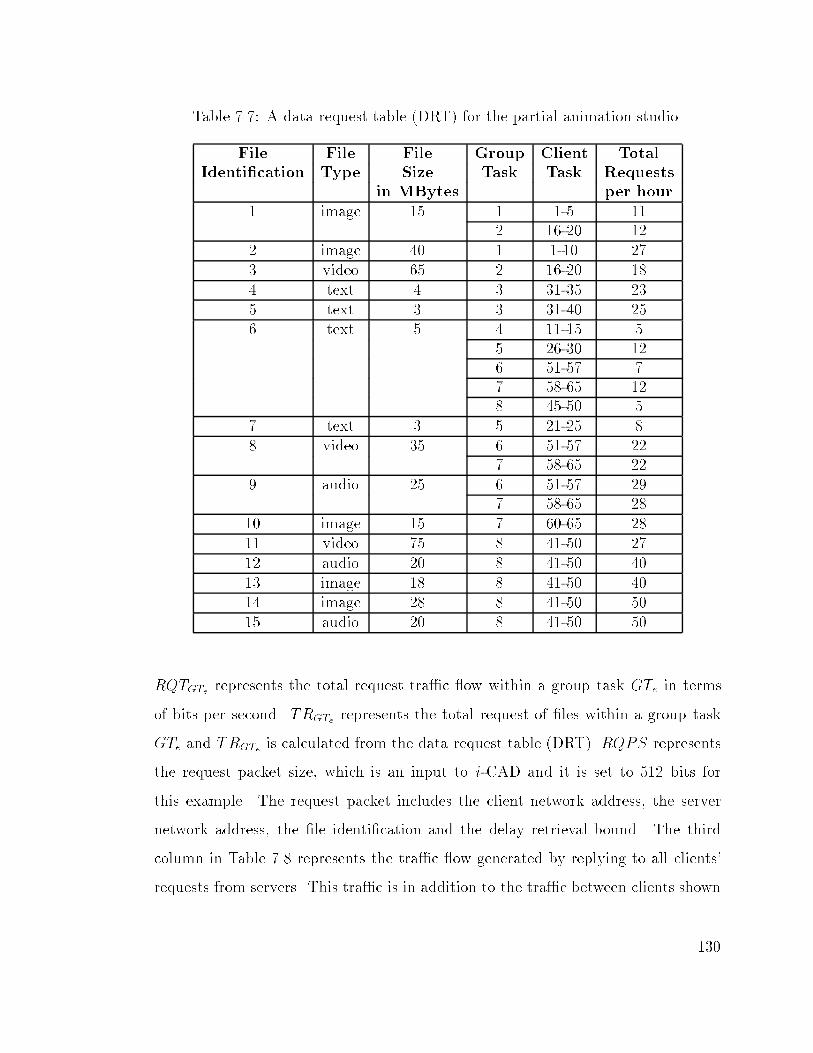
Table 7.7: A data request table (DRT) for the partial animation studio.
File File File Group Client TotalIdenti�cation Type Size Task Task Requests
in MBytes per hour
1 image 15 1 1-5 112 16-20 12
2 image 40 1 1-10 273 video 65 2 16-20 184 text 4 3 31-35 235 text 3 3 31-40 256 text 5 4 11-15 5
5 26-30 126 51-57 77 58-65 128 45-50 5
7 text 3 5 21-25 88 video 35 6 51-57 22
7 58-65 229 audio 25 6 51-57 29
7 58-65 2810 image 15 7 60-65 2811 video 75 8 41-50 2712 audio 20 8 41-50 4013 image 18 8 41-50 4014 image 28 8 41-50 5015 audio 20 8 41-50 50
RQTGTe represents the total request tra�c ow within a group task GTe in terms
of bits per second. TRGTe represents the total request of �les within a group task
GTe and TRGTe is calculated from the data request table (DRT). RQPS represents
the request packet size, which is an input to i -CAD and it is set to 512 bits for
this example. The request packet includes the client network address, the server
network address, the �le identi�cation and the delay retrieval bound. The third
column in Table 7.8 represents the tra�c ow generated by replying to all clients'
requests from servers. This tra�c is in addition to the tra�c between clients shown
130

Table 7.8: Data management tra�c ow within group tasks.
Group Request ReplyTask Tra�c Tra�c(GT) (in bps) (in bps)
1 5.404 2.900x10⁶
2 4.267 3.146x10⁶
3 6.827 0.389x10⁶
4 0.711 0.058x10⁶
5 2.844 0.196x10⁶
6 8.249 3.565x10⁶
7 12.800 4.544x10⁶
8 30.151 13.910x10⁶
in the client tra�c matrix, Table 7.2. This group reply tra�c RPTGTe is expressed
in Equation 7.2.
RPTGTe =X
8Fi requests by GTe
TCRi;GTe � FSi3600
(7.2)
RPTGTe represents the total reply tra�c ow for all clients' requests within a group
task GTe in terms of bits per second. TCRi;GTe represents the total requests of �le
i by all the clients of a group task GTe and TCRi;GTe is calculated from the data
request table (DRT). FSi represents the �le size of the ith �le (F).
The data management tra�c ow within a site task or the backbone task depends
on the placement of the servers and it is dynamically calculated within i -CAD after
the data management system is designed. If a group task has no local server, then
all its clients' request tra�c RQTGTe and reply tra�c RPTGTe have to ow either
to its site network (case 1) or both its site network and the backbone network (case
2). The �rst case occurs when a server is placed within another group task in the
same site and there is a binding between the server and group task (clients). The
binding indicates that a particular client's �les will be stored on a particular server.
The second case occurs when there is no placed server within the site or there is a
131

server placed within the site but there is no binding between the server and group
task (clients).
7.3.1 Experiment 3: Partial Animation Studio with Local
Backbone Topology
In this experiment we present the results of designing optimized intranet infrastruc-
tures, where all sites are located within a studio lot. Thus, the backbone network
is a local star topology. The goal is to integrate a data management system and
a three-level network architecture so that all 65 client tasks perform their tasks in
order and within a delay bound. We ran i -CAD with several threshold network
delays (TND) ranging from ten seconds to one minute. In addition, we used the
following parameters: population size (PS) = 250, number of generations (NG) =
3000, mutation rate (MR) = 0.05, crossover rate (CR) = 0.80, initial number of
servers = 4, and threshold data management performance (TDMP) = 0.30.
The optimization process of complete intranet integration is illustrated in two
examples as shown in Figures 7.12 and 7.13 respectively. The �rst example illustrates
the optimization process of an animation intranet design problem, when TND is set
to 60.0 seconds and the number of servers is set to four by i -CAD's user. However,
i -CAD can create intranet infrastructures with more or less than the number of
servers that has been initially set by the user. This e�ect is due to the crossover
operator. The three curves in Figure 7.12 represent the following:
1. The average design cost curve (TND = 60.0 seconds and 4 servers) represents
the average intranet integration cost, including the 3-level network design cost
and the data management system design cost, of the entire intranet design
population for one generation, when TND is equal to 60.0 seconds and the
number of servers is set to four.
132
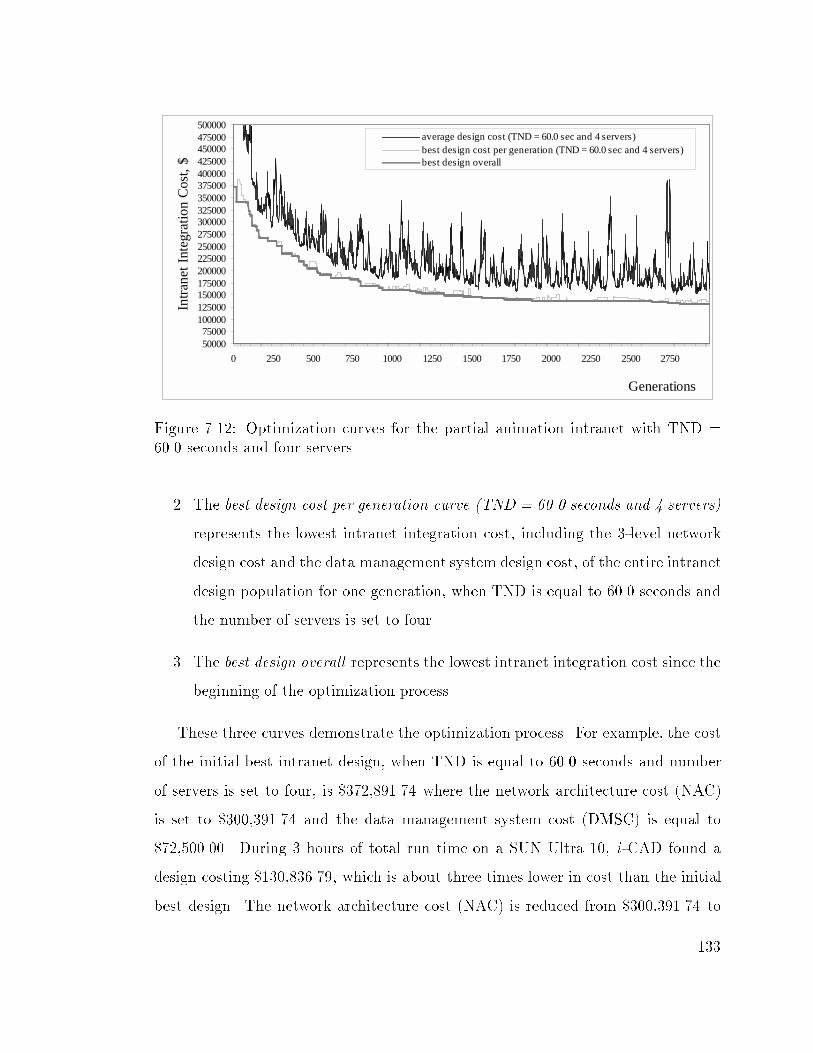
5000075000
100000125000150000175000200000225000250000275000300000325000350000375000400000425000450000475000500000
0 250 500 750 1000 1250 1500 1750 2000 2250 2500 2750
Generations
Intr
anet
Inte
grat
ion
Cos
t,$
average design cost (TND = 60.0 sec and 4 servers)best design cost per generation (TND = 60.0 sec and 4 servers)best design overall
Figure 7.12: Optimization curves for the partial animation intranet with TND =60.0 seconds and four servers.
2. The best design cost per generation curve (TND = 60.0 seconds and 4 servers)
represents the lowest intranet integration cost, including the 3-level network
design cost and the data management system design cost, of the entire intranet
design population for one generation, when TND is equal to 60.0 seconds and
the number of servers is set to four.
3. The best design overall represents the lowest intranet integration cost since the
beginning of the optimization process.
These three curves demonstrate the optimization process. For example, the cost
of the initial best intranet design, when TND is equal to 60.0 seconds and number
of servers is set to four, is $372,891.74 where the network architecture cost (NAC)
is set to $300,391.74 and the data management system cost (DMSC) is equal to
$72,500.00. During 3 hours of total run time on a SUN Ultra 10, i -CAD found a
design costing $130,836.79, which is about three times lower in cost than the initial
best design. The network architecture cost (NAC) is reduced from $300,391.74 to
133

$119,936.79, which is more than three times lower in cost than the initial best design.
The data management system cost is reduced from $72,500.00 to $10,900.00, which
is more than six times lower in cost than the initial best design. The second example
illustrates the optimization process of an animation intranet design problem with a
local backbone star topology, when TND is set to 20.0 seconds and the number of
servers is set to four. The three curves in Figure 7.13 represent the following:
5000075000
100000125000150000175000200000225000250000275000300000325000350000375000400000425000450000475000500000
0 250 500 750 1000 1250 1500 1750 2000 2250 2500 2750
Generations
Intr
anet
Inte
grat
ion
Cos
t,$ average design cost (TND = 20.0 sec and 4 servers)
best design cost per generation (TND = 20.0 sec and 4 servers)best design overall
Figure 7.13: Optimization curves for the partial animation intranet with TND =20.0 seconds and four servers.
1. The average design cost curve (TND = 20.0 seconds and 4 servers) represents
the average intranet integration cost, including the 3-level network design cost
and the data management system design cost, of the entire intranet design
population for one generation, when TND is equal to 20.0 seconds and the
number of servers is set to four.
2. The best design cost per generation curve (TND = 20.0 seconds and 4 servers)
represents the lowest intranet integration cost, including the 3-level network
design cost and the data management system design cost, of the entire intranet
134

design population for one generation, when TND is equal to 20.0 seconds and
the number of servers is set to four.
3. The best design overall represents the lowest intranet integration cost since the
beginning of the optimization process.
These three curves demonstrate the optimization process. For example, the cost
of the initial best intranet design, when TND is set to 20.0 seconds and number
of servers is set to four, is $361,354.30 where the network architecture cost (NAC)
is equal to $314,354.30 and the data management system cost (DMSC) is equal to
$47,000.00. During 4.5 hours of total run time on a SUN Ultra 10, i -CAD found a
design costing $145,560.13, which is about two and half times lower in cost than the
initial best design. The network architecture cost (NAC) is reduced from $314,354.30
to $125,760.13, which is two and half times lower in cost than the initial best design.
The data management system cost is reduced from $47,000.00 to $19,800.00, which
is more than two times lower in cost than the initial best design.
The di�erent designs that are produced by i -CAD when TND is varied from 60.0
seconds to 20.0 seconds are illustrated in Figures 7.14 and 7.15 respectively. The
relationship between the intranet integration cost and the threshold network delay
(TND) can be shown in Figure 7.16. The six points in the plot represent six intranet
designs with TND set to 10.0, 20.0, 30.0, 40.0, 50.0 and 60.0 seconds respectively.
Details of the designs are found in Appendix A. The intranet integration cost is
reduced by more than seventy �ve thousand dollars, from $206,064.90 to $130,836.79,
when TND increases from 10.0 seconds to 60.0 seconds. Also, this plot illustrates
the interdependent relationship between the data management system design and
the network architecture design, as shown in the dot-circle. The increase in the
total design cost, when the curve moves from TND = 20.0 seconds to TND = 30.0
seconds, is due to the number of servers, their locations within the intranet and
their bindings with the client tasks. At TND = 20.0 seconds, i -CAD created an
135

intranet with four servers which are placed at four group tasks that distribute the
data management tra�c over the entire intranet, as shown in Table 7.9.
136

GT5
audio tasks
GT2
ATM switch45Mbps, 15 ports, $9K
CT11
CT12CT13CT14CT15
ATM switch75Mbps, 15 ports, $11K
CT3
CT2
CT1
CT4
CT5CT6CT7CT8CT10 CT9
live-action tasks
GT1ATM switch
100Mbps, 15 ports, $15K
CT3
CT2
CT1
CT4 CT5 CT6 CT7 CT8 CT10CT9
GT4
CT12
ATM switch100Mbps, 10 ports, $11K
CT11
CT13 CT14 CT15
ATM switch45Mbps, 15 ports, $9K
CT53 CT54 CT55 CT56 CT57
CT51
CT52
IP router100Kpps5 ports
$7K
GT6
background andspecial-effect tasks
IP router100Kpps5 ports
$7K
ST2
hard disk 1IDE
15 GB66 Mbps
10 ms$500
.server 21 CPU
5 ns12 MB1 GB$1000
hard disk 1IDE
30 GB66 Mbps
10 ms$2000
file 2file 8file 9file 1file 6file 4file 5
.server 31 CPU
2 ns64 MB10 GB$4000
GT7
CT58
CT59
CT60
ATM switch100Mbps, 10 ports, $11K
CT61 CT62 CT63 CT64 CT65
file 11file 3file 2file 8file 9file 12file 15file 13file 1file 10file 4file 7
management tasks
ATM switch75Mbps5 ports
$5K
ST3
ATM switch100Mbps
5 ports$7K
ST1
IP router50Kpps5 ports
$3K
ST4
Network hardware component cost = $117,000.00Network interconnection cost = $2000Network wire cost = $936.79Data management system cost = $10,900.00Average network delay = 30.7254 secondsAverage data management performance = 99.55%Network homogeneity factor = 0.6923
hard disk 1SCSI5 GB
160 Mbps5 ms$400
.server 12 CPUs
3 ns32 MB10 GB$3000
file 11file 2file 8file 14file 12file 1file 10file 6file 4file 5
GT3
CT40
Ethernet hub100Mbps, 14 ports, $16K
CT39 CT38 CT37CT36 CT35
CT31
CT32
CT33
CT34
ATM switch75Mbps, 15 ports, $11K
GT8
CT49 CT48 CT47 CT46 CT45
CT41
CT42
CT43
CT50 CT44
Figure 7.14: A partial animation studio intranet with TND = 60.0 seconds and fourservers.
137

IP router100Kpps5 ports
$7K
GT6
IP router50Kpps5 ports
$3K
ST4
background andspecial-effect tasks
GT5IP router100Kpps5 ports
$7K
ST2
audio tasks
GT2
ATM switch45Mbps, 15 ports, $9K
CT11
CT12CT13CT14CT15
ATM switch75Mbps, 15 ports, $11K
CT3
CT2
CT1
CT4
CT5CT6CT7CT8CT10 CT9
hard disk 1IDE
50 GB66 Mbps
10 ms$7000
.server 31 CPU
4 ns64 MB10 GB$3000
hard disk 1IDE
10 GB66 Mbps
10 ms$300
file 11file 3file 2file 14file 15file 13file 1file 6file 4file 7 .
server 42 CPUs
3 ns32 MB10 GB$3000
GT7
CT58
CT59
CT60
ATM switch75Mbps, 20 ports, $16K
CT61 CT62 CT63 CT64 CT65
file 11file 3file 2file 14file 9file 12file 13file 1file 6file 5file 7
ATM switch45Mbps, 10 ports, $6K
CT53 CT54 CT55 CT56 CT57
CT51
CT52
management tasks
IP router100Kpps5 ports
$7K
GT3
CT40
Ethernet hub100Mbps, 12 ports, $13K
CT39 CT38 CT37CT36 CT35
CT31
CT32
CT33
CT34
Ethernet hub100Mbps, 14 ports, $16K
GT8
CT49 CT48 CT47 CT46 CT45
CT41
CT42
CT43
CT50 CT44
ST3
hard disk 1IDE
30 GB66 Mbps
10 ms$2000
.server 21 CPU
5 ns12 MB1 GB$1000
file 11file 3file 2file 8file 9file 12file 13file 1file 10file 5file 7
IP router100Kpps5 ports
$7K
ST1
hard disk 1SCSI
20 GB160 Mbps
5 ms$2000
.server 11 CPU
4 ns12 MB3 GB$1500
file 11file 3file 2file 14file 12file 6file 4file 5
GT4Ethernet Hub
100Mbps, 6 ports, $8K
CT11
CT12 CT13 CT14 CT15
live-action tasks GT1
ATM switch75Mbps, 15 ports, $11K
CT3
CT2
CT1
CT4 CT5 CT6 CT7 CT8 CT10CT9
Network hardware component cost = $121,000.00Network interconnection cost = $0Network wire cost = $4,760.13Data management system cost = $19,800.00Average network delay = 13.7428 secondsAverage data management performance = 99.85%Network homogeneity factor = 0.384615
Figure 7.15: A partial animation studio intranet with TND = 20.0 seconds and fourservers.
138

5000150002500035000450005500065000750008500095000
105000115000125000135000145000155000165000175000185000195000205000
5 10 15 20 25 30 35 40 45 50 55 60 65
Threshold Network Delay, seconds
Des
ign
Co
st,
$ network design costdata management system costintranet integration cost
Figure 7.16: Intranet design cost versus delay.
Table 7.9: Data management system with TND = 20.0 seconds.
Server Server Group TotalIdenti�cation Location Binding Requests
1 group task 1 1 384 52 30
2 group task 3 3 483 group task 6 6 584 group task 7 7 90
5 208 212
This table shows the locations of all allocated servers (column 2) and also it
shows the binding between the group tasks and placed servers (column 3). The last
column shows the number of requests by each group task. Both group tasks 7 and
8 perform the most �le requests to a �le server (total of 291 requests per hour out
of 501 requests listed the entire data request table); however, these two group tasks
7 and 8 are bound to the powerful server. This server has two CPUs with a clock
139

cycle is equal to 3 nanoseconds per CPU and a total of 20 gigabytes of hard disk
storage capacity.
On the other hand, at TND = 30.0 seconds, i -CAD produced an intranet with
three servers even though four servers are requested at the beginning of the run
time. This is a normal operation of i -CAD, to drop or add more servers during the
optimization process than the user requested. Table 7.10 shows the placement and
binding information of the three servers with the eight group task. This intranet has
three placed servers in contrast to the other intranets that each intranet has four
placed servers. In addition, the unbalanced group-server binding within the �rst
server leads to an expensive intranet integration design cost.
Table 7.10: Data management system with TND = 30.0 seconds.
Server Server Group TotalIdenti�cation Location Binding Requests
1 group task 4 4 51 382 306 587 90
2 group task 5 5 208 212
3 group task 3 3 48
7.3.2 Experiment 4: Partial Animation Studio with Wide
Backbone Topology
In this experiment we present the results of designing optimized intranet infrastruc-
tures, where all four sites are located in Southern California, USA as depicted in
Figure 7.6. Thus, the backbone network is a wide tree topology. The goal is to
integrate a data management system and a three-level network architecture so that
all 65 client tasks perform their tasks in order and within a delay bound. We ran
140

i -CAD with several threshold network delays (TND) ranging from ten seconds to
one minute. In addition, we used the following parameters: population size (PS)
= 250, number of generations (NG) = 3000, mutation rate (MR) = 0.05, crossover
rate (CR) = 0.80, initial number of servers = 3, and threshold data management
performance (TDMP) = 0.30.
The optimization process of a complete intranet integration is illustrated in two
examples, as shown in Figures 7.17 and 7.18. The �rst example illustrates the
optimization process of the animation intranet design problem with a wide backbone
tree topology, when TND is set to 50.0 seconds and the number of servers is set to
three. The three curves in Figure 7.17 represent the following:
200000250000300000350000400000450000500000550000600000650000700000750000800000850000900000950000
10000001050000110000011500001200000125000013000001350000140000014500001500000
0 250 500 750 1000 1250 1500 1750 2000 2250 2500 2750
Generations
Intr
anet
Inte
grat
ion
Cos
t,$
average intranet integration cost (TND = 50.0 sec and 3 servers)
best intranet integration cost per generation (TND = 50.0 sec and 3 servers)
best design overall
Figure 7.17: Optimization curves for the partial animation intranet with TND =50.0 seconds and three servers.
1. The average design cost curve (TND = 50.0 seconds and 3 servers) represents
the average intranet integration cost, including the 3-level network design cost
and the data management system design cost, of the entire intranet design
population for one generation (including a 1-month lease for a tree topology
141

connecting the four sites), when TND is equal to 50.0 seconds and the number
of servers is set to three.
2. The best design cost per generation curve (TND = 50.0 seconds and 3 servers)
represents the lowest intranet integration cost, including the 3-level network
design cost and the data management system design cost (including a 1-month
lease for a tree topology connecting the four sites), of the entire intranet design
population for one generation, when TND is equal to 50.0 seconds and the
number of servers is set to three.
3. The best design overall represents the lowest intranet integration cost since the
beginning of the optimization process.
These three curves, in Figure 7.17, demonstrate the optimization process. For ex-
ample, the cost of the initial best intranet design, when TND is set to 50.0 seconds
and number of servers is set to three, is $546,190.70 where the network architec-
ture cost (NAC), including a 1-month lease for three backbone links, is equal to
$489,190.70 and the data management system cost (DMSC) is equal to $57,000.00.
During 6 hours of total run time on a SUN Ultra 10, i -CAD found a design costing
$322,091.70, which is less than the initial best intranet design by $224,099.00 (41%).
The network architecture cost (NAC), including a 1-month lease for three backbone
links, is reduced from $489,190.70 to $279,591.70, which is about 43% reduction
in cost from the initial best network design. The data management system cost is
reduced from $57,000.00 to $42,500.00, which is about 25% reduction in cost from
the initial best data management system design. The second example illustrates the
optimization process of an animation intranet design problem with a wide backbone
tree topology, when TND is set to 10.0 seconds and the number of servers is set to
three. The three curves in Figure 7.18 represent the following:
1. The average design cost curve (TND = 10.0 seconds and 3 servers) represents
the average intranet integration cost, including the 3-level network design cost
142

250000300000350000400000450000500000550000600000650000700000750000800000850000900000950000
1000000105000011000001150000120000012500001300000135000014000001450000150000015500001600000165000017000001750000
0 250 500 750 1000 1250 1500 1750 2000 2250 2500 2750
Generations
Intr
anet
Inte
grat
ion
Cos
t,$
average intranet integration cost (TND = 10.0 sec and 3 servers)
best intranet integration cost per generation (TND = 10.0 sec and 3 servers)
best design overall
Figure 7.18: Optimization curves for the partial animation intranet with TND =10.0 seconds and three servers.
and the data management system design cost, of the entire intranet design
population for one generation (including a 1-month lease for a tree topology
connecting the four sites) , when TND is equal to 10.0 seconds and the number
of servers is set to three.
2. The best design cost per generation curve (TND = 10.0 seconds and 3 servers)
represents the lowest intranet integration cost, including the 3-level network
design cost and the data management system design cost, of the entire intranet
design population for one generation (including a 1-month lease for a tree
topology connecting the four sites), when TND is equal to 10.0 seconds and
the number of servers is set to three.
3. The best design overall represents the lowest intranet integration cost since the
beginning of the optimization process.
These three curves, in Figure 7.18, demonstrate the optimization process. For ex-
ample, the cost of the initial best intranet design, when TND is set to 10.0 seconds
143

and number of servers is set to three, is $776,835.90 where the network architec-
ture cost (NAC), including a 1-month lease for three backbone links, is equal to
$724,835.90 and the data management system cost (DMSC) is equal to $75,500.00.
During 6 hours of total run time on a SUN Ultra 10, i -CAD found a design costing
$464,076.70, which is less than the initial best intranet design by $312,759.20 (40%).
The network architecture cost (NAC), including a 1-month lease for three backbone
links, is reduced from $724,835.90 to $388,576.70, which is about 46% reduction
in cost from the initial best network design. The data management system cost is
reduced from $75,500.00 to $52,000.00, which is about 31% reduction in cost from
the initial best data management system design.
The di�erent designs that are produced by i -CAD when TND is varied from 50.0
seconds to 10.0 seconds are illustrated in Figures 7.19 and 7.20 respectively. Details
of the designs are found in Appendix A.
144

Network hardware component cost = $230,000.00Network interconnection cost = $0Network wire cost = $10591.70Monthly network cost = $39,000.00Data management system cost = $42,500.00Average network delay = 21.79264 secondsAverage data management performance = 99.83%Network homogeneity factor = 0.2667
IP router50Kpps5 ports
$3K
ST1
live-action tasks
GT1ATM switch
150Mbps, 15 ports, $20K
CT3
CT2
CT1
CT4 CT5 CT6 CT7 CT8 CT10CT9
GT4
CT12
Ethernet Hub1Gbps, 6 ports, $13K
CT11
CT13 CT14 CT15
audio tasks
GT2Ethernet Hub
100Mbps, 12 ports, $13K
CT11
CT12CT13CT14CT15
IP router100Kpps10 ports
$11K
ST2 hard disk 1IDE
60 GB66 Mbps
10 ms$8000
.server 14 CPUs
2 ns512 MB30 GB$20K
file 11file 3file 2file 8file 14file 9file 12file 15file 13file 1file 10
file 6file 5file 7
GT5
CT10
ATM switch75Mbps, 20 ports, $16K
CT3
CT2
CT1
CT4CT5CT6CT7CT8CT9
ATM switch100Mbps, 10 ports, $11K
CT53 CT54 CT55 CT56 CT57
CT51
CT52
GT6
background andspecial-effect tasks
hard disk 1IDE
30 GB66 Mbps
10 ms$2000 .
server 32 CPUs2.5 ns
128 MB30 GB$7.5K
GT7
CT58
CT59
CT60
ATM switch45Mbps, 15 ports, $9K
CT61 CT62 CT63 CT64 CT65
IP router100Kpps10 ports
$11K
ST4
file 6file 4file 5
file 3file 2file 8file 9file 12file 15file 1
hard disk 1IDE
15 GB66 Mbps
10 ms$500
.server 22 CPUs
3 ns32 MB10 GB$3000
IP router100Kpps5 ports
$7K
ST3
GT3
CT40
Ethernet hub100Mbps, 12 ports, $13K
CT39 CT38 CT37CT36 CT35
CT31
CT32
CT33
CT34
management tasks
Ethernet hub100Mbps, 12 ports, $13KGT8
CT49 CT48 CT47 CT46 CT45
CT41
CT42
CT43
CT50 CT44
file 11file 8file 14file 9file 12file 13file 1
file 10file 4file 5
link 2T-carrier
(DS4)264.24MbpsIC = $30K
MC = $13K
link 1T-carrier
(DS4)264.24MbpsIC = $30K
MC = $13K
link 3T-carrier
(DS4)264.24MbpsIC = $30K
MC = $13K
Figure 7.19: A partial animation studio intranet with TND = 50.0 seconds and threeservers.
145

Network hardware component cost = $315,500.00Network interconnection cost = $22000.00Network wire cost = $10326.70Monthly network cost = $40,750.00Data management system cost = $75,500.00Average network delay = 8.70592 secondsAverage data management performance = 99.82%Network homogeneity factor = 0.5333
IP router300Kpps5 ports$25K
ST1
live-action tasks
GT1
audio tasks
GT2ATM switch
75Mbps, 15 ports, $11K
CT11
CT12CT13CT14CT15
IP router100Kpps5 ports
$7K
ST2 hard disk 1SCSI
80 GB160 Mbps
5 ms$20000
.server 22 CPUs
3 ns32 MB10 GB$3K
file 11file 14file 9file 12file 15file 1file 10file 6
file 4file 5file 7
GT5
CT10
ATM switch100Mbps, 20 ports, $18K
CT3
CT2
CT1
CT4CT5CT6CT7CT8CT9
GT6
background andspecial-effect tasks
hard disk 1IDE
80 GB66 Mbps
10 ms$10K
.server 41 CPU
5 ns32 MB5 GB$2K
GT7 ATM switch200Mbps
5 ports$15K
ST4
CT58
CT59
CT60
Ethernet hub100Mbps, 14 ports, $16K
CT61 CT62 CT63 CT64 CT65
file 13file 10file 6file 5file 7
file 11file 3file 2file 14file 9file 12file 15
hard disk 1IDE
20 GB66 Mbps
10 ms$1500
.server 34 CPUs
1 ns1GB
50 GB$35K
file 3file 2file 8file 12file 9file 13file 1
file 10file 4file 5file 7
link 3SONET(OC74)
362.88MbpsIC = $70K
MC = $21K
link 1T-carrier
(DS4)264.24MbpsIC = $30K
MC = $13K
link 2VPN
(shared OC9)116.64MbpsIC = $22.5K
MC = $6.75K
.server 11 CPU
5 ns32 MB5 GB$2K
hard disk 1IDE
30 GB66 Mbps
10 ms$2000
file 15file 13file 6file 5file 7
file 11file 3file 2file 8file 14file 9file 12
Ethernet hub100Mbps, 18 ports, $22K
CT3
CT2
CT1
CT4 CT5 CT6 CT7 CT8 CT10CT9
GT4
CT12
ATM switch150Mbps, 15 ports, $20K
CT11
CT13 CT14 CT15
ATM switch100Kpps15 ports
$15K
ST3
ATM switch150Mbps, 10 ports, $15K
CT53 CT54 CT55 CT56 CT57
CT51
CT52
GT3
CT40
ATM switch100Mbps, 20 ports, $18K
CT39 CT38 CT37CT36 CT35
CT31
CT32
CT33
CT34
management tasks
ATM switch75Mbps, 15 ports, $11KGT8
CT49 CT48 CT47 CT46 CT45
CT41
CT42
CT43
CT50 CT44
Figure 7.20: A partial animation studio intranet with TND = 10.0 seconds and threeservers.
146

The relationship between the intranet integration cost and the threshold network
delay (TND) can be shown in Figure 7.21. The six points in the plot represent
six intranet designs with TND set to 10.0, 20.0, 30.0, 40.0, 50.0 and 60.0 seconds
respectively. The intranet integration cost is reduced by more than eighty two
thousand dollars (18%), from $464,076.70 to $381,598.09, when TND increases from
10.0 seconds to 60.0 seconds. The dot-circle indicates an inferior design.
5000
55000
105000
155000
205000
255000
305000
355000
405000
455000
505000
5 10 15 20 25 30 35 40 45 50 55 60 65
Threshold Network Delay, seconds
Intr
anet
Inte
gra
tion
Co
st,
$ network costdata management system costintranet integration cost
Figure 7.21: Intranet design cost versus threshold network delay.
7.4 Complete Intranet Integration for A Full
Animation Studio
In this section we present the results of two experiments that involve synthesizing a
full animation studio. The full animation studio consists of six site tasks, 14 group
tasks and 150 client tasks as shown in Figure 2.1. The goal here is to design a data
management system and a three-level network architecture that can enable all 150
client tasks (performed on 150 workstations) to perform their tasks while satisfying
147

all design and performance constraints. Table 7.11 provides detailed information
about the new clients and groups.
Table 7.11: Client and group clustering information.
Site Group ClientTask Task Task(ST) (GT) (CT)
9 66-755 10 76-85
12 86-10511 106-120
6 13 121-13514 136-150
The clustering information regarding the �rst 65 client tasks is the same as in
Table 7.1, while the additional 85 client tasks are divided into two site tasks (5
and 6). Site tasks 5 and 6 perform one of the essential part of the animation �lm
production, which is involved creating, joining and editing the animated characters
within the skeleton shots. The tra�c ow among site task 3, 5, and 6 and group
tasks 3, and 8-14 is presented in Table 7.12. The management task (site task 3)
provides all the data regarding the skeleton shots for the drawing and editing tasks
(site tasks 5 and 6). The tra�c ow within the backbone task of the full animation
studio can be summarized by one parameter (backbone local tra�c, BLOT) or site
tra�c matrix (STM) depending on which topology is used. For a local star topology,
the backbone local tra�c (BLOT) represents all the tra�c ow between all six sites.
For our example, BLOT is equal to 209.575 Mbps. For a wide tree topology, a site-
to-site tra�c ow is needed to determine each link's capacity. Table 7.13 shows a
possible site tra�c matrix (STM). The site tra�c matrix is not symmetric and is
based on the data ow within the task ow graph.
The input information regarding the data management system is given by both
Tables 7.7 and 7.14. The second data request table (shown in Table 7.14) includes
148

Table 7.12: Tra�c ow assignment for experiments 5 and 6.
Local Outgoing IncomingTask Tra�c Tra�c Tra�c
(Mbps) (Mbps) (Mbps)
site task 3 0.0 95.0 33.75site task 5 21.0 18.95 57.5site task 6 100.565 17.5 58.95group task 3 9.0 15.0 7.5group task 8 9.0 80.0 26.25group task 9 1.98 25.0 20.0group task 10 18.0 6.99 20.0group task 11 4.95 31.375 43.445group task 12 40.5 7.95 38.5group task 13 47.31 86.69 43.875group task 14 7.94 0.0 72.195
all the �les that are requested by the additional 85 client tasks. These two tables
present a possible pattern of requests by the 150 client tasks that execute 975 �le
retrieval requests during the duration period (DP) of one hour (an average of 6.5
requests per a client task). The tra�c generated from requesting and retrieving all
�les is listed in Tables 7.8 and 7.15. These tables show the data management tra�c
ow at a group task (column 1) when the client tasks within the group are requesting
�le retrieval from a server. Otherwise, there is no data management tra�c ow at
Table 7.13: A site tra�c matrix (STM) for the full animation studio.
site site site site site sitetask 1 task 2 task 3 task 4 task 5 task 6
site task 1 0.0 16.25 18.75 20.625 0.0 0.0site task 2 0.0 0.0 7.5 7.5 0.0 0.0site task 3 2.5 5.0 0.0 7.5 40.0 40.0site task 4 0.0 0.0 7.5 0.0 0.0 0.0site task 5 0.0 0.0 0.0 0.0 0.0 18.95site task 6 0.0 0.0 0.0 0.0 17.5 0.0
149
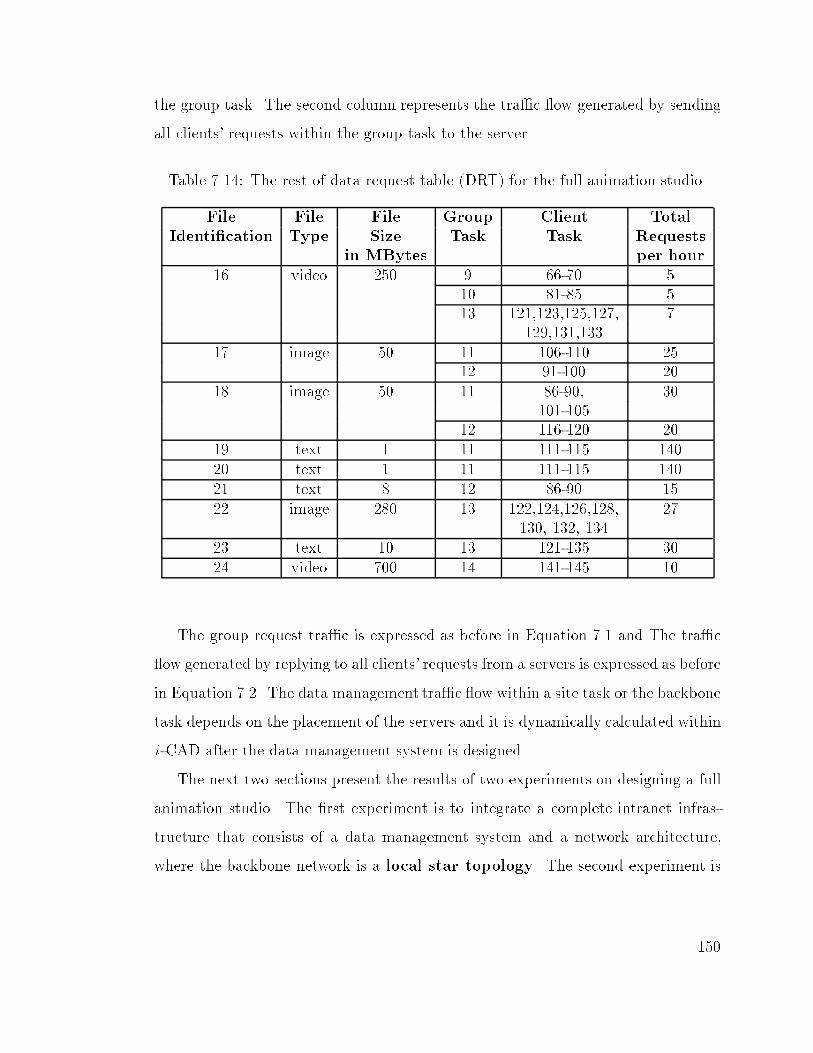
the group task. The second column represents the tra�c ow generated by sending
all clients' requests within the group task to the server.
Table 7.14: The rest of data request table (DRT) for the full animation studio.
File File File Group Client TotalIdenti�cation Type Size Task Task Requests
in MBytes per hour
16 video 250 9 66-70 510 81-85 513 121,123,125,127, 7
129,131,13317 image 50 11 106-110 25
12 91-100 2018 image 50 11 86-90, 30
101-10512 116-120 20
19 text 1 11 111-115 14020 text 1 11 111-115 14021 text 8 12 86-90 1522 image 280 13 122,124,126,128, 27
130, 132, 13423 text 10 13 121-135 3024 video 700 14 141-145 10
The group request tra�c is expressed as before in Equation 7.1 and The tra�c
ow generated by replying to all clients' requests from a servers is expressed as before
in Equation 7.2. The data management tra�c ow within a site task or the backbone
task depends on the placement of the servers and it is dynamically calculated within
i -CAD after the data management system is designed.
The next two sections present the results of two experiments on designing a full
animation studio. The �rst experiment is to integrate a complete intranet infras-
tructure that consists of a data management system and a network architecture,
where the backbone network is a local star topology. The second experiment is
150

Table 7.15: Data management tra�c ow within group tasks 9 to 14.
Group Request ReplyTask Tra�c Tra�c(GT) (in bps) (in bps)
9 0.711 2.913x10⁶
10 0.711 2.913x10⁶
11 46.222 5.895x10⁶
12 9.244 6.105x10⁶
13 9.102 22.393x10⁶
14 1.422 16.311x10⁶
to integrate a complete intranet infrastructure that also consists of a data manage-
ment system and a network architecture, but the backbone network is a wide tree
topology.
7.4.1 Experiment 5: Full Animation Studio with Local
Backbone Topology
In this experiment we present the results of designing optimized intranet infrastruc-
tures, where all six sites are located within a studio lot. Thus, the backbone network
is a local star topology. The goal is to integrate a data management system and
a three-level network architecture so that all 150 client tasks perform their tasks
in order and within a delay bound. We ran i -CAD with several threshold network
delays (TND) ranging from 30 seconds to three minute. In addition, we used the
following parameters: population size (PS) = 250, number of generations (NG) =
5000, mutation rate (MR) = 0.05, crossover rate (CR) = 0.80, initial number of
servers = 5, and threshold data management performance (TDMP) = 0.30.
The optimization process of a complete intranet integration is illustrated in two
examples as shown in Figures 7.22 and 7.23 respectively. The �rst example illustrates
the optimization process of a full animation intranet design problem, when TND is
151

set to 180.0 seconds and the number of servers is set to �ve by i -CAD's user. The
300000340000380000420000460000500000540000580000620000660000700000740000780000820000860000900000940000980000
102000010600001100000
0 500 1000 1500 2000 2500 3000 3500 4000 4500
Generations
Intra
netI
nteg
ratio
nC
ost,
$average intranet integration cost (TND = 180 sec and 5 servers)
best intranet integration cost per generation (TND = 180.0 sec and 5 servers)
best design overall
Figure 7.22: Optimization curves for the full animation intranet with TND = 180.0seconds and �ve servers.
three curves in Figure 7.22 represent the following:
1. The average design cost curve (TND = 180.0 sec and 5 servers) represents
the average intranet integration cost, including the 3-level network design cost
and the data management system design cost, of the entire intranet design
population for one generation, where TND is equal to 180.0 seconds and the
number of servers is set to �ve.
2. The best design cost per generation curve (TND = 180.0 sec and 5 servers)
represents the lowest intranet integration cost, including the 3-level network
design cost and the data management system design cost, of the entire intranet
design population for one generation, where TND is equal to 180.0 seconds and
the number of servers is set to �ve.
3. The best design overall represents the lowest intranet integration cost since the
beginning of the optimization process.
152

These three curves demonstrate the optimization process. For example, the
cost of the initial best intranet design, when TND is equal to 180.0 seconds and
number of servers is set to �ve, is $1,177,823.40, where the network architecture
cost (NAC) is set to $1,103,323.40 and the data management system cost (DMSC)
is equal to $74,500.00. During 4 days of total run time on a shared (heavy loaded)
SUN Enterprise server E4500/E5500, i -CAD found a design costing $406,557.94,
which is about three times lower in cost than the initial best design. The network
architecture cost (NAC) is reduced from $1,103,323.40 to $373,557.94, which is about
three times lower in cost than the initial best design. The data management system
cost is reduced from $74,500.00 to $33,000.00, which is more than two times lower
in cost than the initial best design. The second example illustrates the optimization
process of an animation intranet design problem with a local backbone star topology,
when TND is set to 30.0 seconds and the number of servers is set to �ve.
300000340000380000420000460000500000540000580000620000660000700000740000780000820000860000900000940000980000
102000010600001100000
0 500 1000 1500 2000 2500 3000 3500 4000 4500
Generations
Intr
anet
Inte
grat
ion
Cos
t,$
average intranet integration cost (TND = 30 sec and 5 servers)best intranet integration cost per generation (TND = 30.0 sec and 5 servers)
best design overall
Figure 7.23: Optimization curves for the partial animation intranet with TND =20.0 seconds and four servers.
The three curves in Figure 7.23 represent the following:
153

1. The average design cost curve (TND = 30.0 sec and 5 servers) represents
the average intranet integration cost, including the 3-level network design cost
and the data management system design cost, of the entire intranet design
population for one generation, where TND is equal to 30.0 seconds and the
number of servers is set to �ve.
2. The best design cost per generation curve (TND = 30.0 sec and 5 servers)
represents the lowest intranet integration cost, including the 3-level network
design cost and the data management system design cost, of the entire intranet
design population for one generation, where TND is equal to 30.0 seconds and
the number of servers is set to �ve.
3. The best design overall represents the lowest intranet integration cost since the
beginning of the optimization process.
These three curves demonstrate the optimization process. For example, the cost
of the initial best intranet design, when TND is set to 20.0 seconds and number
of servers is set to �ve, is $981,829.40 where the network architecture cost (NAC)
is equal to $900,829.40 and the data management system cost (DMSC) is equal
to $81,000.00. During 4 days of total run time on a shared (heavy loaded) SUN
Enterprise server E4500/E5500, i -CAD found a design costing $477,059.10, which is
about two times lower in cost than the initial best design. The network architecture
cost (NAC) is reduced from $900,829.40 to $438,059.10, which is about two times
lower in cost than the initial best design. The data management system cost is
reduced from $81,000.00 to $39,800.00, which is more than two times lower in cost
than the initial best design. The di�erent designs that are created by i -CAD when
TND ranges from 180.0 seconds to 30.0 seconds are found in Appendix A.
154

7.4.2 Experiment 6: Full Animation Studio with Wide
Backbone Topology
In this experiment we present the results of designing a full animation intranet,
where all six sites are located in Southern California, United States. The �rst site
task (live-action) is located in Burbank, the second site task (audio) is located in
Pasadena, the third site task (management) is located in Hollywood, the fourth
site task (background and special-e�ect) is located in Santa Monica, the �fth task
(drawing) is located in Anaheim and the sixth task (joining and editing) is located
in Malibu. Figure 7.24 depicts a map of the Los Angeles basin and distance chart
between the six sites in miles.
Malibu
Santa Monica
AnaheimPacificOcean
Hollywood
Burbank
Pasadena
LongBeach
Marina del ReyLAX Airport
Los Angeles Mapnot on scale
Pasadenasite 2
Santa Monicasite 4
Burbanksite 1
Hollywoodsite 3
Burbanksite 1
Pasadenasite 2
Hollywoodsite 3
Santa Monicasite 4
0.0
0.0
0.0
0.0
10.0 8.0 18.0
8.0
18.0
10.0 12.0 22.0
10.012.0
22.0 10.0
Distance chart between the six sites in miles.
Anaheimsite 5
Anaheimsite 5
Malibusite 6
Malibusite 6
33.0
23.0
23.0
27.0
35.0
15.0
35.0
5.0
0.0
0.0
33.0
23.0
35.0
35.0
40.0
40.0
23.0
27.0
15.0
5.0
Figure 7.24: Locations of the six site tasks within the City of Los Angeles, California,USA.
The objective is to synthesize a data management system and a 3-level network,
where the backbone network is constrained to a tree topology that must allow all site
tasks to communicate with each other according to the site tra�c matrix (as shown
in Table 7.13) while satisfying some design and performance requirements. We ran
i -CAD with two threshold network delays (TND) equal to 60 and 30 seconds. In
addition, we used the following parameters: population size (PS) = 250, number of
155
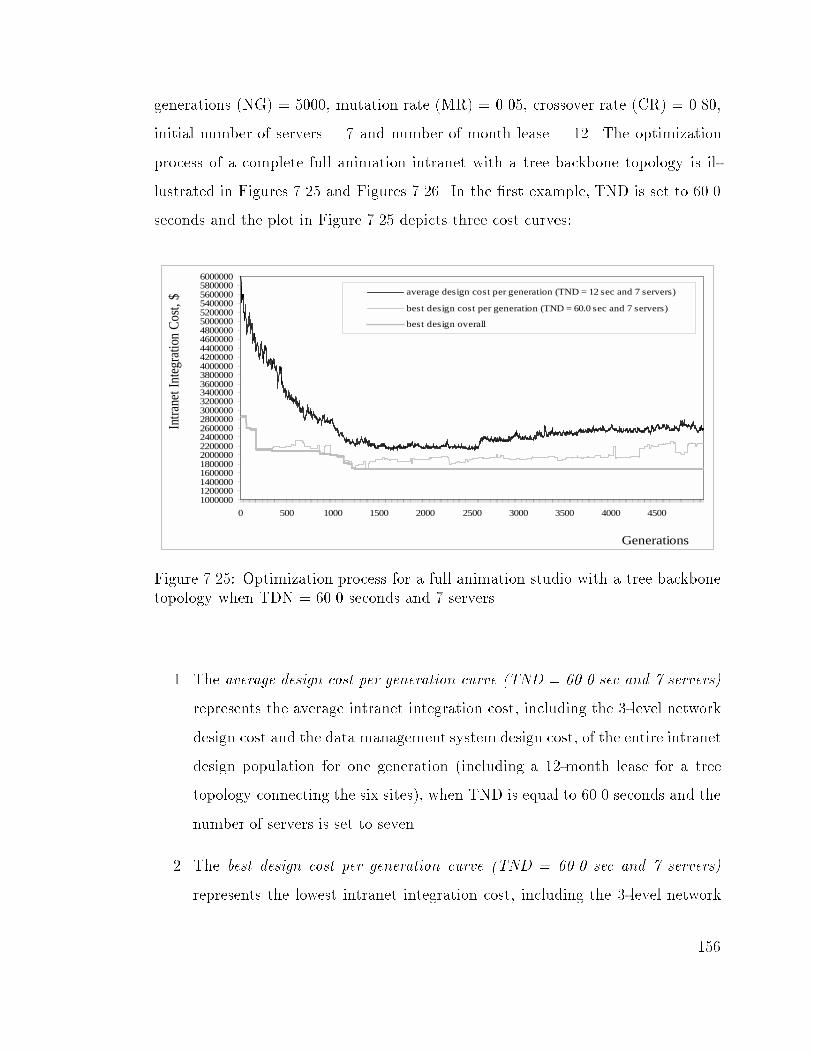
generations (NG) = 5000, mutation rate (MR) = 0.05, crossover rate (CR) = 0.80,
initial number of servers = 7 and number of month lease = 12. The optimization
process of a complete full animation intranet with a tree backbone topology is il-
lustrated in Figures 7.25 and Figures 7.26. In the �rst example, TND is set to 60.0
seconds and the plot in Figure 7.25 depicts three cost curves:
10000001200000140000016000001800000200000022000002400000260000028000003000000320000034000003600000380000040000004200000440000046000004800000500000052000005400000560000058000006000000
0 500 1000 1500 2000 2500 3000 3500 4000 4500
Generations
Intra
netI
nteg
ratio
nC
ost,
$ average design cost per generation (TND = 12 sec and 7 servers)
best design cost per generation (TND = 60.0 sec and 7 servers)
best design overall
Figure 7.25: Optimization process for a full animation studio with a tree backbonetopology when TDN = 60.0 seconds and 7 servers.
1. The average design cost per generation curve (TND = 60.0 sec and 7 servers)
represents the average intranet integration cost, including the 3-level network
design cost and the data management system design cost, of the entire intranet
design population for one generation (including a 12-month lease for a tree
topology connecting the six sites), when TND is equal to 60.0 seconds and the
number of servers is set to seven.
2. The best design cost per generation curve (TND = 60.0 sec and 7 servers)
represents the lowest intranet integration cost, including the 3-level network
156

design cost and the data management system design cost, of the entire intranet
design population for one generation (including a 12-month lease for a tree
topology connecting the six sites), when TND is equal to 60.0 seconds and the
number of servers is set to seven.
3. The best design overall represents the lowest intranet integration cost since the
beginning of the optimization process.
These three curves demonstrate the optimization process. For example, the cost
of the initial best intranet design, when TND is equal to 60.0 seconds and number of
servers is set to seven, is $2,872,621.10 where the network architecture cost (NAC)
is set to $2,730,121.10 (including $1,263,000.00 for 12-month lease) and the data
management system cost (DMSC) is equal to $142,500.00. During 1 day of total run
time on a shared (light load) SUN Enterprise server E4500/E5500, i -CAD found a
design costing $1,695,255.00, which is about 1.7 times lower in cost than the initial
best design. The network architecture cost (NAC) is reduced from $2,730,121.10 to
$1,617,255.00, which is about 1.7 times lower in cost than the initial best design.
The data management system cost is reduced from $142,500.00 to $78,000.00, which
is more than 1.8 times lower in cost than the initial best design. This design can be
found in Appendix A. In the second example, TND is set to 30.0 seconds and the
plot in Figure 7.26 depicts three cost curves:
1. The average design cost per generation curve (TND = 30.0 sec and 7 servers)
represents the average intranet integration cost, including the 3-level network
design cost and the data management system design cost, of the entire intranet
design population for one generation (including a 12-month lease for a tree
topology connecting the six sites), when TND is equal to 30.0 seconds and the
number of servers is set to seven.
2. The best design cost per generation curve (TND = 30.0 sec and 7 servers)
represents the lowest intranet integration cost, including the 3-level network
157

100000012000001400000160000018000002000000220000024000002600000280000030000003200000340000036000003800000400000042000004400000460000048000005000000520000054000005600000580000060000006200000640000066000006800000
0 500 1000 1500 2000 2500 3000 3500 4000 4500
Generations
Intra
netI
nteg
ratio
nC
ost,
$
average design cost per generation (TND = 30.0 sec and 7 servers)
best design cost per generation (TND = 30.0 sec and 7 servers)
best overall design
Figure 7.26: Optimization process for a full animation studio with a tree backbonetopology when TDN = 30.0 seconds and 7 servers.
design cost and the data management system design cost, of the entire intranet
design population for one generation (including a 12-month lease for a tree
topology connecting the six sites), when TND is equal to 30.0 seconds and the
number of servers is set to seven.
3. The best design overall represents the lowest intranet integration cost since the
beginning of the optimization process.
These three curves demonstrate the optimization process. For example, the cost
of the initial best intranet design, when TND is equal to 30.0 seconds and number of
servers is set to seven, is $4,060,828.80 where the network architecture cost (NAC)
is set to $3,968,828.80 (including $1,485,000.00 for 12-month lease) and the data
management system cost (DMSC) is equal to $92,000.00. During 1 day of total run
time on a shared (light load) SUN Enterprise server E4500/E5500, i -CAD found a
design costing $2,016,950.80, which is about two times lower in cost than the initial
best design. The network architecture cost (NAC) is reduced from $3,968,828.80 to
158

$1,875,950.80, which is more than two times lower in cost than the initial best design.
The data management system cost is increased from $92,000.00 to $141,000.00. This
design can be found in Appendix A.
159

Chapter 8
Conclusions and Future Work
8.1 Conclusion
We consider the design problem of an intranet integration infrastructure to min-
imize its hardware installation cost while satisfying the design and performance
requirements. In the past half decade, there has been a rapid expansion in the use
of networks, particularly intranets, to provide hardware platforms to communicate
and share data among distributed multimedia applications, such as the animation
production studio. We de�ned the intranet integration problem as a combination
of two interdependent sub-problems: data management system design and network
architecture design. We proposed and implemented an automated capacity planning
tool, i -CAD, that attempts to optimize the intranet design cost while satisfying both
design and performance constraints, but does not guarantee optimality.
An introduction to our intranet model and a description of our example, an an-
imation production studio, were described in Chapter 2. The intranet integration
problem is an interdisciplinary problem involving research in the �elds of network
synthesis, design automation and multimedia systems. Chapter 3 reviewed rele-
vant related research in early and modern network synthesis and analysis, design
automation tools and techniques, and multimedia systems.
160

The mathematical programming notation was used to formulate the combined
optimization problem. Chapter 4 presented a comprehensive mathematical formula-
tion of the intranet design problem. The formulation includes a large set of network
and data management design constraints and an objective function representing the
total intranet integration cost. An analytical performance model for evaluating the
integrated 3-level network architecture for satisfying a given threshold delay is de-
scribed in Chapter 5. Also, we described a Monte Carlo simulation for evaluating the
data management system to determine how many clients' requests can be satis�ed
within a given threshold duration period.
The implementation of an intranet computer-aided design tool, i -CAD, was de-
scribed in Chapter 6. i -CAD is a software tool that used a suite of techniques
to automatically design and integrate data management systems and network ar-
chitectures. A genetic algorithm used by i -CAD for selecting and integrating the
optimized set of network and data management components that minimize the total
intranet integration cost, while satisfying the design and performance constraints,
was described.
The results of six experiments were presented in Chapter 7. These six experi-
ments consist of various animation studio problems ranging from four sites, eight
groups and 65 clients to six sites, 14 groups and 150 clients. The results showed that
the automatic synthesis and integration of data management systems and network
architectures are feasible and the run-time of i -CAD is in the range of a few minutes
to a few days depending on the size of the problem. During the run-time, i -CAD
was able to improve the intranet integration cost 39.20% to 76.25% from the initial
best intranet cost.
161

8.2 Contributions
The key contributions, which resulted from research on design automation, dis-
tributed systems, network synthesis and multimedia applications, are organized in
the next two sections.
8.2.1 Thesis Contributions
The research described here includes the following contributions:
1. A new direction for design automation was explored by focusing on the design
of large systems that involve both data management and network architecture.
This new direction moves system-level synthesis from designing a system that
consists of processors, memory and input/output, which all are integrated into
a single multiprocessor; into a system that consists of many geographically-
distributed network nodes (clients and servers), which need a communication
network and a database system in order to perform a number of cooperative
periodic tasks.
2. The de�nition and solution of the intranet integration problem as a combina-
tion of two interdependent sub-problems, data management system design and
network design, is introduced for the �rst time, and has not been reported in
the research literature, to our knowledge. The intranet integration problem is
a multidisciplinary problem and it is a complicated combinatorial optimization
problem.
3. An intranet application is modeled as a hierarchy of three tasks. The backbone
task refers to the entire intranet application. The backbone task consists of
a number of subtasks performed at physical sites, each of which is referred to
as a site task. A site task consists of a number of distinct group tasks, where
each group task comprises a number of distinct client tasks (performed on
162

workstations). In order to perform all the collaborative group and site tasks
within an acceptable time, clients must communicate and share data among
themselves.
4. A comprehensive mathematical formulation of the intranet integration prob-
lem was developed as an optimization problem. This optimization problem
includes a large set of network and data management design constraints and
an objective function representing the total intranet integration cost.
5. Quick performance techniques to evaluate both the three-level network infras-
tructure and the data management system are embedded within the optimiza-
tion problem. These quick performance techniques are used to increase the
likelihood that the intranet integration solutions can satisfy both the network
and data management performance constraints.
6. An automated capacity planning tool was developed to synthesize and in-
tegrate the data management system and the network architecture as an
application-speci�c intranet. This custom-built tool, i -CAD, is based on an
evolutionary approach and it consists of three main procedures: the initial
intranet generation, the intranet validation and evaluation, and the intranet
selection and optimization.
7. i -CAD is connected to nine design libraries (Ethernet, ATM, IP router, bridge,
T-carrier, SONET, VPN, server and hard disk). Thus, the designs created by
i -CAD are based on realistic o�-the-shelf components.
8. Our results show a high feasibility of automating data management systems
and network architectures for various intranet infrastructures.
163

8.2.2 Related Contributions
Some early contributions that started our interests in the idea of synthesizing and
integration application-speci�c intranets, are listed below.
1. We examined di�erent distributed �le caching mechanisms. We proposed an
extension protocol for the Prospero File Access Protocol (PFAP) [ANR] to
handle caching prerecorded video/audio �les in real time. The objective of
the extension is to dynamically determine a cache block size and to store
the block(s) temporarily in intermediate PFAP server(s) while the blocks are
transmitted to the clients. This extension has two phases. The �rst phase
deals with the client request by determining the nearest server from which to
fetch the �le and allocating temporally intermediate storage in between the
nearest server and the client. The second phase deals with the server replys by
determining the cache block size, the optimum number of intermediate storage
sites and the block cache schedule.
2. We formulated the caching of multimedia web document as an optimization
problem to minimize the retrieval cost in term of network bandwidth and
memory allocation. Two hierarchical models, object ow graph (OFG) and
extended object ow graph (EOFG), for representing the caching of multimedia
web documents, were proposed to specify the multimedia presentation and
scheduling the retrieval operations [HRP97].
3. We developed a multimedia scheduler based on OFG and EOFG, a system
of di�erence constraints and Allen's temporal intervals. The scheduler uses
the Bellman-Ford algorithm to schedule the operations in an EOFG opti-
mally [HPRdSJ97].
164

8.3 Future Research
The intranet integration problem and its custom-built evolutionary program i -CAD
can be continued in four di�erent directions in the future. The �rst direction is
to make the intranet model more adaptive and realistic. The second direction is
to further extend and re�ne i -CAD to run faster and with more intelligence. The
third direction is modify the intranet design model and i -CAD to handle the issue
of intranet redesign. The fourth possible direction is toward integrating i -CAD with
other design and performance analysis tools.
8.3.1 Intranet Model Enhancements
Our intranet model can be extended further to cope with new network and data
management design and performance requirements. A network can have a variable
number of levels, to be determined during the optimization process. Each network
level (group, site or backbone) can have a number of network components connecting
in a certain topology, such as a tree, ring, bus, star or mesh. This will increase
the reliability of the entire intranet. As for the data management system, we can
use di�erent server placement strategies such as placing servers at various network
levels (site or backbone). Another strategy is to consider a data management system
hierarchy by placing proxies closer to the client tasks and binding the placed proxies
with the �le servers. This strategy may help in balancing the data management load
and easing the network congestion.
8.3.2 i-CAD Re�nement
The capability and performance of i -CAD can be re�ned by examining the behavior
of the genetic algorithm, especially in improving the search for good designs within
the design space, and reducing the repair time to �x invalid designs as result of the
crossover operator or the mutation operator. To improve the search, for example
165

we can alternate the order of the mutation operator and the crossover operator, and
study its e�ect on the population. Also, we can try to �nd a set of values for mutation
rate and crossover rate to improve the optimization process. The techniques that
were used to implement the genetic operators can be improved, especially for the
crossover operator since it performs exchanging network and data management com-
ponents simultaneously. This is a complex operation and it produces many invalid
designs that must be repaired. The size of design libraries a�ects the performance
of i -CAD, since i -CAD accesses design libraries in a linear fashion. This incurs a
high access time which a�ects the mutation operator.
8.3.3 Intranet Redesign
Redesigning a pre-existing network structure or data management system, where the
objective is to improve the performance for example, is a valid extension to i -CAD.
This extension can be considered by adding speci�c techniques and some code to
reuse as many as possible of all pre-allocated components and add new components
as little as possible so that the cost of redesign is minimized.
8.3.4 i -CAD: Complete Synthesis and Analysis Tool
This future direction is focused on embedding or interfacing synthesis and analy-
sis tools within i -CAD. Synthesis tools, which can design application-speci�c com-
puter systems or multiprocessor systems, can be combined with i -CAD to synthesize
group tasks by determining the hardware or software platforms needed to perform
group tasks e�ciently. A detail performance analysis tool that can evaluate network
structures or data management systems can be interfaced with i -CAD to give more
accurate �tness values for each design.
166

Reference List
[AC93] S. Arunkumar and T. Chockalingam. Genetic Search Algorithms andTheir Randomized Operators. Computers and Mathematics with Ap-plications, V. 25:91{100, 1993.
[All83] J. Allen. Maintaining Knowledge about Temporal Intervals. Commu-nication of the ACM, V. 26:832{843, November 1983.
[ANR] S. Augart, B. C. Neuman, and S. Rao. Prospero File Access Protocol.Draft.
[ASW94] F. Abuali, D. Schoenefeld, and R. Wainwright. Designing Telecommu-nications Networks Using Genetic Algorithms and Probabilistic Mini-mum Spanning Trees. In Proceedings of the 1994 ACM Symposium onApplied Computing, pages 242{246, 1994.
[ASW95] F. Abuali, D. Schoenefeld, and R. Wainwright. Solving the Three-StarTree Isomorphism Problem Using Genetic Algorithms. In Proceedingsof the 1995 ACM Symposium on Applied Computing, pages 337{344,1995.
[BC95] H. Braun and K. Cla�y. Web Tra�c Characterization: an Assess-ment of the Impact of Caching Document from NCSA's Web Server.Computer Network and ISDN Systems, V. 28:39{51, 1995.
[BD93] A. Bertoni and M. Dorigo. Implicit Parallelism in Genetic Algorithms.Arti�cial Intelligence, V. 61:307{314, 1993.
[BG87] D. Bertsekas and R. Gallager. Data Network. Prentice-Hall, Inc., 1987.
167
[BMM+] L. Berry, B. Murtagh, G. McMahon, S. Sugden, and L. Welling.An Integrated GA-LP Approach to Communication Network Design.http://www.cse.rmit.edu.au/ rdslw/publications.html.
[BV93] D. Battle and M. Vose. Isomorphisms of Genetic Algorithms. Arti�cialIntelligence, V. 60:155{165, 1993.
[CBC95] C. Cunha, A. Bestavros, and M. Crovella. Characteristics of WWWClient-Based Traces. Technical Report BU-CS-95-010, Boston Univer-sity, 1995.
[CDSW95] S. Cosares, D. Deutsch, I. Saniee, and O. Wasem. SONET Toolkit:A Decision Support System for Designing Robust and Cost-E�ectiveFiber-Optic Networks. Interfaces, V. 25:20{40, January 1995.
[Che97] K. Chellapilla. Evolving Computer Programs Without SubtreeCrossover. IEEE Transactions on Evolutionary Computation, V.1:209{216, September 1997.
[Chi60] R. Chien. Synthesis of a Communication Net. IBM Journal, V. 7:311{320, July 1960.
[Chu69] W. Chu. Optimal File Allocation in a Multiple Computer System.IEEE Transactions on Computers, V. C-18:885{889, October 1969.
[DAS97a] B. Dengiz, F. Altiparmak, and A. Smith. E�cient Optimization of All-Terminal Reliable Networks, Using an Evolutionary Approach. IEEETransactions on Reliability, V. 46:18{26, March 1997.
[DAS97b] B. Dengiz, F. Altiparmak, and A. Smith. Local Search Genetic Algo-rithm for Optimal Design of Reliable networks. IEEE Transactions onEvolutionary Computation, V. 1:179{188, September 1997.
[DDH95] B. Doshi, S. Dravida, and P. Harshavardhana. Overview of INDT - aNew Tool for Next Generation Network Design. In Proceedings of theIEEE Globecomm, November 1995.
168

[DF56] G. Dantzig and D. Fulkerson. On the Min-Cut Max-Flow Theorem inNetworks. Annals of Mathematical Study, V. 38:215{222, 1956.
[DFlH+97] B. Doshi, C. Funka-lea, P. Harshavardhana, J. Gong, R. Nagarajan,S. Ravikumar, S. Chen, and Y. Wang. Integrated Network DesignTools (INDT): a Suite of Network Design Tools for Current and NextGeneration Networking Technologies. In Proceedings of the IEEE Sym-posium on Computers and Communications, 1997.
[DSST95] A. Dan, P. Shahabuddin, D. Sitaram, and D. Towsley. Channel Alloca-tion Under Batching and VCR Control in Video-on-Demand Systems.Journal of Parallel and Distributed Computing, V. 24:168{179, October1995.
[EFS56] P. Elias, A. Feinstein, and C. E. Shannon. A Note on the MaximumFlow Through a Network. IRE Transactions on Information Theory,IT-2:117{119, 1956.
[EP93] C. Ersoy and S. Panwar. Topological Design of InterconnectedLAN/MAN Networks. IEEE Journal Selected Areas in Communica-tions, V. 11:1172{1182, October 1993.
[ES96] R. Elbaum and M. Sidi. Topological Design of Local Area NetworksUsing Genetic Algorithms. IEEE/ACM Transactions on Networking,V. 4:766{778, october 1996.
[EW66] L. Esau and K. Williams. On Teleprocessing System Design. IBMSystems Journal, V. 5:142{147, 1966.
[FD95] H. Fahmy and C. Douligeris. END: An Expert Network Designer.IEEE Network, pages 18{27, November 1995.
[FF56] L. Ford and D. Fulkerson. Maximal Flow Through a Network. Cana-dian Journal of Mathematics, V. 8:399{404, 1956.
[Fog94] D. Fogel. An Introduction to Simulated Evolutionary Optimization.IEEE Transactions on Neural Networks, V. 5:3{14, January 1994.
169

[For93] S. Forrest. Genetic Algorithms: Principles of Natural SelectionAppliedto Computation. Science, V. 261:872{878, august 1993.
[Fox91] E. Fox. Advances in Interactive Digital Multimedia Systems. IEEEComputer, V. 24:9{21, October 1991.
[GK77] M Gerla and L. Kleinrock. On the Topological Design of DistributedComputer Networks. IEEE on Transactions on Communications,COM-25:48{60, January 1977.
[GW90] A. Gersht and R. Weihmayer. Joint Optimization of Data Network De-sign and Facility Selection. IEEE Journal on Selected Areas in Com-munications, V. 8:1667{1681, December 1990.
[Heo97] D. Heo. Early System Architecture Optimization for Multi-Chip Sys-tems. PhD thesis, University of Southern California, 1997.
[HP00] S. Habib and A. Parker. Computer-Aided System Integration for Data-IntensiveMultimedia Applications. In Proceedings of ACM Multimedia2000, pages 379{381, Los Angeles, California, USA, 2000. Poster Pre-sentation.
[HPL01] S. Habib, A. Parker, and D. Lee. Automated Design of Hierarchi-cal Intranets. In Proceedings of the 2001 International Symposium onPerformance Evaluation of Computer and Telecommunication Systems,Orlando, Florida, USA, 2001.
[HPRdSJ97] S. Habib, A. C. Parker, C.P. Ravikumar, and D. C. da Silva Jr.Scheduling Problems in Distributed Multimedia Caching Applications.In Proceedings of the 1997 Paci�c Workshop for Distributed Multime-dia Systems, pages 202{209, Vancouver, Canada, 1997.
[HRP97] S. Habib, C.P. Ravikumar, and A. C. Parker. Storage Allocation andScheduling Problem in Web Caching Applications. In NLANR WebCache Workshop, Boulder, Colorado, USA, 1997. Poster Presentation.
170

[IK82] K. Irani and N. Khabbaz. A Methodology for the Design of Communi-cation Networks and the Distributed of Data in Distributed Supercom-puter Systems. IEEE Transactions on Computers, V. c-31:419{434,May 1982.
[Jai91] R. Jain. The Art of Computer Systems Performance Analysis: Tech-niques for Experimental Design, Measurement, Simulation, and Mod-eling. Wiley & Sons, 1991.
[KB83] A. Kershenbaum and R. Boorstyn. Centralized Teleprocessing NetworkDesign. Networks, V. 13:279{293, 1983.
[KC00] J. Knowles and D. Corne. A New Evolutionary Approach to theDegree-Constrained Minimum Spanning Tree Problem. IEEE Trans-actions on Evolutionary Computation, V. 4:125{134, July 2000.
[Ken97] E. Kennedy. Intranets and Their Impact on Network Infrastructures.ALCATEL Telecommunications Review, V. 4:256{260, December 1997.
[Koz97] M. Kozuch. Video Services Systems for Networked Video Libraries.PhD thesis, Princeton University, 1997.
[KTC+97] K. Ko, K. Tang, C. Chan, K. Man, and S. Kwong. Using GeneticAlgorithms to Design Mesh Networks. IEEE Computer, V. 30:56{61,August 1997.
[KWW97] M. Kozuch, W. Wolf, and A. Wolfe. An Approach to Network Cachingfor Multimedia Objects. In 1997 IEEE International Conference onComputer Design, Austin, Texas, 1997.
[LG90] T. Little and A. Ghafoor. Network Considerations for DistributedMultimedia Object Composition and Communication. IEEE NetworkMagazine, pages 32{49, November 1990.
[LLX98] Y. Leung, G. Li, and Z-B Xu. A Genetic Algorithm for the MultipleDestination Routing Problems. IEEE Transactions on EvolutionaryComputation, V. 2:150{161, November 1998.
171

[May60] W. Mayeda. Terminal and Branch Capacity Matrices of Communica-tion Net. IRE Transactions on Circuit Theory, pages 261{269, Septem-ber 1960.
[MCKA95] R. Martinez, W. Chimiak, J. Kim, and Y. Alsafadi. The Rural andGlobal Medical Informatics Consortium and Network for Radiology.Journal of Computers in Biology and Medicine, V. 25:85{106, 1995.
[Mic94] Z. Michalewicz. Genetic Algorithms + Data Structure = EvolutionPrograms. Springer-Verlag, 1994.
[MMR98] D. Mitra, J. Morrison, and K. Ramakrishnan. VPN DESIGNER: ATool for Design of Multiservice Virtual Private Networks. Bell LabsTechnical Journal, pages 15{31, October 1998.
[OCAV97] A. Ortega, F. Carignano, S. Ayer, and M. Vetterli. Soft Cache: WebCache Management for Images. In IEEE Signal Processing SocietyWorkshop on Multimedia, 1997.
[Pan97] H. Pang. Tertiary Storage in Multimedia Systems: Staging or DirectAccess. Multimedia Systems, V. 5:386{399, 1997.
[PK95] C. Palmer and A. Kershenbaum. An Approach to a Problem in Net-work Design Using Genetic Algorithms. Networks, V. 26:151{163, Oc-tober 1995.
[PL98] S. Pierre and G. Legault. A genetic Algorithm for Design DistributedComputer Network Topologies. IEEE Transactions on Systems, Man,and Cybernetics - Part B: Cybernetics, V. 28:249{258, 1998.
[PP92] S. Prakash and A. C. Parker. Synthesis of Application-Speci�c Hetero-geneous Multiprocessor Systems. Journal of Parallel and DistributedComputing, V. 16:338{351, December 1992.
[RG71] B. Rothfarb and M. Goldstein. The One-Terminal Telpak Problem.Operating Research, V. 19:156{169, 1971.
172

[Rud94] G. Rudolph. Convergence Analysis of Canonical Genetic Algorithms.IEEE Transactions on Neural Networks, V. 5:96{101, January 1994.
[RV91] P. Rangan and H. Vin. Designing File Systems for Digital Video andAudio. In Proceedings of the 13th ACM Symposium on Operating Sys-tem Principles, pages 81{94, 1991.
[RVG+95] K. Ramakrishman, L. Vaitzblit, C. Gray, U. Vahalia, D. Ting, P. Tzel-nic, S. Glaser, and W. Duso. Operating System Support for a Video-on-Demand File Service. Multimedia Systems, V. 3:53{65, 1995.
[Sak89] V. Saksena. Topological Analysis of Packet Networks. IEEE Journalon Selected Areas in Communications, V. 7:1243{1252, October 1989.
[SC95] J. Sanchez and M. Canton. Computer Animation Programming Meth-ods and Techniques. MaGraw-Hill, INC., 1995.
[Sla99] J. Slaton. Toys Will Be Toys.http://www.wired.com/news/culture/0,1284,32591,00.html, 1999.
[SP94] M. Srinivas and L. Patnaik. Genetic algorithms: A Survey. IEEEComputer, V. 27:17{26, June 1994.
[TGP96] Y. G. Tirat-Gefen and A. C. Parker. mega: an Approach to System-Level Design of Application-Speci�c Heterogeneous Multiprocessor. InProceedings of the 5th Heterogeneous Computing Workshop, pages 105{116, Honalulu, Hawaii, USA, 1996.
[TGSP97] Y. G. Tirat-Gefen, D. C. Silva, and A. C. Parker. Incorporating Im-precise Computation into System-Level Design of Application-Speci�cHeterogeneous Multiprocessors. In Proceedings of the 34th Design Au-tomation Conference, pages 58{63, Anaheim, California, USA, 1997.
[TH] J. Touch and S. Hotz. The X-Bone. http://www.isi.edu/x-bone.
173

[TWB78] D. Tang, L. Woo, and L. Bahl. Optimization of TeleprocessingNetworks with Concentrators and Multiconnected Terminals. IEEETransactions on Computers, V. c-27:594{604, July 1978.
[Wei95] R. Weinberg. Producing Content Producers. IEEE CommunicationsMagazine, V. 33:70{73, August 1995.
[Whi70] V. K. Whitney. A Study of Optimal File Site Assignment and Commu-nication Network Con�guration in Remote-Access Computer MessageProcessing and Communication Systems. PhD thesis, University ofMichigan, 1970.
[ZDE+93] L. Zhang, S. Deering, D. Estrin, S. Shenker, and D. Zappala. rsvp: aNew Resource Reservation Protocol. IEEE Network Magazine, pages8{18, September 1993.
[ZL99] Q. Zhang and Y-W Leung. An Orthogonal Genetic Algorithm forMultimedia Multicast Routing. IEEE Transactions on EvolutionaryComputation, V. 3:53{62, April 1999.
174

Appendix A
i-CAD Outputs
This appendix contains the best designs of all the six experiments in Chapter 7,which are produced by i -CAD.
A.1 Experiment 1
� The output of i -CAD for a 3-level network design for the partial animationsutdio, when TND = 5.0 seconds.
Enter the generation number from 0-2999:2010Intranet infrastructure(37) is the best design in generation 2010:initial cost = $156200, monthly cost = $0, interconnection cost = $0, wire cost = $11615average network delay = 4.9135 seconds, homogeneity factor = 0.461538BACKBONE(1) has 4 site tasks, BLT = 93.125 MbpsDESIGN(37): Backbone Router is located at X = 48.4892, Y = 56.7385, Z = 24.2538router(13): ip, 150000 pps, 5 ports, $11000ST(1) is connected to port 1ST(2) is connected to port 2ST(3) is connected to port 3ST(4) is connected to port 4SITE(1) has 2 group tasks, SLT = 0 Mbps, SOT = 55.625 Mbps, SIT = 2.5 MbpsDESIGN(37): Site Router is located at X = 36.4, Y = 63, Z = 1.1router(13): ip, 150000 pps, 5 ports, $11000GT(1) is connected to port 1GT(4) is connected to port 2BT(1) is connected to port 3GROUP(1) has 10 client tasks, GLT = 27 Mbps, GOT = 7.5 Mbps, GIT = 0 MbpsDESIGN(37): GNC is located at X = 9.7, Y = 49.6, Z = 1.1switch(18): atm, 100000000 bps, 15 ports, $15000CT(1) is connected to port 1...CT(10) is connected to port 10ST(1) is connected to port 11GROUP(4) has 5 client tasks, GLT = 8 Mbps, GOT = 48.125 Mbps, GIT = 2.5 MbpsDESIGN(37): GNC is located at X = 89.8, Y = 89.8, Z = 1.1
175

multiaccess(27): ethernet, 1000000000 bps, 6 ports, $13000CT(11) is connected to port 1...CT(15) is connected to port 5ST(1) is connected to port 6SITE(2) has 2 group tasks, SLT = 0 Mbps, SOT = 15 Mbps, SIT = 21.25 MbpsDESIGN(37): Site Router is located at X = 49.6667, Y = 56.3333, Z = 16.1router(9): ip, 100000 pps, 5 ports, $7000GT(2) is connected to port 1GT(5) is connected to port 2BT(1) is connected to port 3GROUP(2) has 5 client tasks, GLT = 2 Mbps, GOT = 2.5 Mbps, GIT = 2.5 MbpsDESIGN(37): GNC is located at X = 9.2, Y = 89, Z = 16.1switch(12): atm, 75000000 bps, 10 ports, $8000CT(16) is connected to port 1...CT(20) is connected to port 5ST(2) is connected to port 6GROUP(5) has 10 client tasks, GLT = 9 Mbps, GOT = 12.5 Mbps, GIT = 18.75 MbpsDESIGN(37): GNC is located at X = 69.9, Y = 40, Z = 16.1multiaccess(18): ethernet, 100000000 bps, 12 ports, $13000CT(21) is connected to port 1...CT(30) is connected to port 10ST(2) is connected to port 11SITE(3) has 2 group tasks, SLT = 0 Mbps, SOT = 15 Mbps, SIT = 33.75 MbpsDESIGN(37): Site Router is located at X = 52.45, Y = 50, Z = 32.1router(13): ip, 150000 pps, 5 ports, $11000GT(3) is connected to port 1GT(8) is connected to port 2BT(1) is connected to port 3GROUP(3) has 10 client tasks, GLT = 9 Mbps, GOT = 15 Mbps, GIT = 7.5 MbpsDESIGN(37): GNC is located at X = 27.5, Y = 85, Z = 32.1multiaccess(18): ethernet, 100000000 bps, 12 ports, $13000CT(31) is connected to port 1...CT(40) is connected to port 10ST(3) is connected to port 11GROUP(8) has 10 client tasks, GLT = 9 Mbps, GOT = 0 Mbps, GIT = 26.25 MbpsDESIGN(37): GNC is located at X = 77.4, Y = 15, Z = 32.1multiaccess(18): ethernet, 100000000 bps, 12 ports, $13000CT(41) is connected to port 1...CT(50) is connected to port 10ST(3) is connected to port 11SITE(4) has 2 group tasks, SLT = 4.2 Mbps, SOT = 7.5 Mbps, SIT = 35.625 MbpsDESIGN(37): Site Router is located at X = 54.12, Y = 59.8667, Z = 45.1router(9): ip, 100000 pps, 5 ports, $7000
176

GT(6) is connected to port 1GT(7) is connected to port 2BT(1) is connected to port 3GROUP(6) has 7 client tasks, GLT = 4.2 Mbps, GOT = 7.7 Mbps, GIT = 16.625 MbpsDESIGN(37): GNC is located at X = 15.4, Y = 30.7143, Z = 45.1multiaccess(16): ethernet, 100000000 bps, 8 ports, $9200CT(51) is connected to port 1...CT(57) is connected to port 7ST(4) is connected to port 8GROUP(7) has 8 client tasks, GLT = 5.6 Mbps, GOT = 4 Mbps, GIT = 23.2 MbpsDESIGN(37): GNC is located at X = 88, Y = 85.375, Z = 45.1multiaccess(29): ethernet, 1000000000 bps, 10 ports, $25000CT(58) is connected to port 1...CT(65) is connected to port 8ST(4) is connected to port 9Enter the generation number from 0-2999:
� The output of i -CAD for a 3-level network design for the partial animationsutdio, when TND = 10.0 seconds.
Enter the generation number from 0-2999:1943Intranet infrastructure(91) is the best design in generation 1943:initial cost = $113400, monthly cost = $0, interconnection cost = $0, wire cost = $3760.13average network delay = 9.90604 seconds, homogeneity Factor = 0.461538BACKBONE(1) has 4 site tasks, BLT = 93.125 MbpsDESIGN(91): Backbone Router is located at X = 48.4892, Y = 56.7385, Z = 24.2538router(9): ip, 100000 pps, 5 ports, $7000ST(1) is connected to port 1ST(2) is connected to port 2ST(3) is connected to port 3ST(4) is connected to port 4SITE(1) has 2 group tasks, SLT = 0 Mbps, SOT = 55.625 Mbps, SIT = 2.5 MbpsDESIGN(91): Site Router is located at X = 36.4, Y = 63, Z = 1.1router(9): ip, 100000 pps, 5 ports, $7000GT(1) is connected to port 1GT(4) is connected to port 2BT(1) is connected to port 3GROUP(1) has 10 client tasks, GLT = 27 Mbps, GOT = 7.5 Mbps, GIT = 0 MbpsDESIGN(91): GNC is located at X = 9.7, Y = 49.6, Z = 1.1switch(13): atm, 75000000 bps, 15 ports, $11000CT(1) is connected to port 1...CT(10) is connected to port 10ST(1) is connected to port 11GROUP(4) has 5 client tasks, GLT = 8 Mbps, GOT = 48.125 Mbps, GIT = 2.5 MbpsDESIGN(91): GNC is located at X = 89.8, Y = 89.8, Z = 1.1
177

multiaccess(15): ethernet, 100000000 bps, 6 ports, $8000CT(11) is connected to port 1...CT(15) is connected to port 5ST(1) is connected to port 6SITE(2) has 2 group tasks, SLT = 0 Mbps, SOT = 15 Mbps, SIT = 21.25 MbpsDESIGN(91): Site Router is located at X = 49.6667, Y = 56.3333, Z = 16.1router(5): ip, 50000 pps, 5 ports, $3000GT(2) is connected to port 1GT(5) is connected to port 2BT(1) is connected to port 3GROUP(2) has 5 client tasks, GLT = 2 Mbps, GOT = 2.5 Mbps, GIT = 2.5 MbpsDESIGN(91): GNC is located at X = 9.2, Y = 89, Z = 16.1switch(12): atm, 75000000 bps, 10 ports, $8000CT(16) is connected to port 1...CT(20) is connected to port 5ST(2) is connected to port 6GROUP(5) has 10 client tasks, GLT = 9 Mbps, GOT = 12.5 Mbps, GIT = 18.75 MbpsDESIGN(91): GNC is located at X = 69.9, Y = 40, Z = 16.1switch(18): atm, 100000000 bps, 15 ports, $15000CT(21) is connected to port 1...CT(30) is connected to port 10ST(2) is connected to port 11SITE(3) has 2 group tasks, SLT = 0 Mbps, SOT = 15 Mbps, SIT = 33.75 MbpsDESIGN(91): Site Router is located at X = 52.45, Y = 50, Z = 32.1router(9): ip, 100000 pps, 5 ports, $7000GT(3) is connected to port 1GT(8) is connected to port 2BT(1) is connected to port 3GROUP(3) has 10 client tasks, GLT = 9 Mbps, GOT = 15 Mbps, GIT = 7.5 MbpsDESIGN(91): GNC is located at X = 27.5, Y = 85, Z = 32.1switch(13): atm, 75000000 bps, 15 ports, $11000CT(31) is connected to port 1...CT(40) is connected to port 10ST(3) is connected to port 11GROUP(8) has 10 client tasks, GLT = 9 Mbps, GOT = 0 Mbps, GIT = 26.25 MbpsDESIGN(91): GNC is located at X = 77.4, Y = 15, Z = 32.1switch(13): atm, 75000000 bps, 15 ports, $11000CT(41) is connected to port 1...CT(50) is connected to port 10ST(3) is connected to port 11SITE(4) has 2 group tasks, SLT = 4.2 Mbps, SOT = 7.5 Mbps, SIT = 35.625 MbpsDESIGN(91): Site Router is located at X = 54.12, Y = 59.8667, Z = 45.1router(9): ip, 100000 pps, 5 ports, $7000
178

GT(6) is connected to port 1GT(7) is connected to port 2BT(1) is connected to port 3GROUP(6) has 7 client tasks, GLT = 4.2 Mbps, GOT = 7.7 Mbps, GIT = 16.625 MbpsDESIGN(91): GNC is located at X = 15.4, Y = 30.7143, Z = 45.1switch(12): atm, 75000000 bps, 10 ports, $8000CT(51) is connected to port 1...ST(4) is connected to port 8GROUP(7) has 8 client tasks, GLT = 5.6 Mbps, GOT = 4 Mbps, GIT = 23.2 MbpsDESIGN(91): GNC is located at X = 88, Y = 85.375, Z = 45.1multiaccess(17): ethernet, 100000000 bps, 10 ports, $10400CT(58) is connected to port 1...ST(4) is connected to port 9Enter the generation number from 0-2999:
� The output of i -CAD for a 3-level network design for the partial animationsutdio, when TND = 20.0 seconds.
Enter the generation number from 0-2999:2209Intranet infrastructure(158) is the best design in generation 2209:initial cost = $87000, monthly cost = $0, interconnection cost = $0, wire cost = $3760.13average network delay = 19.4312 seconds, homogeneity factor = 0.538462BACKBONE(1) has 4 site tasks, BLT = 93.125 MbpsDESIGN(158): Backbone Router is located at X = 48.4892, Y = 56.7385, Z = 24.2538router(9): ip, 100000 pps, 5 ports, $7000ST(1) is connected to port 1ST(2) is connected to port 2ST(3) is connected to port 3ST(4) is connected to port 4SITE(1) has 2 group tasks, SLT = 0 Mbps, SOT = 55.625 Mbps, SIT = 2.5 MbpsDESIGN(158): Site Router is located at X = 36.4, Y = 63, Z = 1.1router(5): ip, 50000 pps, 5 ports, $3000GT(1) is connected to port 1GT(4) is connected to port 2BT(1) is connected to port 3GROUP(1) has 10 client tasks, GLT = 27 Mbps, GOT = 7.5 Mbps, GIT = 0 MbpsDESIGN(158): GNC is located at X = 9.7, Y = 49.6, Z = 1.1switch(13): atm, 75000000 bps, 15 ports, $11000CT(1) is connected to port 1...CT(10) is connected to port 10ST(1) is connected to port 11GROUP(4) has 5 client tasks, GLT = 8 Mbps, GOT = 48.125 Mbps, GIT = 2.5 MbpsDESIGN(158): GNC is located at X = 89.8, Y = 89.8, Z = 1.1multiaccess(15): ethernet, 100000000 bps, 6 ports, $8000CT(11) is connected to port 1
179

...CT(15) is connected to port 5ST(1) is connected to port 6SITE(2) has 2 group tasks, SLT = 0 Mbps, SOT = 15 Mbps, SIT = 21.25 MbpsDESIGN(158): Site Router is located at X = 49.6667, Y = 56.3333, Z = 16.1router(5): ip, 50000 pps, 5 ports, $3000GT(2) is connected to port 1GT(5) is connected to port 2BT(1) is connected to port 3GROUP(2) has 5 client tasks, GLT = 2 Mbps, GOT = 2.5 Mbps, GIT = 2.5 MbpsDESIGN(158): GNC is located at X = 9.2, Y = 89, Z = 16.1switch(2): atm, 25000000 bps, 10 ports, $4000CT(16) is connected to port 1...CT(20) is connected to port 5ST(2) is connected to port 6GROUP(5) has 10 client tasks, GLT = 9 Mbps, GOT = 12.5 Mbps, GIT = 18.75 MbpsDESIGN(158): GNC is located at X = 69.9, Y = 40, Z = 16.1switch(13): atm, 75000000 bps, 15 ports, $11000CT(21) is connected to port 1...CT(30) is connected to port 10ST(2) is connected to port 11SITE(3) has 2 group tasks, SLT = 0 Mbps, SOT = 15 Mbps, SIT = 33.75 MbpsDESIGN(158): Site Router is located at X = 52.45, Y = 50, Z = 32.1router(5): ip, 50000 pps, 5 ports, $3000GT(3) is connected to port 1GT(8) is connected to port 2BT(1) is connected to port 3GROUP(3) has 10 client tasks, GLT = 9 Mbps, GOT = 15 Mbps, GIT = 7.5 MbpsDESIGN(158): GNC is located at X = 27.5, Y = 85, Z = 32.1switch(13): atm, 75000000 bps, 15 ports, $11000CT(31) is connected to port 1...CT(40) is connected to port 10ST(3) is connected to port 11GROUP(8) has 10 client tasks, GLT = 9 Mbps, GOT = 0 Mbps, GIT = 26.25 MbpsDESIGN(158): GNC is located at X = 77.4, Y = 15, Z = 32.1switch(13): atm, 75000000 bps, 15 ports, $11000CT(41) is connected to port 1...CT(50) is connected to port 10ST(3) is connected to port 11SITE(4) has 2 group tasks, SLT = 4.2 Mbps, SOT = 7.5 Mbps, SIT = 35.625 MbpsDESIGN(158): Site Router is located at X = 54.12, Y = 59.8667, Z = 45.1router(5): ip, 50000 pps, 5 ports, $3000GT(6) is connected to port 1GT(7) is connected to port 2
180

BT(1) is connected to port 3GROUP(6) has 7 client tasks, GLT = 4.2 Mbps, GOT = 7.7 Mbps, GIT = 16.625 MbpsDESIGN(158): GNC is located at X = 15.4, Y = 30.7143, Z = 45.1switch(7): atm, 45000000 bps, 10 ports, $6000CT(51) is connected to port 1...CT(57) is connected to port 7ST(4) is connected to port 8GROUP(7) has 8 client tasks, GLT = 5.6 Mbps, GOT = 4 Mbps, GIT = 23.2 MbpsDESIGN(158): GNC is located at X = 88, Y = 85.375, Z = 45.1switch(7): atm, 45000000 bps, 10 ports, $6000CT(58) is connected to port 1: : :
CT(65) is connected to port 8ST(4) is connected to port 9Enter the generation number from 0-2999:
� The output of i -CAD for a 3-level network design for the partial animationsutdio, when TND = 30.0 seconds.
Enter the generation number from 0-2999:2769Intranet infrastructure(153) is the best design in generation 2769:initial cost = $79320, monthly cost = $0, interconnection cost = $0, wire cost = $3760.13average network delay = 28.7014 seconds, homogeneity factor = 0.538462BACKBONE(1) has 4 site tasks, BLT = 93.125 MbpsDESIGN(153): Backbone Router is located at X = 48.4892, Y = 56.7385, Z = 24.2538router(9): ip, 100000 pps, 5 ports, $7000ST(1) is connected to port 1ST(2) is connected to port 2ST(3) is connected to port 3ST(4) is connected to port 4SITE(1) has 2 group tasks, SLT = 0 Mbps, SOT = 55.625 Mbps, SIT = 2.5 MbpsDESIGN(153): Site Router is located at X = 36.4, Y = 63, Z = 1.1router(5): ip, 50000 pps, 5 ports, $3000GT(1) is connected to port 1GT(4) is connected to port 2BT(1) is connected to port 3GROUP(1) has 10 client tasks, GLT = 27 Mbps, GOT = 7.5 Mbps, GIT = 0 MbpsDESIGN(153): GNC is located at X = 9.7, Y = 49.6, Z = 1.1switch(8): atm, 45000000 bps, 15 ports, $9000CT(1) is connected to port 1...CT(10) is connected to port 10ST(1) is connected to port 11GROUP(4) has 5 client tasks, GLT = 8 Mbps, GOT = 48.125 Mbps, GIT = 2.5 MbpsDESIGN(153): GNC is located at X = 89.8, Y = 89.8, Z = 1.1switch(12): atm, 75000000 bps, 10 ports, $8000CT(11) is connected to port 1...
181
CT(15) is connected to port 5ST(1) is connected to port 6SITE(2) has 2 group tasks, SLT = 0 Mbps, SOT = 15 Mbps, SIT = 21.25 MbpsDESIGN(153): Site Router is located at X = 49.6667, Y = 56.3333, Z = 16.1router(5): ip, 50000 pps, 5 ports, $3000GT(2) is connected to port 1GT(5) is connected to port 2BT(1) is connected to port 3GROUP(2) has 5 client tasks, GLT = 2 Mbps, GOT = 2.5 Mbps, GIT = 2.5 MbpsDESIGN(153): GNC is located at X = 9.2, Y = 89, Z = 16.1multiaccess(4): ethernet, 10000000 bps, 8 ports, $320CT(16) is connected to port 1...CT(20) is connected to port 5ST(2) is connected to port 6GROUP(5) has 10 client tasks, GLT = 9 Mbps, GOT = 12.5 Mbps, GIT = 18.75 MbpsDESIGN(153): GNC is located at X = 69.9, Y = 40, Z = 16.1switch(13): atm, 75000000 bps, 15 ports, $11000CT(21) is connected to port 1...CT(30) is connected to port 10ST(2) is connected to port 11SITE(3) has 2 group tasks, SLT = 0 Mbps, SOT = 15 Mbps, SIT = 33.75 MbpsDESIGN(153): Site Router is located at X = 52.45, Y = 50, Z = 32.1router(5): ip, 50000 pps, 5 ports, $3000GT(3) is connected to port 1GT(8) is connected to port 2BT(1) is connected to port 3GROUP(3) has 10 client tasks, GLT = 9 Mbps, GOT = 15 Mbps, GIT = 7.5 MbpsDESIGN(153): GNC is located at X = 27.5, Y = 85, Z = 32.1switch(13): atm, 75000000 bps, 15 ports, $11000CT(31) is connected to port 1...CT(40) is connected to port 10ST(3) is connected to port 11GROUP(8) has 10 client tasks, GLT = 9 Mbps, GOT = 0 Mbps, GIT = 26.25 MbpsDESIGN(153): GNC is located at X = 77.4, Y = 15, Z = 32.1switch(8): atm, 45000000 bps, 15 ports, $9000CT(41) is connected to port 1...CT(50) is connected to port 10ST(3) is connected to port 11SITE(4) has 2 group tasks, SLT = 4.2 Mbps, SOT = 7.5 Mbps, SIT = 35.625 MbpsDESIGN(153): Site Router is located at X = 54.12, Y = 59.8667, Z = 45.1router(5): ip, 50000 pps, 5 ports, $3000GT(6) is connected to port 1GT(7) is connected to port 2BT(1) is connected to port 3GROUP(6) has 7 client tasks, GLT = 4.2 Mbps, GOT = 7.7 Mbps, GIT = 16.625 Mbps
182

DESIGN(153): GNC is located at X = 15.4, Y = 30.7143, Z = 45.1switch(7): atm, 45000000 bps, 10 ports, $6000CT(51) is connected to port 1...CT(57) is connected to port 7ST(4) is connected to port 8GROUP(7) has 8 client tasks, GLT = 5.6 Mbps, GOT = 4 Mbps, GIT = 23.2 MbpsDESIGN(153): GNC is located at X = 88, Y = 85.375, Z = 45.1switch(7): atm, 45000000 bps, 10 ports, $6000CT(58) is connected to port 1...CT(65) is connected to port 8ST(4) is connected to port 9Enter the generation number from 0-2999:
� The output of i -CAD for a 3-level network design for the partial animationsutdio, when TND = 40.0 seconds.
Enter the generation number from 0-2999:2839Intranet infrastructure(193) is the best design in generation 2839:initial cost = $77200, monthly cost = $0, interconnection cost = $0, wire cost = $3760.13average network delay = 37.6259 seconds, homogeneity factor = 0.615385BACKBONE(1) has 4 site tasks, BLT = 93.125 MbpsDESIGN(193): Backbone Router is located at X = 48.4892, Y = 56.7385, Z = 24.2538router(9): ip, 100000 pps, 5 ports, $7000ST(1) is connected to port 1ST(2) is connected to port 2ST(3) is connected to port 3ST(4) is connected to port 4SITE(1) has 2 group tasks, SLT = 0 Mbps, SOT = 55.625 Mbps, SIT = 2.5 MbpsDESIGN(193): Site Router is located at X = 36.4, Y = 63, Z = 1.1router(5): ip, 50000 pps, 5 ports, $3000GT(1) is connected to port 1GT(4) is connected to port 2BT(1) is connected to port 3GROUP(1) has 10 client tasks, GLT = 27 Mbps, GOT = 7.5 Mbps, GIT = 0 MbpsDESIGN(193): GNC is located at X = 9.7, Y = 49.6, Z = 1.1switch(8): atm, 45000000 bps, 15 ports, $9000CT(1) is connected to port 1...CT(10) is connected to port 10ST(1) is connected to port 11GROUP(4) has 5 client tasks, GLT = 8 Mbps, GOT = 48.125 Mbps, GIT = 2.5 MbpsDESIGN(193): GNC is located at X = 89.8, Y = 89.8, Z = 1.1switch(12): atm, 75000000 bps, 10 ports, $8000CT(11) is connected to port 1...CT(15) is connected to port 5
183

ST(1) is connected to port 6SITE(2) has 2 group tasks, SLT = 0 Mbps, SOT = 15 Mbps, SIT = 21.25 MbpsDESIGN(193): Site Router is located at X = 49.6667, Y = 56.3333, Z = 16.1router(5): ip, 50000 pps, 5 ports, $3000GT(2) is connected to port 1GT(5) is connected to port 2BT(1) is connected to port 3GROUP(2) has 5 client tasks, GLT = 2 Mbps, GOT = 2.5 Mbps, GIT = 2.5 MbpsDESIGN(193): GNC is located at X = 9.2, Y = 89, Z = 16.1multiaccess(3): ethernet, 10000000 bps, 6 ports, $200CT(16) is connected to port 1...CT(20) is connected to port 5ST(2) is connected to port 6GROUP(5) has 10 client tasks, GLT = 9 Mbps, GOT = 12.5 Mbps, GIT = 18.75 MbpsDESIGN(193): GNC is located at X = 69.9, Y = 40, Z = 16.1switch(8): atm, 45000000 bps, 15 ports, $9000CT(21) is connected to port 1...CT(30) is connected to port 10ST(2) is connected to port 11SITE(3) has 2 group tasks, SLT = 0 Mbps, SOT = 15 Mbps, SIT = 33.75 MbpsDESIGN(193): Site Switch is located at X = 52.45, Y = 50, Z = 32.1switch(11): atm, 75000000 bps, 5 ports, $5000GT(3) is connected to port 1GT(8) is connected to port 2BT(1) is connected to port 3GROUP(3) has 10 client tasks, GLT = 9 Mbps, GOT = 15 Mbps, GIT = 7.5 MbpsDESIGN(193): GNC is located at X = 27.5, Y = 85, Z = 32.1switch(8): atm, 45000000 bps, 15 ports, $9000CT(31) is connected to port 1...CT(40) is connected to port 10ST(3) is connected to port 11GROUP(8) has 10 client tasks, GLT = 9 Mbps, GOT = 0 Mbps, GIT = 26.25 MbpsDESIGN(193): GNC is located at X = 77.4, Y = 15, Z = 32.1switch(8): atm, 45000000 bps, 15 ports, $9000CT(41) is connected to port 1...CT(50) is connected to port 10ST(3) is connected to port 11SITE(4) has 2 group tasks, SLT = 4.2 Mbps, SOT = 7.5 Mbps, SIT = 35.625 MbpsDESIGN(193): Site Router is located at X = 54.12, Y = 59.8667, Z = 45.1router(5): ip, 50000 pps, 5 ports, $3000GT(6) is connected to port 1GT(7) is connected to port 2BT(1) is connected to port 3GROUP(6) has 7 client tasks, GLT = 4.2 Mbps, GOT = 7.7 Mbps, GIT = 16.625 MbpsDESIGN(193): GNC is located at X = 15.4, Y = 30.7143, Z = 45.1
184

switch(7): atm, 45000000 bps, 10 ports, $6000CT(51) is connected to port 1...CT(57) is connected to port 7ST(4) is connected to port 8GROUP(7) has 8 client tasks, GLT = 5.6 Mbps, GOT = 4 Mbps, GIT = 23.2 MbpsDESIGN(193): GNC is located at X = 88, Y = 85.375, Z = 45.1switch(7): atm, 45000000 bps, 10 ports, $6000CT(58) is connected to port 1...CT(65) is connected to port 8ST(4) is connected to port 9Enter the generation number from 0-2999:
� The output of i -CAD for a 3-level network design for the partial animationsutdio, when TND = 50.0 seconds.
Enter the generation number from 0-2999:1994Intranet infrastructure(37) is the best design in generation 1994:initial cost = $75200, monthly cost = $0, interconnection cost = $0, wire cost = $3760.13average network delay = 37.6259 seconds, homogeneity factor = 0.538462BACKBONE(1) has 4 site tasks, BLT = 93.125 MbpsDESIGN(37): Backbone Router is located at X = 48.4892, Y = 56.7385, Z = 24.2538router(9): ip, 100000 pps, 5 ports, $7000ST(1) is connected to port 1ST(2) is connected to port 2ST(3) is connected to port 3ST(4) is connected to port 4SITE(1) has 2 group tasks, SLT = 0 Mbps, SOT = 55.625 Mbps, SIT = 2.5 MbpsDESIGN(37): Site Router is located at X = 36.4, Y = 63, Z = 1.1router(5): ip, 50000 pps, 5 ports, $3000GT(1) is connected to port 1GT(4) is connected to port 2BT(1) is connected to port 3GROUP(1) has 10 client tasks, GLT = 27 Mbps, GOT = 7.5 Mbps, GIT = 0 MbpsDESIGN(37): GNC is located at X = 9.7, Y = 49.6, Z = 1.1switch(8): atm, 45000000 bps, 15 ports, $9000CT(1) is connected to port 1...CT(10) is connected to port 10ST(1) is connected to port 11GROUP(4) has 5 client tasks, GLT = 8 Mbps, GOT = 48.125 Mbps, GIT = 2.5 MbpsDESIGN(37): GNC is located at X = 89.8, Y = 89.8, Z = 1.1switch(12): atm, 75000000 bps, 10 ports, $8000CT(11) is connected to port 1...CT(15) is connected to port 5ST(1) is connected to port 6
185

SITE(2) has 2 group tasks, SLT = 0 Mbps, SOT = 15 Mbps, SIT = 21.25 MbpsDESIGN(37): Site Router is located at X = 49.6667, Y = 56.3333, Z = 16.1router(5): ip, 50000 pps, 5 ports, $3000GT(2) is connected to port 1GT(5) is connected to port 2BT(1) is connected to port 3GROUP(2) has 5 client tasks, GLT = 2 Mbps, GOT = 2.5 Mbps, GIT = 2.5 MbpsDESIGN(37): GNC is located at X = 9.2, Y = 89, Z = 16.1multiaccess(3): ethernet, 10000000 bps, 6 ports, $200CT(16) is connected to port 1...CT(20) is connected to port 5ST(2) is connected to port 6GROUP(5) has 10 client tasks, GLT = 9 Mbps, GOT = 12.5 Mbps, GIT = 18.75 MbpsDESIGN(37): GNC is located at X = 69.9, Y = 40, Z = 16.1switch(8): atm, 45000000 bps, 15 ports, $9000CT(21) is connected to port 1...CT(30) is connected to port 10ST(2) is connected to port 11SITE(3) has 2 group tasks, SLT = 0 Mbps, SOT = 15 Mbps, SIT = 33.75 MbpsDESIGN(37): Site Router is located at X = 52.45, Y = 50, Z = 32.1router(5): ip, 50000 pps, 5 ports, $3000GT(3) is connected to port 1GT(8) is connected to port 2BT(1) is connected to port 3GROUP(3) has 10 client tasks, GLT = 9 Mbps, GOT = 15 Mbps, GIT = 7.5 MbpsDESIGN(37): GNC is located at X = 27.5, Y = 85, Z = 32.1switch(8): atm, 45000000 bps, 15 ports, $9000CT(31) is connected to port 1...CT(40) is connected to port 10ST(3) is connected to port 11GROUP(8) has 10 client tasks, GLT = 9 Mbps, GOT = 0 Mbps, GIT = 26.25 MbpsDESIGN(37): GNC is located at X = 77.4, Y = 15, Z = 32.1switch(8): atm, 45000000 bps, 15 ports, $9000CT(41) is connected to port 1...CT(50) is connected to port 10ST(3) is connected to port 11SITE(4) has 2 group tasks, SLT = 4.2 Mbps, SOT = 7.5 Mbps, SIT = 35.625 MbpsDESIGN(37): Site Router is located at X = 54.12, Y = 59.8667, Z = 45.1router(5): ip, 50000 pps, 5 ports, $3000GT(6) is connected to port 1GT(7) is connected to port 2BT(1) is connected to port 3GROUP(6) has 7 client tasks, GLT = 4.2 Mbps, GOT = 7.7 Mbps, GIT = 16.625 MbpsDESIGN(37): GNC is located at X = 15.4, Y = 30.7143, Z = 45.1switch(7): atm, 45000000 bps, 10 ports, $6000
186

CT(51) is connected to port 1...CT(57) is connected to port 7ST(4) is connected to port 8GROUP(7) has 8 client tasks, GLT = 5.6 Mbps, GOT = 4 Mbps, GIT = 23.2 MbpsDESIGN(37): GNC is located at X = 88, Y = 85.375, Z = 45.1switch(7): atm, 45000000 bps, 10 ports, $6000CT(58) is connected to port 1...CT(65) is connected to port 8ST(4) is connected to port 9Enter the generation number from 0-2999:
� The output of i -CAD for a 3-level network design for the partial animationsutdio, when TND = 60.0 seconds.
Enter the generation number from 0-2999:1994Intranet infrastructure(37) is the best design in generation 1994:initial cost = $75200, monthly cost = $0, interconnection cost = $0, wire cost = $3760.13average network delay = 37.6259 seconds, homogeneity factor = 0.538462BACKBONE(1) has 4 site tasks, BLT = 93.125 MbpsDESIGN(37): Backbone Router is located at X = 48.4892, Y = 56.7385, Z = 24.2538router(9): ip, 100000 pps, 5 ports, $7000ST(1) is connected to port 1ST(2) is connected to port 2ST(3) is connected to port 3ST(4) is connected to port 4SITE(1) has 2 group tasks, SLT = 0 Mbps, SOT = 55.625 Mbps, SIT = 2.5 MbpsDESIGN(37): Site Router is located at X = 36.4, Y = 63, Z = 1.1router(5): ip, 50000 pps, 5 ports, $3000GT(1) is connected to port 1GT(4) is connected to port 2BT(1) is connected to port 3GROUP(1) has 10 client tasks, GLT = 27 Mbps, GOT = 7.5 Mbps, GIT = 0 MbpsDESIGN(37): GNC is located at X = 9.7, Y = 49.6, Z = 1.1switch(8): atm, 45000000 bps, 15 ports, $9000CT(1) is connected to port 1...CT(10) is connected to port 10ST(1) is connected to port 11GROUP(4) has 5 client tasks, GLT = 8 Mbps , GOT = 48.125 Mbps, GIT = 2.5 MbpsDESIGN(37): GNC is located at X = 89.8, Y = 89.8, Z = 1.1switch(12): atm, 75000000 bps, 10 ports, $8000CT(11) is connected to port 1...CT(15) is connected to port 5ST(1) is connected to port 6SITE(2) has 2 group tasks, SLT = 0 Mbps, SOT = 15 Mbps, SIT = 21.25 Mbps
187

DESIGN(37): Site Router is located at X = 49.6667, Y = 56.3333, Z = 16.1router(5): ip, 50000 pps, 5 ports, $3000GT(2) is connected to port 1GT(5) is connected to port 2BT(1) is connected to port 3GROUP(2) has 5 client tasks, GLT = 2 Mbps, GOT = 2.5 Mbps, GIT = 2.5 MbpsDESIGN(37): GNC is located at X = 9.2, Y = 89, Z = 16.1multiaccess(3): ethernet, 10000000 bps, 6 ports, $200CT(16) is connected to port 1...CT(20) is connected to port 5ST(2) is connected to port 6GROUP(5) has 10 client tasks, GLT = 9 Mbps, GOT = 12.5 Mbps, GIT = 18.75 MbpsDESIGN(37): GNC is located at X = 69.9, Y = 40, Z = 16.1switch(8): atm, 45000000 bps, 15 ports, $9000CT(21) is connected to port 1...CT(30) is connected to port 10ST(2) is connected to port 11SITE(3) has 2 group tasks, SLT = 0 Mbps, SOT = 15 Mbps, SIT = 33.75 MbpsDESIGN(37): Site Router is located at X = 52.45, Y = 50, Z = 32.1router(5): ip, 50000 pps, 5 ports, $3000GT(3) is connected to port 1GT(8) is connected to port 2BT(1) is connected to port 3GROUP(3) has 10 client tasks, GLT = 9 Mbps, GOT = 15 Mbps, GIT = 7.5 MbpsDESIGN(37): GNC is located at X = 27.5, Y = 85, Z = 32.1switch(8): atm, 45000000 bps, 15 ports, $9000CT(31) is connected to port 1...CT(40) is connected to port 10ST(3) is connected to port 11GROUP(8) has 10 client tasks, GLT = 9 Mbps, GOT = 0 Mbps, GIT = 26.25 MbpsDESIGN(37): GNC is located at X = 77.4, Y = 15, Z = 32.1switch(8): atm, 45000000 bps, 15 ports, $9000CT(41) is connected to port 1...CT(50) is connected to port 10ST(3) is connected to port 11SITE(4) has 2 group tasks, SLT = 4.2 Mbps, SOT = 7.5 Mbps, SIT = 35.625 MbpsDESIGN(37): Site Router is located at X = 54.12, Y = 59.8667, Z = 45.1router(5): ip, 50000 pps, 5 ports, $3000GT(6) is connected to port 1GT(7) is connected to port 2BT(1) is connected to port 3GROUP(6) has 7 client tasks, GLT = 4.2 Mbps, GOT = 7.7 Mbps, GIT = 16.625 MbpsDESIGN(37): GNC is located at X = 15.4, Y = 30.7143, Z = 45.1switch(7): atm, 45000000 bps, 10 ports, $6000CT(51) is connected to port 1
188

...CT(57) is connected to port 7ST(4) is connected to port 8GROUP(7) has 8 client tasks, GLT = 5.6 Mbps, GOT = 4 Mbps, GIT = 23.2 MbpsDESIGN(37): GNC is located at X = 88, Y = 85.375, Z = 45.1switch(7): atm, 45000000 bps, 10 ports, $6000CT(58) is connected to port 1...CT(65) is connected to port 8ST(4) is connected to port 9Enter the generation number from 0-2999:
A.2 Experiment 2
� The output of i -CAD for a 3-level network design, including a wide tree back-bone topology, for the partial animation sutdio, when TND = 6.0 seconds.
Enter the generation number from 0-2999:1618Intranet infrastructure(20) is the best design in generation 1618:initial cost = $245400, monthly cost = $396000interconnection cost = $10000, wire cost = $14957.2average network delay = 5.98882 seconds, homogeneity factor = 0.333333BACKBONE(1) has 4 site tasks, BLT = 93.125 MbpsLink(1) connects sites: 1 and 3t-line(ds4): 264241152 bps, initial cost $30000 and monthly cost $13000Link(2) connects sites: 3 and 2sonet(vpc15-oc3/sonetsonet): 116640000 bps, initial cost $22500 and monthly cost $7000Link(3) connects sites: 3 and 4t-line(ds4): 264241152 bps, initial cost $30000 and monthly cost $13000SITE(1) has 2 group tasks, SLT = 0 Mbps, SOT = 55.625 Mbps, SIT = 2.5 MbpsDESIGN(20): Site Router is located at X = 83236.4, Y = 20863, Z = 1.1router(13): ip, 150000 pps, 5 ports, $11000GT(1) is connected to port 1GT(4) is connected to port 2LINK(1) is connected to port 3GROUP(1) has 10 client tasks, GLT = 27 Mbps, GOT = 7.5 Mbps, GIT = 0 MbpsDESIGN(20): GNC is located at X = 83209.7, Y = 20849.6, Z = 1.1switch(18): atm, 100000000 bps, 15 ports, $15000CT(1) is connected to port 1...CT(10) is connected to port 10ST(1) is connected to port 11GROUP(4) has 5 client tasks, GLT = 8 Mbps, GOT = 48.125 Mbps, GIT = 2.5 MbpsDESIGN(20): GNC is located at X = 83289.8, Y = 20889.8, Z = 1.1multiaccess(27): ethernet, 1000000000 bps, 6 ports, $13000CT(11) is connected to port 1...
189

CT(15) is connected to port 5ST(1) is connected to port 6SITE(2) has 2 group tasks, SLT = 0 Mbps, SOT = 15 Mbps, SIT = 21.25 MbpsDESIGN(20): Site Multiaccess device is located at X = 114450, Y = 56.3333, Z = 16.1multiaccess(26): ethernet, 1000000000 bps, 4 ports, $8000GT(2) is connected to site task port 1 via a 2-port bridge with following attributes:Bridge(13), has capacity 80000 frames per second and cost $260GT(5) is connected to site task port 2 via a 2-port bridge with following attributes:Bridge(12), has capacity 70000 frames per second and cost $240LINK(2) is connected to port 3GROUP(2) has 5 client tasks, GLT = 2 Mbps, GOT = 2.5 Mbps, GIT = 2.5 MbpsDESIGN(20): GNC is located at X = 114409, Y = 89, Z = 16.1multiaccess(16): ethernet, 100000000 bps, 8 ports, $9200CT(16) is connected to port 1...CT(20) is connected to port 5ST(2) is connected to port 6GROUP(5) has 10 client tasks, GLT = 9 Mbps, GOT = 12.5 Mbps, GIT = 18.75 MbpsDESIGN(20): GNC is located at X = 114470, Y = 40, Z = 16.1multiaccess(30): ethernet, 1000000000 bps, 12 ports, $33000CT(21) is connected to port 1...CT(30) is connected to port 10ST(2) is connected to port 11SITE(3) has 2 group tasks, SLT = 0 Mbps, SOT = 15 Mbps, SIT = 33.75 MbpsDESIGN(20): Site Router is located at X = 52052.4, Y = 10450, Z = 32.1router(13): ip, 150000 pps, 5 ports, $11000GT(3) is connected to port 1GT(8) is connected to port 2LINK(1) is connected to port 3LINK(2) is connected to port 4LINK(3) is connected to port 5GROUP(3) has 10 client tasks, GLT = 9 Mbps, GOT = 15 Mbps, GIT = 7.5 MbpsDESIGN(20): GNC is located at X = 52027.5, Y = 10485, Z = 32.1switch(13): atm, 75000000 bps, 15 ports, $11000CT(31) is connected to port 1...CT(40) is connected to port 10ST(3) is connected to port 11GROUP(8) has 10 client tasks, GLT = 9 Mbps, GOT = 0 Mbps, GIT = 26.25 MbpsDESIGN(20): GNC is located at X = 52077.4, Y = 10415, Z = 32.1switch(23): atm, 150000000 bps, 15 ports, $20000CT(41) is connected to port 1...CT(50) is connected to port 10ST(3) is connected to port 11SITE(4) has 2 group tasks, SLT = 4.2 Mbps, SOT = 7.5 Mbps, SIT = 35.625 MbpsDESIGN(20): Site Router is located at X = 54.12, Y = 10459.9, Z = 45.1router(9): ip, 100000 pps, 5 ports, $7000
190
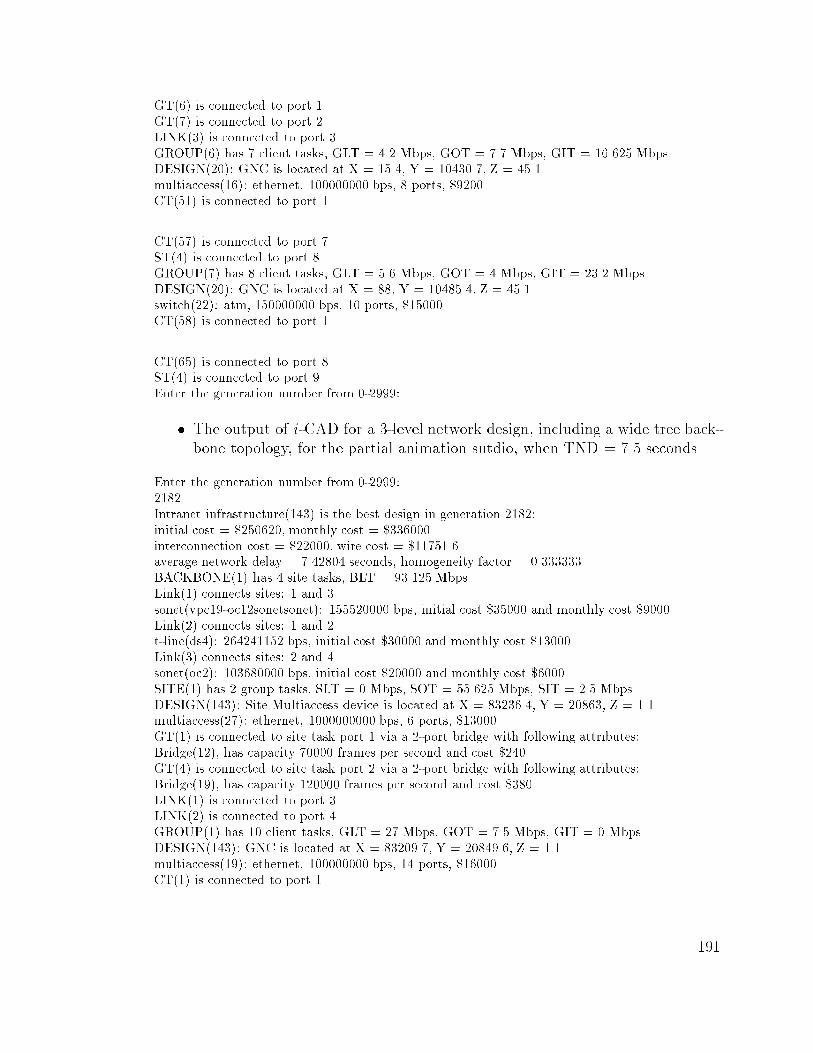
GT(6) is connected to port 1GT(7) is connected to port 2LINK(3) is connected to port 3GROUP(6) has 7 client tasks, GLT = 4.2 Mbps, GOT = 7.7 Mbps, GIT = 16.625 MbpsDESIGN(20): GNC is located at X = 15.4, Y = 10430.7, Z = 45.1multiaccess(16): ethernet, 100000000 bps, 8 ports, $9200CT(51) is connected to port 1...CT(57) is connected to port 7ST(4) is connected to port 8GROUP(7) has 8 client tasks, GLT = 5.6 Mbps, GOT = 4 Mbps, GIT = 23.2 MbpsDESIGN(20): GNC is located at X = 88, Y = 10485.4, Z = 45.1switch(22): atm, 150000000 bps, 10 ports, $15000CT(58) is connected to port 1...CT(65) is connected to port 8ST(4) is connected to port 9Enter the generation number from 0-2999:
� The output of i -CAD for a 3-level network design, including a wide tree back-bone topology, for the partial animation sutdio, when TND = 7.5 seconds.
Enter the generation number from 0-2999:2182Intranet infrastructure(143) is the best design in generation 2182:initial cost = $250620, monthly cost = $336000interconnection cost = $22000, wire cost = $11751.6average network delay = 7.42804 seconds, homogeneity factor = 0.333333BACKBONE(1) has 4 site tasks, BLT = 93.125 MbpsLink(1) connects sites: 1 and 3sonet(vpc19-oc12sonetsonet): 155520000 bps, initial cost $35000 and monthly cost $9000Link(2) connects sites: 1 and 2t-line(ds4): 264241152 bps, initial cost $30000 and monthly cost $13000Link(3) connects sites: 2 and 4sonet(oc2): 103680000 bps, initial cost $20000 and monthly cost $6000SITE(1) has 2 group tasks, SLT = 0 Mbps, SOT = 55.625 Mbps, SIT = 2.5 MbpsDESIGN(143): Site Multiaccess device is located at X = 83236.4, Y = 20863, Z = 1.1multiaccess(27): ethernet, 1000000000 bps, 6 ports, $13000GT(1) is connected to site task port 1 via a 2-port bridge with following attributes:Bridge(12), has capacity 70000 frames per second and cost $240GT(4) is connected to site task port 2 via a 2-port bridge with following attributes:Bridge(19), has capacity 120000 frames per second and cost $380LINK(1) is connected to port 3LINK(2) is connected to port 4GROUP(1) has 10 client tasks, GLT = 27 Mbps, GOT = 7.5 Mbps, GIT = 0 MbpsDESIGN(143): GNC is located at X = 83209.7, Y = 20849.6, Z = 1.1multiaccess(19): ethernet, 100000000 bps, 14 ports, $16000CT(1) is connected to port 1...
191
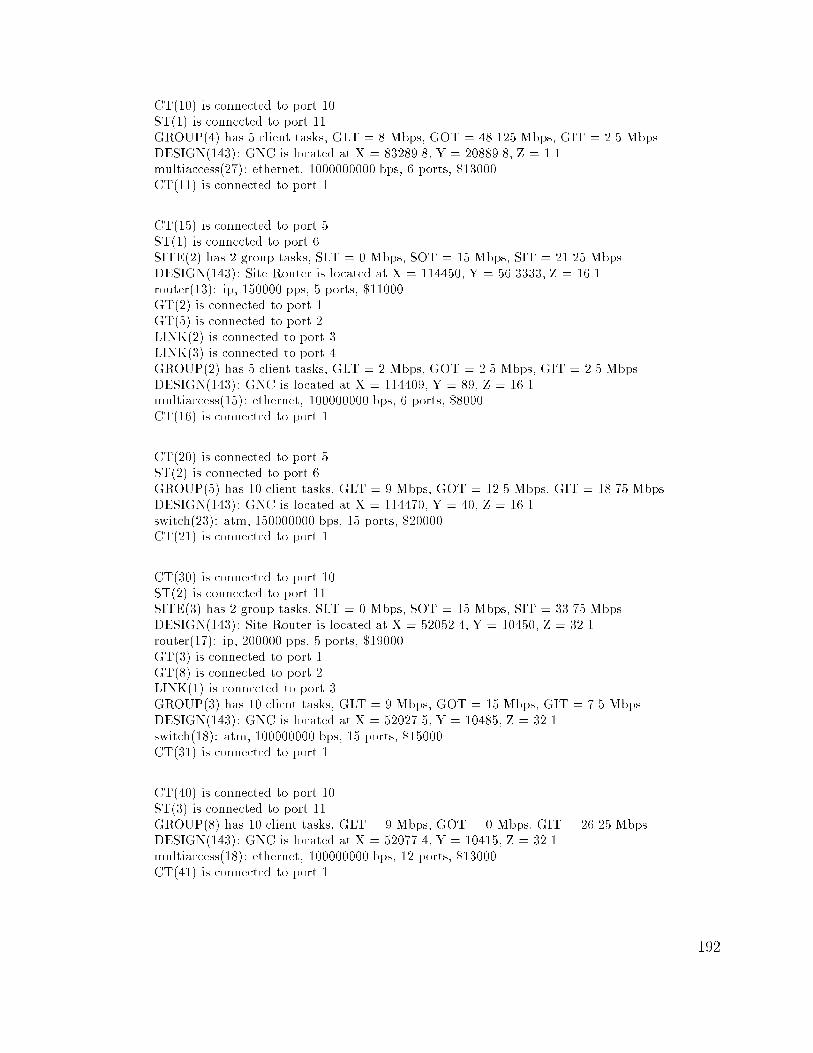
CT(10) is connected to port 10ST(1) is connected to port 11GROUP(4) has 5 client tasks, GLT = 8 Mbps, GOT = 48.125 Mbps, GIT = 2.5 MbpsDESIGN(143): GNC is located at X = 83289.8, Y = 20889.8, Z = 1.1multiaccess(27): ethernet, 1000000000 bps, 6 ports, $13000CT(11) is connected to port 1...CT(15) is connected to port 5ST(1) is connected to port 6SITE(2) has 2 group tasks, SLT = 0 Mbps, SOT = 15 Mbps, SIT = 21.25 MbpsDESIGN(143): Site Router is located at X = 114450, Y = 56.3333, Z = 16.1router(13): ip, 150000 pps, 5 ports, $11000GT(2) is connected to port 1GT(5) is connected to port 2LINK(2) is connected to port 3LINK(3) is connected to port 4GROUP(2) has 5 client tasks, GLT = 2 Mbps, GOT = 2.5 Mbps, GIT = 2.5 MbpsDESIGN(143): GNC is located at X = 114409, Y = 89, Z = 16.1multiaccess(15): ethernet, 100000000 bps, 6 ports, $8000CT(16) is connected to port 1...CT(20) is connected to port 5ST(2) is connected to port 6GROUP(5) has 10 client tasks, GLT = 9 Mbps, GOT = 12.5 Mbps, GIT = 18.75 MbpsDESIGN(143): GNC is located at X = 114470, Y = 40, Z = 16.1switch(23): atm, 150000000 bps, 15 ports, $20000CT(21) is connected to port 1...CT(30) is connected to port 10ST(2) is connected to port 11SITE(3) has 2 group tasks, SLT = 0 Mbps, SOT = 15 Mbps, SIT = 33.75 MbpsDESIGN(143): Site Router is located at X = 52052.4, Y = 10450, Z = 32.1router(17): ip, 200000 pps, 5 ports, $19000GT(3) is connected to port 1GT(8) is connected to port 2LINK(1) is connected to port 3GROUP(3) has 10 client tasks, GLT = 9 Mbps, GOT = 15 Mbps, GIT = 7.5 MbpsDESIGN(143): GNC is located at X = 52027.5, Y = 10485, Z = 32.1switch(18): atm, 100000000 bps, 15 ports, $15000CT(31) is connected to port 1...CT(40) is connected to port 10ST(3) is connected to port 11GROUP(8) has 10 client tasks, GLT = 9 Mbps, GOT = 0 Mbps, GIT = 26.25 MbpsDESIGN(143): GNC is located at X = 52077.4, Y = 10415, Z = 32.1multiaccess(18): ethernet, 100000000 bps, 12 ports, $13000CT(41) is connected to port 1...
192

CT(50) is connected to port 10ST(3) is connected to port 11SITE(4) has 2 group tasks, SLT = 4.2 Mbps, SOT = 7.5 Mbps, SIT = 35.625 MbpsDESIGN(143): Site Switch is located at X = 54.12, Y = 10459.9, Z = 45.1switch(16): atm, 100000000 bps, 5 ports, $7000GT(6) is connected to port 1GT(7) is connected to port 2LINK(3) is connected to port 3GROUP(6) has 7 client tasks, GLT = 4.2 Mbps, GOT = 7.7 Mbps, GIT = 16.625 MbpsDESIGN(143): GNC is located at X = 15.4, Y = 10430.7, Z = 45.1switch(22): atm, 150000000 bps, 10 ports, $15000CT(51) is connected to port 1...CT(57) is connected to port 7ST(4) is connected to port 8GROUP(7) has 8 client tasks, GLT = 5.6 Mbps, GOT = 4 Mbps, GIT = 23.2 MbpsDESIGN(143): GNC is located at X = 88, Y = 10485.4, Z = 45.1switch(22): atm, 150000000 bps, 10 ports, $15000CT(58) is connected to port 1...CT(65) is connected to port 8ST(4) is connected to port 9Enter the generation number from 0-2999:
� The output of i -CAD for a 3-level network design, including a wide tree back-bone topology, for the partial animation sutdio, when TND = 10.0 seconds.
Enter the generation number from 0-2999:1139Intranet infrastructure(174) is the best design in generation 1139:initial cost = $190500, monthly cost = $219000interconnection cost = $24000, wire cost = $4028.53average network delay = 9.86219 seconds, homogeneity factor = 0.466667BACKBONE(1) has 4 site tasks, BLT = 93.125 MbpsLink(1) connects sites: 3 and 1sonet(vpc16-oc9/sonetsonet): 116640000 bps, initial cost $22500 and monthly cost $6750Link(2) connects sites: 3 and 4sonet(oc2): 103680000 bps, initial cost $20000 and monthly cost $6000Link(3) connects sites: 1 and 2sonet(vpc14-oc3/sonetsonet): 77760000 bps, initial cost $15000 and monthly cost $5500SITE(1) has 2 group tasks, SLT = 0 Mbps, SOT = 55.625 Mbps, SIT = 2.5 MbpsDESIGN(174): Site Router is located at X = 83236.4, Y = 20863, Z = 1.1router(9): ip, 100000 pps, 5 ports, $7000GT(1) is connected to port 1GT(4) is connected to port 2LINK(1) is connected to port 3LINK(3) is connected to port 4GROUP(1) has 10 client tasks, GLT = 27 Mbps, GOT = 7.5 Mbps, GIT = 0 MbpsDESIGN(174): GNC is located at X = 83209.7, Y = 20849.6, Z = 1.1switch(18): atm, 100000000 bps, 15 ports, $15000
193

CT(1) is connected to port 1...CT(10) is connected to port 10ST(1) is connected to port 11GROUP(4) has 5 client tasks, GLT = 8 Mbps, GOT = 48.125 Mbps, GIT = 2.5 MbpsDESIGN(174): GNC is located at X = 83289.8, Y = 20889.8, Z = 1.1switch(22): atm, 150000000 bps, 10 ports, $15000CT(11) is connected to port 1...CT(15) is connected to port 5ST(1) is connected to port 6SITE(2) has 2 group tasks, SLT = 0 Mbps, SOT = 15 Mbps, SIT = 21.25 MbpsDESIGN(174): Site Router is located at X = 114450, Y = 56.3333, Z = 16.1router(9): ip, 100000 pps, 5 ports, $7000GT(2) is connected to port 1GT(5) is connected to port 2LINK(3) is connected to port 3GROUP(2) has 5 client tasks, GLT = 2 Mbps, GOT = 2.5 Mbps, GIT = 2.5 MbpsDESIGN(174): GNC is located at X = 114409, Y = 89, Z = 16.1switch(7): atm, 45000000 bps, 10 ports, $6000CT(16) is connected to port 1...CT(20) is connected to port 5ST(2) is connected to port 6GROUP(5) has 10 client tasks, GLT = 9 Mbps, GOT = 12.5 Mbps, GIT = 18.75 MbpsDESIGN(174): GNC is located at X = 114470, Y = 40, Z = 16.1multiaccess(19): ethernet, 100000000 bps, 14 ports, $16000CT(21) is connected to port 1...CT(30) is connected to port 10ST(2) is connected to port 11SITE(3) has 2 group tasks, SLT = 0 Mbps, SOT = 15 Mbps, SIT = 33.75 MbpsDESIGN(174): Site Router is located at X = 52052.4, Y = 10450, Z = 32.1router(9): ip, 100000 pps, 5 ports, $7000GT(3) is connected to port 1GT(8) is connected to port 2LINK(1) is connected to port 3LINK(2) is connected to port 4GROUP(3) has 10 client tasks, GLT = 9 Mbps, GOT = 15 Mbps, GIT = 7.5 MbpsDESIGN(174): GNC is located at X = 52027.5, Y = 10485, Z = 32.1switch(18): atm, 100000000 bps, 15 ports, $15000CT(31) is connected to port 1...CT(40) is connected to port 10ST(3) is connected to port 11GROUP(8) has 10 client tasks, GLT = 9 Mbps, GOT = 0 Mbps, GIT = 26.25 MbpsDESIGN(174): GNC is located at X = 52077.4, Y = 10415, Z = 32.1switch(18): atm, 100000000 bps, 15 ports, $15000
194
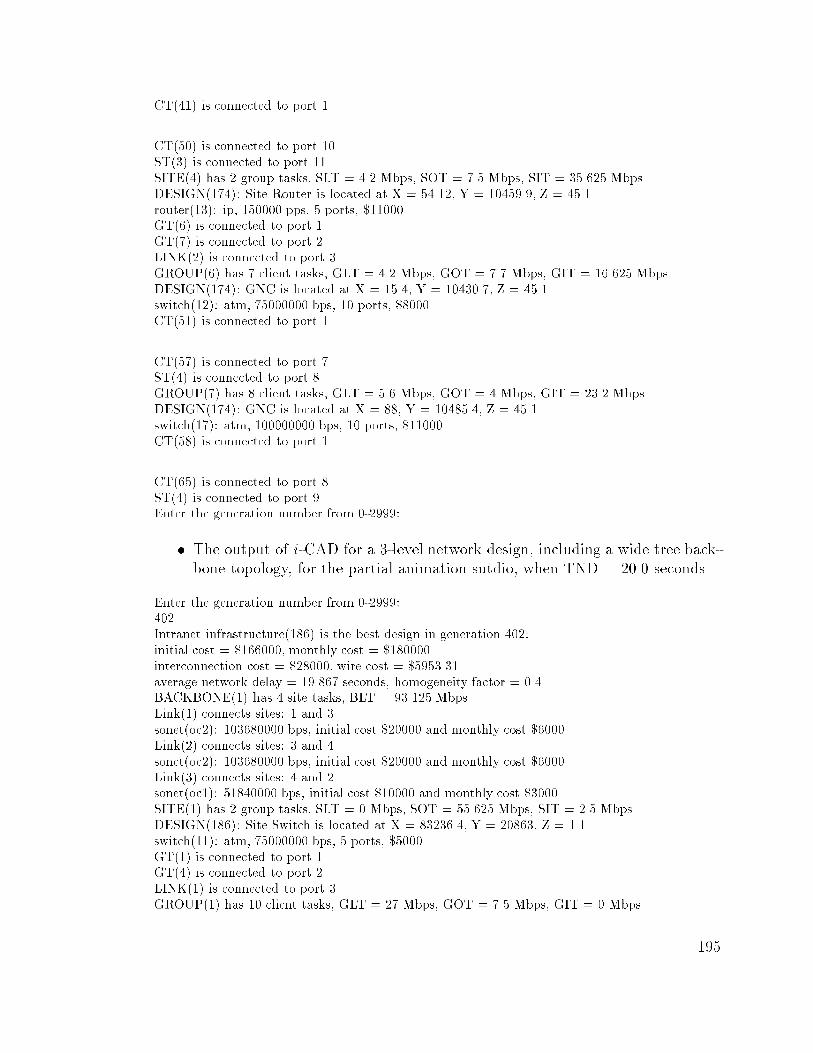
CT(41) is connected to port 1...CT(50) is connected to port 10ST(3) is connected to port 11SITE(4) has 2 group tasks, SLT = 4.2 Mbps, SOT = 7.5 Mbps, SIT = 35.625 MbpsDESIGN(174): Site Router is located at X = 54.12, Y = 10459.9, Z = 45.1router(13): ip, 150000 pps, 5 ports, $11000GT(6) is connected to port 1GT(7) is connected to port 2LINK(2) is connected to port 3GROUP(6) has 7 client tasks, GLT = 4.2 Mbps, GOT = 7.7 Mbps, GIT = 16.625 MbpsDESIGN(174): GNC is located at X = 15.4, Y = 10430.7, Z = 45.1switch(12): atm, 75000000 bps, 10 ports, $8000CT(51) is connected to port 1...CT(57) is connected to port 7ST(4) is connected to port 8GROUP(7) has 8 client tasks, GLT = 5.6 Mbps, GOT = 4 Mbps, GIT = 23.2 MbpsDESIGN(174): GNC is located at X = 88, Y = 10485.4, Z = 45.1switch(17): atm, 100000000 bps, 10 ports, $11000CT(58) is connected to port 1...CT(65) is connected to port 8ST(4) is connected to port 9Enter the generation number from 0-2999:
� The output of i -CAD for a 3-level network design, including a wide tree back-bone topology, for the partial animation sutdio, when TND = 20.0 seconds.
Enter the generation number from 0-2999:402Intranet infrastructure(186) is the best design in generation 402:initial cost = $166000, monthly cost = $180000interconnection cost = $28000, wire cost = $5953.31average network delay = 19.867 seconds, homogeneity factor = 0.4BACKBONE(1) has 4 site tasks, BLT = 93.125 MbpsLink(1) connects sites: 1 and 3sonet(oc2): 103680000 bps, initial cost $20000 and monthly cost $6000Link(2) connects sites: 3 and 4sonet(oc2): 103680000 bps, initial cost $20000 and monthly cost $6000Link(3) connects sites: 4 and 2sonet(oc1): 51840000 bps, initial cost $10000 and monthly cost $3000SITE(1) has 2 group tasks, SLT = 0 Mbps, SOT = 55.625 Mbps, SIT = 2.5 MbpsDESIGN(186): Site Switch is located at X = 83236.4, Y = 20863, Z = 1.1switch(11): atm, 75000000 bps, 5 ports, $5000GT(1) is connected to port 1GT(4) is connected to port 2LINK(1) is connected to port 3GROUP(1) has 10 client tasks, GLT = 27 Mbps, GOT = 7.5 Mbps, GIT = 0 Mbps
195

DESIGN(186): GNC is located at X = 83209.7, Y = 20849.6, Z = 1.1switch(8): atm, 45000000 bps, 15 ports, $9000CT(1) is connected to port 1...CT(10) is connected to port 10ST(1) is connected to port 11GROUP(4) has 5 client tasks, GLT = 8 Mbps, GOT = 48.125 Mbps, GIT = 2.5 MbpsDESIGN(186): GNC is located at X = 83289.8, Y = 20889.8, Z = 1.1multiaccess(15): ethernet, 100000000 bps, 6 ports, $8000CT(11) is connected to port 1...CT(15) is connected to port 5ST(1) is connected to port 6SITE(2) has 2 group tasks, SLT = 0 Mbps, SOT = 15 Mbps, SIT = 21.25 MbpsDESIGN(186): Site Router is located at X = 114450, Y = 56.3333, Z = 16.1router(10): ip, 100000 pps, 10 ports, $11000GT(2) is connected to port 1GT(5) is connected to port 2LINK(3) is connected to port 3GROUP(2) has 5 client tasks, GLT = 2 Mbps, GOT = 2.5 Mbps, GIT = 2.5 MbpsDESIGN(186): GNC is located at X = 114409, Y = 89, Z = 16.1multiaccess(15): ethernet, 100000000 bps, 6 ports, $8000CT(16) is connected to port 1...CT(20) is connected to port 5ST(2) is connected to port 6GROUP(5) has 10 client tasks, GLT = 9 Mbps, GOT = 12.5 Mbps, GIT = 18.75 MbpsDESIGN(186): GNC is located at X = 114470, Y = 40, Z = 16.1multiaccess(18): ethernet, 100000000 bps, 12 ports, $13000CT(21) is connected to port 1...CT(30) is connected to port 10ST(2) is connected to port 11SITE(3) has 2 group tasks, SLT = 0 Mbps, SOT = 15 Mbps, SIT = 33.75 MbpsDESIGN(186): Site Router is located at X = 52052.4, Y = 10450, Z = 32.1router(10): ip, 100000 pps, 10 ports, $11000GT(3) is connected to port 1GT(8) is connected to port 2LINK(1) is connected to port 3LINK(2) is connected to port 4GROUP(3) has 10 client tasks, GLT = 9 Mbps, GOT = 15 Mbps, GIT = 7.5 MbpsDESIGN(186): GNC is located at X = 52027.5, Y = 10485, Z = 32.1switch(13): atm, 75000000 bps, 15 ports, $11000CT(31) is connected to port 1...CT(40) is connected to port 10ST(3) is connected to port 11GROUP(8) has 10 client tasks, GLT = 9 Mbps, GOT = 0 Mbps, GIT = 26.25 Mbps
196
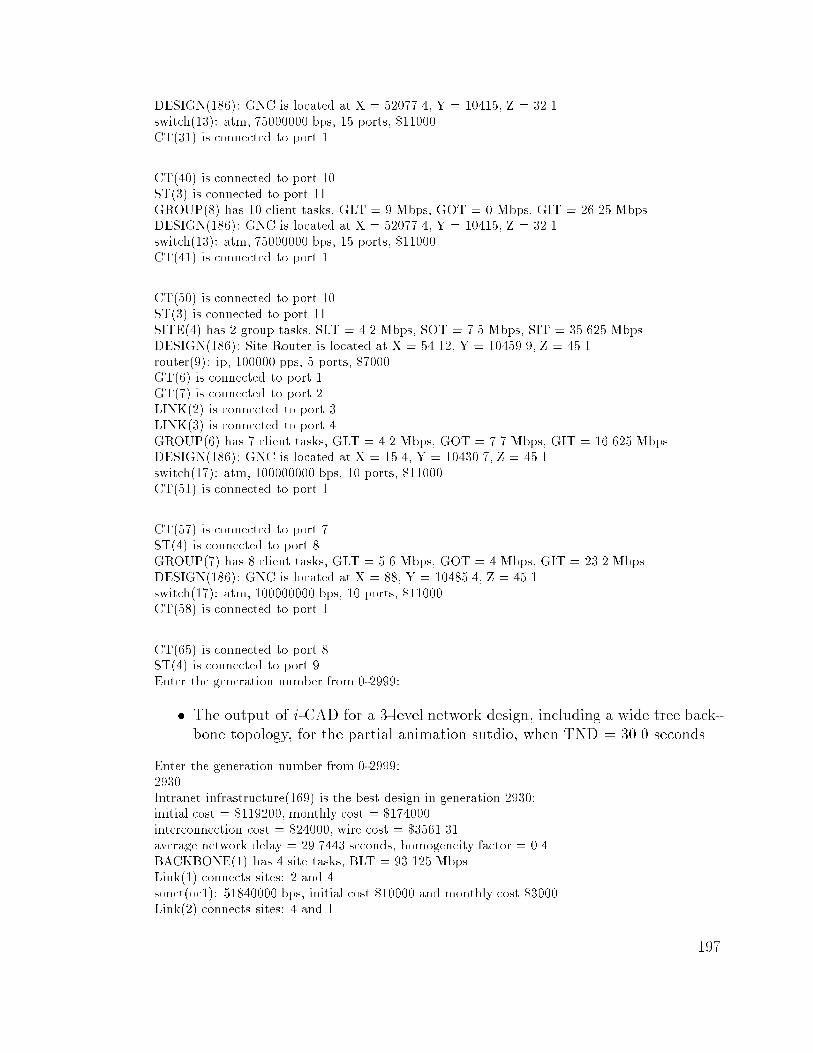
DESIGN(186): GNC is located at X = 52077.4, Y = 10415, Z = 32.1switch(13): atm, 75000000 bps, 15 ports, $11000CT(31) is connected to port 1...CT(40) is connected to port 10ST(3) is connected to port 11GROUP(8) has 10 client tasks, GLT = 9 Mbps, GOT = 0 Mbps, GIT = 26.25 MbpsDESIGN(186): GNC is located at X = 52077.4, Y = 10415, Z = 32.1switch(13): atm, 75000000 bps, 15 ports, $11000CT(41) is connected to port 1...CT(50) is connected to port 10ST(3) is connected to port 11SITE(4) has 2 group tasks, SLT = 4.2 Mbps, SOT = 7.5 Mbps, SIT = 35.625 MbpsDESIGN(186): Site Router is located at X = 54.12, Y = 10459.9, Z = 45.1router(9): ip, 100000 pps, 5 ports, $7000GT(6) is connected to port 1GT(7) is connected to port 2LINK(2) is connected to port 3LINK(3) is connected to port 4GROUP(6) has 7 client tasks, GLT = 4.2 Mbps, GOT = 7.7 Mbps, GIT = 16.625 MbpsDESIGN(186): GNC is located at X = 15.4, Y = 10430.7, Z = 45.1switch(17): atm, 100000000 bps, 10 ports, $11000CT(51) is connected to port 1...CT(57) is connected to port 7ST(4) is connected to port 8GROUP(7) has 8 client tasks, GLT = 5.6 Mbps, GOT = 4 Mbps, GIT = 23.2 MbpsDESIGN(186): GNC is located at X = 88, Y = 10485.4, Z = 45.1switch(17): atm, 100000000 bps, 10 ports, $11000CT(58) is connected to port 1...CT(65) is connected to port 8ST(4) is connected to port 9Enter the generation number from 0-2999:
� The output of i -CAD for a 3-level network design, including a wide tree back-bone topology, for the partial animation sutdio, when TND = 30.0 seconds.
Enter the generation number from 0-2999:2930Intranet infrastructure(169) is the best design in generation 2930:initial cost = $119200, monthly cost = $174000interconnection cost = $24000, wire cost = $3561.31average network delay = 29.7443 seconds, homogeneity factor = 0.4BACKBONE(1) has 4 site tasks, BLT = 93.125 MbpsLink(1) connects sites: 2 and 4sonet(oc1): 51840000 bps, initial cost $10000 and monthly cost $3000Link(2) connects sites: 4 and 1
197

sonet(oc2): 103680000 bps, initial cost $20000 and monthly cost $6000Link(3) connects sites: 1 and 3sonet(vpc14-oc3/sonetsonet): 77760000 bps, initial cost $15000 and monthly cost $5500SITE(1) has 2 group tasks, SLT = 0 Mbps, SOT = 55.625 Mbps, SIT = 2.5 MbpsDESIGN(169): Site Router is located at X = 83236.4, Y = 20863, Z = 1.1router(5): ip, 50000 pps, 5 ports, $3000GT(1) is connected to port 1GT(4) is connected to port 2LINK(2) is connected to port 3LINK(3) is connected to port 4GROUP(1) has 10 client tasks, GLT = 27 Mbps, GOT = 7.5 Mbps, GIT = 0 MbpsDESIGN(169): GNC is located at X = 83209.7, Y = 20849.6, Z = 1.1switch(8): atm, 45000000 bps, 15 ports, $9000CT(1) is connected to port 1...CT(10) is connected to port 10ST(1) is connected to port 11GROUP(4) has 5 client tasks, GLT = 8 Mbps, GOT = 48.125 Mbps, GIT = 2.5 MbpsDESIGN(169): GNC is located at X = 83289.8, Y = 20889.8, Z = 1.1multiaccess(15): ethernet, 100000000 bps, 6 ports, $8000CT(11) is connected to port 1...CT(15) is connected to port 5ST(1) is connected to port 6SITE(2) has 2 group tasks, SLT = 0 Mbps, SOT = 15 Mbps, SIT = 21.25 MbpsDESIGN(169): Site Router is located at X = 114450, Y = 56.3333, Z = 16.1router(5): ip, 50000 pps, 5 ports, $3000GT(2) is connected to port 1GT(5) is connected to port 2LINK(1) is connected to port 3GROUP(2) has 5 client tasks, GLT = 2 Mbps, GOT = 2.5 Mbps, GIT = 2.5 MbpsDESIGN(169): GNC is located at X = 114409, Y = 89, Z = 16.1multiaccess(3): ethernet, 10000000 bps, 6 ports, $200CT(16) is connected to port 1...CT(20) is connected to port 5ST(2) is connected to port 6GROUP(5) has 10 client tasks, GLT = 9 Mbps, GOT = 12.5 Mbps, GIT = 18.75 MbpsDESIGN(169): GNC is located at X = 114470, Y = 40, Z = 16.1switch(13): atm, 75000000 bps, 15 ports, $11000CT(21) is connected to port 1...CT(30) is connected to port 10ST(2) is connected to port 11SITE(3) has 2 group tasks, SLT = 0 Mbps, SOT = 15 Mbps, SIT = 33.75 MbpsDESIGN(169): Site Router is located at X = 52052.4, Y = 10450, Z = 32.1router(5): ip, 50000 pps, 5 ports, $3000GT(3) is connected to port 1GT(8) is connected to port 2
198
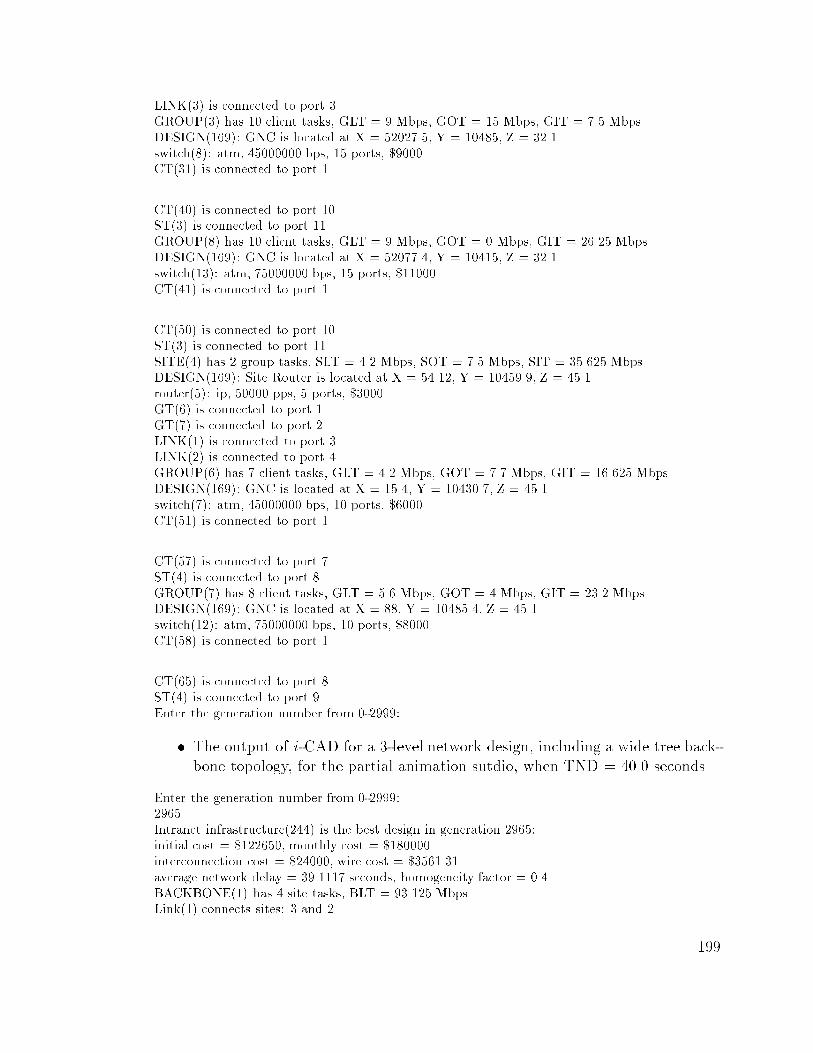
LINK(3) is connected to port 3GROUP(3) has 10 client tasks, GLT = 9 Mbps, GOT = 15 Mbps, GIT = 7.5 MbpsDESIGN(169): GNC is located at X = 52027.5, Y = 10485, Z = 32.1switch(8): atm, 45000000 bps, 15 ports, $9000CT(31) is connected to port 1...CT(40) is connected to port 10ST(3) is connected to port 11GROUP(8) has 10 client tasks, GLT = 9 Mbps, GOT = 0 Mbps, GIT = 26.25 MbpsDESIGN(169): GNC is located at X = 52077.4, Y = 10415, Z = 32.1switch(13): atm, 75000000 bps, 15 ports, $11000CT(41) is connected to port 1...CT(50) is connected to port 10ST(3) is connected to port 11SITE(4) has 2 group tasks, SLT = 4.2 Mbps, SOT = 7.5 Mbps, SIT = 35.625 MbpsDESIGN(169): Site Router is located at X = 54.12, Y = 10459.9, Z = 45.1router(5): ip, 50000 pps, 5 ports, $3000GT(6) is connected to port 1GT(7) is connected to port 2LINK(1) is connected to port 3LINK(2) is connected to port 4GROUP(6) has 7 client tasks, GLT = 4.2 Mbps, GOT = 7.7 Mbps, GIT = 16.625 MbpsDESIGN(169): GNC is located at X = 15.4, Y = 10430.7, Z = 45.1switch(7): atm, 45000000 bps, 10 ports, $6000CT(51) is connected to port 1...CT(57) is connected to port 7ST(4) is connected to port 8GROUP(7) has 8 client tasks, GLT = 5.6 Mbps, GOT = 4 Mbps, GIT = 23.2 MbpsDESIGN(169): GNC is located at X = 88, Y = 10485.4, Z = 45.1switch(12): atm, 75000000 bps, 10 ports, $8000CT(58) is connected to port 1...CT(65) is connected to port 8ST(4) is connected to port 9Enter the generation number from 0-2999:
� The output of i -CAD for a 3-level network design, including a wide tree back-bone topology, for the partial animation sutdio, when TND = 40.0 seconds.
Enter the generation number from 0-2999:2965Intranet infrastructure(244) is the best design in generation 2965:initial cost = $122650, monthly cost = $180000interconnection cost = $24000, wire cost = $3561.31average network delay = 39.1117 seconds, homogeneity factor = 0.4BACKBONE(1) has 4 site tasks, BLT = 93.125 MbpsLink(1) connects sites: 3 and 2
199

sonet(oc2): 103680000 bps, initial cost $20000 and monthly cost $6000Link(2) connects sites: 2 and 4sonet(oc1): 51840000 bps, initial cost $10000 and monthly cost $3000Link(3) connects sites: 3 and 1sonet(oc2): 103680000 bps, initial cost $20000 and monthly cost $6000SITE(1) has 2 group tasks, SLT = 0 Mbps, SOT = 55.625 Mbps, SIT = 2.5 MbpsDESIGN(244): Site Router is located at X = 83236.4, Y = 20863, Z = 1.1router(5): ip, 50000 pps, 5 ports, $3000GT(1) is connected to port 1GT(4) is connected to port 2LINK(3) is connected to port 3GROUP(1) has 10 client tasks, GLT = 27 Mbps, GOT = 7.5 Mbps, GIT = 0 MbpsDESIGN(244): GNC is located at X = 83209.7, Y = 20849.6, Z = 1.1switch(8): atm, 45000000 bps, 15 ports, $9000CT(1) is connected to port 1...CT(10) is connected to port 10ST(1) is connected to port 11GROUP(4) has 5 client tasks, GLT = 8 Mbps, GOT = 48.125 Mbps, GIT = 2.5 MbpsDESIGN(244): GNC is located at X = 83289.8, Y = 20889.8, Z = 1.1multiaccess(15): ethernet, 100000000 bps, 6 ports, $8000CT(11) is connected to port 1...CT(15) is connected to port 5ST(1) is connected to port 6SITE(2) has 2 group tasks, SLT = 0 Mbps, SOT = 15 Mbps, SIT = 21.25 MbpsDESIGN(244): Site Router is located at X = 114450, Y = 56.3333, Z = 16.1router(5): ip, 50000 pps, 5 ports, $3000GT(2) is connected to port 1GT(5) is connected to port 2LINK(1) is connected to port 3LINK(2) is connected to port 4GROUP(2) has 5 client tasks, GLT = 2 Mbps, GOT = 2.5 Mbps, GIT = 2.5 MbpsDESIGN(244): GNC is located at X = 114409, Y = 89, Z = 16.1multiaccess(7): ethernet, 10000000 bps, 14 ports, $650CT(16) is connected to port 1...CT(20) is connected to port 5ST(2) is connected to port 6GROUP(5) has 10 client tasks, GLT = 9 Mbps, GOT = 12.5 Mbps, GIT = 18.75 MbpsDESIGN(244): GNC is located at X = 114470, Y = 40, Z = 16.1switch(8): atm, 45000000 bps, 15 ports, $9000CT(21) is connected to port 1...CT(30) is connected to port 10ST(2) is connected to port 11SITE(3) has 2 group tasks, SLT = 0 Mbps, SOT = 15 Mbps, SIT = 33.75 MbpsDESIGN(244): Site Router is located at X = 52052.4, Y = 10450, Z = 32.1router(5): ip, 50000 pps, 5 ports, $3000
200

GT(3) is connected to port 1GT(8) is connected to port 2LINK(1) is connected to port 3LINK(3) is connected to port 4GROUP(3) has 10 client tasks, GLT = 9 Mbps, GOT = 15 Mbps, GIT = 7.5 MbpsDESIGN(244): GNC is located at X = 52027.5, Y = 10485, Z = 32.1switch(8): atm, 45000000 bps, 15 ports, $9000CT(31) is connected to port 1...CT(40) is connected to port 10ST(3) is connected to port 11GROUP(8) has 10 client tasks, GLT = 9 Mbps, GOT = 0 Mbps, GIT = 26.25 MbpsDESIGN(244): GNC is located at X = 52077.4, Y = 10415, Z = 32.1switch(13): atm, 75000000 bps, 15 ports, $11000CT(41) is connected to port 1...CT(50) is connected to port 10ST(3) is connected to port 11SITE(4) has 2 group tasks, SLT = 4.2 Mbps, SOT = 7.5 Mbps, SIT = 35.625 MbpsDESIGN(244): Site Router is located at X = 54.12, Y = 10459.9, Z = 45.1router(5): ip, 50000 pps, 5 ports, $3000GT(6) is connected to port 1GT(7) is connected to port 2LINK(2) is connected to port 3GROUP(6) has 7 client tasks, GLT = 4.2 Mbps, GOT = 7.7 Mbps, GIT = 16.625 MbpsDESIGN(244): GNC is located at X = 15.4, Y = 10430.7, Z = 45.1switch(7): atm, 45000000 bps, 10 ports, $6000CT(51) is connected to port 1...CT(57) is connected to port 7ST(4) is connected to port 8GROUP(7) has 8 client tasks, GLT = 5.6 Mbps, GOT = 4 Mbps, GIT = 23.2 MbpsDESIGN(244): GNC is located at X = 88, Y = 10485.4, Z = 45.1switch(12): atm, 75000000 bps, 10 ports, $8000CT(58) is connected to port 1...CT(65) is connected to port 8ST(4) is connected to port 9Enter the generation number from 0-2999:
� The output of i -CAD for a 3-level network design, including a wide tree back-bone topology, for the partial animation sutdio, when TND = 50.0 seconds.
Enter the generation number from 0-2999:2135Intranet infrastructure(53) is the best design in generation 2135:initial cost = $123320, monthly cost = $180000interconnection cost = $24000, wire cost = $3561.31average network delay = 41.023 seconds, homogeneity factor = 0.4
201

BACKBONE(1) has 4 site tasks, BLT = 93.125 MbpsLink(1) connects sites: 1 and 3sonet(oc2): 103680000 bps, initial cost $20000 and monthly cost $6000Link(2) connects sites: 3 and 2sonet(oc2): 103680000 bps, initial cost $20000 and monthly cost $6000Link(3) connects sites: 2 and 4sonet(oc1): 51840000 bps, initial cost $10000 and monthly cost $3000SITE(1) has 2 group tasks, SLT = 0 Mbps, SOT = 55.625 Mbps, SIT = 2.5 MbpsDESIGN(53): Site Router is located at X = 83236.4, Y = 20863, Z = 1.1router(5): ip, 50000 pps, 5 ports, $3000GT(1) is connected to port 1GT(4) is connected to port 2LINK(1) is connected to port 3GROUP(1) has 10 client tasks, GLT = 27 Mbps, GOT = 7.5 Mbps, GIT = 0 MbpsDESIGN(53): GNC is located at X = 83209.7, Y = 20849.6, Z = 1.1switch(8): atm, 45000000 bps, 15 ports, $9000CT(1) is connected to port 1...CT(10) is connected to port 10ST(1) is connected to port 11GROUP(4) has 5 client tasks, GLT = 8 Mbps, GOT = 48.125 Mbps, GIT = 2.5 MbpsDESIGN(53): GNC is located at X = 83289.8, Y = 20889.8, Z = 1.1multiaccess(15): ethernet, 100000000 bps, 6 ports, $8000CT(11) is connected to port 1...CT(15) is connected to port 5ST(1) is connected to port 6SITE(2) has 2 group tasks, SLT = 0 Mbps, SOT = 15 Mbps, SIT = 21.25 MbpsDESIGN(53): Site Router is located at X = 114450, Y = 56.3333, Z = 16.1router(5): ip, 50000 pps, 5 ports, $3000GT(2) is connected to port 1GT(5) is connected to port 2LINK(2) is connected to port 3LINK(3) is connected to port 4GROUP(2) has 5 client tasks, GLT = 2 Mbps, GOT = 2.5 Mbps, GIT = 2.5 MbpsDESIGN(53): GNC is located at X = 114409, Y = 89, Z = 16.1multiaccess(4): ethernet, 10000000 bps, 8 ports, $320CT(16) is connected to port 1...CT(20) is connected to port 5ST(2) is connected to port 6GROUP(5) has 10 client tasks, GLT = 9 Mbps, GOT = 12.5 Mbps, GIT = 18.75 MbpsDESIGN(53): GNC is located at X = 114470, Y = 40, Z = 16.1switch(8): atm, 45000000 bps, 15 ports, $9000CT(21) is connected to port 1...CT(30) is connected to port 10ST(2) is connected to port 11SITE(3) has 2 group tasks, SLT = 0 Mbps, SOT = 15 Mbps, SIT = 33.75 Mbps
202

DESIGN(53): Site Router is located at X = 52052.4, Y = 10450, Z = 32.1router(5): ip, 50000 pps, 5 ports, $3000GT(3) is connected to port 1GT(8) is connected to port 2LINK(1) is connected to port 3LINK(2) is connected to port 4GROUP(3) has 10 client tasks, GLT = 9 Mbps, GOT = 15 Mbps, GIT = 7.5 MbpsDESIGN(53): GNC is located at X = 52027.5, Y = 10485, Z = 32.1switch(8): atm, 45000000 bps, 15 ports, $9000CT(31) is connected to port 1...CT(40) is connected to port 10ST(3) is connected to port 11GROUP(8) has 10 client tasks, GLT = 9 Mbps, GOT = 0 Mbps, GIT = 26.25 MbpsDESIGN(53): GNC is located at X = 52077.4, Y = 10415, Z = 32.1switch(13): atm, 75000000 bps, 15 ports, $11000CT(41) is connected to port 1...CT(50) is connected to port 10ST(3) is connected to port 11SITE(4) has 2 group tasks, SLT = 4.2 Mbps, SOT = 7.5 Mbps, SIT = 35.625 MbpsDESIGN(53): Site Router is located at X = 54.12, Y = 10459.9, Z = 45.1router(6): ip, 50000 pps, 10 ports, $6000GT(6) is connected to port 1GT(7) is connected to port 2LINK(3) is connected to port 3GROUP(6) has 7 client tasks, GLT = 4.2 Mbps, GOT = 7.7 Mbps, GIT = 16.625 MbpsDESIGN(53): GNC is located at X = 15.4, Y = 10430.7, Z = 45.1switch(7): atm, 45000000 bps, 10 ports, $6000CT(51) is connected to port 1...CT(57) is connected to port 7ST(4) is connected to port 8GROUP(7) has 8 client tasks, GLT = 5.6 Mbps, GOT = 4 Mbps, GIT = 23.2 MbpsDESIGN(53): GNC is located at X = 88, Y = 10485.4, Z = 45.1switch(7): atm, 45000000 bps, 10 ports, $6000CT(58) is connected to port 1...CT(65) is connected to port 8ST(4) is connected to port 9Enter the generation number from 0-2999:
� The output of i -CAD for a 3-level network design, including a wide tree back-bone topology, for the partial animation sutdio, when TND = 60.0 seconds.
Enter the generation number from 0-2999:2540Intranet infrastructure(172) is the best design in generation 2540:initial cost = $110900, monthly cost = $132000
203

interconnection cost = $26000, wire cost = $3561.31average network delay = 48.8868 seconds, homogeneity factor = 0.533333BACKBONE(1) has 4 site tasks, BLT = 93.125 MbpsLink(1) connects sites: 3 and 2sonet(vpc13-oc3/sonetsonet): 38880000 bps, initial cost $7500 and monthly cost $2500Link(2) connects sites: 3 and 4sonet(oc1): 51840000 bps, initial cost $10000 and monthly cost $3000Link(3) connects sites: 3 and 1sonet(vpc14-oc3/sonetsonet): 77760000 bps, initial cost $15000 and monthly cost $5500SITE(1) has 2 group tasks, SLT = 0 Mbps, SOT = 55.625 Mbps, SIT = 2.5 MbpsDESIGN(172): Site Switch is located at X = 83236.4, Y = 20863, Z = 1.1switch(11): atm, 75000000 bps, 5 ports, $5000GT(1) is connected to port 1GT(4) is connected to port 2LINK(3) is connected to port 3GROUP(1) has 10 client tasks, GLT = 27 Mbps, GOT = 7.5 Mbps, GIT = 0 MbpsDESIGN(172): GNC is located at X = 83209.7, Y = 20849.6, Z = 1.1switch(8): atm, 45000000 bps, 15 ports, $9000CT(1) is connected to port 1...CT(10) is connected to port 10ST(1) is connected to port 11GROUP(4) has 5 client tasks, GLT = 8 Mbps, GOT = 48.125 Mbps, GIT = 2.5 MbpsDESIGN(172): GNC is located at X = 83289.8, Y = 20889.8, Z = 1.1switch(12): atm, 75000000 bps, 10 ports, $8000CT(11) is connected to port 1...CT(15) is connected to port 5ST(1) is connected to port 6SITE(2) has 2 group tasks, SLT = 0 Mbps, SOT = 15 Mbps, SIT = 21.25 MbpsDESIGN(172): Site Router is located at X = 114450, Y = 56.3333, Z = 16.1router(5): ip, 50000 pps, 5 ports, $3000GT(2) is connected to port 1GT(5) is connected to port 2LINK(1) is connected to port 3GROUP(2) has 5 client tasks, GLT = 2 Mbps, GOT = 2.5 Mbps, GIT = 2.5 MbpsDESIGN(172): GNC is located at X = 114409, Y = 89, Z = 16.1multiaccess(6): ethernet, 10000000 bps, 12 ports, $400CT(16) is connected to port 1...CT(20) is connected to port 5ST(2) is connected to port 6GROUP(5) has 10 client tasks, GLT = 9 Mbps, GOT = 12.5 Mbps, GIT = 18.75 MbpsDESIGN(172): GNC is located at X = 114470, Y = 40, Z = 16.1switch(13): atm, 75000000 bps, 15 ports, $11000CT(21) is connected to port 1...CT(30) is connected to port 10ST(2) is connected to port 11
204

SITE(3) has 2 group tasks, SLT = 0 Mbps, SOT = 15 Mbps, SIT = 33.75 MbpsDESIGN(172): Site Router is located at X = 52052.4, Y = 10450, Z = 32.1router(9): ip, 100000 pps, 5 ports, $7000GT(3) is connected to port 1GT(8) is connected to port 2LINK(1) is connected to port 3LINK(2) is connected to port 4LINK(3) is connected to port 5GROUP(3) has 10 client tasks, GLT = 9 Mbps, GOT = 15 Mbps, GIT = 7.5 MbpsDESIGN(172): GNC is located at X = 52027.5, Y = 10485, Z = 32.1switch(13): atm, 75000000 bps, 15 ports, $11000CT(31) is connected to port 1...CT(40) is connected to port 10ST(3) is connected to port 11GROUP(8) has 10 client tasks, GLT = 9 Mbps, GOT = 0 Mbps, GIT = 26.25 MbpsDESIGN(172): GNC is located at X = 52077.4, Y = 10415, Z = 32.1switch(8): atm, 45000000 bps, 15 ports, $9000CT(41) is connected to port 1...CT(50) is connected to port 10ST(3) is connected to port 11SITE(4) has 2 group tasks, SLT = 4.2 Mbps, SOT = 7.5 Mbps, SIT = 35.625 MbpsDESIGN(172): Site Router is located at X = 54.12, Y = 10459.9, Z = 45.1router(5): ip, 50000 pps, 5 ports, $3000GT(6) is connected to port 1GT(7) is connected to port 2LINK(2) is connected to port 3GROUP(6) has 7 client tasks, GLT = 4.2 Mbps, GOT = 7.7 Mbps, GIT = 16.625 MbpsDESIGN(172): GNC is located at X = 15.4, Y = 10430.7, Z = 45.1switch(7): atm, 45000000 bps, 10 ports, $6000CT(51) is connected to port 1...CT(57) is connected to port 7ST(4) is connected to port 8GROUP(7) has 8 client tasks, GLT = 5.6 Mbps, GOT = 4 Mbps, GIT = 23.2 MbpsDESIGN(172): GNC is located at X = 88, Y = 10485.4, Z = 45.1switch(7): atm, 45000000 bps, 10 ports, $6000CT(58) is connected to port 1...CT(65) is connected to port 8ST(4) is connected to port 9Enter the generation number from 0-2999:
205
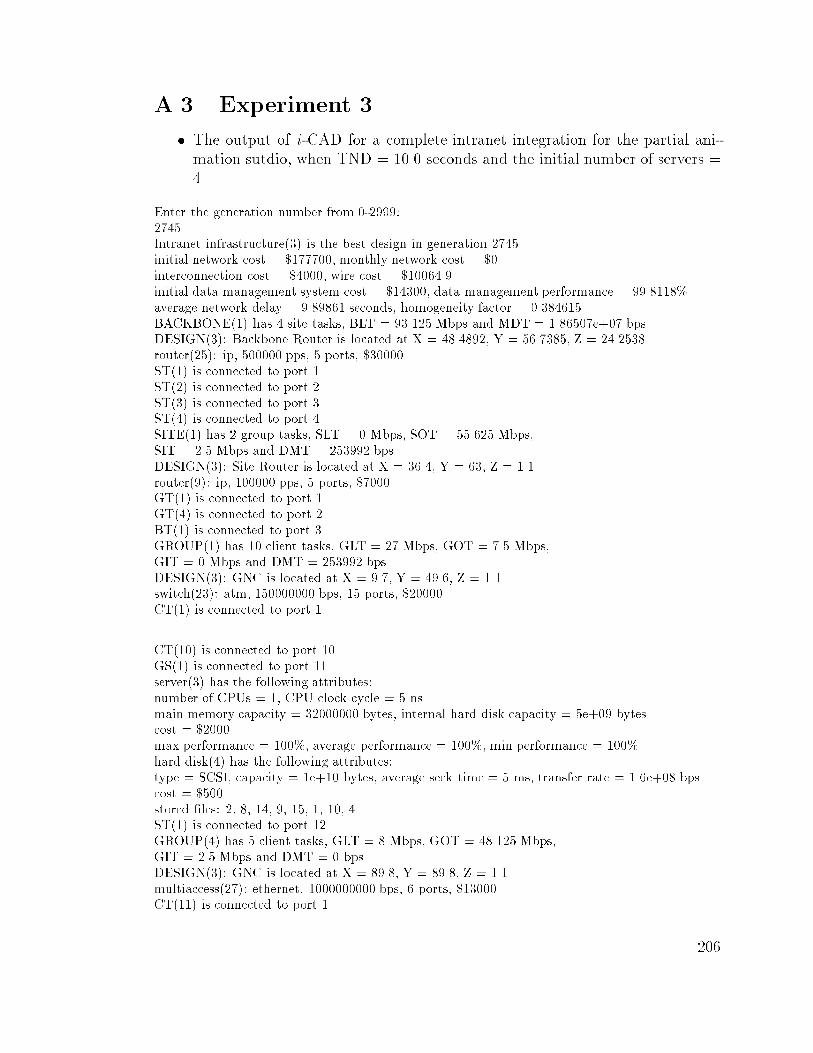
A.3 Experiment 3
� The output of i -CAD for a complete intranet integration for the partial ani-mation sutdio, when TND = 10.0 seconds and the initial number of servers =4.
Enter the generation number from 0-2999:2745Intranet infrastructure(3) is the best design in generation 2745initial network cost = $177700, monthly network cost = $0interconnection cost = $4000, wire cost = $10064.9initial data management system cost = $14300, data management performance = 99.8118%average network delay = 9.89861 seconds, homogeneity factor = 0.384615BACKBONE(1) has 4 site tasks, BLT = 93.125 Mbps and MDT = 1.86507e+07 bpsDESIGN(3): Backbone Router is located at X = 48.4892, Y = 56.7385, Z = 24.2538router(25): ip, 500000 pps, 5 ports, $30000ST(1) is connected to port 1ST(2) is connected to port 2ST(3) is connected to port 3ST(4) is connected to port 4SITE(1) has 2 group tasks, SLT = 0 Mbps, SOT = 55.625 Mbps,SIT = 2.5 Mbps and DMT = 253992 bpsDESIGN(3): Site Router is located at X = 36.4, Y = 63, Z = 1.1router(9): ip, 100000 pps, 5 ports, $7000GT(1) is connected to port 1GT(4) is connected to port 2BT(1) is connected to port 3GROUP(1) has 10 client tasks, GLT = 27 Mbps, GOT = 7.5 Mbps,GIT = 0 Mbps and DMT = 253992 bpsDESIGN(3): GNC is located at X = 9.7, Y = 49.6, Z = 1.1switch(23): atm, 150000000 bps, 15 ports, $20000CT(1) is connected to port 1...CT(10) is connected to port 10GS(1) is connected to port 11server(3) has the following attributes:number of CPUs = 1, CPU clock cycle = 5 nsmain memory capacity = 32000000 bytes, internal hard disk capacity = 5e+09 bytescost = $2000max performance = 100%, average performance = 100%, min performance = 100%hard disk(4) has the following attributes:type = SCSI, capacity = 1e+10 bytes, average seek time = 5 ms, transfer rate = 1.6e+08 bpscost = $500stored �les: 2, 8, 14, 9, 15, 1, 10, 4.ST(1) is connected to port 12GROUP(4) has 5 client tasks, GLT = 8 Mbps, GOT = 48.125 Mbps,GIT = 2.5 Mbps and DMT = 0 bpsDESIGN(3): GNC is located at X = 89.8, Y = 89.8, Z = 1.1multiaccess(27): ethernet, 1000000000 bps, 6 ports, $13000CT(11) is connected to port 1
206

...CT(15) is connected to port 5ST(1) is connected to port 6SITE(2) has 2 group tasks, SLT = 0 Mbps, SOT = 15 Mbps,SIT = 21.25 Mbps and DMT = 1.86507e+07 bpsDESIGN(3): Site Multiaccess device is located at X = 49.6667, Y = 56.3333, Z = 16.1multiaccess(14): ethernet, 100000000 bps, 4 ports, $6000GT(2) is connected to site task port 1 via a 2-port bridge with following attributes:Bridge(15), has capacity 100000 frames per second and cost $300GT(5) is connected to port 2BT(1) is connected to port 3GROUP(2) has 5 client tasks, GLT = 2 Mbps, GOT = 2.5 Mbps,GIT = 2.5 Mbps and DMT = 1.8455e+07 bpsDESIGN(3): GNC is located at X = 9.2, Y = 89, Z = 16.1multiaccess(19): ethernet, 100000000 bps, 14 ports, $16000CT(16) is connected to port 1...CT(20) is connected to port 5GS(2) is connected to port 6server(6) has the following attributes:number of CPUs = 1, CPU clock cycle = 2 nsmain memory capacity = 64000000 bytes, internal hard disk capacity = 1e+10 bytescost = $4000max performance = 100%, average performance = 99.5918%, min performance = 98.9796%hard disk(7) has the following attributes:type = IDE, capacity = 2e+10 bytes, average seek time = 10 ms, transfer rate = 6.6e+07 bpscost = $1500stored �les: 11, 2, 8, 9, 15, 13, 1, 6, 4, 5.ST(2) is connected to port 7GROUP(5) has 10 client tasks, GLT = 9 Mbps, GOT = 12.5 Mbps,GIT = 18.75 Mbps and DMT = 0 bpsDESIGN(3): GNC is located at X = 69.9, Y = 40, Z = 16.1switch(18): atm, 100000000 bps, 15 ports, $15000CT(21) is connected to port 1...CT(30) is connected to port 10ST(2) is connected to port 11SITE(3) has 2 group tasks, SLT = 0 Mbps, SOT = 15 Mbps,SIT = 33.75 Mbps and DMT = 1.39111e+07 bpsDESIGN(3): Site Router is located at X = 52.45, Y = 50, Z = 32.1router(13): ip, 150000 pps, 5 ports, $11000GT(3) is connected to port 1GT(8) is connected to port 2BT(1) is connected to port 3GROUP(3) has 10 client tasks, GLT = 9 Mbps, GOT = 15 Mbps,GIT = 7.5 Mbps and DMT = 0 bpsDESIGN(3): GNC is located at X = 27.5, Y = 85, Z = 32.1switch(14): atm, 75000000 bps, 20 ports, $16000CT(31) is connected to port 1
207

...CT(40) is connected to port 10GS(3) is connected to port 11server(1) has the following attributes:number of CPUs = 1, CPU clock cycle = 5 nsmain memory capacity = 12000000 bytes, internal hard disk capacity = 1e+09 bytescost = $1000max performance = 100%, average performance = 100%, min performance = 100%hard disk(11) has the following attributes:type = IDE, capacity = 4e+10 bytes, average seek time = 10 ms, transfer rate = 6.6e+07 bpscost = $4000stored �les: 2, 8, 14, 9, 12, 13, 1, 10, 6, 4, 5.ST(3) is connected to port 12GROUP(8) has 10 client tasks, GLT = 9 Mbps, GOT = 0 Mbps,GIT = 26.25 Mbps and DMT = 0 bpsDESIGN(3): GNC is located at X = 77.4, Y = 15, Z = 32.1switch(13): atm, 75000000 bps, 15 ports, $11000CT(41) is connected to port 1...CT(50) is connected to port 10ST(3) is connected to port 11SITE(4) has 2 group tasks, SLT = 4.2 Mbps, SOT = 7.5 Mbps,SIT = 35.625 Mbps and DMT = 4.54384e+06 bpsDESIGN(3): Site Router is located at X = 54.12, Y = 59.8667, Z = 45.1router(10): ip, 100000 pps, 10 ports, $11000GT(6) is connected to port 1GT(7) is connected to port 2BT(1) is connected to port 3GROUP(6) has 7 client tasks, GLT = 4.2 Mbps, GOT = 7.7 Mbps,GIT = 16.625 Mbps and DMT = 0 bpsDESIGN(3): GNC is located at X = 15.4, Y = 30.7143, Z = 45.1switch(13): atm, 75000000 bps, 15 ports, $11000CT(51) is connected to port 1...CT(57) is connected to port 7GS(4) is connected to port 8server(1) has the following attributes:number of CPUs = 1, CPU clock cycle = 5 nsmain memory capacity = 12000000 bytes, internal hard disk capacity = 1e+09 bytescost = $1000max performance = 100%, average performance = 99.6552%, min performance = 98.2759%hard disk(3) has the following attributes:type = IDE, capacity = 1e+10 bytes, average seek time = 10 ms, transfer rate = 6.6e+07 bpscost = $300stored �les: 11, 3, 2, 8, 14, 9, 12, 15, 13, 6, 7.ST(4) is connected to port 9GROUP(7) has 8 client tasks, GLT = 5.6 Mbps, GOT = 4 Mbps,GIT = 23.2 Mbps and DMT = 0 bpsDESIGN(3): GNC is located at X = 88, Y = 85.375, Z = 45.1multiaccess(17): ethernet, 100000000 bps, 10 ports, $10400
208
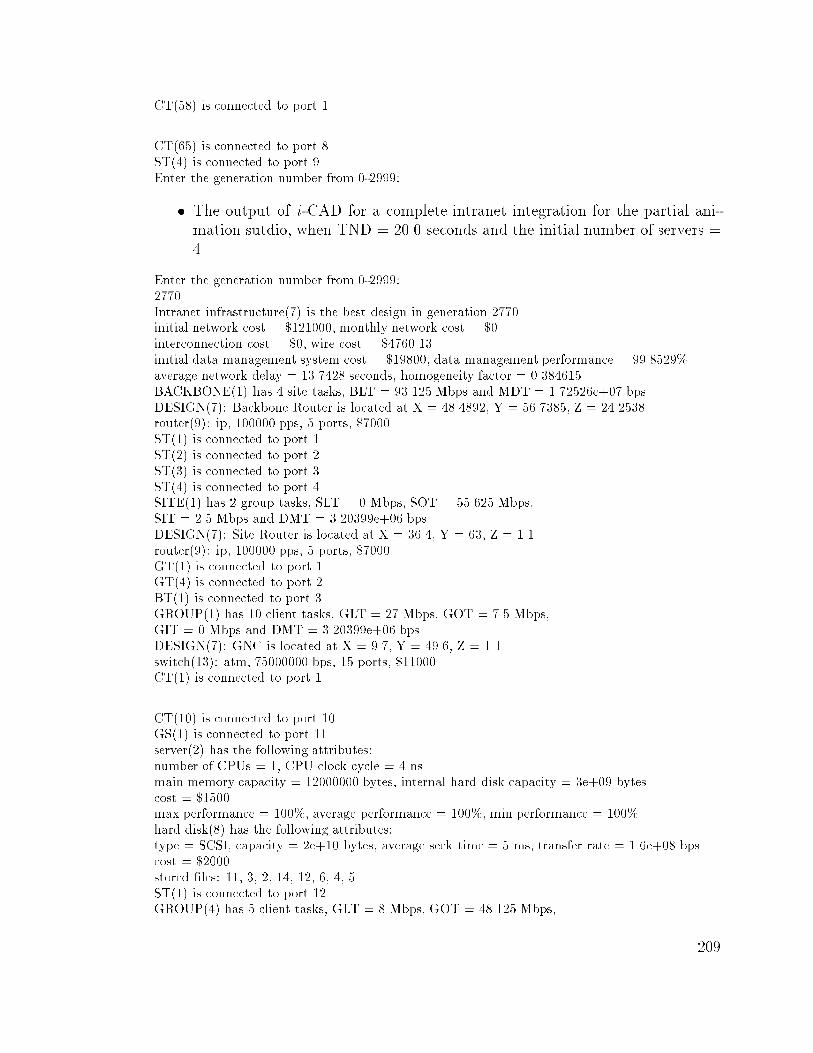
CT(58) is connected to port 1...CT(65) is connected to port 8ST(4) is connected to port 9Enter the generation number from 0-2999:
� The output of i -CAD for a complete intranet integration for the partial ani-mation sutdio, when TND = 20.0 seconds and the initial number of servers =4.
Enter the generation number from 0-2999:2770Intranet infrastructure(7) is the best design in generation 2770initial network cost = $121000, monthly network cost = $0interconnection cost = $0, wire cost = $4760.13initial data management system cost = $19800, data management performance = 99.8529%average network delay = 13.7428 seconds, homogeneity factor = 0.384615BACKBONE(1) has 4 site tasks, BLT = 93.125 Mbps and MDT = 1.72526e+07 bpsDESIGN(7): Backbone Router is located at X = 48.4892, Y = 56.7385, Z = 24.2538router(9): ip, 100000 pps, 5 ports, $7000ST(1) is connected to port 1ST(2) is connected to port 2ST(3) is connected to port 3ST(4) is connected to port 4SITE(1) has 2 group tasks, SLT = 0 Mbps, SOT = 55.625 Mbps,SIT = 2.5 Mbps and DMT = 3.20399e+06 bpsDESIGN(7): Site Router is located at X = 36.4, Y = 63, Z = 1.1router(9): ip, 100000 pps, 5 ports, $7000GT(1) is connected to port 1GT(4) is connected to port 2BT(1) is connected to port 3GROUP(1) has 10 client tasks, GLT = 27 Mbps, GOT = 7.5 Mbps,GIT = 0 Mbps and DMT = 3.20399e+06 bpsDESIGN(7): GNC is located at X = 9.7, Y = 49.6, Z = 1.1switch(13): atm, 75000000 bps, 15 ports, $11000CT(1) is connected to port 1...CT(10) is connected to port 10GS(1) is connected to port 11server(2) has the following attributes:number of CPUs = 1, CPU clock cycle = 4 nsmain memory capacity = 12000000 bytes, internal hard disk capacity = 3e+09 bytescost = $1500max performance = 100%, average performance = 100%, min performance = 100%hard disk(8) has the following attributes:type = SCSI, capacity = 2e+10 bytes, average seek time = 5 ms, transfer rate = 1.6e+08 bpscost = $2000stored �les: 11, 3, 2, 14, 12, 6, 4, 5.ST(1) is connected to port 12GROUP(4) has 5 client tasks, GLT = 8 Mbps, GOT = 48.125 Mbps,
209

GIT = 2.5 Mbps and DMT = 0 bpsDESIGN(7): GNC is located at X = 89.8, Y = 89.8, Z = 1.1multiaccess(15): ethernet, 100000000 bps, 6 ports, $8000CT(11) is connected to port 1...CT(15) is connected to port 5ST(1) is connected to port 6SITE(2) has 2 group tasks, SLT = 0 Mbps, SOT = 15 Mbps,SIT = 21.25 Mbps and DMT = 3.34147e+06 bpsDESIGN(7): Site Router is located at X = 49.6667, Y = 56.3333, Z = 16.1router(9): ip, 100000 pps, 5 ports, $7000GT(2) is connected to port 1GT(5) is connected to port 2BT(1) is connected to port 3GROUP(2) has 5 client tasks, GLT = 2 Mbps, GOT = 2.5 Mbps,GIT = 2.5 Mbps and DMT = 0 bpsDESIGN(7): GNC is located at X = 9.2, Y = 89, Z = 16.1switch(8): atm, 45000000 bps, 15 ports, $9000CT(16) is connected to port 1...CT(20) is connected to port 5ST(2) is connected to port 6GROUP(5) has 10 client tasks, GLT = 9 Mbps, GOT = 12.5 Mbps,GIT = 18.75 Mbps and DMT = 0 bpsDESIGN(7): GNC is located at X = 69.9, Y = 40, Z = 16.1switch(13): atm, 75000000 bps, 15 ports, $11000CT(21) is connected to port 1...CT(30) is connected to port 10ST(2) is connected to port 11SITE(3) has 2 group tasks, SLT = 0 Mbps, SOT = 15 Mbps,SIT = 33.75 Mbps and DMT = 1.39111e+07 bpsDESIGN(7): Site Router is located at X = 52.45, Y = 50, Z = 32.1router(9): ip, 100000 pps, 5 ports, $7000GT(3) is connected to port 1GT(8) is connected to port 2BT(1) is connected to port 3GROUP(3) has 10 client tasks, GLT = 9 Mbps, GOT = 15 Mbps,GIT = 7.5 Mbps and DMT = 0 bpsDESIGN(7): GNC is located at X = 27.5, Y = 85, Z = 32.1multiaccess(18): ethernet, 100000000 bps, 12 ports, $13000CT(31) is connected to port 1...CT(40) is connected to port 10GS(2) is connected to port 11server(1) has the following attributes:number of CPUs = 1, CPU clock cycle = 5 nsmain memory capacity = 12000000 bytes, internal hard disk capacity = 1e+09 bytescost = $1000
210

max performance = 100%, average performance = 100%, min performance = 100%hard disk(9) has the following attributes:type = IDE, capacity = 3e+10, average seek time = 10 ms, transfer rate = 6.6e+07 bpscost = $2000stored �les: 11, 3, 2, 8, 9, 12, 13, 1, 10, 5, 7.ST(3) is connected to port 12GROUP(8) has 10 client tasks, GLT = 9 Mbps, GOT = 0 Mbps,GIT = 26.25 Mbps and DMT = 0 bpsDESIGN(7): GNC is located at X = 77.4, Y = 15, Z = 32.1multiaccess(19): ethernet, 100000000 bps, 14 ports, $16000CT(41) is connected to port 1...CT(50) is connected to port 10ST(3) is connected to port 11SITE(4) has 2 group tasks, SLT = 4.2 Mbps, SOT = 7.5 Mbps,SIT = 35.625 Mbps and DMT = 1.41069e+07 bpsDESIGN(7): Site Router is located at X = 54.12, Y = 59.8667, Z = 45.1router(5): ip, 50000 pps, 5 ports, $3000GT(6) is connected to port 1GT(7) is connected to port 2BT(1) is connected to port 3GROUP(6) has 7 client tasks, GLT = 4.2 Mbps, GOT = 7.7 Mbps,GIT = 16.625 Mbps and DMT = 0 bpsDESIGN(7): GNC is located at X = 15.4, Y = 30.7143, Z = 45.1switch(7): atm, 45000000 bps, 10 ports, $6000CT(51) is connected to port 1...CT(57) is connected to port 7GS(3) is connected to port 8server(5) has the following attributes:number of CPUs = 1, CPU clock cycle = 4 nsmain memory capacity = 64000000 bytes, internal hard disk capacity = 1e+10 bytescost = $3000max performance = 100%, average performance = 100%, min performance = 100%hard disk(13) has the following attributes:type = IDE, capacity = 5e+10 bytes, average seek time = 10 ms, transfer rate = 6.6e+07 bpscost = $7000stored �les: 11, 3, 2, 14, 9, 12, 13, 1, 6, 5, 7.ST(4) is connected to port 9GROUP(7) has 8 client tasks, GLT = 5.6 Mbps, GOT = 4 Mbps,GIT = 23.2 Mbps and DMT = 1.41069e+07 bpsDESIGN(7): GNC is located at X = 88, Y = 85.375, Z = 45.1switch(14): atm, 75000000 bps, 20 ports, $16000CT(58) is connected to port 1...CT(65) is connected to port 8GS(4) is connected to port 9server(7) has the following attributes:number of CPUs = 2, CPU clock cycle = 3 ns
211

main memory capacity = 32000000 bytes, internal hard disk capacity = 1e+10 bytescost = $3000max performance = 100%, average performance = 99.4118%, min performance = 98.5294%hard disk(3) has the following attributes:type = IDE, capacity = 1e+10 bytes, average seek time = 10 ms, transfer rate = 6.6e+07 bpscost = $300stored �les: 11, 3, 2, 14, 15, 13, 1, 6, 4, 7.ST(4) is connected to port 10Enter the generation number from 0-2999:
� The output of i -CAD for a complete intranet integration for the partial ani-mation sutdio, when TND = 30.0 seconds and the initial number of servers =4.
Enter the generation number from 0-2999:2899Intranet infrastructure(20) is the best design in generation 2899initial network cost = $139620, monthly network cost = $0interconnection cost = $8000, wire cost = $5629.73initial data management system cost = $13500, data management performance = 99.5293%average network delay = 24.6313 seconds, homogeneity factor = 0.538462BACKBONE(1) has 4 site tasks, BLT = 93.125 Mbps and MDT = 2.51659e+07 bpsDESIGN(20): Backbone Router is located at X = 48.4892, Y = 56.7385, Z = 24.2538router(10): ip, 100000 pps, 10 ports, $11000ST(1) is connected to port 1ST(2) is connected to port 2ST(3) is connected to port 3ST(4) is connected to port 4SITE(1) has 2 group tasks, SLT = 0 Mbps, SOT = 55.625 Mbps,SIT = 2.5 Mbps and DMT = 1.41558e+07 bpsDESIGN(20): Site Switch is located at X = 36.4, Y = 63, Z = 1.1switch(17): atm, 100000000 bps, 10 ports, $11000GT(1) is connected to port 1GT(4) is connected to port 2BT(1) is connected to port 3GROUP(1) has 10 client tasks, GLT = 27 Mbps, GOT = 7.5 Mbps,GIT = 0 Mbps and DMT = 0 bpsDESIGN(20): GNC is located at X = 9.7, Y = 49.6, Z = 1.1switch(13): atm, 75000000 bps, 15 ports, $11000CT(1) is connected to port 1...CT(10) is connected to port 10ST(1) is connected to port 11GROUP(4) has 5 client tasks, GLT = 8 Mbps, GOT = 48.125 Mbps,GIT = 2.5 Mbps and DMT = 1.41558e+07 bpsDESIGN(20): GNC is located at X = 89.8, Y = 89.8, Z = 1.1switch(18): atm, 100000000 bps, 15 ports, $15000CT(11) is connected to port 1...CT(15) is connected to port 5
212

GS(1) is connected to port 6server(5) has the following attributes:number of CPUs = 1, CPU clock cycle = 4 nsmain memory capacity = 64000000 bytes, internal hard disk capacity = 1e+10 bytescost = $3000max performance = 99.5475%, average performance = 98.914%, min performance = 98.19%hard disk(5) has the following attributes:type = IDE, capacity = 1.5e+10 bytes, average seek time = 10 ms, transfer rate = 6.6e+07 bpscost = $500stored �les: 3, 2, 8, 14, 9, 12, 13, 1, 10, 6, 5, 7.ST(1) is connected to port 7SITE(2) has 2 group tasks, SLT = 0 Mbps, SOT = 15 Mbps,SIT = 21.25 Mbps and DMT = 1.70569e+07 bpsDESIGN(20): Site Multiaccess device is located at X = 49.6667, Y = 56.3333, Z = 16.1multiaccess(14): ethernet, 100000000 bps, 4 ports, $6000GT(2) is connected to site task port 1 via a 2-port bridge with following attributes:Bridge(13), has capacity 80000 packets per second and cost $260GT(5) is connected to port 2BT(1) is connected to port 3GROUP(2) has 5 client tasks, GLT = 2 Mbps, GOT = 2.5 Mbps,GIT = 2.5 Mbps and DMT = 0 bpsDESIGN(20): GNC is located at X = 9.2, Y = 89, Z = 16.1multiaccess(15): ethernet, 100000000 bps, 6 ports, $8000CT(16) is connected to port 1...CT(20) is connected to port 5ST(2) is connected to port 6GROUP(5) has 10 client tasks, GLT = 9 Mbps, GOT = 12.5 Mbps,GIT = 18.75 Mbps and DMT = 1.39111e+07 bpsDESIGN(20): GNC is located at X = 69.9, Y = 40, Z = 16.1switch(13): atm, 75000000 bps, 15 ports, $11000CT(21) is connected to port 1...CT(30) is connected to port 10GS(2) is connected to port 11server(9) has the following attributes:number of CPUs = 2, CPU clock cycle = 2.5 nsmain memory capacity = 128000000 bytes, internal hard disk capacity = 3e+10 bytescost = $7500max performance = 100%, average performance = 99.6739%, min performance = 98.913%hard disk(1) has the following attributes:type = IDE, capacity = 5e+09 bytes, average seek time = 10 ms, transfer rate = 6.6e+07 bpscost = $200stored �les: 11, 3, 2, 8, 14, 12, 15, 1, 10, 6, 5.ST(2) is connected to port 12SITE(3) has 2 group tasks, SLT = 0 Mbps, SOT = 15 Mbps,SIT = 33.75 Mbps and DMT = 1.39111e+07 bpsDESIGN(20): Site Multiaccess device is located at X = 52.45, Y = 50, Z = 32.1multiaccess(15): ethernet, 100000000 bps, 6 ports, $8000GT(3) is connected to port 1
213

GT(8) is connected to site task port 2 via a 2-port bridge with following attributes:Bridge(18), has capacity 115000 frames per second and cost $360BT(1) is connected to port 3GROUP(3) has 10 client tasks, GLT = 9 Mbps, GOT = 15 Mbps,GIT = 7.5 Mbps and DMT = 0 bpsDESIGN(20): GNC is located at X = 27.5, Y = 85, Z = 32.1switch(14): atm, 75000000 bps, 20 ports, $16000CT(31) is connected to port 1...CT(40) is connected to port 10GS(3) is connected to port 11server(3) has the following attributes:number of CPUs = 1, CPU clock cycle = 5 nsmain memory capacity = 32000000 bytes, internal hard disk capacity = 5e+09 bytescost = $2000max performance = 100%, average performance = 100%, min performance = 100%hard disk(3) has the following attributes:type = IDE, capacity = 1e+10 bytes, average seek time = 10 ms, transfer rate = 6.6e+07 bpscost = $300stored �les: 3, 2, 8, 12, 15, 10, 4, 5, 7.ST(3) is connected to port 12GROUP(8) has 10 client tasks, GLT = 9 Mbps, GOT = 0 Mbps,GIT = 26.25 Mbps and DMT = 0 bpsDESIGN(20): GNC is located at X = 77.4, Y = 15, Z = 32.1multiaccess(18): ethernet, 100000000 bps, 12 ports, $13000CT(41) is connected to port 1...CT(50) is connected to port 10ST(3) is connected to port 11SITE(4) has 2 group tasks, SLT = 4.2 Mbps, SOT = 7.5 Mbps,SIT = 35.625 Mbps and DMT = 8.10901e+06 bpsDESIGN(20): Site Router is located at X = 54.12, Y = 59.8667, Z = 45.1router(5): ip, 50000 pps, 5 ports, $3000GT(6) is connected to port 1GT(7) is connected to port 2BT(1) is connected to port 3GROUP(6) has 7 client tasks, GLT = 4.2 Mbps, GOT = 7.7 Mbps,GIT = 16.625 Mbps and DMT = 0 bpsDESIGN(20): GNC is located at X = 15.4, Y = 30.7143, Z = 45.1switch(18): atm, 100000000 bps, 15 ports, $15000CT(51) is connected to port 1...CT(57) is connected to port 7ST(4) is connected to port 8GROUP(7) has 8 client tasks, GLT = 5.6 Mbps, GOT = 4 Mbps,GIT = 23.2 Mbps and DMT = 0 bpsDESIGN(20): GNC is located at X = 88, Y = 85.375, Z = 45.1switch(17): atm, 100000000 bps, 10 ports, $11000CT(58) is connected to port 1
214

...CT(65) is connected to port 8ST(4) is connected to port 9Enter the generation number from 0-2999:
� The output of i -CAD for a complete intranet integration for the partial ani-mation sutdio, when TND = 40.0 seconds and the initial number of servers =4.
Enter the generation number from 0-2999:2656Intranet infrastructure(13) is the best design in generation 2656initial network cost = $123400, monthly network cost = $0interconnection cost = $2000, wire cost = $1269.59initial data management system cost = $10500, data management performance = 99.7009%average network delay = 27.3268 seconds, homogeneity factor = 0.692308BACKBONE(1) has 4 site tasks, BLT = 93.125 Mbps and MDT = 8.69389e+06 bpsDESIGN(13): Backbone Router is located at X = 23.6308, Y = 14.2, Z = 24.2538router(9): ip, 100000 pps, 5 ports, $7000ST(1) is connected to port 1ST(2) is connected to port 2ST(3) is connected to port 3ST(4) is connected to port 4SITE(1) has 2 group tasks, SLT = 0 Mbps, SOT = 55.625 Mbps,SIT = 2.5 Mbps and DMT = 643137 bpsDESIGN(13): Site Switch is located at X = 4.4, Y = 43.3333, Z = 1.1switch(12): atm, 75000000 bps, 10 ports, $8000GT(1) is connected to port 1GT(4) is connected to port 2BT(1) is connected to port 3GROUP(1) has 10 client tasks, GLT = 27 Mbps, GOT = 7.5 Mbps,GIT = 0 Mbps and DMT = 643137 bpsDESIGN(13): GNC is located at X = 3.9, Y = 43.6, Z = 1.1switch(19): atm, 100000000 bps, 20 ports, $18000CT(1) is connected to port 1...CT(10) is connected to port 10GS(1) is connected to port 11server(1) has the following attributes:number of CPUs = 1, CPU clock cycle = 5 nsmain memory capacity = 12000000 bytes, internal hard disk capacity = 1e+09 bytescost = $1000max performance = 100%, average performance = 100%, min performance = 100%hard disk(5) has the following attributes:type = IDE, capacity = 1.5e+10 bytes, average seek time = 10 ms, transfer rate = 6.6e+07 bpscost = $500stored �les: 11, 2, 8, 9, 12, 15, 13, 10, 6, 5, 7.ST(1) is connected to port 12GROUP(4) has 5 client tasks, GLT = 8 Mbps, GOT = 48.125 Mbps,GIT = 2.5 Mbps and DMT = 0 bps
215
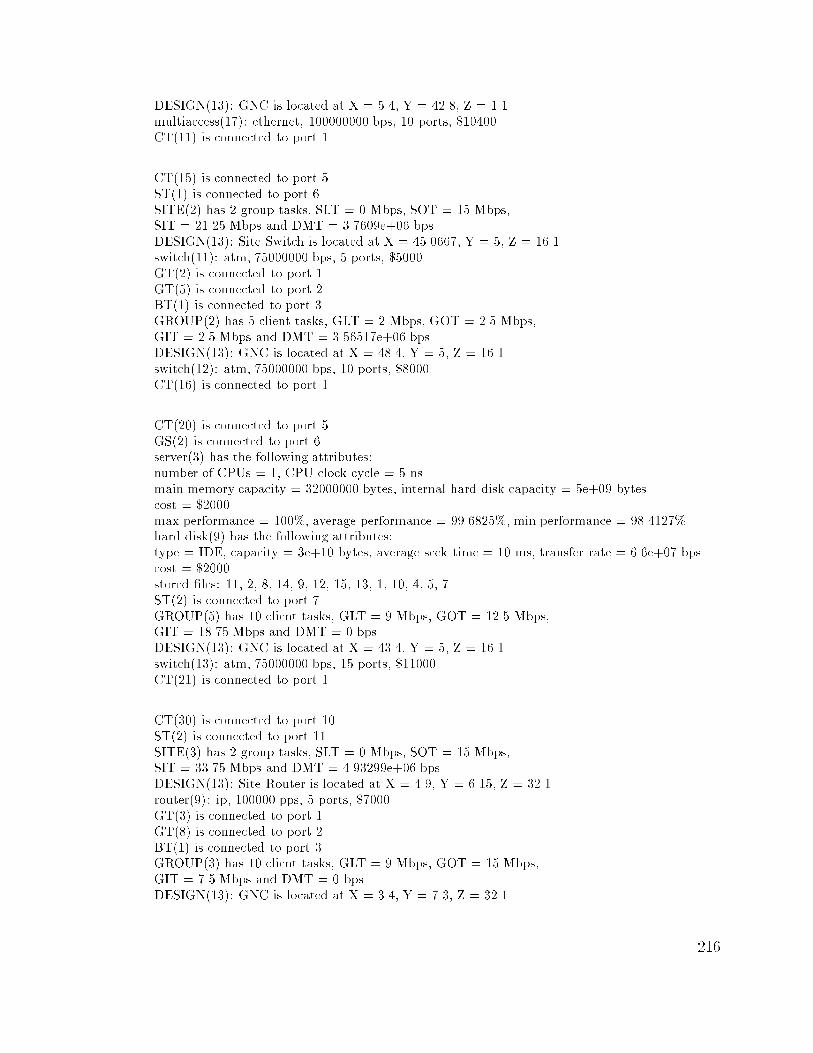
DESIGN(13): GNC is located at X = 5.4, Y = 42.8, Z = 1.1multiaccess(17): ethernet, 100000000 bps, 10 ports, $10400CT(11) is connected to port 1...CT(15) is connected to port 5ST(1) is connected to port 6SITE(2) has 2 group tasks, SLT = 0 Mbps, SOT = 15 Mbps,SIT = 21.25 Mbps and DMT = 3.7609e+06 bpsDESIGN(13): Site Switch is located at X = 45.0667, Y = 5, Z = 16.1switch(11): atm, 75000000 bps, 5 ports, $5000GT(2) is connected to port 1GT(5) is connected to port 2BT(1) is connected to port 3GROUP(2) has 5 client tasks, GLT = 2 Mbps, GOT = 2.5 Mbps,GIT = 2.5 Mbps and DMT = 3.56517e+06 bpsDESIGN(13): GNC is located at X = 48.4, Y = 5, Z = 16.1switch(12): atm, 75000000 bps, 10 ports, $8000CT(16) is connected to port 1...CT(20) is connected to port 5GS(2) is connected to port 6server(3) has the following attributes:number of CPUs = 1, CPU clock cycle = 5 nsmain memory capacity = 32000000 bytes, internal hard disk capacity = 5e+09 bytescost = $2000max performance = 100%, average performance = 99.6825%, min performance = 98.4127%hard disk(9) has the following attributes:type = IDE, capacity = 3e+10 bytes, average seek time = 10 ms, transfer rate = 6.6e+07 bpscost = $2000stored �les: 11, 2, 8, 14, 9, 12, 15, 13, 1, 10, 4, 5, 7.ST(2) is connected to port 7GROUP(5) has 10 client tasks, GLT = 9 Mbps, GOT = 12.5 Mbps,GIT = 18.75 Mbps and DMT = 0 bpsDESIGN(13): GNC is located at X = 43.4, Y = 5, Z = 16.1switch(13): atm, 75000000 bps, 15 ports, $11000CT(21) is connected to port 1...CT(30) is connected to port 10ST(2) is connected to port 11SITE(3) has 2 group tasks, SLT = 0 Mbps, SOT = 15 Mbps,SIT = 33.75 Mbps and DMT = 4.93299e+06 bpsDESIGN(13): Site Router is located at X = 4.9, Y = 6.15, Z = 32.1router(9): ip, 100000 pps, 5 ports, $7000GT(3) is connected to port 1GT(8) is connected to port 2BT(1) is connected to port 3GROUP(3) has 10 client tasks, GLT = 9 Mbps, GOT = 15 Mbps,GIT = 7.5 Mbps and DMT = 0 bpsDESIGN(13): GNC is located at X = 3.4, Y = 7.3, Z = 32.1
216

switch(14): atm, 75000000 bps, 20 ports, $16000CT(31) is connected to port 1...CT(40) is connected to port 10ST(3) is connected to port 11GROUP(8) has 10 client tasks, GLT = 9 Mbps, GOT = 0 Mbps,GIT = 26.25 Mbps and DMT = 4.54384e+06 bpsDESIGN(13): GNC is located at X = 6.4, Y = 5, Z = 32.1switch(13): atm, 75000000 bps, 15 ports, $11000CT(41) is connected to port 1...CT(50) is connected to port 10GS(3) is connected to port 11server(5) has the following attributes:number of CPUs = 1, CPU clock cycle = 4 nsmain memory capacity = 64000000 bytes, internal hard disk capacity = 1e+10 bytescost = $3000max performance = 100%, average performance = 99.4203%, min performance = 99.0338%hard disk(9) has the following attributes:type = IDE, capacity = 3e+10 bytes, average seek time = 10 ms, transfer rate = 6.6e+07 bpscost = $2000stored �les: 3, 2, 8, 14, 9, 12, 15, 6, 4, 5, 7.ST(3) is connected to port 12SITE(4) has 2 group tasks, SLT = 4.2 Mbps, SOT = 7.5 Mbps,SIT = 35.625 Mbps and DMT = 8.10901e+06 bpsDESIGN(13): Site Router is located at X = 46.4, Y = 5, Z = 45.1router(6): ip, 50000 pps, 10 ports, $6000GT(6) is connected to port 1GT(7) is connected to port 2BT(1) is connected to port 3GROUP(6) has 7 client tasks, GLT = 4.2 Mbps, GOT = 7.7 Mbps,GIT = 16.625 Mbps and DMT = 0 bpsDESIGN(13): GNC is located at X = 47.8286, Y = 4.14286, Z = 45.1switch(12): atm, 75000000 bps, 10 ports, $8000CT(51) is connected to port 1...CT(57) is connected to port 7ST(4) is connected to port 8GROUP(7) has 8 client tasks, GLT = 5.6 Mbps, GOT = 4 Mbps,GIT = 23.2 Mbps and DMT = 0 bpsDESIGN(13): GNC is located at X = 45.15, Y = 5.75, Z = 45.1switch(12): atm, 75000000 bps, 10 ports, $8000CT(58) is connected to port 1...CT(65) is connected to port 8ST(4) is connected to port 9Enter the generation number from 0-2999:
217

� The output of i -CAD for a complete intranet integration for the partial ani-mation sutdio, when TND = 50.0 seconds and the initial number of servers =4.
Enter the generation number from 0-2999:2440Intranet infrastructure(7) is the best design in generation 2440initial network cost = $112000, monthly network cost = $0interconnection cost = $0, wire cost = $7340.93initial data management system cost = $12800, data management performance = 99.8125average network delay = 20.701 seconds, homogeneity factor = 0.538462BACKBONE(1) has 4 site tasks, BLT = 93.125 Mbps and MDT = 1.45543e+07 bpsDESIGN(7): Backbone Router is located at X = 48.4892, Y = 56.7385, Z = 24.2538router(9): ip, 100000 pps, 5 ports, $7000ST(1) is connected to port 1ST(2) is connected to port 2ST(3) is connected to port 3ST(4) is connected to port 4SITE(1) has 2 group tasks, SLT = 0 Mbps, SOT = 55.625 Mbps,SIT = 2.5 Mbps and DMT = 1.45543e+07 bpsDESIGN(7): Site Router is located at X = 36.4, Y = 63, Z = 1.1router(9): ip, 100000 pps, 5 ports, $7000GT(1) is connected to port 1GT(4) is connected to port 2BT(1) is connected to port 3GROUP(1) has 10 client tasks, GLT = 27 Mbps, GOT = 7.5 Mbps,GIT = 0 Mbps and DMT = 1.4496e+07 bpsDESIGN(7): GNC is located at X = 9.7, Y = 49.6, Z = 1.1multiaccess(18): ethernet, 100000000 bps, 12 ports, $13000CT(1) is connected to port 1...CT(10) is connected to port 10GS(1) is connected to port 11server(3) has the following attributes:number of CPUs = 1, CPU clock cycle = 5 nsmain memory capacity = 32000000 bytes, internal hard disk capacity = 5e+09 bytescost = $2000max performance = 100%, average performance = 99.5726%, min performance = 99.1453%hard disk(8) has the following attributes:type = SCSI, capacity = 2e+10 bytes, average seek time = 5 ms, transfer rate = 1.6e+08 bpscost = $2000stored �les: 11, 2, 8, 9, 12, 15, 13, 10, 6, 5, 7.ST(1) is connected to port 12GROUP(4) has 5 client tasks, GLT = 8 Mbps, GOT = 48.125 Mbps,GIT = 2.5 Mbps and DMT = 0 bpsDESIGN(7): GNC is located at X = 89.8, Y = 89.8, Z = 1.1multiaccess(15): ethernet, 100000000 bps, 6 ports, $8000CT(11) is connected to port 1...CT(15) is connected to port 5
218

ST(1) is connected to port 6SITE(2) has 2 group tasks, SLT = 0 Mbps, SOT = 15 Mbps,SIT = 21.25 Mbps and DMT = 195737 bpsDESIGN(7): Site Switch is located at X = 49.6667, Y = 56.3333, Z = 16.1switch(11): atm, 75000000 bps, 5 ports, $5000GT(2) is connected to port 1GT(5) is connected to port 2BT(1) is connected to port 3GROUP(2) has 5 client tasks, GLT = 2 Mbps, GOT = 2.5 Mbps,GIT = 2.5 Mbps and DMT = 0 bpsDESIGN(7): GNC is located at X = 9.2, Y = 89, Z = 16.1switch(7): atm, 45000000 bps, 10 ports, $6000CT(16) is connected to port 1...CT(20) is connected to port 5GS(2) is connected to port 6server(7) has the following attributes:number of CPUs = 2, CPU clock cycle = 3 nsmain memory capacity = 32000000 bytes, internal hard disk capacity = 1e+10 bytescost = $3000max performance = 100%, average performance = 100%, min performance = 100%hard disk(6) has the following attributes:type = SCSI, capacity = 1.5e+10 bytes, average seek time = 5 ms, transfer rate = 1.6e+08 bpscost = $1000stored �les: 11, 2, 8, 14, 9, 12, 15, 13, 1, 10, 4, 5, 7.ST(2) is connected to port 7GROUP(5) has 10 client tasks, GLT = 9 Mbps, GOT = 12.5 Mbps,GIT = 18.75 Mbps and DMT = 0 bpsDESIGN(7): GNC is located at X = 69.9, Y = 40, Z = 16.1switch(9): atm, 45000000 bps, 20 ports, $13000CT(21) is connected to port 1...CT(30) is connected to port 10ST(2) is connected to port 11SITE(3) has 2 group tasks, SLT = 0 Mbps, SOT = 15 Mbps,SIT = 33.75 Mbps and DMT = 1.43003e+07 bpsDESIGN(7): Site Router is located at X = 52.45, Y = 50, Z = 32.1router(5): ip, 50000 pps, 5 ports, $3000GT(3) is connected to port 1GT(8) is connected to port 2BT(1) is connected to port 3GROUP(3) has 10 client tasks, GLT = 9 Mbps, GOT = 15 Mbps,GIT = 7.5 Mbps and DMT = 0 bpsDESIGN(7): GNC is located at X = 27.5, Y = 85, Z = 32.1switch(18): atm, 100000000 bps, 15 ports, $15000CT(31) is connected to port 1...CT(40) is connected to port 10ST(3) is connected to port 11
219

GROUP(8) has 10 client tasks, GLT = 9 Mbps, GOT = 0 Mbps,GIT = 26.25 Mbps and DMT = 0 bpsDESIGN(7): GNC is located at X = 77.4, Y = 15, Z = 32.1switch(18): atm, 100000000 bps, 15 ports, $15000CT(41) is connected to port 1...CT(50) is connected to port 10ST(3) is connected to port 11SITE(4) has 2 group tasks, SLT = 4.2 Mbps, SOT = 7.5 Mbps,SIT = 35.625 Mbps and DMT = 58254.9 bpsDESIGN(7): Site Router is located at X = 54.12, Y = 59.8667, Z = 45.1router(6): ip, 50000 pps, 10 ports, $6000GT(6) is connected to port 1GT(7) is connected to port 2BT(1) is connected to port 3GROUP(6) has 7 client tasks, GLT = 4.2 Mbps, GOT = 7.7 Mbps,GIT = 16.625 Mbps and DMT = 58254.9 bpsDESIGN(7): GNC is located at X = 15.4, Y = 30.7143, Z = 45.1switch(12): atm, 75000000 bps, 10 ports, $8000CT(51) is connected to port 1...CT(57) is connected to port 7GS(3) is connected to port 8server(4) has the following attributes:number of CPUs = 1, CPU clock cycle = 4 nsmain memory capacity = 32000000 bytes, internal hard disk capacity = 5e+09 bytescost = $2500max performance = 100%, average performance = 100%, min performance = 100%hard disk(3) has the following attributes:type = IDE, capacity = 1e+10 bytes, average seek time = 10 ms, transfer rate = 6.6e+07 bpscost = $300stored �les: 3, 2, 14, 12, 15, 13, 10, 6, 7.ST(4) is connected to port 9GROUP(7) has 8 client tasks, GLT = 5.6 Mbps, GOT = 4 Mbps,GIT = 23.2 Mbps and DMT = 0 bpsDESIGN(7): GNC is located at X = 88, Y = 85.375, Z = 45.1switch(7): atm, 45000000 bps, 10 ports, $6000CT(58) is connected to port 1...CT(65) is connected to port 8GS(4) is connected to port 9server(1) has the following attributes:number of CPUs = 1, CPU clock cycle = 5 nsmain memory capacity = 12000000 bytes, internal hard disk capacity = 1e+09 bytescost = $1000max performance = 100%, average performance = 99.6774%, min performance = 98.3871%hard disk(6) has the following attributes:type = SCSI, capacity = 1.5e+10 bytes, average seek time = 5 ms, transfer rate = 1.6e+08 bpscost = $1000
220

stored �les: 3, 2, 8, 14, 9, 12, 13, 6, 4, 5, 7.ST(4) is connected to port 10Enter the generation number from 0-2999:
� The output of i -CAD for a complete intranet integration for the partial ani-mation sutdio, when TND = 60.0 seconds and the initial number of servers =4.
Enter the generation number from 0-2999:2813Intranet infrastructure(16) is the best design in generation 2813initial network cost = $117000, monthly network cost = $0interconnection cost = $2000, wire cost = $936.786initial data management system cost = $10900, data management performance = 99.5534%average network delay = 30.7254 seconds, homogeneity factor = 0.692308BACKBONE(1) has 4 site tasks, BLT = 93.125 Mbps and MDT = 1.76418e+07 bpsDESIGN(16): Backbone Router is located at X = 23.6308, Y = 14.2, Z = 24.2538router(9): ip, 100000 pps, 5 ports, $7000ST(1) is connected to port 1ST(2) is connected to port 2ST(3) is connected to port 3ST(4) is connected to port 4SITE(1) has 2 group tasks, SLT = 0 Mbps, SOT = 55.625 Mbps,SIT = 2.5 Mbps and DMT = 2.03471e+07 bpsDESIGN(16): Site Switch is located at X = 4.4, Y = 43.3333, Z = 1.1switch(16): atm, 100000000 bps, 5 ports, $7000GT(1) is connected to port 1GT(4) is connected to port 2BT(1) is connected to port 3GROUP(1) has 10 client tasks, GLT = 27 Mbps, GOT = 7.5 Mbps,GIT = 0 Mbps and DMT = 0 bpsDESIGN(16): GNC is located at X = 3.9, Y = 43.6, Z = 1.1switch(18): atm, 100000000 bps, 15 ports, $15000CT(1) is connected to port 1...CT(10) is connected to port 10ST(1) is connected to port 11GROUP(4) has 5 client tasks, GLT = 8 Mbps, GOT = 48.125 Mbps,GIT = 2.5 Mbps and DMT = 2.03471e+07 bpsDESIGN(16): GNC is located at X = 5.4, Y = 42.8, Z = 1.1switch(17): atm, 100000000 bps, 10 ports, $11000CT(11) is connected to port 1...CT(15) is connected to port 5GS(1) is connected to port 6server(7) has the following attributes:number of CPUs = 2, CPU clock cycle = 3 nsmain memory capacity = 32000000 bytes, internal hard disk capacity = 1e+10 bytescost = $3000max performance = 100%, average performance = 99.6444%, min performance = 99.5556%
221

hard disk(2) has the following attributes:type = SCSI, capacity = 5e+09, average seek time = 5 ms, transfer rate = 1.6e+08 bpscost = $400stored �les: 11, 2, 8, 14, 12, 1, 10, 6, 4, 5.ST(1) is connected to port 7SITE(2) has 2 group tasks, SLT = 0 Mbps, SOT = 15 Mbps,SIT = 21.25 Mbps and DMT = 3.34147e+06 bpsDESIGN(16): Site Router is located at X = 45.0667, Y = 5, Z = 16.1router(9): ip, 100000 pps, 5 ports, $7000GT(2) is connected to port 1GT(5) is connected to port 2BT(1) is connected to port 3GROUP(2) has 5 client tasks, GLT = 2 Mbps, GOT = 2.5 Mbps,GIT = 2.5 Mbps and DMT = 0 bpsDESIGN(16): GNC is located at X = 48.4, Y = 5, Z = 16.1switch(2): atm, 25000000 bps, 10 ports, $4000CT(16) is connected to port 1...CT(20) is connected to port 5ST(2) is connected to port 6GROUP(5) has 10 client tasks, GLT = 9 Mbps, GOT = 12.5 Mbps,GIT = 18.75 Mbps and DMT = 0 bpsDESIGN(16): GNC is located at X = 43.4, Y = 5, Z = 16.1switch(13): atm, 75000000 bps, 15 ports, $11000CT(21) is connected to port 1...CT(30) is connected to port 10ST(2) is connected to port 11SITE(3) has 2 group tasks, SLT = 0 Mbps, SOT = 15 Mbps,SIT = 33.75 Mbps and DMT = 1.43003e+07 bpsDESIGN(16): Site Switch is located at X = 4.9, Y = 6.15, Z = 32.1switch(11): atm, 75000000 bps, 5 ports, $5000GT(3) is connected to port 1GT(8) is connected to port 2BT(1) is connected to port 3GROUP(3) has 10 client tasks, GLT = 9 Mbps, GOT = 15 Mbps,GIT = 7.5 Mbps and DMT = 0 bpsDESIGN(16): GNC is located at X = 3.4, Y = 7.3, Z = 32.1multiaccess(19): ethernet, 100000000 bps, 14 ports, $16000CT(31) is connected to port 1...CT(40) is connected to port 10ST(3) is connected to port 11GROUP(8) has 10 client tasks, GLT = 9 Mbps, GOT = 0 Mbps,GIT = 26.25 Mbps and DMT = 0 bpsDESIGN(16): GNC is located at X = 6.4, Y = 5, Z = 32.1switch(13): atm, 75000000 bps, 15 ports, $11000CT(41) is connected to port 1...
222

CT(50) is connected to port 10ST(3) is connected to port 11SITE(4) has 2 group tasks, SLT = 4.2 Mbps, SOT = 7.5 Mbps,SIT = 35.625 Mbps and DMT = 195737 bpsDESIGN(16): Site Router is located at X = 46.4, Y = 5, Z = 45.1router(5): ip, 50000 pps, 5 ports, $3000GT(6) is connected to port 1GT(7) is connected to port 2BT(1) is connected to port 3GROUP(6) has 7 client tasks, GLT = 4.2 Mbps, GOT = 7.7 Mbps,GIT = 16.625 Mbps and DMT = 195737 bpsDESIGN(16): GNC is located at X = 47.8286, Y = 4.14286, Z = 45.1switch(8): atm, 45000000 bps, 15 ports, $9000CT(51) is connected to port 1...CT(57) is connected to port 7GS(2) is connected to port 8server(1) has the following attributes:number of CPUs = 1, CPU clock cycle = 5 nsmain memory capacity = 12000000 bytes, internal hard disk capacity = 1e+09 bytescost = $1000max performance = 100% average performance = 99.661%, min performance = 98.3051%hard disk(5) has the following attributes:type = IDE, capacity = 1.5e+10 bytes, average seek time = 10 ms, transfer rate = 6.6e+07 bpscost = $500stored �les: 11, 3, 2, 8, 9, 12, 15, 13, 1, 10, 4, 7.ST(4) is connected to port 9GROUP(7) has 8 client tasks, GLT = 5.6 Mbps, GOT = 4 Mbps,GIT = 23.2 Mbps and DMT = 0 bpsDESIGN(16): GNC is located at X = 45.15, Y = 5.75, Z = 45.1switch(17): atm, 100000000 bps, 10 ports, $11000CT(58) is connected to port 1...CT(65) is connected to port 8GS(3) is connected to port 9server(6) has the following attributes:number of CPUs = 1, CPU clock cycle = 2 nsmain memory capacity = 64000000 bytes, internal hard disk capacity = 1e+10 bytescost = $4000max performance = 100%, average performance = 99.3548%, min performance = 98.3871%hard disk(9) has the following attributes:type = IDE, capacity = 3e+10 bytes, average seek time = 10 ms, transfer rate = 6.6e+07 bpscost = $2000stored �les: 2, 8, 9, 1, 6, 4, 5.ST(4) is connected to port 10Enter the generation number from 0-2999:
223

A.4 Experiment 4
� The output of i -CAD for a complete intranet integration for the partial an-imation sutdio, including a wide tree backbone topology, when TND = 10.0seconds and the initial number of servers = 3.
Enter the generation number from 0-2999:1782Intranet infrastructure(18) is the best design in generation 1782initial network cost = $315500, monthly network cost = $40750interconnection cost = $22000, wire cost = $10326.7initial data management system cost = $75500, data management performance = 99.8194%average network delay = 8.70592 seconds, homogeneity factor = 0.533333BACKBONE(1) has 4 site tasks, BLT = 93.125 Mbps and MDT = 5.12872e+06 bpsLink(1) connects sites: 1 and 2t-line(ds4): 264241152 bps, initial cost $30000 and monthly cost $13000Link(2) connects sites: 1 and 4sonet(vpc16-oc9/sonet): 116640000 bps, initial cost $22500 and monthly cost $6750Link(3) connects sites: 2 and 3sonet(oc7): 362880000 bps, initial cost $70000 and monthly cost $21000SITE(1) has 2 group tasks, SLT = 0 Mbps, SOT = 55.625 Mbps,SIT = 2.5 Mbps and DMT = 643137 bpsDESIGN(18): Site Router is located at X = 83236.4, Y = 20863, Z = 1.1router(21): ip, 300000 pps, 5 ports, $25000GT(1) is connected to port 1GT(4) is connected to port 2LINK(1) is connected to port 3LINK(2) is connected to port 4GROUP(1) has 10 client tasks, GLT = 27 Mbps, GOT = 7.5 Mbps,GIT = 0 Mbps and DMT = 643137 bpsDESIGN(18): GNC is located at X = 83209.7, Y = 20849.6, Z = 1.1multiaccess(21): ethernet, 100000000 bps, 18 ports, $22000CT(1) is connected to port 1...CT(10) is connected to port 10GS(1) is connected to port 11server(3) has the following attributes:number of CPUs = 1, CPU clock cycle = 5 nsmain memory capacity = 32000000 bytes, internal hard disk capacity = 5e+09 bytescost = $2000max performance = 100%, average performance = 100%, min performance = 100%hard disk(9) has the following attributes:type = IDE, capacity = 3e+10 bytes, average seek time = 10 ms, transfer rate = 6.6e+07 bpscost = $2000stored �les: 11, 3, 2, 8, 14, 9, 12, 15, 13, 6, 5, 7. ST(1) is connected to port 12GROUP(4) has 5 client tasks, GLT = 8 Mbps, GOT = 48.125 Mbps,GIT = 2.5 Mbps and DMT = 0 bpsDESIGN(18): GNC is located at X = 83289.8, Y = 20889.8, Z = 1.1switch(23): atm, 150000000 bps, 15 ports, $20000CT(11) is connected to port 1
224

...CT(15) is connected to port 5ST(1) is connected to port 6SITE(2) has 2 group tasks, SLT = 0 Mbps, SOT = 15 Mbps,SIT = 21.25 Mbps and DMT = 4.73958e+06 bpsDESIGN(18): Site Router is located at X = 114450, Y = 56.3333, Z = 16.1router(9): ip, 100000 pps, 5 ports, $7000GT(2) is connected to port 1GT(5) is connected to port 2LINK(1) is connected to port 3LINK(3) is connected to port 4GROUP(2) has 5 client tasks, GLT = 2 Mbps, GOT = 2.5 Mbps,GIT = 2.5 Mbps and DMT = 4.54384e+06 bpsDESIGN(18): GNC is located at X = 114409, Y = 89, Z = 16.1switch(13): atm, 75000000 bps, 15 ports, $11000CT(16) is connected to port 1...CT(20) is connected to port 5GS(2) is connected to port 6server(7) has the following attributes:number of CPUs = 2, CPU clock cycle = 3 nsmain memory capacity = 32000000 bytes, internal hard disk capacity = 1e+10 bytescost = $3000max performance = 100%, average performance = 99.5%, min performance = 98.75%hard disk(20) has the following attributes:type = SCSI, capacity = 8e+10 bytes, average seek time = 5 ms, transfer rate = 1.6e+08 bpscost = $20000stored �les: 11, 14, 9, 12, 15, 1, 10, 6, 4, 5, 7.ST(2) is connected to port 7GROUP(5) has 10 client tasks, GLT = 9 Mbps, GOT = 12.5 Mbps,GIT = 18.75 Mbps and DMT = 0 bpsDESIGN(18): GNC is located at X = 114470, Y = 40, Z = 16.1switch(19): atm, 100000000 bps, 20 ports, $18000CT(21) is connected to port 1...CT(30) is connected to port 10ST(2) is connected to port 11SITE(3) has 2 group tasks, SLT = 0 Mbps, SOT = 15 Mbps,SIT = 33.75 Mbps and DMT = 389145 bpsDESIGN(18): Site Switch is located at X = 52052.4, Y = 10450, Z = 32.1switch(18): atm, 100000000 bps, 15 ports, $15000GT(3) is connected to port 1GT(8) is connected to port 2LINK(3) is connected to port 3GROUP(3) has 10 client tasks, GLT = 9 Mbps, GOT = 15 Mbps,GIT = 7.5 Mbps and DMT = 0 bpsDESIGN(18): GNC is located at X = 52027.5, Y = 10485, Z = 32.1switch(19): atm, 100000000 bps, 20 ports, $18000CT(31) is connected to port 1
225

...CT(40) is connected to port 10ST(3) is connected to port 11GROUP(8) has 10 client tasks, GLT = 9 Mbps, GOT = 0 Mbps,GIT = 26.25 Mbps and DMT = 0 bpsDESIGN(18): GNC is located at X = 52077.4, Y = 10415, Z = 32.1switch(13): atm, 75000000 bps, 15 ports, $11000CT(41) is connected to port 1...CT(50) is connected to port 10GS(3) is connected to port 11server(15) has the following attributes:number of CPUs = 4, CPU clock cycle = 1 nsmain memory capacity = 1024000000 bytes, internal hard disk capacity = 5e+10 bytescost = $35000max performance = 100%, average performance = 99.7778%, min performance = 98.8889%hard disk(7) has the following attributes:type = IDE, capacity = 2e+10 bytes, average seek time = 10 ms, transfer rate = 6.6e+07 bpscost = $1500stored �les: 3, 2, 8, 14, 9, 13, 1, 10, 4, 5, 7.ST(3) is connected to port 12SITE(4) has 2 group tasks, SLT = 4.2 Mbps, SOT = 7.5 Mbps,SIT = 35.625 Mbps and DMT = 4.54384e+06 bpsDESIGN(18): Site Switch is located at X = 54.12, Y = 10459.9, Z = 45.1switch(26): atm, 200000000 bps, 5 ports, $15000GT(6) is connected to port 1GT(7) is connected to port 2LINK(2) is connected to port 3GROUP(6) has 7 client tasks, GLT = 4.2 Mbps, GOT = 7.7 Mbps,GIT = 16.625 Mbps and DMT = 0 bpsDESIGN(18): GNC is located at X = 15.4, Y = 10430.7, Z = 45.1switch(22): atm, 150000000 bps, 10 ports, $15000CT(51) is connected to port 1...CT(57) is connected to port 7GS(4) is connected to port 8server(3) has the following attributes:number of CPUs = 1, CPU clock cycle = 5 nsmain memory capacity = 32000000 bytes, internal hard disk capacity = 5e+09 bytescost = $2000max performance = 100%, average performance = 100%, min performance = 100%hard disk(19) has the following attributes:type = IDE, capacity = 8e+10 bytes, verage seek time = 10 ms, transfer rate = 6.6e+07 bpscost = $10000stored �les: 11, 3, 2, 14, 9, 12, 15, 13, 10, 6, 5, 7.ST(4) is connected to port 9GROUP(7) has 8 client tasks, GLT = 5.6 Mbps, GOT = 4 Mbps,GIT = 23.2 Mbps and DMT = 0 bpsDESIGN(18): GNC is located at X = 88, Y = 10485.4, Z = 45.1multiaccess(19): ethernet, 100000000 bps, 14 ports, $16000
226

CT(58) is connected to port 1...CT(65) is connected to port 8ST(4) is connected to port 9Enter the generation number from 0-2999:
� The output of i -CAD for a complete intranet integration for the partial an-imation sutdio, including a wide tree backbone topology, when TND = 20.0seconds and the initial number of servers = 3.
Enter the generation number from 0-2999:2347Intranet infrastructure(33) is the best design in generation 2347initial network cost = $300800, monthly network cost = $53000interconnection cost = $16000, wire cost = $7976.86initial data management system cost = $42500, data management performance = 99.5909%average network delay = 16.8058 seconds, homogeneity factor = 0.533333BACKBONE(1) has 4 site tasks, BLT = 93.125 Mbps and MDT = 1.16439e+07 bpsLink(1) connects sites: 2 and 4t-line(ds4): 264241152 bps, initial cost $30000 and monthly cost $13000Link(2) connects sites: 4 and 1sonet(oc9): 466560000 bps, initial cost $90000 and monthly cost $27000Link(3) connects sites: 4 and 3t-line(ds4): 264241152 bps, initial cost $30000 and monthly cost $13000SITE(1) has 2 group tasks, SLT = 0 Mbps, SOT = 55.625 Mbps,SIT = 2.5 Mbps and DMT = 1.05906e+07 bpsDESIGN(33): Site Switch is located at X = 83236.4, Y = 20863, Z = 1.1switch(23): atm, 150000000 bps, 15 ports, $20000GT(1) is connected to port 1GT(4) is connected to port 2LINK(1) is connected to port 3GROUP(1) has 10 client tasks, GLT = 27 Mbps, GOT = 7.5 Mbps,GIT = 0 Mbps and DMT = 0 bpsDESIGN(33): GNC is located at X = 83209.7, Y = 20849.6, Z = 1.1multiaccess(19): ethernet, 100000000 bps, 14 ports, $16000CT(1) is connected to port 1...CT(10) is connected to port 10ST(1) is connected to port 11GROUP(4) has 5 client tasks, GLT = 8 Mbps, GOT = 48.125 Mbps,GIT = 2.5 Mbps and DMT = 1.05906e+07 bpsDESIGN(33): GNC is located at X = 83289.8, Y = 20889.8, Z = 1.1multiaccess(17): ethernet, 100000000 bps, 10 ports, $10400CT(11) is connected to port 1...CT(15) is connected to port 5GS(1) is connected to port 6server(4) has the following attributes:number of CPUs = 1, CPU clock cycle = 4 ns
227

main memory capacity = 32000000 bytes, internal hard disk capacity = 5e+09 bytescost = $2500max performance = 100%, average performance = 99.6296%, min performance = 99.0741%hard disk(16) has the following attributes:type = SCSI, capacity = 6e+10 bytes, average seek time = 5 ms, transfer rate = 1.6e+08 bpscost = $11000stored �les: 11, 3, 8, 14, 12, 1, 10, 6, 5, 7.ST(1) is connected to port 7SITE(2) has 2 group tasks, SLT = 0 Mbps, SOT = 15 Mbps,SIT = 21.25 Mbps and DMT = 7.10004e+06 bpsDESIGN(33): Site Router is located at X = 114450, Y = 56.3333, Z = 16.1router(5): ip, 50000 pps, 5 ports, $3000GT(2) is connected to port 1GT(5) is connected to port 2LINK(1) is connected to port 3GROUP(2) has 5 client tasks, GLT = 2 Mbps, GOT = 2.5 Mbps,GIT = 2.5 Mbps and DMT = 0 bpsDESIGN(33): GNC is located at X = 114409, Y = 89, Z = 16.1switch(2): atm, 25000000 bps, 10 ports, $4000CT(16) is connected to port 1...CT(20) is connected to port 5ST(2) is connected to port 6GROUP(5) has 10 client tasks, GLT = 9 Mbps, GOT = 12.5 Mbps,GIT = 18.75 Mbps and DMT = 3.95431e+06 bpsDESIGN(33): GNC is located at X = 114470, Y = 40, Z = 16.1multiaccess(19): ethernet, 100000000 bps, 14 ports, $16000CT(21) is connected to port 1...CT(30) is connected to port 10GS(2) is connected to port 11server(8) has the following attributes:number of CPUs = 2, CPU clock cycle = 3 nsmain memory capacity = 64000000 bytes, internal hard disk capacity = 1.5e+10 bytescost = $5000max performance = 100%, average performance = 99.5294%, min performance = 98.8235%hard disk(19) has the following attributes:type = IDE, capacity = 8e+10 bytes, average seek time = 10 ms, transfer rate = 6.6e+07 bpscost = $10000stored �les: 11, 14, 9, 12, 15, 13, 1, 10, 4, 5, 7.ST(2) is connected to port 12SITE(3) has 2 group tasks, SLT = 0 Mbps, SOT = 15 Mbps,SIT = 33.75 Mbps and DMT = 389145 bpsDESIGN(33): Site Multiaccess device is located at X = 52052.4, Y = 10450, Z = 32.1multiaccess(14): ethernet, 100000000 bps, 4 ports, $6000GT(3) is connected to site task port 1 via a 2-port bridge with following attributes:Bridge(23), has capacity 500000 frames per second and cost $4000GT(8) is connected to site task port 2 via a 2-port bridge with following attributes:Bridge(23), has capacity 500000 frames per second and cost $4000LINK(1) is connected to port 3
228

GROUP(3) has 10 client tasks, GLT = 9 Mbps, GOT = 15 Mbps,GIT = 7.5 Mbps and DMT = 0 bpsDESIGN(33): GNC is located at X = 52027.5, Y = 10485, Z = 32.1multiaccess(18): ethernet, 100000000 bps, 12 ports, $13000CT(31) is connected to port 1...CT(40) is connected to port 10ST(3) is connected to port 11GROUP(8) has 10 client tasks, GLT = 9 Mbps, GOT = 0 Mbps,GIT = 26.25 Mbps and DMT = 0 bpsDESIGN(33): GNC is located at X = 52077.4, Y = 10415, Z = 32.1multiaccess(19): ethernet, 100000000 bps, 14 ports, $16000CT(41) is connected to port 1...CT(50) is connected to port 10GS(3) is connected to port 11server(7) has the following attributes:number of CPUs = 2, CPU clock cycle = 3 nsmain memory capacity = 32000000 bytes, internal hard disk capacity = 1e+10 bytescost = $3000max performance = 100%, average performance = 99.6135%, min performance = 99.5169%hard disk(16) has the following attributes:type = SCSI, capacity = 6e+10 bytes, average seek time = 5 ms, transfer rate = 1.6e+08 bpscost = $11000stored �les: 11, 3, 2, 8, 14, 9, 12, 15, 13, 10, 5, 7.ST(3) is connected to port 12SITE(4) has 2 group tasks, SLT = 4.2 Mbps, SOT = 7.5 Mbps,SIT = 35.625 Mbps and DMT = 8.10901e+06 bpsDESIGN(33): Site Router is located at X = 54.12, Y = 10459.9, Z = 45.1router(5): ip, 50000 pps, 5 ports, $3000GT(6) is connected to port 1GT(7) is connected to port 2LINK(1) is connected to port 3GROUP(6) has 7 client tasks, GLT = 4.2 Mbps, GOT = 7.7 Mbps,GIT = 16.625 Mbps and DMT = 0 bpsDESIGN(33): GNC is located at X = 15.4, Y = 10430.7, Z = 45.1multiaccess(17): ethernet, 100000000 bps, 10 ports, $10400CT(51) is connected to port 1...CT(57) is connected to port 7ST(4) is connected to port 8GROUP(7) has 8 client tasks, GLT = 5.6 Mbps, GOT = 4 Mbps,GIT = 23.2 Mbps and DMT = 0 bpsDESIGN(33): GNC is located at X = 88, Y = 10485.4, Z = 45.1multiaccess(29): ethernet, 1000000000 bps, 10 ports, $25000CT(58) is connected to port 1...CT(65) is connected to port 8ST(4) is connected to port 9
229

Enter the generation number from 0-2999:
� The output of i -CAD for a complete intranet integration for the partial an-imation sutdio, including a wide tree backbone topology, when TND = 30.0seconds and the initial number of servers = 3.
Enter the generation number from 0-2999:2682Intranet infrastructure(16) is the best design in generation 2682initial network cost = $267000, monthly network cost = $47000interconnection cost = $14000, wire cost $10428.5initial data management system cost = $52500, data management performance = 99.8201average network delay = 24.5864 seconds, homogeneity factor = 0.333333BACKBONE(1) has 4 site tasks, BLT = 93.125 Mbps and MDT = 1.75043e+07 bpsLink(1) connects sites: 3 and 4t-line(ds4): 264241152 bps, initial cost $30000 and monthly cost $13000Link(2) connects sites: 4 and 2t-line(ds4): 264241152 bps, initial cost $30000 and monthly cost $13000Link(3) connects sites: 4 and 1sonet(oc7): 362880000 bps, initial cost $70000 and monthly cost $21000SITE(1) has 2 group tasks, SLT = 0 Mbps, SOT = 55.625 Mbps,SIT = 2.5 Mbps and DMT = 1.71151e+07 bpsDESIGN(16): Site Multiaccess device is located at X = 83236.4, Y = 20863, Z = 1.1multiaccess(14): ethernet, 100000000 bps, 4 ports, $6000GT(1) is connected to site task port 1 via a 2-port bridge with following attributes:Bridge(22), has capacity 300000 frames per second and cost $2000GT(4) is connected to site task port 2 via a 2-port bridge with following attributes:Bridge(22), has capacity 300000 frames per second and cost $2000LINK(3) is connected to port 3GROUP(1) has 10 client tasks, GLT = 27 Mbps, GOT = 7.5 Mbps,GIT = 0 Mbps and DMT = 1.70569e+07 bpsDESIGN(16): GNC is located at X = 83209.7, Y = 20849.6, Z = 1.1multiaccess(22): ethernet, 100000000 bps, 20 ports, $25000CT(1) is connected to port 1...CT(10) is connected to port 10GS(1) is connected to port 11server(11) has the following attributes:number of CPUs = 4, CPU clock cycle = 2.5 nsmain memory capacity = 256000000 bytes, internal hard disk capacity = 2e+10 bytescost = $12000max performance = 100%, average performance = 99.9034%, min performance = 99.5169%hard disk(16) has the following attributes:type = SCSI, capacity = 6e+10 bytes, average seek time = 5 ms, transfer rate = 1.6e+08 bpscost = $11000stored �les: 11, 2, 8, 9, 12, 15, 13, 1, 4, 5, 7.ST(1) is connected to port 12GROUP(4) has 5 client tasks, GLT = 8 Mbps, GOT = 48.125 Mbps,GIT = 2.5 Mbps and DMT = 0 bpsDESIGN(16): GNC is located at X = 83289.8, Y = 20889.8, Z = 1.1
230

multiaccess(15): ethernet, 100000000 bps, 6 ports, $8000CT(11) is connected to port 1...CT(15) is connected to port 5ST(1) is connected to port 6SITE(2) has 2 group tasks, SLT = 0 Mbps, SOT = 15 Mbps,SIT = 21.25 Mbps and DMT = 3.14573e+06 bpsDESIGN(16): Site Router is located at X = 114450, Y = 56.3333, Z = 16.1router(6): ip, 50000 pps, 10 ports, $6000GT(2) is connected to port 1GT(5) is connected to port 2LINK(2) is connected to port 3GROUP(2) has 5 client tasks, GLT = 2 Mbps, GOT = 2.5 Mbps,GIT = 2.5 Mbps and DMT = 0 bpsDESIGN(16): GNC is located at X = 114409, Y = 89, Z = 16.1switch(22): atm, 150000000 bps, 10 ports, $15000CT(16) is connected to port 1...CT(20) is connected to port 5ST(2) is connected to port 6GROUP(5) has 10 client tasks, GLT = 9 Mbps, GOT = 12.5 Mbps,GIT = 18.75 Mbps and DMT = 0 bpsDESIGN(16): GNC is located at X = 114470, Y = 40, Z = 16.1switch(13): atm, 75000000 bps, 15 ports, $11000CT(21) is connected to port 1...CT(30) is connected to port 10GS(2) is connected to port 11server(2) has the following attributes:number of CPUs = 1, CPU clock cycle = 4 nsmain memory capacity = 12000000 bytes, internal hard disk capacity = 3e+09 bytescost = $1500max performance = 100%, average performance = 100%, min performance = 100%hard disk(15) has the following attributes:type = IDE, capacity = 6e+10 bytes, average seek time = 10 ms, transfer rate = 6.6e+07 bpscost = $8000stored �les: 11, 3, 2, 14, 9, 12, 15, 1, 10, 6, 4, 5.ST(2) is connected to port 12SITE(3) has 2 group tasks, SLT = 0 Mbps, SOT = 15 Mbps,SIT = 33.75 Mbps and DMT = 1.43003e+07 bpsDESIGN(16): Site Switch is located at X = 52052.4, Y = 10450, Z = 32.1switch(11): atm, 75000000 bps, 5 ports, $5000GT(3) is connected to port 1GT(8) is connected to port 2LINK(1) is connected to port 3GROUP(3) has 10 client tasks, GLT = 9 Mbps, GOT = 15 Mbps,GIT = 7.5 Mbps and DMT = 0 bpsDESIGN(16): GNC is located at X = 52027.5, Y = 10485, Z = 32.1switch(8): atm, 45000000 bps, 15 ports, $9000
231

CT(31) is connected to port 1...CT(40) is connected to port 10ST(3) is connected to port 11GROUP(8) has 10 client tasks, GLT = 9 Mbps, GOT = 0 Mbps,GIT = 26.25 Mbps and DMT = 0 bpsDESIGN(16): GNC is located at X = 52077.4, Y = 10415, Z = 32.1multiaccess(18): ethernet, 100000000 bps, 12 ports, $13000CT(41) is connected to port 1...CT(50) is connected to port 10ST(3) is connected to port 11SITE(4) has 2 group tasks, SLT = 4.2 Mbps, SOT = 7.5 Mbps,SIT = 35.625 Mbps and DMT = 447400 bpsDESIGN(16): Site Router is located at X = 54.12, Y = 10459.9, Z = 45.1router(9): ip, 100000 pps, 5 ports, $7000GT(6) is connected to port 1GT(7) is connected to port 2LINK(1) is connected to port 3LINK(2) is connected to port 4LINK(3) is connected to port 5GROUP(6) has 7 client tasks, GLT = 4.2 Mbps, GOT = 7.7 Mbps,GIT = 16.625 Mbps and DMT = 389145 bpsDESIGN(16): GNC is located at X = 15.4, Y = 10430.7, Z = 45.1multiaccess(18): ethernet, 100000000 bps, 12 ports, $13000CT(51) is connected to port 1...CT(57) is connected to port 7GS(3) is connected to port 8server(8) has the following attributes:number of CPUs = 2, CPU clock cycle = 3 nsmain memory capacity = 64000000 bytes, internal hard disk capacity = 1.5e+10 bytescost = $5000max performance = 100%, average performance = 99.798%, min performance = 98.9899%hard disk(8) has the following attributes:type = SCSI, capacity = 2e+10 bytes, average seek time = 5 ms, transfer rate = 1.6e+08 bpscost = $2000stored �les: 11, 3, 8, 14, 9, 12, 13, 10, 4, 5, 7.ST(4) is connected to port 9GROUP(7) has 8 client tasks, GLT = 5.6 Mbps, GOT = 4 Mbps,GIT = 23.2 Mbps and DMT = 58254.9 bpsDESIGN(16): GNC is located at X = 88, Y = 10485.4, Z = 45.1switch(18): atm, 100000000 bps, 15 ports, $15000CT(58) is connected to port 1...CT(65) is connected to port 8GS(4) is connected to port 9server(8) has the following attributes:number of CPUs = 2, CPU clock cycle = 3 ns
232

main memory capacity = 64000000 bytes, internal hard disk capacity = 1.5e+10 bytescost = $5000max performance = 100%, average performance = 99.5789%, min performance = 98.9474%hard disk(15) has the following attributes:type = IDE, capacity = 6e+10 bytes, average seek time = 10 ms, transfer rate = 6.6e+07 bpscost = $8000stored �les: 11, 3, 2, 8, 14, 9, 12, 15, 13, 1, 10, 6, 4, 5, 7.ST(4) is connected to port 10Enter the generation number from 0-2999:
� The output of i -CAD for a complete intranet integration for the partial an-imation sutdio, including a wide tree backbone topology, when TND = 40.0seconds and the initial number of servers = 3.
Enter the generation number from 0-2999:1340Intranet infrastructure(1) is the best design in generation 1340initial network cost = $267400, monthly network cost = $32000interconnection cost = $22000, wire cost = $6094.88initial data management system cost = $55500, data management performance = 99.7034%average network delay = 35.8453 seconds, homogeneity factor = 0.4BACKBONE(1) has 4 site tasks, BLT = 93.125 Mbps and MDT = 7.89231e+06 bpsLink(1) connects sites: 1 and 2t-line(ds4): 264241152 bps, initial cost $30000 and monthly cost $13000Link(2) connects sites: 2 and 4sonet(oc2): 103680000 bps, initial cost $20000 and monthly cost $6000Link(3) connects sites: 1 and 3t-line(ds4): 264241152 bps, initial cost $30000 and monthly cost $13000SITE(1) has 2 group tasks, SLT = 0 Mbps, SOT = 55.625 Mbps,SIT = 2.5 Mbps and DMT = 2.95932e+06 bpsDESIGN(1): Site Router is located at X = 83236.4, Y = 20863, Z = 1.1router(6): ip, 50000 pps, 10 ports, $6000GT(1) is connected to port 1GT(4) is connected to port 2LINK(1) is connected to port 3LINK(3) is connected to port 4GROUP(1) has 10 client tasks, GLT = 27 Mbps, GOT = 7.5 Mbps,GIT = 0 Mbps and DMT = 0 bpsDESIGN(1): GNC is located at X = 83209.7, Y = 20849.6, Z = 1.1switch(8): atm, 45000000 bps, 15 ports, $9000CT(1) is connected to port 1...CT(10) is connected to port 10ST(1) is connected to port 11GROUP(4) has 5 client tasks, GLT = 8 Mbps, GOT = 48.125 Mbps,GIT = 2.5 Mbps and DMT = 0 bpsDESIGN(1): GNC is located at X = 83289.8, Y = 20889.8, Z = 1.1switch(13): atm, 75000000 bps, 15 ports, $11000CT(11) is connected to port 1...
233

CT(15) is connected to port 5ST(1) is connected to port 6SITE(2) has 2 group tasks, SLT = 0 Mbps, SOT = 15 Mbps,SIT = 21.25 Mbps and DMT = 7.68957e+06 bpsDESIGN(1): Site Switch is located at X = 114450, Y = 56.3333, Z = 16.1switch(25): atm, 150000000 bps, 32 ports, $38000GT(2) is connected to port 1GT(5) is connected to port 2LINK(1) is connected to port 3LINK(2) is connected to port 4GROUP(2) has 5 client tasks, GLT = 2 Mbps, GOT = 2.5 Mbps,GIT = 2.5 Mbps and DMT = 0 bpsDESIGN(1): GNC is located at X = 114409, Y = 89, Z = 16.1multiaccess(19): ethernet, 100000000 bps, 14 ports, $16000CT(16) is connected to port 1...CT(20) is connected to port 5ST(2) is connected to port 6GROUP(5) has 10 client tasks, GLT = 9 Mbps, GOT = 12.5 Mbps,GIT = 18.75 Mbps and DMT = 7.68957e+06 bpsDESIGN(1): GNC is located at X = 114470, Y = 40, Z = 16.1multiaccess(19): ethernet, 100000000 bps, 14 ports, $16000CT(21) is connected to port 1...CT(30) is connected to port 10GS(1) is connected to port 11server(4) has the following attributes:number of CPUs = 1, CPU clock cycle = 4 nsmain memory capacity = 32000000 bytes, internal hard disk capacity = 5e+09 bytescost = $2500max performance = 100%, average performance = 99.8039%, min performance = 99.0196%hard disk(20) has the following attributes:type = SCSI, capacity = 8e+10 bytes, average seek time = 5 ms, transfer rate = 1.6e+08 bpscost = $20000stored �les: 2, 8, 14, 9, 12, 15, 13, 10, 6, 4, 5.ST(2) is connected to port 12SITE(3) has 2 group tasks, SLT = 0 Mbps, SOT = 15 Mbps,SIT = 33.75 Mbps and DMT = 3.29021e+06 bpsDESIGN(1): Site Router is located at X = 52052.4, Y = 10450, Z = 32.1router(10): ip, 100000 pps, 10 ports, $11000GT(3) is connected to port 1GT(8) is connected to port 2LINK(3) is connected to port 3GROUP(3) has 10 client tasks, GLT = 9 Mbps, GOT = 15 Mbps,GIT = 7.5 Mbps and DMT = 0 bpsDESIGN(1): GNC is located at X = 52027.5, Y = 10485, Z = 32.1switch(8): atm, 45000000 bps, 15 ports, $9000CT(31) is connected to port 1...
234

CT(40) is connected to port 10ST(3) is connected to port 11GROUP(8) has 10 client tasks, GLT = 9 Mbps, GOT = 0 Mbps,GIT = 26.25 Mbps and DMT = 2.90107e+06 bpsDESIGN(1): GNC is located at X = 52077.4, Y = 10415, Z = 32.1switch(24): atm, 150000000 bps, 20 ports, $28000CT(41) is connected to port 1...CT(50) is connected to port 10GS(2) is connected to port 11server(3) has the following attributes:number of CPUs = 1, CPU clock cycle = 5 nsmain memory capacity = 32000000 bytes, internal hard disk capacity = 5e+09 bytescost = $2000max performance = 99.422%, average performance = 99.3064%, min performance = 98.8439%hard disk(14) has the following attributes:type = SCSI, capacity = 5e+10 bytes, average seek time = 5 ms, transfer rate = 1.6e+08 bpscost = $9000stored �les: 3, 2, 8, 14, 9, 12, 13, 1, 10, 6, 4, 5, 7.ST(3) is connected to port 12SITE(4) has 2 group tasks, SLT = 4.2 Mbps, SOT = 7.5 Mbps,SIT = 35.625 Mbps and DMT = 4.99124e+06 bpsDESIGN(1): Site Multiaccess device is located at X = 54.12, Y = 10459.9, Z = 45.1multiaccess(15): ethernet, 100000000 bps, 6 ports, $8000GT(6) is connected to port 1GT(7) is connected to site task port 2 via a 2-port bridge with following attributes:Bridge(20), has capacity 125000 packets per second and cost $400LINK(2) is connected to port 3GROUP(6) has 7 client tasks, GLT = 4.2 Mbps, GOT = 7.7 Mbps,GIT = 16.625 Mbps and DMT = 447400 bpsDESIGN(1): GNC is located at X = 15.4, Y = 10430.7, Z = 45.1switch(14): atm, 75000000 bps, 20 ports, $16000CT(51) is connected to port 1...CT(57) is connected to port 7GS(3) is connected to port 8server(11) has the following attributes:number of CPUs = 4, CPU clock cycle = 2.5 nsmain memory capacity = 256000000 bytes, internal hard disk capacity = 2e+10 bytescost = $12000max performance = 100%, average performance = 100%, min performance = 100%hard disk(19) has the following attributes:type = IDE, capacity = 8e+10 bytes, average seek time = 10 ms, transfer rate = 6.6e+07 bpscost = $10000stored �les: 11, 3, 2, 8, 14, 12, 13, 1, 6, 4, 7.ST(4) is connected to port 9GROUP(7) has 8 client tasks, GLT = 5.6 Mbps, GOT = 4 Mbps,GIT = 23.2 Mbps and DMT = 0 bpsDESIGN(1): GNC is located at X = 88, Y = 10485.4, Z = 45.1multiaccess(20): ethernet, 100000000 bps, 16 ports, $19000
235

CT(58) is connected to port 1...CT(65) is connected to port 8ST(4) is connected to port 9Enter the generation number from 0-2999:
� The output of i -CAD for a complete intranet integration for the partial an-imation sutdio, including a wide tree backbone topology, when TND = 50.0seconds and the initial number of servers = 3.
Enter the generation number from 0-2999:1775Intranet infrastructure(46) is the best design in generation 1775initial network cost = $230000, monthly network cost = $39000interconnection cost = $0, wire cost = $10591.7initial data management system cost = $42500, data management ratio = 99.8316%average network delay = 21.7926 seconds, homogeneity factor = 0.266667BACKBONE(1) has 4 site tasks, BLT = 93.125 Mbps and MDT = 6.91363e+06 bpsLink(1) connects sites: 2 and 4t-line(ds4): 264241152 bps, initial cost $30000 and monthly cost $13000Link(2) connects sites: 4 and 1t-line(ds4): 264241152 bps, initial cost $30000 and monthly cost $13000Link(3) connects sites: 4 and 3t-line(ds4): 264241152 bps, initial cost $30000 and monthly cost $13000SITE(1) has 2 group tasks, SLT = 0 Mbps, SOT = 55.625 Mbps,SIT = 2.5 Mbps and DMT = 2.95932e+06 bpsDESIGN(46): Site Router is located at X = 83236.4, Y = 20863, Z = 1.1router(5): ip, 50000 pps, 5 ports, $3000GT(1) is connected to port 1GT(4) is connected to port 2LINK(2) is connected to port 3GROUP(1) has 10 client tasks, GLT = 27 Mbps, GOT = 7.5 Mbps,GIT = 0 Mbps and DMT = 0 bpsDESIGN(46): GNC is located at X = 83209.7, Y = 20849.6, Z = 1.1switch(23): atm, 150000000 bps, 15 ports, $20000CT(1) is connected to port 1...CT(10) is connected to port 10ST(1) is connected to port 11GROUP(4) has 5 client tasks, GLT = 8 Mbps, GOT = 48.125 Mbps,GIT = 2.5 Mbps and DMT = 0 bpsDESIGN(46): GNC is located at X = 83289.8, Y = 20889.8, Z = 1.1multiaccess(27): ethernet, 1000000000 bps, 6 ports, $13000CT(11) is connected to port 1...CT(15) is connected to port 5ST(1) is connected to port 6SITE(2) has 2 group tasks, SLT = 0 Mbps, SOT = 15 Mbps,SIT = 21.25 Mbps and DMT = 3.0968e+06 bps
236

DESIGN(46): Site Router is located at X = 114450, Y = 56.3333, Z = 16.1router(10): ip, 100000 pps, 10 ports, $11000GT(2) is connected to port 1GT(5) is connected to port 2LINK(1) is connected to port 3GROUP(2) has 5 client tasks, GLT = 2 Mbps, GOT = 2.5 Mbps,GIT = 2.5 Mbps and DMT = 3.0968e+06 bpsDESIGN(46): GNC is located at X = 114409, Y = 89, Z = 16.1multiaccess(18): ethernet, 100000000 bps, 12 ports, $13000CT(16) is connected to port 1...CT(20) is connected to port 5GS(1) is connected to port 6server(13) has the following attributes:number of CPUs = 4, CPU clock cycle = 2 nsmain memory capacity = 512000000 bytes, internal hard disk capacity = 3e+10 bytescost = $20000max performance = 100%, average performance = 99.7727%, min performance = 98.8636%hard disk(15) has the following attributes:type = IDE, capacity = 6e+10, average seek time = 10 ms, transfer rate = 6.6e+07 bpscost = $8000 stored �les: 11, 3, 2, 8, 14, 9, 12, 15, 13, 1, 10, 6, 5, 7.ST(2) is connected to port 7GROUP(5) has 10 client tasks, GLT = 9 Mbps, GOT = 12.5 Mbps,GIT = 18.75 Mbps and DMT = 0 bpsDESIGN(46): GNC is located at X = 114470, Y = 40, Z = 16.1switch(14): atm, 75000000 bps, 20 ports, $16000CT(21) is connected to port 1...CT(30) is connected to port 10ST(2) is connected to port 11SITE(3) has 2 group tasks, SLT = 0 Mbps, SOT = 15 Mbps,SIT = 33.75 Mbps and DMT = 4.01257e+06 bpsDESIGN(46): Site Router is located at X = 52052.4, Y = 10450, Z = 32.1router(9): ip, 100000 pps, 5 ports, $7000GT(3) is connected to port 1GT(8) is connected to port 2LINK(3) is connected to port 3GROUP(3) has 10 client tasks, GLT = 9 Mbps, GOT = 15 Mbps,GIT = 7.5 Mbps and DMT = 0 bpsDESIGN(46): GNC is located at X = 52027.5, Y = 10485, Z = 32.1multiaccess(18): ethernet, 100000000 bps, 12 ports, $13000CT(31) is connected to port 1...CT(40) is connected to port 10ST(3) is connected to port 11GROUP(8) has 10 client tasks, GLT = 9 Mbps, GOT = 0 Mbps,GIT = 26.25 Mbps and DMT = 3.62342e+06 bpsDESIGN(46): GNC is located at X = 52077.4, Y = 10415, Z = 32.1multiaccess(18): ethernet, 100000000 bps, 12 ports, $13000
237

CT(41) is connected to port 1...CT(50) is connected to port 10GS(2) is connected to port 11server(7) has the following attributes:number of CPUs = 2, CPU clock cycle = 3 nsmain memory capacity = 32000000 bytes, internal hard disk capacity = 1e+10 bytescost = $3000max performance = 100%, average performance = 99.9038%, min performance = 99.5192%hard disk(8) has the following attributes:type = SCSI, capacity = 2e+10 bytes, average seek time = 5 ms, transfer rate = 1.6e+08 bpscost = $2000stored �les: 11, 8, 14, 9, 12, 13, 1, 10, 4, 5.ST(3) is connected to port 12SITE(4) has 2 group tasks, SLT = 4.2 Mbps, SOT = 7.5 Mbps,SIT = 35.625 Mbps and DMT = 3.95431e+06 bpsDESIGN(46): Site Router is located at X = 54.12, Y = 10459.9, Z = 45.1router(10): ip, 100000 pps, 10 ports, $11000GT(6) is connected to port 1GT(7) is connected to port 2LINK(1) is connected to port 3LINK(2) is connected to port 4LINK(3) is connected to port 5GROUP(6) has 7 client tasks, GLT = 4.2 Mbps, GOT = 7.7 Mbps,GIT = 16.625 Mbps and DMT = 0 bpsDESIGN(46): GNC is located at X = 15.4, Y = 10430.7, Z = 45.1switch(17): atm, 100000000 bps, 10 ports, $11000CT(51) is connected to port 1...CT(57) is connected to port 7ST(4) is connected to port 8GROUP(7) has 8 client tasks, GLT = 5.6 Mbps, GOT = 4 Mbps,GIT = 23.2 Mbps and DMT = 389145 bpsDESIGN(46): GNC is located at X = 88, Y = 10485.4, Z = 45.1switch(8): atm, 45000000 bps, 15 ports, $9000CT(58) is connected to port 1...CT(65) is connected to port 8GS(3) is connected to port 9server(9) has the following attributes:number of CPUs = 2, CPU clock cycle = 2.5 nsmain memory capacity = 128000000 bytes, internal hard disk capacity = 3e+10 bytescost = $7500max performance = 100%, average performance = 99.8182%, min performance = 99.0909%hard disk(9) has the following attributes:type = IDE, capacity = 3e+10 bytes, verage seek time = 10 ms, transfer rate = 6.6e+07 bpscost = $2000stored �les: 3, 2, 8, 9, 12, 15, 1, 6, 4, 5.ST(4) is connected to port 10
238

Enter the generation number from 0-2999:
� The output of i -CAD for a complete intranet integration for the partial an-imation sutdio, including a wide tree backbone topology, when TND = 60.0seconds and the initial number of servers = 3.
Enter the generation number from 0-2999:2444Intranet infrastructure(35) is the best design in generation 2444initial network cost = $280200, monthly network cost = $50000interconnection cost = $14000, wire cost = $6898.09initial data management system cost = $30500, data management performance = 99.5483%average network delay = 30.3252 seconds, homogeneity factor = 0.533333BACKBONE(1) has 4 site tasks, BLT = 93.125 Mbps and MDT = 1.14505e+07 bpsLink(1) connects sites: 4 and 3t-line(ds4): 264241152 bps, initial cost $30000 and monthly cost $13000Link(2) connects sites: 4 and 1t-line(ds4): 264241152 bps, initial cost $30000 and monthly cost $13000Link(3) connects sites: 4 and 2sonet(oc8): 414720000 bps, initial cost $80000 and monthly cost $24000SITE(1) has 2 group tasks, SLT = 0 Mbps, SOT = 55.625 Mbps,SIT = 2.5 Mbps and DMT = 7.44491e+06 bpsDESIGN(35): Site Switch is located at X = 83236.4, Y = 20863, Z = 1.1switch(12): atm, 75000000 bps, 10 ports, $8000GT(1) is connected to port 1GT(4) is connected to port 2LINK(2) is connected to port 3GROUP(1) has 10 client tasks, GLT = 27 Mbps, GOT = 7.5 Mbps,GIT = 0 Mbps and DMT = 0 bpsDESIGN(35): GNC is located at X = 83209.7, Y = 20849.6, Z = 1.1switch(13): atm, 75000000 bps, 15 ports, $11000CT(1) is connected to port 1...CT(10) is connected to port 10ST(1) is connected to port 11GROUP(4) has 5 client tasks, GLT = 8 Mbps, GOT = 48.125 Mbps,GIT = 2.5 Mbps and DMT = 7.44491e+06 bpsDESIGN(35): GNC is located at X = 83289.8, Y = 20889.8, Z = 1.1multiaccess(16): ethernet, 100000000 bps, 8 ports, $9200CT(11) is connected to port 1...CT(15) is connected to port 5GS(1) is connected to port 6server(11) has the following attributes:number of CPUs = 4, CPU clock cycle = 2.5 nsmain memory capacity = 256000000 bytes, internal hard disk capacity = 2e+10 bytescost = $12000max performance = 100%, average performance = 99.4286%, min performance = 99.0476%hard disk(17) has the following attributes:type = IDE, capacity = 7e+10 bytes, average seek time = 10 ms, transfer rate = 6.6e+07 bps
239

cost = $9000stored �les: 3, 2, 8, 9, 12, 15, 1, 6, 5, 7.ST(1) is connected to port 7SITE(2) has 2 group tasks, SLT = 0 Mbps, SOT = 15 Mbps,SIT = 21.25 Mbps and DMT = 3.34147e+06 bpsDESIGN(35): Site Switch is located at X = 114450, Y = 56.3333, Z = 16.1switch(22): atm, 150000000 bps, 10 ports, $15000GT(2) is connected to port 1GT(5) is connected to port 2LINK(3) is connected to port 3GROUP(2) has 5 client tasks, GLT = 2 Mbps, GOT = 2.5 Mbps,GIT = 2.5 Mbps and DMT = 0 bpsDESIGN(35): GNC is located at X = 114409, Y = 89, Z = 16.1switch(2): atm, 25000000 bps, 10 ports, $4000CT(16) is connected to port 1...CT(20) is connected to port 5ST(2) is connected to port 6GROUP(5) has 10 client tasks, GLT = 9 Mbps, GOT = 12.5 Mbps,GIT = 18.75 Mbps and DMT = 0 bpsDESIGN(35): GNC is located at X = 114470, Y = 40, Z = 16.1switch(13): atm, 75000000 bps, 15 ports, $11000CT(21) is connected to port 1...CT(30) is connected to port 10ST(2) is connected to port 11SITE(3) has 2 group tasks, SLT = 0 Mbps, SOT = 15 Mbps,SIT = 33.75 Mbps and DMT = 6.90664e+06 bpsDESIGN(35): Site Router is located at X = 52052.4, Y = 10450, Z = 32.1router(10): ip, 100000 pps, 10 ports, $11000GT(3) is connected to port 1GT(8) is connected to port 2LINK(1) is connected to port 3GROUP(3) has 10 client tasks, GLT = 9 Mbps, GOT = 15 Mbps,GIT = 7.5 Mbps and DMT = 3.34147e+06 bpsDESIGN(35): GNC is located at X = 52027.5, Y = 10485, Z = 32.1switch(19): atm, 100000000 bps, 20 ports, $18000CT(31) is connected to port 1...CT(40) is connected to port 10GS(2) is connected to port 11server(4) has the following attributes:number of CPUs = 1, CPU clock cycle = 4 nsmain memory capacity = 32000000 bytes, internal hard disk capacity = 5e+09 bytescost = $2500max performance = 100%, average performance = 99.6491%, min performance = 98.2456%hard disk(9) has the following attributes:type = IDE, capacity = 3e+10 bytes, average seek time = 10 ms, transfer rate = 6.6e+07 bpscost = $2000
240

stored �les: 11, 2, 14, 9, 12, 15, 13, 1, 6, 5, 7.ST(3) is connected to port 12GROUP(8) has 10 client tasks, GLT = 9 Mbps, GOT = 0 Mbps,GIT = 26.25 Mbps and DMT = 3.56517e+06 bpsDESIGN(35): GNC is located at X = 52077.4, Y = 10415, Z = 32.1multiaccess(20): ethernet, 100000000 bps, 16 ports, $19000CT(41) is connected to port 1...CT(50) is connected to port 10GS(3) is connected to port 11server(5) has the following attributes:number of CPUs = 1, CPU clock cycle = 4 nsmain memory capacity = 64000000 bytes, internal hard disk capacity = 1e+10 bytescost = $3000max performance = 100%, average performance = 99.5671%, min performance = 99.1342%hard disk(8) has the following attributes:type = SCSI, capacity = 2e+10 bytes, average seek time = 5 ms, transfer rate = 1.6e+08 bpscost = $2000stored �les: 3, 8, 14, 9, 12, 15, 13, 1, 10, 4, 7.ST(3) is connected to port 12SITE(4) has 2 group tasks, SLT = 4.2 Mbps, SOT = 7.5 Mbps,SIT = 35.625 Mbps and DMT = 8.10901e+06 bpsDESIGN(35): Site Router is located at X = 54.12, Y = 10459.9, Z = 45.1router(7): ip, 50000 pps, 15 ports, $20000GT(6) is connected to port 1GT(7) is connected to port 2LINK(1) is connected to port 3LINK(2) is connected to port 4LINK(3) is connected to port 5GROUP(6) has 7 client tasks, GLT = 4.2 Mbps, GOT = 7.7 Mbps,GIT = 16.625 Mbps and DMT = 0 bpsDESIGN(35): GNC is located at X = 15.4, Y = 10430.7, Z = 45.1switch(7): atm, 45000000 bps, 10 ports, $6000CT(51) is connected to port 1...CT(57) is connected to port 7ST(4) is connected to port 8GROUP(7) has 8 client tasks, GLT = 5.6 Mbps, GOT = 4 Mbps,GIT = 23.2 Mbps and DMT = 0 bpsDESIGN(35): GNC is located at X = 88, Y = 10485.4, Z = 45.1switch(12): atm, 75000000 bps, 10 ports, $8000CT(58) is connected to port 1...CT(65) is connected to port 8ST(4) is connected to port 9Enter the generation number from 0-2999:
241

A.5 Experiment 5
� The output of i -CAD for a complete intranet integration for the full animationsutdio, when TND = 30.0 seconds and the initial number of servers = 5.
Enter the generation number from 0-4999:4627Intranet infrastructure(32) is the best design in generation 4627initial network cost = $417440, monthly network cost = $0interconnection cost = $8000, wire cost = $12619.1initial data management system cost = $39000, data management performance = 99.6508%average network delay = 25.0348 seconds, homogeneity factor = 0.619048BACKBONE(1) has 6 site tasks, BLT = 209.575 Mbps and MDT = 5.87576e+07 bpsDESIGN(32): Backbone Router is located at X = 24.3733, Y = 14.1867, Z = 49.3router(22): ip, 300000 pps, 10 ports, $40000ST(1) is connected to port 1...ST(6) is connected to port 6SITE(1) has 2 group tasks, SLT = 0 Mbps, SOT = 55.625 Mbps,SIT = 2.5 Mbps and DMT = 2.95932e+06 bpsDESIGN(32): Site Router is located at X = 4.4, Y = 43.3333, Z = 1.1router(9): ip, 100000 pps, 5 ports, $7000GT(1) is connected to port 1GT(4) is connected to port 2BT(1) is connected to port 3GROUP(1) has 10 client tasks, GLT = 27 Mbps, GOT = 7.5 Mbps,GIT = 0 Mbps and DMT = 0 bpsDESIGN(32): GNC is located at X = 3.9, Y = 43.6, Z = 1.1switch(19): atm, 100000000 bps, 20 ports, $18000CT(1) is connected to port 1...CT(10) is connected to port 10ST(1) is connected to port 11GROUP(4) has 5 client tasks, GLT = 8 Mbps, GOT = 48.125 Mbps,GIT = 2.5 Mbps and DMT = 0 bpsDESIGN(32): GNC is located at X = 5.4, Y = 42.8, Z = 1.1multiaccess(17): ethernet, 100000000 bps, 10 ports, $10400CT(11) is connected to port 1...CT(15) is connected to port 5ST(1) is connected to port 6SITE(2) has 2 group tasks, SLT = 0 Mbps, SOT = 15 Mbps,SIT = 21.25 Mbps and DMT = 1.71525e+07 bpsDESIGN(32): Site Multiaccess device is located at X = 45.0667, Y = 5, Z = 16.1multiaccess(26): ethernet, 1000000000 bps, 4 ports, $8000GT(2) is connected to site task port 1 via a 2-port bridge with following attributes:Bridge(16), has capacity 105000 frames per second and cost $320GT(5) is connected to site task port 2 via a 2-port bridge with following attributes:Bridge(18), has capacity 115000 frames per second and cost $360
242

BT(1) is connected to port 3GROUP(2) has 5 client tasks, GLT = 2 Mbps, GOT = 2.5 Mbps,GIT = 2.5 Mbps and DMT = 1.69567e+07 bpsDESIGN(32): GNC is located at X = 48.4, Y = 5, Z = 16.1multiaccess(17): ethernet, 100000000 bps, 10 ports, $10400CT(16) is connected to port 1...CT(20) is connected to port 5GS(1) is connected to port 6server(1) has the following attributes:number of CPUs = 1, CPU clock cycle = 5 nsmain memory capacity = 12000000 bytes, internal hard disk capacity = 1e+09 bytescost = $1000max performance = 100%, average performance = 99.3277%, min performance = 98.7395%hard disk(15) has the following attributes:type = IDE, capacity = 6e+10 bytes, average seek time = 10 ms, transfer rate = 6.6e+07 bpscost = $8000stored �les: 11, 3, 9, 12, 13, 1, 21, 5, 7, 19.ST(2) is connected to port 7GROUP(5) has 10 client tasks, GLT = 9 Mbps, GOT = 12.5 Mbps,GIT = 18.75 Mbps and DMT = 0 bpsDESIGN(32): GNC is located at X = 43.4, Y = 5, Z = 16.1multiaccess(18): ethernet, 100000000 bps, 12 ports, $13000CT(21) is connected to port 1...CT(30) is connected to port 10ST(2) is connected to port 11SITE(3) has 2 group tasks, SLT = 0 Mbps, SOT = 95 Mbps,SIT = 33.75 Mbps and DMT = 2.29778e+07 bpsDESIGN(32): Site Router is located at X = 4.9, Y = 6.15, Z = 32.1router(14): ip, 150000 pps, 10 ports, $20000GT(3) is connected to port 1GT(8) is connected to port 2BT(1) is connected to port 3GROUP(3) has 10 client tasks, GLT = 9 Mbps, GOT = 15 Mbps,GIT = 7.5 Mbps and DMT = 0 bpsDESIGN(32): GNC is located at X = 3.4, Y = 7.3, Z = 32.1multiaccess(18): ethernet, 100000000 bps, 12 ports, $13000CT(31) is connected to port 1...CT(40) is connected to port 10ST(3) is connected to port 11GROUP(8) has 10 client tasks, GLT = 9 Mbps, GOT = 80 Mbps,GIT = 26.25 Mbps and DMT = 2.25887e+07 bpsDESIGN(32): GNC is located at X = 6.4, Y = 5, Z = 32.1multiaccess(30): ethernet, 1000000000 bps, 12 ports, $33000CT(41) is connected to port 1...CT(50) is connected to port 10
243

GS(2) is connected to port 11server(3) has the following attributes:number of CPUs = 1, CPU clock cycle = 5 nsmain memory capacity = 32000000 bytes, internal hard disk capacity = 5e+09 bytescost = $2000max performance = 99.3289%, average performance = 98.9262%, min performance = 97.3154%hard disk(10) has the following attributes:type = SCSI, capacity = 3e+10 bytes, average seek time = 5 ms, transfer rate = 1.6e+08 bpscost = $3000stored �les: 22, 3, 17, 8, 12, 13, 1, 10, 23, 6, 5, 19.ST(3) is connected to port 12SITE(4) has 2 group tasks, SLT = 4.2 Mbps, SOT = 7.5 Mbps,SIT = 35.625 Mbps and DMT = 2.08201e+07 bpsDESIGN(32): Site Multiaccess device is located at X = 46.4, Y = 5, Z = 45.1multiaccess(14): ethernet, 100000000 bps, 4 ports, $6000GT(6) is connected to site task port 1 via a 2-port bridge with following attributes:Bridge(16), has capacity 105000 frames per second and cost $320GT(7) is connected to port 2BT(1) is connected to port 3GROUP(6) has 7 client tasks, GLT = 4.2 Mbps, GOT = 7.7 Mbps,GIT = 16.625 Mbps and DMT = 1.63112e+07 bpsDESIGN(32): GNC is located at X = 47.8286, Y = 4.14286, Z = 45.1multiaccess(17): ethernet, 100000000 bps, 10 ports, $10400CT(51) is connected to port 1...CT(57) is connected to port 7GS(3) is connected to port 8server(1) has the following attributes:number of CPUs = 1, CPU clock cycle = 5 nsmain memory capacity = 12000000 bytes, internal hard disk capacity = 1e+09 bytescost = $1000max performance = 100%, average performance = 100%, min performance = 100%hard disk(7) has the following attributes:type = IDE, capacity = 2e+10 bytes, average seek time = 10 ms, transfer rate = 6.6e+07 bpscost = $1500stored �les: 22, 16, 3, 17, 18, 2, 8, 14, 15, 10, 23, 21, 6, 5, 7, 19.ST(4) is connected to port 9GROUP(7) has 8 client tasks, GLT = 5.6 Mbps, GOT = 4 Mbps,GIT = 23.2 Mbps and DMT = 0 bpsDESIGN(32): GNC is located at X = 45.15, Y = 5.75, Z = 45.1switch(14): atm, 75000000 bps, 20 ports, $16000CT(58) is connected to port 1...CT(65) is connected to port 8ST(4) is connected to port 9SITE(5) has 3 group tasks, SLT = 21 Mbps, SOT = 18.95 Mbps,SIT = 57.5 Mbps and DMT = 9.00612e+06 bpsDESIGN(32): Site Multiaccess device is located at X = 12.5, Y = 13.25, Z = 62.1multiaccess(26): ethernet, 1000000000 bps, 4 ports, $8000GT(9) is connected to site task port 1 via a 2-port bridge with following attributes:
244

Bridge(12), has capacity 70000 frames per second and cost $240GT(10) is connected to site task port 2 via a 2-port bridge with following attributes:Bridge(21), has capacity 200000 frames per second and cost $1000GT(12) is connected to port 3BT(1) is connected to port 4GROUP(9) has 10 client tasks, GLT = 1.98 Mbps, GOT = 25 Mbps,GIT = 20 Mbps and DMT = 0 bpsDESIGN(32): GNC is located at X = 20, Y = 5, Z = 62.1multiaccess(20): ethernet, 100000000 bps, 16 ports, $19000CT(66) is connected to port 1...CT(75) is connected to port 10GS(4) is connected to port 11server(3) has the following attributes:number of CPUs = 1, CPU clock cycle = 5 nsmain memory capacity = 32000000 bytes, internal hard disk capacity = 5e+09 bytescost = $2000max performance = 100%, average performance = 100%, min performance = 100%hard disk(17) has the following attributes:type = IDE, capacity = 7e+10 bytes, average seek time = 10 ms, transfer rate = 6.6e+07 bpscost = $9000 bytesstored �les: 22, 17, 2, 14, 15, 1, 6, 5, 7, 19, 20.ST(5) is connected to port 12GROUP(10) has 10 client tasks, GLT = 18 Mbps, GOT = 6.99999 Mbps,GIT = 20 Mbps and DMT = 2.90107e+06 bpsDESIGN(32): GNC is located at X = 10, Y = 10, Z = 62.1multiaccess(19): ethernet, 100000000 bps, 14 ports, $16000CT(76) is connected to port 1...CT(85) is connected to port 10GS(5) is connected to port 11server(2) has the following attributes:number of CPUs = 1, CPU clock cycle = 4 nsmain memory capacity = 12000000 bytes, internal hard disk capacity = 3e+09 bytescost = $1500max performance = 100%, average performance = 100%, min performance = 100%hard disk(19) has the following attributes:type = IDE, capacity = 8e+10 bytes, average seek time = 10 ms, transfer rate = 6.6e+07 bpscost = $10000stored �les: 24, 22, 16, 11, 3, 2, 8, 14, 15, 21, 6, 4, 5, 7, 19, 20.ST(5) is connected to port 12GROUP(12) has 20 client tasks, GLT = 40.5 Mbps, GOT = 7.95002 Mbps,GIT = 38.5 Mbps and DMT = 0 bpsDESIGN(32): GNC is located at X = 10, Y = 19, Z = 62.1switch(25): atm, 150000000 bps, 32 ports, $38000CT(86) is connected to port 1...CT(105) is connected to port 20ST(5) is connected to port 21
245

SITE(6) has 3 group tasks, SLT = 100.565 Mbps, SOT = 17.5002 Mbps,SIT = 58.9502 Mbps and DMT = 4.45995e+07 bpsDESIGN(32): Site Router is located at X = 36, Y = 15, Z = 74.1router(21): ip, 300000 pps, 5 ports, $25000GT(11) is connected to port 1GT(13) is connected to port 2GT(14) is connected to port 3BT(1) is connected to port 4GROUP(11) has 15 client tasks, GLT = 4.95 Mbps, GOT = 31.375 Mbps,GIT = 43.445 Mbps and DMT = 0 bpsDESIGN(32): GNC is located at X = 26, Y = 14, Z = 74.1multiaccess(20): ethernet, 100000000 bps, 16 ports, $19000CT(106) is connected to port 1...CT(120) is connected to port 15ST(6) is connected to port 16GROUP(13) has 15 client tasks, GLT = 47.31 Mbps, GOT = 86.69 Mbps,GIT = 43.875 Mbps and DMT = 0 bpsDESIGN(32): GNC is located at X = 36, Y = 15, Z = 74.1multiaccess(32): ethernet, 1000000000 bps, 16 ports, $45000CT(121) is connected to port 1...CT(135) is connected to port 15ST(6) is connected to port 16GROUP(14) has 15 client tasks, GLT = 7.94 Mbps, GOT = 0 Mbps,GIT = 72.195 Mbps and DMT = 0 bpsDESIGN(32): GNC is located at X = 46, Y = 16, Z = 74.1switch(29): atm, 200000000 bps, 20 ports, $40000CT(136) is connected to port 1...CT(150) is connected to port 15ST(6) is connected to port 16Enter the generation number from 0-4999:
� The output of i -CAD for a complete intranet integration for the full animationsutdio, when TND = 180.0 seconds and the initial number of servers = 5.
Enter the generation number from 0-4999:4701Intranet infrastructure(4) is the best design in generation 4701initial network cost = $363200, monthly network cost = $0interconnection cost = $2000, wire cost = $8357.94initial data management system cost = $33000, data management performance = 98.5227%average network delay = 136.622 seconds, homogeneity factor = 0.52381BACKBONE(1) has 6 site tasks, BLT = 209.575 Mbps and MDT = 3.55026e+07 bpsDESIGN(4): Backbone Router is located at X = 24.3733, Y = 14.1867, Z = 49.3router(18): ip, 200000 pps, 10 ports, $31000ST(1) is connected to port 1...
246

ST(6) is connected to port 6SITE(1) has 2 group tasks, SLT = 0 Mbps, SOT = 55.625 Mbps,SIT = 2.5 Mbps and DMT = 1.49108e+07 bpsDESIGN(4): Site Router is located at X = 4.4, Y = 43.3333, Z = 1.1router(9): ip, 100000 pps, 5 ports, $7000GT(1) is connected to port 1GT(4) is connected to port 2BT(1) is connected to port 3GROUP(1) has 10 client tasks, GLT = 27 Mbps, GOT = 7.5 Mbps,GIT = 0 Mbps and DMT = 0 bpsDESIGN(4): GNC is located at X = 3.9, Y = 43.6, Z = 1.1switch(13): atm, 75000000 bps, 15 ports, $11000CT(1) is connected to port 1...CT(10) is connected to port 10ST(1) is connected to port 11GROUP(4) has 5 client tasks, GLT = 8 Mbps, GOT = 48.125 Mbps,GIT = 2.5 Mbps and DMT = 1.49108e+07 bpsDESIGN(4): GNC is located at X = 5.4, Y = 42.8, Z = 1.1multiaccess(16): ethernet, 100000000 bps, 8 ports, $9200CT(11) is connected to port 1...CT(15) is connected to port 5GS(1) is connected to port 6server(2) has the following attributes:number of CPUs = 1, CPU clock cycle = 4 nsmain memory capacity = 12000000 bytes, internal hard disk capacity = 3e+09 bytescost = $1500max performance = 100%, average performance = 99.8206%, min performance = 99.5516%hard disk(11) has the following attributes:type = IDE, capacity = 4e+10 bytes, average seek time = 10 ms, transfer rate = 6.6e+07 bpscost = $4000stored �les: 11, 18, 2, 14, 9, 15, 13, 1, 23, 6, 5, 20.ST(1) is connected to port 7SITE(2) has 2 group tasks, SLT = 0 Mbps, SOT = 15 Mbps,SIT = 21.25 Mbps and DMT = 3.34147e+06 bpsDESIGN(4): Site Switch is located at X = 45.0667, Y = 5, Z = 16.1switch(11): atm, 75000000 bps, 5 ports, $5000GT(2) is connected to port 1GT(5) is connected to port 2BT(1) is connected to port 3GROUP(2) has 5 client tasks, GLT = 2 Mbps, GOT = 2.5 Mbps,GIT = 2.5 Mbps and DMT = 0 bpsDESIGN(4): GNC is located at X = 48.4, Y = 5, Z = 16.1switch(2): atm, 25000000 bps, 10 ports, $4000CT(16) is connected to port 1...CT(20) is connected to port 5ST(2) is connected to port 6
247

GROUP(5) has 10 client tasks, GLT = 9 Mbps, GOT = 12.5 Mbps,GIT = 18.75 Mbps and DMT = 0 bpsDESIGN(4): GNC is located at X = 43.4, Y = 5, Z = 16.1multiaccess(18): ethernet, 100000000 bps, 12 ports, $13000CT(21) is connected to port 1...CT(30) is connected to port 10ST(2) is connected to port 11SITE(3) has 2 group tasks, SLT = 0 Mbps, SOT = 95 Mbps,SIT = 33.75 Mbps and DMT = 1.4242e+07 bpsDESIGN(4): Site Router is located at X = 4.9, Y = 6.15, Z = 32.1router(17): ip, 200000 pps, 5 ports, $19000GT(3) is connected to port 1GT(8) is connected to port 2BT(1) is connected to port 3GROUP(3) has 10 client tasks, GLT = 9 Mbps, GOT = 15 Mbps,GIT = 7.5 Mbps and DMT = 0 bpsDESIGN(4): GNC is located at X = 3.4, Y = 7.3, Z = 32.1switch(9): atm, 45000000 bps, 20 ports, $13000CT(31) is connected to port 1...CT(40) is connected to port 10ST(3) is connected to port 11GROUP(8) has 10 client tasks, GLT = 9 Mbps, GOT = 80 Mbps,GIT = 26.25 Mbps and DMT = 0 bpsDESIGN(4): GNC is located at X = 6.4, Y = 5, Z = 32.1switch(23): atm, 150000000 bps, 15 ports, $20000CT(41) is connected to port 1...CT(50) is connected to port 10ST(3) is connected to port 11SITE(4) has 2 group tasks, SLT = 4.2 Mbps, SOT = 7.5 Mbps,SIT = 35.625 Mbps and DMT = 2.34928e+07 bpsDESIGN(4): Site Router is located at X = 46.4, Y = 5, Z = 45.1router(5): ip, 50000 pps, 5 ports, $3000GT(6) is connected to port 1GT(7) is connected to port 2BT(1) is connected to port 3GROUP(6) has 7 client tasks, GLT = 4.2 Mbps, GOT = 7.7 Mbps,GIT = 16.625 Mbps and DMT = 389145 bpsDESIGN(4): GNC is located at X = 47.8286, Y = 4.14286, Z = 45.1switch(18): atm, 100000000 bps, 15 ports, $15000CT(51) is connected to port 1...CT(57) is connected to port 7GS(2) is connected to port 8server(7) has the following attributes:number of CPUs = 2, CPU clock cycle = 3 nsmain memory capacity = 32000000 bytes, internal hard disk capacity = 1e+10 bytes
248

cost = $3000max performance = 100%, average performance = 99.6226%, min performance = 98.1132%hard disk(6) has the following attributes:type = SCSI, capacity = 1.5e+10 bytes, average seek time = 5 ms, transfer rate = 1.6e+08 bpscost = $1000stored �les: 11, 18, 8, 14, 9, 12, 15, 23, 6, 4, 5, 19, 20.ST(4) is connected to port 9GROUP(7) has 8 client tasks, GLT = 5.6 Mbps, GOT = 4 Mbps,GIT = 23.2 Mbps and DMT = 2.31037e+07 bpsDESIGN(4): GNC is located at X = 45.15, Y = 5.75, Z = 45.1switch(12): atm, 75000000 bps, 10 ports, $8000CT(58) is connected to port 1...CT(65) is connected to port 8GS(3) is connected to port 9server(1) has the following attributes:number of CPUs = 1, CPU clock cycle = 5 nsmain memory capacity = 12000000 bytes, internal hard disk capacity = 1e+09 bytescost = $1000max performance = 98.7069%, average performance = 97.7586%, min performance = 95.6897%hard disk(17) has the following attributes:type = IDE, capacity = 7e+10 bytes, average seek time = 10 ms, transfer rate = 6.6e+07 bpscost = $9000stored �les: 22, 11, 17, 18, 2, 8, 14, 9, 1, 10, 23, 21, 4, 5, 7, 19, 20.ST(4) is connected to port 10SITE(5) has 3 group tasks, SLT = 21 Mbps, SOT = 18.95 Mbps,SIT = 57.5 Mbps and DMT = 1.20237e+07 bpsDESIGN(4): Site Router is located at X = 12.5, Y = 13.25, Z = 62.1router(9): ip, 100000 pps, 5 ports, $7000GT(9) is connected to port 1GT(10) is connected to port 2GT(12) is connected to port 3BT(1) is connected to port 4GROUP(9) has 10 client tasks, GLT = 1.98 Mbps, GOT = 25 Mbps,GIT = 20 Mbps and DMT = 0 bpsDESIGN(4): GNC is located at X = 20, Y = 5, Z = 62.1switch(19): atm, 100000000 bps, 20 ports, $18000CT(66) is connected to port 1...CT(75) is connected to port 10ST(5) is connected to port 11GROUP(10) has 10 client tasks, GLT = 18 Mbps, GOT = 6.99999 Mbps,GIT = 20 Mbps and DMT = 0 bpsDESIGN(4): GNC is located at X = 10, Y = 10, Z = 62.1switch(18): atm, 100000000 bps, 15 ports, $15000CT(76) is connected to port 1...CT(85) is connected to port 10ST(5) is connected to port 11
249

GROUP(12) has 20 client tasks, GLT = 40.5 Mbps, GOT = 7.95002 Mbps,GIT = 38.5 Mbps and DMT = 0 bpsDESIGN(4): GNC is located at X = 10, Y = 19, Z = 62.1switch(20): atm, 100000000 bps, 32 ports, $28000CT(86) is connected to port 1...CT(105) is connected to port 20ST(5) is connected to port 21SITE(6) has 3 group tasks, SLT = 100.565 Mbps, SOT = 17.5002 Mbps,SIT = 58.9502 Mbps and DMT = 5.89537e+06 bpsDESIGN(4): Site Router is located at X = 36, Y = 15, Z = 74.1router(17): ip, 200000 pps, 5 ports, $19000GT(11) is connected to port 1GT(13) is connected to port 2GT(14) is connected to port 3BT(1) is connected to port 4GROUP(11) has 15 client tasks, GLT = 4.95 Mbps, GOT = 31.375 Mbps,GIT = 43.445 Mbps and DMT = 0 bpsDESIGN(4): GNC is located at X = 26, Y = 14, Z = 74.1multiaccess(22): ethernet, 100000000 bps, 20 ports, $25000CT(106) is connected to port 1...CT(120) is connected to port 15ST(6) is connected to port 16GROUP(13) has 15 client tasks, GLT = 47.31 Mbps, GOT = 86.69 Mbps,GIT = 43.875 Mbps and DMT = 0 bpsDESIGN(4): GNC is located at X = 36, Y = 15, Z = 74.1multiaccess(33): ethernet, 1000000000 bps, 18 ports, $65000CT(121) is connected to port 1...CT(135) is connected to port 15GS(4) is connected to port 16server(1) has the following attributes:number of CPUs = 1CPU clock cycle = 5 nsmain memory capacity = 12000000 bytesinternal hard disk capacity = 1e+09 bytescost = $1000max performance = 100%, average performance = 99.4118%, min performance = 97.0588%hard disk(10) has the following attributes:type = SCSI, capacity = 3e+10 bytes, average seek time = 5 ms, transfer rate = 1.6e+08 bpscost = $3000 byesstored �les: 24, 22, 16, 11, 18, 2, 14, 13, 21, 6, 4, 5, 7, 19, 20.ST(6) is connected to port 17GROUP(14) has 15 client tasks, GLT = 7.94 Mbps, GOT = 0 Mbps,GIT = 72.195 Mbps and DMT = 0 bpsDESIGN(4): GNC is located at X = 46, Y = 16, Z = 74.1switch(24): atm, 150000000 bps, 20 ports, $28000CT(136) is connected to port 1
250

...CT(150) is connected to port 15GS(5) is connected to port 16server(4) has the following attributes:number of CPUs = 1, CPU clock cycle = 4 nsmain memory capacity = 32000000 bytes, internal hard disk capacity = 5e+09 bytescost = $2500max performance = 100%, average performance = 96%, min performance = 90%hard disk(12) has the following attributes:type = SCSI, capacity = 4e+10 bytes, average seek time = 5 ms, transfer rate = 1.6e+08 bpscost = $7000stored �les: 24, 16, 3, 18, 14, 15, 13, 1, 23, 21, 4, 5, 7, 19, 20.ST(6) is connected to port 17Enter the generation number from 0-4999:
A.6 Experiment 6
� The output of i -CAD for a complete intranet integration for the full animationsutdio, including a wide tree backbone topology, when TND = 60.0 secondsand the initial number of servers = 7.
Enter the generation number from 0-4999:1376Intranet infrastructure(15) is the best design in generation 1376initial network cost $741700, monthly network cost $68500interconnection cost $24000, wire cost $29555initial data management system cost $78000, data management ratio = 99.5419%average network delay = 46.8228 seconds, homogeneity factor = 0.32BACKBONE(1) has 6 site tasks, BLT = 209.575 Mbps and MDT = 4.86237e+07 bpsLink(1) connects sites: 4 and 6t-line(ds4): 264241152 bps, initial cost $30000 and monthly cost $13000Link(2) connects sites: 4 and 1t-line(vpc12-ds4/t-line): 198144000 bps, initial cost $8250 and monthly cost $9750Link(3) connects sites: 4 and 2sonet(oc7): 362880000 bps, initial cost $70000 and monthly cost $21000Link(4) connects sites: 1 and 5t-line(vpc12-ds4/t-line): 198144000 bps, initial cost $8250 and monthly cost $9750Link(5) connects sites: 2 and 3sonet(oc5): 259200000 bps, initial cost $50000 and monthly cost $15000SITE(1) has 2 group tasks, SLT = 0 Mbps, SOT = 55.625 Mbps,SIT = 2.5 Mbps and DMT = 2.95932e+06 bpsDESIGN(15): Site Switch is located at X = 36440, Y = 135233, Z = 1.1switch(22): atm, 150000000 bps, 10 ports, $15000GT(1) is connected to port 1GT(4) is connected to port 2LINK(2) is connected to port 3LINK(4) is connected to port 4GROUP(1) has 10 client tasks, GLT = 27 Mbps, GOT = 7.5 Mbps,GIT = 0 Mbps and DMT = 0 bps
251

DESIGN(15): GNC is located at X = 36427.5, Y = 135200, Z = 1.1switch(15): atm, 75000000 bps, 32 ports, $26000CT(1) is connected to port 1...CT(10) is connected to port 10ST(1) is connected to port 11GROUP(4) has 5 client tasks, GLT = 8 Mbps, GOT = 48.125 Mbps,GIT = 2.5 Mbps and DMT = 0 bpsDESIGN(15): GNC is located at X = 36465, Y = 135300, Z = 1.1multiaccess(19): ethernet, 100000000 bps, 14 ports, $16000CT(11) is connected to port 1...CT(15) is connected to port 5ST(1) is connected to port 6SITE(2) has 2 group tasks, SLT = 0 Mbps, SOT = 15 Mbps,SIT = 21.25 Mbps and DMT = 1.00011e+07 bpsDESIGN(15): Site Router is located at X = 11, Y = 119643, Z = 16.1router(14): ip, 150000 pps, 10 ports, $20000GT(2) is connected to port 1GT(5) is connected to port 2LINK(3) is connected to port 3LINK(5) is connected to port 4GROUP(2) has 5 client tasks, GLT = 2 Mbps, GOT = 2.5 Mbps,GIT = 2.5 Mbps and DMT = 0 bpsDESIGN(15): GNC is located at X = 11, Y = 119624, Z = 16.1switch(3): atm, 25000000 bps, 15 ports, $7000CT(16) is connected to port 1...CT(20) is connected to port 5ST(2) is connected to port 6GROUP(5) has 10 client tasks, GLT = 9 Mbps, GOT = 12.5 Mbps,GIT = 18.75 Mbps and DMT = 1.00011e+07 bpsDESIGN(15): GNC is located at X = 11, Y = 119652, Z = 16.1multiaccess(18): ethernet, 100000000 bps, 12 ports, $13000CT(21) is connected to port 1...CT(30) is connected to port 10GS(1) is connected to port 11server(4) has the following attributes:number of CPUs = 1, CPU clock cycle = 4 nsmain memory capacity = 32000000 bytes, internal hard disk capacity = 5e+09 bytescost = $2500max performance = 100%, average performance = 100%, min performance = 100%hard disk(18) has the following attributes:type = SCSI, capacity = 7e+10 bytes, average seek time = 5 ms, transfer rate = 1.6e+08 bpscost = $15000stored �les: 11, 3, 18, 2, 8, 9, 12, 15, 13, 23, 21, 4, 5, 19, 20.ST(2) is connected to port 12SITE(3) has 2 group tasks, SLT = 0 Mbps, SOT = 95 Mbps,
252

SIT = 33.75 Mbps and DMT = 1.67586e+07 bpsDESIGN(15): Site Router is located at X = 62452.4, Y = 119450, Z = 32.1router(29): ip, 1000000 pps, 5 ports, $40000GT(3) is connected to port 1GT(8) is connected to port 2LINK(5) is connected to port 3GROUP(3) has 10 client tasks, GLT = 9 Mbps, GOT = 15 Mbps,GIT = 7.5 Mbps and DMT = 0 bpsDESIGN(15): GNC is located at X = 62427.5, Y = 119485, Z = 32.1multiaccess(19): ethernet, 100000000 bps, 14 ports, $16000CT(31) is connected to port 1...CT(40) is connected to port 10ST(3) is connected to port 11GROUP(8) has 10 client tasks, GLT = 9 Mbps, GOT = 80 Mbps,GIT = 26.25 Mbps and DMT = 1.63694e+07 bpsDESIGN(15): GNC is located at X = 62477.4, Y = 119415, Z = 32.1multiaccess(30): ethernet, 1000000000 bps, 12 ports, $33000CT(41) is connected to port 1...CT(50) is connected to port 10GS(2) is connected to port 11server(8) has the following attributes:number of CPUs = 2, CPU clock cycle = 3 nsmain memory capacity = 64000000 bytes, internal hard disk capacity = 1.5e+10 bytescost = $5000max performance = 100%, average performance = 98.9535%, min performance = 97.093%hard disk(9) has the following attributes:type = IDE, capacity = 3e+10 bytes, average seek time = 10 ms, transfer rate = 6.6e+07 bpscost = $2000stored �les: 24, 16, 11, 3, 18, 8, 9, 12, 15, 13, 6, 7, 19, 20.ST(3) is connected to port 12SITE(4) has 2 group tasks, SLT = 4.2 Mbps, SOT = 7.5 Mbps,SIT = 35.625 Mbps and DMT = 6.57109e+06 bpsDESIGN(15): Site Router is located at X = 88454.1, Y = 93459.7, Z = 45.1router(17): ip, 200000 pps, 5 ports, $19000GT(6) is connected to port 1GT(7) is connected to port 2LINK(1) is connected to port 3LINK(2) is connected to port 4LINK(3) is connected to port 5GROUP(6) has 7 client tasks, GLT = 4.2 Mbps, GOT = 7.7 Mbps,GIT = 16.625 Mbps and DMT = 0 bpsDESIGN(15): GNC is located at X = 88415.4, Y = 93430.7, Z = 45.1multiaccess(16): ethernet, 100000000 bps, 8 ports, $9200CT(51) is connected to port 1...CT(57) is connected to port 7ST(4) is connected to port 8
253

GROUP(7) has 8 client tasks, GLT = 5.6 Mbps, GOT = 4 Mbps,GIT = 23.2 Mbps and DMT = 3.00592e+06 bpsDESIGN(15): GNC is located at X = 88488, Y = 93485.1, Z = 45.1switch(14): atm, 75000000 bps, 20 ports, $16000CT(58) is connected to port 1...CT(65) is connected to port 8GS(3) is connected to port 9server(12) has the following attributes:number of CPUs = 4, CPU clock cycle = 2 nsmain memory capacity = 512000000 bytes, internal hard disk capacity = 2.5e+10 bytescost = $15000max performance = 100%, average performance = 99.5181%, min performance = 98.7952%hard disk(15) has the following attributes:type = IDE, capacity = 6e+10 bytes, average seek time = 10 ms, transfer rate = 6.6e+07 bpscost = $8000stored �les: 16, 3, 17, 2, 8, 14, 9, 12, 15, 13, 10, 21, 5, 7, 19.ST(4) is connected to port 10SITE(5) has 3 group tasks, SLT = 21 Mbps, SOT = 18.95 Mbps,SIT = 57.5 Mbps and DMT = 3.15039e+07 bpsDESIGN(15): Site Switch is located at X = 57.475, Y = 15.25, Z = 34.6switch(21): atm, 150000000 bps, 5 ports, $11000GT(9) is connected to port 1GT(10) is connected to port 2GT(12) is connected to port 3LINK(4) is connected to port 4GROUP(9) has 10 client tasks, GLT = 1.98 Mbps, GOT = 25 Mbps,GIT = 20 Mbps and DMT = 0 bpsDESIGN(15): GNC is located at X = 32.5, Y = 5, Z = 12.1switch(24): atm, 150000000 bps, 20 ports, $28000CT(66) is connected to port 1...CT(75) is connected to port 10ST(5) is connected to port 11GROUP(10) has 10 client tasks, GLT = 18 Mbps, GOT = 6.99999 Mbps,GIT = 20 Mbps and DMT = 2.8498e+07 bpsDESIGN(15): GNC is located at X = 109.9, Y = 15, Z = 62.1switch(35): atm, 400000000 bps, 20 ports, $75000CT(76) is connected to port 1...CT(85) is connected to port 10GS(4) is connected to port 11server(10) has the following attributes:number of CPUs = 2, CPU clock cycle = 2.5 ns,main memory capacity = 256000000 bytes, internal hard disk capacity = 3e+10 bytescost = $9500max performance = 100%, average performance = 99.4805%, min performance = 98.7013%hard disk(19) has the following attributes:type = IDE, capacity = 8e+10 bytes, average seek time = 10 ms, transfer rate = 6.6e+07 bps
254

cost = $10000stored �les: 16, 3, 17, 18, 2, 8, 9, 15, 1, 21, 4, 7, 19.ST(5) is connected to port 12GROUP(12) has 20 client tasks, GLT = 40.5 Mbps, GOT = 7.95002 Mbps,GIT = 38.5 Mbps and DMT = 0 bpsDESIGN(15): GNC is located at X = 43.75, Y = 20.5, Z = 32.1switch(30): atm, 200000000 bps, 32 ports, $60000CT(86) is connected to port 1...CT(105) is connected to port 20ST(5) is connected to port 21SITE(6) has 3 group tasks, SLT = 100.565 Mbps, SOT = 17.5002 Mbps,SIT = 58.9502 Mbps and DMT = 3.87041e+07 bpsDESIGN(15): Site Router is located at X = 114238, Y = 93322.3, Z = 54.1router(17): ip, 200000 pps, 5 ports, $19000GT(11) is connected to port 1GT(13) is connected to port 2GT(14) is connected to port 3LINK(1) is connected to port 4GROUP(11) has 15 client tasks, GLT = 4.95 Mbps, GOT = 31.375 Mbps,GIT = 43.445 Mbps and DMT = 0 bpsDESIGN(15): GNC is located at X = 114232, Y = 93336, Z = 74.1multiaccess(21): ethernet, 100000000 bps, 18 ports, $22000CT(106) is connected to port 1...CT(120) is connected to port 15GS(5) is connected to port 16server(1) has the following attributes:number of CPUs = 1, CPU clock cycle = 5 nsmain memory capacity = 12000000 bytes, internal hard disk capacity = 1e+09 bytescost = $1000max performance = 100%, average performance = 99.7576%, min performance = 99.3939%hard disk(19) has the following attributes:type = IDE, capacity = 8e+10 bytes, average seek time = 10 ms, transfer rate = 6.6e+07 bpscost = $10000stored �les: 22, 16, 11, 17, 2, 8, 14, 9, 13, 4, 7, 19.ST(6) is connected to port 17GROUP(13) has 15 client tasks, GLT = 47.31 Mbps, GOT = 86.69 Mbps,GIT = 43.875 Mbps and DMT = 0 bpsDESIGN(15): GNC is located at X = 114336, Y = 93415, Z = 54.1multiaccess(33): ethernet, 1000000000 bps, 18 ports, $65000CT(121) is connected to port 1...CT(135) is connected to port 15ST(6) is connected to port 16GROUP(14) has 15 client tasks, GLT = 7.94 Mbps, GOT = 0 Mbps,GIT = 72.195 Mbps and DMT = 0 bpsDESIGN(15): GNC is located at X = 114146, Y = 93216, Z = 34.1multiaccess(33): ethernet, 1000000000 bps, 18 ports, $65000
255

CT(136) is connected to port 1...CT(150) is connected to port 15ST(6) is connected to port 16Enter the generation number from 0-4999:
� The output of i -CAD for a complete intranet integration for the full animationsutdio, including a wide tree backbone topology, when TND = 30.0 secondsand the initial number of servers = 7.
Enter the generation number from 0-4999:4456Intranet infrastructure(16) is the best design in generation 4456initial network cost $868000, monthly network cost $74000interconnection cost $70000, wire cost $49950.8initial data management system cost $141000, data management ratio = 99.3986%average network delay = 22.2633 seconds, homogeneity factor = 0.44BACKBONE(1) has 6 site tasks, BLT = 209.575 Mbps and MDT = 1.57543e+07 bpsLink(1) connects sites: 5 and 3t-line(ds4): 264241152 bps, initial cost $30000 and monthly cost $13000Link(2) connects sites: 3 and 4sonet(oc9): 466560000 bps, initial cost $90000 and monthly cost $27000Link(3) connects sites: 3 and 1sonet(oc3): 155520000 bps, initial cost $30000 and monthly cost $9000Link(4) connects sites: 5 and 2sonet(oc4): 207360000 bps, initial cost $40000 and monthly cost $12000Link(5) connects sites: 5 and 6t-line(ds4): 264241152 bps, initial cost $30000 and monthly cost $13000SITE(1) has 2 group tasks, SLT = 0 Mbps, SOT = 55.625 Mbps,SIT = 2.5 Mbps and DMT = 1.86554e+07 bpsDESIGN(16): Site Switch is located at X = 36440, Y = 135233, Z = 1.1switch(26): atm, 200000000 bps, 5 ports, $15000GT(1) is connected to port 1GT(4) is connected to port 2LINK(3) is connected to port 3GROUP(1) has 10 client tasks, GLT = 27 Mbps, GOT = 7.5 Mbps,GIT = 0 Mbps and DMT = 0 bpsDESIGN(16): GNC is located at X = 36427.5, Y = 135200, Z = 1.1multiaccess(20): ethernet, 100000000 bps, 16 ports, $19000CT(1) is connected to port 1...CT(10) is connected to port 10ST(1) is connected to port 11GROUP(4) has 5 client tasks, GLT = 8 Mbps, GOT = 48.125 Mbps,GIT = 2.5 Mbps and DMT = 1.86554e+07 bpsDESIGN(16): GNC is located at X = 36465, Y = 135300, Z = 1.1multiaccess(30): ethernet, 1000000000 bps, 12 ports, $33000CT(11) is connected to port 1...
256

CT(15) is connected to port 5GS(1) is connected to port 6server(1) has the following attributes:number of CPUs = 1, CPU clock cycle = 5 nsmain memory capacity = 12000000 bytes, internal hard disk capacity = 1e+09 bytescost = $1000max performance = 100%, average performance = 100%, min performance = 100%hard disk(18) has the following attributes:type = SCSI, capacity = 7e+10 bytes, average seek time = 5 ms, transfer rate = 1.6e+08 bpscost = $15000stored �les: 24, 22, 16, 11, 3, 17, 8, 14, 9, 15, 10, 7, 19.ST(1) is connected to port 7SITE(2) has 2 group tasks, SLT = 0 Mbps, SOT = 15 Mbps,SIT = 21.25 Mbps and DMT = 3.34147e+06 bpsDESIGN(16): Site Multiaccess device is located at X = 11, Y = 119643, Z = 16.1multiaccess(18): ethernet, 100000000 bps, 12 ports, $13000GT(2) is connected to port 1GT(5) is connected to port 2LINK(1) is connected to port 3GROUP(2) has 5 client tasks, GLT = 2 Mbps, GOT = 2.5 Mbps,GIT = 2.5 Mbps and DMT = 0 bpsDESIGN(16): GNC is located at X = 11, Y = 119624, Z = 16.1switch(29): atm, 200000000 bps, 20 ports, $40000CT(16) is connected to port 1...ST(2) is connected to port 6GROUP(5) has 10 client tasks, GLT = 9 Mbps, GOT = 12.5 Mbps,GIT = 18.75 Mbps and DMT = 0 bpsDESIGN(16): GNC is located at X = 11, Y = 119652, Z = 16.1switch(13): atm, 75000000 bps, 15 ports, $11000CT(21) is connected to port 1...CT(30) is connected to port 10ST(2) is connected to port 11SITE(3) has 2 group tasks, SLT = 0 Mbps, SOT = 95 Mbps,SIT = 33.75 Mbps and DMT = 389145 bpsDESIGN(16): Site Switch is located at X = 62452.4, Y = 119450, Z = 32.1switch(31): atm, 400000000 bps, 5 ports, $20000GT(3) is connected to port 1GT(8) is connected to port 2LINK(1) is connected to port 3LINK(2) is connected to port 4LINK(3) is connected to port 5GROUP(3) has 10 client tasks, GLT = 9 Mbps, GOT = 15 Mbps,GIT = 7.5 Mbps and DMT = 0 bpsDESIGN(16): GNC is located at X = 62427.5, Y = 119485, Z = 32.1switch(20): atm, 100000000 bps, 32 ports, $28000CT(31) is connected to port 1...
257
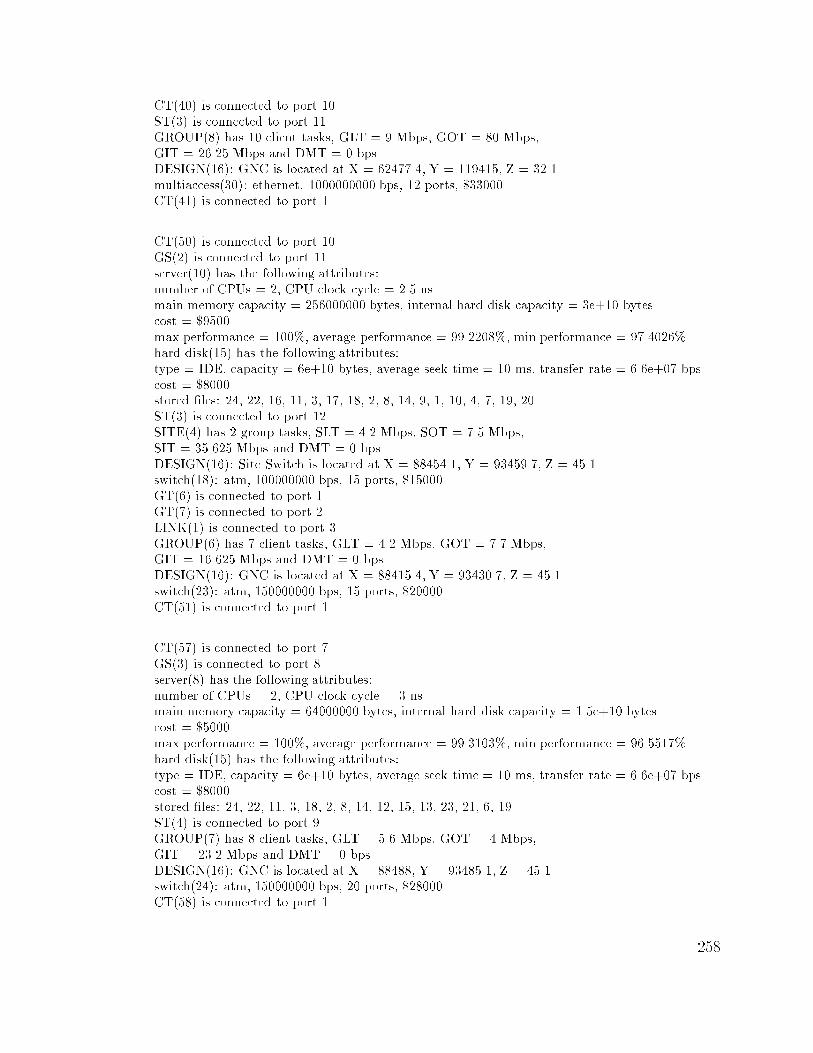
CT(40) is connected to port 10ST(3) is connected to port 11GROUP(8) has 10 client tasks, GLT = 9 Mbps, GOT = 80 Mbps,GIT = 26.25 Mbps and DMT = 0 bpsDESIGN(16): GNC is located at X = 62477.4, Y = 119415, Z = 32.1multiaccess(30): ethernet, 1000000000 bps, 12 ports, $33000CT(41) is connected to port 1...CT(50) is connected to port 10GS(2) is connected to port 11server(10) has the following attributes:number of CPUs = 2, CPU clock cycle = 2.5 nsmain memory capacity = 256000000 bytes, internal hard disk capacity = 3e+10 bytescost = $9500max performance = 100%, average performance = 99.2208%, min performance = 97.4026%hard disk(15) has the following attributes:type = IDE, capacity = 6e+10 bytes, average seek time = 10 ms, transfer rate = 6.6e+07 bpscost = $8000stored �les: 24, 22, 16, 11, 3, 17, 18, 2, 8, 14, 9, 1, 10, 4, 7, 19, 20.ST(3) is connected to port 12SITE(4) has 2 group tasks, SLT = 4.2 Mbps, SOT = 7.5 Mbps,SIT = 35.625 Mbps and DMT = 0 bpsDESIGN(16): Site Switch is located at X = 88454.1, Y = 93459.7, Z = 45.1switch(18): atm, 100000000 bps, 15 ports, $15000GT(6) is connected to port 1GT(7) is connected to port 2LINK(1) is connected to port 3GROUP(6) has 7 client tasks, GLT = 4.2 Mbps, GOT = 7.7 Mbps,GIT = 16.625 Mbps and DMT = 0 bpsDESIGN(16): GNC is located at X = 88415.4, Y = 93430.7, Z = 45.1switch(23): atm, 150000000 bps, 15 ports, $20000CT(51) is connected to port 1...CT(57) is connected to port 7GS(3) is connected to port 8server(8) has the following attributes:number of CPUs = 2, CPU clock cycle = 3 nsmain memory capacity = 64000000 bytes, internal hard disk capacity = 1.5e+10 bytescost = $5000max performance = 100%, average performance = 99.3103%, min performance = 96.5517%hard disk(15) has the following attributes:type = IDE, capacity = 6e+10 bytes, average seek time = 10 ms, transfer rate = 6.6e+07 bpscost = $8000stored �les: 24, 22, 11, 3, 18, 2, 8, 14, 12, 15, 13, 23, 21, 6, 19.ST(4) is connected to port 9GROUP(7) has 8 client tasks, GLT = 5.6 Mbps, GOT = 4 Mbps,GIT = 23.2 Mbps and DMT = 0 bpsDESIGN(16): GNC is located at X = 88488, Y = 93485.1, Z = 45.1switch(24): atm, 150000000 bps, 20 ports, $28000CT(58) is connected to port 1
258

...CT(65) is connected to port 8GS(4) is connected to port 9server(8) has the following attributes:number of CPUs = 2, CPU clock cycle = 3 nsmain memory capacity = 64000000 bytes, internal hard disk capacity = 1.5e+10 bytescost = $5000max performance = 100%, average performance = 100%, min performance = 100%hard disk(16) has the following attributes:type = SCSI, capacity = 6e+10 bytes, average seek time = 5 ms, transfer rate = 1.6e+08 bpscost = $11000stored �les: 22, 16, 18, 8, 14, 12, 15, 23, 21, 6, 4, 19, 20.ST(4) is connected to port 10SITE(5) has 3 group tasks, SLT = 21 Mbps, SOT = 18.95 Mbps,SIT = 57.5 Mbps and DMT = 1.20237e+07 bpsDESIGN(16): Site Multiaccess device is located at X = 57.475, Y = 15.25, Z = 34.6multiaccess(27): ethernet, 1000000000 bps, 6 ports, $13000GT(9) is connected to site task port 1 via a 2-port bridge with following attributes:Bridge(28), has capacity 5000000 frames per second and cost $14000GT(10) is connected to port 2GT(12) is connected to port 3LINK(1) is connected to port 4LINK(4) is connected to port 5LINK(5) is connected to port 6GROUP(9) has 10 client tasks, GLT = 1.98 Mbps, GOT = 25 Mbps,GIT = 20 Mbps and DMT = 0 bpsDESIGN(16): GNC is located at X = 32.5, Y = 5, Z = 12.1multiaccess(19): ethernet, 100000000 bps, 14 ports, $16000CT(66) is connected to port 1...CT(75) is connected to port 10ST(5) is connected to port 11GROUP(10) has 10 client tasks, GLT = 18 Mbps, GOT = 6.99999 Mbps,GIT = 20 Mbps and DMT = 0 bpsDESIGN(16): GNC is located at X = 109.9, Y = 15, Z = 62.1switch(33): atm, 400000000 bps, 15 ports, $55000CT(76) is connected to port 1...CT(85) is connected to port 10ST(5) is connected to port 11GROUP(12) has 20 client tasks, GLT = 40.5 Mbps, GOT = 7.95002 Mbps,GIT = 38.5 Mbps and DMT = 0 bpsDESIGN(16): GNC is located at X = 43.75, Y = 20.5, Z = 32.1switch(30): atm, 200000000 bps, 32 ports, $60000CT(86) is connected to port 1...CT(105) is connected to port 20ST(5) is connected to port 21SITE(6) has 3 group tasks, SLT = 100.565 Mbps, SOT = 17.5002 Mbps,
259
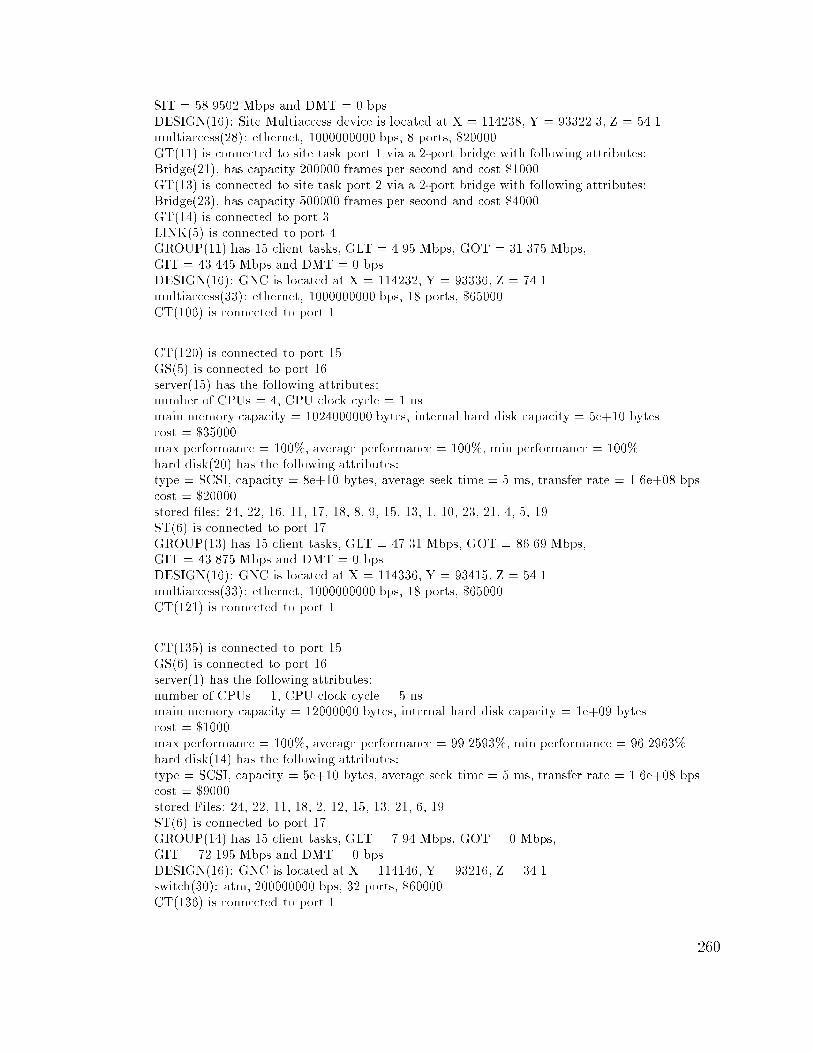
SIT = 58.9502 Mbps and DMT = 0 bpsDESIGN(16): Site Multiaccess device is located at X = 114238, Y = 93322.3, Z = 54.1multiaccess(28): ethernet, 1000000000 bps, 8 ports, $20000GT(11) is connected to site task port 1 via a 2-port bridge with following attributes:Bridge(21), has capacity 200000 frames per second and cost $1000GT(13) is connected to site task port 2 via a 2-port bridge with following attributes:Bridge(23), has capacity 500000 frames per second and cost $4000GT(14) is connected to port 3LINK(5) is connected to port 4GROUP(11) has 15 client tasks, GLT = 4.95 Mbps, GOT = 31.375 Mbps,GIT = 43.445 Mbps and DMT = 0 bpsDESIGN(16): GNC is located at X = 114232, Y = 93336, Z = 74.1multiaccess(33): ethernet, 1000000000 bps, 18 ports, $65000CT(106) is connected to port 1...CT(120) is connected to port 15GS(5) is connected to port 16server(15) has the following attributes:number of CPUs = 4, CPU clock cycle = 1 nsmain memory capacity = 1024000000 bytes, internal hard disk capacity = 5e+10 bytescost = $35000max performance = 100%, average performance = 100%, min performance = 100%hard disk(20) has the following attributes:type = SCSI, capacity = 8e+10 bytes, average seek time = 5 ms, transfer rate = 1.6e+08 bpscost = $20000stored �les: 24, 22, 16, 11, 17, 18, 8, 9, 15, 13, 1, 10, 23, 21, 4, 5, 19.ST(6) is connected to port 17GROUP(13) has 15 client tasks, GLT = 47.31 Mbps, GOT = 86.69 Mbps,GIT = 43.875 Mbps and DMT = 0 bpsDESIGN(16): GNC is located at X = 114336, Y = 93415, Z = 54.1multiaccess(33): ethernet, 1000000000 bps, 18 ports, $65000CT(121) is connected to port 1...CT(135) is connected to port 15GS(6) is connected to port 16server(1) has the following attributes:number of CPUs = 1, CPU clock cycle = 5 nsmain memory capacity = 12000000 bytes, internal hard disk capacity = 1e+09 bytescost = $1000max performance = 100%, average performance = 99.2593%, min performance = 96.2963%hard disk(14) has the following attributes:type = SCSI, capacity = 5e+10 bytes, average seek time = 5 ms, transfer rate = 1.6e+08 bpscost = $9000stored Files: 24, 22, 11, 18, 2, 12, 15, 13, 21, 6, 19.ST(6) is connected to port 17GROUP(14) has 15 client tasks, GLT = 7.94 Mbps, GOT = 0 Mbps,GIT = 72.195 Mbps and DMT = 0 bpsDESIGN(16): GNC is located at X = 114146, Y = 93216, Z = 34.1switch(30): atm, 200000000 bps, 32 ports, $60000CT(136) is connected to port 1
260

...CT(150) is connected to port 15GS(7) is connected to port 16server(10) has the following attributes:number of CPUs = 2, CPU clock cycle = 2.5 nsmain memory capacity = 256000000 bytes, internal hard disk capacity = 3e+10 bytescost = $9500max performance = 100%, average performance = 98%, min performance = 90%hard disk(11) has the following attributes:type = IDE, capacity = 4e+10 bytes, average seek time = 10 ms, transfer rate = 6.6e+07 bpscost = $4000stored �les: 24, 22, 17, 18, 8, 9, 12, 13, 10, 23, 21, 4, 5, 7, 19.ST(6) is connected to port 17Enter the generation number from 0-4999:
261

Appendix B
The Design Libraries
The design libraries for Ethernet hubs, ATM switches, IP routers, bridges, T-carrier
leasedlines, SONET leasedlines, VPN leasedlines, servers, hard disks, wires/cables
and interconnection network used by i -CAD experiments are given here.
Table B.1: Server library.
Device Number Main CPU Internal DeviceIdenti�cation of Memory Clock Hard Disk Cost
CPUs Capacity Cycle Capacity in Dollars
1 1 12Mbytes 5.0 ns 1Gbytes 1000.002 1 12Mbbytes 4.0 ns 3Gbytes 1500.003 1 32Mbytes 5.0 ns 5Gbytes 2000.004 1 32Mbytes 4.0 ns 5Gbytes 2500.005 1 64Mbytes 4.0 ns 10Gbytes 3000.006 1 64Mbytes 2.0 ns 10Gbytes 4000.007 2 32Mbytes 3.0 ns 10Gbytes 3000.008 2 64Mbytes 3.0 ns 15Gbytes 5000.009 2 128Mbytes 2.5 ns 30Gbytes 7500.0010 2 256Mbytes 2.5 ns 30Gbytes 9500.0011 4 256Mbytes 2.0 ns 20Gbytes 12000.0012 4 512Mbytes 2.0 ns 25Gbytes 15000.0013 4 512Mbytes 2.0 ns 30Gbytes 20000.0014 4 512Mbytes 2.0 ns 40Gbytes 25000.0015 4 1024Mbytes 1.0 ns 50Gbytes 35000.00
262

Table B.2: Hard Disk library.
Device Hard Total Average Transfer DeviceIdenti�cation Disk Capacity Seek Rate Cost
Type Time in Dollars
1 IDE 5Gbytes 10.0 ms 66Mbps 200.002 SCSI 5Gbytes 5.0 ms 160Mbps 400.003 IDE 10Gbytes 10.0 ms 66Mbps 300.004 SCSI 10Gbytes 5.0 ms 160Mbps 500.005 IDE 15Gbytes 10.0 ms 66Mbps 500.006 SCSI 15Gbytes 5.0 ms 160Mbps 1000.007 IDE 20Gbytes 10.0 ms 66Mbps 1500.008 SCSI 20Gbytes 5.0 ms 160Mbps 2000.009 IDE 30Gbytes 10.0 ms 66Mbps 2000.0010 SCSI 30Gbytes 5.0 ms 160Mbps 3000.0011 IDE 40Gbytes 10.0 ms 66Mbps 4000.0012 SCSI 40Gbytes 5.0 ms 160Mbps 7000.0013 IDE 50Gbytes 10.0 ms 66Mbps 7000.0014 SCSI 50Gbytes 5.0 ms 160Mbps 9000.0015 IDE 60Gbytes 10.0 ms 66Mbps 8000.0016 SCSI 60Gbytes 5.0 ms 160Mbps 11000.0017 IDE 70Gbytes 10.0 ms 66Mbps 9000.0018 SCSI 70Gbytes 5.0 ms 160Mbps 15000.0019 IDE 80Gbytes 10.0 ms 66Mbps 10000.0020 SCSI 80Gbytes 5.0 ms 160Mbps 20000.00
Table B.3: Wire/cable library.
Wire/Cable Cost (in Dollars) perType Foot
Twisted Pair 2.00Coxial Cable 10.00Fiber Optic 20.00
263

Table B.4: Bridge library.
Device Capacity BridgeIdenti�cation in Cost
Frames in Dollarsper Seconds
1 1000 20.002 2000 40.003 3000 60.004 4000 80.005 5000 100.006 10000 120.007 20000 140.008 30000 160.009 40000 180.0010 50000 200.0011 60000 220.0012 70000 240.0013 80000 260.0014 90000 280.0015 100000 300.0016 105000 320.0017 110000 340.0018 115000 360.0019 120000 380.0020 125000 400.0021 200000 1000.0022 300000 2000.0023 500000 4000.0024 700000 6000.0025 900000 8000.0026 1000000 10000.0027 3000000 12000.0028 5000000 14000.0029 7000000 16000.0030 9000000 18000.00
264

Table B.5: Ethernet Hub library.
Device Type Bandwidth Number Type DeviceIdenti�cation of (Mbps) of of Cost
Protocol Ports Wire in Dollars
1 CSMA/CD 10 2 twisted-pair 50.002 CSMA/CD 10 4 twisted-pair 100.003 CSMA/CD 10 6 twisted-pair 200.004 CSMA/CD 10 8 twisted-pair 320.005 CSMA/CD 10 10 twisted-pair 340.006 CSMA/CD 10 12 twisted-pair 400.007 CSMA/CD 10 14 twisted-pair 650.008 CSMA/CD 10 16 twisted-pair 900.009 CSMA/CD 10 18 twisted-pair 1000.0010 CSMA/CD 10 20 twisted-pair 1500.0011 CSMA/CD 10 25 twisted-pair 2500.0012 CSMA/CD 10 32 twisted-pair 5000.0013 CSMA/CD 100 2 twisted-pair 3500.0014 CSMA/CD 100 4 coaxial cable 6000.0015 CSMA/CD 100 6 twisted-pair 8000.0016 CSMA/CD 100 8 coaxial cable 9200.0017 CSMA/CD 100 10 twisted-pair 10400.0018 CSMA/CD 100 12 coaxial cable 13000.0019 CSMA/CD 100 14 twisted-pair 16000.0020 CSMA/CD 100 16 coaxial cable 19000.0021 CSMA/CD 100 18 twisted-pair 22000.0022 CSMA/CD 100 20 coaxial cable 25000.0023 CSMA/CD 100 25 twisted-pair 50000.0024 CSMA/CD 100 32 coaxial cable 75000.0025 CSMA/CD 1000 2 �ber optics 4000.0026 CSMA/CD 1000 4 �ber optics 8000.0027 CSMA/CD 1000 6 �ber optics 13000.0028 CSMA/CD 1000 8 �ber optics 20000.0029 CSMA/CD 1000 10 �ber optics 25000.0030 CSMA/CD 1000 12 �ber optics 33000.0031 CSMA/CD 1000 14 �ber optics 40000.0032 CSMA/CD 1000 16 �ber optics 45000.0033 CSMA/CD 1000 18 �ber optics 65000.0034 CSMA/CD 1000 20 �ber optics 80000.0035 CSMA/CD 1000 25 �ber optics 90000.0036 CSMA/CD 1000 32 �ber optics 100000.00
265

Table B.6: ATM switch library.
Device Bandwidth Number Type DeviceIdenti�cation (Mbps) of of Cost
Ports Wire in Dollars
1 25 5 twisted-pair 2000.002 25 10 twisted-pair 4000.003 25 15 twisted-pair 7000.004 25 20 twisted-pair 9000.005 25 32 twisted-pair 15000.006 45 5 twisted-pair 3000.007 45 10 twisted-pair 6000.008 45 15 twisted-pair 9000.009 45 20 twisted-pair 13000.0010 45 32 twisted-pair 20000.0011 75 5 twisted-pair 5000.0012 75 10 twisted-pair 8000.0013 75 15 twisted-pair 11000.0014 75 20 twisted-pair 16000.0015 75 32 twisted-pair 26000.0016 100 5 twisted-pair 7000.0017 100 10 twisted-pair 11000.0018 100 15 twisted-pair 15000.0019 100 20 coaxial cable 18000.0020 100 32 coaxial cable 28000.0021 150 5 coaxial cable 11000.0022 150 10 coaxial cable 15000.0023 150 15 coaxial cable 20000.0024 150 20 coaxial cable 28000.0025 150 32 coaxial cable 38000.0026 200 5 coaxial cable 15000.0027 200 10 coaxial cable 23000.0028 200 15 coaxial cable 33000.0029 200 20 coaxial cable 40000.0030 200 32 coaxial cable 60000.0031 400 5 �ber optics 20000.0032 400 10 �ber optics 35000.0033 400 15 �ber optics 55000.0034 400 20 �ber optics 75000.0035 400 32 �ber optics 90000.0036 622 32 �ber optics 250000.00
266

Table B.7: Router library.
Device Type Device Number Type DeviceIdenti�cation of Capacity of of Cost
Protocol Ports Wire in Dollars
1 IP 10Kpps 5 twisted-pair 1000.002 IP 10Kpps 10 twisted-pair 3000.003 IP 10Kpps 15 twisted-pair 10000.004 IP 10Kpps 20 twisted-pair 15000.005 IP 50Kpps 5 twisted-pair 3000.006 IP 50Kpps 10 twisted-pair 6000.007 IP 50Kpps 15 twisted-pair 20000.008 IP 50Kpps 20 twisted-pair 25000.009 IP 100Kpps 5 twisted-pair 7000.0010 IP 100Kpps 10 twisted-pair 11000.0011 IP 100Kpps 15 twisted-pair 35000.0012 IP 100Kpps 20 twisted-pair 45000.0013 IP 150Kpps 5 twisted-pair 11000.0014 IP 150Kpps 10 twisted-pair 20000.0015 IP 150Kpps 15 twisted-pair 40000.0016 IP 150Kpps 20 twisted-pair 55000.0017 IP 200Kpps 5 twisted-pair 19000.0018 IP 200Kpps 10 twisted-pair 31000.0019 IP 200Kpps 15 twisted-pair 55000.0020 IP 200Kpps 20 twisted-pair 70000.0021 IP 300Kpps 5 coaxial cable 25000.0022 IP 300Kpps 10 coaxial cable 40000.0023 IP 300Kpps 15 coaxial cable 75000.0024 IP 300Kpps 20 coaxial cable 90000.0025 IP 500Kpps 5 coaxial cable 30000.0026 IP 500Kpps 10 coaxial cable 55000.0027 IP 500Kpps 15 coaxial cable 80000.0028 IP 500Kpps 20 coaxial cable 100000.0029 IP 1000Kpps 5 �ber optics 40000.0030 IP 1000Kpps 10 �ber optics 60000.0031 IP 1000Kpps 15 �ber optics 100000.0032 IP 1000Kpps 20 �ber optics 150000.0033 IP 2000Kpps 5 �ber optics 60000.0034 IP 2000Kpps 10 �ber optics 800000.0035 IP 2000Kpps 15 �ber optics 1500000.0036 IP 2000Kpps 20 �ber optics 2000000.00
267

Table B.8: T-carrier library.
Line Line Line Initial MonthlyIdenti�cation Name Bandwidth Cost Cost
in Dollars in Dollars
1 DS0 64Kbps 1000.00 500.002 DS1 1.536Mbps 3000.00 1000.003 DS1c 3.072Mbps 5000.00 2000.004 DS2 6.144Mbps 7000.00 5000.005 DS3 44.032Mbps 15000.00 9000.006 DS4 264.192Mbps 30000.00 13000.00
Table B.9: SONET library.
Line Line Line Initial MonthlyIdenti�cation Name Bandwidth Cost Cost
in Dollars in Dollars
1 OC1 51.84Mbps 10000.00 3000.002 OC2 103.68Mbps 20000.00 6000.003 OC3 155.52Mbps 30000.00 9000.004 OC4 207.36Mbps 40000.00 12000.005 OC5 259.20Mbps 50000.00 15000.006 OC6 311.04Mbps 60000.00 18000.007 OC7 362.88Mbps 70000.00 21000.008 OC8 414.72Mbps 80000.00 24000.009 OC9 466.56Mbps 90000.00 27000.0010 OC10 518.40Mbps 100000.00 30000.0011 OC11 570.24Mbps 120000.00 33000.0012 OC12 622.08Mbps 140000.00 36000.0013 OC13 673.92Mbps 160000.00 39000.0014 OC14 725.76Mbps 180000.00 42000.0015 OC15 777.60Mbps 200000.00 45000.0016 OC16 829.44Mbps 230000.00 48000.0017 OC17 881.28Mbps 260000.00 51000.0018 OC18 933.12Mbps 290000.00 54000.0019 OC19 984.96Mbps 320000.00 57000.0020 OC20 1036.80Mbps 350000.00 60000.00
268

Table B.10: Virtual Private Network (VPN) library.
Line Line Precentage Line Initial MonthlyIdenti�cation Type of Line Bandwidth Cost Cost
leased in Dollars in Dollars
1 DS1 25% 384Kbps 250.00 125.002 DS1 50% 768Kbps 500.00 250.003 DS1 75% 1.152Mbps 750.00 375.004 DS2 25% 1.536Mbps 1750.00 1250.005 DS2 50% 3.072Mbps 3500.00 2500.006 DS2 75% 4.608Mbps 5250.00 3750.007 DS3 25% 11.008Mbps 2250.00 2250.008 DS3 50% 22.016Mbps 4500.00 4500.009 DS3 75% 33.024Mbps 6750.00 6750.0010 DS4 25% 66.048Mbps 2750.00 3250.0011 DS4 50% 132.096Mbps 5500.00 6500.0012 DS4 75% 198.144Mbps 8250.00 9750.0013 OC3 25% 38.880Mbps 7500.00 2500.0014 OC3 50% 77.760Mbps 15000.00 5500.0015 OC3 75% 116.640Mbps 22500.00 7000.0016 OC9 25% 116.640Mbps 22500.00 6750.0017 OC9 50% 233.280Mbps 45000.00 13500.0018 OC9 75% 349.920Mbps 67500.00 20250.0019 OC12 25% 155.520Mbps 35000.00 9000.0020 OC12 50% 311.040Mbps 70000.00 18000.0021 OC12 75% 466.560Mbps 105000.00 27000.0022 OC15 25% 194.400Mbps 50000.00 11250.0023 OC15 50% 388.800Mbps 100000.00 22500.0024 OC15 75% 583.200Mbps 150000.00 33750.0025 OC18 25% 233.280Mbps 72500.00 13500.0026 OC18 50% 466.560Mbps 145000.00 27000.0027 OC18 75% 699.840Mbps 217500.00 40500.0028 OC20 25% 259.200Mbps 87500.00 15000.0029 OC20 50% 518.400Mbps 175000.00 30000.0030 OC20 75% 777.600Mbps 262500.00 45000.00
269

Table B.11: Group-site interconnection network cost matrix.
Devices Ethernet ATM Router
Ethernet 0 2000 0ATM 4000 0 0
Table B.12: Site-backbone interconnection network cost matrix.
Devices Ethernet ATM Router T-carrier SONET VPN
Ethernet 0 2000 0 2000 6000 2000ATM 4000 0 0 2000 6000 2000Router 6000 6000 0 0 4000 0
270