Embed Size (px)
Citation preview
1
Master thesis in Materials
Science and Nanotechnology
Nebojsa Milanovic
Synthesis, structural
and magnetic
properties of layered
double hydroxides
60 credits
Department of Physics
Faculty of Mathematics and Natural
Sciences
UNIVERSITY OF OSLO
January 26/2016

2

3

4
5
Preface The work done in this master thesis has been done at the research group “Nanostructures and
Functional Materials” (NAFUMA) at the Department of Chemistry at the University of Oslo
between January 2014 and January 2016.
Professor Helmer Fjellvåg has been my supervisor and Professor Anja Olafsen Sjåstad has
been my secondary supervisor. I would like to thank them for introducing me to the exciting
world of anionic clays and scientific methods, and for guiding me through the process with
great patience and dedication.
I would also like to thank Dr. David Wragg and Dr. Susmit Kumar for their help. A thank you
also goes to Erik Glense whom I have shared office with. Thank you for all the help and for
the rewarding discussions.
A special thanks goes to my family and girlfriend Bojana who have been supporting during
this process.
Nebojsa Milanovic
University of Oslo, January 26, 2016

6
7
Abstract
Two main layered double hydroxide (LDH) systems were studied in this project; the
Nickel(II)-Manganese(III) LDH system, Ni1-xMnx(OH)2(An-)x/n∙mH2O and the
Magnesium(II)-Aluminum(III) LDH system, Mg1-xAlx(OH)2(An-)x/n∙mH2O. Two main
synthesis methods were used; the co-precipitation method and the urea hydrolysis method.
Post synthesis hydrothermal treatment was done on both syntheses methods in attempt to
increase the crystallinity of the product LDH. The synthesized materials were characterized
by powder diffraction (X-ray and neutron), thermogravimetry (TG) and magnetic
measurements (PPMS).
For the Ni1-xMnx(OH)2(An-)x/n∙mH2O LDH, the most crystalline samples were synthesized
with the co-precipitation method at non constant pH. The unit cell parameters were
determined with Rietveld refinement. Thermal decomposition studies were done on three
samples with the main motivation to find the full formulas of the samples. Results from the
thermal decomposition studies together with results from the Rietveld refinement of the P-
XRD of the calcined product at 900 °C were used to calculated the full formulas for the three
LDHs; Ni0.71Mn0.29(OH)2(CO3)0.15∙mH2O, Ni0.78Mn0.22(OH)2(CO3)0.11∙mH2O and
Ni0.84Mn0.16(OH)2(CO3)0.08∙mH2O.
Magnetic properties were studied the respective LDHs. Results indicate paramagnetic
behavior at high temperature (Curie-Weiss region), and ferromagnetic interactions below 17-
25 K (dependent on LDH composition). At low temperatures (>10 K) results suggest short
range antiferromagnetic interactions. This antiferromagnetic tendency increases with
increasing Mn content in the LDH.
The Mg1-xAlx(OH)2(An-)x/n∙mH2O LDHs were synthesized with the urea method. Unit cell
parameters were determined with Rietveld refinement, and were used to indicate the
aluminum content in the LDHs. Attempts were done to synthesize MgAl LDHs with nitrate as
the interlayer anion with a modified urea synthesis. Parameters such as pH, temperature and
addition of nitrate were tuned, but it was not successful to synthesize pure nitrate containing
MgAl LDHs using the urea method. However, a mix of nitrate and carbonate containing
MgAl LDH was found.

8
Neutron diffraction was used in order to investigate possible long-range ordering of metal
cations in a MgAl LDH. There were difficulties associated with the Rietveld fit, However, the
lack of expected super structure Bragg reflections indicate no long range cation ordering.
9
Table of contents Preface ................................................................................................................................................. 5
Abstract ............................................................................................................................................... 7
1. Introduction ................................................................................................................................... 11
1.1 Introduction to hydrotalcite like compounds and layered double hydroxides ....................... 11
1.2 Structural aspects ................................................................................................................... 12
1.3 Synthesis and structural aspects ............................................................................................ 16
1.4 Thermal decomposition ......................................................................................................... 21
1.5 Magnetic properties ............................................................................................................... 25
1.6 Motivation ............................................................................................................................. 28
2. Method and theory ......................................................................................................................... 29
2.1 Synthesis ...................................................................................................................................... 29
2.1.1 Co-precipitation: ............................................................................................................ 29
2.1.2 Urea method .................................................................................................................. 31
2.1.3 Hydrothermal treatment ................................................................................................. 32
2.1.4 Ion exchange .................................................................................................................. 32
2.2 Powder X-ray diffraction ............................................................................................................. 33
2.3 Neutron diffraction ...................................................................................................................... 39
2.4 Rietveld method .......................................................................................................................... 40
2.5 Thermogravimetry (TG) and differential scanning calorimetry (DSC) ...................................... 41
2.6 Magnetic studies .......................................................................................................................... 42
3. Experimental ................................................................................................................................. 49
3.1 Synthesis:............................................................................................................................... 49
3.1.1 Nickel(II)-Manganese(III) LDH system, Ni1-xMnx(OH)2(An-)x/n∙mH2O:..................... 50
3.1.2 Magnesium(II)-Aluminum(III) LDH system, Mg1-xAlx(OH)2(An-)x/n∙mH2O: ............. 54
3.2 Characterization: ......................................................................................................................... 59
3.2.1 Powder X-ray diffraction:..................................................................................................... 59
3.2.2 Thermal analysis (TG/DSC) ................................................................................................. 59
3.2.3 Magnetic measurements ....................................................................................................... 60
4. Results ............................................................................................................................................... 61
4.1 Synthesis and characterization of NiMn-LDHs..................................................................... 61
4.1.1 XRD data of NiMn-LDH samples ................................................................................. 61
4.1.2 NiMn-LDHs unit cell parameters, evaluation of impurities and crystallinity ...................... 71
4.1.3 Different approaches to improve NiMn LDH products ........................................................ 72
10
4.2 Synthesis and characterization of MgAl-LDHs..................................................................... 80
4.2.1 XRD data of MgAl-LDH samples ........................................................................................ 80
4.2.2 MgAl-LDHs unit cell parameters obtained from Rietveld refinement ................................. 91
4.2.3 Hydrothermal treatment as approach to improve MgAl LDH products ................................... 92
4.3 Thermal stability .......................................................................................................................... 95
4.3.1 High temperature synchrotron data .................................................................................... 104
4.4 Structure analysis with neutron diffraction ............................................................................... 108
4.5 Physical properties ........................................................................................................................ 110
5. Discussion ....................................................................................................................................... 121
5.1. Ni1xMnx(OH)2(CO3)x/2mH2O LDH ........................................................................................ 121
5.1.1 Synthesis, crystallinity and lattice parameters for NiMn ................................................... 121
5.1.2 Thermal decomposition and analysis of calcined product .................................................. 124
5.1.3 Magnetic properties ............................................................................................................ 126
5.2. Mg1xAlx(OH)2(CO3)x/2mH2O LDH ........................................................................................ 127
5.2.1 Synthesis, phase purity and lattice parameters ................................................................... 127
6. Conclusions ..................................................................................................................................... 129
7. Further research: .............................................................................................................................. 130
8. Appendix A ...................................................................................................................................... 130
9.References ........................................................................................................................................ 131
11
1. Introduction
This chapter will give an introduction to hydrotalcite like compounds and layered double
hydroxides, their possible applications, structural aspects, thermal stability and physical
properties. A motivation for the work will also be presented.
1.1 Introduction to hydrotalcite like compounds and layered double
hydroxides
The naturally occurring mineral hydrotalcite, Mg6Al2(OH)16(CO3)∙4H2O, was discovered in
Sweden around year 1842. Hydrotalcite is the prototype of hydrotalcite like materials which is
a sub group of layered double hydroxides (LDHs), which again is a sub group of anionic clays.
Hydrotalcite like compounds are promising for a large number of possible applications of
scientific and industrial interest. This has much to do due to their high versatility, easily
manipulated properties, wide range of composition and preparation techniques and relatively
low cost associated, which makes it possible to produce tailor made materials to fulfill
specific requirements [1]. Hydrotalcite like compounds are widely used as polymer stabilizers,
catalysts or precursors for catalysts [2, 3]. One such example is the mixed metal oxide catalyst
Ni/Mg(Al)O with various Ni/Mg ratio, obtained from hydrotalcite like precursors[4]. This is a
very active catalyst for methane and propane dry reforming and exhibits exceptional stability
[4]. Hydrotalcite like compounds are promising adsorbent materials, including carbon dioxide
capture [5]. Research has also been done on LDHs with different metal cations used to
recover phosphate in waste sludge from wastewater [6]. LDHs, including magnetic LDHs and
LDH-based nanocomposites have been extensively studied in biomedicine-related fields, with
promising properties for controlled drug delivery and release [7, 8].
12
1.2 Structural aspects
The crystal structure of hydrotalcite like materials and LDHs is conveniently described in
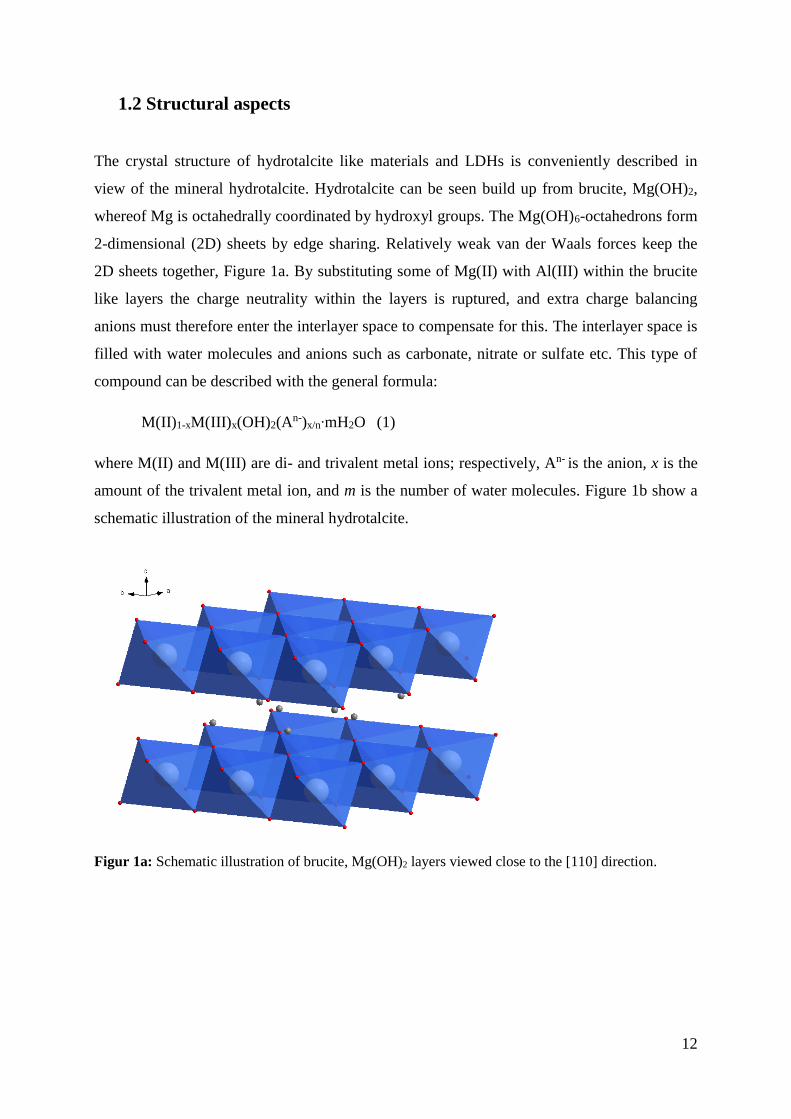
view of the mineral hydrotalcite. Hydrotalcite can be seen build up from brucite, Mg(OH)2,
whereof Mg is octahedrally coordinated by hydroxyl groups. The Mg(OH)6-octahedrons form
2-dimensional (2D) sheets by edge sharing. Relatively weak van der Waals forces keep the
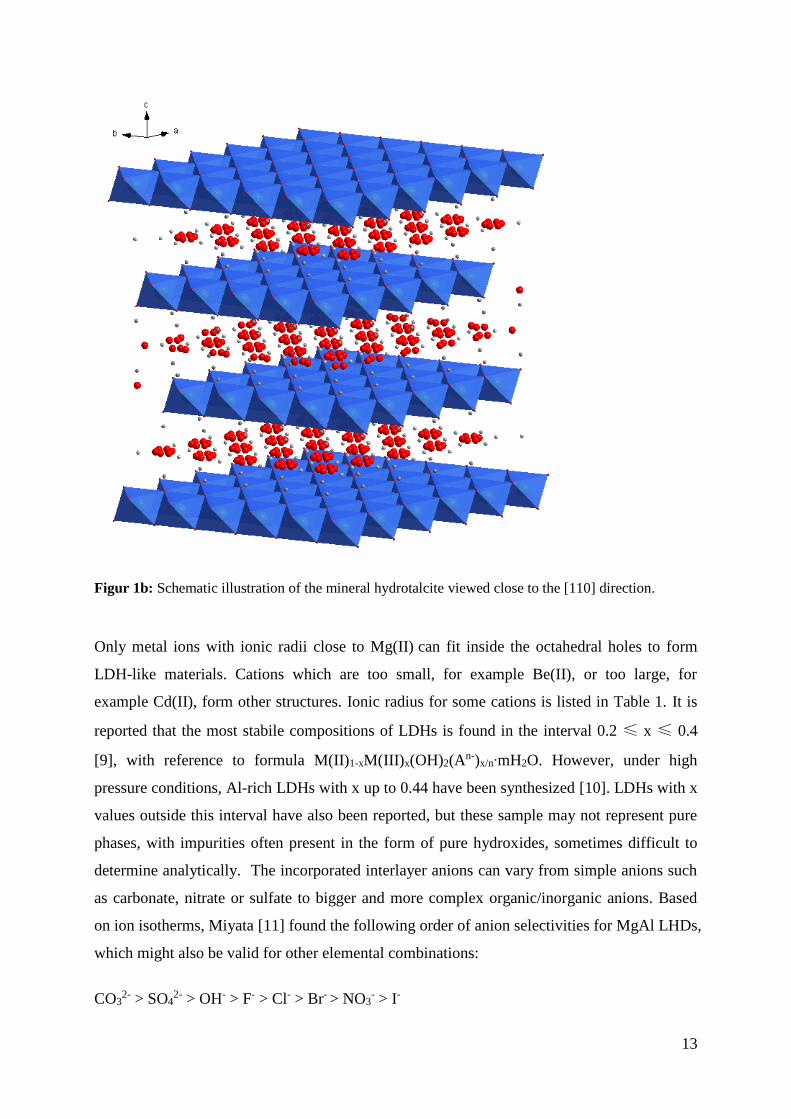
2D sheets together, Figure 1a. By substituting some of Mg(II) with Al(III) within the brucite
like layers the charge neutrality within the layers is ruptured, and extra charge balancing
anions must therefore enter the interlayer space to compensate for this. The interlayer space is
filled with water molecules and anions such as carbonate, nitrate or sulfate etc. This type of
compound can be described with the general formula:
M(II)1-xM(III)x(OH)2(An-)x/n∙mH2O (1)
where M(II) and M(III) are di- and trivalent metal ions; respectively, An- is the anion, x is the
amount of the trivalent metal ion, and m is the number of water molecules. Figure 1b show a
schematic illustration of the mineral hydrotalcite.
Figur 1a: Schematic illustration of brucite, Mg(OH)2 layers viewed close to the [110] direction.
13
Figur 1b: Schematic illustration of the mineral hydrotalcite viewed close to the [110] direction.
Only metal ions with ionic radii close to Mg(II) can fit inside the octahedral holes to form
LDH-like materials. Cations which are too small, for example Be(II), or too large, for
example Cd(II), form other structures. Ionic radius for some cations is listed in Table 1. It is
reported that the most stabile compositions of LDHs is found in the interval 0.2 ≤ x ≤ 0.4
[9], with reference to formula M(II)1-xM(III)x(OH)2(An-)x/n∙mH2O. However, under high
pressure conditions, Al-rich LDHs with x up to 0.44 have been synthesized [10]. LDHs with x
values outside this interval have also been reported, but these sample may not represent pure
phases, with impurities often present in the form of pure hydroxides, sometimes difficult to
determine analytically. The incorporated interlayer anions can vary from simple anions such
as carbonate, nitrate or sulfate to bigger and more complex organic/inorganic anions. Based
on ion isotherms, Miyata [11] found the following order of anion selectivities for MgAl LHDs,
which might also be valid for other elemental combinations:
CO32- > SO4
2- > OH- > F- > Cl- > Br- > NO3- > I-
14
This order shows that the divalent carbonate anion has the highest affinity to the LDH
interlayer space while monovalent anions like nitrate or iodide are much less attacked [12].
Table 1: Ionic radius of some cations, Å [13].
Referring to figure 1b, the anions and water molecules in the LDH are randomly located in the
interlayer region, being free to move by breaking their bonds and forming new ones [13].
Hydrogen bonds between hydroxide groups, anions and water molecules hold the layers
together. The hydroxides are either connected to the anions An- directly or through the water
molecules to form hydrogen bridges: OH-An--HO or OH-H2O-An--HO [14]. The carbonate
groups in hydrotalcite-like materials are oriented horizontally in the interlayer gallery, and the
water molecules can be removed reversibly without destroying the LDH structure [14]. For
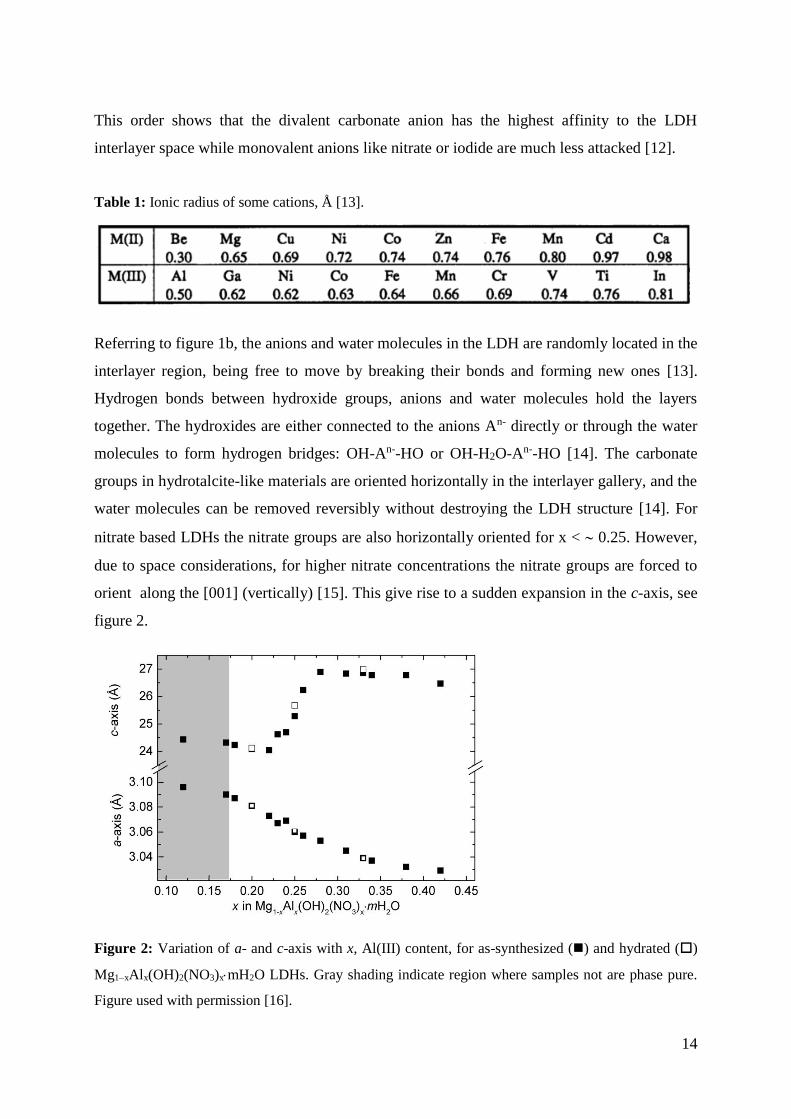
nitrate based LDHs the nitrate groups are also horizontally oriented for x < 0.25. However,
due to space considerations, for higher nitrate concentrations the nitrate groups are forced to
orient along the [001] (vertically) [15]. This give rise to a sudden expansion in the c-axis, see
figure 2.
Figure 2: Variation of a- and c-axis with x, Al(III) content, for as-synthesized () and hydrated ()
Mg1xAlx(OH)2(NO3)xmH2O LDHs. Gray shading indicate region where samples not are phase pure.
Figure used with permission [16].
15
For hydrotalcite, the brucite like layers can stack one on another with two different lattice
centerings, rombohedral or hexagonal, denoted as R and H, respectively. This give rise to a
large number of polytypes of LDHs, with two-, three- and six-layers. Brucite like layers
taking rombohedral lattice centering have the stacking sequence ABC and thus three layers in
the unit cell. Brucite like layers taking the hexagonal lattice centering have the stacking
sequence AB and thus two layers in the unit cell.
Typical examples of polytypes are the two-layer mineral manasseite with hexagonal
symmetry (2H) and the three-layer mineral hydrotalcite with rhombohedral symmetry (3R).
These two polytypes are often intergrown [10]. Among the varieties with carbonate as the
interlayer anions, only two- and three-layer polytypes have been confirmed to have the same
structure as hydrotalcite [17], which are the ones that we will focus on here. The regular 3R
hydrotalcite is described in space group R-3m using a hexagonal unit cell, where a = b ≠ c,
and α = β = 90o and γ = 120o. The unit cell dimensions for hydrotalcite itself is a= 3.05 Å, and
c = 23.0 Å. The a-axis is particular sensitive to the nature of cations and the degree of M(III)
substitution whereas the c-axis is influenced by the size of the anion (An-) and water content
(m) [15].
Hydrotalcite like compounds are described with very long formulas. For the sake of
simplification, we introduce some abbreviated notations, which indicate type of cations
involved. In the following occasionally Mg1-xAlx(OH)2(CO3)x/2∙mH2O and Ni1-
xMnx(OH)2(CO3)x/2∙mH2O will be denoted MgAl LDH and NiMn LDH, respectively. Anions
may also be specified, e.g. MgAl-CO3 and MgAl-NO3 denote the LDHs to have carbonate
and nitrate as charge balancing anion in the interlayer gallery.
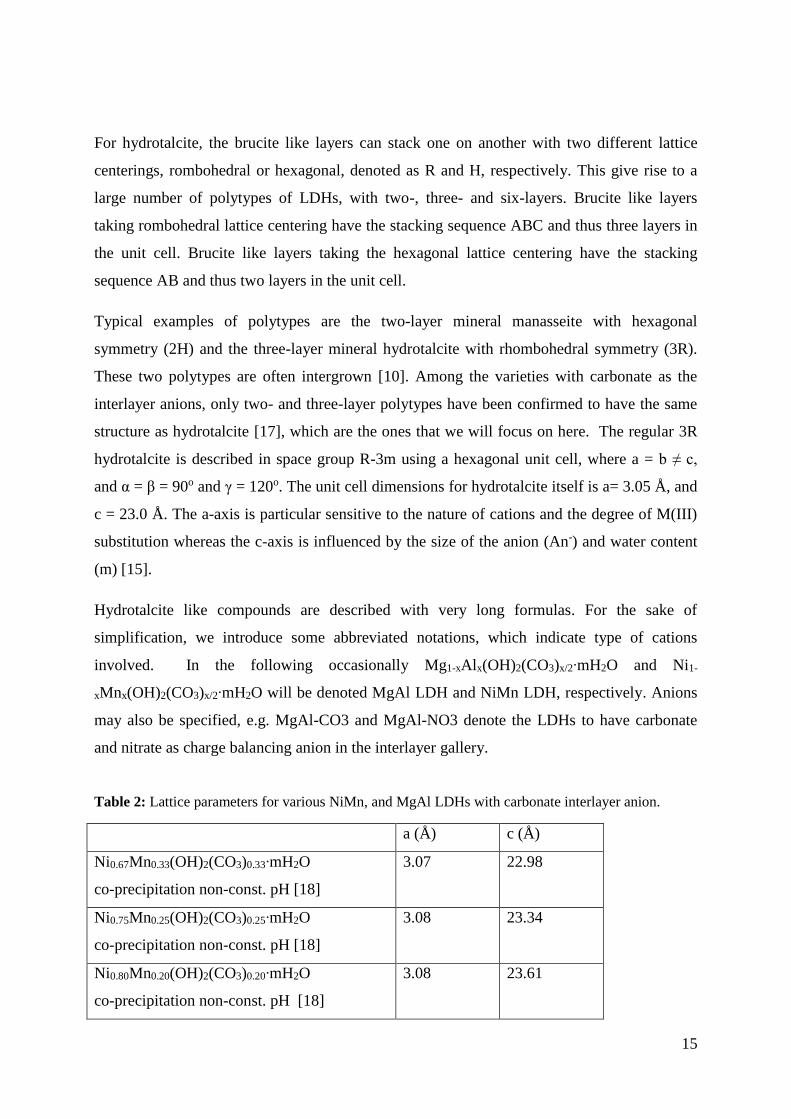
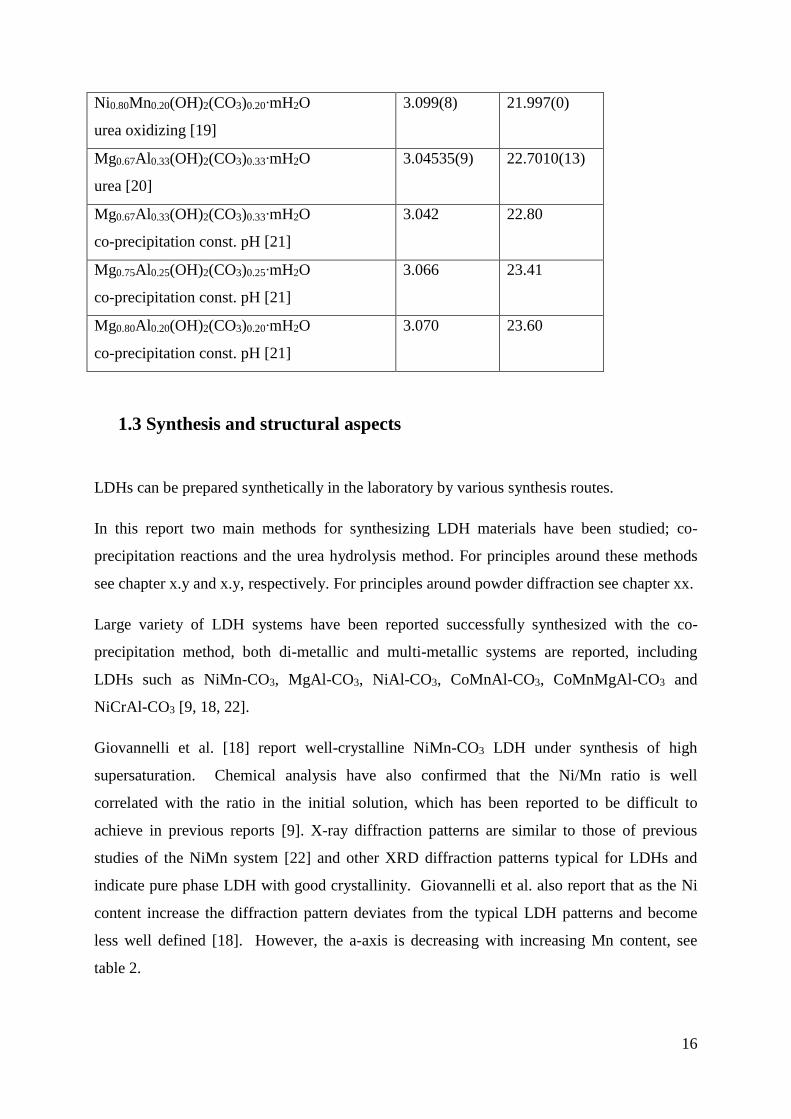
Table 2: Lattice parameters for various NiMn, and MgAl LDHs with carbonate interlayer anion.
a (Å) c (Å)
Ni0.67Mn0.33(OH)2(CO3)0.33∙mH2O
co-precipitation non-const. pH [18]
3.07 22.98
Ni0.75Mn0.25(OH)2(CO3)0.25∙mH2O
co-precipitation non-const. pH [18]
3.08 23.34
Ni0.80Mn0.20(OH)2(CO3)0.20∙mH2O
co-precipitation non-const. pH [18]
3.08 23.61
16
Ni0.80Mn0.20(OH)2(CO3)0.20∙mH2O
urea oxidizing [19]
3.099(8) 21.997(0)
Mg0.67Al0.33(OH)2(CO3)0.33∙mH2O
urea [20]
3.04535(9) 22.7010(13)
Mg0.67Al0.33(OH)2(CO3)0.33∙mH2O
co-precipitation const. pH [21]
3.042 22.80
Mg0.75Al0.25(OH)2(CO3)0.25∙mH2O
co-precipitation const. pH [21]
3.066 23.41
Mg0.80Al0.20(OH)2(CO3)0.20∙mH2O
co-precipitation const. pH [21]
3.070 23.60
1.3 Synthesis and structural aspects
LDHs can be prepared synthetically in the laboratory by various synthesis routes.
In this report two main methods for synthesizing LDH materials have been studied; co-
precipitation reactions and the urea hydrolysis method. For principles around these methods
see chapter x.y and x.y, respectively. For principles around powder diffraction see chapter xx.
Large variety of LDH systems have been reported successfully synthesized with the co-
precipitation method, both di-metallic and multi-metallic systems are reported, including
LDHs such as NiMn-CO3, MgAl-CO3, NiAl-CO3, CoMnAl-CO3, CoMnMgAl-CO3 and
NiCrAl-CO3 [9, 18, 22].
Giovannelli et al. [18] report well-crystalline NiMn-CO3 LDH under synthesis of high
supersaturation. Chemical analysis have also confirmed that the Ni/Mn ratio is well
correlated with the ratio in the initial solution, which has been reported to be difficult to
achieve in previous reports [9]. X-ray diffraction patterns are similar to those of previous
studies of the NiMn system [22] and other XRD diffraction patterns typical for LDHs and
indicate pure phase LDH with good crystallinity. Giovannelli et al. also report that as the Ni
content increase the diffraction pattern deviates from the typical LDH patterns and become
less well defined [18]. However, the a-axis is decreasing with increasing Mn content, see
table 2.
17
Chang et al. [19] have recently reported NiMn based LDHs with good crystallinity and
uniform morphology produced hydrothermally at 180 °C for 2 days using a modified urea
hydrolysis method with ammonium persulfate as an oxidant.
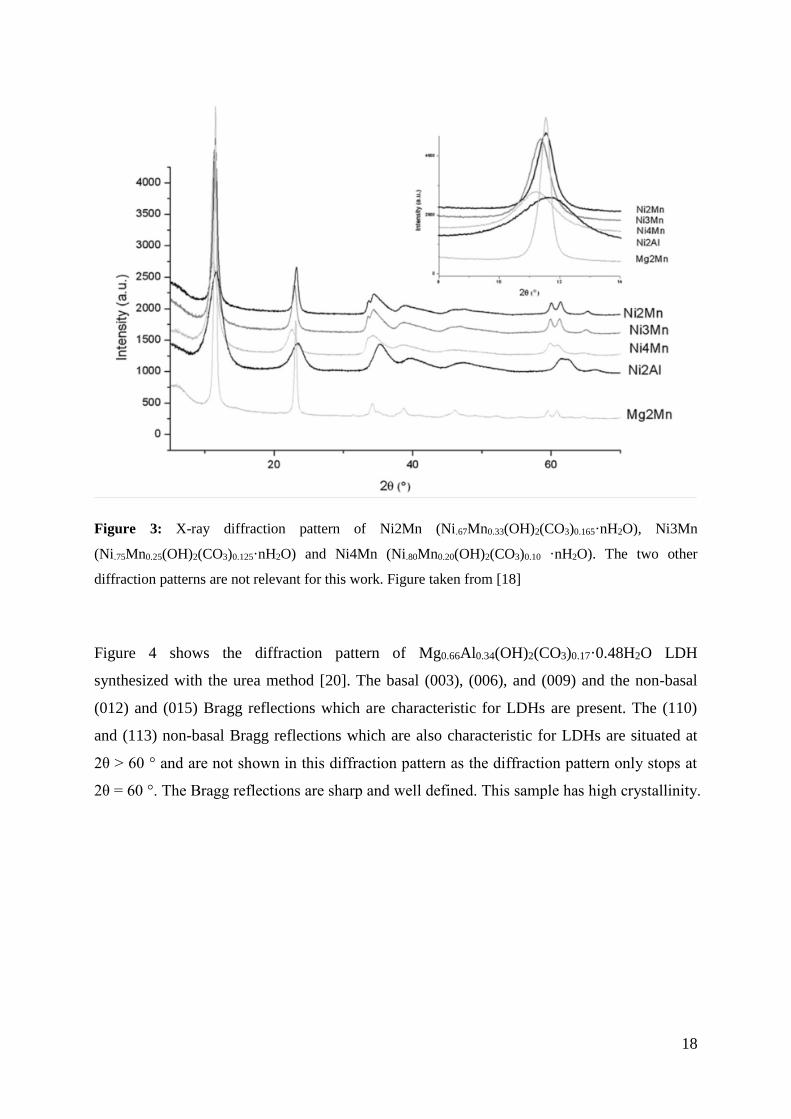
Diffraction patterns of Ni.67Mn0.33(OH)2(CO3)0.165·nH2O, Ni.75Mn0.25(OH)2(CO3)0.125·nH2O
and Ni.80Mn0.20(OH)2(CO3)0.10 ·nH2O synthesized with the co-precipitation method with non-
constant pH are shown in figure 3 [18]. The sample Bragg reflections as for the
aforementioned MgAl LDH are present, but are in general less defined and broader. The most
significant difference is around the (012), (009) and (015) Bragg reflections which are not
separated peaks as for the MgAl LDH. The (110) and (113) Bragg reflections at around 2θ =
60 ° are significantly more defined for the Ni.67Mn0.33(OH)2(CO3)0.165·nH2O and
Ni.75Mn0.25(OH)2(CO3)0.125·nH2O LDHs compared to the Ni.80Mn0.20(OH)2(CO3)0.10 ·nH2O.
This is in agreement of the general trend that LDHs with x = 0.33 have the highest
crystallinity.
The diffraction patterns of NiMn LDHs show generally lesser crystallinity than the diffraction
patterns for the urea synthesized MgAl LDH, which again confirms the superiority of the urea
method when it comes to crystallinity.
18
Figure 3: X-ray diffraction pattern of Ni2Mn (Ni.67Mn0.33(OH)2(CO3)0.165·nH2O), Ni3Mn
(Ni.75Mn0.25(OH)2(CO3)0.125·nH2O) and Ni4Mn (Ni.80Mn0.20(OH)2(CO3)0.10 ·nH2O). The two other
diffraction patterns are not relevant for this work. Figure taken from [18]
Figure 4 shows the diffraction pattern of Mg0.66Al0.34(OH)2(CO3)0.17·0.48H2O LDH
synthesized with the urea method [20]. The basal (003), (006), and (009) and the non-basal
(012) and (015) Bragg reflections which are characteristic for LDHs are present. The (110)
and (113) non-basal Bragg reflections which are also characteristic for LDHs are situated at
2θ > 60 ° and are not shown in this diffraction pattern as the diffraction pattern only stops at
2θ = 60 °. The Bragg reflections are sharp and well defined. This sample has high crystallinity.

19
Figure 4: X-ray diffraction pattern of Mg0.66Al0.34(OH)2(CO3)0.17 ·0.48H2O. Figure taken from [20].
A. Inayat et al. [12] have recently reported direct synthesis of ZnAl LDhs with nitrate as the
interlayer anion using the urea method. This is achieved by careful control of the pH of the
solution and by adding an excess of nitrate, the intercalation of interlayer anion can be
manipulated to other interlayer anions such as nitrate, as well. The transition from pure nitrate
phase to pure carbonate phase is well documented by A. Inayat et al. The results show the
transition of pure phase of nitrate at pH < 7, via mixed phase at pH = 7, to pure carbonate
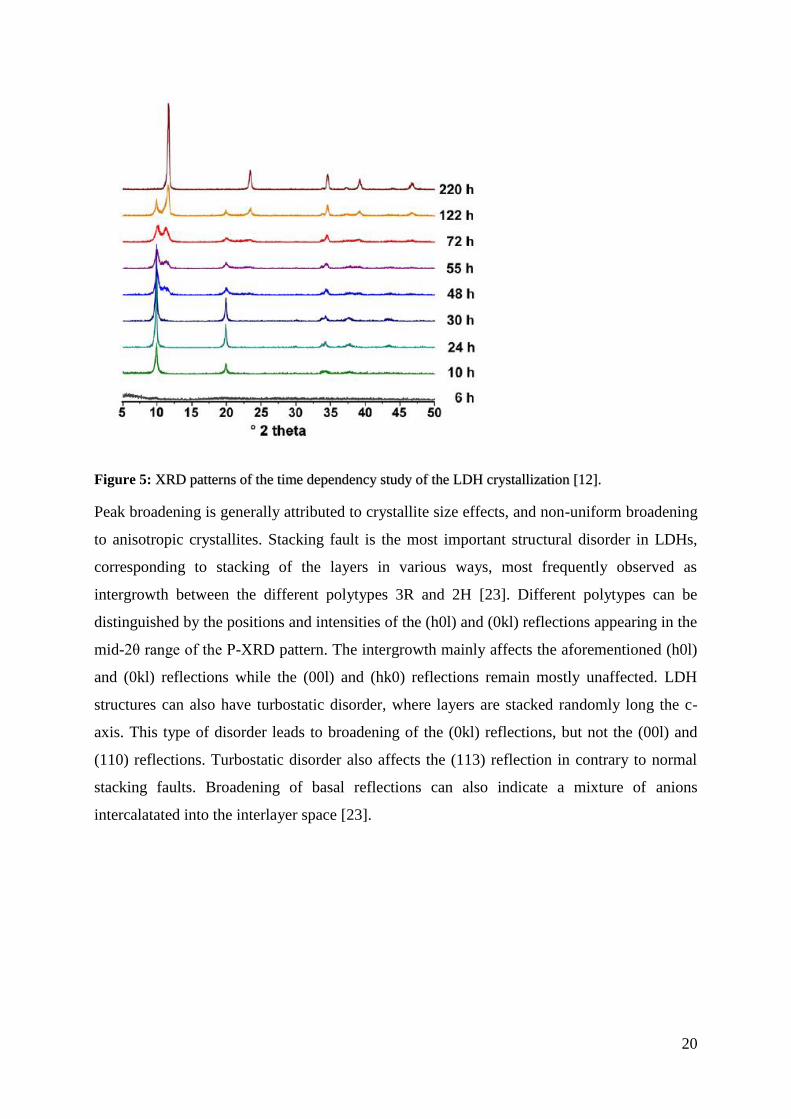
LDH at pH > 7, as figure 3 shows. P-XRD patterns of the time dependency study are shown
in figure 5.
20
Figure 5: XRD patterns of the time dependency study of the LDH crystallization [12].
Peak broadening is generally attributed to crystallite size effects, and non-uniform broadening
to anisotropic crystallites. Stacking fault is the most important structural disorder in LDHs,
corresponding to stacking of the layers in various ways, most frequently observed as
intergrowth between the different polytypes 3R and 2H [23]. Different polytypes can be
distinguished by the positions and intensities of the (h0l) and (0kl) reflections appearing in the
mid-2θ range of the P-XRD pattern. The intergrowth mainly affects the aforementioned (h0l)
and (0kl) reflections while the (00l) and (hk0) reflections remain mostly unaffected. LDH
structures can also have turbostatic disorder, where layers are stacked randomly long the c-
axis. This type of disorder leads to broadening of the (0kl) reflections, but not the (00l) and
(110) reflections. Turbostatic disorder also affects the (113) reflection in contrary to normal
stacking faults. Broadening of basal reflections can also indicate a mixture of anions
intercalatated into the interlayer space [23].
21
1.4 Thermal decomposition
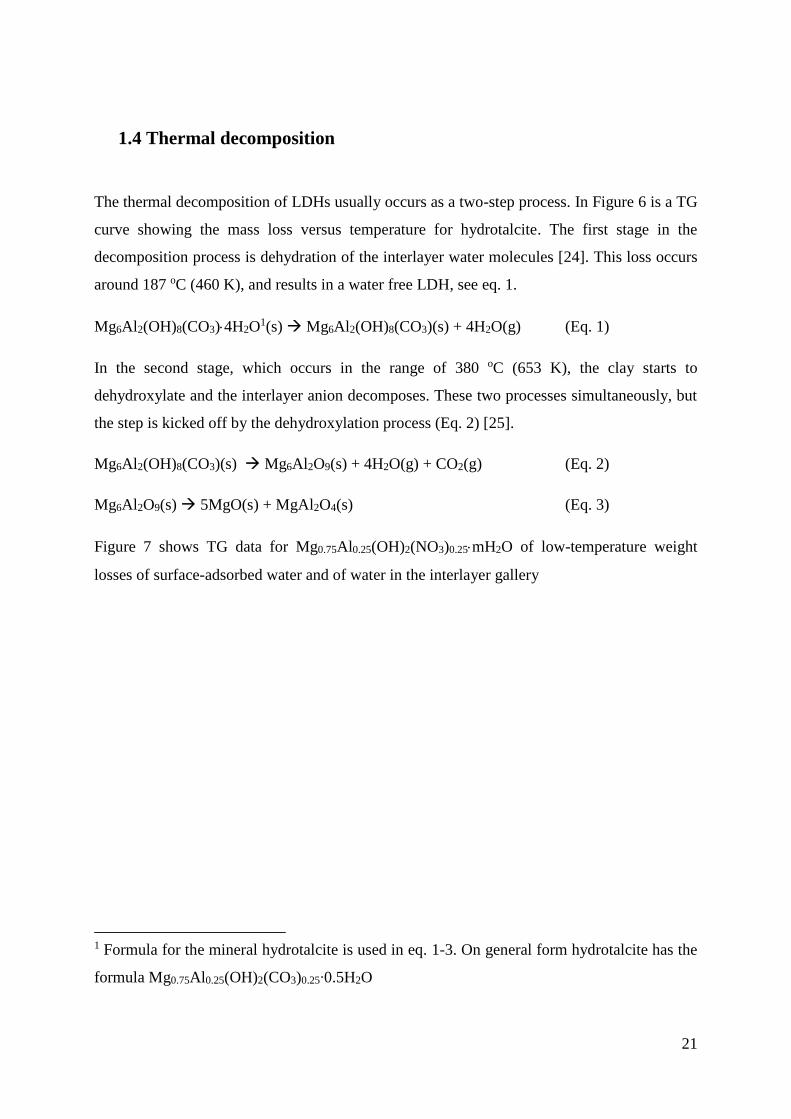
The thermal decomposition of LDHs usually occurs as a two-step process. In Figure 6 is a TG
curve showing the mass loss versus temperature for hydrotalcite. The first stage in the
decomposition process is dehydration of the interlayer water molecules [24]. This loss occurs
around 187 oC (460 K), and results in a water free LDH, see eq. 1.
Mg6Al2(OH)8(CO3)4H2O1(s) Mg6Al2(OH)8(CO3)(s) + 4H2O(g) (Eq. 1)
In the second stage, which occurs in the range of 380 oC (653 K), the clay starts to
dehydroxylate and the interlayer anion decomposes. These two processes simultaneously, but
the step is kicked off by the dehydroxylation process (Eq. 2) [25].
Mg6Al2(OH)8(CO3)(s) Mg6Al2O9(s) + 4H2O(g) + CO2(g) (Eq. 2)
Mg6Al2O9(s) 5MgO(s) + MgAl2O4(s) (Eq. 3)
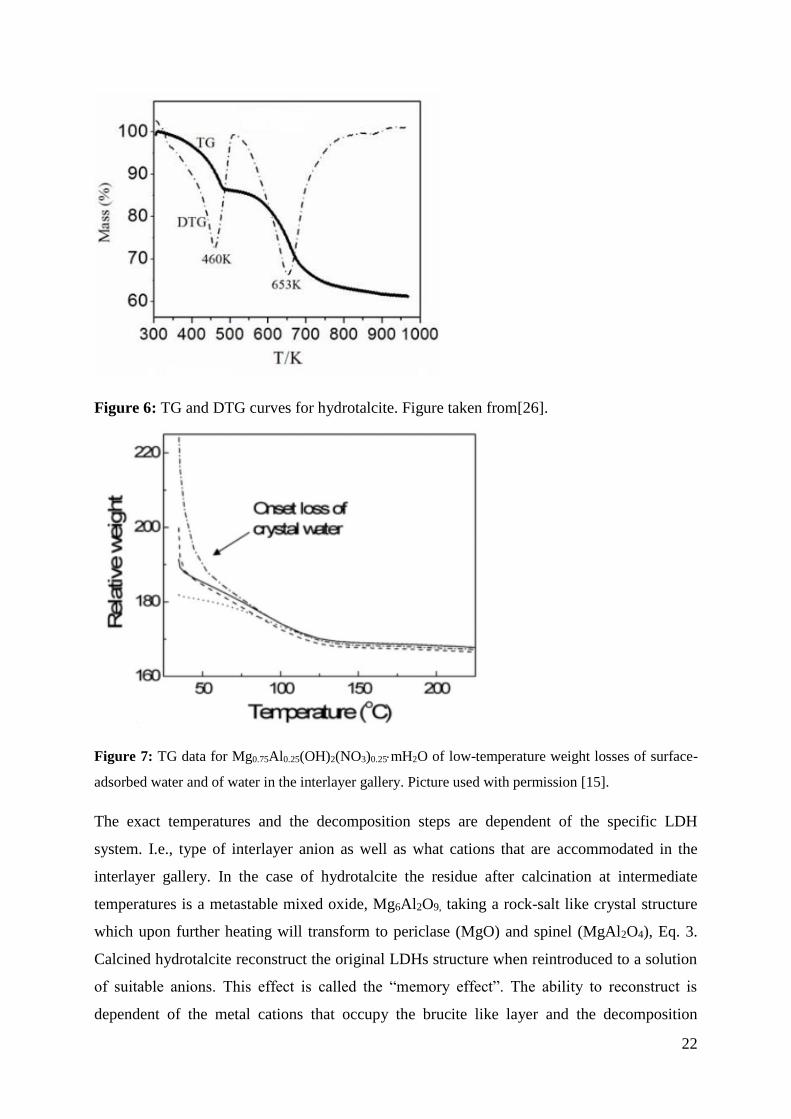
Figure 7 shows TG data for Mg0.75Al0.25(OH)2(NO3)0.25mH2O of low-temperature weight
losses of surface-adsorbed water and of water in the interlayer gallery
1 Formula for the mineral hydrotalcite is used in eq. 1-3. On general form hydrotalcite has the
formula Mg0.75Al0.25(OH)2(CO3)0.25∙0.5H2O
22
Figure 6: TG and DTG curves for hydrotalcite. Figure taken from[26].
Figure 7: TG data for Mg0.75Al0.25(OH)2(NO3)0.25mH2O of low-temperature weight losses of surface-
adsorbed water and of water in the interlayer gallery. Picture used with permission [15].
The exact temperatures and the decomposition steps are dependent of the specific LDH
system. I.e., type of interlayer anion as well as what cations that are accommodated in the
interlayer gallery. In the case of hydrotalcite the residue after calcination at intermediate
temperatures is a metastable mixed oxide, Mg6Al2O9, taking a rock-salt like crystal structure
which upon further heating will transform to periclase (MgO) and spinel (MgAl2O4), Eq. 3.
Calcined hydrotalcite reconstruct the original LDHs structure when reintroduced to a solution
of suitable anions. This effect is called the “memory effect”. The ability to reconstruct is
dependent of the metal cations that occupy the brucite like layer and the decomposition
23
temperature [27]. For hydrotalcite, the memory effect is observed for calcined material that is
not transformed beyond the metastable mixed oxide as described in Eq. 2. For example, for
MgAl LDH full reconstruction has been shown to up to 750 oC [27]. For MgAl LDHs
calcined at 1000 oC, reconstruction occurs, but with phases of MgO and MgAl2O4 (spinel)
present [27]. It is believed that spinel formation does not take place before well over 1000 oC
and only after spinel formation the reversible behavior is lost [28]. The ZnCr, ZnAl and CoAl
LDH systems show no reversible reconstruction of the LDH structure [28]. The explanation to
this is that these LDH systems do not form the metastable mixed oxide as MgAl does.
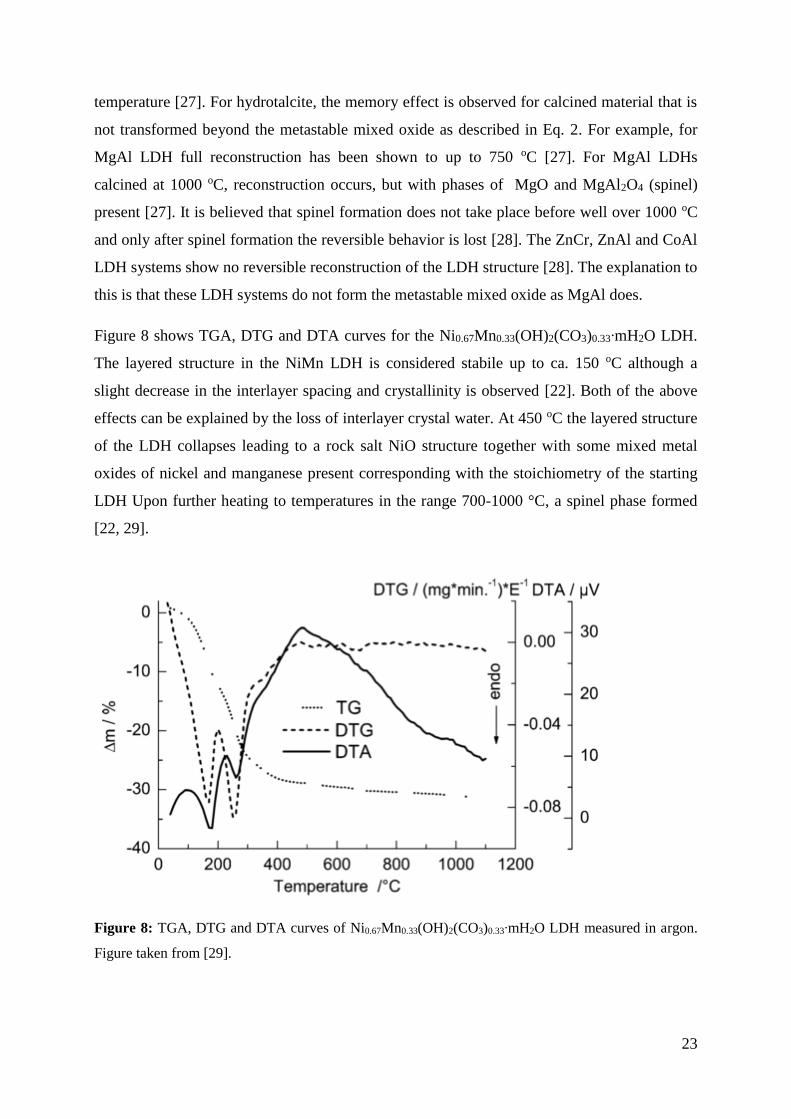
Figure 8 shows TGA, DTG and DTA curves for the Ni0.67Mn0.33(OH)2(CO3)0.33∙mH2O LDH.
The layered structure in the NiMn LDH is considered stabile up to ca. 150 oC although a
slight decrease in the interlayer spacing and crystallinity is observed [22]. Both of the above
effects can be explained by the loss of interlayer crystal water. At 450 oC the layered structure
of the LDH collapses leading to a rock salt NiO structure together with some mixed metal
oxides of nickel and manganese present corresponding with the stoichiometry of the starting
LDH Upon further heating to temperatures in the range 700-1000 °C, a spinel phase formed
[22, 29].
Figure 8: TGA, DTG and DTA curves of Ni0.67Mn0.33(OH)2(CO3)0.33∙mH2O LDH measured in argon.
Figure taken from [29].

24
25
1.5 Magnetic properties
The brucite layers in LDHs accommodate cations with two different oxidation states, which
can induce different magnetic interactions of the cations have unpaired electrons [13].
Introducing magnetic substrates into already magnetic brucite like layers open for further new
magnetic compounds [30]. Magnetism in LDHs is controlled by two main parameters: (1) the
in-layer magnetic superexchange between metal centers through OH bridges and (2) the less
intense dipolar interactions between the individual layers [31]. If one assumes a cation
ordered LDH with a metal cation compositional ratio of 2:1 (x = 0.33), then each M(III)
cation will be surrounded by six M(II) cations, and each M(II) will be surrounded by three
M(II) and three M(III), which gives M(II)-OH-M(III) and M(II)-OH-M(II) coupled pairs,
respectively. For the NiFe LDH system the coupled pairs Fe(III)-OH-Fe(III) give
antiferromagnetic interactions while the coupled pairs of Ni(II)-OH-Fe(III)/Fe(III)-OH-Ni(II)
give ferromagnetic interactions [31]. For the NiMn LDH system the antiferromagnetic
interactions come from the Mn(III)-OH-Mn(III) and Ni(II)-OH-Mn(III)/Mn(III)-OH-Ni(II)
couplings, while the ferromagnetic interactions come from the Ni(II)-OH-Ni(II) coupling [18].
Previous studies of similar structures (double hydroxides salt compounds, DHS) of Ni(II)
report the same results of in-layer ferromagnetic ordering [32]. The magnetic properties can
therefore be efficiently modified by carefully choosing the M(II) and M(III) cations and their
compositional ratio (in-layer interactions), as well as varying the interlayer distance by the
ability of introducing different interlayer anions (between layer interactions). By changing the
compositional ratio of the cations (varying x value) one can adjust the relative number of
ferromagnetic and antiferromagnetic pairs within the layer.
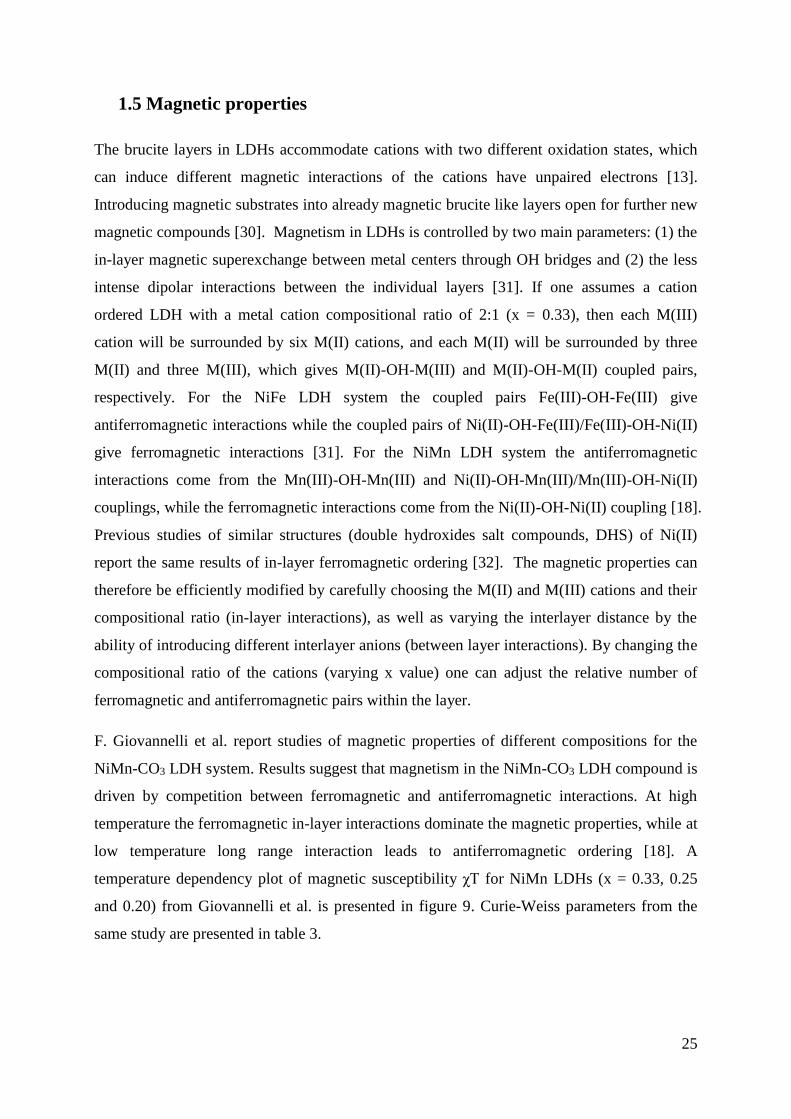
F. Giovannelli et al. report studies of magnetic properties of different compositions for the
NiMn-CO3 LDH system. Results suggest that magnetism in the NiMn-CO3 LDH compound is
driven by competition between ferromagnetic and antiferromagnetic interactions. At high
temperature the ferromagnetic in-layer interactions dominate the magnetic properties, while at
low temperature long range interaction leads to antiferromagnetic ordering [18]. A
temperature dependency plot of magnetic susceptibility χT for NiMn LDHs (x = 0.33, 0.25
and 0.20) from Giovannelli et al. is presented in figure 9. Curie-Weiss parameters from the
same study are presented in table 3.
26
Figure 9: Temperature dependence of χT for NiMn compounds (open symbols). Picture taken from
[18]. Ni2Mn (Ni.67Mn0.33(OH)2(CO3)0.165·nH2O), Ni3Mn (Ni.75Mn0.25(OH)2(CO3)0.125·nH2O) and
Ni4Mn (Ni.80Mn0.20(OH)2(CO3)0.10 ·nH2O).
Table 3: Curie-Weiss law parameters for NiMn compounds, determined from high temperature
magnetic susceptibility measurements. Ni2Mn (Ni.67Mn0.33(OH)2(CO3)0.165·nH2O), Ni3Mn
(Ni.75Mn0.25(OH)2(CO3)0.125·nH2O) and Ni4Mn (Ni.80Mn0.20(OH)2(CO3)0.10 ·nH2O). Table taken from
[18].
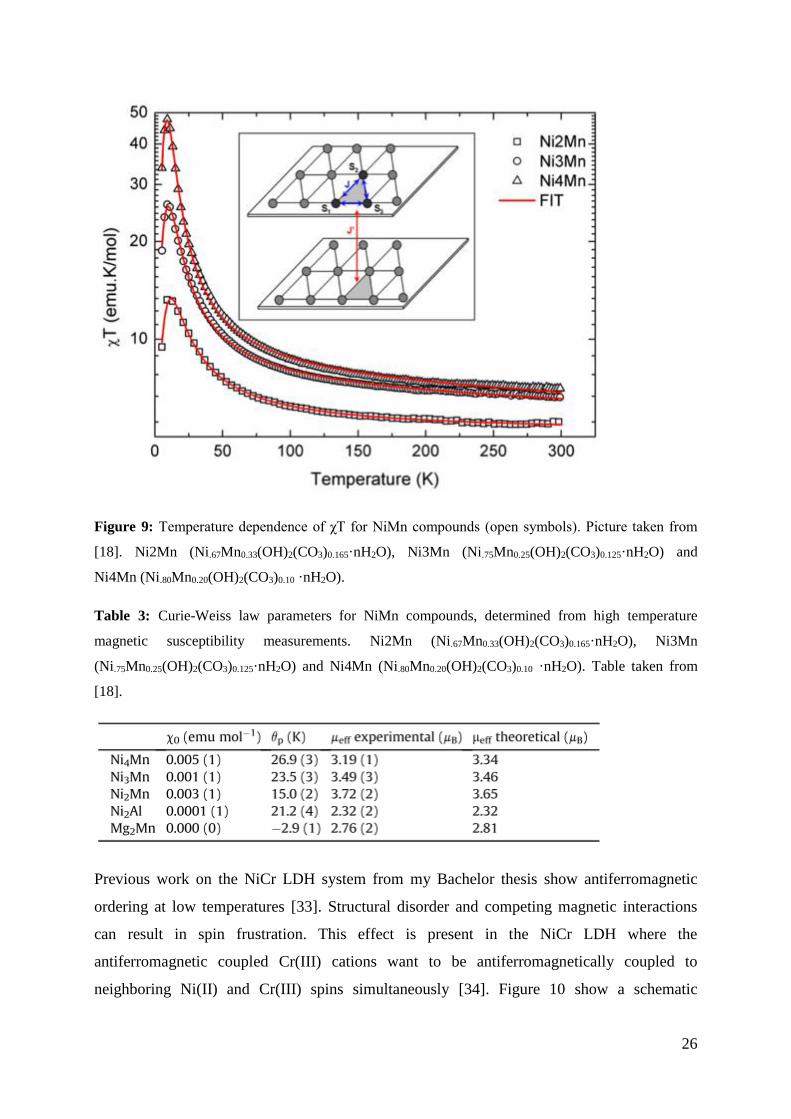
Previous work on the NiCr LDH system from my Bachelor thesis show antiferromagnetic
ordering at low temperatures [33]. Structural disorder and competing magnetic interactions
can result in spin frustration. This effect is present in the NiCr LDH where the
antiferromagnetic coupled Cr(III) cations want to be antiferromagnetically coupled to
neighboring Ni(II) and Cr(III) spins simultaneously [34]. Figure 10 show a schematic
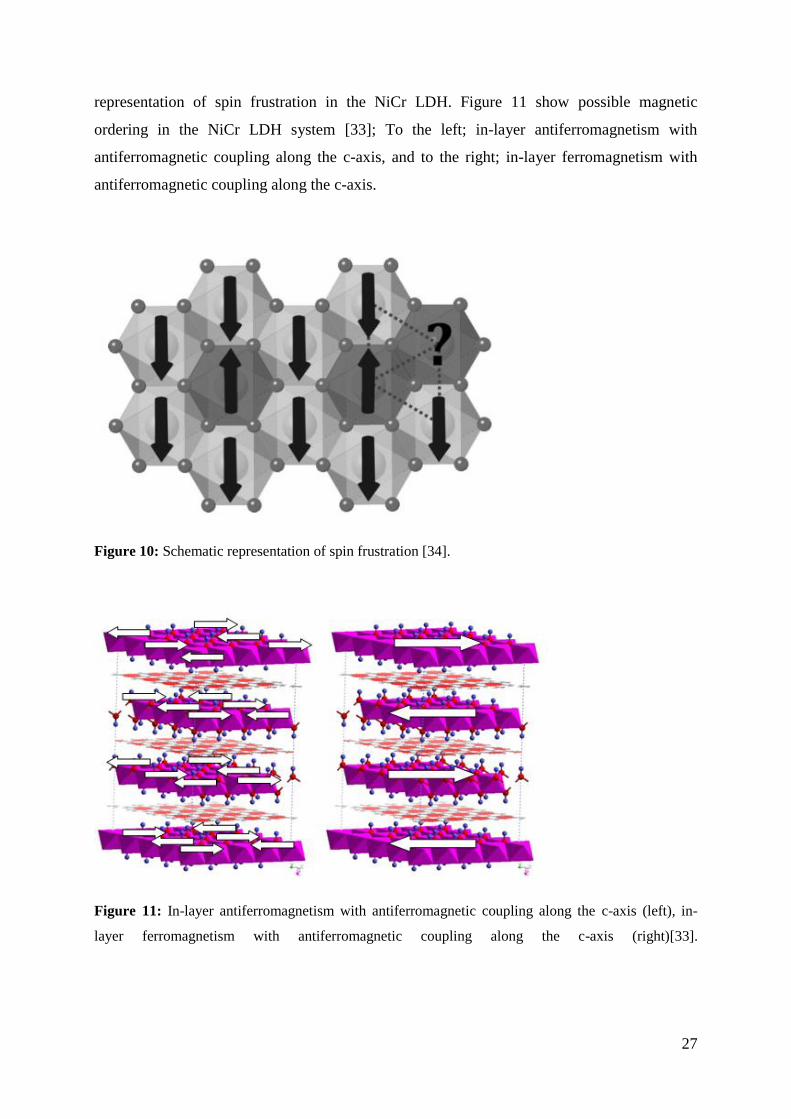
27
representation of spin frustration in the NiCr LDH. Figure 11 show possible magnetic
ordering in the NiCr LDH system [33]; To the left; in-layer antiferromagnetism with
antiferromagnetic coupling along the c-axis, and to the right; in-layer ferromagnetism with
antiferromagnetic coupling along the c-axis.
Figure 10: Schematic representation of spin frustration [34].
Figure 11: In-layer antiferromagnetism with antiferromagnetic coupling along the c-axis (left), in-
layer ferromagnetism with antiferromagnetic coupling along the c-axis (right)[33].
28
1.6 Motivation
Layered double hydroxides (LDH) have a crystal structure with pronounced two-dimensional
character, consisting of brucite-like positively charged layers being bonded together via
charge compensating anions and water molecules. The layered nature gives rise to interesting
physical and chemical properties.
In this master work, the main goal is to synthesize and investigate physical properties of LDH
materials based on paramagnetic transition metal cations. The focus is put on the Ni(II) -
Mn(III) system. The magnetic properties are expected to vary dependent on the Ni/Mn molar
ratio and with the interactions determined by the separation between the stacked brucite-like
layers. Development of appropriate synthesis procedures is then essential. The distance
between the layers, as easily evaluated from the length of the c-axis in these hexagonal
(rhombohedral) LDH materials, can be tuned by exchanging the type of charge compensating
anion (carbonate, nitrate,...) or by modifying the water content in the interlayers (e.g. by
investigating completely hydrated and dehydrated samples). A challenge more generally, is to
achieve samples with high degree of crystallinity. Frequently a lot of stacking faults may
occur, which results in broad and less defined diffraction peaks. Different synthesis routes
shall be explored, with target to obtain products with different degrees of crystallinity
(stacking faults), including well-crystalline samples that can be subjected to X-ray (neutron)
diffraction studies for structure analysis. Studies of thermal stability and temperature induced
phase transitions will be done by thermal analysis and variable temperature X-ray diffraction.
The magnetic properties of the Ni-Mn LDH samples will be investigated by magnetization
measurements, and possibly also neutron diffraction. In cases with need of good model
samples for method development or for studies of crystalline LDH samples, carbonate- or
nitrate based Mg-Al LDH samples (preferentially)shall be synthesized and studied.
29
2. Method and theory
2.1 Synthesis
In this report two main methods for synthesizing LDH materials have been used; co-
precipitation reactions and the urea hydrolysis method.
2.1.1 Co-precipitation:
Co-precipitation method is the most used preparative technique for LDHs, and can be applied
at both constant and variable pH. This method offers great freedom in choosing the interlayer
anions. LDHs with a great variety of both metal ions and interlayer anions can be synthesized
with this technique [35]. To assure precipitation of the metal ions it is necessary to control the
pH in the solution such that the reaction takes place under supersaturated conditions. In
general, this is achieved by holding the pH equal to or higher than the pH necessary for
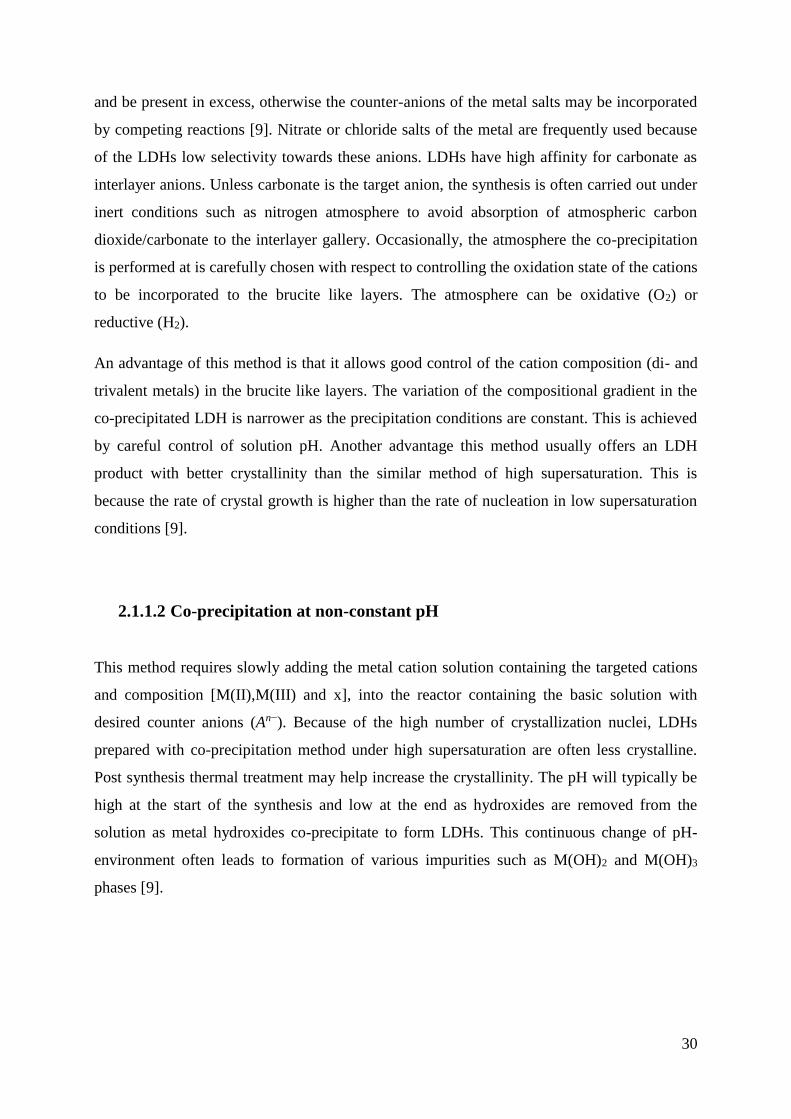
precipitation of the most soluble metal hydroxide [13]. Table 4 lists pH values for
precipitation of hydroxides of the most common LDHs [9].
Table 4: pH values of precipitation of popular di- and trivalent metalhydroxides [13]
2.1.1.1 Co-precipitation with constant pH (low supersaturation)
In the method of co-precipitation at constant pH the aqueous solution of the di- and tri metal
salts is prepared in desired cationic composition relative to the general formula
[M(II)1−xM(III)x(OH)2][An−]x/nmH2O, and slowly added to the reactor via a pump. The chosen
basic solution is added simultaneously via a pH controlled pump to maintain constant pH in
the reactor. The anion that is to be introduced should have a high affinity for the LDH layers
30
and be present in excess, otherwise the counter-anions of the metal salts may be incorporated
by competing reactions [9]. Nitrate or chloride salts of the metal are frequently used because
of the LDHs low selectivity towards these anions. LDHs have high affinity for carbonate as
interlayer anions. Unless carbonate is the target anion, the synthesis is often carried out under
inert conditions such as nitrogen atmosphere to avoid absorption of atmospheric carbon
dioxide/carbonate to the interlayer gallery. Occasionally, the atmosphere the co-precipitation
is performed at is carefully chosen with respect to controlling the oxidation state of the cations
to be incorporated to the brucite like layers. The atmosphere can be oxidative (O2) or
reductive (H2).
An advantage of this method is that it allows good control of the cation composition (di- and
trivalent metals) in the brucite like layers. The variation of the compositional gradient in the
co-precipitated LDH is narrower as the precipitation conditions are constant. This is achieved
by careful control of solution pH. Another advantage this method usually offers an LDH
product with better crystallinity than the similar method of high supersaturation. This is
because the rate of crystal growth is higher than the rate of nucleation in low supersaturation
conditions [9].
2.1.1.2 Co-precipitation at non-constant pH
This method requires slowly adding the metal cation solution containing the targeted cations
and composition [M(II),M(III) and x], into the reactor containing the basic solution with
desired counter anions (An−). Because of the high number of crystallization nuclei, LDHs
prepared with co-precipitation method under high supersaturation are often less crystalline.
Post synthesis thermal treatment may help increase the crystallinity. The pH will typically be
high at the start of the synthesis and low at the end as hydroxides are removed from the
solution as metal hydroxides co-precipitate to form LDHs. This continuous change of pH-
environment often leads to formation of various impurities such as M(OH)2 and M(OH)3
phases [9].
31
2.1.2 Urea method
The so-called “urea hydrolysis method” is suitable for precipitation of various metal
hydroxides. Ammonium and carbonate is released during decomposition of urea, see
equations 1-4 below. The hydrolysis of urea can easily be controlled by controlling the
temperature [9]. The rate constant increases by about 200 times when the temperature is
increased from 60 to 100 °C [20]. Oxidation states of the metal cations can be controlled by
addition of oxidizing agents such as, ammonium persulfate [19].
Typically, the pH of the solution is controlled to be in the area of pH = 6-10, which is where
precipitation of most LDHs will occur. The urea method favors growth of larger particles than
the earlier mentioned co-precipitation method. The urea method consequently yields products
with much higher crystallinity. A disadvantage is that formation of LDHs with the urea
method will nearly just give carbonate as the interlayer anion because of its high affinity for
carbonate.
According to Inayat et al. [12] the decomposition of urea in aqueous solution to carbonate and
hydroxide takes place in the following reaction steps:
CO(NH2)(aq)+ H2O(l) → CO2(aq)+ 2NH3(aq) (Eq.4)
NH3(aq)+ H2O(l) ⇄ NH4+ +OH-(aq) (Eq.5)
CO2(aq)+ OH-(aq) ⇄ HCO3-(aq) (Eq.6)
HCO3-(aq) + OH-(aq)⇄ CO3
2-(aq) +H2O(l) (Eq.7)
Recently however, there has been reported a successful use of the urea method for direct
synthesis of LDHs with nitrate as the interlayer anion [12]. By carefully controlling the pH of
the solution and by addition excess nitrate, the intercalation of interlayer anion can be
manipulated to other interlayer anions such as nitrate as well. The key parameter to control is
the final pH of the synthesis mixture which are correlated to the initial nitrate/urea molar ratio
and the synthesis time. By addition of ammonium nitrate to the reaction mixture, it is also
possible to synthesize pure nitrate phase LHDs. Transition of pure phase of nitrate occurs at
conditions pH < 7, via a mixed phase at pH = 7, to pure carbonate LDH at pH >7.
32
2.1.3 Hydrothermal treatment
In order to increase crystallinity of the synthesized LDH, a hydrothermal treatment is often
performed. Post synthesis heat treatment is generally split into two categories, low and high
temperature. Ageing or heating aqueous suspension in the reactor over few hours to several
days at temperatures between 0-100 °C, and hydrothermal treatment in high-pressure auto
claves, respectively [9].
2.1.4 Ion exchange
In the ion exchange method guest anions are introduced into the solution to replace anions
present in the interlayer gallery of the LDHs. This is particularly useful when the co-
precipitation method is inapplicable such as when, for example, the divalent or trivalent metal
cations or the anions involved are unstable in alkaline solution, or the direct reaction between
metal ions and guest anions is more favorable [9]. The ion exchange depends mainly on the
electrostatic interaction between the positively charged layers and the anion.
There are several factors which determines the extent of ion-exchange [9]:
1) Affinity for incoming anion
In general, the exchange ability increases with increasing charge and decreasing ionic
radius. The order for popular inorganic anions decreases in the order: CO32- > SO4
2- >
OH- > F- > Cl- > Br- > NO3- > I- .
2) Exchange medium
Interlayer space can be expanded by suitable solvents. This enhances the ion exchange
rate.
3) pH value
The lower the pH of the reaction solution, the weaker interaction forces between the
layers and thus the interlayer anions. The pH should not be too low, as LDH dissolved
in acids, starting at around pH 4.
4) Chemical composition of the layers
The chemical composition of the LDH layers influences the charge density and
thereby affecting the ion exchange process.
33
2.2 Powder X-ray diffraction
Powder X-ray diffraction (PXRD) is a characterization method suited for crystalline materials.
The method is used for phase identification and for pattern refinement techniques such as the
Rietveld method for refinement of structures and for structure determination of new crystal
structures.
X-rays are electromagnetic waves with a wavelength corresponding to the same magnitude of
order as the bond lengths in the samples examined with PXRD. This is typically in range of
0.5-10 Å corresponding to E = 3-20 keV. The X-rays interact with the electric field
originating from the electron cloud of the atoms. A characteristic property of waves is that
they interfere with each other, amplifying where they coincide and cancelling out where they
do not [36]. This is also known as constructive and destructive interference, respectively.
Diffraction is such an interference effect exploited in this characterization method. The
principle is based upon an incident beam of X-rays hitting the sample is diffracted into
specific directions, which are determined by the periodic network of the scattering planes in
the crystallites. Each lattice plane reflects only a portion of ca. 10-3-10-5 of the incoming
radiation, meaning that the X-rays penetrate deep into the sample. This means that ideally
103-105 lattice planes can contribute to the Bragg reflection [37]. Detectors register the
scattered beam from the crystallites (powder sample). The data collected is presented as a plot
of scattering intensity as function of scattering angle 2θA such plot is called a diffractogram
and describes the crystallographic/structural properties of the material.
The crystal structure can be described with help of periodically oriented lattice points, where
each lattice point can represent single atoms or molecules. With the use of three space vectors
a, b and c, and the angles between them, α, β and γ, a smallest repetitive cell, the unit cell can
be determined. The vectors; a, b and c, and the angles between them; α, β and γ, describe the
unit cell, and are called lattice parameters. As the unit cell contains all the information of the
crystal structure, repeating the unit cell along the three axes will show the atomic arrangement
of the complete crystal.
Miller indices form a notation system for lattice planes, which give rise to the scattering of X-
rays and thus the diffractograms. The Miller indices (h k l) describe a lattice plane that
intersects the three points (a/h, b/k, c/l) or a multiple of these. This means that the Miller
34
index is proportional to the inverse of the intersected plane. If an index is 0, it means that the
given axis is never intersected.
The reciprocal space (k-space, momentum space) is a Fourier transformation of real space.
The reciprocal space can be described with the three reciprocal space vectors a*, b* and c*
which are defined in (Eq. 1) and obtained from the real space vectors a, b and c. The Miller
indices (h k l) describe coordinates to points in the reciprocal space that correspond to sets of
planes in real space. Diffraction takes place in the reciprocal space. (Eq. 8) describes the
construction of the reciprocal space vectors mathematically. From (Eq. 8) we see that each
reciprocal vector; a*, b* and c* is orthogonal to two real space vectors.
(Eq. 8):
𝐚∗ = 𝟐𝛑𝐛 × 𝐜
𝐚 ∙ 𝐛 × 𝐜 ; 𝐛∗ = 𝟐𝛑
𝐜 × 𝐚
𝐚 ∙ 𝐛 × 𝐜 ; 𝐚∗ = 𝟐𝛑
𝐚 × 𝐛
𝐚 ∙ 𝐛 × 𝐜
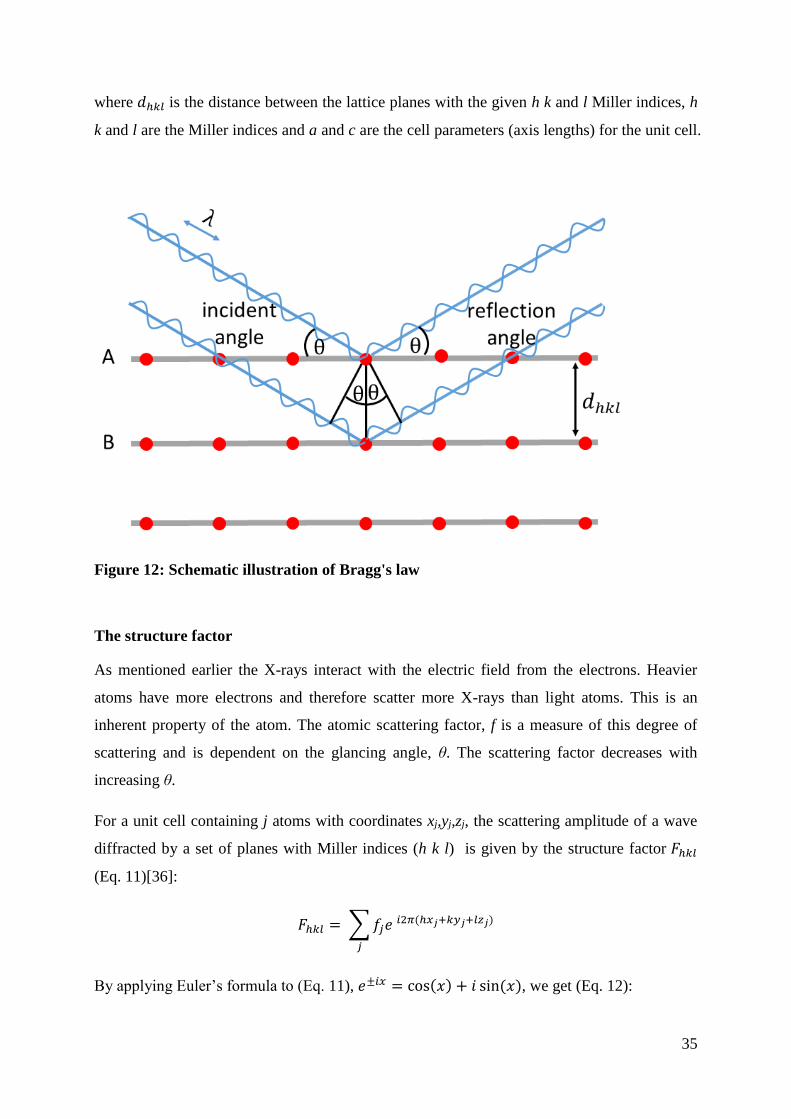
Bragg diffraction occurs when a beam of radiation (X-ray, neutron etc.) is scattered by sets of
lattice planes such as A and B in Figure 12, in such a way that is undergoes constructive
interference. In such coherent scattering (reflection) the incident angle θ is the same as the
reflection angle θ as shown in Figure 12. When waves interfere in this way they remain in
phase since one of the waves have travelled a longer path than the other. The Bragg condition
is fulfilled when this extra distance equals to the wavelength 𝜆, or to an integer multiple, 𝑛𝜆,
of it. This path difference equals to 2𝑑 sin 𝜃, such that when these two conditions are put
equal to one another, we get the Bragg’s law (Eq. 9):
𝑛𝜆 = 2𝑑ℎ𝑘𝑙 sin 𝜃
With the wavelength known, and the scattering angle 𝜃 measured, one can use the Bragg’s
law to calculate the interplanar distance 𝑑ℎ𝑘𝑙 . Each peak or Bragg reflection in the
diffractogram contains information of a given lattice plane and has therefore its own set of
Miller indices. The relationship between the interplanar distance 𝑑ℎ𝑘𝑙 and the cell parameters
for the hexagonal crystal system can be described with the following formula (Eq. 10):
1
𝑑ℎ𝑘𝑙=
4
3(
ℎ2 + ℎ𝑘 + 𝑘2
𝑎2) +
𝑙2
𝑐2
35
where 𝑑ℎ𝑘𝑙 is the distance between the lattice planes with the given h k and l Miller indices, h
k and l are the Miller indices and a and c are the cell parameters (axis lengths) for the unit cell.
Figure 12: Schematic illustration of Bragg's law
The structure factor
As mentioned earlier the X-rays interact with the electric field from the electrons. Heavier
atoms have more electrons and therefore scatter more X-rays than light atoms. This is an
inherent property of the atom. The atomic scattering factor, f is a measure of this degree of
scattering and is dependent on the glancing angle, θ. The scattering factor decreases with
increasing θ.
For a unit cell containing j atoms with coordinates xj,yj,zj, the scattering amplitude of a wave
diffracted by a set of planes with Miller indices (h k l) is given by the structure factor 𝐹ℎ𝑘𝑙
(Eq. 11)[36]:
𝐹ℎ𝑘𝑙 = ∑ 𝑓𝑗𝑒 𝑖2𝜋(ℎ𝑥𝑗+𝑘𝑦𝑗+𝑙𝑧𝑗)
𝑗
By applying Euler’s formula to (Eq. 11), 𝑒±𝑖𝑥 = cos(𝑥) + 𝑖 sin(𝑥), we get (Eq. 12):
36
𝐹ℎ𝑘𝑙 = ∑ 𝑓𝑗 [cos (2𝜋(ℎ𝑥𝑗 + 𝑘𝑦𝑗 + 𝑙𝑧𝑗)) + 𝑖 sin (2𝜋(ℎ𝑥𝑗 + 𝑘𝑦𝑗 + 𝑙𝑧𝑗))]
𝑗
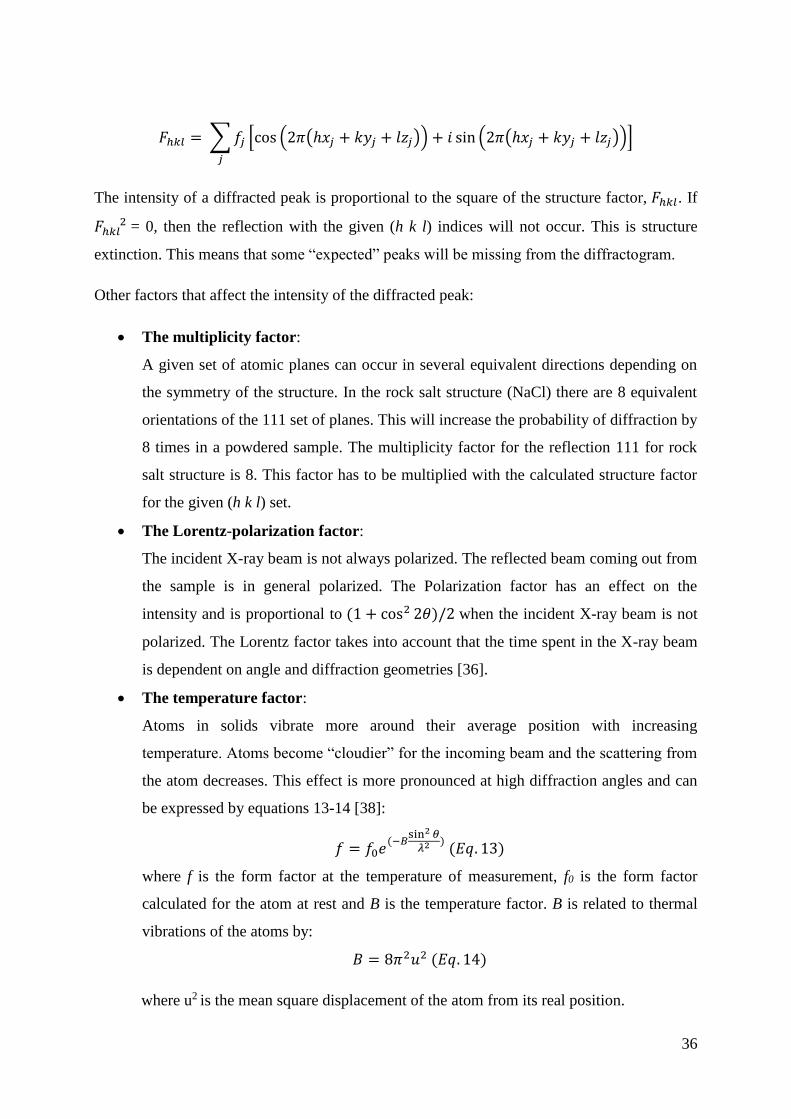
The intensity of a diffracted peak is proportional to the square of the structure factor, 𝐹ℎ𝑘𝑙. If
𝐹ℎ𝑘𝑙 2 = 0, then the reflection with the given (h k l) indices will not occur. This is structure
extinction. This means that some “expected” peaks will be missing from the diffractogram.
Other factors that affect the intensity of the diffracted peak:
The multiplicity factor:
A given set of atomic planes can occur in several equivalent directions depending on
the symmetry of the structure. In the rock salt structure (NaCl) there are 8 equivalent
orientations of the 111 set of planes. This will increase the probability of diffraction by
8 times in a powdered sample. The multiplicity factor for the reflection 111 for rock
salt structure is 8. This factor has to be multiplied with the calculated structure factor
for the given (h k l) set.
The Lorentz-polarization factor:
The incident X-ray beam is not always polarized. The reflected beam coming out from
the sample is in general polarized. The Polarization factor has an effect on the
intensity and is proportional to (1 + cos2 2𝜃)/2 when the incident X-ray beam is not
polarized. The Lorentz factor takes into account that the time spent in the X-ray beam
is dependent on angle and diffraction geometries [36].
The temperature factor:
Atoms in solids vibrate more around their average position with increasing
temperature. Atoms become “cloudier” for the incoming beam and the scattering from
the atom decreases. This effect is more pronounced at high diffraction angles and can
be expressed by equations 13-14 [38]:
𝑓 = 𝑓0𝑒(−𝐵
sin2 𝜃𝜆2 )
(𝐸𝑞. 13)
where f is the form factor at the temperature of measurement, f0 is the form factor
calculated for the atom at rest and B is the temperature factor. B is related to thermal
vibrations of the atoms by:
𝐵 = 8𝜋2𝑢2 (𝐸𝑞. 14)
where u2 is the mean square displacement of the atom from its real position.
37
Preferred orientation: Flat samples often cause preferred orientation, reducing the
intensity of some Bragg reflections. As the samples are flat, they will orientate in a
preferred way and the sum of all reflections will not equal to the expected powder
average.
Instrumentation with Bragg Brentano geometry:
X-ray diffractometers come with numerous geometries, two of the most used being the Bragg
Brentano and Debye Scherrer geometries. X-ray diffractometers have many components, with
only the three following components being absolutely necessary; the X-ray tube, sample
holder and detector. X-ray diffractometers can also have components such as
monochromators, slits etc. The Bragg Brentano geometry is described in more details in the
following section.
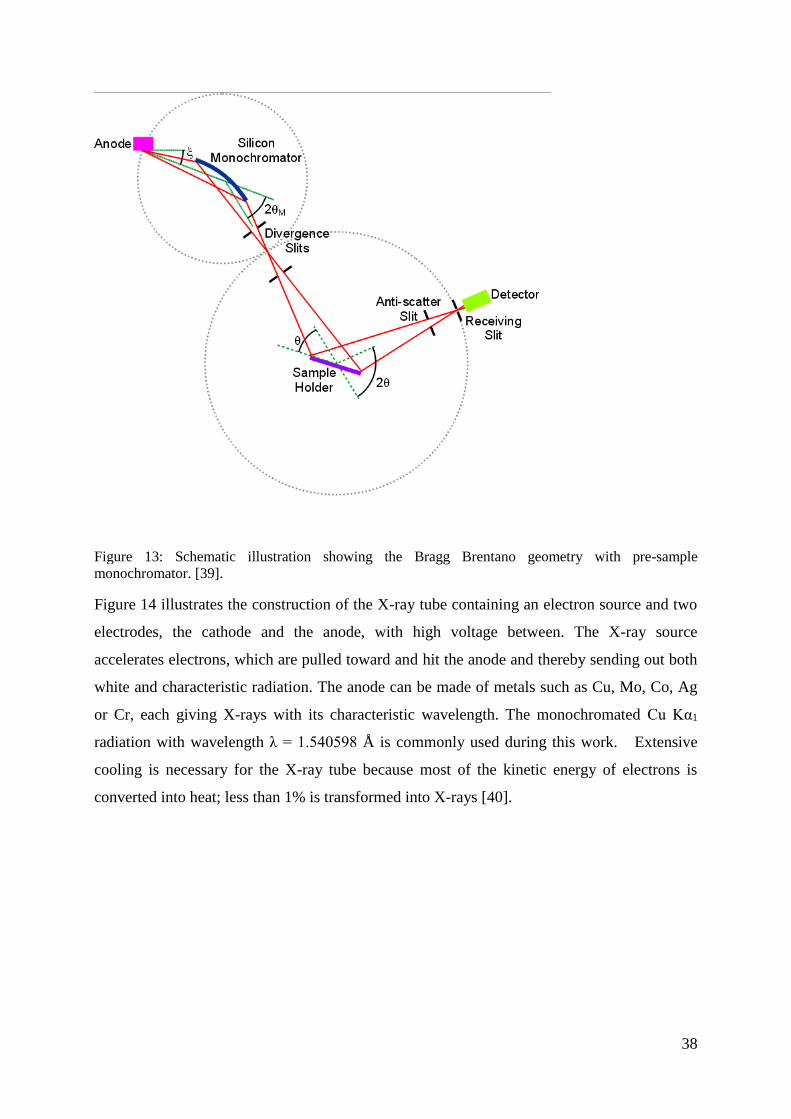
The Bragg Brentano geometry diffractometers are commonly used instruments for P-XRD
analysis. A schematic illustration of the Bragg Brentano geometry is presented in figure 13.
The instrument is based on the principle that the rotating sample is stationary with the X-ray
tube and detector moving around it, with angles θ and 2θ, respectively. The top left side
shows the X-ray source and its monochromator. The monochromator is placed between the X-
ray beam and the sample to separate Kα1 and Kα2 wavelengths. Slits are placed both pre- and
post-sample to reduce divergence of the X-rays. The sample holder position is in the middle
of the lower circle and the path of both the incident and diffracted beam is shown. The right
hand side shows anti-scatter slits and the detector.
38
Figure 13: Schematic illustration showing the Bragg Brentano geometry with pre-sample
monochromator. [39].
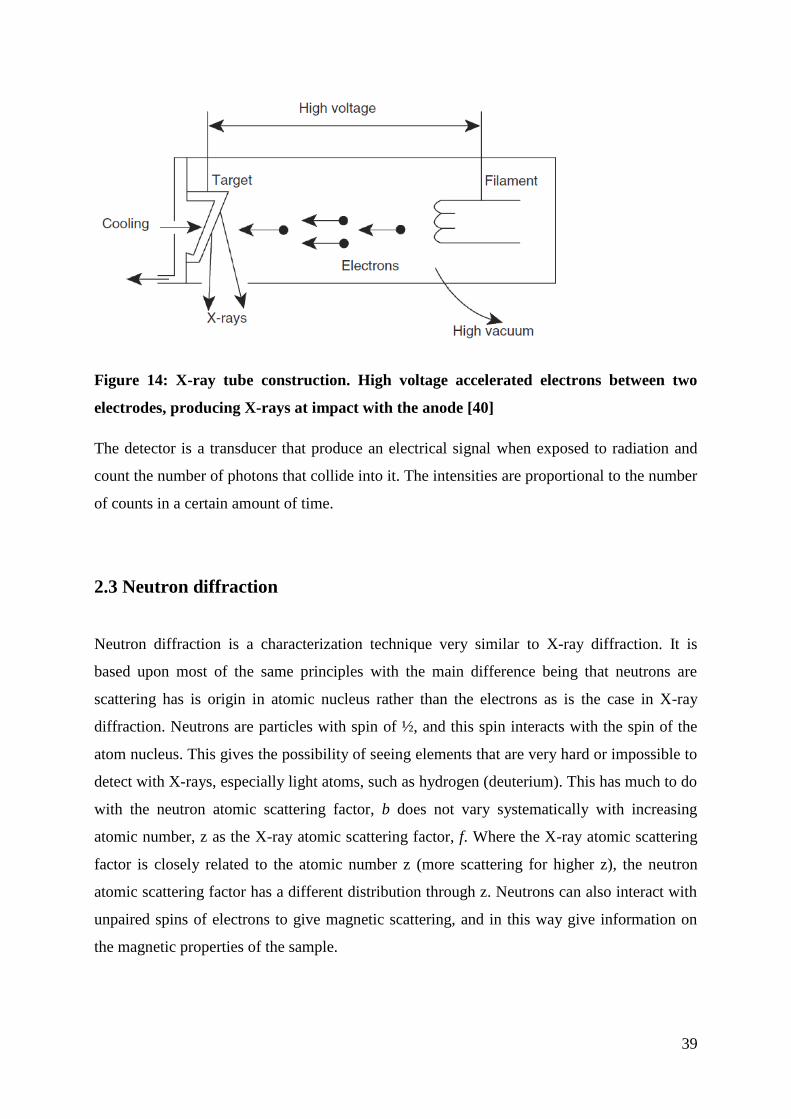
Figure 14 illustrates the construction of the X-ray tube containing an electron source and two
electrodes, the cathode and the anode, with high voltage between. The X-ray source
accelerates electrons, which are pulled toward and hit the anode and thereby sending out both
white and characteristic radiation. The anode can be made of metals such as Cu, Mo, Co, Ag
or Cr, each giving X-rays with its characteristic wavelength. The monochromated Cu Kα1
radiation with wavelength λ = 1.540598 Å is commonly used during this work. Extensive
cooling is necessary for the X-ray tube because most of the kinetic energy of electrons is
converted into heat; less than 1% is transformed into X-rays [40].
39
Figure 14: X-ray tube construction. High voltage accelerated electrons between two
electrodes, producing X-rays at impact with the anode [40]
The detector is a transducer that produce an electrical signal when exposed to radiation and
count the number of photons that collide into it. The intensities are proportional to the number
of counts in a certain amount of time.
2.3 Neutron diffraction
Neutron diffraction is a characterization technique very similar to X-ray diffraction. It is
based upon most of the same principles with the main difference being that neutrons are
scattering has is origin in atomic nucleus rather than the electrons as is the case in X-ray
diffraction. Neutrons are particles with spin of ½, and this spin interacts with the spin of the
atom nucleus. This gives the possibility of seeing elements that are very hard or impossible to
detect with X-rays, especially light atoms, such as hydrogen (deuterium). This has much to do
with the neutron atomic scattering factor, b does not vary systematically with increasing
atomic number, z as the X-ray atomic scattering factor, f. Where the X-ray atomic scattering
factor is closely related to the atomic number z (more scattering for higher z), the neutron
atomic scattering factor has a different distribution through z. Neutrons can also interact with
unpaired spins of electrons to give magnetic scattering, and in this way give information on
the magnetic properties of the sample.
40
2.4 Rietveld method
The Rietveld method has during the last decades become a very valuable tool for determining
structural details of powdered samples. The method is most efficient when the approximate
structure type is known and structural details need to be determined. The Rietveld method is a
whole pattern refinement method where a calculated pattern profile is modeled and compared
to the experimental powder diffraction pattern. The Rietveld method uses least-squares
refinement to minimize the difference between the experimental diffraction pattern and the
calculated diffraction pattern. The calculated pattern is adjusted by refinement of given
parameters. The method was developed by Hugo Rietveld initially for processing neutron
diffraction patterns, but has since been adopted for use on X-ray diffraction patterns. There
are numerous software packages available for Rietveld refinement today. The two used in this
study are; FullProf Suite (ref) and TOPAS-Academic (ref).
The Rietveld refinement requires a starting model for a crystal structure, from which the
calculated powder diffraction pattern is obtained. “A key feature is the feedback, during
refinement, between improving knowledge of the structure and improving allocation of
observed intensity to partially overlapping individual Bragg reflections” [41].
The mathematical model used to calculate the intensity at the ith, step, yci, is shown in
equation 15[41].
𝑦𝑐𝑖 = 𝑠 ∑ 𝐿𝐾|𝐹𝐾|2𝜙(2𝜃𝑖 − 2𝜃𝐾)𝑃𝐾𝐴 + 𝑦𝑏𝑖
𝐾
(𝐸𝑞. 15)
where
s is the scale factor,
K represents the Miller indices, h k l, for a Bragg reflection,
LK contains the Lorentz, polarization, and multiplicity factors,
ϕ is the reflection profile function
PK is the preferedpreferred orientation function
A is an absorption factor,
FK is the structure factor for Bragg reflection K
ybi is the background intensity at the ith step.
41
The calculated peak shapes are often Lorentzian, Gaussian or a convolution of these. The
breadth H, of the peak profiles measured as full-width-at-half-maximum (FWHM) are
traditionally modelled as:
𝐻2 = 𝑈 tan2 𝜃 + 𝑉 tan 𝜃 + 𝑊 (𝐸𝑞. 16)
where, U, V and W are refinable parameters.
The Rietveld refinement process is carried out until the residual, the difference between the
calculated and the observed pattern is minimized in some sense. The criteria of fit are often
expressed as R-values (reliability factors):
Rp is profile pattern
Rwp is weighted profile pattern
Re is the best possible with the given data set; socalled expected reliability factor
Goodness of fit = Rwp/Re
In general, a better fit is represented by lower R-values and a goodness of fit approaching the
value 1 is usually pursued. But a lower R-value does not necessarily mean a better fit, the
refinement can be trapped into false minima. All of the above parameters can be expressed
mathematically more advanced.
2.5 Thermogravimetry (TG) and differential scanning calorimetry (DSC)
Thermogravimetry (TG) and differential scanning calorimetry (DSC) belong to the group of
thermal analysis techniques that analytically measure properties or property changes of
materials as a function of temperature or time in a controlled gas atmosphere. TG is primarily
used to examine the mass loss (decomposition, reduction) or mass gain (oxidation,
carbonatization, hydration etc), while DSC is used for examining phase changes in materials
or chemical reactions [40] which either are exothermic or endothermic.
The instrumentation for TG and DSC have common features. There is a furnace in which the
sample is heated (cooled) and a balance that monitors the samples mass change. The furnace
has a controllable environment with possibilities for introducing wanted atmospheres/gases. It
is important to choose an atmosphere that does not interact with the sample in an unwanted
manner. For example, when studying LDHs containing nitrate in the interlayer gallery, it is
important to use an inert gas such as nitrogen (N2) or argon (Ar), to avoid absorption of
42
carbon dioxide/carbonate from air. The sample is analyzed under a programmable profile
where the operator can control parameters such as: the heating rate, isothermal steps and
atmospheres. The results are shown as a TG curve, with mass % along the y-axis and time or
temperature along the x-axis. For more precise results, a background run is performed with
the same crucible and the programmed profile as the “real” measurement in order to map the
background component. The background profile is then subtracted from the “real”
measurement.
To ensure as precise data as possible, the sample dimension and mass should be small. A
sample in powder form with mass less than 10 mg is preferred. Heat transfer in such a sample
will be higher than for a bulk sample, and the sample is more likely to reach thermal
equilibrium with the atmosphere during the measurements. Slow heating rate is often
favorable for the same reason. The primary task of DSC is to measure transition temperatures.
A DSC curve is usually plotted as 𝑑𝐻
𝑑𝑡 per mass unit versus temperature. The enthalpy change
of phase transition can be directly measured from the corresponding peak area of a DSC curve
[40].
2.6 Magnetic studies
The response of a material to an applied magnetic field H, is called magnetization, M.
Equations 10-14 are taken from Magnetic Materials Fundamentals and Device Applications
[42]. All magnetic formulas are expressed in cgs units. The magnetization is defined to be the
magnetic moment per unit volume:
𝑴 =𝒎
𝑽 𝑒𝑚𝑢
𝑐𝑚3 (𝐸𝑞. 17)
The magnetization is an inherent property of the material and depends on the individual
magnetic moments of the material and on how they interact. The ratio between the
magnetization M, and the applied magnetic field H is the magnetic susceptibility:
𝜒 =𝑴
𝑯
𝑒𝑚𝑢
𝑐𝑚3𝑂𝑒 (𝐸𝑞. 18)
43
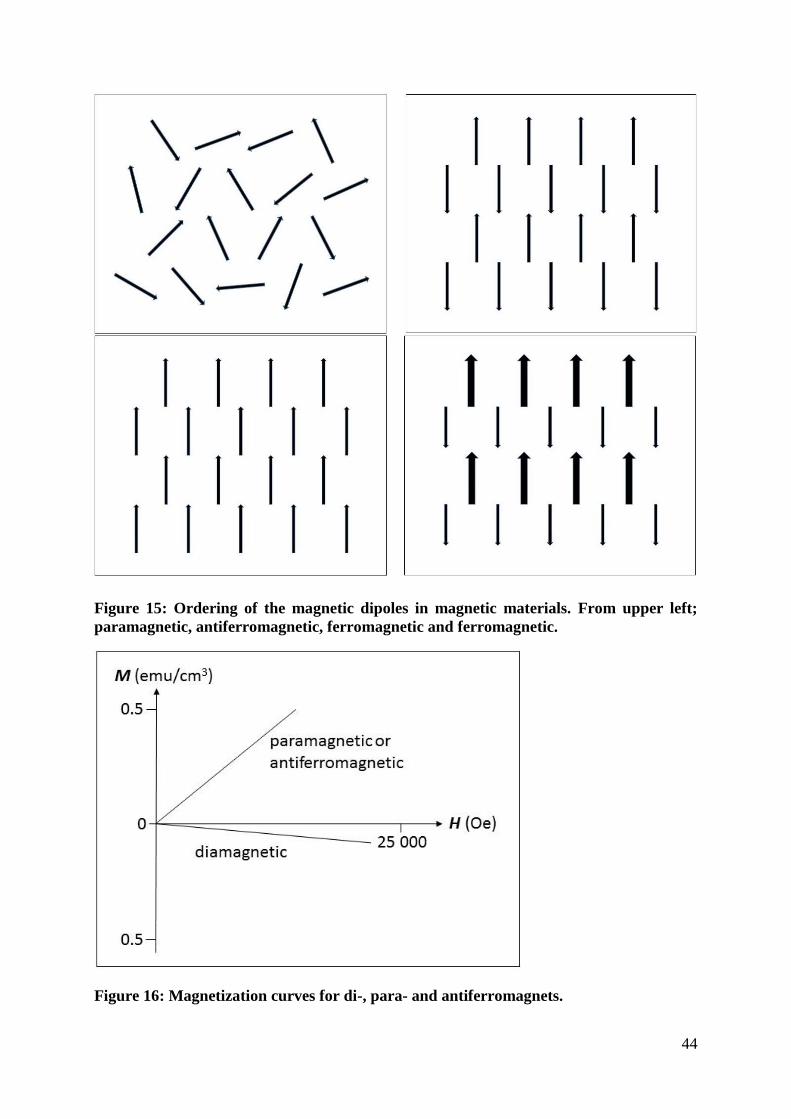
The magnetic susceptibility expresses how responsive a non-metallic material is to the applied
magnetic field. Figure 15 shows different types of ordering of the magnetic dipoles in
magnetic materials. The magnetic dipole moments in paramagnets are randomly ordered, and
in antiferromagnets they are ordered antiparallel to each other. The magnetization curves,
M(H), for para- and antiferromagnets show no hysteresis. See figure 16. For these magnets
large applied fields are required to cause small changes in magnetization, see scales in figure
16. Diamagnetic materials induce a magnetic field in the opposite direction to an externally
applied magnetic field. For this reason, the magnetization curve shown in figure 16 for a
diamagnet is negative. The slope of the magnetization curve gives the value of the magnetic
susceptibility. For para- and antiferromagnets we can see that the magnetic susceptibility is
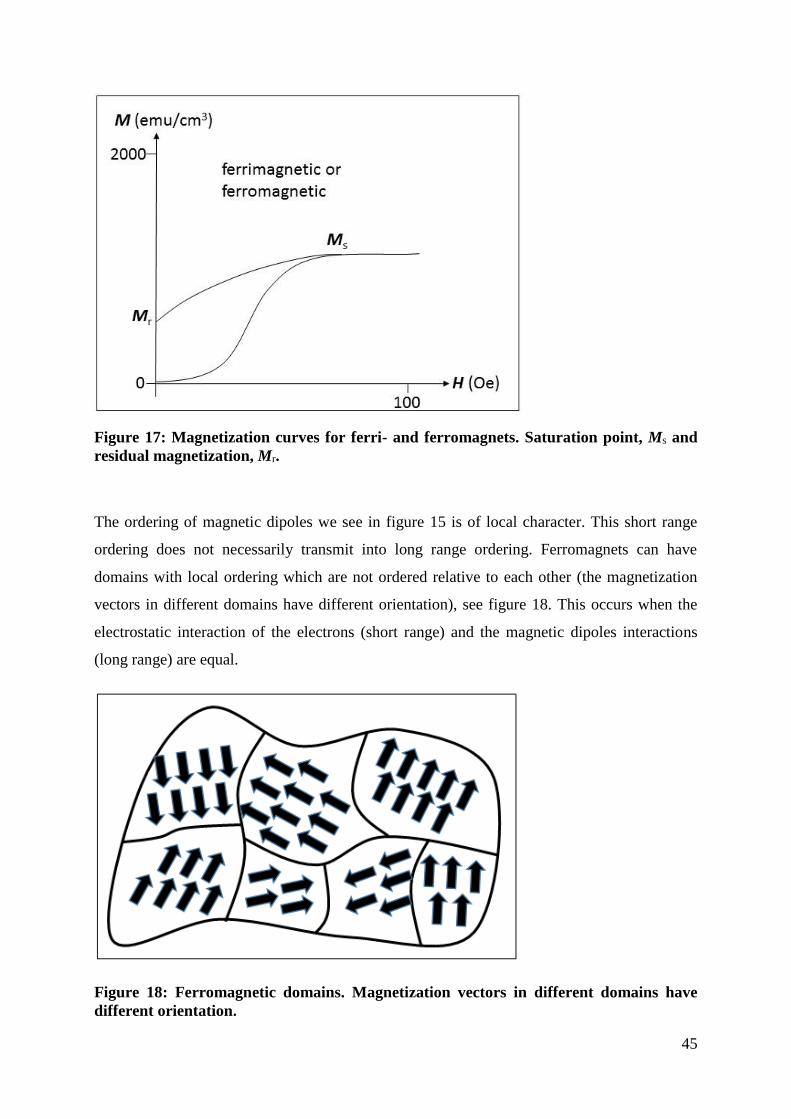
small and positive. The magnetization curves for ferro- and ferrimagnets show hysteresis, and
much smaller applied fields are required to cause changes in magnetization, see figure 17.
Also the magnetization saturates above a certain applied field, which means that further
increase of the applied field will have result in small changes in the magnetization. This point
is marked as Ms on figure 17. The magnetic susceptibility for these magnets is much larger
than for para- and antiferromagnets.
44
Figure 15: Ordering of the magnetic dipoles in magnetic materials. From upper left;
paramagnetic, antiferromagnetic, ferromagnetic and ferromagnetic.
Figure 16: Magnetization curves for di-, para- and antiferromagnets.
45
Figure 17: Magnetization curves for ferri- and ferromagnets. Saturation point, Ms and
residual magnetization, Mr.
The ordering of magnetic dipoles we see in figure 15 is of local character. This short range
ordering does not necessarily transmit into long range ordering. Ferromagnets can have
domains with local ordering which are not ordered relative to each other (the magnetization
vectors in different domains have different orientation), see figure 18. This occurs when the
electrostatic interaction of the electrons (short range) and the magnetic dipoles interactions
(long range) are equal.
Figure 18: Ferromagnetic domains. Magnetization vectors in different domains have
different orientation.
46
Curie’s law states that the susceptibility of a paramagnet is inversely proportional to
temperature in Kelvin:
𝜒 =𝐶
𝑇 (𝐸𝑞. 19)
where C is the material dependent Curie constant. Many paramagnetic materials however, do
not follow Curie’s law, but instead follow the more general Curie-Weiss law:
𝜒 =𝐶
𝑇 − 𝜃 (𝐸𝑞. 20)
where θ is the Curie-temperature (critical temperature). Paramagnets that follow the Curie-
Weiss law undergo spontaneous ordering and become ferromagnetic below the Curie-
temperature [42].
In antiferromagnets the magnetic dipole moments align antiparallel to each other such that the
net magnetization is zero. Curie-Weiss law is valid for antiferromagnets above the Néel-
temperature TN, but with negative Curie-temperature:
𝜒 =𝐶
𝑇 − (−𝜃) (𝐸𝑞. 21)
Below the Néel-temperature, the susceptibility decreases slightly with decreasing temperature.
The effect of the negative Curie-temperature is explained by the presence of a negative
molecular field, the Weiss molecular field which causes dipole moments to anti-align [42].
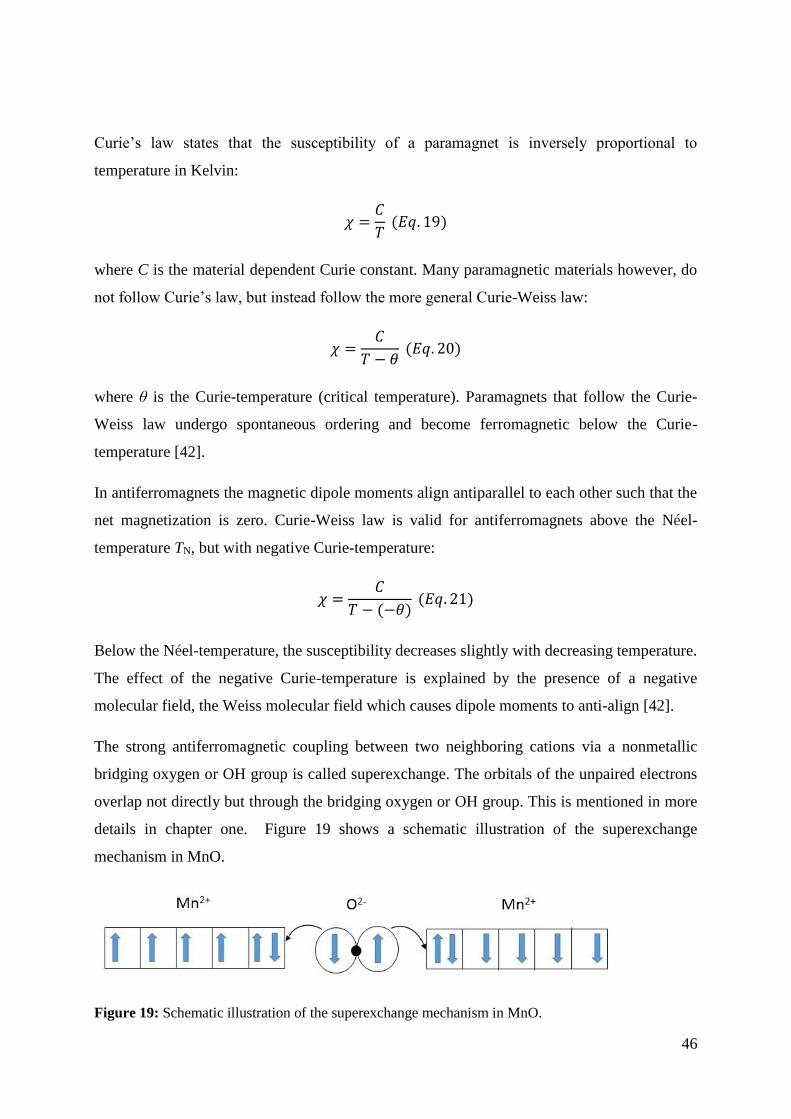
The strong antiferromagnetic coupling between two neighboring cations via a nonmetallic
bridging oxygen or OH group is called superexchange. The orbitals of the unpaired electrons
overlap not directly but through the bridging oxygen or OH group. This is mentioned in more
details in chapter one. Figure 19 shows a schematic illustration of the superexchange
mechanism in MnO.
Figure 19: Schematic illustration of the superexchange mechanism in MnO.
47
Physical property measurement system, PPMS
The PPMS instrument can measure the magnetization of a sample under applied magnetic
field. The magnetization if measured as a response to the applied field. The data is usually
measured in two modes; zero field cooled (ZFC), where the sample is cooled under no
external field, and in field cooled (FC), where the sample is cooled under an applied field. The
magnetization is measured inductively with an external field in both cases.

48
49
3. Experimental
This chapter will describe the experimental part of the work. In the first section an overview
of the synthesis work is given, followed by a part describing the characterization of the
synthesized products.
3.1 Synthesis:
This chapter will be divided into two sub-chapters, one for each LDH system synthesized;
NiMn-LDH and MgAl-LDH, respectively.
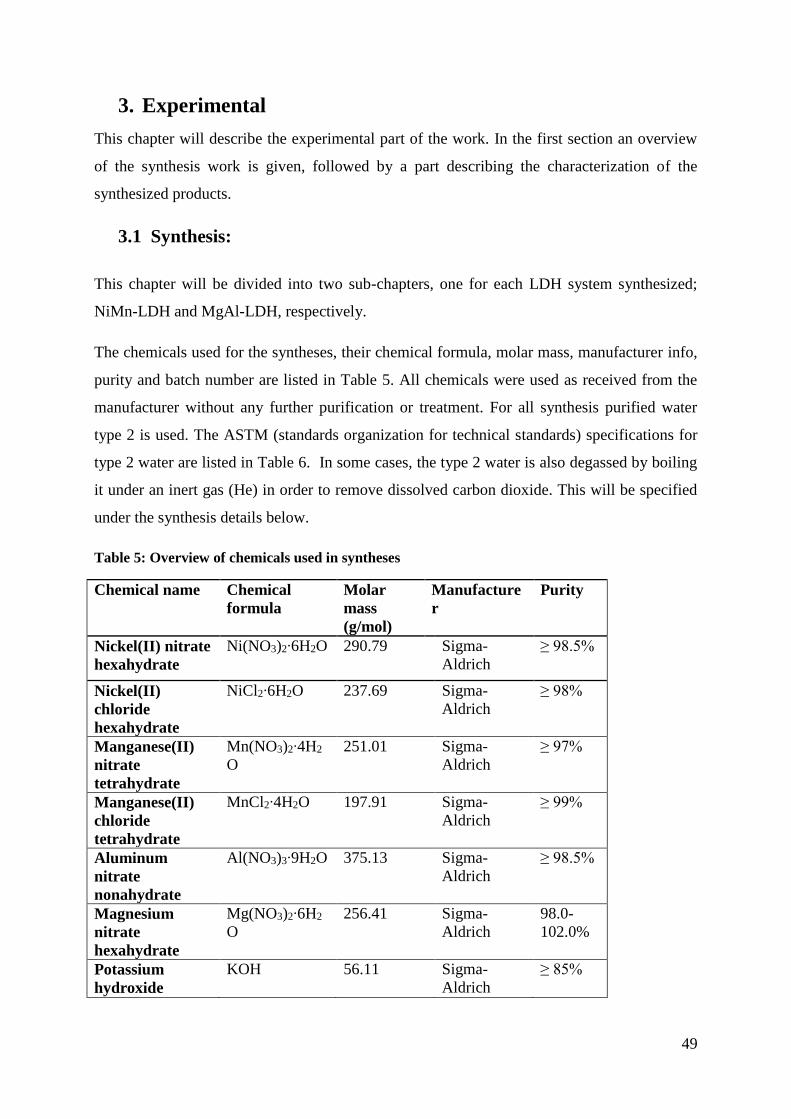
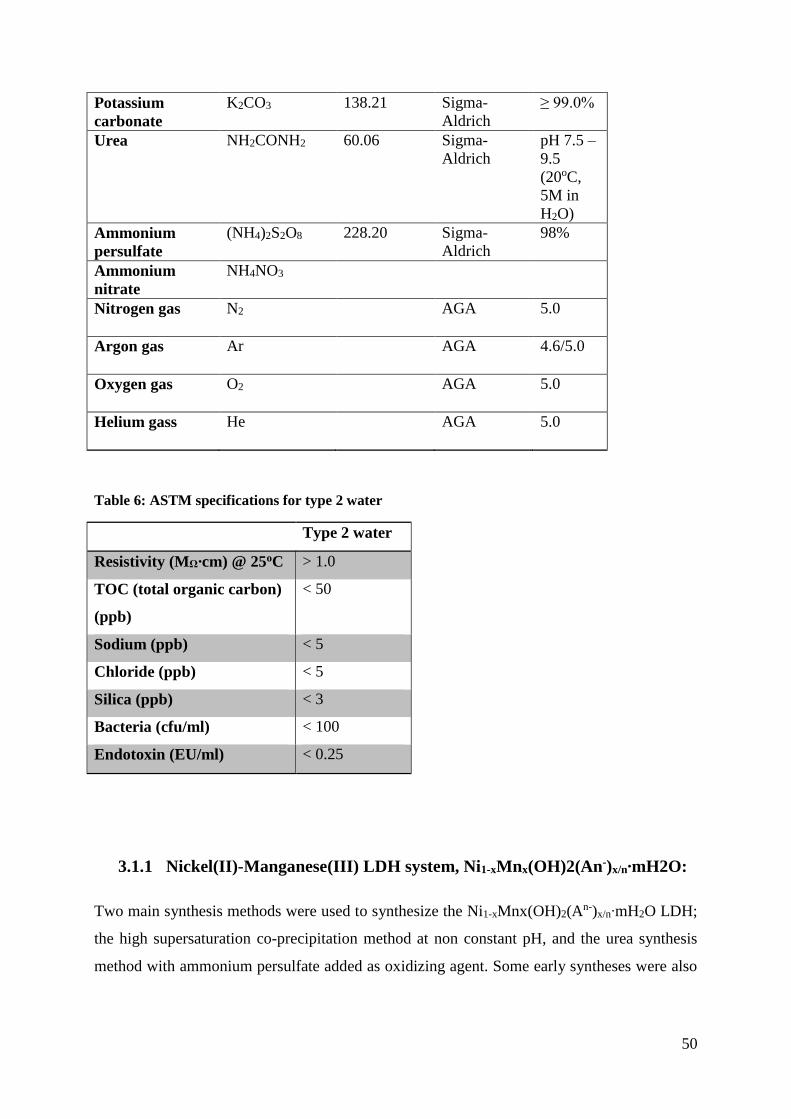
The chemicals used for the syntheses, their chemical formula, molar mass, manufacturer info,
purity and batch number are listed in Table 5. All chemicals were used as received from the
manufacturer without any further purification or treatment. For all synthesis purified water
type 2 is used. The ASTM (standards organization for technical standards) specifications for
type 2 water are listed in Table 6. In some cases, the type 2 water is also degassed by boiling
it under an inert gas (He) in order to remove dissolved carbon dioxide. This will be specified
under the synthesis details below.
Table 5: Overview of chemicals used in syntheses
Chemical name Chemical
formula
Molar
mass
(g/mol)
Manufacture
r
Purity
Nickel(II) nitrate
hexahydrate
Ni(NO3)2∙6H2O 290.79 Sigma-
Aldrich
≥ 98.5%
Nickel(II)
chloride
hexahydrate
NiCl2∙6H2O 237.69 Sigma-
Aldrich
≥ 98%
Manganese(II)
nitrate
tetrahydrate
Mn(NO3)2∙4H2
O
251.01
Sigma-
Aldrich
≥ 97%
Manganese(II)
chloride
tetrahydrate
MnCl2∙4H2O 197.91 Sigma-
Aldrich
≥ 99%
Aluminum
nitrate
nonahydrate
Al(NO3)3∙9H2O 375.13 Sigma-
Aldrich
≥ 98.5%
Magnesium
nitrate
hexahydrate
Mg(NO3)2∙6H2
O
256.41 Sigma-
Aldrich
98.0-
102.0%
Potassium
hydroxide
KOH 56.11 Sigma-
Aldrich
≥ 85%
50
Potassium
carbonate
K2CO3 138.21 Sigma-
Aldrich
≥ 99.0%
Urea NH2CONH2 60.06 Sigma-
Aldrich
pH 7.5 –
9.5
(20oC,
5M in
H2O)
Ammonium
persulfate
(NH4)2S2O8 228.20 Sigma-
Aldrich
98%
Ammonium
nitrate
NH4NO3
Nitrogen gas N2 AGA 5.0
Argon gas Ar AGA 4.6/5.0
Oxygen gas O2 AGA 5.0
Helium gass He AGA 5.0
Table 6: ASTM specifications for type 2 water
Type 2 water
Resistivity (MΩ∙cm) @ 25oC > 1.0
TOC (total organic carbon)
(ppb)
< 50
Sodium (ppb) < 5
Chloride (ppb) < 5
Silica (ppb) < 3
Bacteria (cfu/ml) < 100
Endotoxin (EU/ml) < 0.25
3.1.1 Nickel(II)-Manganese(III) LDH system, Ni1-xMnx(OH)2(An-)x/n∙mH2O:
Two main synthesis methods were used to synthesize the Ni1-xMnx(OH)2(An-)x/n∙mH2O LDH;
the high supersaturation co-precipitation method at non constant pH, and the urea synthesis
method with ammonium persulfate added as oxidizing agent. Some early syntheses were also
51
done with the co-precipitation method. An overview of technical details of all synthesized
samples is given in the end of this section.
3.1.1.1 Co-precipitation at constant pH:
Ni1-xMnx(OH)2(An-)x/n∙mH2O LDHs with carbonate as interlayer anion and target composition
x = 0.20 and x = 0.25, were prepared with the co-precipitation method under constant pH and
temperature (pH = 10.0 and 9.0; T = 60 oC). A schematic illustration of the apparatus setup is
shown in figure 1. See section X in chapter two for more theoretical information.
Two solutions were prepared:
I. 50 ml 1.0 M cationic solution of the divalent metal salts; Ni(NO3)2∙6H2O(s) and
Mn(NO3)2∙4H2O(s) with desired composition (x = 0.20 and 0.25 with reference to
formula 1).
II. 250 ml alkaline solution consisting of 1.0M KOH(s) and 0.20M K2CO3(s).
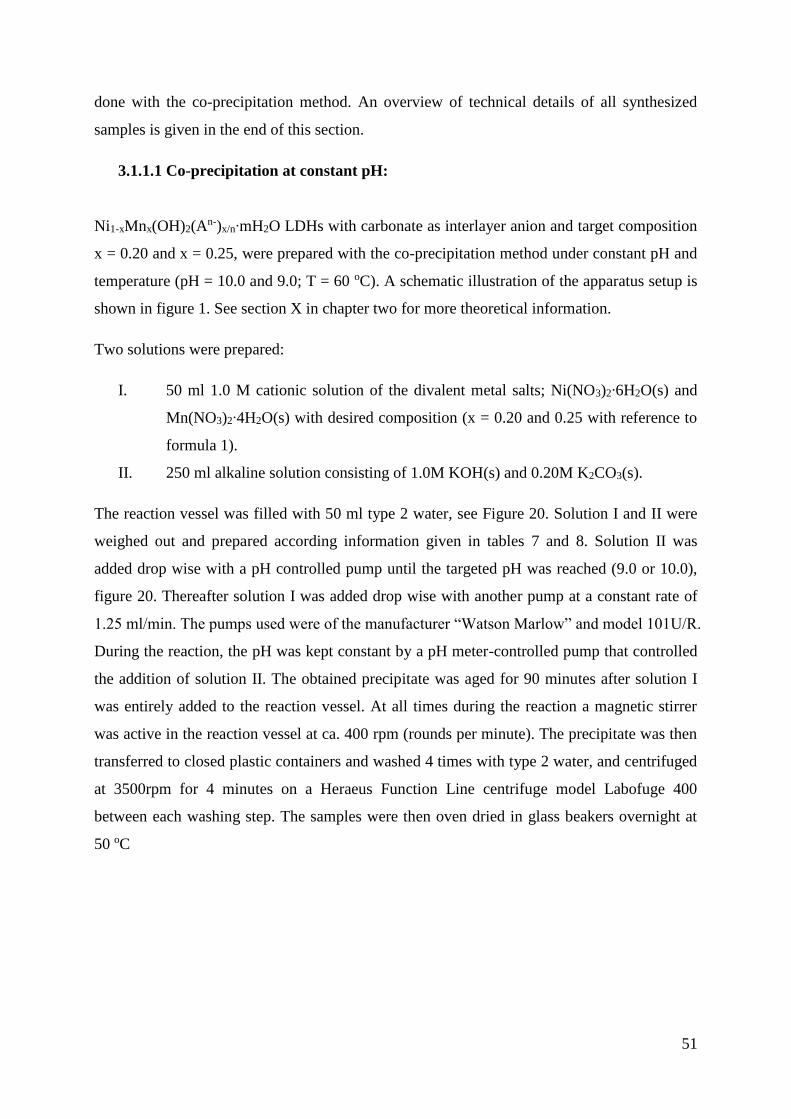
The reaction vessel was filled with 50 ml type 2 water, see Figure 20. Solution I and II were
weighed out and prepared according information given in tables 7 and 8. Solution II was
added drop wise with a pH controlled pump until the targeted pH was reached (9.0 or 10.0),
figure 20. Thereafter solution I was added drop wise with another pump at a constant rate of
1.25 ml/min. The pumps used were of the manufacturer “Watson Marlow” and model 101U/R.
During the reaction, the pH was kept constant by a pH meter-controlled pump that controlled
the addition of solution II. The obtained precipitate was aged for 90 minutes after solution I
was entirely added to the reaction vessel. At all times during the reaction a magnetic stirrer
was active in the reaction vessel at ca. 400 rpm (rounds per minute). The precipitate was then
transferred to closed plastic containers and washed 4 times with type 2 water, and centrifuged
at 3500rpm for 4 minutes on a Heraeus Function Line centrifuge model Labofuge 400
between each washing step. The samples were then oven dried in glass beakers overnight at
50 oC
52
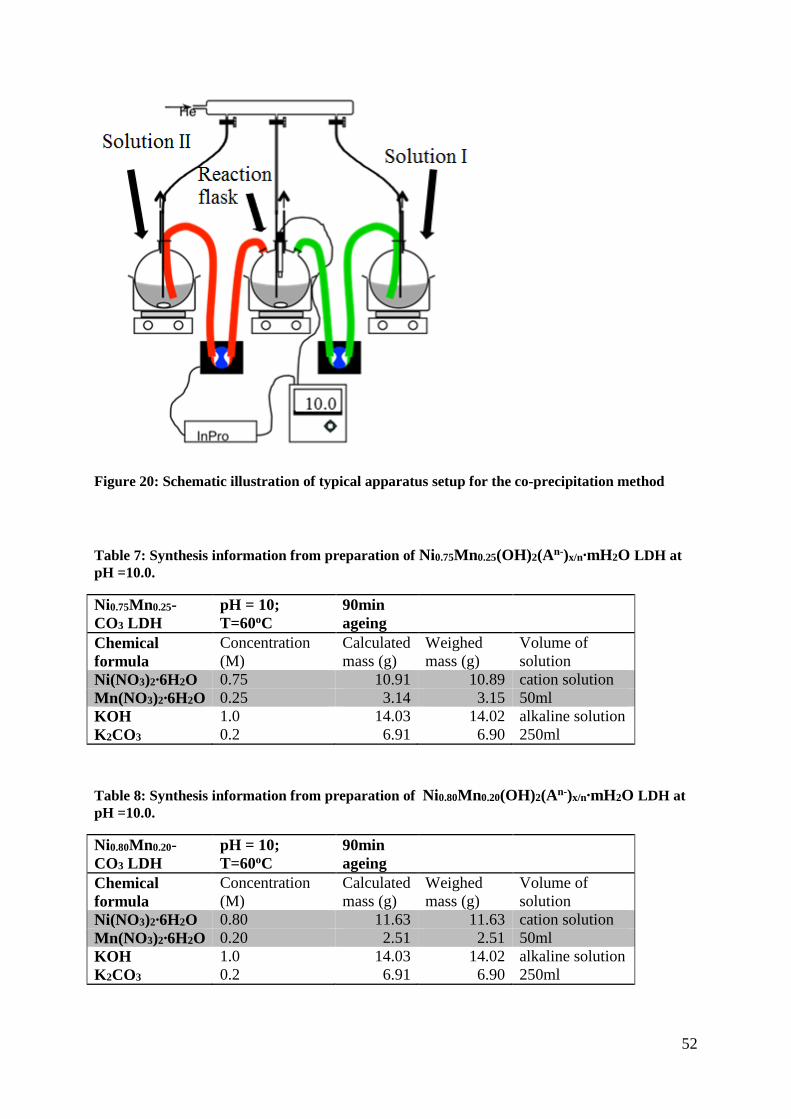
Figure 20: Schematic illustration of typical apparatus setup for the co-precipitation method
Table 7: Synthesis information from preparation of Ni0.75Mn0.25(OH)2(An-)x/n∙mH2O LDH at
pH =10.0.
Ni0.75Mn0.25-
CO3 LDH
pH = 10;
T=60oC
90min
ageing
Chemical
formula
Concentration
(M)
Calculated
mass (g)
Weighed
mass (g)
Volume of
solution
Ni(NO3)2∙6H2O 0.75 10.91 10.89 cation solution
Mn(NO3)2∙6H2O 0.25 3.14 3.15 50ml
KOH 1.0 14.03 14.02 alkaline solution
K2CO3 0.2 6.91 6.90 250ml
Table 8: Synthesis information from preparation of Ni0.80Mn0.20(OH)2(An-)x/n∙mH2O LDH at
pH =10.0.
Ni0.80Mn0.20-
CO3 LDH
pH = 10;
T=60oC
90min
ageing
Chemical
formula
Concentration
(M)
Calculated
mass (g)
Weighed
mass (g)
Volume of
solution
Ni(NO3)2∙6H2O 0.80 11.63 11.63 cation solution
Mn(NO3)2∙6H2O 0.20 2.51 2.51 50ml
KOH 1.0 14.03 14.02 alkaline solution
K2CO3 0.2 6.91 6.90 250ml
53
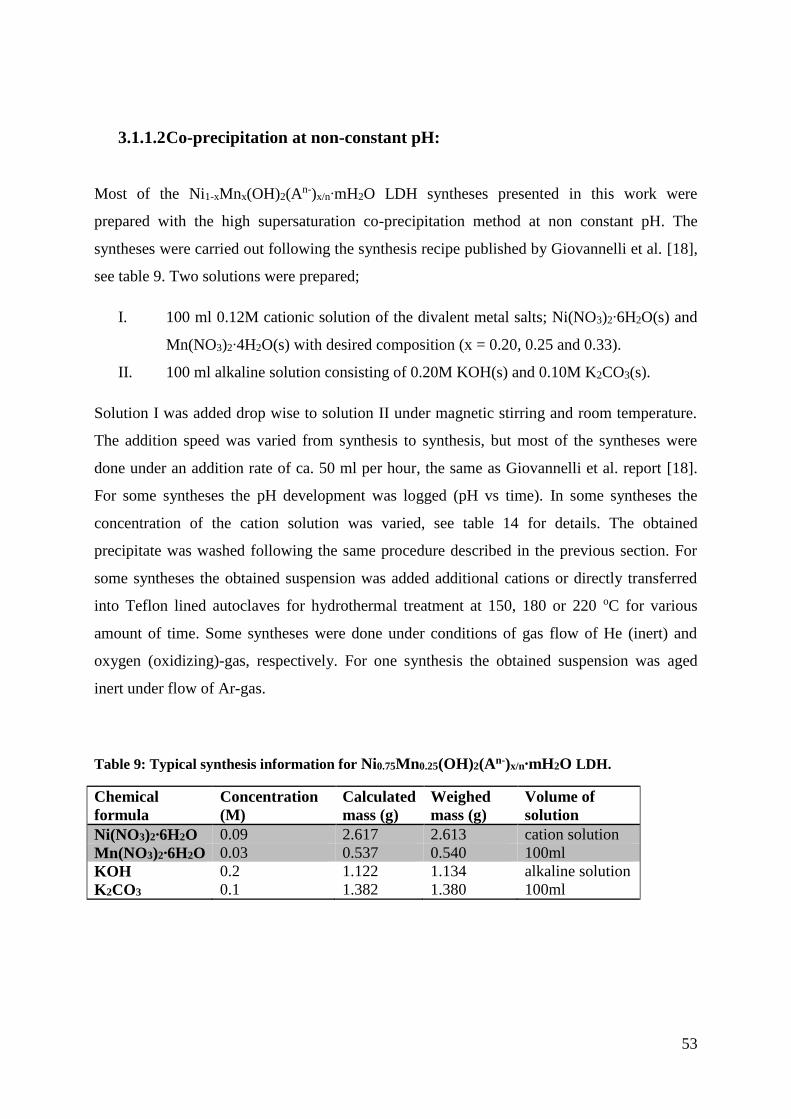
3.1.1.2 Co-precipitation at non-constant pH:
Most of the Ni1-xMnx(OH)2(An-)x/n∙mH2O LDH syntheses presented in this work were
prepared with the high supersaturation co-precipitation method at non constant pH. The
syntheses were carried out following the synthesis recipe published by Giovannelli et al. [18],
see table 9. Two solutions were prepared;
I. 100 ml 0.12M cationic solution of the divalent metal salts; Ni(NO3)2∙6H2O(s) and
Mn(NO3)2∙4H2O(s) with desired composition (x = 0.20, 0.25 and 0.33).
II. 100 ml alkaline solution consisting of 0.20M KOH(s) and 0.10M K2CO3(s).
Solution I was added drop wise to solution II under magnetic stirring and room temperature.
The addition speed was varied from synthesis to synthesis, but most of the syntheses were
done under an addition rate of ca. 50 ml per hour, the same as Giovannelli et al. report [18].
For some syntheses the pH development was logged (pH vs time). In some syntheses the
concentration of the cation solution was varied, see table 14 for details. The obtained
precipitate was washed following the same procedure described in the previous section. For
some syntheses the obtained suspension was added additional cations or directly transferred
into Teflon lined autoclaves for hydrothermal treatment at 150, 180 or 220 oC for various
amount of time. Some syntheses were done under conditions of gas flow of He (inert) and
oxygen (oxidizing)-gas, respectively. For one synthesis the obtained suspension was aged
inert under flow of Ar-gas.
Table 9: Typical synthesis information for Ni0.75Mn0.25(OH)2(An-)x/n∙mH2O LDH.
Chemical
formula
Concentration
(M)
Calculated
mass (g)
Weighed
mass (g)
Volume of
solution
Ni(NO3)2∙6H2O 0.09 2.617 2.613 cation solution
Mn(NO3)2∙6H2O 0.03 0.537 0.540 100ml
KOH 0.2 1.122 1.134 alkaline solution
K2CO3 0.1 1.382 1.380 100ml
54
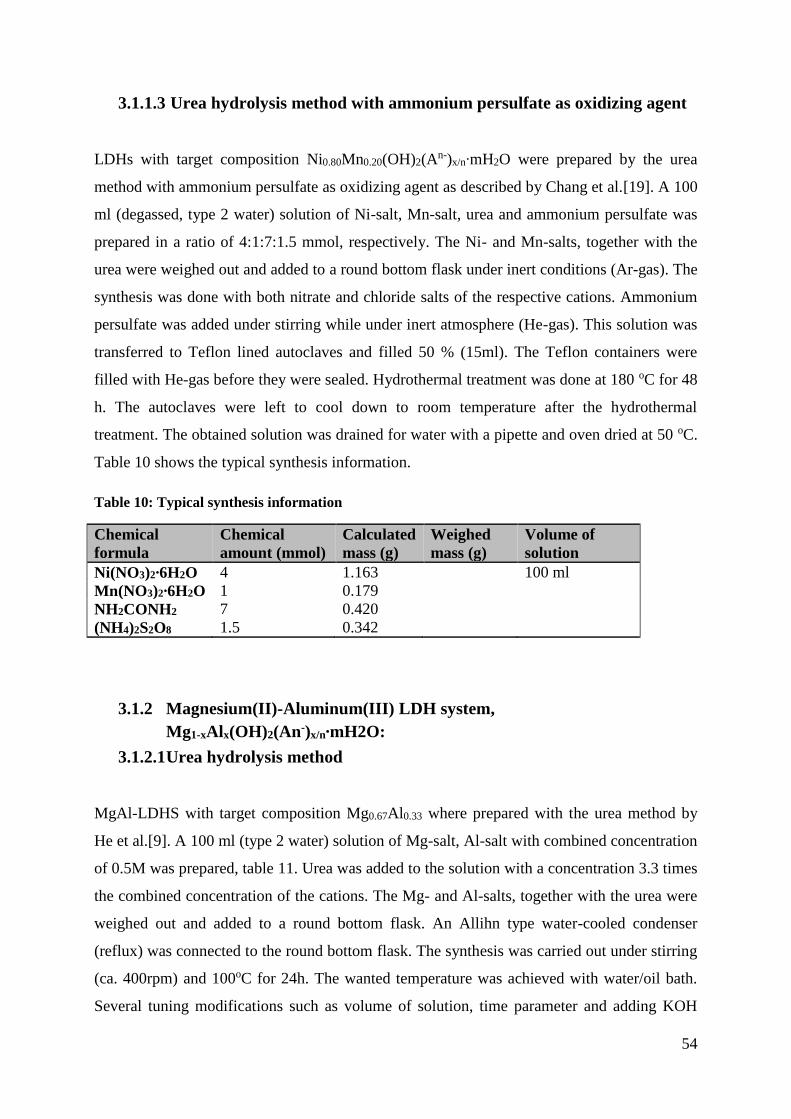
3.1.1.3 Urea hydrolysis method with ammonium persulfate as oxidizing agent
LDHs with target composition Ni0.80Mn0.20(OH)2(An-)x/n∙mH2O were prepared by the urea
method with ammonium persulfate as oxidizing agent as described by Chang et al.[19]. A 100
ml (degassed, type 2 water) solution of Ni-salt, Mn-salt, urea and ammonium persulfate was
prepared in a ratio of 4:1:7:1.5 mmol, respectively. The Ni- and Mn-salts, together with the
urea were weighed out and added to a round bottom flask under inert conditions (Ar-gas). The
synthesis was done with both nitrate and chloride salts of the respective cations. Ammonium
persulfate was added under stirring while under inert atmosphere (He-gas). This solution was
transferred to Teflon lined autoclaves and filled 50 % (15ml). The Teflon containers were
filled with He-gas before they were sealed. Hydrothermal treatment was done at 180 oC for 48
h. The autoclaves were left to cool down to room temperature after the hydrothermal
treatment. The obtained solution was drained for water with a pipette and oven dried at 50 oC.
Table 10 shows the typical synthesis information.
Table 10: Typical synthesis information
Chemical
formula
Chemical
amount (mmol)
Calculated
mass (g)
Weighed
mass (g)
Volume of
solution
Ni(NO3)2∙6H2O 4 1.163 100 ml
Mn(NO3)2∙6H2O 1 0.179
NH2CONH2 7 0.420
(NH4)2S2O8 1.5 0.342
3.1.2 Magnesium(II)-Aluminum(III) LDH system,
Mg1-xAlx(OH)2(An-)x/n∙mH2O:
3.1.2.1 Urea hydrolysis method
MgAl-LDHS with target composition Mg0.67Al0.33 where prepared with the urea method by
He et al.[9]. A 100 ml (type 2 water) solution of Mg-salt, Al-salt with combined concentration
of 0.5M was prepared, table 11. Urea was added to the solution with a concentration 3.3 times
the combined concentration of the cations. The Mg- and Al-salts, together with the urea were
weighed out and added to a round bottom flask. An Allihn type water-cooled condenser
(reflux) was connected to the round bottom flask. The synthesis was carried out under stirring
(ca. 400rpm) and 100oC for 24h. The wanted temperature was achieved with water/oil bath.
Several tuning modifications such as volume of solution, time parameter and adding KOH
55
and KNO3 were done in order to achieve wanted results. This also led us to the “Urea direct
nitrate synthesis” described in the following section. Some obtained solutions were also
hydrothermally treated at various temperatures and times after the described precipitation. All
samples were washed 4 times for 4 minutes with type 2 water at 3500rpm, thereafter oven
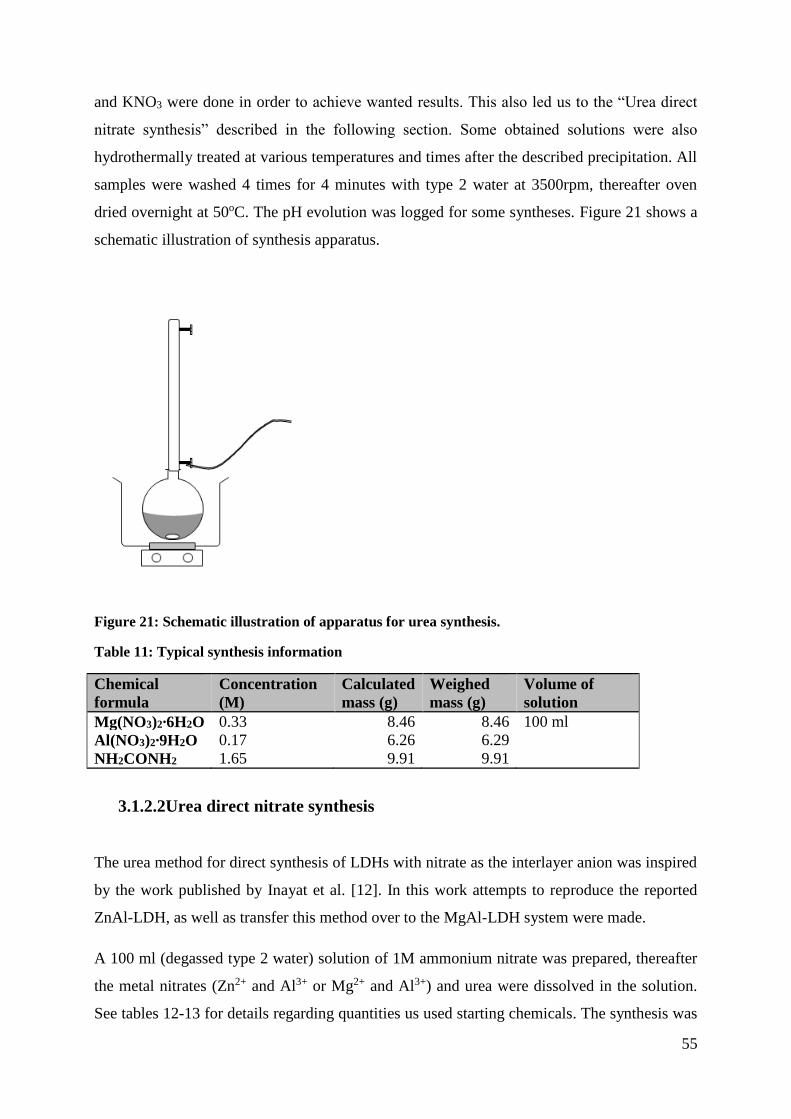
dried overnight at 50oC. The pH evolution was logged for some syntheses. Figure 21 shows a
schematic illustration of synthesis apparatus.
Figure 21: Schematic illustration of apparatus for urea synthesis.
Table 11: Typical synthesis information
Chemical
formula
Concentration
(M)
Calculated
mass (g)
Weighed
mass (g)
Volume of
solution
Mg(NO3)2∙6H2O 0.33 8.46 8.46 100 ml
Al(NO3)2∙9H2O 0.17 6.26 6.29
NH2CONH2 1.65 9.91 9.91
3.1.2.2Urea direct nitrate synthesis
The urea method for direct synthesis of LDHs with nitrate as the interlayer anion was inspired
by the work published by Inayat et al. [12]. In this work attempts to reproduce the reported
ZnAl-LDH, as well as transfer this method over to the MgAl-LDH system were made.
A 100 ml (degassed type 2 water) solution of 1M ammonium nitrate was prepared, thereafter
the metal nitrates (Zn2+ and Al3+ or Mg2+ and Al3+) and urea were dissolved in the solution.
See tables 12-13 for details regarding quantities us used starting chemicals. The synthesis was
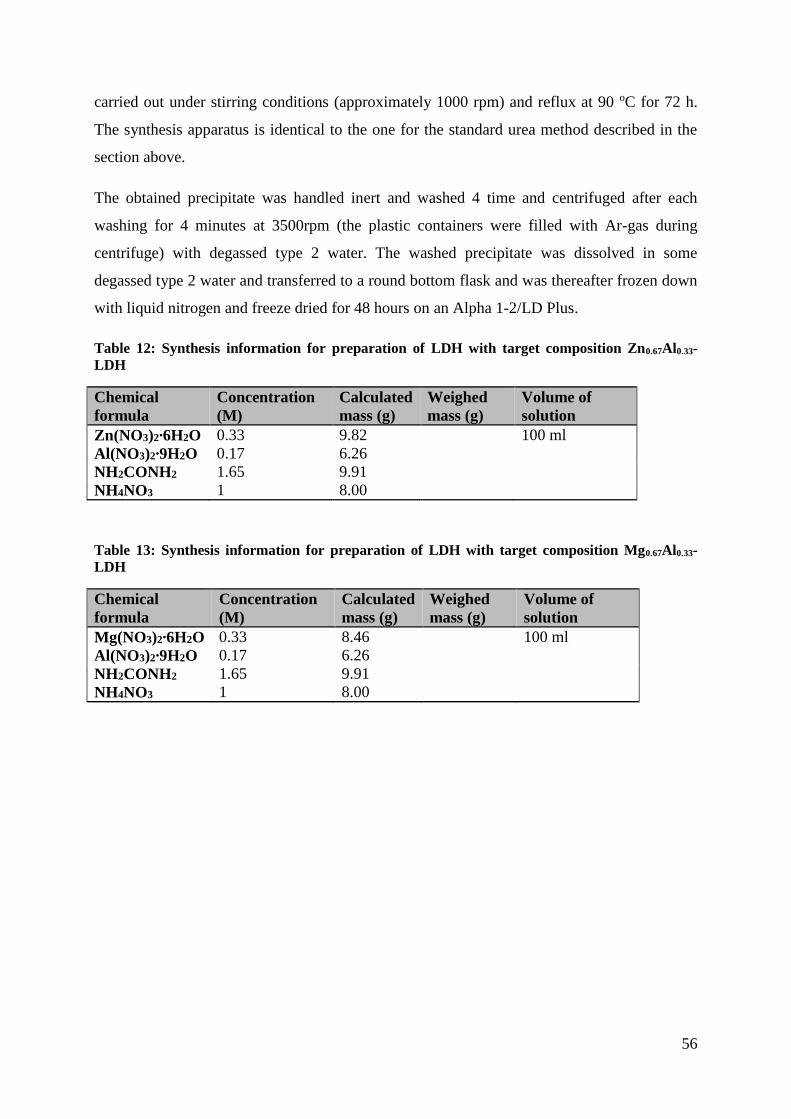
56
carried out under stirring conditions (approximately 1000 rpm) and reflux at 90 oC for 72 h.
The synthesis apparatus is identical to the one for the standard urea method described in the
section above.
The obtained precipitate was handled inert and washed 4 time and centrifuged after each
washing for 4 minutes at 3500rpm (the plastic containers were filled with Ar-gas during
centrifuge) with degassed type 2 water. The washed precipitate was dissolved in some
degassed type 2 water and transferred to a round bottom flask and was thereafter frozen down
with liquid nitrogen and freeze dried for 48 hours on an Alpha 1-2/LD Plus.
Table 12: Synthesis information for preparation of LDH with target composition Zn0.67Al0.33-
LDH
Chemical
formula
Concentration
(M)
Calculated
mass (g)
Weighed
mass (g)
Volume of
solution
Zn(NO3)2∙6H2O 0.33 9.82 100 ml
Al(NO3)2∙9H2O 0.17 6.26
NH2CONH2 1.65 9.91
NH4NO3 1 8.00
Table 13: Synthesis information for preparation of LDH with target composition Mg0.67Al0.33-
LDH
Chemical
formula
Concentration
(M)
Calculated
mass (g)
Weighed
mass (g)
Volume of
solution
Mg(NO3)2∙6H2O 0.33 8.46 100 ml
Al(NO3)2∙9H2O 0.17 6.26
NH2CONH2 1.65 9.91
NH4NO3 1 8.00
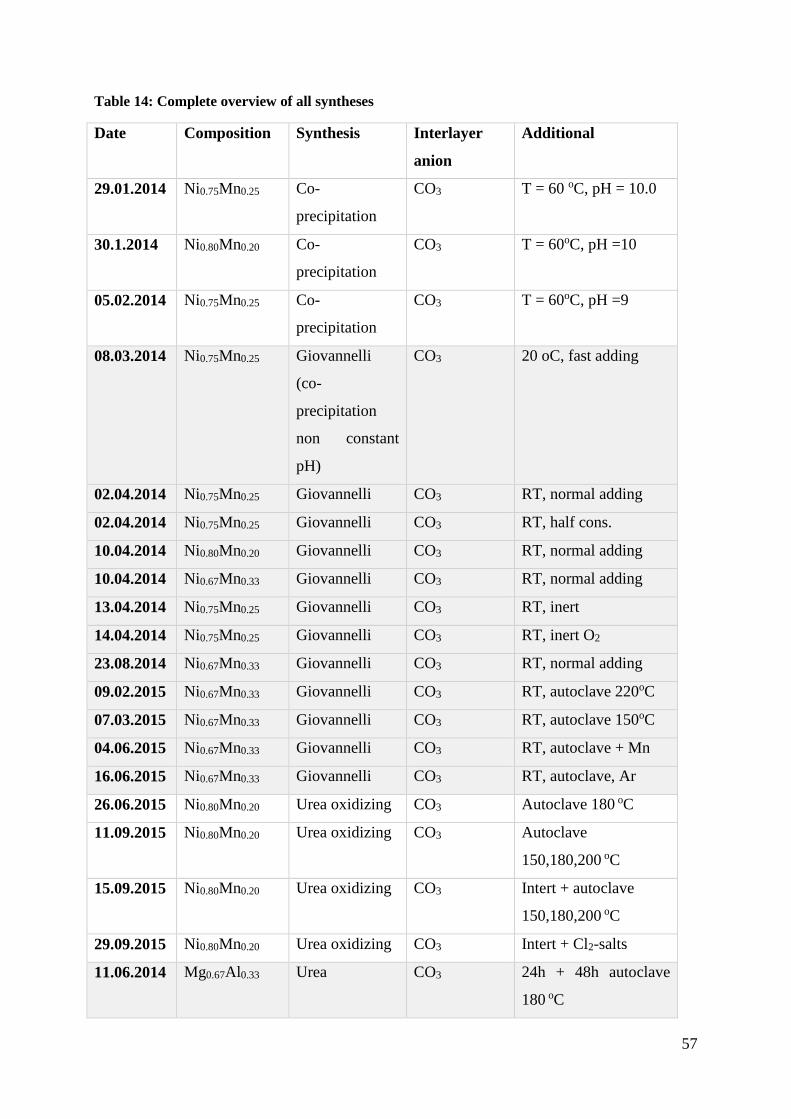
57
Table 14: Complete overview of all syntheses
Date Composition Synthesis Interlayer
anion
Additional
29.01.2014 Ni0.75Mn0.25 Co-
precipitation
CO3 T = 60 oC, pH = 10.0
30.1.2014 Ni0.80Mn0.20 Co-
precipitation
CO3 T = 60oC, pH =10
05.02.2014 Ni0.75Mn0.25 Co-
precipitation
CO3 T = 60oC, pH =9
08.03.2014 Ni0.75Mn0.25 Giovannelli
(co-
precipitation
non constant
pH)
CO3 20 oC, fast adding
02.04.2014 Ni0.75Mn0.25 Giovannelli CO3 RT, normal adding
02.04.2014 Ni0.75Mn0.25 Giovannelli CO3 RT, half cons.
10.04.2014 Ni0.80Mn0.20 Giovannelli CO3 RT, normal adding
10.04.2014 Ni0.67Mn0.33 Giovannelli CO3 RT, normal adding
13.04.2014 Ni0.75Mn0.25 Giovannelli CO3 RT, inert
14.04.2014 Ni0.75Mn0.25 Giovannelli CO3 RT, inert O2
23.08.2014 Ni0.67Mn0.33 Giovannelli CO3 RT, normal adding
09.02.2015 Ni0.67Mn0.33 Giovannelli CO3 RT, autoclave 220oC
07.03.2015 Ni0.67Mn0.33 Giovannelli CO3 RT, autoclave 150oC
04.06.2015 Ni0.67Mn0.33 Giovannelli CO3 RT, autoclave + Mn
16.06.2015 Ni0.67Mn0.33 Giovannelli CO3 RT, autoclave, Ar
26.06.2015 Ni0.80Mn0.20 Urea oxidizing CO3 Autoclave 180 oC
11.09.2015 Ni0.80Mn0.20 Urea oxidizing CO3 Autoclave
150,180,200 oC
15.09.2015 Ni0.80Mn0.20 Urea oxidizing CO3 Intert + autoclave
150,180,200 oC
29.09.2015 Ni0.80Mn0.20 Urea oxidizing CO3 Intert + Cl2-salts
11.06.2014 Mg0.67Al0.33 Urea CO3 24h + 48h autoclave
180 oC
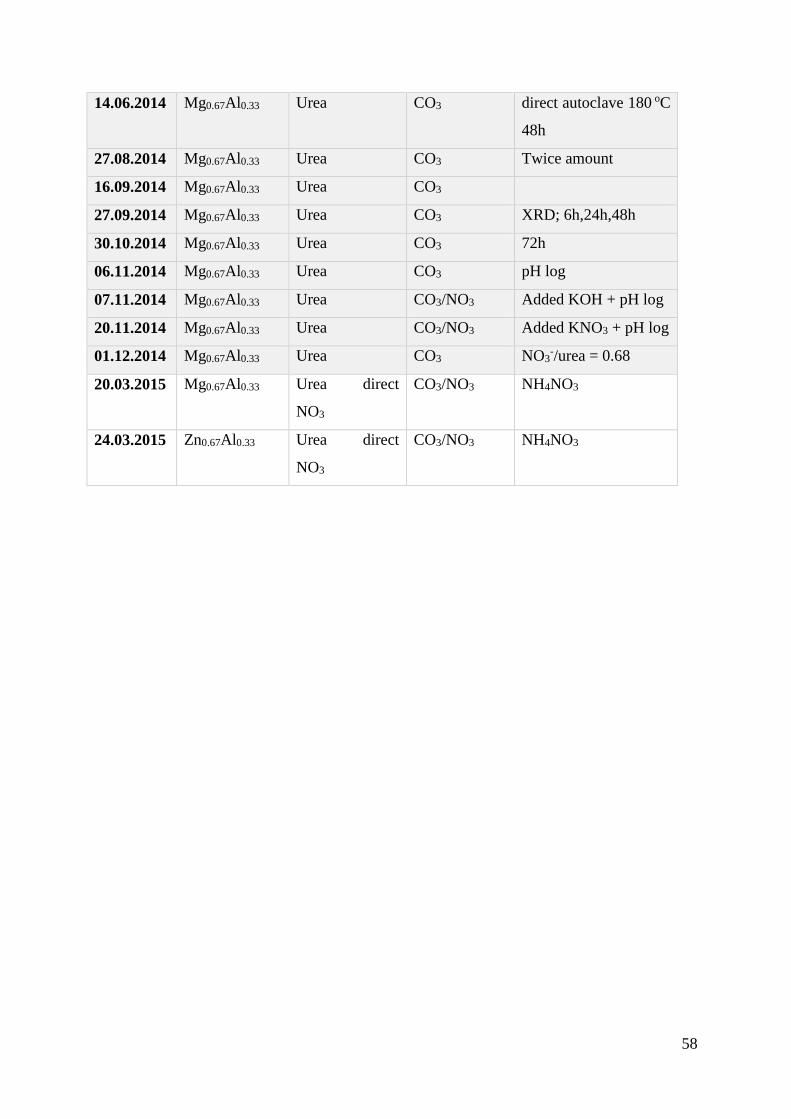
58
14.06.2014 Mg0.67Al0.33 Urea CO3 direct autoclave 180 oC
48h
27.08.2014 Mg0.67Al0.33 Urea CO3 Twice amount
16.09.2014 Mg0.67Al0.33 Urea CO3
27.09.2014 Mg0.67Al0.33 Urea CO3 XRD; 6h,24h,48h
30.10.2014 Mg0.67Al0.33 Urea CO3 72h
06.11.2014 Mg0.67Al0.33 Urea CO3 pH log
07.11.2014 Mg0.67Al0.33 Urea CO3/NO3 Added KOH + pH log
20.11.2014 Mg0.67Al0.33 Urea CO3/NO3 Added KNO3 + pH log
01.12.2014 Mg0.67Al0.33 Urea CO3 NO3-/urea = 0.68
20.03.2015 Mg0.67Al0.33 Urea direct
NO3
CO3/NO3 NH4NO3
24.03.2015 Zn0.67Al0.33 Urea direct
NO3
CO3/NO3 NH4NO3
59
3.2 Characterization:
3.2.1 Powder X-ray diffraction:
Powder X-ray diffraction patters were collected for all LDH samples using a Bruker D8
Discover diffractometer with Bragg-Brentano geometry and Cu Kα1 (λ = 1.540598 Å)
radiation selected by a single crystal Ge(111) Johanssen monochromator. The diffractometer
uses a Lynxeye detector. The typical diffraction pattern covered a 2θ range of 2-90o, with step
size 0.02°and counting time of 0.3 sec/step.
The samples were prepared in the following way:
The LDH samples were powdered in a mortar; thereafter some Si-NIST (National Institute of
Standards and Technology) was added. This powdered mix was added onto the plastic sample
holder. Some drops of isopropanol were then dripped on top of the powder, making a uniform
slurry.
The obtained diffraction data were treated with several software packs; DIFFRAC EVA,
Fullprof Suite [43, 44], Pearson’s Crystal Database[45] and TOPAS-Academic[46].
For some samples diffraction data was collected at the ESRF (European Synchrotron
Radiation Facility) at the SNBL (Swiss-Norwegian beam line).
These samples were measured in capillaries at 4 temperatures; room temperature, 150 °C,
400 °C and 650 °C. Background was measured in empty capillary in the respective
temperatures.
3.2.2 Thermal analysis (TG/DSC)
Combined TG-DSC data was collected with a Netzsch STA 449 F1 Jupiter instrument. Pt
crucibles, which are stable for the temperature interval used, were used for the measurements.
An empty Pt crucible was measured for background correction.
In a typical measurement, the Pt crucible was filled with approximately 20-30 mg of
powdered sample. Protection gas flow was set to 25 ml/min and gas flow to 50 ml/min. The
measurement program was started first when the balance was stable after the protection gas
flow (N2) was turned on. Data was measured during heating from 30 to 900 oC with a heating
rate of 5 oC /min and during cooling from 900 -30o C with the same rate.
60
3.2.3 Magnetic measurements
Magnetic properties were measured on a PPMS (Physical Property Measurement System)
instrument from Quantum Design. The instrument model is 6000 PPMS. The samples were
weighed and placed inside a gelatine capsule and thereafter mounted in a sample tube with
tape. The sample tube was pierced such that the pressure could equalize inside the instrument
when underpressure was applied. Two types of measurements were done:
1) ZFC (Zero field cooled), heating in a measuring field of 500G from 4-298K
2) Thereafter, a FC (field cooled) measurement from 4-298K in the same field.
3) Hysteresis, M(H) curve at 4 K
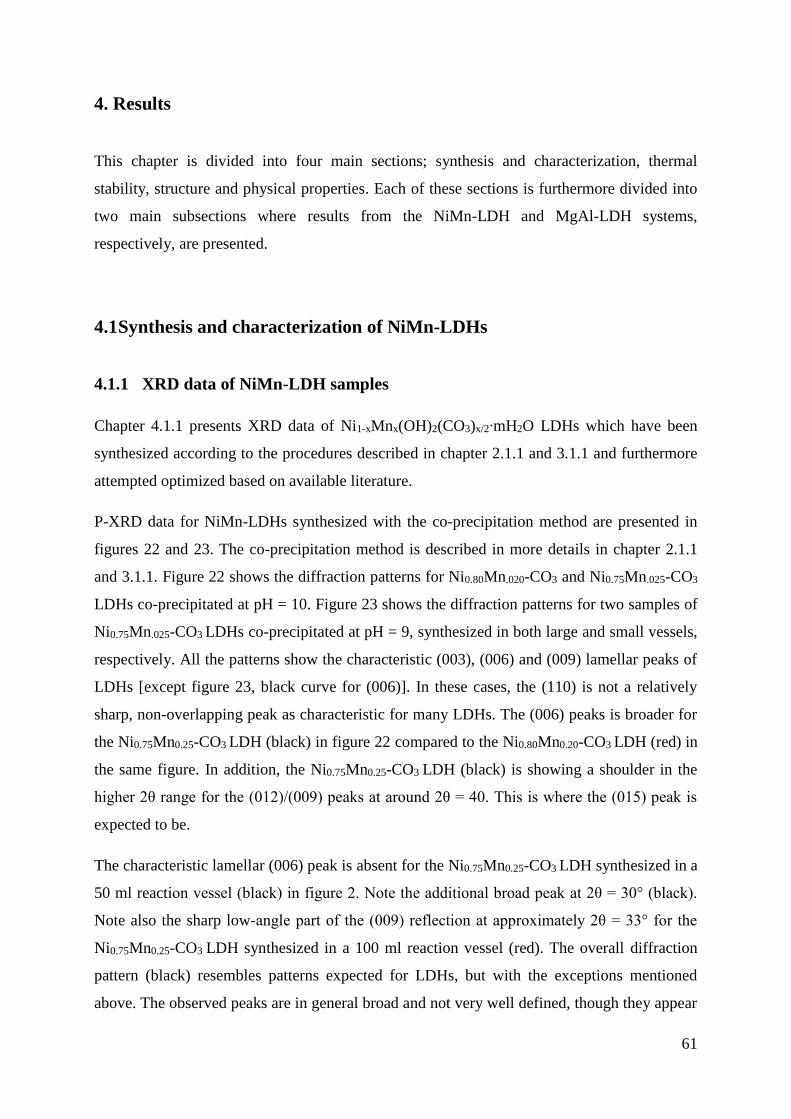
61
4. Results
This chapter is divided into four main sections; synthesis and characterization, thermal
stability, structure and physical properties. Each of these sections is furthermore divided into
two main subsections where results from the NiMn-LDH and MgAl-LDH systems,
respectively, are presented.
4.1 Synthesis and characterization of NiMn-LDHs
4.1.1 XRD data of NiMn-LDH samples
Chapter 4.1.1 presents XRD data of Ni1-xMnx(OH)2(CO3)x/2∙mH2O LDHs which have been
synthesized according to the procedures described in chapter 2.1.1 and 3.1.1 and furthermore
attempted optimized based on available literature.
P-XRD data for NiMn-LDHs synthesized with the co-precipitation method are presented in
figures 22 and 23. The co-precipitation method is described in more details in chapter 2.1.1
and 3.1.1. Figure 22 shows the diffraction patterns for Ni0.80Mn.020-CO3 and Ni0.75Mn.025-CO3
LDHs co-precipitated at pH = 10. Figure 23 shows the diffraction patterns for two samples of
Ni0.75Mn.025-CO3 LDHs co-precipitated at pH = 9, synthesized in both large and small vessels,
respectively. All the patterns show the characteristic (003), (006) and (009) lamellar peaks of
LDHs [except figure 23, black curve for (006)]. In these cases, the (110) is not a relatively
sharp, non-overlapping peak as characteristic for many LDHs. The (006) peaks is broader for
the Ni0.75Mn0.25-CO3 LDH (black) in figure 22 compared to the Ni0.80Mn0.20-CO3 LDH (red) in
the same figure. In addition, the Ni0.75Mn0.25-CO3 LDH (black) is showing a shoulder in the
higher 2θ range for the (012)/(009) peaks at around 2θ = 40. This is where the (015) peak is
expected to be.
The characteristic lamellar (006) peak is absent for the Ni0.75Mn0.25-CO3 LDH synthesized in a
50 ml reaction vessel (black) in figure 2. Note the additional broad peak at 2θ = 30° (black).
Note also the sharp low-angle part of the (009) reflection at approximately 2θ = 33° for the
Ni0.75Mn0.25-CO3 LDH synthesized in a 100 ml reaction vessel (red). The overall diffraction
pattern (black) resembles patterns expected for LDHs, but with the exceptions mentioned
above. The observed peaks are in general broad and not very well defined, though they appear
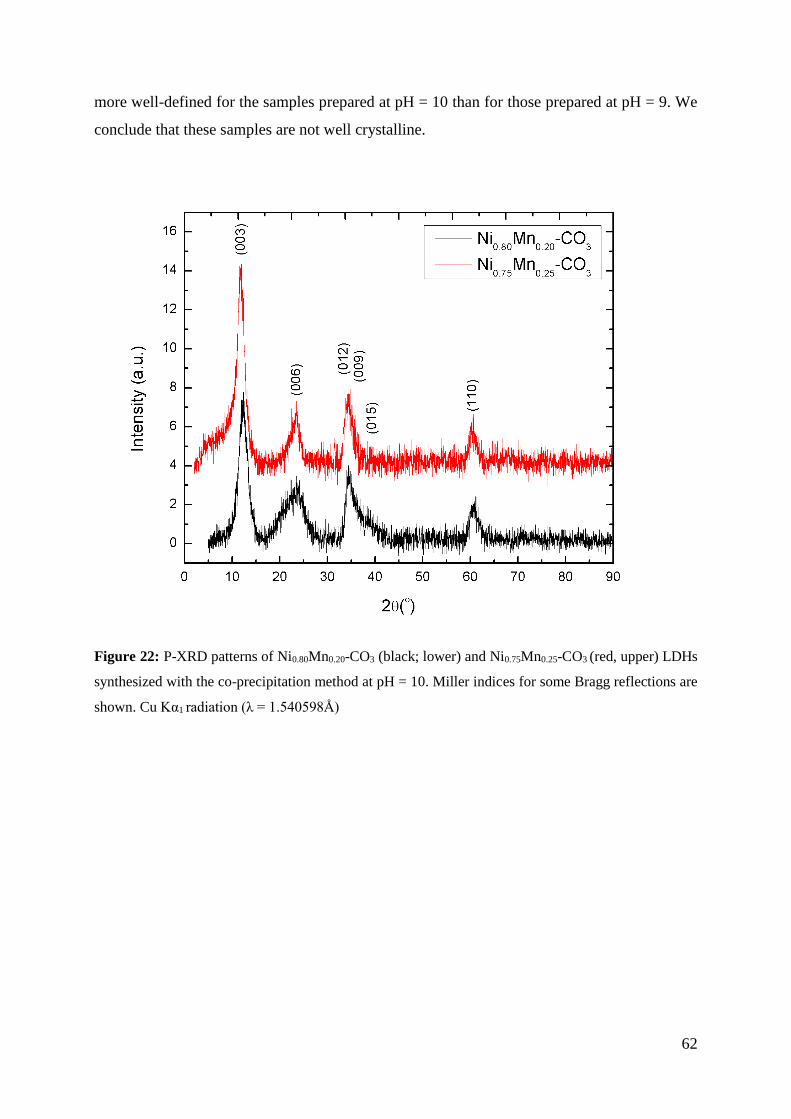
62
more well-defined for the samples prepared at pH = 10 than for those prepared at pH = 9. We
conclude that these samples are not well crystalline.
Figure 22: P-XRD patterns of Ni0.80Mn0.20-CO3 (black; lower) and Ni0.75Mn0.25-CO3 (red, upper) LDHs
synthesized with the co-precipitation method at pH = 10. Miller indices for some Bragg reflections are
shown. Cu Kα1 radiation (λ = 1.540598Å)
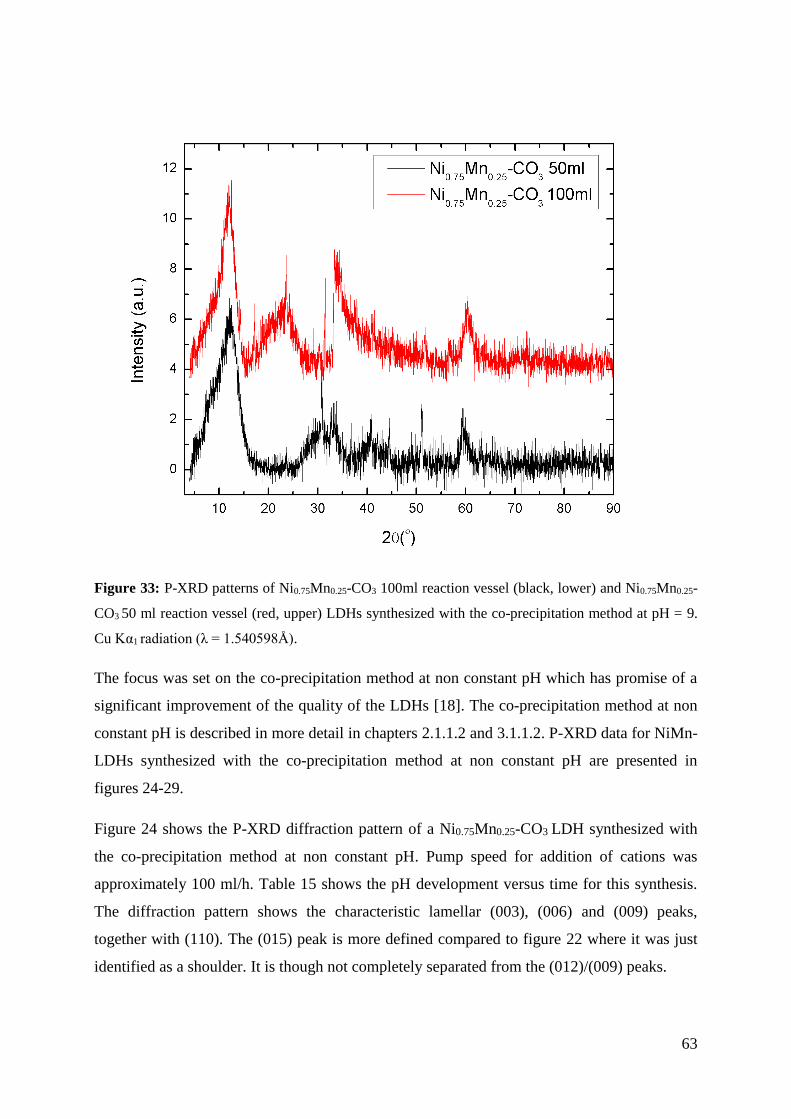
63
Figure 33: P-XRD patterns of Ni0.75Mn0.25-CO3 100ml reaction vessel (black, lower) and Ni0.75Mn0.25-
CO3 50 ml reaction vessel (red, upper) LDHs synthesized with the co-precipitation method at pH = 9.
Cu Kα1 radiation (λ = 1.540598Å).
The focus was set on the co-precipitation method at non constant pH which has promise of a
significant improvement of the quality of the LDHs [18]. The co-precipitation method at non
constant pH is described in more detail in chapters 2.1.1.2 and 3.1.1.2. P-XRD data for NiMn-
LDHs synthesized with the co-precipitation method at non constant pH are presented in
figures 24-29.
Figure 24 shows the P-XRD diffraction pattern of a Ni0.75Mn0.25-CO3 LDH synthesized with
the co-precipitation method at non constant pH. Pump speed for addition of cations was
approximately 100 ml/h. Table 15 shows the pH development versus time for this synthesis.
The diffraction pattern shows the characteristic lamellar (003), (006) and (009) peaks,
together with (110). The (015) peak is more defined compared to figure 22 where it was just
identified as a shoulder. It is though not completely separated from the (012)/(009) peaks.
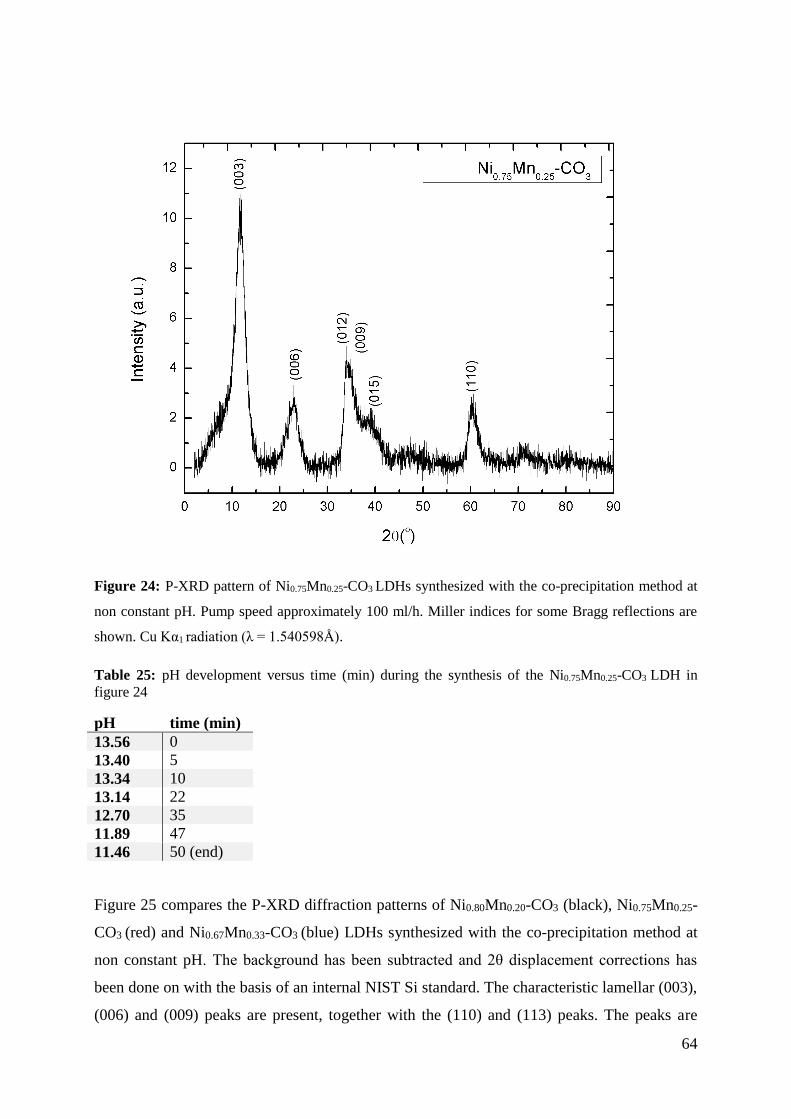
64
Figure 24: P-XRD pattern of Ni0.75Mn0.25-CO3 LDHs synthesized with the co-precipitation method at
non constant pH. Pump speed approximately 100 ml/h. Miller indices for some Bragg reflections are
shown. Cu Kα1 radiation (λ = 1.540598Å).
Table 25: pH development versus time (min) during the synthesis of the Ni0.75Mn0.25-CO3 LDH in
figure 24
pH time (min)
13.56 0
13.40 5
13.34 10
13.14 22
12.70 35
11.89 47
11.46 50 (end)
Figure 25 compares the P-XRD diffraction patterns of Ni0.80Mn0.20-CO3 (black), Ni0.75Mn0.25-
CO3 (red) and Ni0.67Mn0.33-CO3 (blue) LDHs synthesized with the co-precipitation method at
non constant pH. The background has been subtracted and 2θ displacement corrections has
been done on with the basis of an internal NIST Si standard. The characteristic lamellar (003),
(006) and (009) peaks are present, together with the (110) and (113) peaks. The peaks are
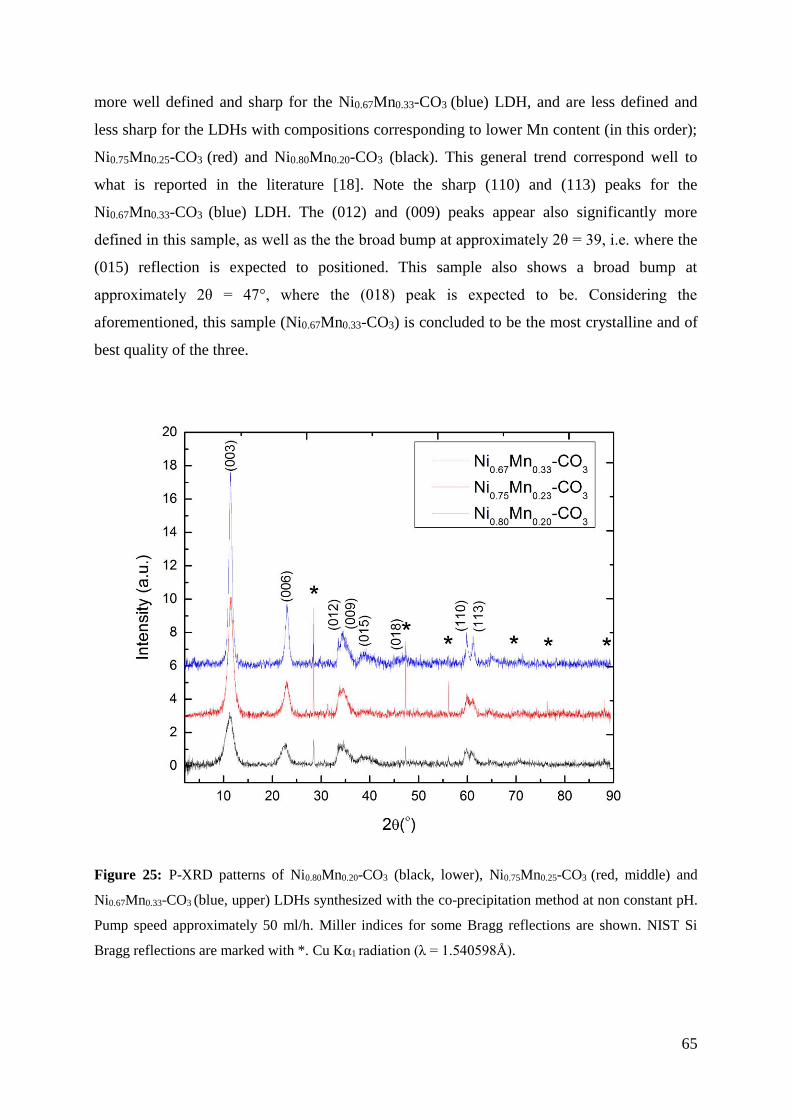
65
more well defined and sharp for the Ni0.67Mn0.33-CO3 (blue) LDH, and are less defined and
less sharp for the LDHs with compositions corresponding to lower Mn content (in this order);
Ni0.75Mn0.25-CO3 (red) and Ni0.80Mn0.20-CO3 (black). This general trend correspond well to
what is reported in the literature [18]. Note the sharp (110) and (113) peaks for the
Ni0.67Mn0.33-CO3 (blue) LDH. The (012) and (009) peaks appear also significantly more
defined in this sample, as well as the the broad bump at approximately 2θ = 39, i.e. where the
(015) reflection is expected to positioned. This sample also shows a broad bump at
approximately 2θ = 47°, where the (018) peak is expected to be. Considering the
aforementioned, this sample (Ni0.67Mn0.33-CO3) is concluded to be the most crystalline and of
best quality of the three.
Figure 25: P-XRD patterns of Ni0.80Mn0.20-CO3 (black, lower), Ni0.75Mn0.25-CO3 (red, middle) and
Ni0.67Mn0.33-CO3 (blue, upper) LDHs synthesized with the co-precipitation method at non constant pH.
Pump speed approximately 50 ml/h. Miller indices for some Bragg reflections are shown. NIST Si
Bragg reflections are marked with *. Cu Kα1 radiation (λ = 1.540598Å).
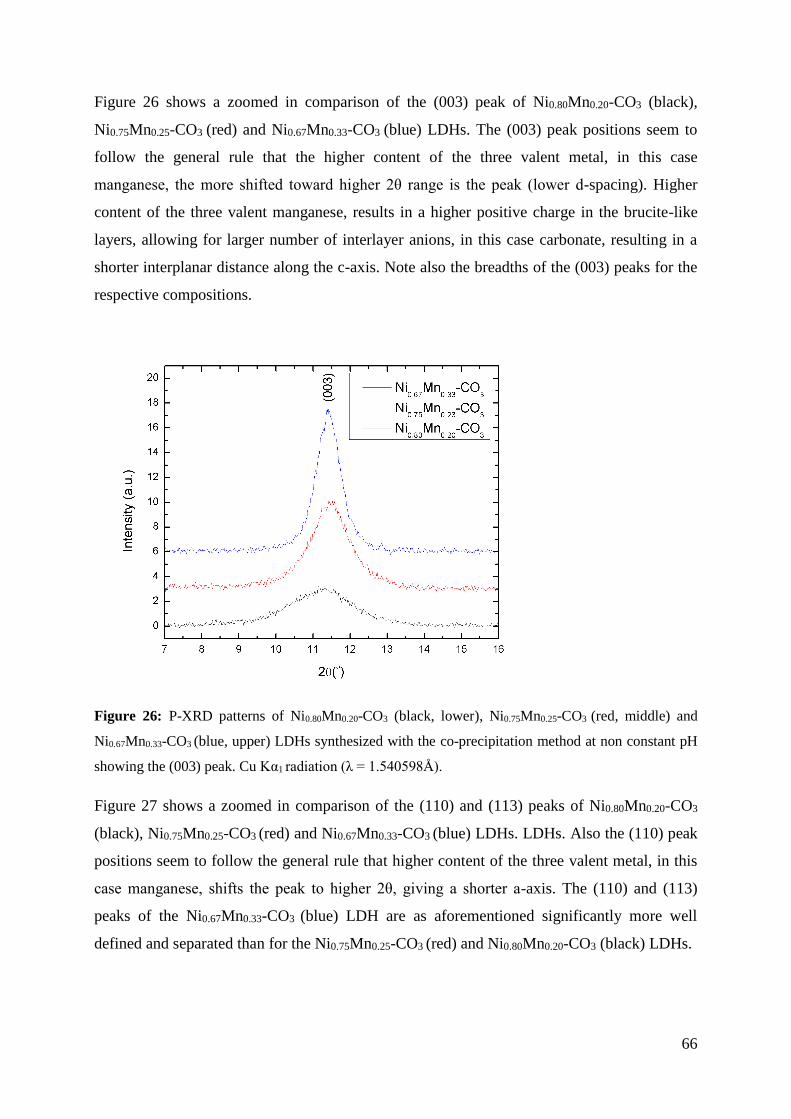
66
Figure 26 shows a zoomed in comparison of the (003) peak of Ni0.80Mn0.20-CO3 (black),
Ni0.75Mn0.25-CO3 (red) and Ni0.67Mn0.33-CO3 (blue) LDHs. The (003) peak positions seem to
follow the general rule that the higher content of the three valent metal, in this case
manganese, the more shifted toward higher 2θ range is the peak (lower d-spacing). Higher
content of the three valent manganese, results in a higher positive charge in the brucite-like
layers, allowing for larger number of interlayer anions, in this case carbonate, resulting in a
shorter interplanar distance along the c-axis. Note also the breadths of the (003) peaks for the
respective compositions.
Figure 26: P-XRD patterns of Ni0.80Mn0.20-CO3 (black, lower), Ni0.75Mn0.25-CO3 (red, middle) and
Ni0.67Mn0.33-CO3 (blue, upper) LDHs synthesized with the co-precipitation method at non constant pH
showing the (003) peak. Cu Kα1 radiation (λ = 1.540598Å).
Figure 27 shows a zoomed in comparison of the (110) and (113) peaks of Ni0.80Mn0.20-CO3
(black), Ni0.75Mn0.25-CO3 (red) and Ni0.67Mn0.33-CO3 (blue) LDHs. LDHs. Also the (110) peak
positions seem to follow the general rule that higher content of the three valent metal, in this
case manganese, shifts the peak to higher 2θ, giving a shorter a-axis. The (110) and (113)
peaks of the Ni0.67Mn0.33-CO3 (blue) LDH are as aforementioned significantly more well
defined and separated than for the Ni0.75Mn0.25-CO3 (red) and Ni0.80Mn0.20-CO3 (black) LDHs.
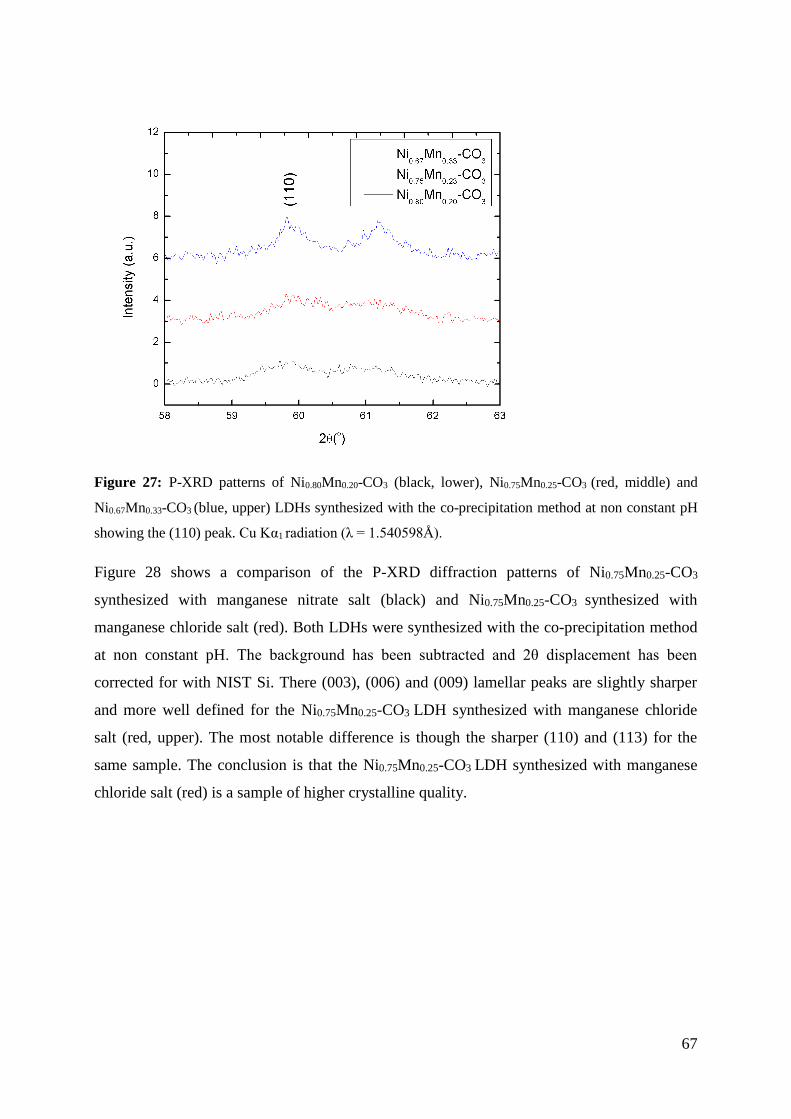
67
Figure 27: P-XRD patterns of Ni0.80Mn0.20-CO3 (black, lower), Ni0.75Mn0.25-CO3 (red, middle) and
Ni0.67Mn0.33-CO3 (blue, upper) LDHs synthesized with the co-precipitation method at non constant pH
showing the (110) peak. Cu Kα1 radiation (λ = 1.540598Å).
Figure 28 shows a comparison of the P-XRD diffraction patterns of Ni0.75Mn0.25-CO3
synthesized with manganese nitrate salt (black) and Ni0.75Mn0.25-CO3 synthesized with
manganese chloride salt (red). Both LDHs were synthesized with the co-precipitation method
at non constant pH. The background has been subtracted and 2θ displacement has been
corrected for with NIST Si. There (003), (006) and (009) lamellar peaks are slightly sharper
and more well defined for the Ni0.75Mn0.25-CO3 LDH synthesized with manganese chloride
salt (red, upper). The most notable difference is though the sharper (110) and (113) for the
same sample. The conclusion is that the Ni0.75Mn0.25-CO3 LDH synthesized with manganese
chloride salt (red) is a sample of higher crystalline quality.
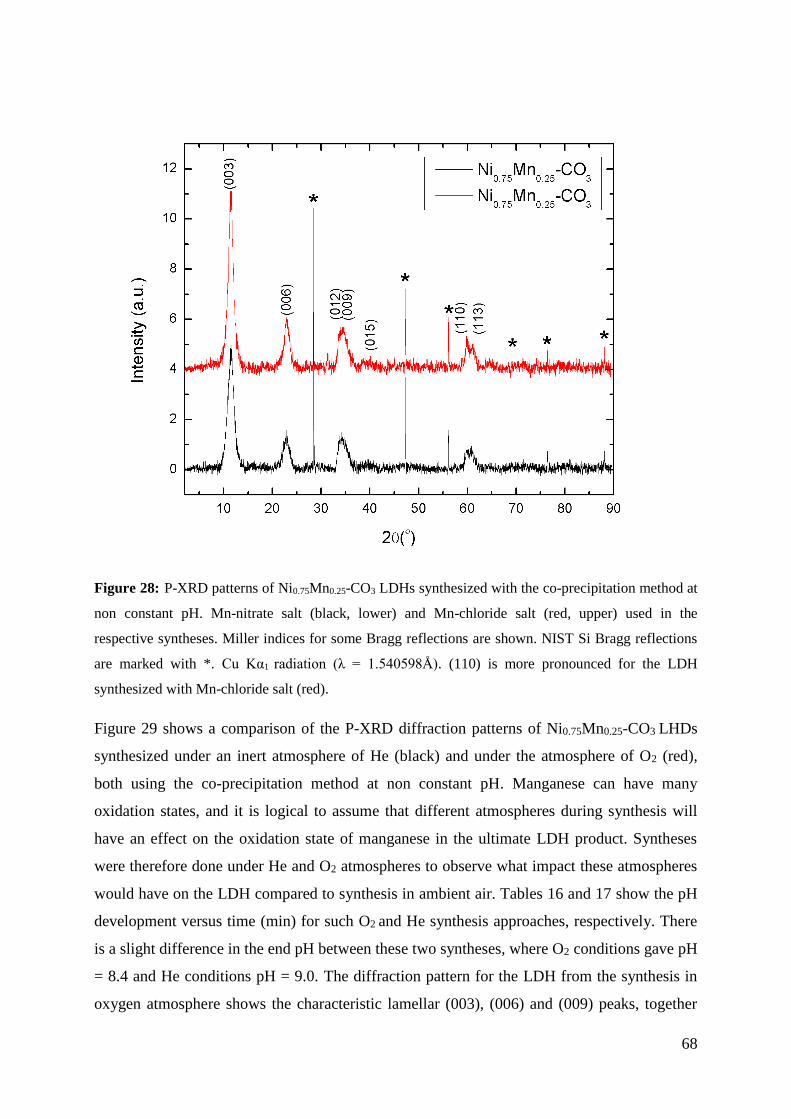
68
Figure 28: P-XRD patterns of Ni0.75Mn0.25-CO3 LDHs synthesized with the co-precipitation method at
non constant pH. Mn-nitrate salt (black, lower) and Mn-chloride salt (red, upper) used in the
respective syntheses. Miller indices for some Bragg reflections are shown. NIST Si Bragg reflections
are marked with *. Cu Kα1 radiation (λ = 1.540598Å). (110) is more pronounced for the LDH
synthesized with Mn-chloride salt (red).
Figure 29 shows a comparison of the P-XRD diffraction patterns of Ni0.75Mn0.25-CO3 LHDs
synthesized under an inert atmosphere of He (black) and under the atmosphere of O2 (red),
both using the co-precipitation method at non constant pH. Manganese can have many
oxidation states, and it is logical to assume that different atmospheres during synthesis will
have an effect on the oxidation state of manganese in the ultimate LDH product. Syntheses
were therefore done under He and O2 atmospheres to observe what impact these atmospheres
would have on the LDH compared to synthesis in ambient air. Tables 16 and 17 show the pH
development versus time (min) for such O2 and He synthesis approaches, respectively. There
is a slight difference in the end pH between these two syntheses, where O2 conditions gave pH
= 8.4 and He conditions pH = 9.0. The diffraction pattern for the LDH from the synthesis in
oxygen atmosphere shows the characteristic lamellar (003), (006) and (009) peaks, together
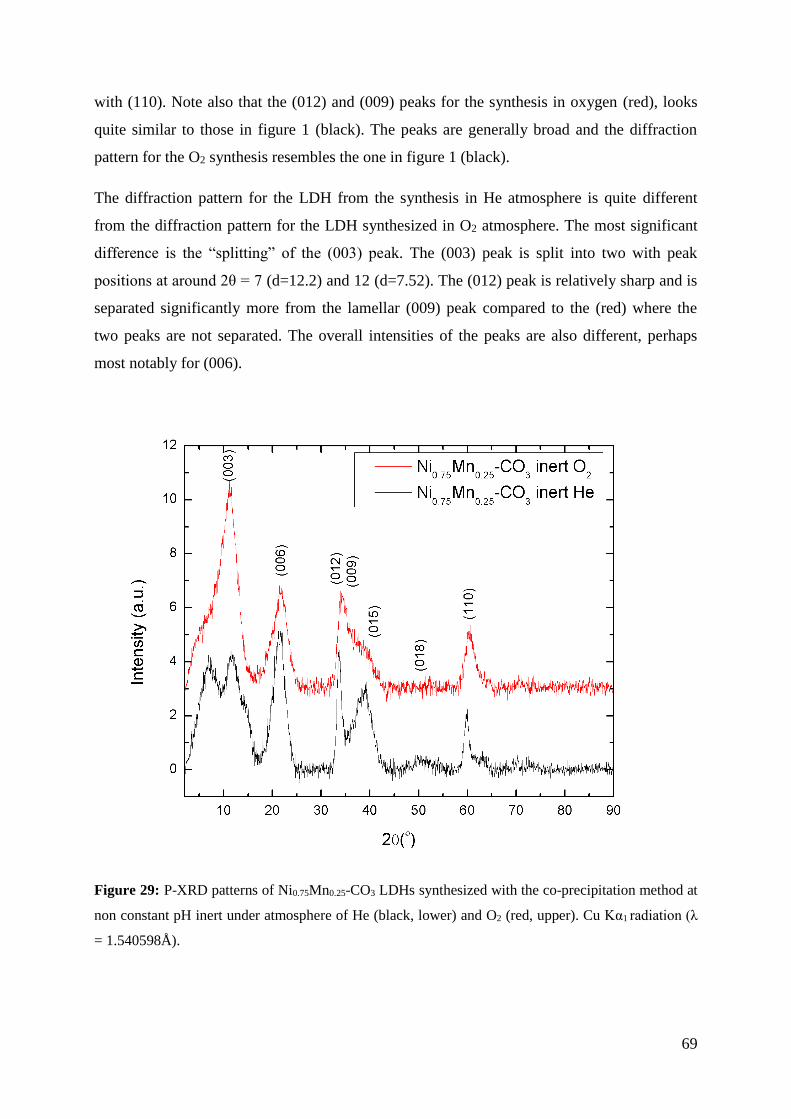
69
with (110). Note also that the (012) and (009) peaks for the synthesis in oxygen (red), looks
quite similar to those in figure 1 (black). The peaks are generally broad and the diffraction
pattern for the O2 synthesis resembles the one in figure 1 (black).
The diffraction pattern for the LDH from the synthesis in He atmosphere is quite different
from the diffraction pattern for the LDH synthesized in O2 atmosphere. The most significant
difference is the “splitting” of the (003) peak. The (003) peak is split into two with peak
positions at around 2θ = 7 (d=12.2) and 12 (d=7.52). The (012) peak is relatively sharp and is
separated significantly more from the lamellar (009) peak compared to the (red) where the
two peaks are not separated. The overall intensities of the peaks are also different, perhaps
most notably for (006).
Figure 29: P-XRD patterns of Ni0.75Mn0.25-CO3 LDHs synthesized with the co-precipitation method at
non constant pH inert under atmosphere of He (black, lower) and O2 (red, upper). Cu Kα1 radiation (λ
= 1.540598Å).
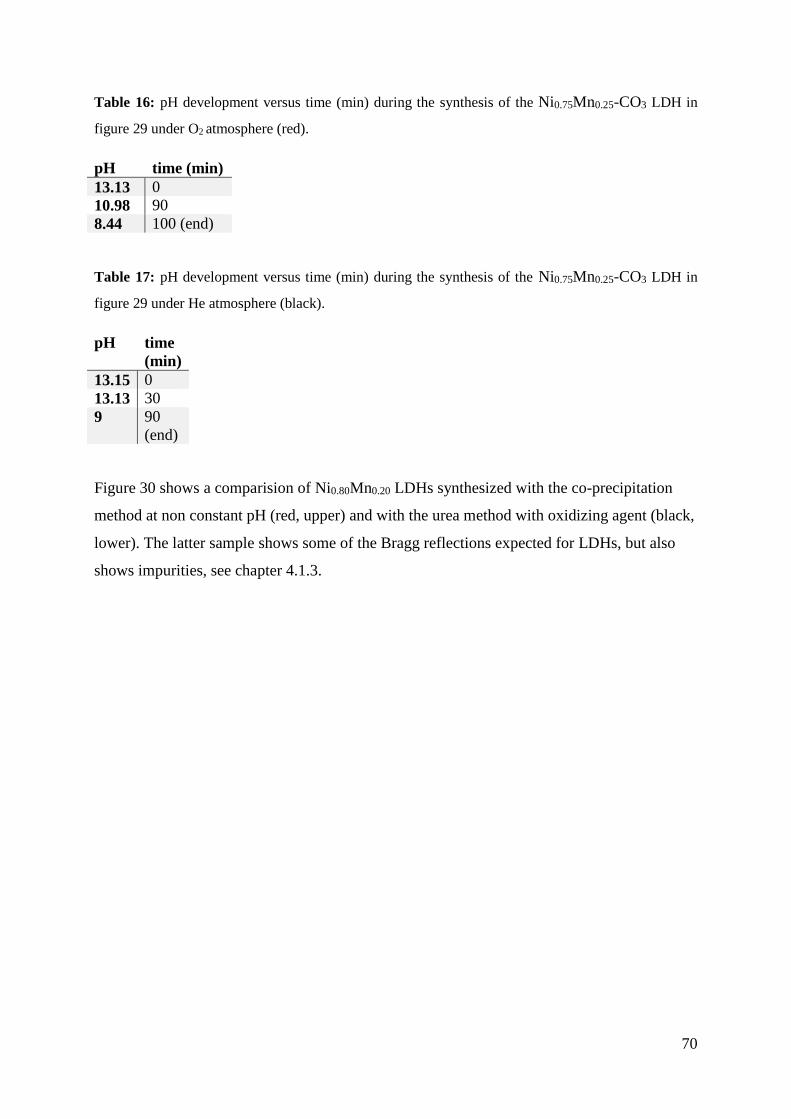
70
Table 16: pH development versus time (min) during the synthesis of the Ni0.75Mn0.25-CO3 LDH in
figure 29 under O2 atmosphere (red).
pH time (min)
13.13 0
10.98 90
8.44 100 (end)
Table 17: pH development versus time (min) during the synthesis of the Ni0.75Mn0.25-CO3 LDH in
figure 29 under He atmosphere (black).
pH time
(min)
13.15 0
13.13 30
9 90
(end)
Figure 30 shows a comparision of Ni0.80Mn0.20 LDHs synthesized with the co-precipitation
method at non constant pH (red, upper) and with the urea method with oxidizing agent (black,
lower). The latter sample shows some of the Bragg reflections expected for LDHs, but also
shows impurities, see chapter 4.1.3.
71
Figure 30: P-XRD patterns of Ni0.80Mn0.20-CO3 LDH synthesized with the co-precipitation method at
non constant pH (red) and Ni0.80Mn0.20-CO3 LDH synthesized with the modified urea method with
ammonium persulfate as oxidizing agent (black). Miller indices for some Bragg reflections are shown.
NIST Si Bragg reflections are marked with *. Cu Kα1 radiation (λ = 1.540598Å).
4.1.2 NiMn-LDHs unit cell parameters, evaluation of impurities and crystallinity
Obtained unit cell parameters from Rietveld refinement of the synthesized Ni1-
xMnx(OH)2(CO3)x/2∙mH2O LDHs, together with R-factors are presented in table 18.
72
Table 18: Obtained unit cell parameters from Rietveld refinement of P-XRD data for NiMn LDHs.
Calculated standard deviations in parentheses.
a (Å) c (Å) V (Å3) R-factors
08.03.2014
Ni0.75Mn0.25
3.065(4)
23.475(3) 190.96(5) Rexp :4.07
Rwp : 5.37
Rp : 4.25
GOF : 1.32
10.04.2014
Ni0.67Mn0.33
3.030(9) 23.190(9) 184.34(1) Rexp :8.81
Rwp :10.71
Rp : 8.46
GOF : 1.22
02.04.2014
Ni0.75Mn0.25
3.028(9)
23.142(7) 191.18(5) Rexp :8.64
Rwp : 9.86
Rp : 7.73
GOF : 1.14
10.04.2014
Ni0.80Mn0.20
3.061(7)
23.445(6) 190.2(1) Rexp : 11.61
Rwp : 17.06
Rp : 13.32
GOF : 1.47
05.12.2015
Ni0.75Mn0.25
MnCl2
3.041(2) 23.198(10)
185.74(2)
Rexp : 6.51
Rwp : 7.84
Rp : 6.11
GOF : 1.20
4.1.3 Different approaches to improve NiMn LDH products
Different approaches in order to improve the crystallinity of the NiMn LDHs will be
presented in this section. These approaches will be based on the results from section 4.1.1 and
4.1.2 and in light of relevant literature presented in chapter 1.
Several approaches were tested out in order to improve the crystallinity of the NiMn LDHs.
Post synthesis hydrothermal treatment, which is reported in literature to significantly improve
the crystallinity of LDHs on several other LDHs systems, was given main attention.
Hydrothermal treatment was carried out at various temperatures, and in some cases together
with addition of manganese, since leaching of the three valent metal is known to occur for
several LDH systems, including MgAl LDHs [16]. The addition of Mn solution was done as
following: A 50 ml solution of 0.1 M KOH and 0.08 M Mn(II) was prepared. O2 was bubbled
into the stirring solution until the solution was light brown and yellow. The pH in the solution
was measured to be 13. From the color we assume that some of the Mn in the solution is
present as M(III) and some as Mn(IV). 10 ml manganese solution corresponds to 8 mmol Mn,
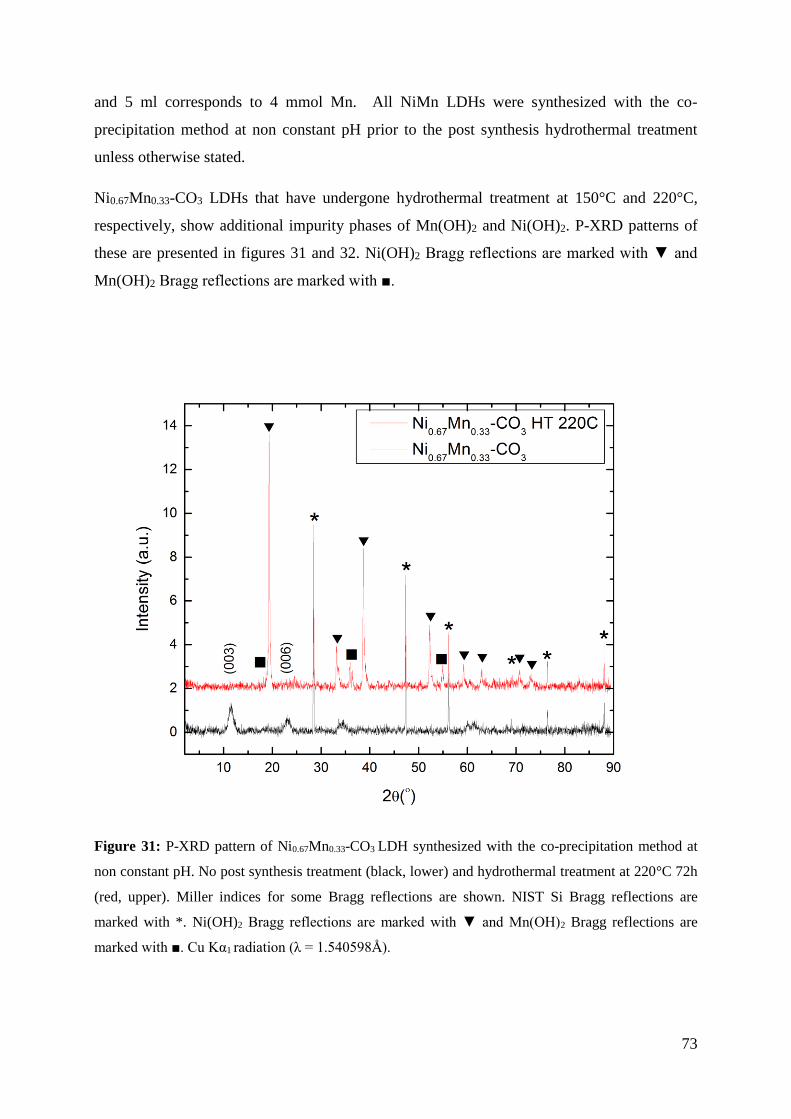
73
and 5 ml corresponds to 4 mmol Mn. All NiMn LDHs were synthesized with the co-
precipitation method at non constant pH prior to the post synthesis hydrothermal treatment
unless otherwise stated.
Ni0.67Mn0.33-CO3 LDHs that have undergone hydrothermal treatment at 150°C and 220°C,
respectively, show additional impurity phases of Mn(OH)2 and Ni(OH)2. P-XRD patterns of
these are presented in figures 31 and 32. Ni(OH)2 Bragg reflections are marked with ▼ and
Mn(OH)2 Bragg reflections are marked with ■.
Figure 31: P-XRD pattern of Ni0.67Mn0.33-CO3 LDH synthesized with the co-precipitation method at
non constant pH. No post synthesis treatment (black, lower) and hydrothermal treatment at 220°C 72h
(red, upper). Miller indices for some Bragg reflections are shown. NIST Si Bragg reflections are
marked with *. Ni(OH)2 Bragg reflections are marked with ▼ and Mn(OH)2 Bragg reflections are
marked with ■. Cu Kα1 radiation (λ = 1.540598Å).
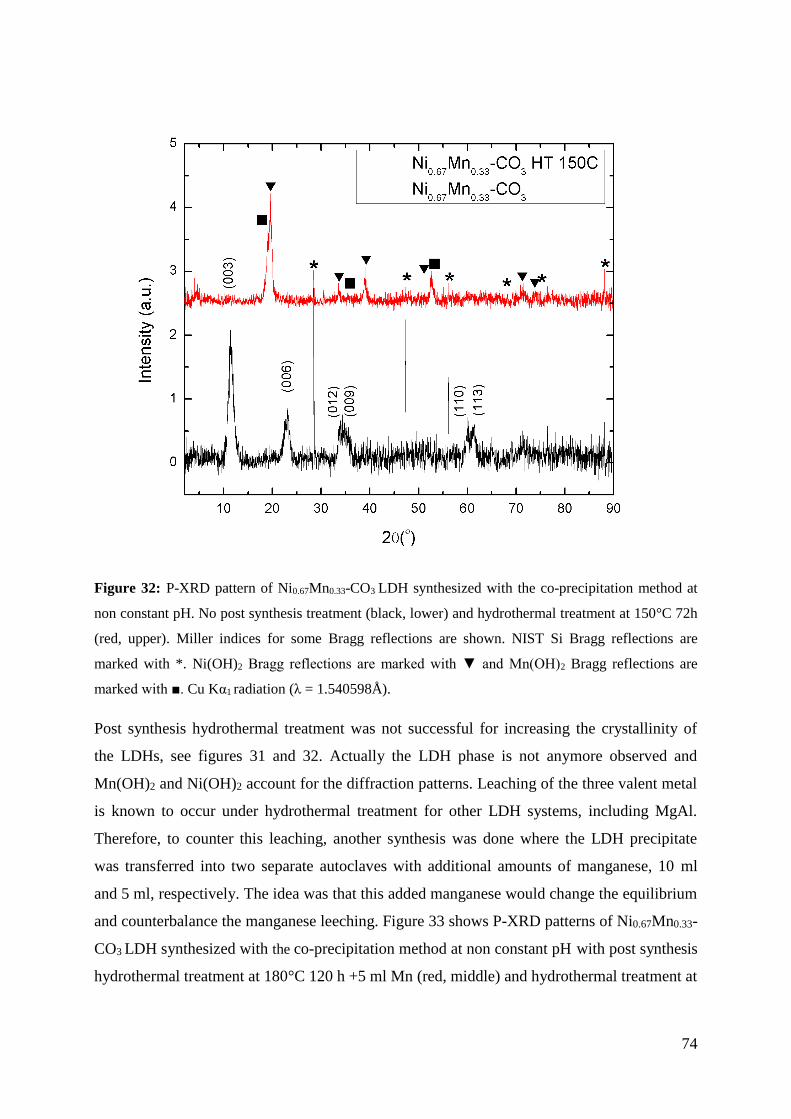
74
Figure 32: P-XRD pattern of Ni0.67Mn0.33-CO3 LDH synthesized with the co-precipitation method at
non constant pH. No post synthesis treatment (black, lower) and hydrothermal treatment at 150°C 72h
(red, upper). Miller indices for some Bragg reflections are shown. NIST Si Bragg reflections are
marked with *. Ni(OH)2 Bragg reflections are marked with ▼ and Mn(OH)2 Bragg reflections are
marked with ■. Cu Kα1 radiation (λ = 1.540598Å).
Post synthesis hydrothermal treatment was not successful for increasing the crystallinity of
the LDHs, see figures 31 and 32. Actually the LDH phase is not anymore observed and
Mn(OH)2 and Ni(OH)2 account for the diffraction patterns. Leaching of the three valent metal
is known to occur under hydrothermal treatment for other LDH systems, including MgAl.
Therefore, to counter this leaching, another synthesis was done where the LDH precipitate
was transferred into two separate autoclaves with additional amounts of manganese, 10 ml
and 5 ml, respectively. The idea was that this added manganese would change the equilibrium
and counterbalance the manganese leeching. Figure 33 shows P-XRD patterns of Ni0.67Mn0.33-
CO3 LDH synthesized with the co-precipitation method at non constant pH with post synthesis
hydrothermal treatment at 180°C 120 h +5 ml Mn (red, middle) and hydrothermal treatment at
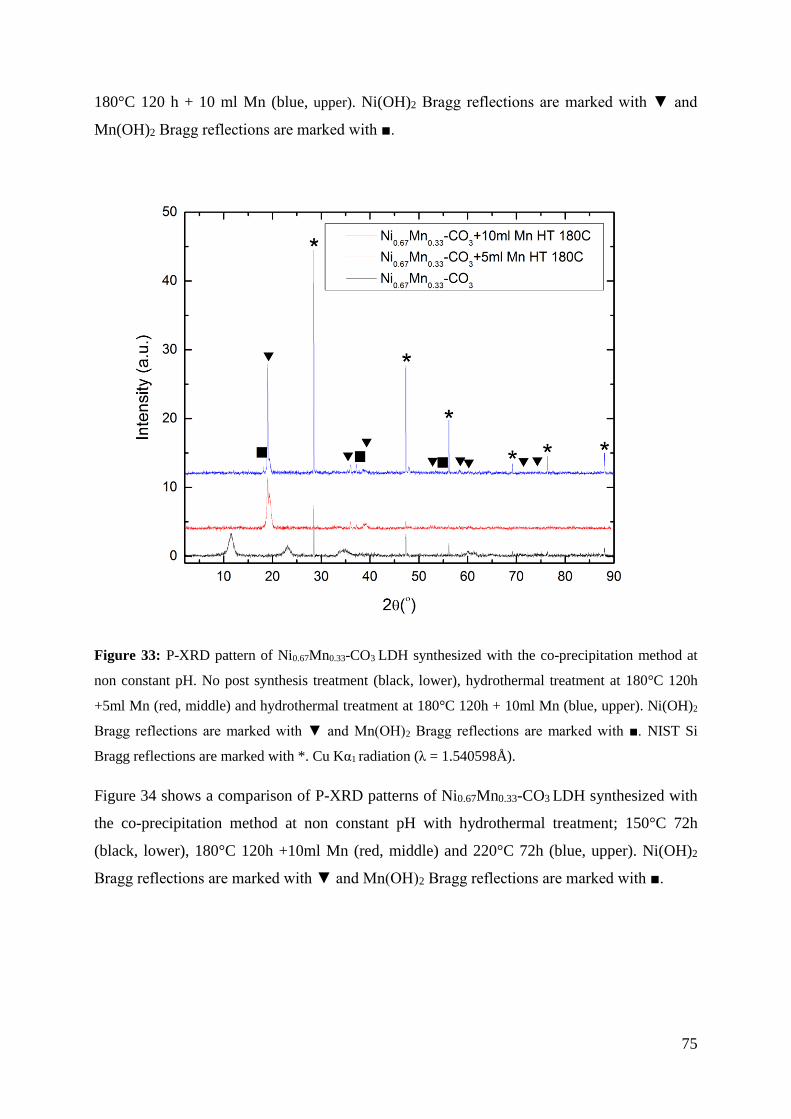
75
180°C 120 h + 10 ml Mn (blue, upper). Ni(OH)2 Bragg reflections are marked with ▼ and
Mn(OH)2 Bragg reflections are marked with ■.
Figure 33: P-XRD pattern of Ni0.67Mn0.33-CO3 LDH synthesized with the co-precipitation method at
non constant pH. No post synthesis treatment (black, lower), hydrothermal treatment at 180°C 120h
+5ml Mn (red, middle) and hydrothermal treatment at 180°C 120h + 10ml Mn (blue, upper). Ni(OH)2
Bragg reflections are marked with ▼ and Mn(OH)2 Bragg reflections are marked with ■. NIST Si
Bragg reflections are marked with *. Cu Kα1 radiation (λ = 1.540598Å).
Figure 34 shows a comparison of P-XRD patterns of Ni0.67Mn0.33-CO3 LDH synthesized with
the co-precipitation method at non constant pH with hydrothermal treatment; 150°C 72h
(black, lower), 180°C 120h +10ml Mn (red, middle) and 220°C 72h (blue, upper). Ni(OH)2
Bragg reflections are marked with ▼ and Mn(OH)2 Bragg reflections are marked with ■.
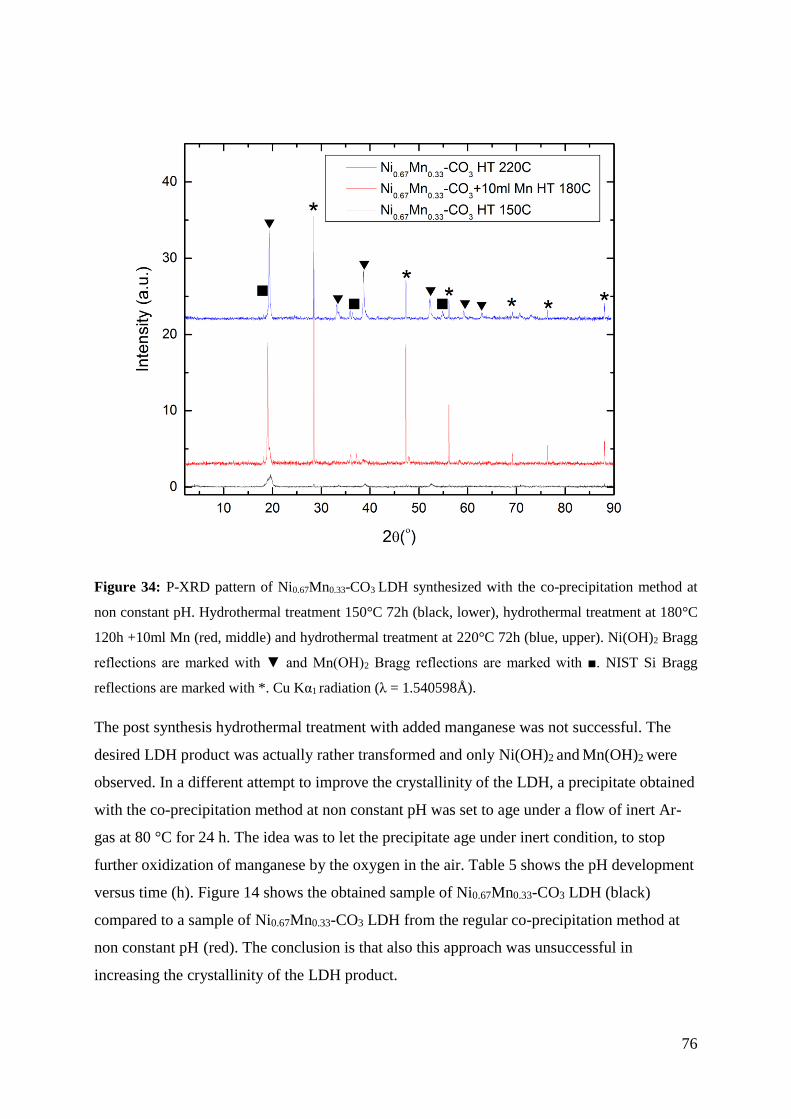
76
Figure 34: P-XRD pattern of Ni0.67Mn0.33-CO3 LDH synthesized with the co-precipitation method at
non constant pH. Hydrothermal treatment 150°C 72h (black, lower), hydrothermal treatment at 180°C
120h +10ml Mn (red, middle) and hydrothermal treatment at 220°C 72h (blue, upper). Ni(OH)2 Bragg
reflections are marked with ▼ and Mn(OH)2 Bragg reflections are marked with ■. NIST Si Bragg
reflections are marked with *. Cu Kα1 radiation (λ = 1.540598Å).
The post synthesis hydrothermal treatment with added manganese was not successful. The
desired LDH product was actually rather transformed and only Ni(OH)2 and Mn(OH)2 were
observed. In a different attempt to improve the crystallinity of the LDH, a precipitate obtained
with the co-precipitation method at non constant pH was set to age under a flow of inert Ar-
gas at 80 °C for 24 h. The idea was to let the precipitate age under inert condition, to stop
further oxidization of manganese by the oxygen in the air. Table 5 shows the pH development
versus time (h). Figure 14 shows the obtained sample of Ni0.67Mn0.33-CO3 LDH (black)
compared to a sample of Ni0.67Mn0.33-CO3 LDH from the regular co-precipitation method at
non constant pH (red). The conclusion is that also this approach was unsuccessful in
increasing the crystallinity of the LDH product.
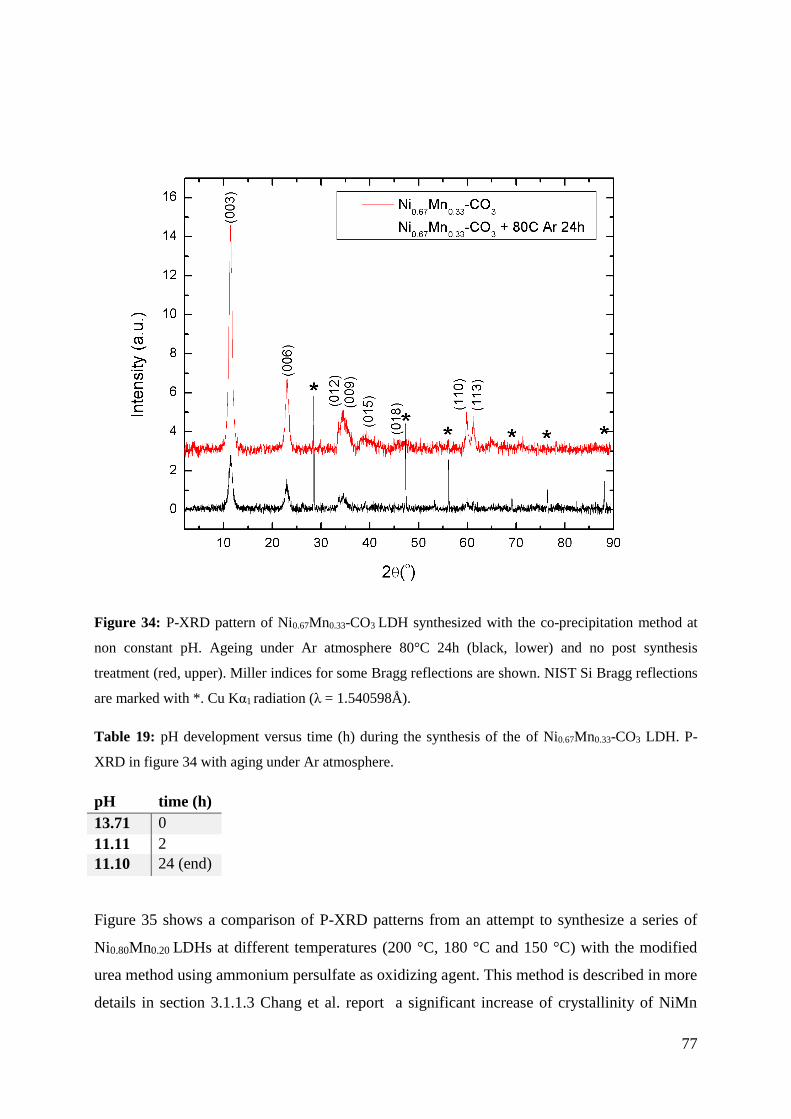
77
Figure 34: P-XRD pattern of Ni0.67Mn0.33-CO3 LDH synthesized with the co-precipitation method at
non constant pH. Ageing under Ar atmosphere 80°C 24h (black, lower) and no post synthesis
treatment (red, upper). Miller indices for some Bragg reflections are shown. NIST Si Bragg reflections
are marked with *. Cu Kα1 radiation (λ = 1.540598Å).
Table 19: pH development versus time (h) during the synthesis of the of Ni0.67Mn0.33-CO3 LDH. P-
XRD in figure 34 with aging under Ar atmosphere.
pH time (h)
13.71 0
11.11 2
11.10 24 (end)
Figure 35 shows a comparison of P-XRD patterns from an attempt to synthesize a series of
Ni0.80Mn0.20 LDHs at different temperatures (200 °C, 180 °C and 150 °C) with the modified
urea method using ammonium persulfate as oxidizing agent. This method is described in more
details in section 3.1.1.3 Chang et al. report a significant increase of crystallinity of NiMn
78
LDHs using this method [19]. However, the current work failed to reproduce the reported
results on improvements.
The sample synthesized with hydrothermal treatment at 150 °C shows signs of Bragg
reflections which are typical for LDHS, but these are not well defined compared to pure LDH
phases as earlier shown. The sample synthesized with hydrothermal treatment at 180 °C
shows even less LDH-resembling Bragg reflections with displacement on basal (00l) Bragg
reflections toward higher 2θ compared to the aforementioned sample. This sample
synthesized at 180 °C also show phases of Mn2O3, MnO2, NiO2 and Ni(OH)2. The sample
synthesized at 200 °C show significantly more dominant Bragg reflections corresponding to
the Mn2O3 phase. It also shows higher intensities for the Mn(OH)2 Bragg reflections. This
indicates a higher content of Mn2O3 and Mn(OH)2 in the sample synthesized at 200 °C. Some
Bragg reflections for all three samples are unaccounted for.
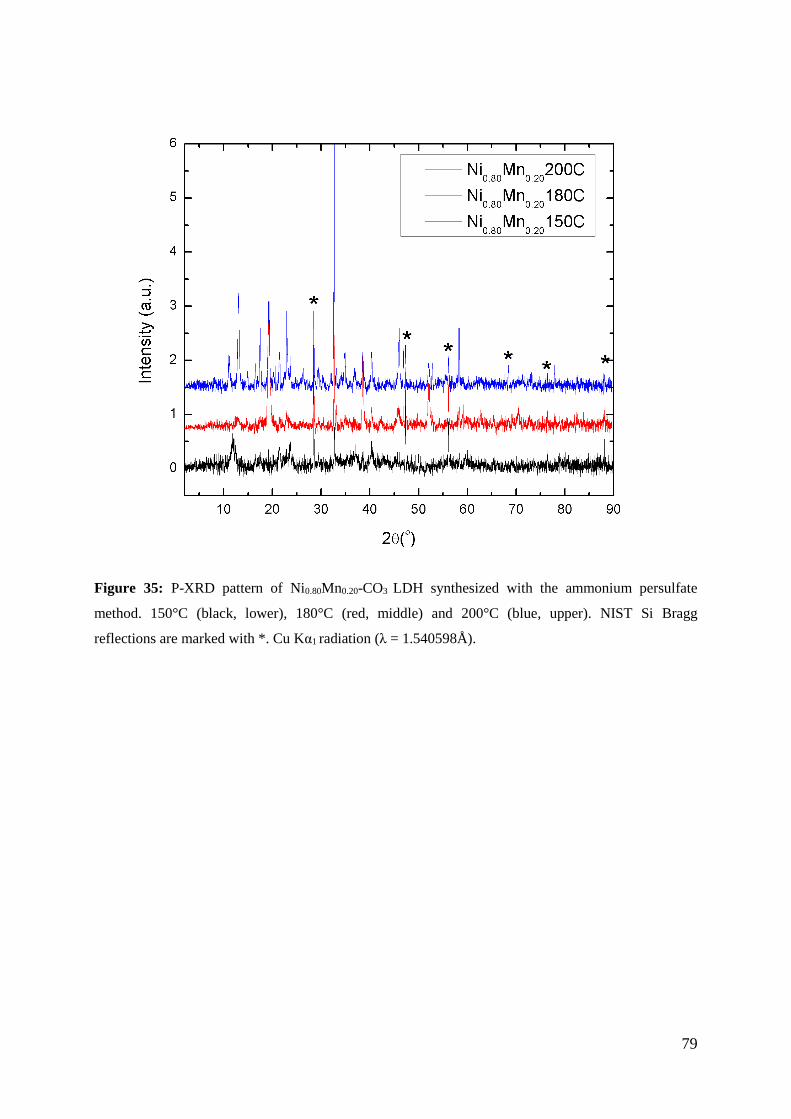
79
Figure 35: P-XRD pattern of Ni0.80Mn0.20-CO3 LDH synthesized with the ammonium persulfate
method. 150°C (black, lower), 180°C (red, middle) and 200°C (blue, upper). NIST Si Bragg
reflections are marked with *. Cu Kα1 radiation (λ = 1.540598Å).
80
4.2 Synthesis and characterization of MgAl-LDHs
4.2.1 XRD data of MgAl-LDH samples
Chapter 4.2.1 presents XRD data of Mg1-xAlx(OH)2(CO3)x/2∙mH2O LDHs which have been
synthesized according to the procedures described in chapter 3.1.2 and thereafter attempted
optimized based on literature.
Figure 36 shows the P-XRD pattern of a Mg0.67Al0.33-CO3 LDH synthesized with the urea
method. Miller indices for some Bragg reflections are included. The lamellar (003), (006) and
(009) Bragg reflections are present, as well as the (110) and (113) Bragg reflections. All the
Bragg reflections are relatively sharp indicating high crystallinity. The diffraction pattern is in
accordance to literature.
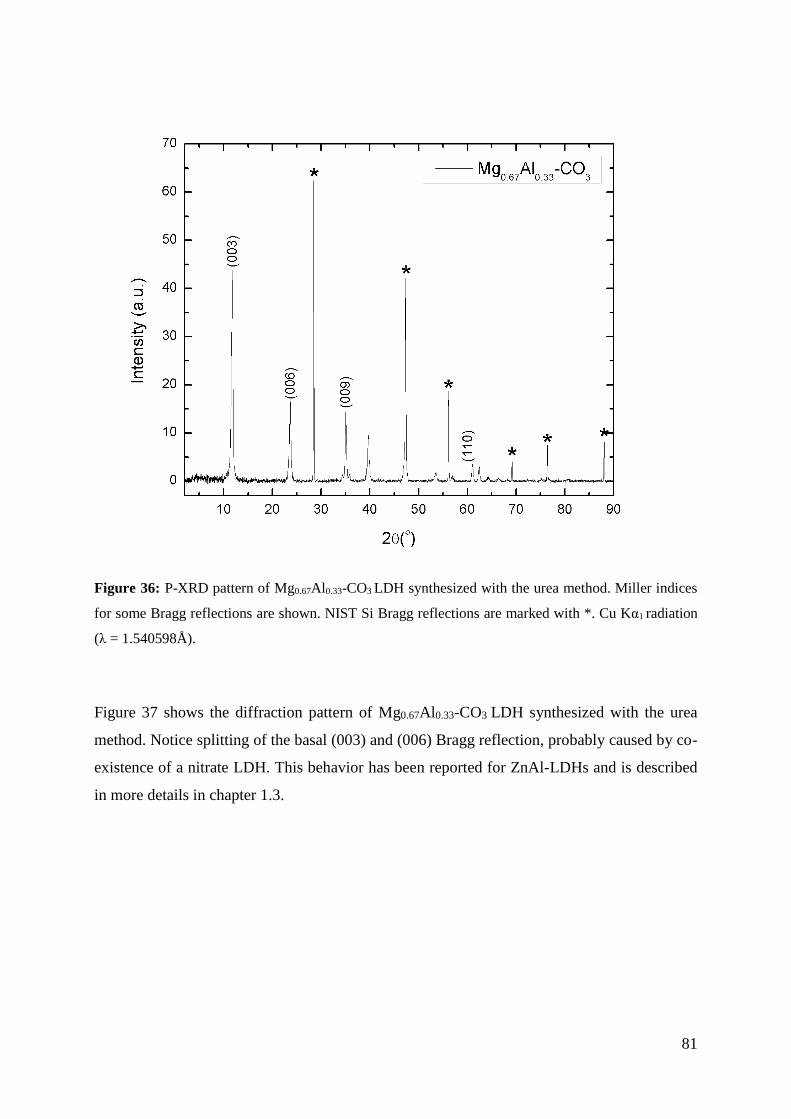
81
Figure 36: P-XRD pattern of Mg0.67Al0.33-CO3 LDH synthesized with the urea method. Miller indices
for some Bragg reflections are shown. NIST Si Bragg reflections are marked with *. Cu Kα1 radiation
(λ = 1.540598Å).
Figure 37 shows the diffraction pattern of Mg0.67Al0.33-CO3 LDH synthesized with the urea
method. Notice splitting of the basal (003) and (006) Bragg reflection, probably caused by co-
existence of a nitrate LDH. This behavior has been reported for ZnAl-LDHs and is described
in more details in chapter 1.3.
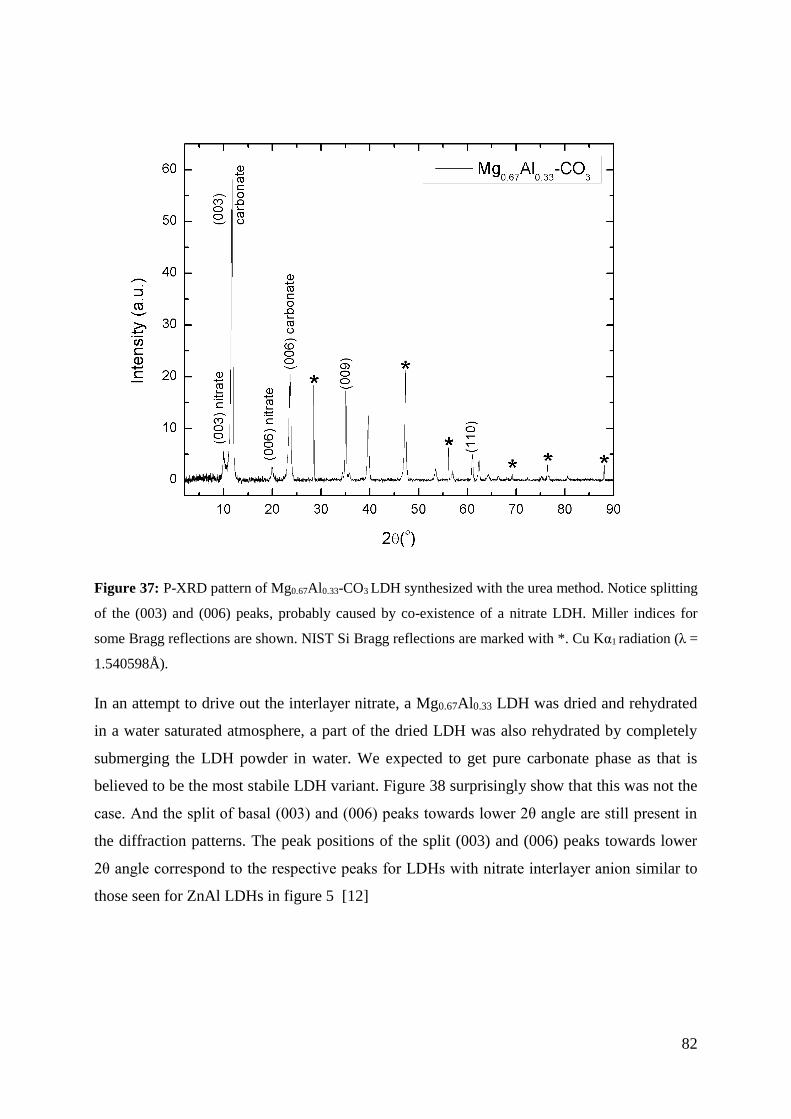
82
Figure 37: P-XRD pattern of Mg0.67Al0.33-CO3 LDH synthesized with the urea method. Notice splitting
of the (003) and (006) peaks, probably caused by co-existence of a nitrate LDH. Miller indices for
some Bragg reflections are shown. NIST Si Bragg reflections are marked with *. Cu Kα1 radiation (λ =
1.540598Å).
In an attempt to drive out the interlayer nitrate, a Mg0.67Al0.33 LDH was dried and rehydrated
in a water saturated atmosphere, a part of the dried LDH was also rehydrated by completely
submerging the LDH powder in water. We expected to get pure carbonate phase as that is
believed to be the most stabile LDH variant. Figure 38 surprisingly show that this was not the
case. And the split of basal (003) and (006) peaks towards lower 2θ angle are still present in
the diffraction patterns. The peak positions of the split (003) and (006) peaks towards lower
2θ angle correspond to the respective peaks for LDHs with nitrate interlayer anion similar to
those seen for ZnAl LDHs in figure 5 [12]

83
Figure 38: P-XRD patterns of Mg0.67Al0.33-CO3 LDH synthesized with the urea method. Notice
splitting of the (003) and (006) peaks. As synthesized (black), dried (red), rehydrated (blue) and
rehydrated more(green). Miller indices for some Bragg reflections are shown. NIST Si Bragg
reflections are marked with *. Cu Kα1 radiation (λ = 1.540598Å).
Another synthesis was done with twice amount of chemicals and double volume of water to
see if this would have an effect on the LDH product. Diffraction pattern of this synthesis is
shown in figure 39. The peak at very low 2θ value is most likely background as the
diffractometer has some issues with that as that time. The intensity of the lower 2θ part of the
split of the basal (003) and (006) Bragg reflections seems to be significantly lower compared
to the previous sample. It is likely that there is less amount of nitrate LDH phase in this
sample.
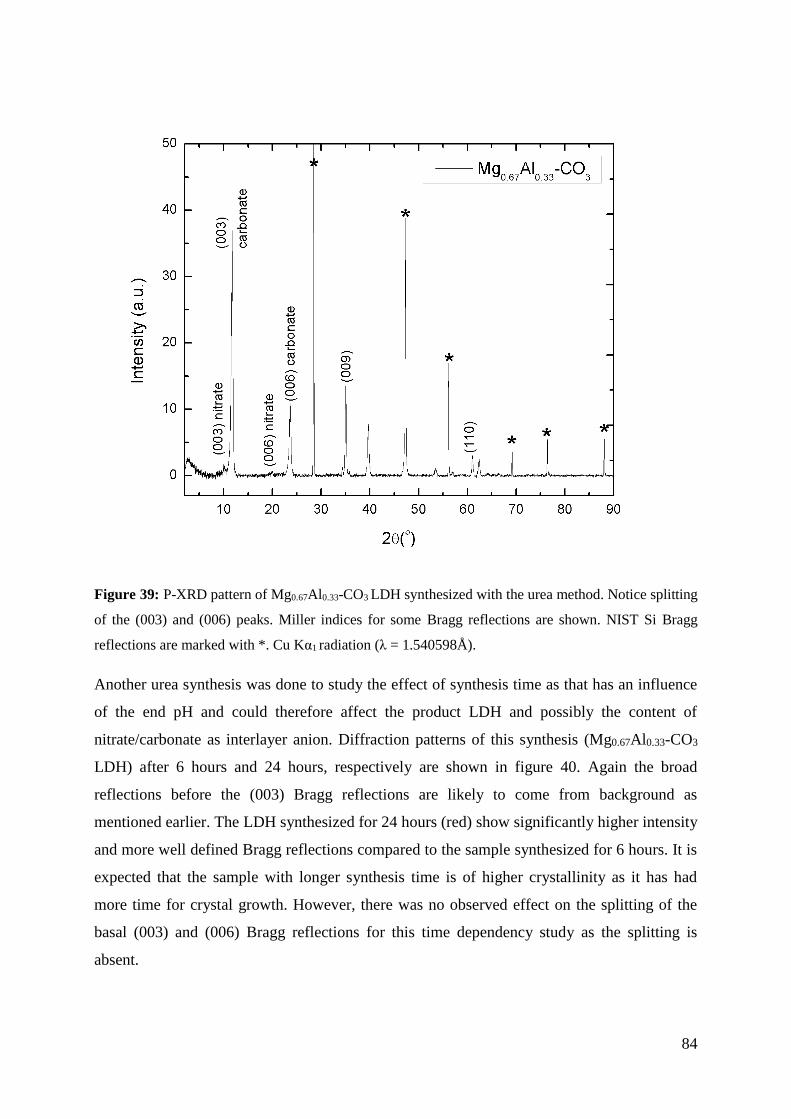
84
Figure 39: P-XRD pattern of Mg0.67Al0.33-CO3 LDH synthesized with the urea method. Notice splitting
of the (003) and (006) peaks. Miller indices for some Bragg reflections are shown. NIST Si Bragg
reflections are marked with *. Cu Kα1 radiation (λ = 1.540598Å).
Another urea synthesis was done to study the effect of synthesis time as that has an influence
of the end pH and could therefore affect the product LDH and possibly the content of
nitrate/carbonate as interlayer anion. Diffraction patterns of this synthesis (Mg0.67Al0.33-CO3
LDH) after 6 hours and 24 hours, respectively are shown in figure 40. Again the broad
reflections before the (003) Bragg reflections are likely to come from background as
mentioned earlier. The LDH synthesized for 24 hours (red) show significantly higher intensity
and more well defined Bragg reflections compared to the sample synthesized for 6 hours. It is
expected that the sample with longer synthesis time is of higher crystallinity as it has had
more time for crystal growth. However, there was no observed effect on the splitting of the
basal (003) and (006) Bragg reflections for this time dependency study as the splitting is
absent.
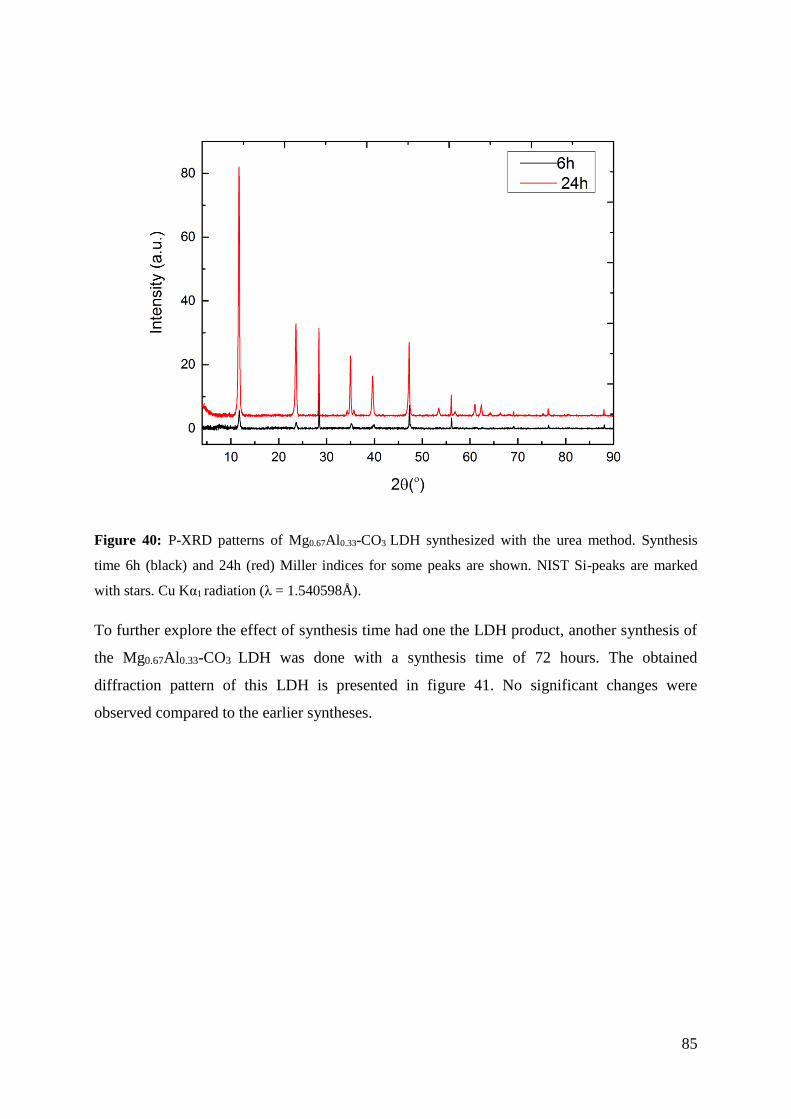
85
Figure 40: P-XRD patterns of Mg0.67Al0.33-CO3 LDH synthesized with the urea method. Synthesis
time 6h (black) and 24h (red) Miller indices for some peaks are shown. NIST Si-peaks are marked
with stars. Cu Kα1 radiation (λ = 1.540598Å).
To further explore the effect of synthesis time had one the LDH product, another synthesis of
the Mg0.67Al0.33-CO3 LDH was done with a synthesis time of 72 hours. The obtained
diffraction pattern of this LDH is presented in figure 41. No significant changes were
observed compared to the earlier syntheses.
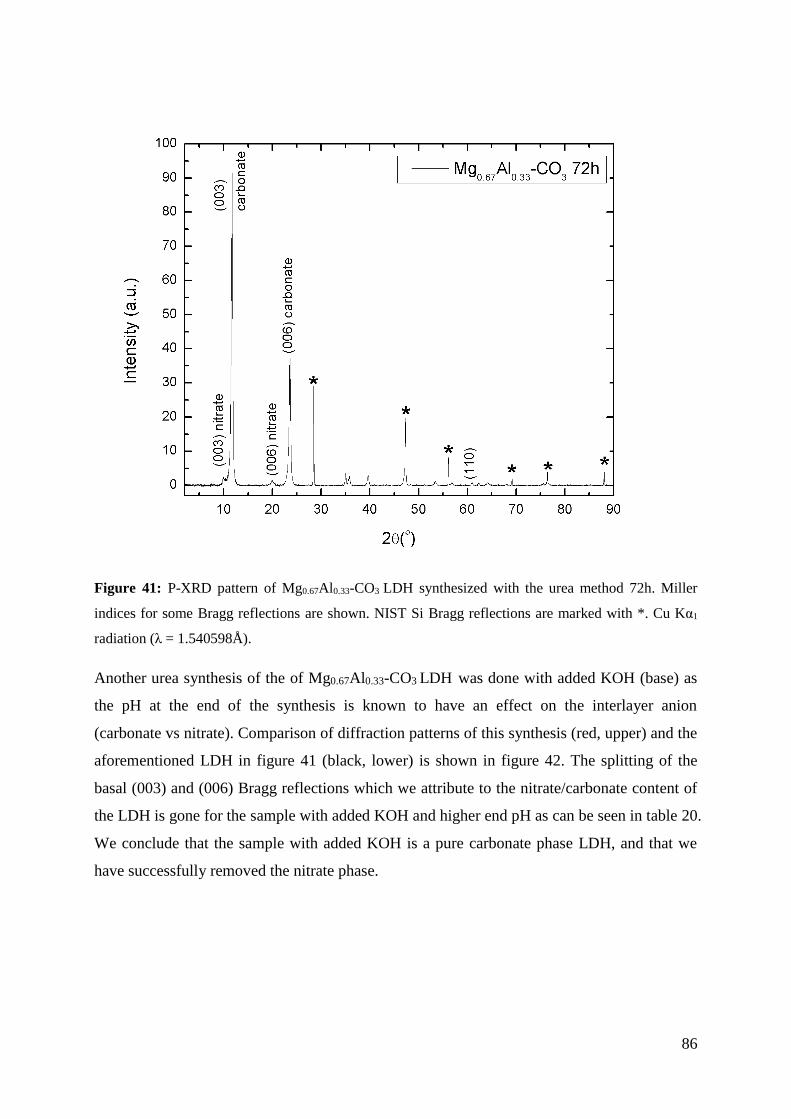
86
Figure 41: P-XRD pattern of Mg0.67Al0.33-CO3 LDH synthesized with the urea method 72h. Miller
indices for some Bragg reflections are shown. NIST Si Bragg reflections are marked with *. Cu Kα1
radiation (λ = 1.540598Å).
Another urea synthesis of the of Mg0.67Al0.33-CO3 LDH was done with added KOH (base) as
the pH at the end of the synthesis is known to have an effect on the interlayer anion
(carbonate vs nitrate). Comparison of diffraction patterns of this synthesis (red, upper) and the
aforementioned LDH in figure 41 (black, lower) is shown in figure 42. The splitting of the
basal (003) and (006) Bragg reflections which we attribute to the nitrate/carbonate content of
the LDH is gone for the sample with added KOH and higher end pH as can be seen in table 20.
We conclude that the sample with added KOH is a pure carbonate phase LDH, and that we
have successfully removed the nitrate phase.
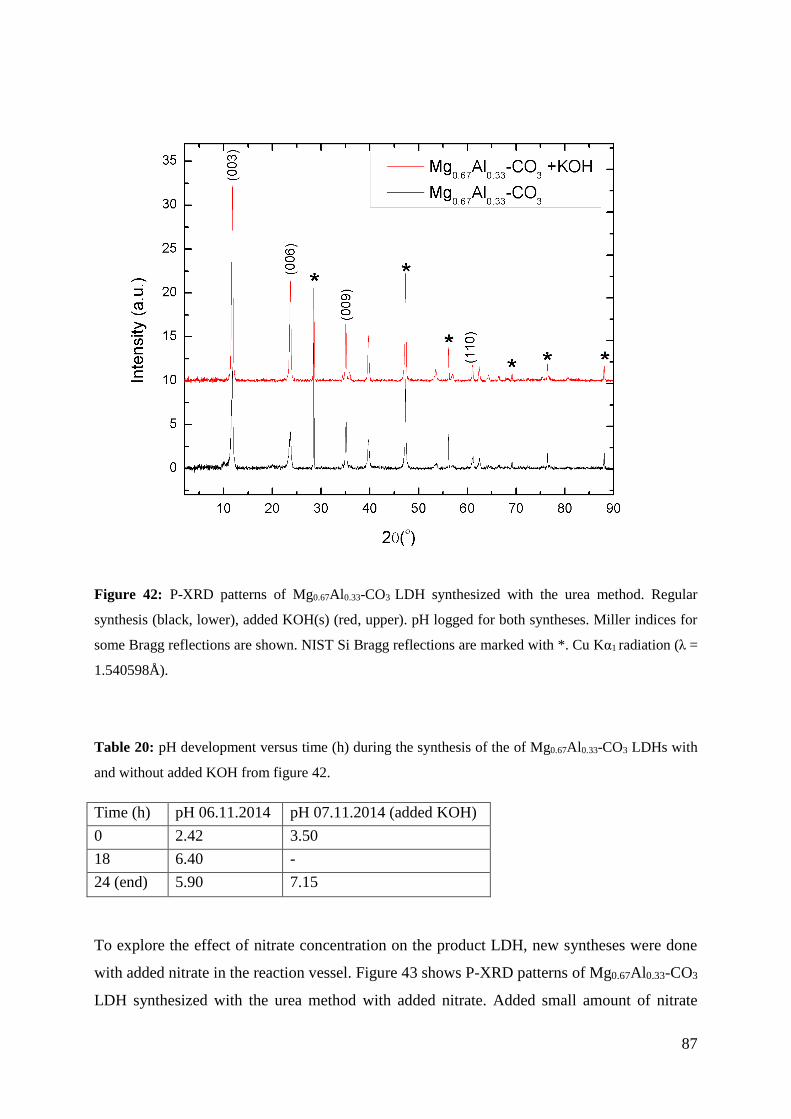
87
Figure 42: P-XRD patterns of Mg0.67Al0.33-CO3 LDH synthesized with the urea method. Regular
synthesis (black, lower), added KOH(s) (red, upper). pH logged for both syntheses. Miller indices for
some Bragg reflections are shown. NIST Si Bragg reflections are marked with *. Cu Kα1 radiation (λ =
1.540598Å).
Table 20: pH development versus time (h) during the synthesis of the of Mg0.67Al0.33-CO3 LDHs with
and without added KOH from figure 42.
Time (h) pH 06.11.2014 pH 07.11.2014 (added KOH)
0 2.42 3.50
18 6.40 -
24 (end) 5.90 7.15
To explore the effect of nitrate concentration on the product LDH, new syntheses were done
with added nitrate in the reaction vessel. Figure 43 shows P-XRD patterns of Mg0.67Al0.33-CO3
LDH synthesized with the urea method with added nitrate. Added small amount of nitrate
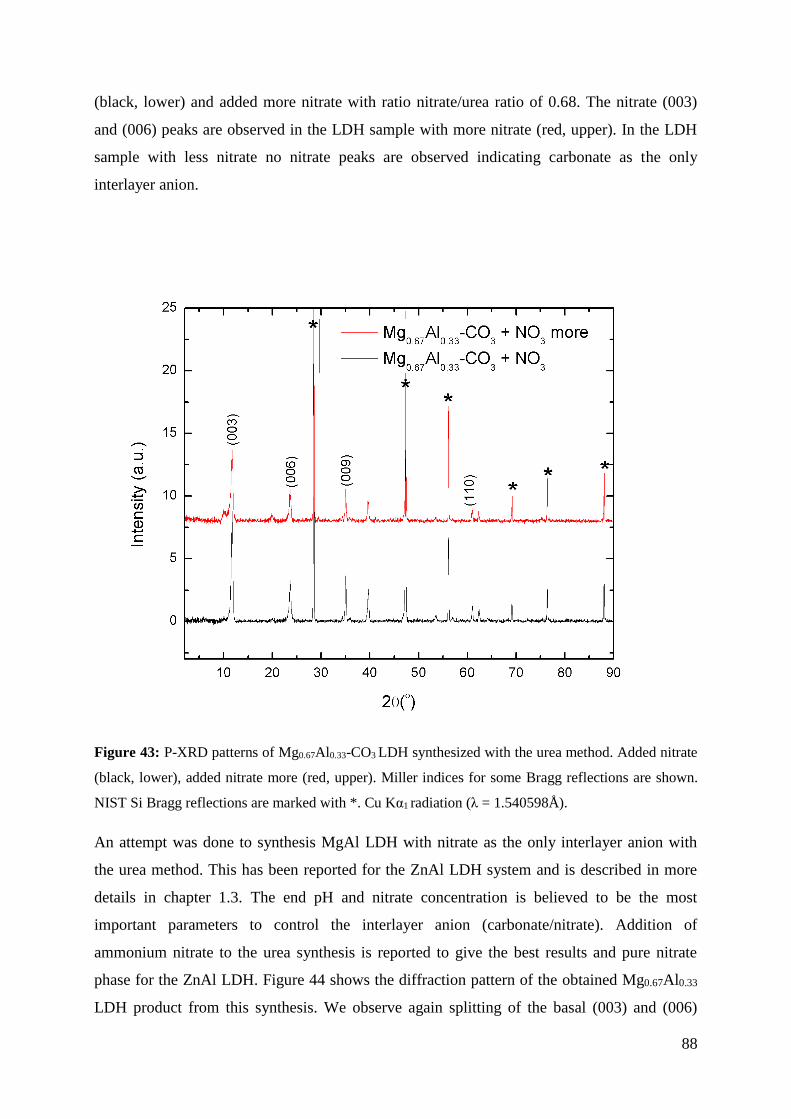
88
(black, lower) and added more nitrate with ratio nitrate/urea ratio of 0.68. The nitrate (003)
and (006) peaks are observed in the LDH sample with more nitrate (red, upper). In the LDH
sample with less nitrate no nitrate peaks are observed indicating carbonate as the only
interlayer anion.
Figure 43: P-XRD patterns of Mg0.67Al0.33-CO3 LDH synthesized with the urea method. Added nitrate
(black, lower), added nitrate more (red, upper). Miller indices for some Bragg reflections are shown.
NIST Si Bragg reflections are marked with *. Cu Kα1 radiation (λ = 1.540598Å).
An attempt was done to synthesis MgAl LDH with nitrate as the only interlayer anion with
the urea method. This has been reported for the ZnAl LDH system and is described in more
details in chapter 1.3. The end pH and nitrate concentration is believed to be the most
important parameters to control the interlayer anion (carbonate/nitrate). Addition of
ammonium nitrate to the urea synthesis is reported to give the best results and pure nitrate
phase for the ZnAl LDH. Figure 44 shows the diffraction pattern of the obtained Mg0.67Al0.33
LDH product from this synthesis. We observe again splitting of the basal (003) and (006)
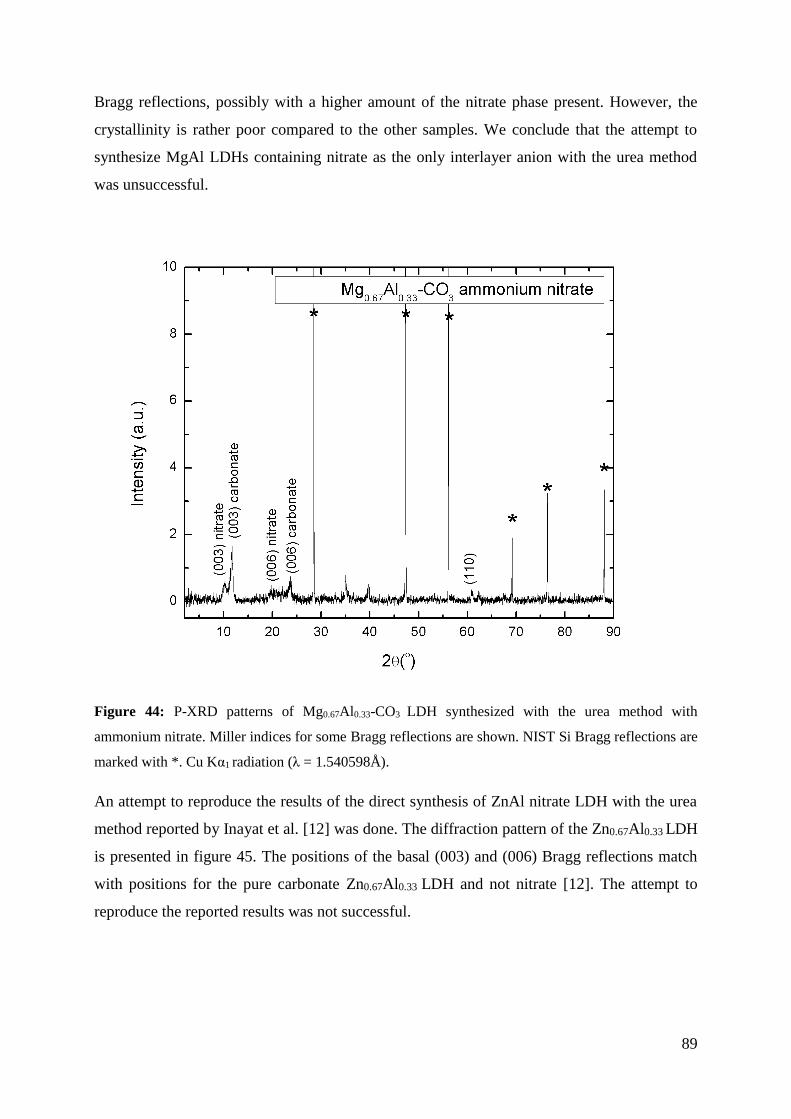
89
Bragg reflections, possibly with a higher amount of the nitrate phase present. However, the
crystallinity is rather poor compared to the other samples. We conclude that the attempt to
synthesize MgAl LDHs containing nitrate as the only interlayer anion with the urea method
was unsuccessful.
Figure 44: P-XRD patterns of Mg0.67Al0.33-CO3 LDH synthesized with the urea method with
ammonium nitrate. Miller indices for some Bragg reflections are shown. NIST Si Bragg reflections are
marked with *. Cu Kα1 radiation (λ = 1.540598Å).
An attempt to reproduce the results of the direct synthesis of ZnAl nitrate LDH with the urea
method reported by Inayat et al. [12] was done. The diffraction pattern of the Zn0.67Al0.33 LDH
is presented in figure 45. The positions of the basal (003) and (006) Bragg reflections match
with positions for the pure carbonate Zn0.67Al0.33 LDH and not nitrate [12]. The attempt to
reproduce the reported results was not successful.
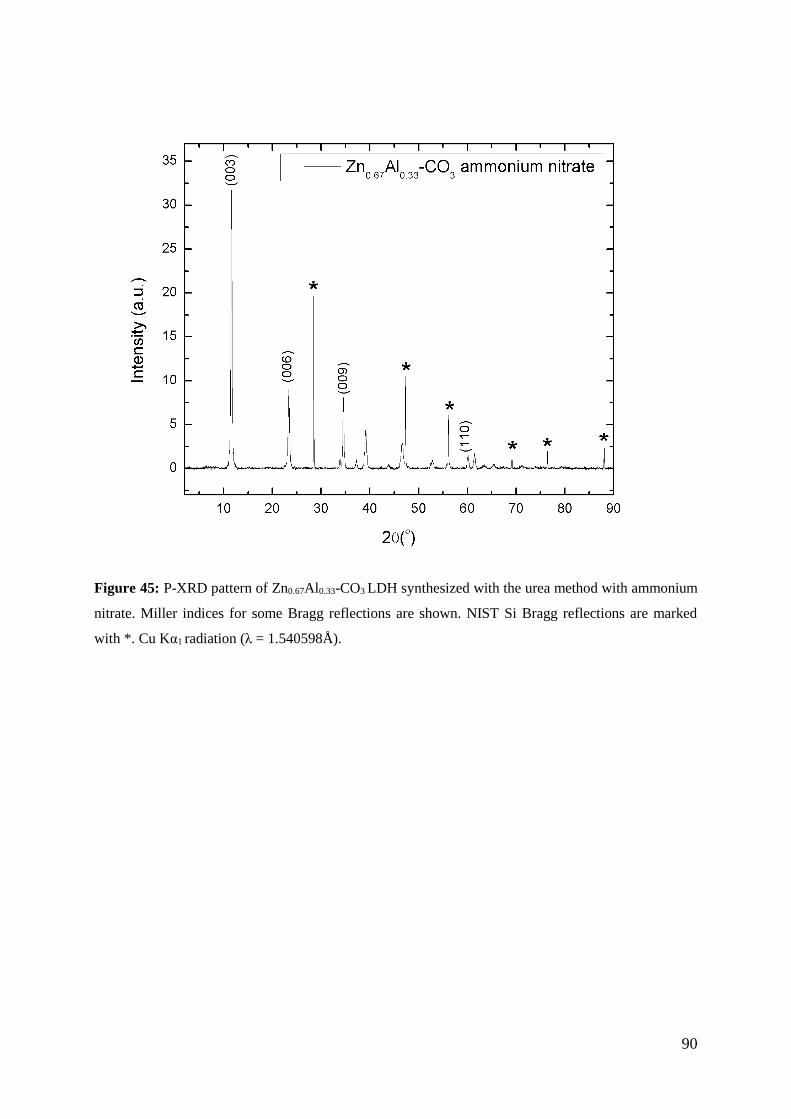
90
Figure 45: P-XRD pattern of Zn0.67Al0.33-CO3 LDH synthesized with the urea method with ammonium
nitrate. Miller indices for some Bragg reflections are shown. NIST Si Bragg reflections are marked
with *. Cu Kα1 radiation (λ = 1.540598Å).
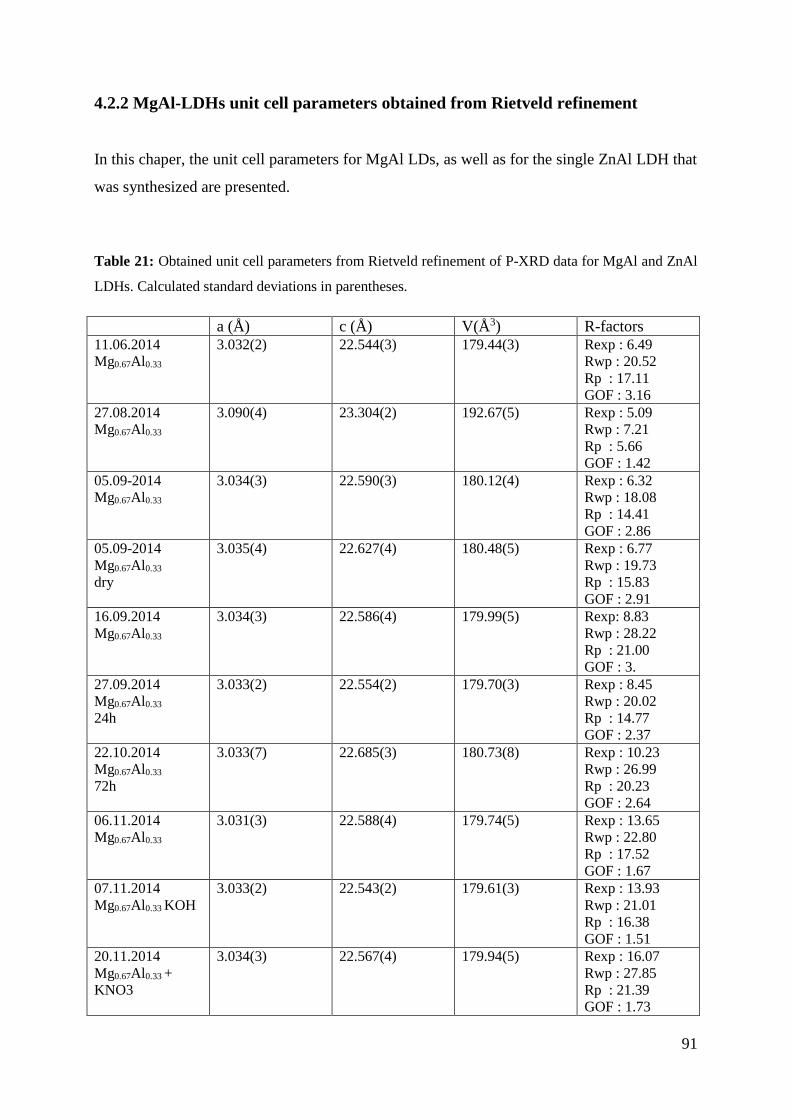
91
4.2.2 MgAl-LDHs unit cell parameters obtained from Rietveld refinement
In this chaper, the unit cell parameters for MgAl LDs, as well as for the single ZnAl LDH that
was synthesized are presented.
Table 21: Obtained unit cell parameters from Rietveld refinement of P-XRD data for MgAl and ZnAl
LDHs. Calculated standard deviations in parentheses.
a (Å) c (Å) V(Å3) R-factors 11.06.2014
Mg0.67Al0.33
3.032(2)
22.544(3)
179.44(3)
Rexp : 6.49
Rwp : 20.52
Rp : 17.11
GOF : 3.16
27.08.2014
Mg0.67Al0.33
3.090(4)
23.304(2) 192.67(5) Rexp : 5.09
Rwp : 7.21
Rp : 5.66
GOF : 1.42
05.09-2014
Mg0.67Al0.33
3.034(3)
22.590(3) 180.12(4) Rexp : 6.32
Rwp : 18.08
Rp : 14.41
GOF : 2.86
05.09-2014
Mg0.67Al0.33
dry
3.035(4) 22.627(4)
180.48(5) Rexp : 6.77
Rwp : 19.73
Rp : 15.83
GOF : 2.91
16.09.2014
Mg0.67Al0.33
3.034(3) 22.586(4)
179.99(5) Rexp: 8.83
Rwp : 28.22
Rp : 21.00
GOF : 3.
27.09.2014
Mg0.67Al0.33
24h
3.033(2)
22.554(2)
179.70(3)
Rexp : 8.45
Rwp : 20.02
Rp : 14.77
GOF : 2.37
22.10.2014
Mg0.67Al0.33
72h
3.033(7) 22.685(3) 180.73(8)
Rexp : 10.23
Rwp : 26.99
Rp : 20.23
GOF : 2.64
06.11.2014
Mg0.67Al0.33
3.031(3)
22.588(4)
179.74(5) Rexp : 13.65
Rwp : 22.80
Rp : 17.52
GOF : 1.67
07.11.2014
Mg0.67Al0.33 KOH
3.033(2)
22.543(2) 179.61(3) Rexp : 13.93
Rwp : 21.01
Rp : 16.38
GOF : 1.51
20.11.2014
Mg0.67Al0.33 +
KNO3
3.034(3)
22.567(4)
179.94(5)
Rexp : 16.07
Rwp : 27.85
Rp : 21.39
GOF : 1.73
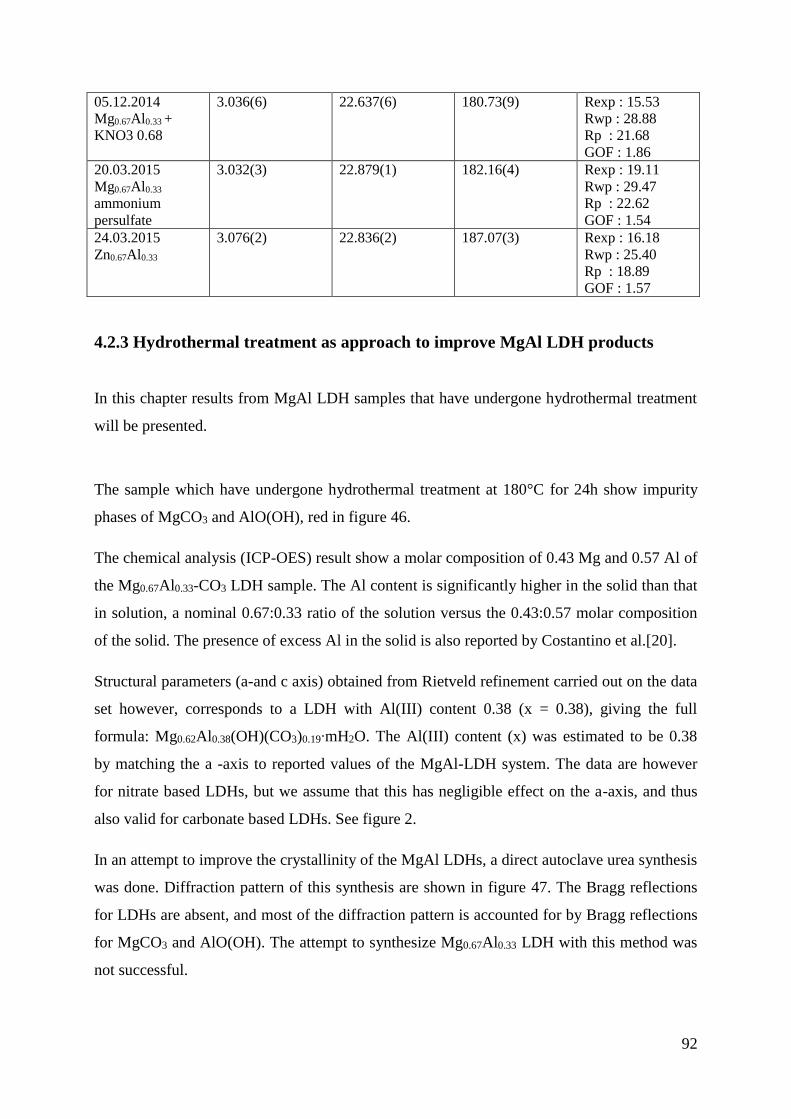
92
05.12.2014
Mg0.67Al0.33 +
KNO3 0.68
3.036(6)
22.637(6)
180.73(9)
Rexp : 15.53
Rwp : 28.88
Rp : 21.68
GOF : 1.86
20.03.2015
Mg0.67Al0.33
ammonium
persulfate
3.032(3)
22.879(1)
182.16(4)
Rexp : 19.11
Rwp : 29.47
Rp : 22.62
GOF : 1.54
24.03.2015
Zn0.67Al0.33
3.076(2)
22.836(2)
187.07(3) Rexp : 16.18
Rwp : 25.40
Rp : 18.89
GOF : 1.57
4.2.3 Hydrothermal treatment as approach to improve MgAl LDH products
In this chapter results from MgAl LDH samples that have undergone hydrothermal treatment
will be presented.
The sample which have undergone hydrothermal treatment at 180°C for 24h show impurity
phases of MgCO3 and AlO(OH), red in figure 46.
The chemical analysis (ICP-OES) result show a molar composition of 0.43 Mg and 0.57 Al of
the Mg0.67Al0.33-CO3 LDH sample. The Al content is significantly higher in the solid than that
in solution, a nominal 0.67:0.33 ratio of the solution versus the 0.43:0.57 molar composition
of the solid. The presence of excess Al in the solid is also reported by Costantino et al.[20].
Structural parameters (a-and c axis) obtained from Rietveld refinement carried out on the data
set however, corresponds to a LDH with Al(III) content 0.38 (x = 0.38), giving the full
formula: Mg0.62Al0.38(OH)(CO3)0.19∙mH2O. The Al(III) content (x) was estimated to be 0.38
by matching the a -axis to reported values of the MgAl-LDH system. The data are however
for nitrate based LDHs, but we assume that this has negligible effect on the a-axis, and thus
also valid for carbonate based LDHs. See figure 2.
In an attempt to improve the crystallinity of the MgAl LDHs, a direct autoclave urea synthesis
was done. Diffraction pattern of this synthesis are shown in figure 47. The Bragg reflections
for LDHs are absent, and most of the diffraction pattern is accounted for by Bragg reflections
for MgCO3 and AlO(OH). The attempt to synthesize Mg0.67Al0.33 LDH with this method was
not successful.
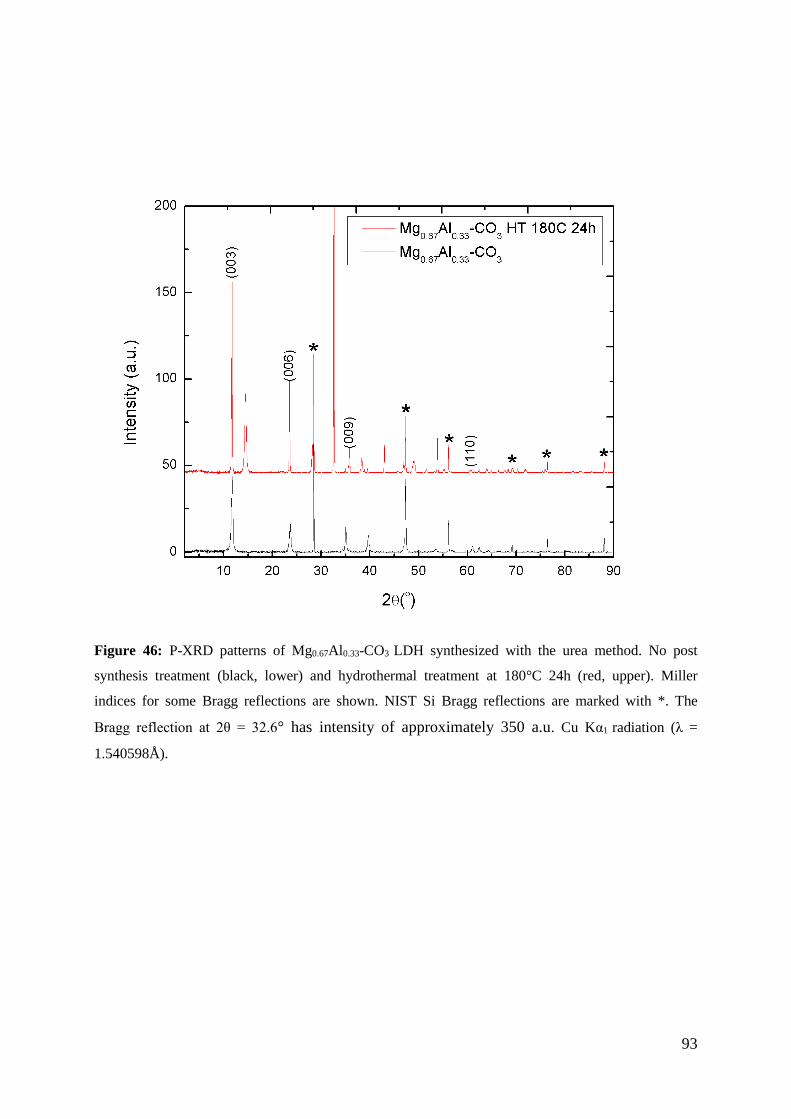
93
Figure 46: P-XRD patterns of Mg0.67Al0.33-CO3 LDH synthesized with the urea method. No post
synthesis treatment (black, lower) and hydrothermal treatment at 180°C 24h (red, upper). Miller
indices for some Bragg reflections are shown. NIST Si Bragg reflections are marked with *. The
Bragg reflection at 2θ = 32.6° has intensity of approximately 350 a.u. Cu Kα1 radiation (λ =
1.540598Å).
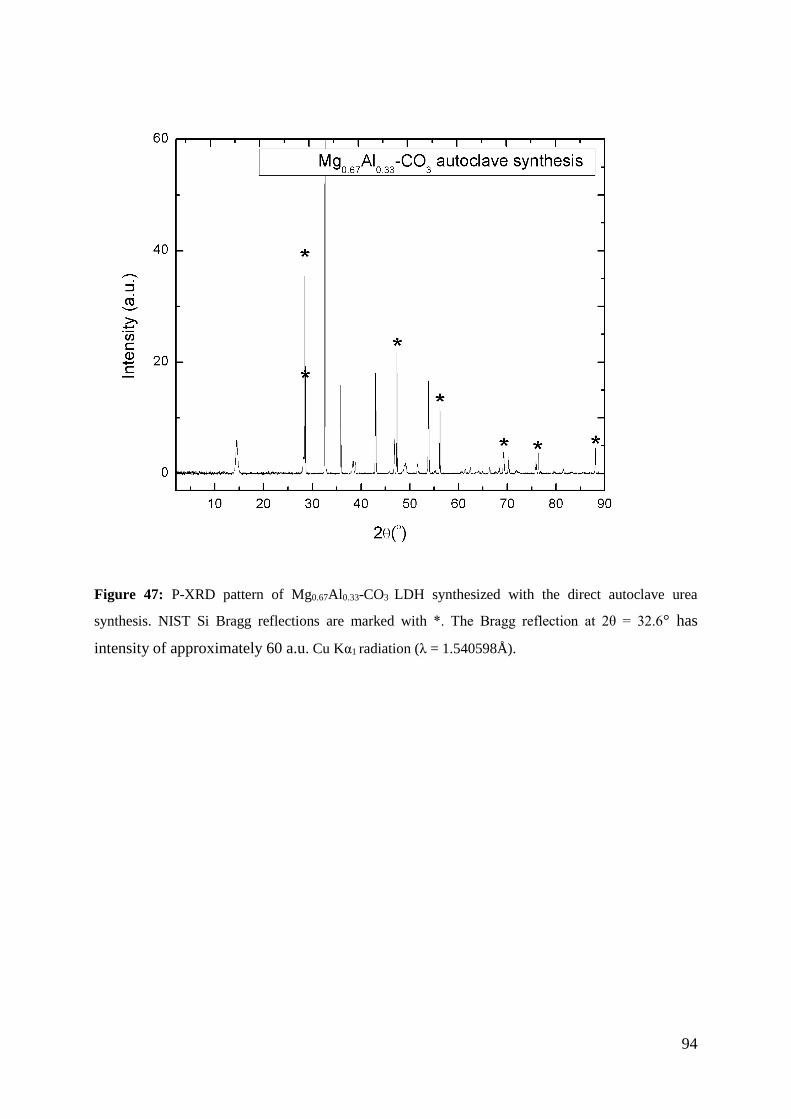
94
Figure 47: P-XRD pattern of Mg0.67Al0.33-CO3 LDH synthesized with the direct autoclave urea
synthesis. NIST Si Bragg reflections are marked with *. The Bragg reflection at 2θ = 32.6° has
intensity of approximately 60 a.u. Cu Kα1 radiation (λ = 1.540598Å).
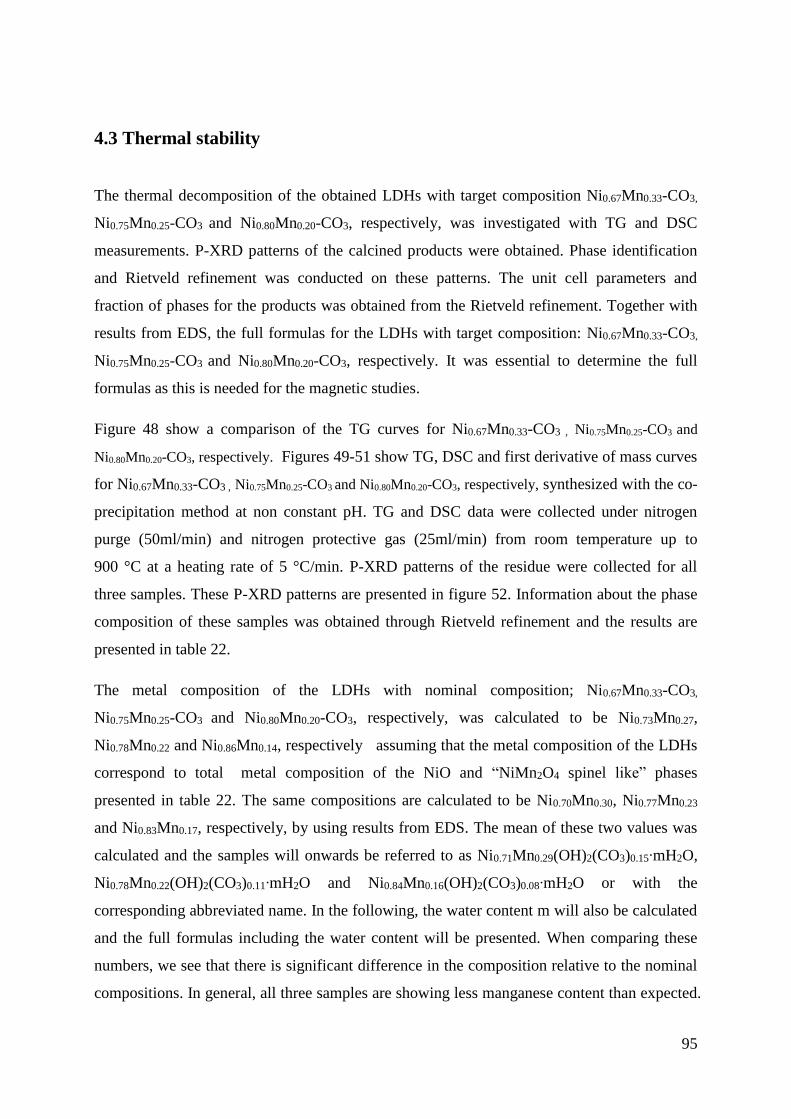
95
4.3 Thermal stability
The thermal decomposition of the obtained LDHs with target composition Ni0.67Mn0.33-CO3,
Ni0.75Mn0.25-CO3 and Ni0.80Mn0.20-CO3, respectively, was investigated with TG and DSC
measurements. P-XRD patterns of the calcined products were obtained. Phase identification
and Rietveld refinement was conducted on these patterns. The unit cell parameters and
fraction of phases for the products was obtained from the Rietveld refinement. Together with
results from EDS, the full formulas for the LDHs with target composition: Ni0.67Mn0.33-CO3,
Ni0.75Mn0.25-CO3 and Ni0.80Mn0.20-CO3, respectively. It was essential to determine the full
formulas as this is needed for the magnetic studies.
Figure 48 show a comparison of the TG curves for Ni0.67Mn0.33-CO3 , Ni0.75Mn0.25-CO3 and
Ni0.80Mn0.20-CO3, respectively. Figures 49-51 show TG, DSC and first derivative of mass curves
for Ni0.67Mn0.33-CO3 , Ni0.75Mn0.25-CO3 and Ni0.80Mn0.20-CO3, respectively, synthesized with the co-
precipitation method at non constant pH. TG and DSC data were collected under nitrogen
purge (50ml/min) and nitrogen protective gas (25ml/min) from room temperature up to
900 °C at a heating rate of 5 °C/min. P-XRD patterns of the residue were collected for all
three samples. These P-XRD patterns are presented in figure 52. Information about the phase
composition of these samples was obtained through Rietveld refinement and the results are
presented in table 22.
The metal composition of the LDHs with nominal composition; Ni0.67Mn0.33-CO3,
Ni0.75Mn0.25-CO3 and Ni0.80Mn0.20-CO3, respectively, was calculated to be Ni0.73Mn0.27,
Ni0.78Mn0.22 and Ni0.86Mn0.14, respectively assuming that the metal composition of the LDHs
correspond to total metal composition of the NiO and “NiMn2O4 spinel like” phases
presented in table 22. The same compositions are calculated to be Ni0.70Mn0.30, Ni0.77Mn0.23
and Ni0.83Mn0.17, respectively, by using results from EDS. The mean of these two values was
calculated and the samples will onwards be referred to as Ni0.71Mn0.29(OH)2(CO3)0.15∙mH2O,
Ni0.78Mn0.22(OH)2(CO3)0.11∙mH2O and Ni0.84Mn0.16(OH)2(CO3)0.08∙mH2O or with the
corresponding abbreviated name. In the following, the water content m will also be calculated
and the full formulas including the water content will be presented. When comparing these
numbers, we see that there is significant difference in the composition relative to the nominal
compositions. In general, all three samples are showing less manganese content than expected.
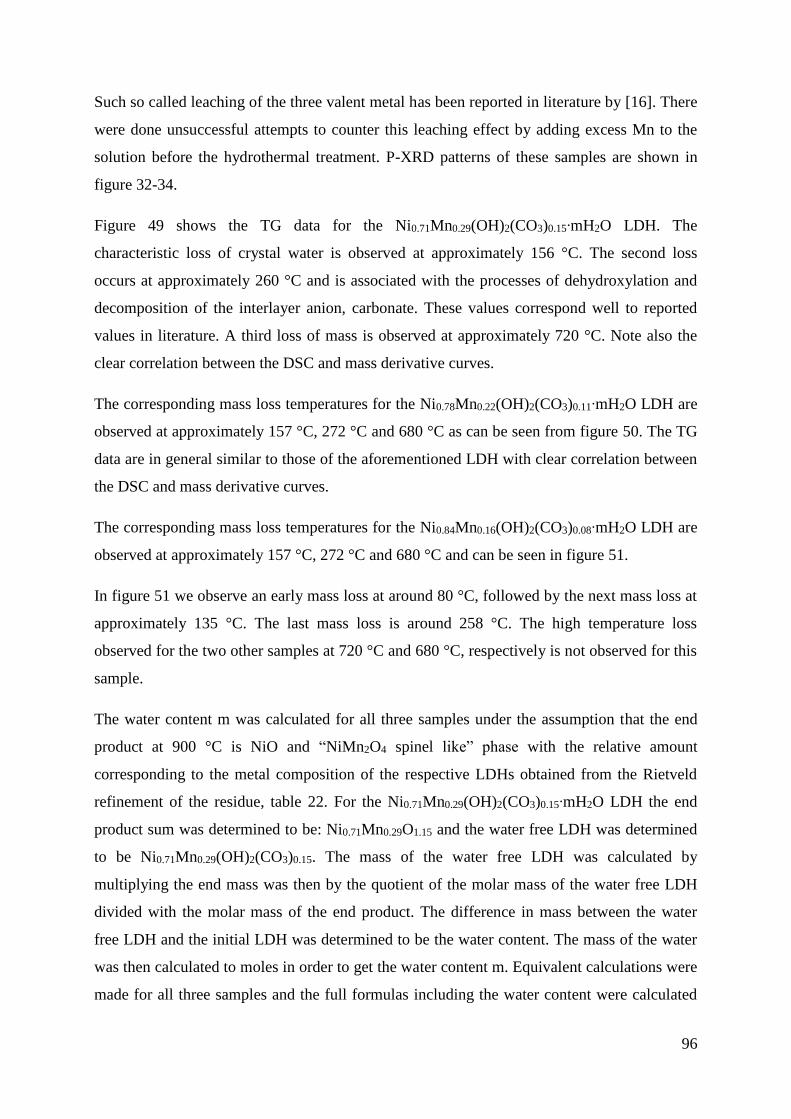
96
Such so called leaching of the three valent metal has been reported in literature by [16]. There
were done unsuccessful attempts to counter this leaching effect by adding excess Mn to the
solution before the hydrothermal treatment. P-XRD patterns of these samples are shown in
figure 32-34.
Figure 49 shows the TG data for the Ni0.71Mn0.29(OH)2(CO3)0.15∙mH2O LDH. The
characteristic loss of crystal water is observed at approximately 156 °C. The second loss
occurs at approximately 260 °C and is associated with the processes of dehydroxylation and
decomposition of the interlayer anion, carbonate. These values correspond well to reported
values in literature. A third loss of mass is observed at approximately 720 °C. Note also the
clear correlation between the DSC and mass derivative curves.
The corresponding mass loss temperatures for the Ni0.78Mn0.22(OH)2(CO3)0.11∙mH2O LDH are
observed at approximately 157 °C, 272 °C and 680 °C as can be seen from figure 50. The TG
data are in general similar to those of the aforementioned LDH with clear correlation between
the DSC and mass derivative curves.
The corresponding mass loss temperatures for the Ni0.84Mn0.16(OH)2(CO3)0.08∙mH2O LDH are
observed at approximately 157 °C, 272 °C and 680 °C and can be seen in figure 51.
In figure 51 we observe an early mass loss at around 80 °C, followed by the next mass loss at
approximately 135 °C. The last mass loss is around 258 °C. The high temperature loss
observed for the two other samples at 720 °C and 680 °C, respectively is not observed for this
sample.
The water content m was calculated for all three samples under the assumption that the end
product at 900 °C is NiO and “NiMn2O4 spinel like” phase with the relative amount
corresponding to the metal composition of the respective LDHs obtained from the Rietveld
refinement of the residue, table 22. For the Ni0.71Mn0.29(OH)2(CO3)0.15∙mH2O LDH the end
product sum was determined to be: Ni0.71Mn0.29O1.15 and the water free LDH was determined
to be Ni0.71Mn0.29(OH)2(CO3)0.15. The mass of the water free LDH was calculated by
multiplying the end mass was then by the quotient of the molar mass of the water free LDH
divided with the molar mass of the end product. The difference in mass between the water
free LDH and the initial LDH was determined to be the water content. The mass of the water
was then calculated to moles in order to get the water content m. Equivalent calculations were
made for all three samples and the full formulas including the water content were calculated
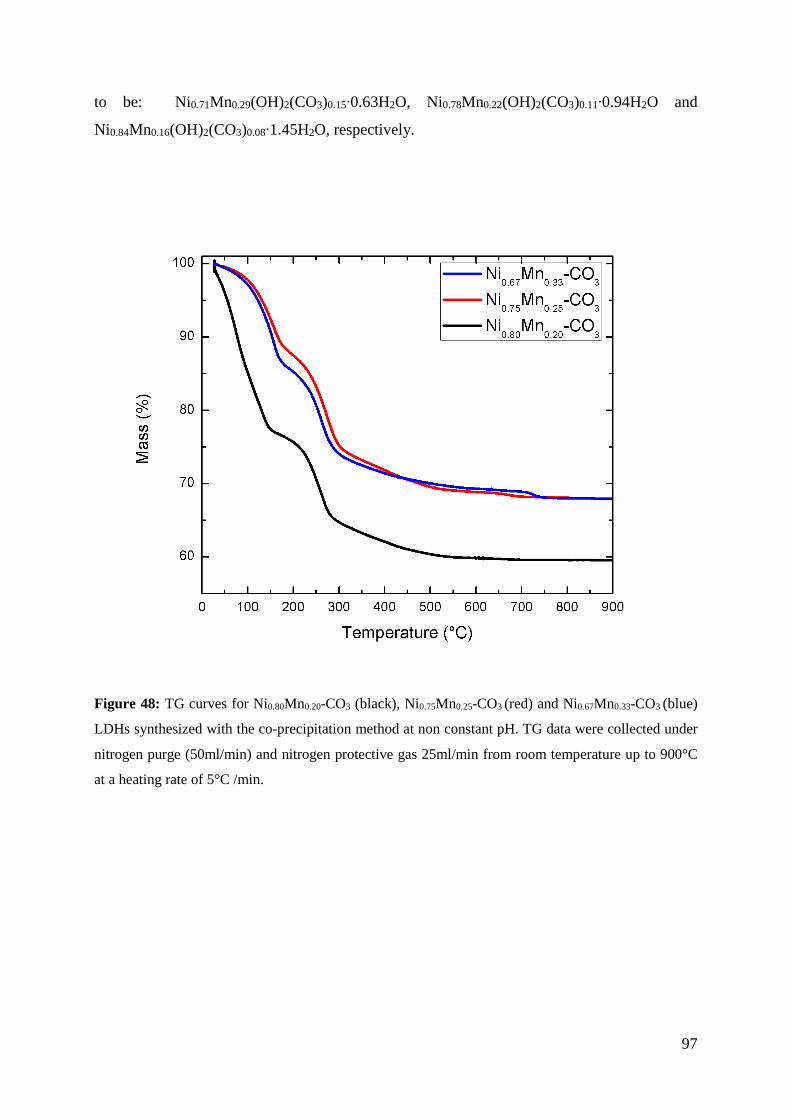
97
to be: Ni0.71Mn0.29(OH)2(CO3)0.15∙0.63H2O, Ni0.78Mn0.22(OH)2(CO3)0.11∙0.94H2O and
Ni0.84Mn0.16(OH)2(CO3)0.08∙1.45H2O, respectively.
Figure 48: TG curves for Ni0.80Mn0.20-CO3 (black), Ni0.75Mn0.25-CO3 (red) and Ni0.67Mn0.33-CO3 (blue)
LDHs synthesized with the co-precipitation method at non constant pH. TG data were collected under
nitrogen purge (50ml/min) and nitrogen protective gas 25ml/min from room temperature up to 900°C
at a heating rate of 5°C /min.
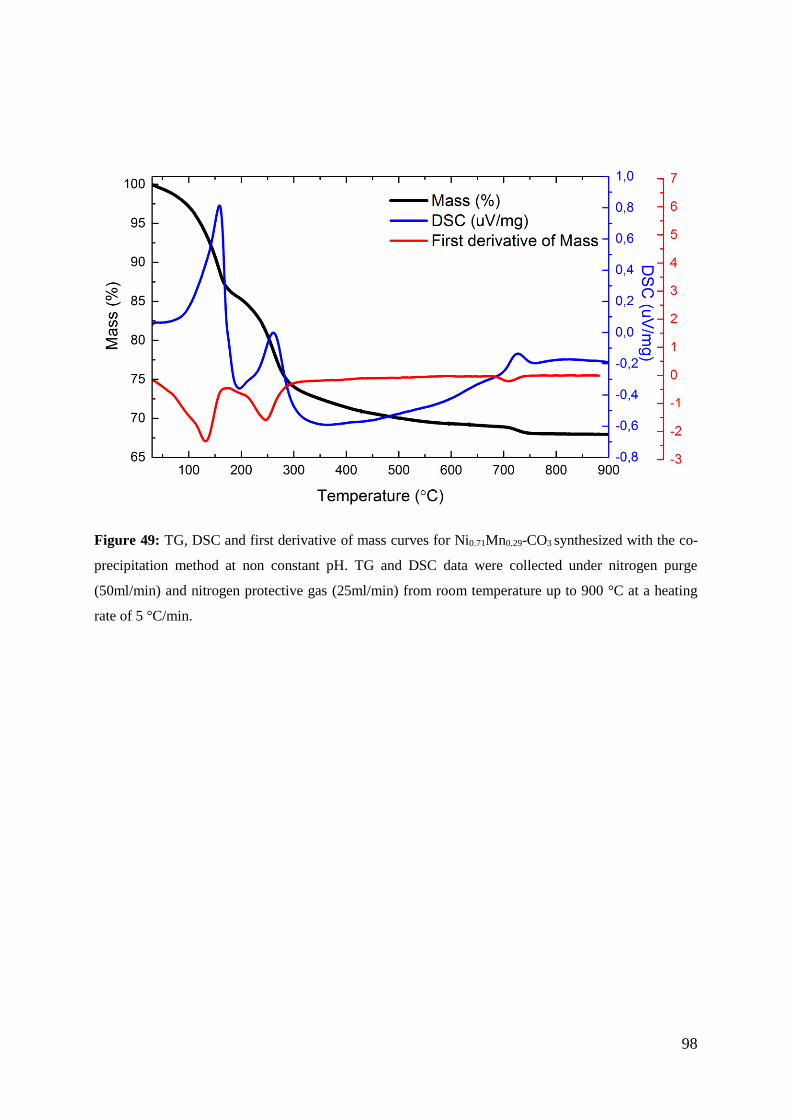
98
Figure 49: TG, DSC and first derivative of mass curves for Ni0.71Mn0.29-CO3 synthesized with the co-
precipitation method at non constant pH. TG and DSC data were collected under nitrogen purge
(50ml/min) and nitrogen protective gas (25ml/min) from room temperature up to 900 °C at a heating
rate of 5 °C/min.
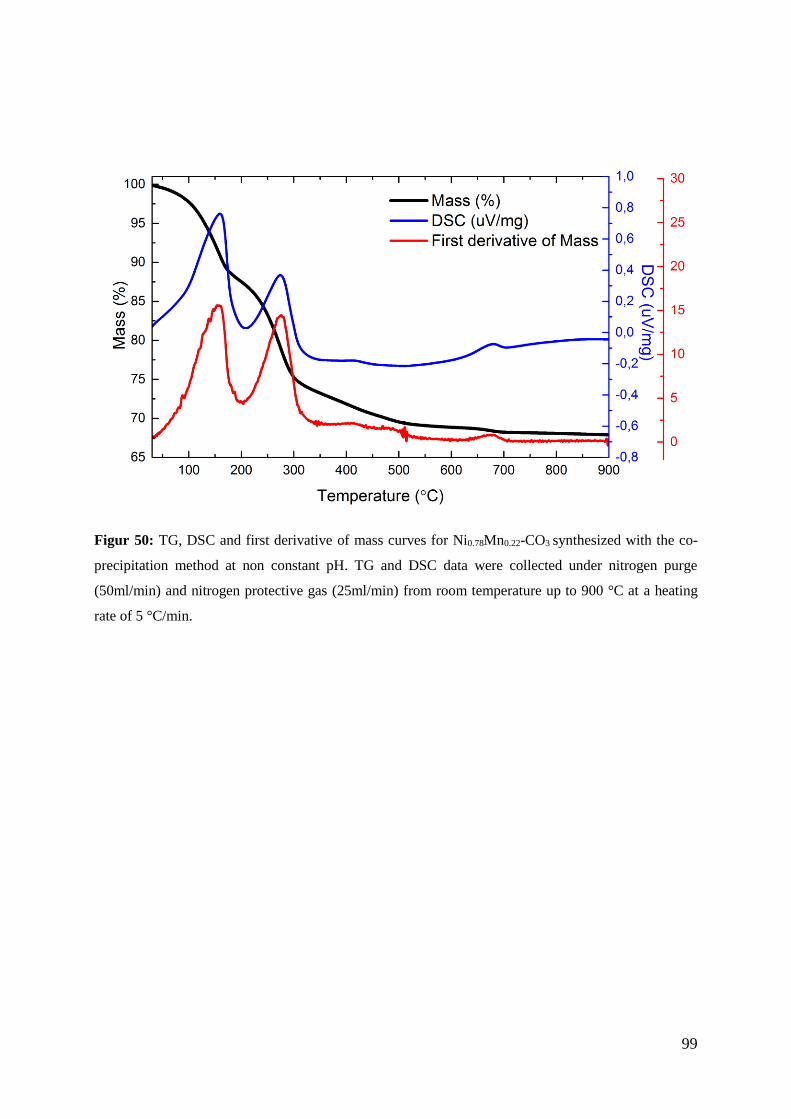
99
Figur 50: TG, DSC and first derivative of mass curves for Ni0.78Mn0.22-CO3 synthesized with the co-
precipitation method at non constant pH. TG and DSC data were collected under nitrogen purge
(50ml/min) and nitrogen protective gas (25ml/min) from room temperature up to 900 °C at a heating
rate of 5 °C/min.
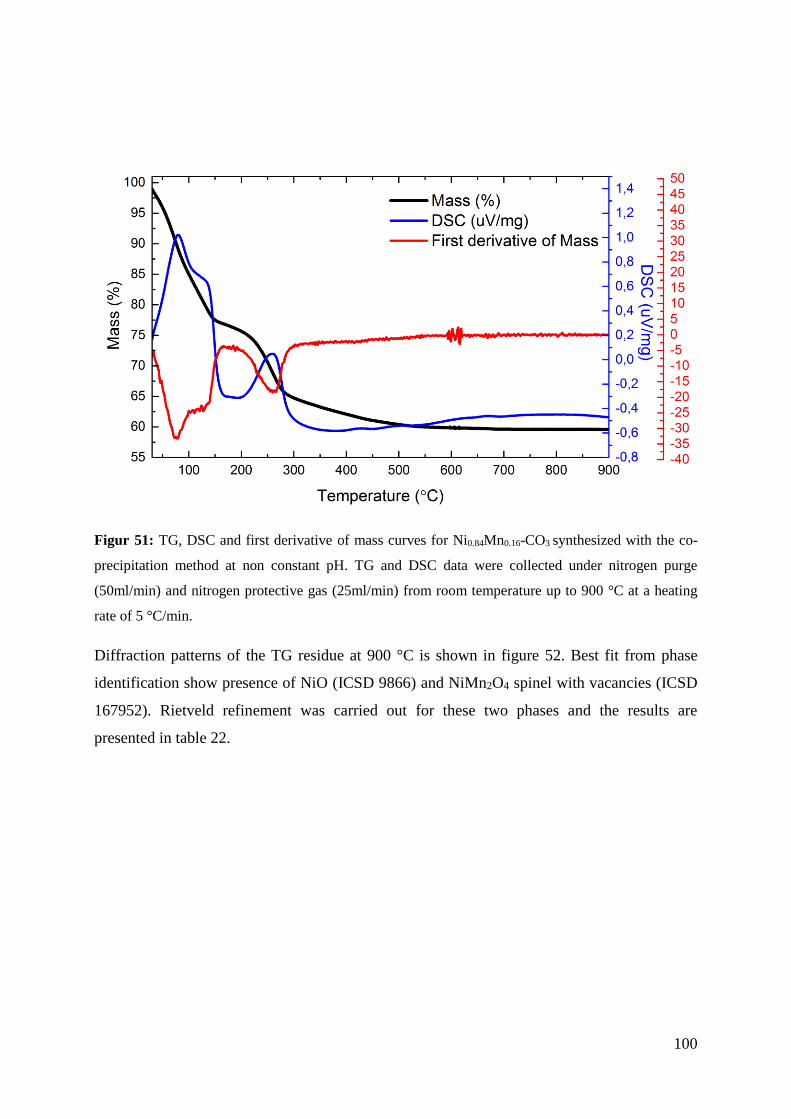
100
Figur 51: TG, DSC and first derivative of mass curves for Ni0.84Mn0.16-CO3 synthesized with the co-
precipitation method at non constant pH. TG and DSC data were collected under nitrogen purge
(50ml/min) and nitrogen protective gas (25ml/min) from room temperature up to 900 °C at a heating
rate of 5 °C/min.
Diffraction patterns of the TG residue at 900 °C is shown in figure 52. Best fit from phase
identification show presence of NiO (ICSD 9866) and NiMn2O4 spinel with vacancies (ICSD
167952). Rietveld refinement was carried out for these two phases and the results are
presented in table 22.
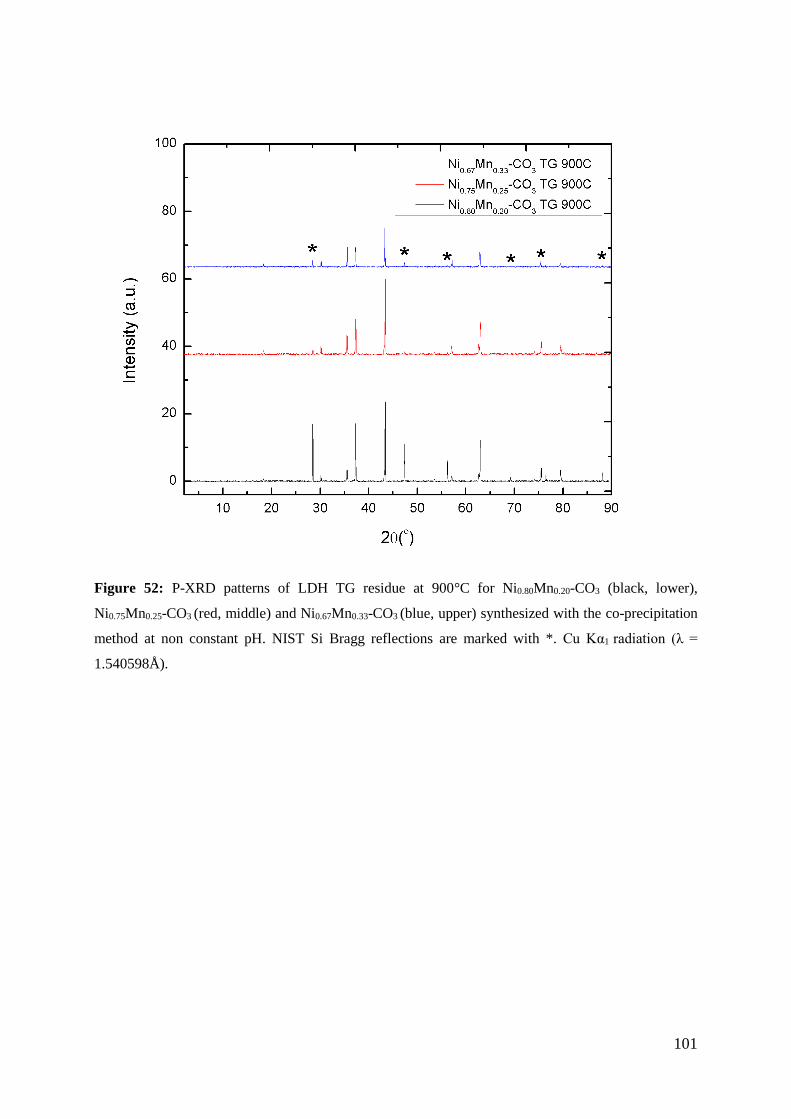
101
Figure 52: P-XRD patterns of LDH TG residue at 900°C for Ni0.80Mn0.20-CO3 (black, lower),
Ni0.75Mn0.25-CO3 (red, middle) and Ni0.67Mn0.33-CO3 (blue, upper) synthesized with the co-precipitation
method at non constant pH. NIST Si Bragg reflections are marked with *. Cu Kα1 radiation (λ =
1.540598Å).
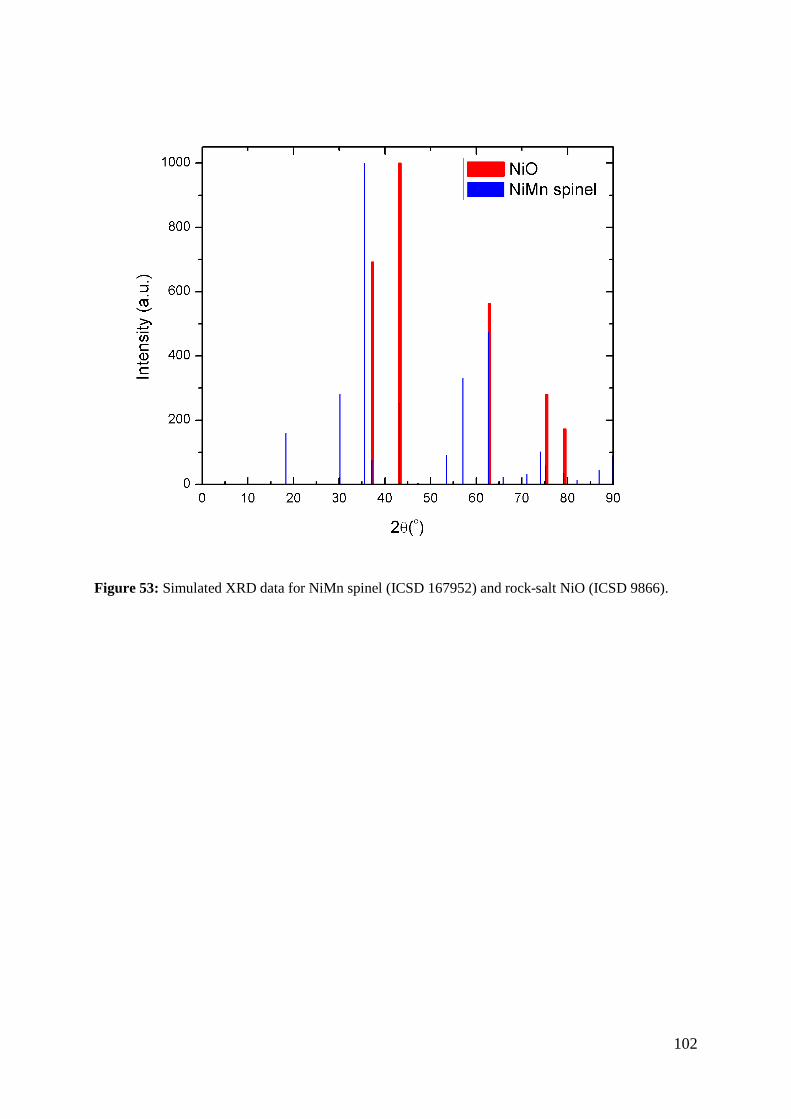
102
Figure 53: Simulated XRD data for NiMn spinel (ICSD 167952) and rock-salt NiO (ICSD 9866).
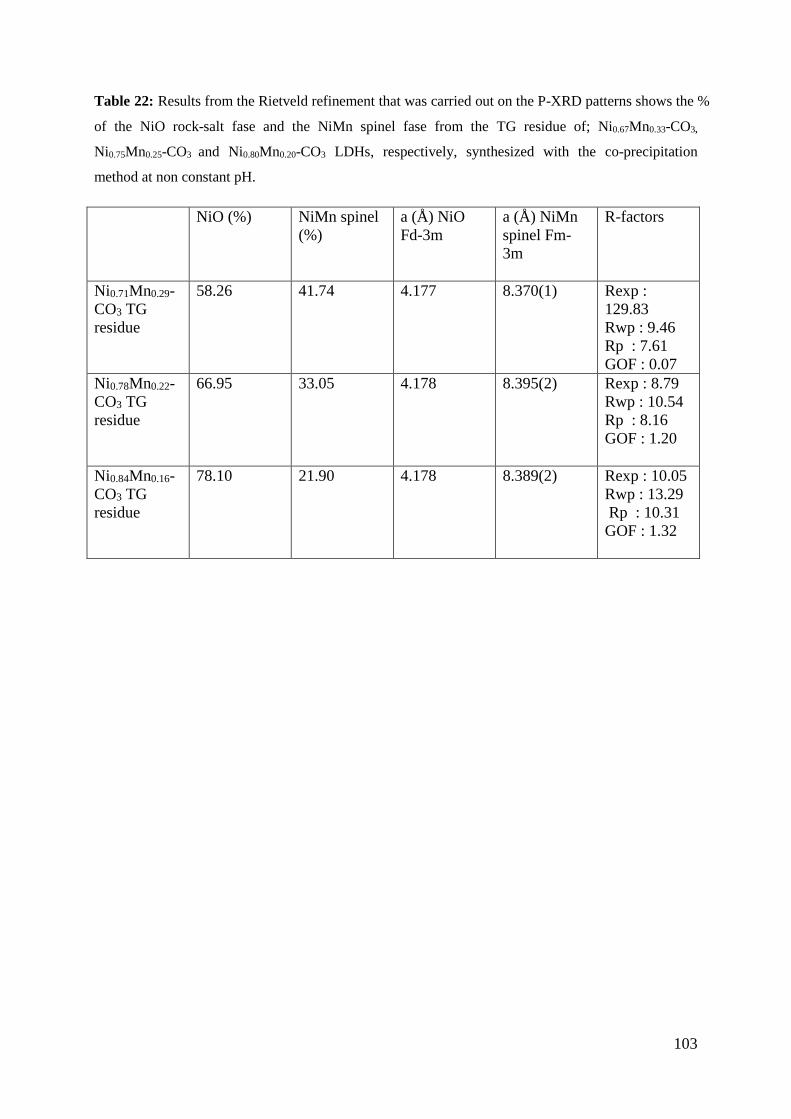
103
Table 22: Results from the Rietveld refinement that was carried out on the P-XRD patterns shows the %
of the NiO rock-salt fase and the NiMn spinel fase from the TG residue of; Ni0.67Mn0.33-CO3,
Ni0.75Mn0.25-CO3 and Ni0.80Mn0.20-CO3 LDHs, respectively, synthesized with the co-precipitation
method at non constant pH.
NiO (%) NiMn spinel
(%)
a (Å) NiO
Fd-3m
a (Å) NiMn
spinel Fm-
3m
R-factors
Ni0.71Mn0.29-
CO3 TG
residue
58.26 41.74 4.177 8.370(1) Rexp :
129.83
Rwp : 9.46
Rp : 7.61
GOF : 0.07
Ni0.78Mn0.22-
CO3 TG
residue
66.95 33.05 4.178 8.395(2) Rexp : 8.79
Rwp : 10.54
Rp : 8.16
GOF : 1.20
Ni0.84Mn0.16-
CO3 TG
residue
78.10 21.90 4.178 8.389(2) Rexp : 10.05
Rwp : 13.29
Rp : 10.31
GOF : 1.32

104
4.3.1 High temperature synchrotron data
Diffraction patterns of Ni0.71Mn0.29-CO3 and Ni0.84Mn0.14-CO3 LDHs synthesized with the co-
precipitation method at non constant pH at SNBL at four different temperatures; room
temperature (lower), 150 °C, 400 °C and 650 °C (upper) are presented in figure 54 and 55.
The intensities were multiplied by a factor of 6 and 8, respectively, for the following samples:
RT, 150 °C and 400 °C as the sample heated at 650 °C has significantly higher intensities.
The diffraction patterns at room temperature for both samples correspond to the typical LDH
diffraction pattern as seen earlier (fig. 25). The Ni0.71Mn0.29-CO3 LDH show however more
well defined Bragg reflections compared to the Ni0.84Mn0.14-CO3 LDH. This corresponds well
with earlier diffraction patterns we have seen of these samples. Both samples heated at 150 °C
show signs of the characteristic (003), (006), (110) and (113) Bragg reflections, though
significantly less defined than in the previous pattern. The most significant change is for the
(003) Bragg reflection which shows as a broad bump. The basal (003) and (006) Bragg
reflections appear to have shifted slightly towards higher 2θ range, which corresponds to a
shorter c-axis. This is expected at this temperature as we have seen from the TG studies that
the LDH loses its water at around 150 °C. The Bragg reflections are in general significantly
broader which with the Ni0.71Mn0.29-CO3 LDH sample showing slightly more well defined
Bragg reflections.
At 400 °C the LDH Bragg reflections are completely gone and the NiO rock salt phase
account for majority of the Bragg reflections for both samples. The diffraction patterns for
both samples heated to 650 °C corresponds to well crystalline NiO and “NiMn2O4 spinel like”
phases. This corresponds well with the diffraction patterns of the TG residues heated to
900 °C.
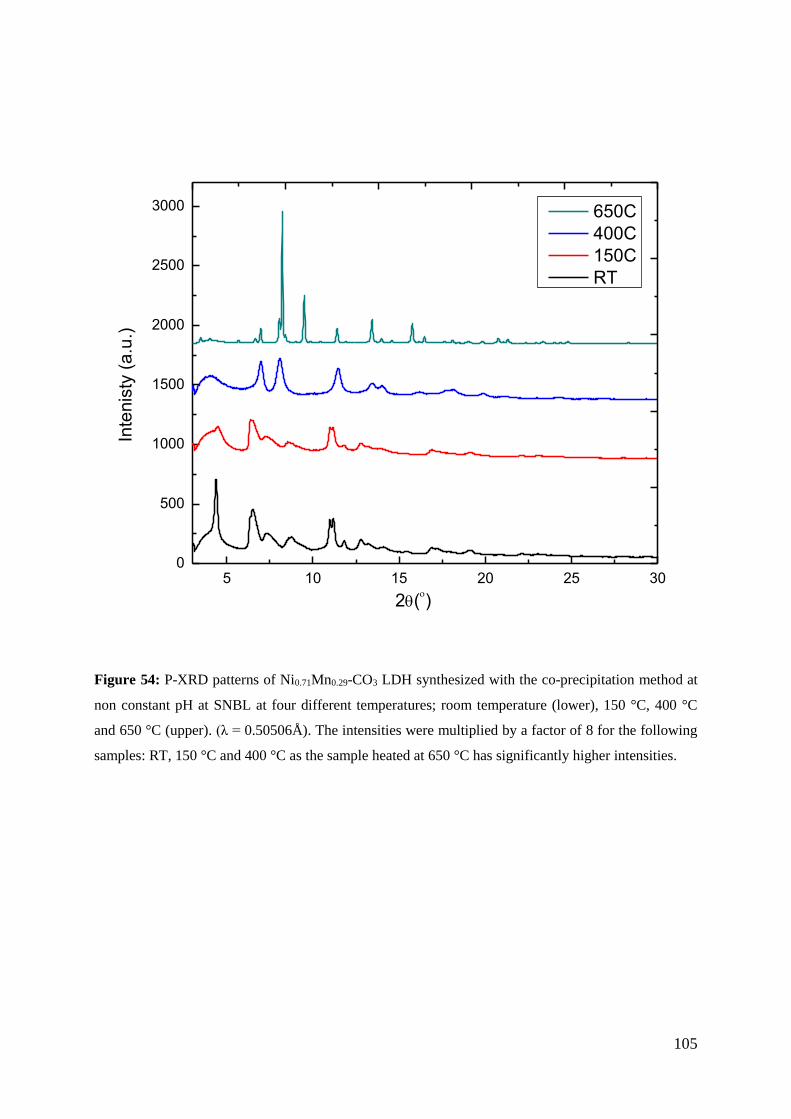
105
5 10 15 20 25 300
500
1000
1500
2000
2500
3000
Inte
nis
ty (
a.u
.)
650C
400C
150C
RT
2()
Figure 54: P-XRD patterns of Ni0.71Mn0.29-CO3 LDH synthesized with the co-precipitation method at
non constant pH at SNBL at four different temperatures; room temperature (lower), 150 °C, 400 °C
and 650 °C (upper). (λ = 0.50506Å). The intensities were multiplied by a factor of 8 for the following
samples: RT, 150 °C and 400 °C as the sample heated at 650 °C has significantly higher intensities.
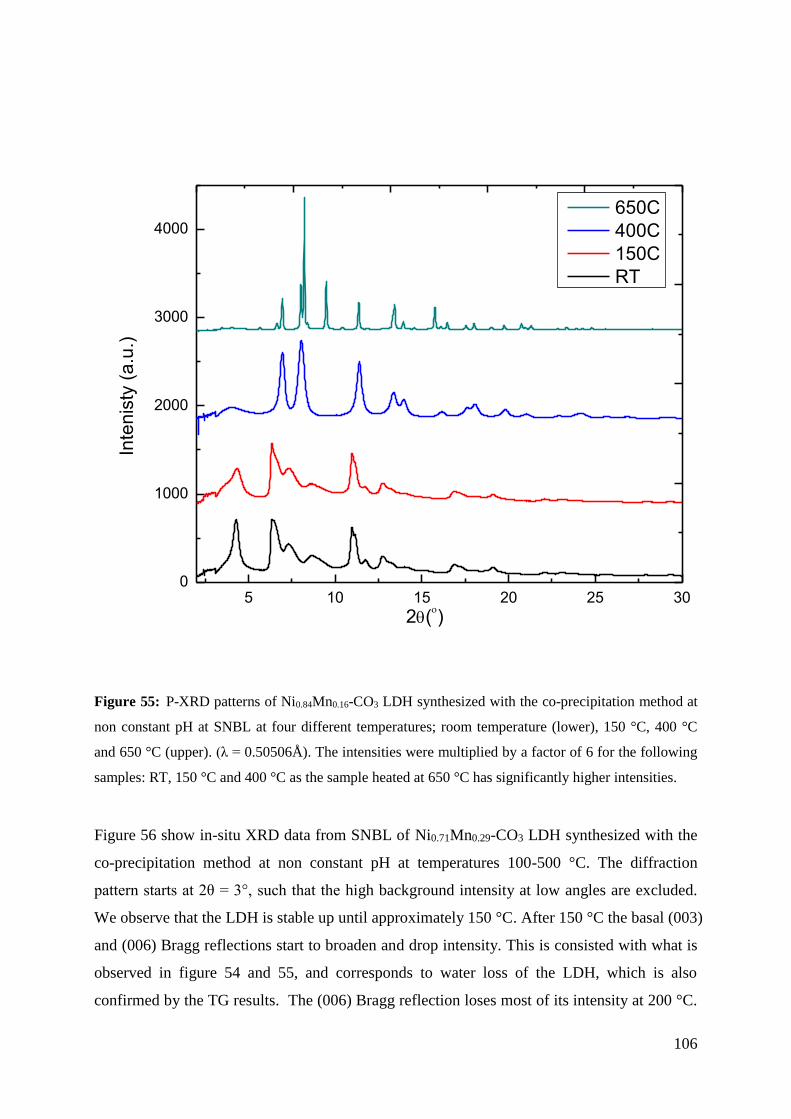
106
5 10 15 20 25 300
1000
2000
3000
4000
2(
)
Inte
nis
ty (
a.u
.)
650C
400C
150C
RT
Figure 55: P-XRD patterns of Ni0.84Mn0.16-CO3 LDH synthesized with the co-precipitation method at
non constant pH at SNBL at four different temperatures; room temperature (lower), 150 °C, 400 °C
and 650 °C (upper). (λ = 0.50506Å). The intensities were multiplied by a factor of 6 for the following
samples: RT, 150 °C and 400 °C as the sample heated at 650 °C has significantly higher intensities.
Figure 56 show in-situ XRD data from SNBL of Ni0.71Mn0.29-CO3 LDH synthesized with the
co-precipitation method at non constant pH at temperatures 100-500 °C. The diffraction
pattern starts at 2θ = 3°, such that the high background intensity at low angles are excluded.
We observe that the LDH is stable up until approximately 150 °C. After 150 °C the basal (003)
and (006) Bragg reflections start to broaden and drop intensity. This is consisted with what is
observed in figure 54 and 55, and corresponds to water loss of the LDH, which is also
confirmed by the TG results. The (006) Bragg reflection loses most of its intensity at 200 °C.
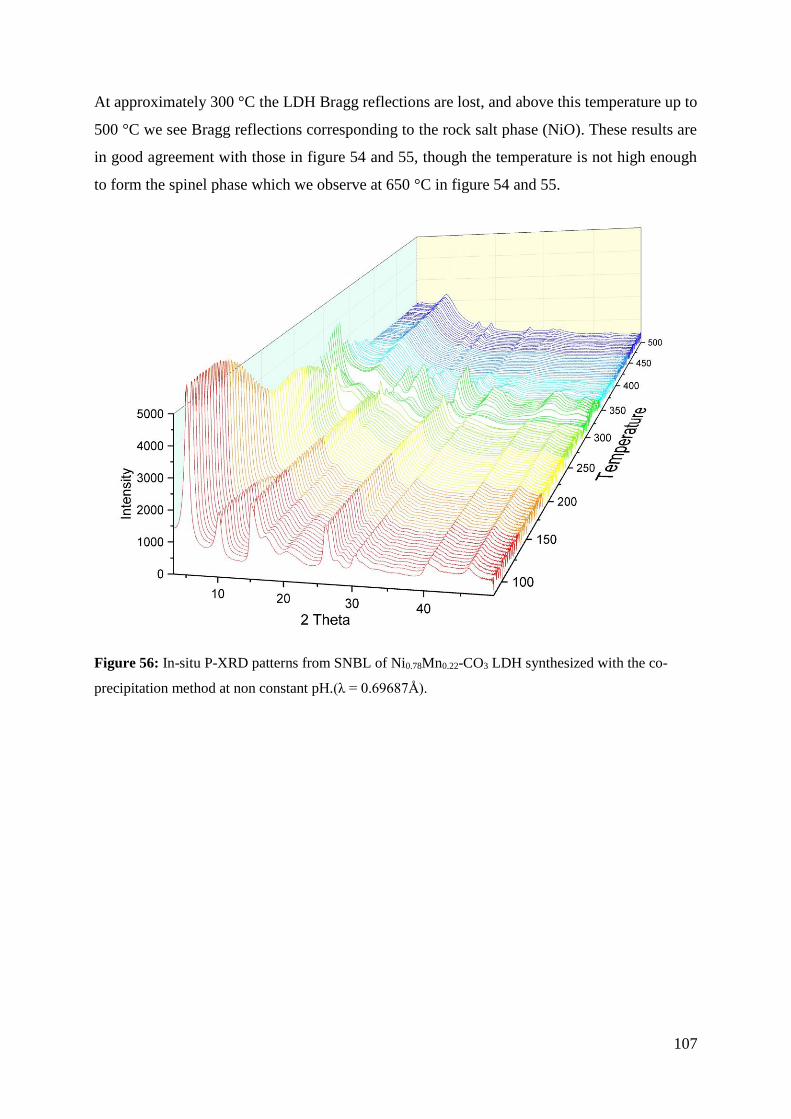
107
At approximately 300 °C the LDH Bragg reflections are lost, and above this temperature up to
500 °C we see Bragg reflections corresponding to the rock salt phase (NiO). These results are
in good agreement with those in figure 54 and 55, though the temperature is not high enough
to form the spinel phase which we observe at 650 °C in figure 54 and 55.
Figure 56: In-situ P-XRD patterns from SNBL of Ni0.78Mn0.22-CO3 LDH synthesized with the co-
precipitation method at non constant pH.(λ = 0.69687Å).
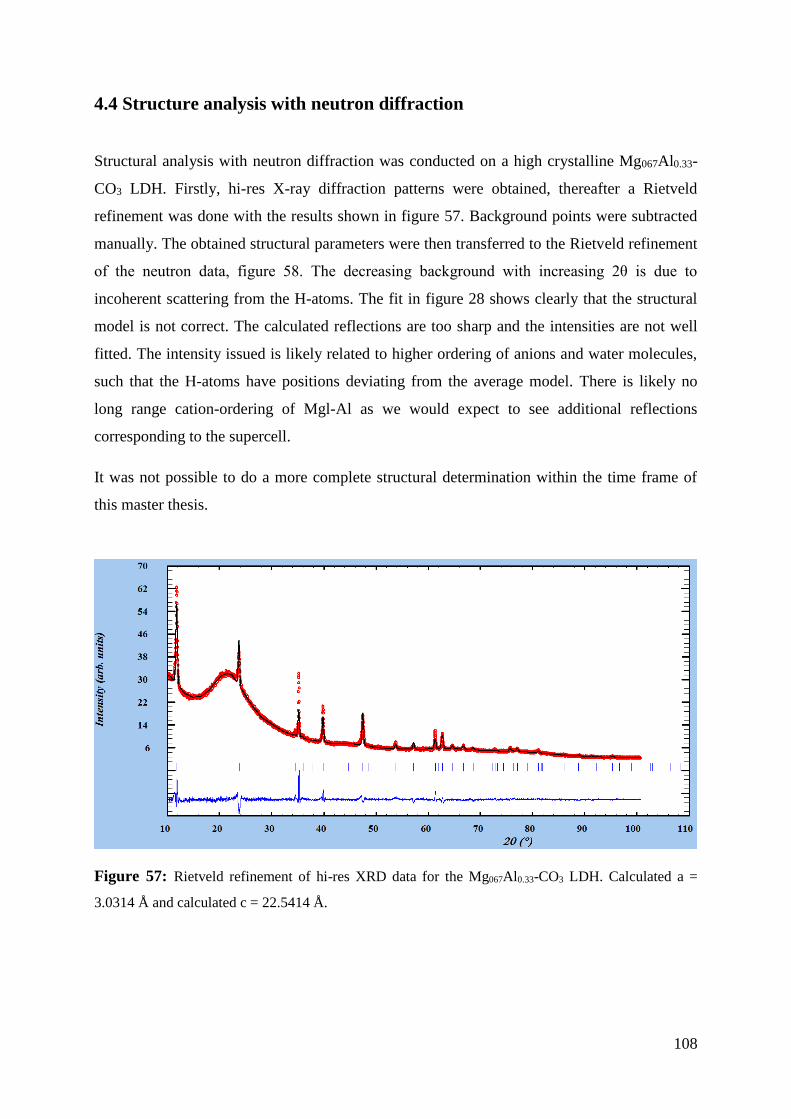
108
4.4 Structure analysis with neutron diffraction
Structural analysis with neutron diffraction was conducted on a high crystalline Mg067Al0.33-
CO3 LDH. Firstly, hi-res X-ray diffraction patterns were obtained, thereafter a Rietveld
refinement was done with the results shown in figure 57. Background points were subtracted
manually. The obtained structural parameters were then transferred to the Rietveld refinement
of the neutron data, figure 58. The decreasing background with increasing 2θ is due to
incoherent scattering from the H-atoms. The fit in figure 28 shows clearly that the structural
model is not correct. The calculated reflections are too sharp and the intensities are not well
fitted. The intensity issued is likely related to higher ordering of anions and water molecules,
such that the H-atoms have positions deviating from the average model. There is likely no
long range cation-ordering of Mgl-Al as we would expect to see additional reflections
corresponding to the supercell.
It was not possible to do a more complete structural determination within the time frame of
this master thesis.
Figure 57: Rietveld refinement of hi-res XRD data for the Mg067Al0.33-CO3 LDH. Calculated a =
3.0314 Å and calculated c = 22.5414 Å.
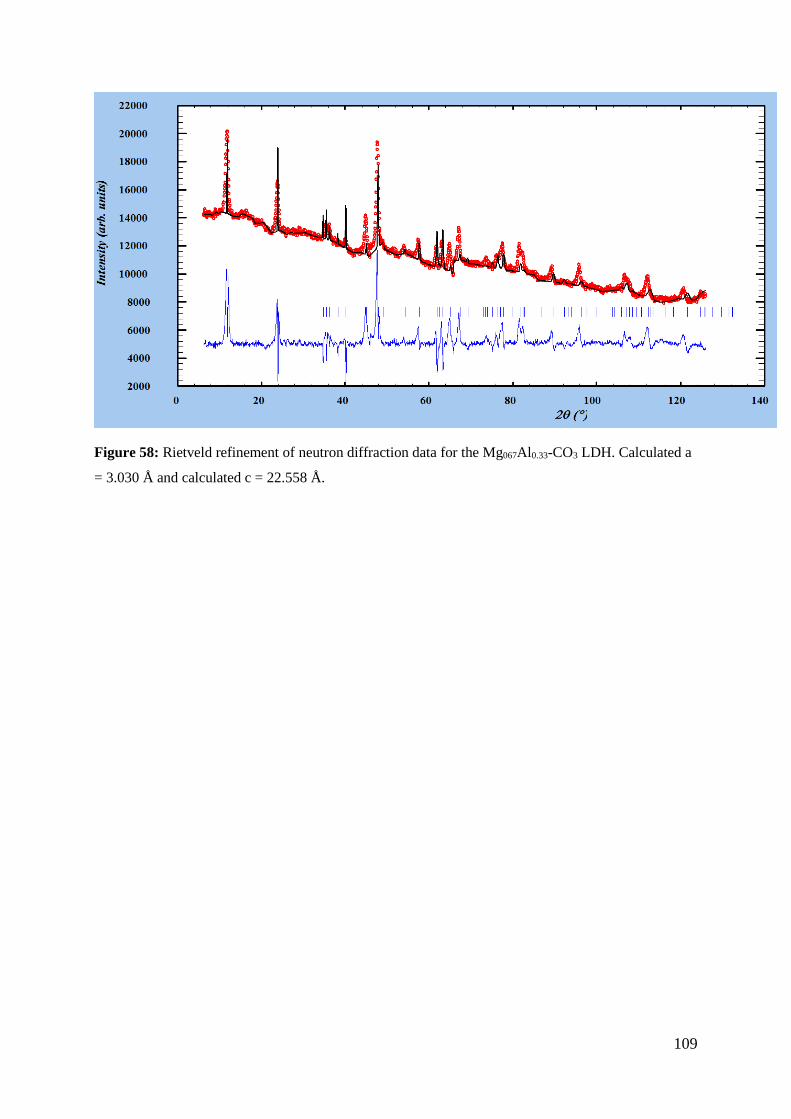
109
Figure 58: Rietveld refinement of neutron diffraction data for the Mg067Al0.33-CO3 LDH. Calculated a
= 3.030 Å and calculated c = 22.558 Å.
110
4.5 Physical properties
Magnetic properties were measured for the three NiMn LDH samples:
Ni0.71Mn0.29(OH)2(CO3)0.15∙0.63H2O, Ni0.78Mn0.22(OH)2(CO3)0.11∙0.94H2O and
Ni0.84Mn0.16(OH)2(CO3)0.08∙1.45H2O, respectively. The results are presented in the following.
Plots of molar susceptibility χm as function of temperature (K) under field cooled (FC) and
under zero field cooled (ZFC) for Ni0.71Mn0.29(OH)2(CO3)0.15∙0.63H2O (black ○ ),
Ni0.78Mn0.22(OH)2(CO3)0.11∙0.94H2O (red ▼) and Ni0.84Mn0.16(OH)2(CO3)0.08∙1.45H2O (blue
□ ) is presented in figure 59 and 60. The FC curve (figure 1) show highest molar
susceptibility χm for the LDH sample with the highest content of Ni,
Ni0.84Mn0.16(OH)2(CO3)0.08∙1.45H2O (blue □). Then a decrease as the Mn content increases.
The ZFC (figure 2) show highest molar susceptibility χm for the
Ni0.78Mn0.22(OH)2(CO3)0.11∙0.94H2O (red ▼) LDH. The highest molar susceptibility χm for the
Ni0.71Mn0.29(OH)2(CO3)0.15∙0.63H2O (black ○) and Ni0.84Mn0.16(OH)2(CO3)0.08∙1.45H2O (blue
□) have approximately sample values. Note that the Ni0.84Mn0.16(OH)2(CO3)0.08∙1.45H2O
(blue □) sample starts the dramatic increase in molar susceptibility at a significantly lower
temperature than the two other samples. This is reflected in a higher Curie-Weiss temperature
θ, see table 2. The form of the plots presented in figure 1 and 2 is typical for ferromagnetic
materials.
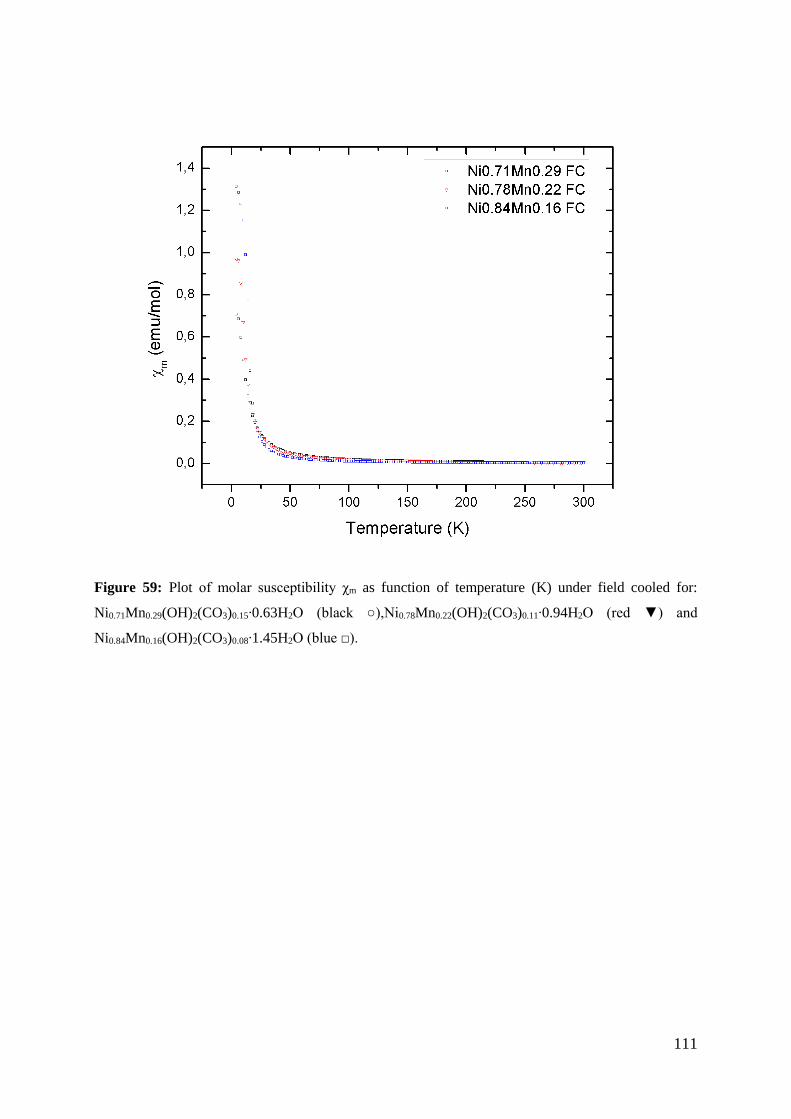
111
Figure 59: Plot of molar susceptibility χm as function of temperature (K) under field cooled for:
Ni0.71Mn0.29(OH)2(CO3)0.15∙0.63H2O (black ○),Ni0.78Mn0.22(OH)2(CO3)0.11∙0.94H2O (red ▼) and
Ni0.84Mn0.16(OH)2(CO3)0.08∙1.45H2O (blue □).
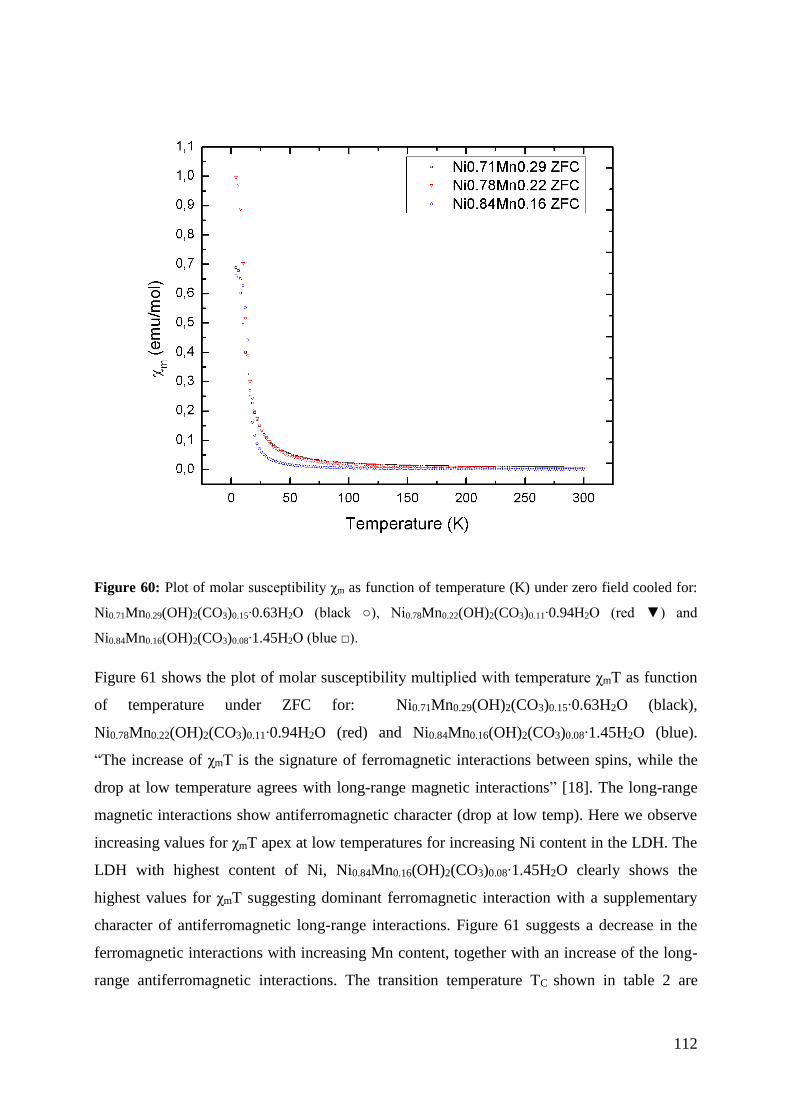
112
Figure 60: Plot of molar susceptibility χm as function of temperature (K) under zero field cooled for:
Ni0.71Mn0.29(OH)2(CO3)0.15∙0.63H2O (black ○), Ni0.78Mn0.22(OH)2(CO3)0.11∙0.94H2O (red ▼) and
Ni0.84Mn0.16(OH)2(CO3)0.08∙1.45H2O (blue □).
Figure 61 shows the plot of molar susceptibility multiplied with temperature χmT as function
of temperature under ZFC for: Ni0.71Mn0.29(OH)2(CO3)0.15∙0.63H2O (black),
Ni0.78Mn0.22(OH)2(CO3)0.11∙0.94H2O (red) and Ni0.84Mn0.16(OH)2(CO3)0.08∙1.45H2O (blue).
“The increase of χmT is the signature of ferromagnetic interactions between spins, while the
drop at low temperature agrees with long-range magnetic interactions” [18]. The long-range
magnetic interactions show antiferromagnetic character (drop at low temp). Here we observe
increasing values for χmT apex at low temperatures for increasing Ni content in the LDH. The
LDH with highest content of Ni, Ni0.84Mn0.16(OH)2(CO3)0.08∙1.45H2O clearly shows the
highest values for χmT suggesting dominant ferromagnetic interaction with a supplementary
character of antiferromagnetic long-range interactions. Figure 61 suggests a decrease in the
ferromagnetic interactions with increasing Mn content, together with an increase of the long-
range antiferromagnetic interactions. The transition temperature TC shown in table 2 are
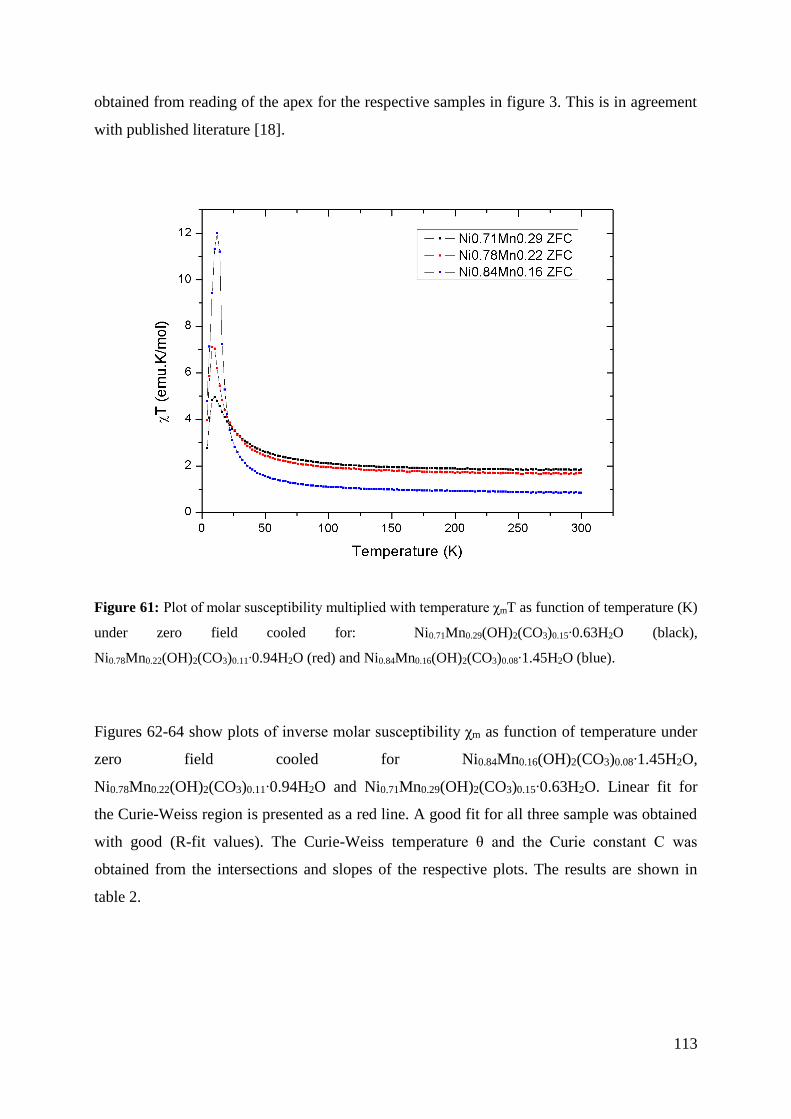
113
obtained from reading of the apex for the respective samples in figure 3. This is in agreement
with published literature [18].
Figure 61: Plot of molar susceptibility multiplied with temperature χmT as function of temperature (K)
under zero field cooled for: Ni0.71Mn0.29(OH)2(CO3)0.15∙0.63H2O (black),
Ni0.78Mn0.22(OH)2(CO3)0.11∙0.94H2O (red) and Ni0.84Mn0.16(OH)2(CO3)0.08∙1.45H2O (blue).
Figures 62-64 show plots of inverse molar susceptibility χm as function of temperature under
zero field cooled for Ni0.84Mn0.16(OH)2(CO3)0.08∙1.45H2O,
Ni0.78Mn0.22(OH)2(CO3)0.11∙0.94H2O and Ni0.71Mn0.29(OH)2(CO3)0.15∙0.63H2O. Linear fit for
the Curie-Weiss region is presented as a red line. A good fit for all three sample was obtained
with good (R-fit values). The Curie-Weiss temperature θ and the Curie constant C was
obtained from the intersections and slopes of the respective plots. The results are shown in
table 2.
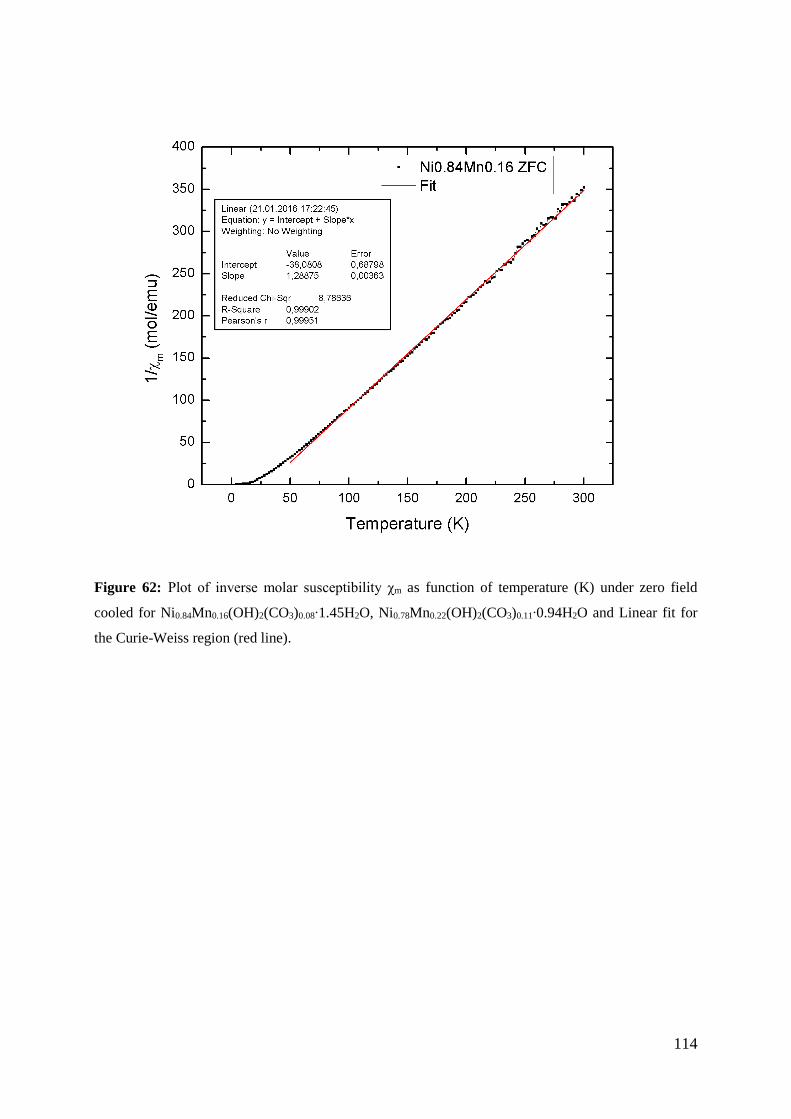
114
Figure 62: Plot of inverse molar susceptibility χm as function of temperature (K) under zero field
cooled for Ni0.84Mn0.16(OH)2(CO3)0.08∙1.45H2O, Ni0.78Mn0.22(OH)2(CO3)0.11∙0.94H2O and Linear fit for
the Curie-Weiss region (red line).
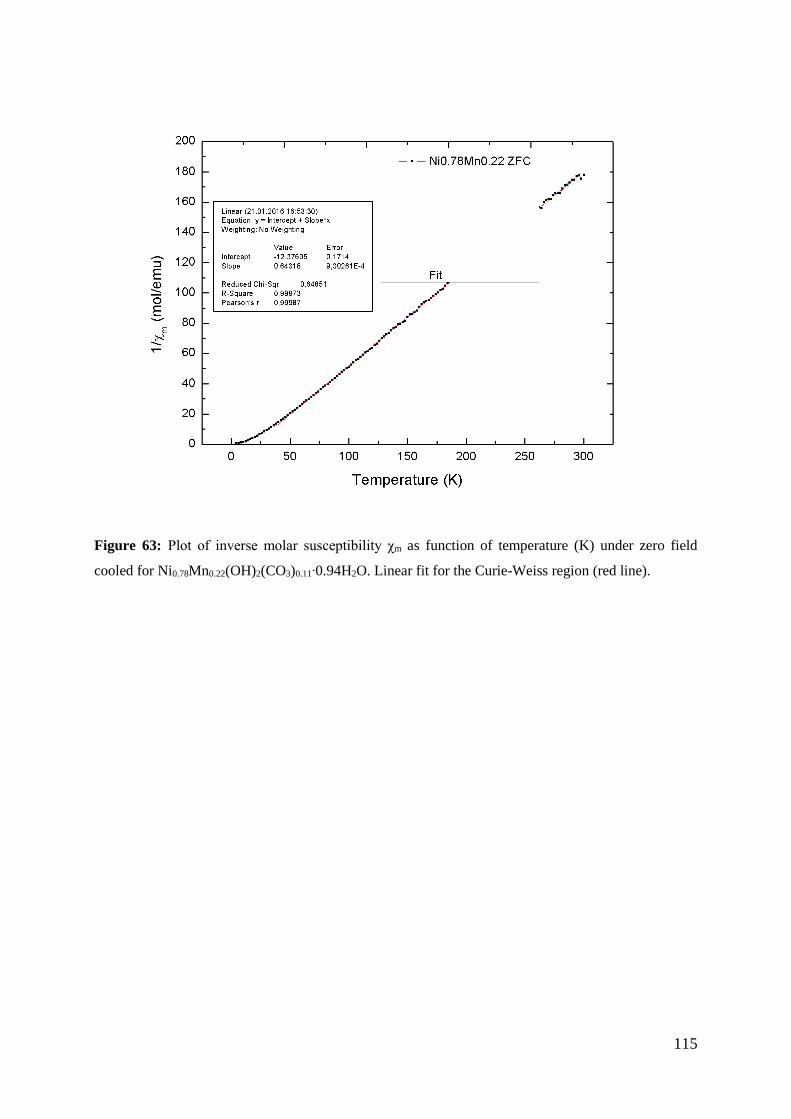
115
Figure 63: Plot of inverse molar susceptibility χm as function of temperature (K) under zero field
cooled for Ni0.78Mn0.22(OH)2(CO3)0.11∙0.94H2O. Linear fit for the Curie-Weiss region (red line).
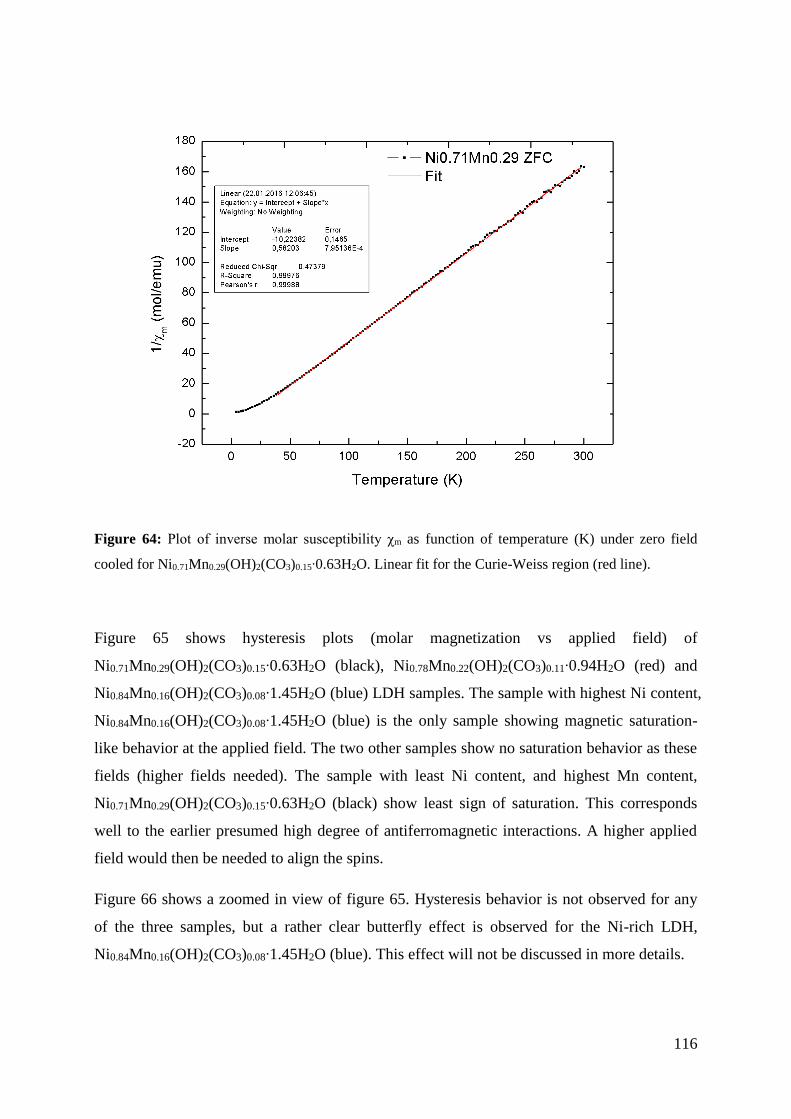
116
Figure 64: Plot of inverse molar susceptibility χm as function of temperature (K) under zero field
cooled for Ni0.71Mn0.29(OH)2(CO3)0.15∙0.63H2O. Linear fit for the Curie-Weiss region (red line).
Figure 65 shows hysteresis plots (molar magnetization vs applied field) of
Ni0.71Mn0.29(OH)2(CO3)0.15∙0.63H2O (black), Ni0.78Mn0.22(OH)2(CO3)0.11∙0.94H2O (red) and
Ni0.84Mn0.16(OH)2(CO3)0.08∙1.45H2O (blue) LDH samples. The sample with highest Ni content,
Ni0.84Mn0.16(OH)2(CO3)0.08∙1.45H2O (blue) is the only sample showing magnetic saturation-
like behavior at the applied field. The two other samples show no saturation behavior as these
fields (higher fields needed). The sample with least Ni content, and highest Mn content,
Ni0.71Mn0.29(OH)2(CO3)0.15∙0.63H2O (black) show least sign of saturation. This corresponds
well to the earlier presumed high degree of antiferromagnetic interactions. A higher applied
field would then be needed to align the spins.
Figure 66 shows a zoomed in view of figure 65. Hysteresis behavior is not observed for any
of the three samples, but a rather clear butterfly effect is observed for the Ni-rich LDH,
Ni0.84Mn0.16(OH)2(CO3)0.08∙1.45H2O (blue). This effect will not be discussed in more details.
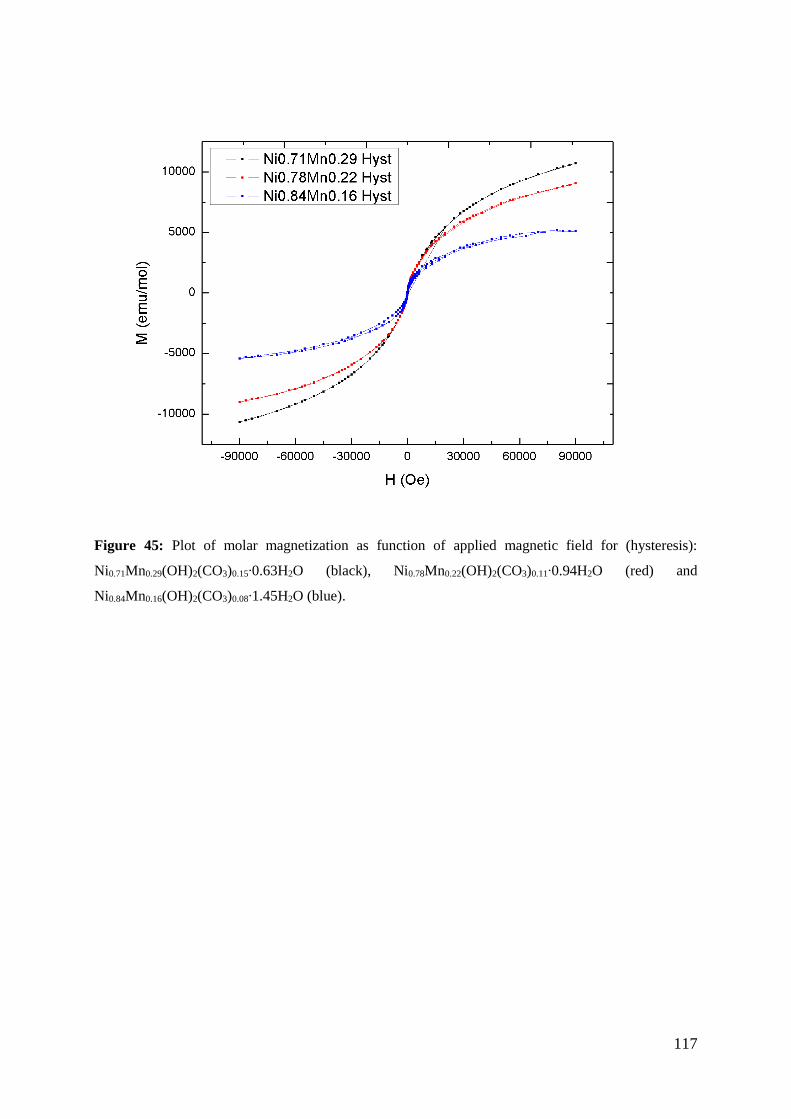
117
Figure 45: Plot of molar magnetization as function of applied magnetic field for (hysteresis):
Ni0.71Mn0.29(OH)2(CO3)0.15∙0.63H2O (black), Ni0.78Mn0.22(OH)2(CO3)0.11∙0.94H2O (red) and
Ni0.84Mn0.16(OH)2(CO3)0.08∙1.45H2O (blue).
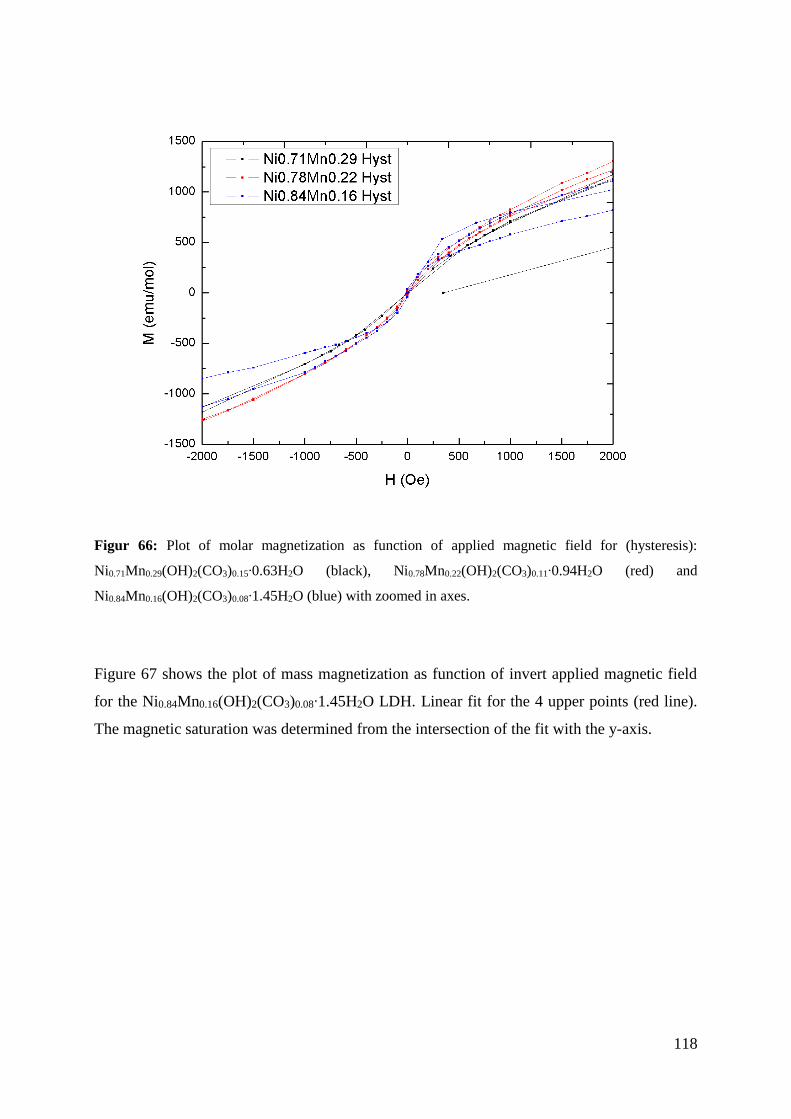
118
Figur 66: Plot of molar magnetization as function of applied magnetic field for (hysteresis):
Ni0.71Mn0.29(OH)2(CO3)0.15∙0.63H2O (black), Ni0.78Mn0.22(OH)2(CO3)0.11∙0.94H2O (red) and
Ni0.84Mn0.16(OH)2(CO3)0.08∙1.45H2O (blue) with zoomed in axes.
Figure 67 shows the plot of mass magnetization as function of invert applied magnetic field
for the Ni0.84Mn0.16(OH)2(CO3)0.08∙1.45H2O LDH. Linear fit for the 4 upper points (red line).
The magnetic saturation was determined from the intersection of the fit with the y-axis.
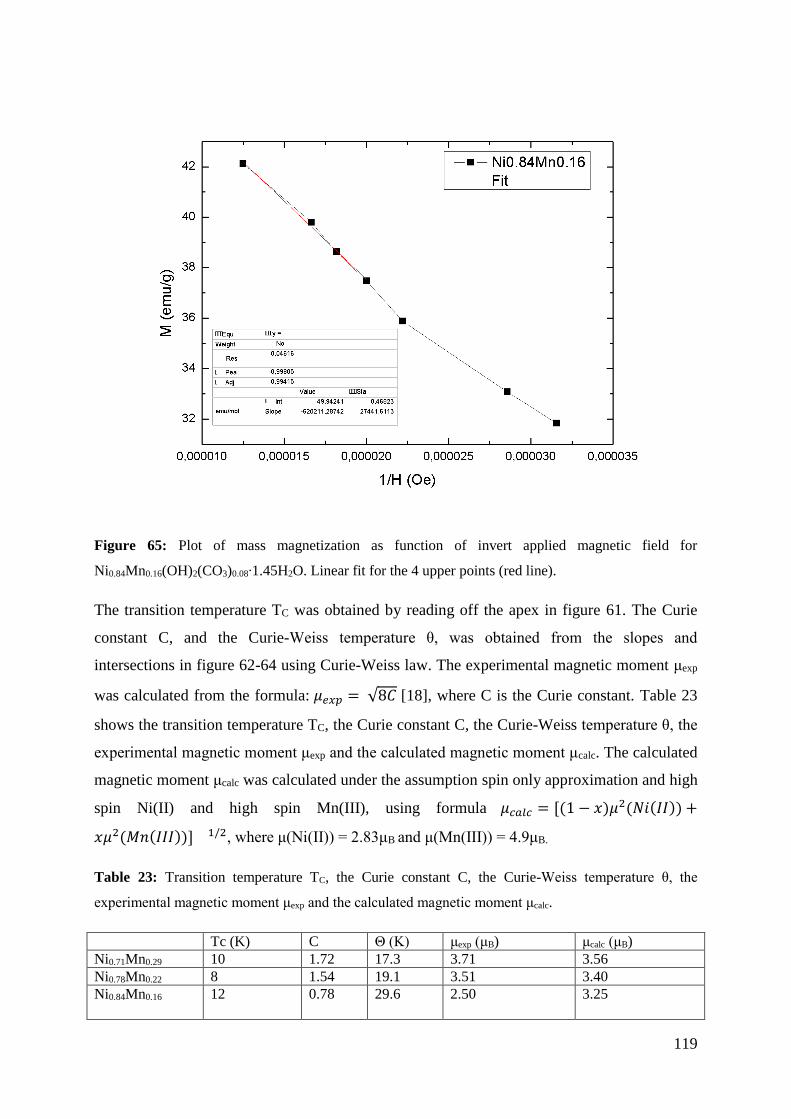
119
Figure 65: Plot of mass magnetization as function of invert applied magnetic field for
Ni0.84Mn0.16(OH)2(CO3)0.08∙1.45H2O. Linear fit for the 4 upper points (red line).
The transition temperature TC was obtained by reading off the apex in figure 61. The Curie
constant C, and the Curie-Weiss temperature θ, was obtained from the slopes and
intersections in figure 62-64 using Curie-Weiss law. The experimental magnetic moment μexp
was calculated from the formula: 𝜇𝑒𝑥𝑝 = √8𝐶 [18], where C is the Curie constant. Table 23
shows the transition temperature TC, the Curie constant C, the Curie-Weiss temperature θ, the
experimental magnetic moment μexp and the calculated magnetic moment μcalc. The calculated
magnetic moment μcalc was calculated under the assumption spin only approximation and high
spin Ni(II) and high spin Mn(III), using formula 𝜇𝑐𝑎𝑙𝑐 = [(1 − 𝑥)𝜇2(𝑁𝑖(𝐼𝐼)) +
𝑥𝜇2(𝑀𝑛(𝐼𝐼𝐼))] 1/2, where μ(Ni(II)) = 2.83μB and μ(Mn(III)) = 4.9μB.
Table 23: Transition temperature TC, the Curie constant C, the Curie-Weiss temperature θ, the
experimental magnetic moment μexp and the calculated magnetic moment μcalc.
Tc (K) C Θ (K) μexp (μB) μcalc (μB)
Ni0.71Mn0.29 10 1.72 17.3 3.71 3.56
Ni0.78Mn0.22 8 1.54 19.1 3.51 3.40
Ni0.84Mn0.16
12
0.78 29.6 2.50 3.25

120
121
5. Discussion
In this chapter, the results presented in chapter 4 will be discussed and compared in view of
published literature. This chapter will be divided into two main parts of which the first part
will address the Ni1xMnx(OH)2(CO3)x/2mH2O LDHs, and the second part the
Mg1xAlx(OH)2(CO3)x/2mH2O LDHs.
5.1. Ni1xMnx(OH)2(CO3)x/2mH2O LDH
5.1.1 Synthesis, crystallinity and lattice parameters for NiMn
The Ni1-xMnx(OH)2(CO3)x/2∙mH2O LDHs synthesized with the co-precipitation method at
constant pH (figure 22-23) are in general of poor crystallinity with broad and not well defined
Bragg reflections. The basal (003) and (006) Bragg reflections are well defined and are
located at 2θ values in line with reported literature. The (012), (009) and (015) Bragg
reflections are mostly undistinguishable from each other, as well as the (110) and (113) Bragg
reflections. This is slightly worse compared to diffraction patterns in published literature for
LDHs synthesized with this preparation method [22, 29]. Not much time was spent in attempt
to optimize parameters for this synthesis, as focus was shifted to the more promising co-
precipitation method at non constant pH.
In general, the Ni1-xMnx(OH)2(CO3)x/2∙mH2O LDHs synthesized with the co-precipitation
method at non constant pH were characterized to have significantly better crystallinity and
well defined Bragg reflections, see figure 25. The (012), (009) and (015) Bragg reflections
which were undistinguishable for the NiMn LDHs synthesized with the co-precipitation
method at constant pH, are for this method (non constant pH) significantly more well defined
and clearly distinguishable. This also applies to the (110) and (113) Bragg reflections which
are well defined, especially for the Ni0.71Mn0.29(OH)2(CO3)0.15∙0.63H2O LDH. There were
done several approaches in the attempt to optimize the synthesis parameters; addition rate of
metal cations into the reaction vessel, synthesis/ageing under different atmospheres (He, Ar,
O2), post synthesis hydrothermal treatment at different temperatures and length of time and
addition of additional Mn(III) (see section 4.1.3). Two different types of metal salts were also
used, namely nitrates and chlorides. This was done as nitrates are known to be weakly
122
oxidizing in basic environment, and Mn(III) which is needed for formation of LDHs is
sensitive to oxidation. No significant effect was observed between samples of either metal
salts. Only slight changes were observed in the diffraction patterns for the LDHs synthesized
with the different salts. For the target composition Ni0.75Mn0.25 sample there appears to be a
slight increase in crystallinity, mostly noticeable for the (110) and (113) Bragg reflections
which are more well defined and separated for the LDHs synthesized with the chloride salts.
The pH was also logged for some syntheses. We conclude that the most crystalline sample is
the LDH with formula Ni0.71Mn0.29(OH)2(CO3)0.15∙0.63H2O (smallest x of investigated NiMn
LDHs), with crystallinity decreasing as x is increased. This is in line with reported literature
[18].
The attempts to produce NiMn LDHs with nitrate as the only interlayer anion by the inert co-
precipitation method at non constant pH were not successful (figure 29). However, the
diffraction pattern (figure 29) show splitting of the basal (003) which was also seen for the
MgAl LDH system, and could imply presence of a nitrate phase together with the carbonate
LDH phase. Figure 68 shows the unit cell dimensions a and c vs composition x for Ni1–
xMnx(OH)2(CO3)x/2·mH2O LDHs synthesized with the co-precipitation at non constant pH.
The unit cell dimensions were obtained from Rietveld refinement (see table x) for the
following LDHs: Ni0.71Mn0.29(OH)2(CO3)0.15∙0.63H2O, Ni0.78Mn0.22(OH)2(CO3)0.11∙0.94H2O
and Ni0.84Mn0.16(OH)2(CO3)0.08∙1.45H2O (●). Unit cell dimensions reported by Giovannelli et
al. are marked as (∆). We see that the metal compositions of LDHs synthesized in present
study is slightly off from the targeted composition. In general the a-axis is smaller for the
NiMn LDHs in the present work than for reported literature [18], even though the lesser Mn
content in samples from present study should imply a longer a-axis compared to reported
values, as Mn(III) (high spin) is slightly smaller in size than Ni(II) (high spin). The difference
in unit cell dimensions in the present work versus the unit cell dimensions reported by
Giovannelli et al. (see figure 68) can possibly be explained by the different methods used for
determining the unit cell dimensions. Rietveld refinement was used to determine the unit cell
dimensions for samples in the present work, while Giovannelli et al. used only the peak
positions of (110) and (003) to calculate the unit cell dimensions a and c, respectively. The
metal cation compositions will be discussed in more detail in section 5.1.2. We observe the
trend of decreasing unit cell dimensions a and c for higher x values (higher Mn content). This
corresponds well to reported literature for carbonate based NiMn LDHs [18], and can be seen
in figure 68. The effect on the a-axis is rather small, which indicates that Ni(II) and Mn(III)
123
are or similar size, and thus that Mn(III) is present in the high spin configuration. This is also
reported by Giovannelli et al. [18], and will be discussed in more details in the section on
magnetic properties. It is reasonable to assume that the cause of the rather poor crystallinity
for NiMn LDHs in general is stacking faults.
The attempts that were done in attempt to increase the crystallinity of the NiMn LDH samples
synthesized with the co-precipitation at non constant pH by post synthesis hydrothermal
treatment were unsuccessful. Hydrothermal treatment is however known to be effective for
this purpose on other LDH systems such as the MgAl, though it has been reported leaching of
the M(III) [16]. Additional Mn was added prior to the post synthesis hydrothermal treatment
in an attempt to counter leeching. These attempts were not successful. In figure 31-34 we see
the diffraction patterns of NiMn LDH samples which have undergone post synthesis
hydrothermal treatment. The diffraction patterns show no LDH Bragg reflections and the two
phases Ni(OH)2 and Mn(OH)2 account for the majority of the Bragg reflections. We see that
the manganese is present in M(II) oxidation state in Mn(OH)2, while the Mn(III) oxidation
state is necessary for LDH formation.
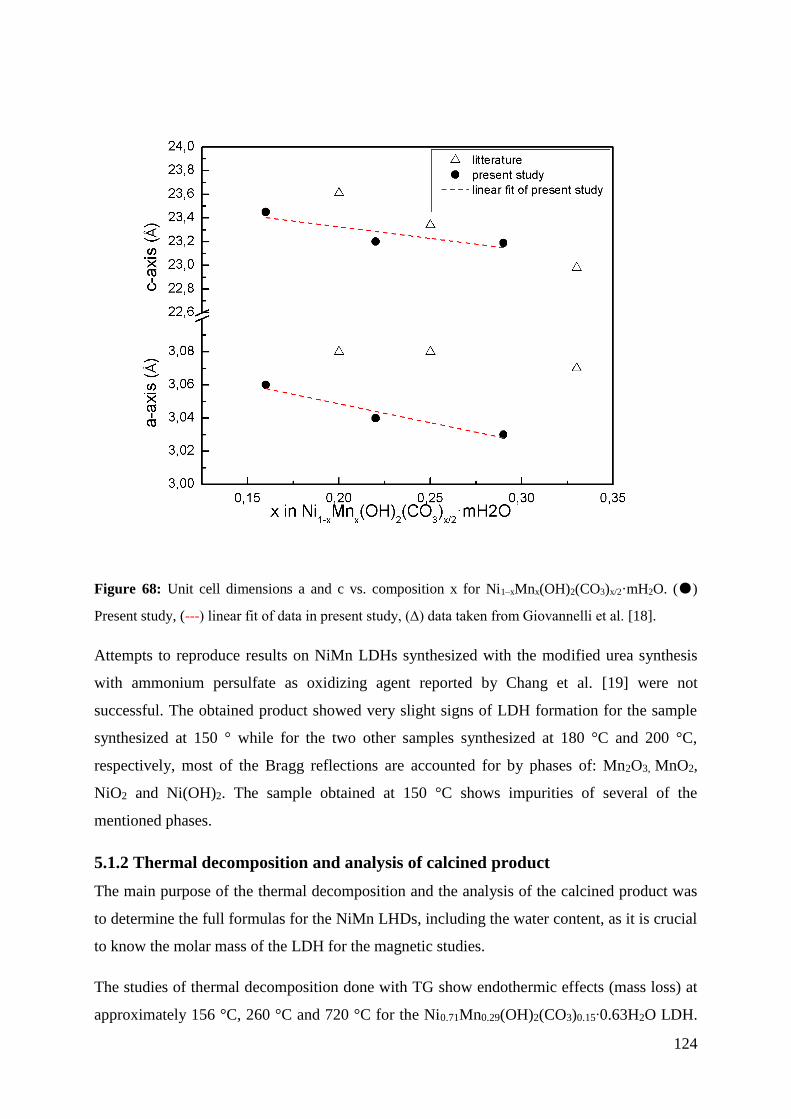
124
Figure 68: Unit cell dimensions a and c vs. composition x for Ni1–xMnx(OH)2(CO3)x/2·mH2O. (●)
Present study, (---) linear fit of data in present study, (∆) data taken from Giovannelli et al. [18].
Attempts to reproduce results on NiMn LDHs synthesized with the modified urea synthesis
with ammonium persulfate as oxidizing agent reported by Chang et al. [19] were not
successful. The obtained product showed very slight signs of LDH formation for the sample
synthesized at 150 ° while for the two other samples synthesized at 180 °C and 200 °C,
respectively, most of the Bragg reflections are accounted for by phases of: Mn2O3, MnO2,
NiO2 and Ni(OH)2. The sample obtained at 150 °C shows impurities of several of the
mentioned phases.
5.1.2 Thermal decomposition and analysis of calcined product
The main purpose of the thermal decomposition and the analysis of the calcined product was
to determine the full formulas for the NiMn LHDs, including the water content, as it is crucial
to know the molar mass of the LDH for the magnetic studies.
The studies of thermal decomposition done with TG show endothermic effects (mass loss) at
approximately 156 °C, 260 °C and 720 °C for the Ni0.71Mn0.29(OH)2(CO3)0.15∙0.63H2O LDH.
125
These are in line with those of reported literature [22, 29]. The TG data for the
Ni0.78Mn0.22(OH)2(CO3)0.11∙0.94H2O LDH show endothermic effects at approximately 157 °C,
272 °C and 680 °C. These values are quite similar to those of the aforementioned LDH and in
good line with reported values for NiMn LDHs with this metal composition [22]. The TG data
for the Ni0.84Mn0.16(OH)2(CO3)0.08∙1.45H2O LDH are observed at approximately 80 °C,
157 °C, 272 °C and 680 °C. No relevant data was found in literature for this LDH, but the
values are in good agreement with the two other previously mentioned LDHs. The
endothermic effect observed at approximately 80 °C, together with the large water content has
been observed can be explained by adsorption of surface water. This has been seen for MgAl
LDHs [15]. See figure 7.
X-ray diffraction data for the obtained calcined (900 °C) products show presence of NiO and
NiMn spinel. This is in accordance with reported literature [29]. In table 22 we see that the
content of the NiMn spinel is increasing and the content of NiO is decreasing in the calcined
product for increasing x (increasing Mn content in LDH). An increase of NiMn spinel content
corresponds to an increase of manganese content. These values of Ni and Mn content
correlate to the initially weighed out metal cation content, which tells us that we can
manipulate the metal composition of the NiMn LDH system. The trend is clear for the three
compositions (x = 0.20, 0.25 and 0.33) investigated in this work; more initial manganese
content lead to LDHs with higher manganese content. However, all samples show a
significantly lower manganese content than the target composition. This has been mentioned
in the results chapter as leaching of the M(III) metal cation, in this case Mn. This effect has
been reported for the MgAl LDH system [16] and seems to apply for the NiMn LDH system
as well.
The lattice parameter (a-axis) for the NiO is 4.177 Å and for the “NiMn2O4 spinel like” phase,
ranging from 8.370-8.394 Å (dependent on x) obtained from Rietveld refinement (table 22) of
the TG residue (900 °C), correspond well with the reported lattice parameters from equivalent
experiments, 4.177 Å and 8.381 Å, respectively [29].
The high temperature synchrotron data confirm the results from the TG. The LDHs are stabile
to approximately 150 °C, where they lose water and the c-axis shorten. At temperatures 300-
500 °C, the rock salte NiO phase is observed. The temperature is not high enough at 500 ° to
for the spinel structure.
126
5.1.3 Magnetic properties
Results from the measurements of magnetic properties show that all three samples exhibit
paramagnetic behavior at high temperatures (Curie-Weiss region). These results were
obtained from linear fit of the inverse molar susceptibility plot versus temperature. Curie-
Weiss temperature θ, and Curie constant C were obtained through calculations based on the
aforementioned plots. The Curie-Weiss temperatures in present work are in good agreement
for those reported by Giovannelli et al. [18]. The general trend is decreasing Curie-Weiss
temperature for increase of Mn content (x). The transition temperature TC, for ferromagnetic
to antiferromagnetic regime was determined by reading of the apex of the plot of molar
susceptibility multiplied with temperature, χmT as function of temperature (ZFC). These
values are listed in table 23 and do not correspond well to those reported by Giovannelli et al.
[18]. Giovannelli et al. use an advanced fit on the magnetic data to calculate the TC, and the
difference in values can possibly be attributed to this fact. The mentioned plot shows a drop at
low temperatures, which is reported as a signature feature for long range antiferromagnetic
interactions at low temperatures [18]. The plot indicates stronger antiferromagnetic
interactions for increasing Mn content (x) in the LDHs. This is in agreement with results
reported by Giovannelli et al. [18].
The experimental magnetic moment μexp and the calculated magnetic moment μcalc were
determined for all three NiMn samples. The values are listed in table 23. The calculated
magnetic moment was calculated assuming high spin states of Ni(II) and Mn(III) in
octahedral field. These values, except for the Ni0.84Mn0.16 LDH are inn good agreement with
reported values, if one considers the difference in metal cation composition between NiMn
LDHs in present study and those reported. This confirms that Ni(II) and Mn(III) are present in
the high spin state, and are of similar size. The metal cation compositions have been discussed
earlier in the chapter.
The hysteresis plots show that magnetic saturation was not reached any of the three samples
under the applied magnetic field, but that the LDH with least Mn content,
Ni0.84Mn0.16(OH)2(CO3)0.08∙1.45H2O, showed partial flattening of the curve at high field. This
suggests that it is more difficult (requires higher field) to align the more Mn rich LDHs, which
agrees with the results from the χmT vs temperature plot which suggest that higher Mn content
gives stronger antiferromagnetic interactions. This is in line with reported literature where the
Ni-OH-Mn and Mn-OH-Mn interactions are believed to cause the short-range in-layer
127
antiferromagnetic interactions, while the Ni-OH-Ni interactions are believed to cause long-
range ferromagnetic interactions.
A plot of magnetization versus inverse applied field was made, together with a linear fit for
the 4 last measurement points. From this the magnetization saturation at 4 K was calculated.
From this value the magnetic moment was calculated to be approximately μ = 1.1 μB. This
corresponds to a net ferromagnetic moment per formula unit of 1.1 unpaired electrons.
5.2. Mg1xAlx(OH)2(CO3)x/2mH2O LDH
5.2.1 Synthesis, phase purity and lattice parameters
Mg1-xAlx(OH)2(An-)x/n∙mH2O LDHs were synthesized with the urea method. Most samples
had target composition (x = 0.33) and carbonate as interlayer anion. P-XRD data show well
crystalline LDHs with well-defined and sharp Bragg reflections, see figure 36. The LDH
characteristic (003), (006), (009), (110) and (113) Bragg reflections are accounted for.
However, for some samples a splitting of the basal (003) and (006) Bragg reflections was
observed (figure 37). This has been reported for the ZnAl LDH system [12]. The lower 2θ
part of the Bragg reflections correspond to those of nitrate MgAl LDHs. Inayat et al. reported
a direct nitrate urea synthesis for ZnAl LDHs [12]. They report that the main parameters to
control in order to control nitrate/carbonate as the interlayer anion are: synthesis end pH (this
can be manipulated with reaction time and temperature as urea decomposition controls the pH)
and the nitrate to urea relative amount (more nitrate favors nitrate LDHs, less nitrate favors
carbonate LDHs as urea decomposes to carbon dioxide/carbonate). These parameters were
tuned to produce pure carbonate MgAl LDHs, see figure 42. This was accomplished by tuning
the end pH with added KOH (basic).
The focus was shifted towards trying to synthesize MgAl LDHs with the urea method
containing nitrate as the only anion. This has only been reported for ZnAl LDHs [12]. Firstly,
a synthesis with increased nitrate/urea ratio was done, see figure 43. The diffraction patterns
show that increase of initial nitrate/urea ratio gave larger (003) and (006) nitrate Bragg
reflections. But still, the carbonate (003) and (009) Bragg reflections dominate. An attempt
was done with addition of ammonium nitrate which is reported as the best approach for
synthesizing ZnAl nitrate LDHs [12]. Diffraction pattern in figure 44 show slightly larger
128
(003) and (006) Bragg reflections associated with nitrate, but still the carbonate (003) and
(006) Bragg reflections dominate the diffraction pattern, indicating a larger content of the
carbonate LDH phase.
An attempt to reproduce the nitrate ZnAl synthesis was done, with results presented in figure
45. The position of the (003) and (006) Bragg reflections correspond with those expected for
carbonate containing ZnAl LDHs, showing no sign of Bragg reflections expected for nitrate
based ZnAl. The attempt was not successful.
The attempt to produce nitrate containing MgAl LDHs with the urea synthesis was driven by
the wish to produce high crystalline nitrate MgAl LDHs, this is hard to achieve with the co-
precipitation method. The attempts to produce pure nitrate phase MgAl LDHs with the direct
urea synthesis method were not successful. However, useful insight was gained on the issue
and the obtained information is interesting.
The Rietveld refinement conducted on the MgAl LDHs give us lattice parameter a which
correspond to a substitution rate x = 38 based on figure 2. The numbers in figure 2 are based
on nitrate containing MgAl LDHs, but should also apply to carbonate based MgAl LDHs as
the effect of interlayer anion should have negligible effect on the a-axis.
Structural analysis including neutron diffraction was carried out on a MgAl LDH with the
main goal to investigate possible long range cation-ordering. The results are briefly presented
in chapter 4.4. It showed to be challenging to work on this issue, as it was difficult to do the
Rietveld refinement. However, the lack of expected super structure Bragg reflections indicate
no long range cation ordering.
129
6. Conclusions
Ni1-xMnx(OH)2(CO3)x/2∙mH2O LDHs in the range of x = 0.16-0.29 were synthesized with the
co-precipitation method at non constant pH. The unit cell parameters a and c were determined
by Rietveld method with respect to metal cation composition (x). The most crystalline of the
NiMn LDH samples was the sample with substitution degree x = 0.29, the LDH with largest
Mn content. There was found decrease in crystallinity for decreasing Mn content (decrease in
x). This is in line with reported literature.
Thermogravimetric studies were conducted on three sample, together with Rietveld analysis
of the P-XRD patterns from their calcined products at 900 °C. The main goal of these
characterizations was to determine the full formulas of the respective LDHs, which are
necessary for the magnetic studies. The results from this give the full formulas;
Ni0.71Mn0.29(OH)2(CO3)0.15∙0.63H2O, Ni0.78Mn0.22(OH)2(CO3)0.11∙0.94H2O and
Ni0.84Mn0.16(OH)2(CO3)0.08∙1.45H2O.
Measurements of the magnetic properties showed paramagnetic behavior at high temperature
(Curie-Weiss region), and ferromagnetic interactions at lower temperatures. At temperatures >
10 K short-range antiferromagnetic interactions are observed, with increasing tendency for
higher Mn content. These results are in line with literature. The net ferromagnetic moment of
the most Ni-rich LHD, Ni0.84Mn0.16(OH)2(CO3)0.08∙1.45H2O, was calculated to 1.1μB,
corresponding to 1.1 unpaired electrons per formula unit.
High crystalline MgAl LDHs with carbonate in the interlayer gallery were synthesized with
urea method. Attempts were made to synthesize MgAl LDHs with carbonate as the interlayer
anion using the urea method. There attempts were not successful in synthesizing MgAl LDHs
with nitrate as the only interlayer anion. However, results suggest presence of a mix of both
nitrate and carbonate LDH phases.
Rietveld analysis on neutron diffraction data from a MgAl LDH was done to examine
possible long-range cation order. There were difficulties linked to this analysis, but results
suggest no long-range cation order in the sample.
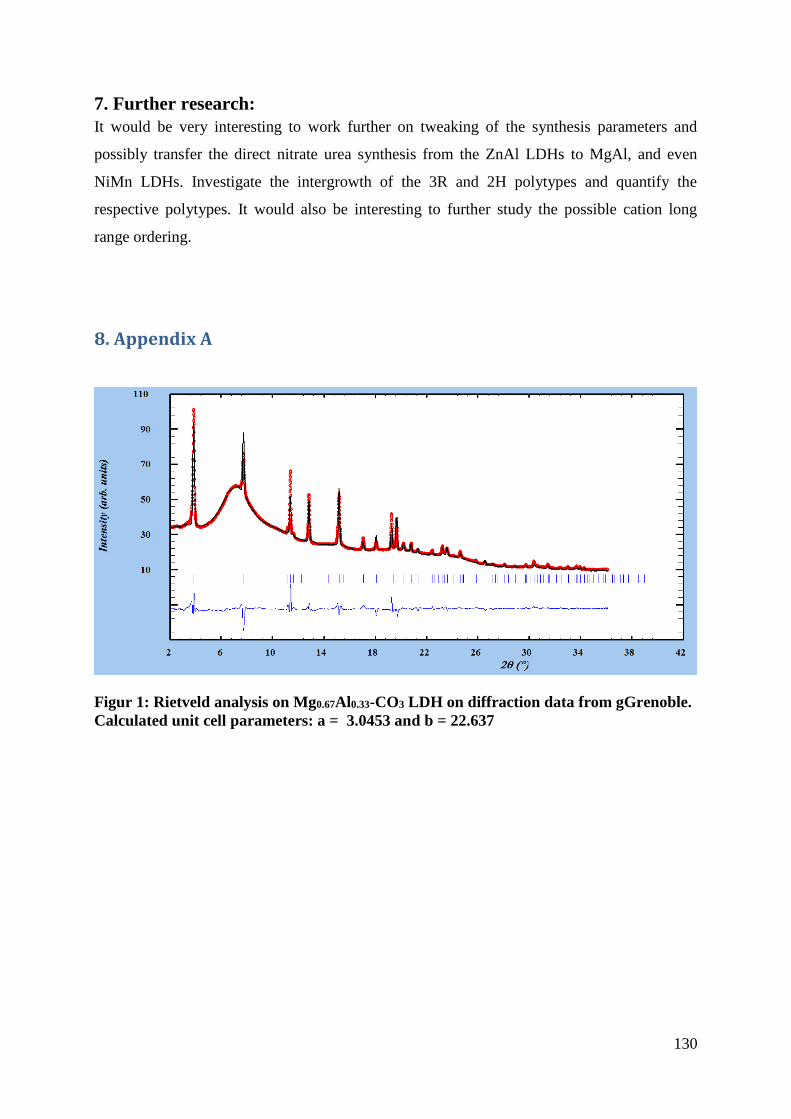
130
7. Further research:
It would be very interesting to work further on tweaking of the synthesis parameters and
possibly transfer the direct nitrate urea synthesis from the ZnAl LDHs to MgAl, and even
NiMn LDHs. Investigate the intergrowth of the 3R and 2H polytypes and quantify the
respective polytypes. It would also be interesting to further study the possible cation long
range ordering.
8. Appendix A
Figur 1: Rietveld analysis on Mg0.67Al0.33-CO3 LDH on diffraction data from gGrenoble.
Calculated unit cell parameters: a = 3.0453 and b = 22.637

131
9.References
1. Rives, V., Layered Double Hydroxides: Present And Future. 2001.
2. Vaccari, A., Clays and catalysis: a promising future. Appl. Clay Sci., 1999. 14(4): p.
161-198.
3. Vaccari, A., Preparation and catalytic properties of cationic and anionic clays. Catal.
Today, 1998. 41(1-3): p. 53-71.
4. Olafsen, A., et al., Mechanistic features for propane reforming by carbon dioxide over
a Ni/Mg(Al)O hydrotalcite-derived catalyst. J. Catal., 2005. 229(1): p. 163-175.
5. Choi, S., J.H. Drese, and C.W. Jones, Adsorbent Materials for Carbon Dioxide
Capture from Large Anthropogenic Point Sources. ChemSusChem, 2009. 2(9): p.
796-854.
6. Cheng, X., et al., Phosphate adsorption from sewage sludge filtrate using zinc-
aluminum layered double hydroxides. J. Hazard. Mater., 2009. 169(1-3): p. 958-964.
7. Gu, Z., J.J. Atherton, and Z.P. Xu, Hierarchical layered double hydroxide
nanocomposites: structure, synthesis and applications. Chem. Commun. (Cambridge,
U. K.), 2015. 51(15): p. 3024-3036.
8. Lv, F., et al., Layered Double Hydroxide Assemblies with Controllable Drug Loading
Capacity and Release Behavior as well as Stabilized Layer-by-Layer Polymer
Multilayers. ACS Appl. Mater. Interfaces, 2015. 7(34): p. 19104-19111.
9. He, J., et al., Preparation of Layered Double Hydroxides, in Layered Double
Hydroxides, X. Duan and D. Evans, Editors. 2006, Springer Berlin Heidelberg. p. 89-
119.
10. Pausch, I., et al., Syntheses of disordered and aluminum-rich hydrotalcite-like
compounds. Clays Clay Miner., 1986. 34(5): p. 507-10.
11. Miyata, S., Anion-exchange properties of hydrotalcite-like compounds. Clays Clay
Miner., 1983. 31(4): p. 305-11.
12. Inayat, A., M. Klumpp, and W. Schwieger, The urea method for the direct synthesis of
ZnAl layered double hydroxides with nitrate as the interlayer anion. Appl. Clay Sci.,
2011. 51(4): p. 452-459.
13. Cavani, F., F. Trifiro, and A. Vaccari, Hydrotalcite-type anionic clays: preparation,
properties and applications. Catal. Today, 1991. 11(2): p. 173-301.
14. Allmann, R., Double layer structures with brucite-like ions [M(II)1-
xM(III)x(OH)2]x+. Chimia, 1970. 24(3): p. 99-108.
15. Sjastad, A.O., et al., On the Thermal Stability and Structures of Layered Double
Hydroxides Mg1-xAlx(OH)2(NO3)x·mH2O (0.18 ≤ x ≤ 0.38). Eur. J. Inorg. Chem.,
2015. 2015(10): p. 1775-1788.
16. Jayakumar Karthikeyan, H.F., Anja Olafsen - Manuscript in preparation, Efficient
delamination of Layered Double Hydroxides; Effect of cationic ratio, hydration state,
anions and their orientations.
17. Bookin, A.S., V.I. Cherkashin, and V.A. Drits, Polytype diversity of the hydrotalcite-
like minerals. II. Determination of the polytypes of experimentally studied varieties.
Clays Clay Miner., 1993. 41(5): p. 558-64.
18. Giovannelli, F., et al., Magnetic properties of Ni(II)-Mn(III) LDHs. Mater. Chem.
Phys., 2012. 137(1): p. 55-60.
19. Chang, X., et al., Oxidizing synthesis of Ni2+-Mn3+ layered double hydroxide with
good crystallinity. Mater. Res. Bull., 2011. 46(11): p. 1843-1847.
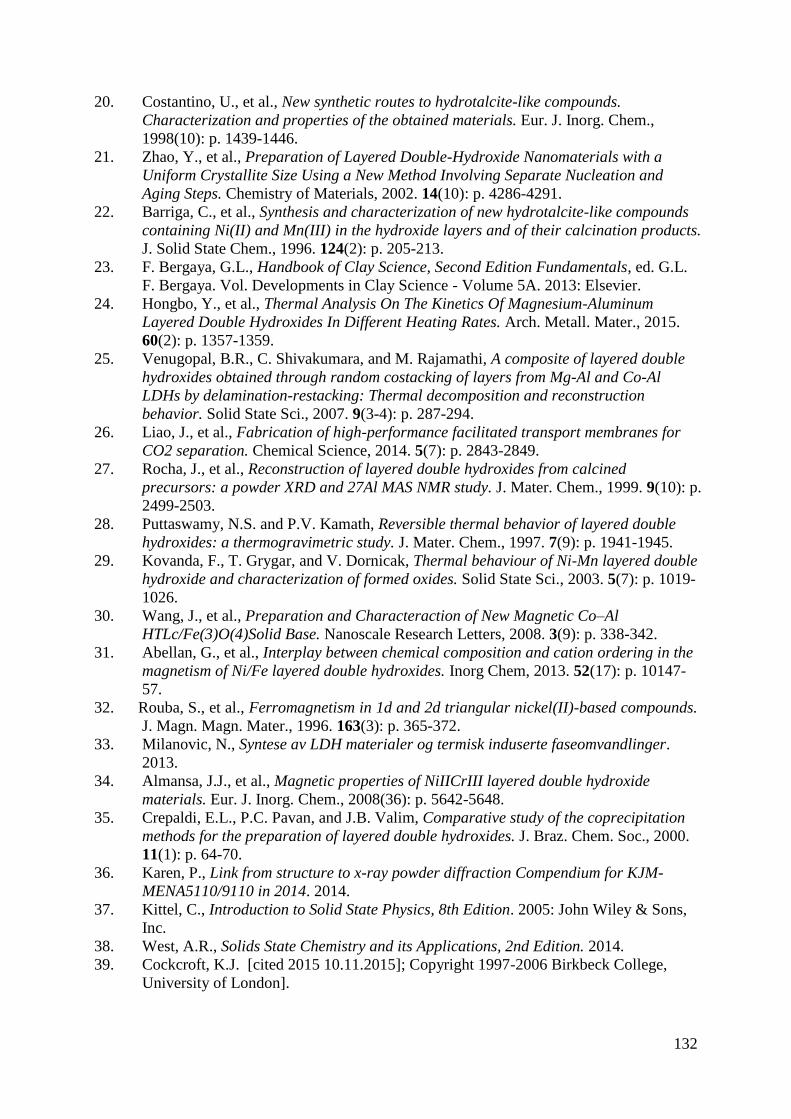
132
20. Costantino, U., et al., New synthetic routes to hydrotalcite-like compounds.
Characterization and properties of the obtained materials. Eur. J. Inorg. Chem.,
1998(10): p. 1439-1446.
21. Zhao, Y., et al., Preparation of Layered Double-Hydroxide Nanomaterials with a
Uniform Crystallite Size Using a New Method Involving Separate Nucleation and
Aging Steps. Chemistry of Materials, 2002. 14(10): p. 4286-4291.
22. Barriga, C., et al., Synthesis and characterization of new hydrotalcite-like compounds
containing Ni(II) and Mn(III) in the hydroxide layers and of their calcination products.
J. Solid State Chem., 1996. 124(2): p. 205-213.
23. F. Bergaya, G.L., Handbook of Clay Science, Second Edition Fundamentals, ed. G.L.
F. Bergaya. Vol. Developments in Clay Science - Volume 5A. 2013: Elsevier.
24. Hongbo, Y., et al., Thermal Analysis On The Kinetics Of Magnesium-Aluminum
Layered Double Hydroxides In Different Heating Rates. Arch. Metall. Mater., 2015.
60(2): p. 1357-1359.
25. Venugopal, B.R., C. Shivakumara, and M. Rajamathi, A composite of layered double
hydroxides obtained through random costacking of layers from Mg-Al and Co-Al
LDHs by delamination-restacking: Thermal decomposition and reconstruction
behavior. Solid State Sci., 2007. 9(3-4): p. 287-294.
26. Liao, J., et al., Fabrication of high-performance facilitated transport membranes for
CO2 separation. Chemical Science, 2014. 5(7): p. 2843-2849.
27. Rocha, J., et al., Reconstruction of layered double hydroxides from calcined
precursors: a powder XRD and 27Al MAS NMR study. J. Mater. Chem., 1999. 9(10): p.
2499-2503.
28. Puttaswamy, N.S. and P.V. Kamath, Reversible thermal behavior of layered double
hydroxides: a thermogravimetric study. J. Mater. Chem., 1997. 7(9): p. 1941-1945.
29. Kovanda, F., T. Grygar, and V. Dornicak, Thermal behaviour of Ni-Mn layered double
hydroxide and characterization of formed oxides. Solid State Sci., 2003. 5(7): p. 1019-
1026.
30. Wang, J., et al., Preparation and Characteraction of New Magnetic Co–Al
HTLc/Fe(3)O(4)Solid Base. Nanoscale Research Letters, 2008. 3(9): p. 338-342.
31. Abellan, G., et al., Interplay between chemical composition and cation ordering in the
magnetism of Ni/Fe layered double hydroxides. Inorg Chem, 2013. 52(17): p. 10147-
57.
32. Rouba, S., et al., Ferromagnetism in 1d and 2d triangular nickel(II)-based compounds.
J. Magn. Magn. Mater., 1996. 163(3): p. 365-372.
33. Milanovic, N., Syntese av LDH materialer og termisk induserte faseomvandlinger.
2013.
34. Almansa, J.J., et al., Magnetic properties of NiIICrIII layered double hydroxide
materials. Eur. J. Inorg. Chem., 2008(36): p. 5642-5648.
35. Crepaldi, E.L., P.C. Pavan, and J.B. Valim, Comparative study of the coprecipitation
methods for the preparation of layered double hydroxides. J. Braz. Chem. Soc., 2000.
11(1): p. 64-70.
36. Karen, P., Link from structure to x-ray powder diffraction Compendium for KJM-
MENA5110/9110 in 2014. 2014.
37. Kittel, C., Introduction to Solid State Physics, 8th Edition. 2005: John Wiley & Sons,
Inc.
38. West, A.R., Solids State Chemistry and its Applications, 2nd Edition. 2014.
39. Cockcroft, K.J. [cited 2015 10.11.2015]; Copyright 1997-2006 Birkbeck College,
University of London].
133
40. Leng, Y., Materials Characterization: Introduction to Microscopic and Spectroscopic
Methods, 2nd Edition. 2013: Wiley-VCH.
41. Young, R.A., The Rietveld Method. 1993: Oxford University Press.
42. Spaldin, N., Magnetic Materials Fundamentals and Device Applications. 2003:
University Press, Cambridge.
43. Gražulis, S., et al., Crystallography Open Database (COD): an open-access collection
of crystal structures and platform for world-wide collaboration. Nucleic Acids
Research, 2012. 40(Database issue): p. D420-D427.
44. AXS, B., DIFFRAC.EVA version 3.1, B. AXA, Editor. 2012.
45. Holeger Putz, K.B., Pearson's Crystal Data Crystal Structure Database for Inorganic
Compounds. 2009.
46. AXS, B., TOPAS. 2009.