Embed Size (px)
Citation preview

Cat. No. W373-E1-04
CX-Process Monitor
SYSMAC CS Series
WS02-LCTC1-E
(Ver. 2.60)

WS02-LCTC1-E CX-Process Monitor (Ver. 2.60)
Operation Manual
Revised December 2003

iv

!
!
!
v
Notice:OMRON products are manufactured for use according to proper procedures by a qualified operatorand only for the purposes described in this manual.
The following conventions are used to indicate and classify precautions in this manual. Always heedthe information provided with them. Failure to heed precautions can result in injury to people or dam-age to property.
DANGER Indicates an imminently hazardous situation which, if not avoided, will result in death orserious injury.
WARNING Indicates a potentially hazardous situation which, if not avoided, could result in death orserious injury.
Caution Indicates a potentially hazardous situation which, if not avoided, may result in minor ormoderate injury, or property damage.
OMRON Product ReferencesAll OMRON products are capitalized in this manual. The word “Unit” is also capitalized when it refersto an OMRON product, regardless of whether or not it appears in the proper name of the product.
The abbreviation “Ch,” which appears in some displays and on some OMRON products, often means“word” and is abbreviated “Wd” in documentation in this sense.
The abbreviation “PLC” means Programmable Controller. “PC” is used, however, in some Program-ming Device displays to mean Programmable Controller.
Visual AidsThe following headings appear in the left column of the manual to help you locate different types ofinformation.
Note Indicates information of particular interest for efficient and convenient operationof the product.
1, 2, 3... 1. Indicates lists of one sort or another, such as procedures, checklists, etc.
OMRON, 2000All rights reserved. No part of this publication may be reproduced, stored in a retrieval system, or transmitted, in anyform, or by any means, mechanical, electronic, photocopying, recording, or otherwise, without the prior written permis-sion of OMRON.
No patent liability is assumed with respect to the use of the information contained herein. Moreover, because OMRON isconstantly striving to improve its high-quality products, the information contained in this manual is subject to changewithout notice. Every precaution has been taken in the preparation of this manual. Nevertheless, OMRON assumes noresponsibility for errors or omissions. Neither is any liability assumed for damages resulting from the use of the informa-tion contained in this publication.

vi
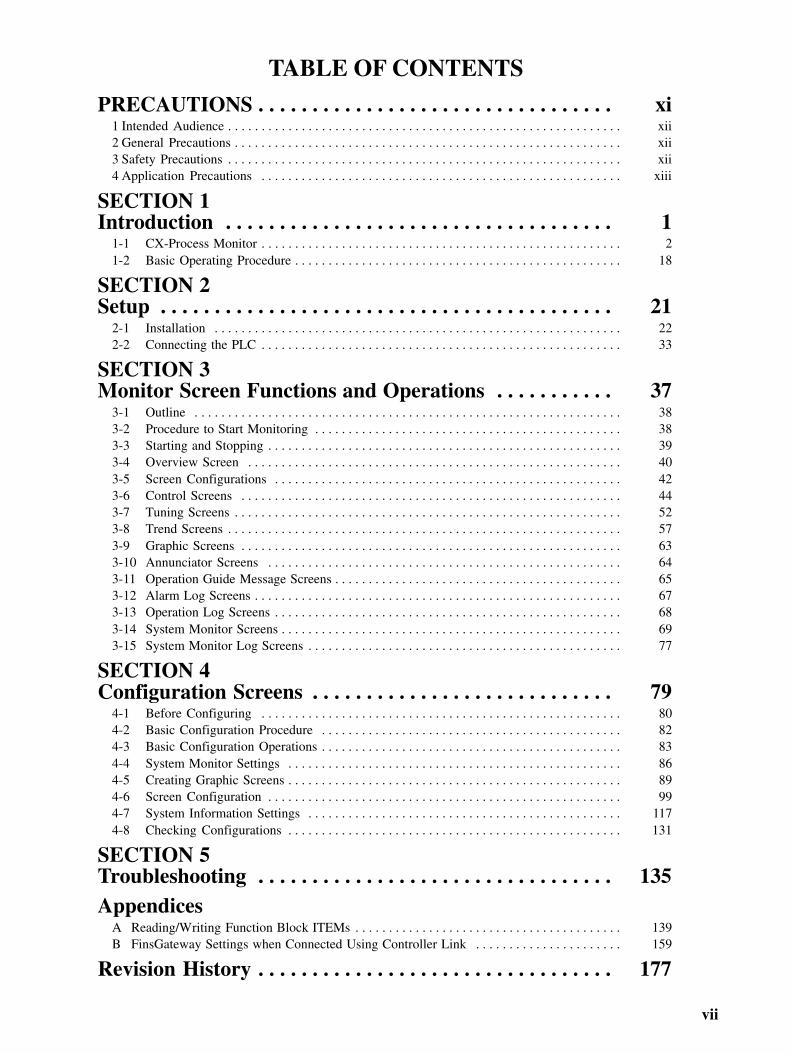
TABLE OF CONTENTS
vii
PRECAUTIONS xi. . . . . . . . . . . . . . . . . . . . . . . . . . . . . . . . . 1 Intended Audience xii. . . . . . . . . . . . . . . . . . . . . . . . . . . . . . . . . . . . . . . . . . . . . . . . . . . . . . . . . . . 2 General Precautions xii. . . . . . . . . . . . . . . . . . . . . . . . . . . . . . . . . . . . . . . . . . . . . . . . . . . . . . . . . . 3 Safety Precautions xii. . . . . . . . . . . . . . . . . . . . . . . . . . . . . . . . . . . . . . . . . . . . . . . . . . . . . . . . . . . 4 Application Precautions xiii. . . . . . . . . . . . . . . . . . . . . . . . . . . . . . . . . . . . . . . . . . . . . . . . . . . . . .
SECTION 1Introduction 1. . . . . . . . . . . . . . . . . . . . . . . . . . . . . . . . . . . .
1-1 CX-Process Monitor 2. . . . . . . . . . . . . . . . . . . . . . . . . . . . . . . . . . . . . . . . . . . . . . . . . . . . . . 1-2 Basic Operating Procedure 18. . . . . . . . . . . . . . . . . . . . . . . . . . . . . . . . . . . . . . . . . . . . . . . . .
SECTION 2Setup 21. . . . . . . . . . . . . . . . . . . . . . . . . . . . . . . . . . . . . . . . . .
2-1 Installation 22. . . . . . . . . . . . . . . . . . . . . . . . . . . . . . . . . . . . . . . . . . . . . . . . . . . . . . . . . . . . . 2-2 Connecting the PLC 33. . . . . . . . . . . . . . . . . . . . . . . . . . . . . . . . . . . . . . . . . . . . . . . . . . . . . .
SECTION 3Monitor Screen Functions and Operations 37. . . . . . . . . . .
3-1 Outline 38. . . . . . . . . . . . . . . . . . . . . . . . . . . . . . . . . . . . . . . . . . . . . . . . . . . . . . . . . . . . . . . . 3-2 Procedure to Start Monitoring 38. . . . . . . . . . . . . . . . . . . . . . . . . . . . . . . . . . . . . . . . . . . . . . 3-3 Starting and Stopping 39. . . . . . . . . . . . . . . . . . . . . . . . . . . . . . . . . . . . . . . . . . . . . . . . . . . . . 3-4 Overview Screen 40. . . . . . . . . . . . . . . . . . . . . . . . . . . . . . . . . . . . . . . . . . . . . . . . . . . . . . . . 3-5 Screen Configurations 42. . . . . . . . . . . . . . . . . . . . . . . . . . . . . . . . . . . . . . . . . . . . . . . . . . . . 3-6 Control Screens 44. . . . . . . . . . . . . . . . . . . . . . . . . . . . . . . . . . . . . . . . . . . . . . . . . . . . . . . . . 3-7 Tuning Screens 52. . . . . . . . . . . . . . . . . . . . . . . . . . . . . . . . . . . . . . . . . . . . . . . . . . . . . . . . . . 3-8 Trend Screens 57. . . . . . . . . . . . . . . . . . . . . . . . . . . . . . . . . . . . . . . . . . . . . . . . . . . . . . . . . . . 3-9 Graphic Screens 63. . . . . . . . . . . . . . . . . . . . . . . . . . . . . . . . . . . . . . . . . . . . . . . . . . . . . . . . . 3-10 Annunciator Screens 64. . . . . . . . . . . . . . . . . . . . . . . . . . . . . . . . . . . . . . . . . . . . . . . . . . . . . 3-11 Operation Guide Message Screens 65. . . . . . . . . . . . . . . . . . . . . . . . . . . . . . . . . . . . . . . . . . . 3-12 Alarm Log Screens 67. . . . . . . . . . . . . . . . . . . . . . . . . . . . . . . . . . . . . . . . . . . . . . . . . . . . . . . 3-13 Operation Log Screens 68. . . . . . . . . . . . . . . . . . . . . . . . . . . . . . . . . . . . . . . . . . . . . . . . . . . . 3-14 System Monitor Screens 69. . . . . . . . . . . . . . . . . . . . . . . . . . . . . . . . . . . . . . . . . . . . . . . . . . . 3-15 System Monitor Log Screens 77. . . . . . . . . . . . . . . . . . . . . . . . . . . . . . . . . . . . . . . . . . . . . . .
SECTION 4Configuration Screens 79. . . . . . . . . . . . . . . . . . . . . . . . . . . .
4-1 Before Configuring 80. . . . . . . . . . . . . . . . . . . . . . . . . . . . . . . . . . . . . . . . . . . . . . . . . . . . . . 4-2 Basic Configuration Procedure 82. . . . . . . . . . . . . . . . . . . . . . . . . . . . . . . . . . . . . . . . . . . . . 4-3 Basic Configuration Operations 83. . . . . . . . . . . . . . . . . . . . . . . . . . . . . . . . . . . . . . . . . . . . . 4-4 System Monitor Settings 86. . . . . . . . . . . . . . . . . . . . . . . . . . . . . . . . . . . . . . . . . . . . . . . . . . 4-5 Creating Graphic Screens 89. . . . . . . . . . . . . . . . . . . . . . . . . . . . . . . . . . . . . . . . . . . . . . . . . . 4-6 Screen Configuration 99. . . . . . . . . . . . . . . . . . . . . . . . . . . . . . . . . . . . . . . . . . . . . . . . . . . . . 4-7 System Information Settings 117. . . . . . . . . . . . . . . . . . . . . . . . . . . . . . . . . . . . . . . . . . . . . . . 4-8 Checking Configurations 131. . . . . . . . . . . . . . . . . . . . . . . . . . . . . . . . . . . . . . . . . . . . . . . . . .
SECTION 5Troubleshooting 135. . . . . . . . . . . . . . . . . . . . . . . . . . . . . . . . . Appendices
A Reading/Writing Function Block ITEMs 139. . . . . . . . . . . . . . . . . . . . . . . . . . . . . . . . . . . . . . . . B FinsGateway Settings when Connected Using Controller Link 159. . . . . . . . . . . . . . . . . . . . . .
Revision History 177. . . . . . . . . . . . . . . . . . . . . . . . . . . . . . . . .

ix
About this Manual:
This manual describes the installation and operation of the WS02-LCTC1-E CX-Process Monitor soft-ware package and includes the sections described below. The CX-Process Monitor is used to control andmonitor the operation of the CS1W-LC001 Loop Control Unit.
Please read this manual carefully and be sure you understand the information provided before attemptingto install and operate the CX-Process Monitor. Please read the following manuals carefully and be sureyou understand the information provided before setting up or using an application for a Loop Control Unit.
Product Manual name Cat. No. Contents
WS02-LCTC1-ECX-Process Tool
CX-Process Tool Operation Manual
W372 Installation and operation proceduresfor the CX-Process Tool.
WS02-LCTC1-ECX-Process Monitor
CX-Process MonitorOperation Manual
W373 (this manual)
Installation and operation proceduresfor the CX-Process Monitor.
CS1W-LC001 Loop Control Unit
Loop Control UnitOperation Manual
W374 Installation and operation proceduresfor the Loop Control Unit (except forfunction blocks).
Loop Control Unit Function BlockReference Manual
W375 Detailed information on functionblocks.
Section 1 introduces the CX-Process Monitor.
Section 2 describes installing the CX-Process and connections to the PLC.
Section 3 describes the monitor screens used with the CX-Process Monitor.
Section 4 describes operating procedures to create screens and monitor using the CX-Process Monitor.
Section 5 describes errors that can occur while using the CX-Process Monitor.
Appendices are provided containing a list of ITEM settings for function blocks and FinsGateway settingsto connect to the PLC using Controller Link.
WARNING Failure to read and understand the information provided in this manual may result inpersonal injury or death, damage to the product, or product failure. Please read eachsection in its entirety and be sure you understand the information provided in the sectionand related sections before attempting any of the procedures or operations given.
!

xi
PRECAUTIONS
This section provides general precautions for using the CX-Process Monitor.
The information contained in this section is important for the safe and reliable application of the CX-Process Monitor.You must read this section and understand the information contained before attempting to set up or operate the CX-Process Monitor.
1 Intended Audience xii. . . . . . . . . . . . . . . . . . . . . . . . . . . . . . . . . . . . . . . . . . . . . . . . . . . . . . . . . . . . 2 General Precautions xii. . . . . . . . . . . . . . . . . . . . . . . . . . . . . . . . . . . . . . . . . . . . . . . . . . . . . . . . . . . 3 Safety Precautions xii. . . . . . . . . . . . . . . . . . . . . . . . . . . . . . . . . . . . . . . . . . . . . . . . . . . . . . . . . . . . 4 Application Precautions xiii. . . . . . . . . . . . . . . . . . . . . . . . . . . . . . . . . . . . . . . . . . . . . . . . . . . . . . . .

!
!
!
4Safety Precautions
xii
1 Intended AudienceThis manual is intended for the following personnel, who must also have knowl-edge of electrical systems (an electrical engineer or the equivalent) and knowl-edge about instrumentation system.• Personnel in charge of installing FA systems.• Personnel in charge of designing FA systems.• Personnel in charge of managing FA systems and facilities.
2 General PrecautionsThe user must operate the product according to the performance specificationsdescribed in the operation manuals.Before using the product under conditions which are not described in the manualor applying the product to nuclear control systems, railroad systems, aviationsystems, vehicles, combustion systems, medical equipment, amusement ma-chines, safety equipment, petrochemical plants, and other systems, machines,and equipment that may have a serious influence on lives and property if usedimproperly, consult your OMRON representative.Make sure that the ratings and performance characteristics of the product aresufficient for the systems, machines, and equipment, and be sure to provide thesystems, machines, and equipment with double safety mechanisms.This manual provides information for programming and operating the Unit. Besure to read this manual before attempting to use the Unit and keep this manualclose at hand for reference during operation.
WARNING It is extremely important that a PLC and all PLC Units be used for the specifiedpurpose and under the specified conditions, especially in applications that candirectly or indirectly affect human life. You must consult with your OMRONrepresentative before applying a PLC System to the above-mentionedapplications.
3 Safety PrecautionsWARNING Check the following items before starting Loop Control Unit operation:
Analog I/O Units used in combination with the Loop Control Unit must bemounted correctly, and the unit number set on the front panel of the Analog I/OUnit must be the same as the unit number set on the Field Terminal FunctionBlock. If the unit numbers are not the same, I/O (read/write) will be performed onthe data for another Special I/O Unit (i.e., the one whose unit number is set in theField Terminal Function Block).The initial settings of the System Common Block on the Loop Control Unit mustbe set correctly. In particular, make sure that the Data Memory for the Node Ter-minals in the CPU Unit controlling the Loop Control Unit is not used for other ap-plications on the PLC. If the same words in Data Memory are used for more thanone application, the PLC system may act unexpectedly and cause injury.When writing data to the I/O memory in the CPU Unit with function blocks (e.g.,using Send All Blocks, Expanded DO/AO Terminal to CPU Unit, or DO/AO Ter-minal to CPU Unit), be sure that the words written to in the I/O memory are notbeing used for any other purpose. If I/O memory words are allocated to morethan one purpose, the PLC system may act unexpectedly and cause injury.
WARNING Do not perform processing in such a way that the Loop Control Unit and CPUUnit write to identical I/O memory words allocated to a contact output or analogoutput of an external Unit. If the same words are written to, the externallyconnected loads may act unexpectedly and cause injury.

!
!
!
!
!
!
!
!
!
4Application Precautions
xiii
Caution Before transferring function block data (initial setting data or operation data) tothe Loop Control Unit, confirm that the destination for the data is correct and alsoconfirm the overall safety of the system (including the Loop Control Unit). Notdoing so may result in unexpected operation.
4 Application PrecautionsObserve the following precautions when using CX-Process Tool.
Caution Loop Control Unit data is monitored and operated using CX-Process Monitorbased on the monitor tag files created using CX-Process Tool. CX-Process Toolcan be used on Microsoft Windows 95, 98, Me, 2000, or NT (Service Pack 4 orlater). When creating monitor tag files using CX-Process Tool, CX-ProcessMonitor must be installed on the same computer.
Caution Before using function block data in actual operation, confirm operation by moni-toring run status (to check the load rate; select Execute/Operation/MonitorRun Status) and validating actions (select Validate Action/Start) with CX-Pro-cess Tool. In particular, be sure to confirm that the load rate will be less than 60%.(For details on the load rate, refer to the Loop Control Unit Operation Manual.)
Caution The Loop Control Unit can read and write I/O memory in the CPU Unit using theField Terminal Function Blocks or CPU Terminal Blocks independent of the userprogram (Step Ladder Program) in the CPU Unit. Do not write to the same I/Omemory words from both the Loop Control Unit and the CPU Unit.
Caution To hold an analog output or contact output at a specific value (for example, themaximum value or minimum value) when the Loop Control Unit stops running,create a Step Ladder Program in the CPU Unit so that the corresponding outputbit allocated to Analog Output Unit or Contact Output Unit is set to the desiredvalue using an NC condition of the Loop Control Unit Running Flag (bit 00 in allo-cated CIO word “n”) as an input condition.
Caution If a fatal error occurs in the CPU Unit (including fatal errors created by executionof an FALS instruction), the Loop Control Unit will also stop running. To hold ana-log outputs to the previous values before the stop occurred, and to set analogoutputs to either the minimum value or maximum value, use the output holdfunction of the Analog Output Unit or Analog I/O Unit.
Caution Before turning ON the power to the PLC, make sure that the facilities are safe.The analog output values and contact outputs from the Loop Control Unit areupdated when the power to the PLC is turned ON regardless of the operatingmode of the CPU Unit (including in the PROGRAM mode). (Internally, the analogoutput values and contact outputs are sent from the CPU Unit to Basic I/O Unitsand Analog Output Units.)
Caution Fail-safe measures must be taken by the customer to ensure safety in the eventof incorrect, missing, or abnormal signals caused by broken signal lines, mo-mentary power interruptions, or other causes.
Caution Confirm that no adverse effect will occur in the system before attempting any ofthe following:

!
!
4Application Precautions
xiv
• Changing the operating mode of the PLC
• Force-setting/force-resetting any bit in memory
• Changing the present value or any set value in memory
Caution Be sure that all mounting screws, terminal screws, and cable connector screwsare tightened to the torque specified in the user manuals. Incorrect tighteningtorque may result in malfunction.
Caution In the event of system or power failure, CX-Process function files (extension“.ist”) may not be saved. It is recommended that function files are saved regu-larly.

1
SECTION 1Introduction
This section introduces the CX-Process Monitor.
1-1 CX-Process Monitor 2. . . . . . . . . . . . . . . . . . . . . . . . . . . . . . . . . . . . . . . . . . . . . . . . . . . . . . . 1-1-1 Outline 2. . . . . . . . . . . . . . . . . . . . . . . . . . . . . . . . . . . . . . . . . . . . . . . . . . . . . . . . . . 1-1-2 Screen Outlines 4. . . . . . . . . . . . . . . . . . . . . . . . . . . . . . . . . . . . . . . . . . . . . . . . . . . 1-1-3 CX-Process Monitor System Requirements 9. . . . . . . . . . . . . . . . . . . . . . . . . . . . . 1-1-4 Relationship to CX-Process Tool 10. . . . . . . . . . . . . . . . . . . . . . . . . . . . . . . . . . . . . . 1-1-5 Relation between Screens and Function Blocks 12. . . . . . . . . . . . . . . . . . . . . . . . . . 1-1-6 Monitor Software Specifications 13. . . . . . . . . . . . . . . . . . . . . . . . . . . . . . . . . . . . . . 1-1-7 CX-Process Monitor Setting and Monitoring Capabilities 17. . . . . . . . . . . . . . . . . . 1-1-8 Version Changes 17. . . . . . . . . . . . . . . . . . . . . . . . . . . . . . . . . . . . . . . . . . . . . . . . . .
1-2 Basic Operating Procedure 18. . . . . . . . . . . . . . . . . . . . . . . . . . . . . . . . . . . . . . . . . . . . . . . . . .

1-1SectionCX-Process Monitor
2
1-1 CX-Process Monitor
1-1-1 OutlineThe CX-Process Monitor is a Windows NT/2000/XP-based application thatmonitors the Function Block data within the Loop Control Unit using selection,Control screen (on-site instrument image), Trend screen, Graphic screen, andAnnunciator screen, etc., via the Controller Link, serial communications, or anEthernet. The CX-Process Monitor uses settings and the CX-Process Tool tocreate function blocks within Loop Control Units.
Note To use the CX-Process Monitor, you also need License key WS02-LCTK1-EL01(sold separately). In addition to installing the CX-Process Monitor, make sure tofirst connect License key WS02-LCTK1-EL01 to the IBM PC/AT or compatibleprinter port, and then install the License key driver before using the CX-ProcessMonitor. Also, when using the CX-Process Monitor, make sure that the Licensekey WS02-LCTK1-EL01 is always connected to the printer port.
You can also perform the following four functions.
Monitor PV, SP, and MV, etc., within the Control Block, monitor analog signals,and monitor contact signals.
Perform Run/Stop instructions in the Loop Control Unit.
Display the status of the CPU Unit, such as the current operating mode.
Change settings, switch between auto and manual, and perform manual opera-tions, tune PID constants, etc., in the Control Block.
You can perform stop block operation commands for each Control Block (whenusing the Tuning screen).
Display Control Block and Alarm Block alarms if they occur, and store the alarmsin the alarm history.
You can configure the screen to suit your needs.
Monitoring FunctionBlocks in a Loop ControlUnit
Controlling FunctionBlocks in a Loop ControlUnit
Monitoring FunctionBlock Alarm Status in aLoop Control Unit
Configuring CX-ProcessMonitor Screens

1-1SectionCX-Process Monitor
3
CX-Process Monitor Functions
--- Screen Monitoring operatingstatus
Controlling operation Monitoring alarmstatus
User-defined Overview --- --- OKscreens Control OK (Display PV bar) OK (Change SP, switch
between auto/manual,and perform manualoperations)
OK
Tuning OK (Display PV, SP, andMV trends for 1 loop)
OK (Change SP, andchange P, I, D, etc.)
OK (Change bar graphcolors)
Trend OK (Display ControlBlock or analog signaltrends)
--- OK
Graphic OK (Display status forcontact or analog signalgraphics)
OK (Turn ON/OFF thecontact, and set theanalog value)
OK
Annunciator --- --- OK (Use colors or soundto notify of an alarm)
OperationGuide Message
OK (Display messagewhen Internal Switch isturned ON)
--- OK
System Monitor OK (Display the run/stopstatus for the LoopControl Unit, displayExecution errors, RAMchecksum errors, andbattery errors, andmonitor the status of theCPU Unit control mode,etc.)
OK (Run/stop commandfor the Loop ControlUnit)
OK
System screens Alarm Log --- --- OK (Stored when analarm occurs)
Operation Log --- OK (Stores run operationhistory; e.g., SP change,etc.)
OK
System MonitorLog
OK (Displays run/stopcommand history andExecution error historywhen an error occurs)
--- OK
Note If License key WS02-LCTK1-JL01 is not connected to the IBM PC/AT or compat-ible printer port, or even if it is connected, if the License key driver is not installed,you cannot use the following monitor screens or configuration screens. (If you tryto switch to the following screens, an error message will be displayed.)
Monitor Screens
Item ScreenUser-defined screens Trend Screens
Graphic Screens
Operation Guide Screens
System screens Alarm Log Screensy
Operation Log Screens
System Monitor Log Screens
Configuration Screens
Item Screen
Created using GraphicBuilder Button
Graphic Screen Create Window

1-1SectionCX-Process Monitor
4
1-1-2 Screen Outlines
Overview ScreenPossesses the functions of all menu screens and alarm display screens.
Control ScreensMonitor and set the Control Block and part of the Operation Block, monitor ana-log signals, and monitor and set contact signals.

1-1SectionCX-Process Monitor
5
Tuning ScreensUse this screen to change Control Block P, I, D constants specified using SendTerminals per block addressed to the computer.
Trend ScreensDisplay as an image changes due to the passage to time of the Control Block PV,SP, MV, or other analog signals.

1-1SectionCX-Process Monitor
6
Graphic ScreensUse the screen to display the device status as a schematic.
Annunciator ScreensUse this screen to display comprehensively the status (mainly the alarm status)of the contacts.

1-1SectionCX-Process Monitor
7
Operation Guide ScreensUse this screen to display registered messages when the contact signal is ON.
Alarm Log ScreensUse this screen to display the alarm history.

1-1SectionCX-Process Monitor
8
Operation Log ScreensUse this screen to display the operation history.
System Monitor ScreensUse this screen to display the system status, and run/stop the Loop Control Unit.

1-1SectionCX-Process Monitor
9
System Monitor Log ScreensUse this screen to display the run/stop history and Execution error history, and torecord the time at which they occurred.
1-1-3 CX-Process Monitor System RequirementsAs shown below, the CX-Process Monitor uses the communications driver Fins-Gateway Version 3 (Embedded version) to communicate with the PLC (Pro-grammable Controller) mounted to the Loop Control Unit.
Software
Hardware
CX-Process Tool CX-Process Monitor
FinsGateway Version 3 (Embedded version)
RS-232C port Controller Link Support Board Ethernet board
You can use any one of the FinsGateway Version 3 (Embedded version) givenbelow.• Serial Unit driver• Controller Link driver• CLK (PCI) driver• ETN_UNIT driver
The CX-Process Monitor reads/writes data within the Loop Control Unit via theTag names of Execution blocks addressed to the IBM PC/AT or Compatible setusing the CX-Process Tool. Consequently, when using the CX-Process Monitor,you must first set items 1 to 3 below, using on the CX-Process Tool.
1, 2, 3... 1. Register the Function Block to Exchange Data with the CX-Process Monitor.Specify a Function Block, analog signal (including parameters), or contactsignal (including parameters) as the source, depending on the Send Termi-nal to Computer Block (Block Models 401 to 404), using on the CX-ProcessTool. Also, prepare to receive analog signals or contact signals from the IBMPC/AT or compatible using on the IBM PC/AT or compatible AO setting orDO Terminal Block setting.
2. Set the Tag Name.Next, set the Tag name for the Function Block, analog signal (including pa-rameters), or contact signal (including parameters) you have set as the
FinsGateway Version 3
Creating Monitor TagFiles Using CX-ProcessTool

1-1SectionCX-Process Monitor
10
source, using the CX-Process Tool. Also, set the Tag name for the analogoutput or contact output for the IBM PC/AT or compatible AO setting or DOTerminal setting. At the same time, you must set the zero point, span point,decimal point location, and the engineering units scaling for the analog sig-nals (including parameters).
3. Compile Tag Files for the CX-Process Monitor.Compile Tag files to pass Tag data to the CX-Process Monitor. The Tag filesmust be complied using the CX-Process Tool installed on the same comput-er as the CX-Processor Monitor.
Note Monitor Tag files are stored in the following directory with fixed filenames.
Directory: Omron/CX-Process Monitor/db (The underlined part is the direc-tory in which the CX-Process Monitor is installed.)File name: mtagmst, and mtagsubmstIt is possible to create multiple Monitor Tags and switch between them. Fordetails, refer to 4-6 Screen Configuration.
The network address, node address, and unit address for communications be-tween the CX-Process Monitor and PLC using the CX-Process Tool addresssettings (Setting/Network).
Note 1. Be aware that you cannot start CX-Process Monitor if FinsGateway Version3 (Embedded version) is not installed.
2. CX-Process (Monitor and Tool) cannot use FinsGateway Version 1 as acommunications driver. Be sure to use Version 3.
3. If CX-Programmer, CX-Protocol, CX-Motion, or other Support Software(i.e., CX-Server communications software), or applications that use specialserial drivers, are connected online, they use the same COM port, so CX-Process (Monitor and Tool) cannot connect online (i.e., initialize serial com-munications) using the Host link (SYSMAC WAY). First disconnect offlineother Support Software or applications that use special serial drivers, beforereconnecting online (i.e., initializing serial communications) CX-Process.Conversely, while CX-Process is connected online (i.e., initializing serialcommunications), other Support Software that communicate using CX-Server cannot connect online.
4. You cannot install CX-Process and FinsGateway Version 1 on the same IBMPC/AT or compatible.
5. If using Windows NT 4.0 as your OS, you must use Service Pack 4 or later.6. FinsGateway Version 3 (Embedded version) is bundled with CX-Process,
but you can also use FinsGateway Version 3 (Runtime version). If FinsGate-way Version 3 (Runtime version) is already installed, you do not need toinstall FinsGateway Version 3 (Embedded version).
1-1-4 Relationship to CX-Process Tool(As shown earlier in CX-Process Monitor Conditions of Use, if monitoring or op-erating Function Blocks using CX-Process monitor, you must first compile Tagnames and Monitor Tag files using CX-Process Tool. Also, CX-Process Monitorhandles all items allocated Tag names as one string. CX-Process Monitor doesnot differentiate which Function Block was used to specify the Tag names; Sendto Computer Block, DO/AO Terminal to all Nodes Block, or DO/AO Terminal Set-tings from Computer Block. (In Tuning screen, however, you can use only theFunction Block specified using 1-Block Send Terminal to Computer.
Function block ITEMs are set as shown in the following table. The CX-ProcessTool is normally used to set initial data S and the CX-Process Monitor is normallyused to set operation data O.
Set Network Address,Node Address, and UnitAddress UsingCX-Process Tool
Tag Names
ITEM Settings

1-1SectionCX-Process Monitor
11
CX-Process Tooldata classification
Type ITEM Example: PID Block CX-ProcessTool
CX-ProcessMonitor
Initial settings S Initial setting parameterfor each function block
Forward/Reverse direction,SP setting method,compensation method, etc.
Set Cannot beset
Operation data O Operation parametersfor each function block
Example: PID Block SP,alarm settings, PIDconstants, etc.
Set in specialcases
Set
Note Initial settings O and operation data S classifications are displayed on ITEM Set-ting Screens of the CX-Protocol Tool. For details on the ITEMs set each functionblock, refer to the Function Block Reference Manual.
Example
ITEM type ITEM Contents R: Read, W: Write, R/W: Read/write, ---: R/W disabled
r, t/w: CX-Process Tooloperation monitor/Operation
monitor read and write(S): Initial setting, (O): Operation data
CX-ProcessTool
CX-ProcessMonitor
Parameter 004 Operation cycle (s) R/W (S) ---
Parameter 008 High/Low alarm R/W (O) R/W
012 Hysteresis set value R/W (S) ---
Parameter 023 Local SP set value R/W (O) R/W
024 SP set method (Initial setting)0: Local, 1: Remote/Local
R/W (S) R
Note Analog values are normally set with the CX-Process Monitor. They can be setwith the CX-Process Tool provided that they are in percentage increments be-tween 0% and 100%. Scaling engineering units cannot be set with the CX-Pro-cess Tool.

1-1SectionCX-Process Monitor
12
1-1-5 Relation between Screens and Function Blocks
The relation between screens and function blocks is shown below.
Screen 1-BlockSend to
Computer(403)
4-Block Send toComputer (404)
AO toComputer(402), AO
Terminal toAll Nodes
(408)
DO toComputer(401), DO
Terminal toAll Nodes
(407)
AOTerminalSettings
fromComputer
(410)
DOTerminalSettings
fromComputer
(409)
User-defined
OverviewScreen
--- --- --- --- --- ---de edscreens Control
ScreensBasic PID,AdvancedPID, batchflowratecapture (Seenote),Indication andSetting,Indication andOperation,Ratio Setting,Indicator,2-PositionON/OFF,3-PositionON/OFF,blended PID
Basic PID, AdvancedPID, Indication andSetting, Indication andOperation, RatioSetting, Indicator,2-Position ON/OFF,3-Position ON/OFF,High/Low Alarm,Segment Program 2,ON/OFF ValveManipulator, MotorManipulator,Reversible MotorManipulator, MotorOpening Manipulator,Timer, Counter
Analogsignal oranalogvalueparameters
Contactsignal orcontactparameters
Analogoutput
Contactoutput
TuningScreens
(As above) Segment Program 2 --- --- --- ---
TrendScreens
(As above)(PV, SP, MVonly)
Basic PID, AdvancedPID, Indication andSetting, Indication andOperation, RatioSetting, Indicator,2-Position ON/OFF,3-Position ON/OFF(PV, SP, MV only),Segment Program 2,ON/OFF ValveManipulator, MotorManipulator,Reversible MotorManipulator, MotorOpening Manipulator
Analogsignal oranalogvalueparameters
Contactsignal orcontactparameters
Analogoutput
Contactoutput
GraphicScreens
Tag ITEMs asabove
Same tag ITEMs as forControl screens.
Analogsignal oranalogvalueparameters
Contactsignal orcontactparameters
Analogoutput
Contactoutput
AnnunciatorScreens
Contactswithin tagITEMs asabove
Same tag ITEMs as forControl screens.
--- Contactsignal orcontactparameters
--- Resendcontactoutput
OperationGuideMessageScreens
--- --- --- Contactsignal orcontactparameters
--- Resendcontactoutput
SystemMonitorScreens
--- --- --- --- --- ---

1-1SectionCX-Process Monitor
13
Screen DOTerminalSettings
fromComputer
(409)
AOTerminalSettings
fromComputer
(410)
DO toComputer(401), DO
Terminal toAll Nodes
(407)
AO toComputer(402), AO
Terminal toAll Nodes
(408)
4-Block Send toComputer (404)
1-BlockSend to
Computer(403)
Systemscreens
Alarm LogScreens
Alarms onlywithin TagITEMs asabove
Same as alarm tagITEMs as for Controlscreens.
--- --- --- ---
OperationHistoryScreens
--- --- --- --- --- ---
SystemMonitor LogScreens
--- --- --- --- --- ---
Note Be sure to send Batch Flowrate Capture (014) and Blended PID (013) using1-Block Send Terminal to Computer (403). You can specify batch flowrate cap-ture (014) and blended PID (013) as the send source for 4-Block Send Terminalto Computer (404) using CX-Process Tool. You cannot monitor batch flowratecapture sent using 4-Block Send Terminal to Computer (404) using CX-ProcessMonitor, however.
1-1-6 Monitor Software Specifications
CX-Process Monitor Specifications
Item Descriptions
Product name CX-Process Monitor
Model WS02-LCTC1
Applicable PLC-series CS1-series
Applicable Unit Loop Control Unit
Applicable Personal computer PC AT or compatibleppcomputer CPU Min. required: Pentium MMX233 MHz or faster, Recommended: Pentium
Celeron 400 MHz or faster
OS Microsoft Windows NT4.0 Service Pack 4 or later, Windows 2000, orWindows XP (Windows 95 and 98 cannot be used.)
Memory Min. required: 96 Mbytes, Recommended: 128 Mbytes or more
Hard disk drive Min. required: 400 Mbytes of free space, Recommended: 500 Mbytes ormore of free space
Monitor Min. required: XGA, Recommended: XGA or higher, min. 1024 x 768 dots,256 colors
CD-ROM drive At least one
Mouse Recommended: Microsoft mouse or compatible pointing device
Printer (See note.) Any printer supported by Microsoft Windows.
Sound board 1 board
Required software One of the FinsGateway Version 3 (Embedded version) drivers given belowmust be installed on the computer.
Serial Unit driver (Host Link)Controller Link driver (Controller Link)CLK (PCI) driver (Controller Link, PCI bus)ETN_UNIT driver (Ethernet)

1-1SectionCX-Process Monitor
14
Item DescriptionsConnectingmethod
Connection with CPU Unit(or Serial CommunicationsBoard/Unit)
UsingFinsGatewaySerial Unitversion
The computer is connected to the CPU Unit peripheral portsor integrated RS-232C port, or RS-232C port of the SerialCommunications Unit. (Only a 1:1 connection is possible.)
– Connector cable:
When connecting to the CPU Unit peripheral ports: ModelCS1W-CN��� (2 m, 6 m)
When connecting to the CPU Unit’s RS-232C port: ModelXW2Z���-� (2 m, 5 m)
– Communications protocol with PLC: Host Link (notsupported on Peripheral bus)
Connection via ControllerLink
UsingFinsGatewayCLK (PCI)Driver
Install the driver in a computer equipped with a Controller LinkSupport Board (PCI slot) to support communications betweenthe computer and PLCs equipped with a Controller Link Unit.
UsingFinsGatewayControllerLink driver
Install the driver in a computer equipped with a Controller LinkSupport Board (ISA slot) to support communications betweenthe computer and PLCs equipped with a Controller Link Unit.
Connection via Ethernet UsingFinsGatewayETN_UNITdriver
Install the FinsGateway ETN_UNIT driver on the computer onwhich an Ethernet board is mounted to enable to enablecommunications with the PLC on which the Ethernet Unit ismounted.
Loop Control Unit data specificationmethod
Function blocks, analog signals and contact signals (including parameters)that are designated as the source by the Send to Computer blocks (BlockModels 401 to 404) are appended a tag name by the CX-Process Tool.Specify this tag name to specify the Loop Control Unit data.
Data exchange method with CPU Unitd L C l U i
Mode name Description Connection methodgmounted on Loop Control Unit On-demand read
mode:CX-Process Monitor readsthe data in the terminal tocomputer send areawhenever necessary.
One of Host Link, Ethernetor Controller Link
Data Link mode: CX-Process Monitor readsthe terminal to computersend area at all times bythe Controller Link datalink.
Only Controller Link ispossible
Offline operation functions Prepare the user configuration screen for use in the online operation screen.

1-1SectionCX-Process Monitor
15
Item DescriptionsOnlineoperationfunctions
User Con-figurationscreen
Overviewscreen
Place buttons for progressing to the Control screen, Trend screen and otherscreens. 4 columns and 8 lines are displayed on each screen (max. 32screens).
Controlscreen
Control blocks such as the PID blocks and Indication blocks, and someOperation blocks are displayed for up to 8 loops in a single screen in the formof a field device. The maximum number of screens is 400.
This screen displays the Set Point, PV and MV numeric values, displays PVas a bar graph, and can be used for changing Set Point, MAN and othersetting values. The color of bar graphs changes when an alarm occurs.
You can progress to the Tuning screen from the Control screen.
Fine tuning according to the degree specified by the user is possible for PIDconstants.
Tuningscreen
This screen is for setting P, I, D parameters in Control blocks such as the PIDblocks, and for setting alarm setting values. PV, Set Point and MV can betuned while their trends are monitored. The maximum number of screens is3200.
Run stop/stop cancellation are possible on each function block.
Note Only the Control block that is designated as the source at the 1-BlockSend Terminal to Computer block can be registered.
Trendscreen
The analog signals (analog values such as the Control block Set Point, PVand MV, and other analog values) input from the terminals to the computerare collected at a fixed cycle and saved to a file. If necessary, up to 8 analogsignals can be displayed on one screen in the form of a multi-dot recorder.Data collected(logger function)
Real time trend
12 hour’s of data is savedat 10-second cyclesappended with up to 480tags.
Output possible in CSVformat.
Data can be saved in CSVformat either using buttoncommands, orautomatically at a setinterval (every 1, 2, 3, 4, 6,8, 10, 12, 18, 20, 24, 48,72, 96, 120, or 240 hours)
Historic trend
10 day’s of data is savedat 1-minute cyclesappended with up to 960tags.
Output possible in CSVformat.
Data display Horizontal (time) axis: 2, 4, 8, 12 and 24 hour time unitscan be scrolled
Vertical (8-point common) axis: Graduation can beenlarged by a factor or 1, 2, 5 and 10.
Data is displayed from the time when the specifieddisplay start time is reached.
Display color: red, yellow, green, blue, magenta, purple,cyan, white

1-1SectionCX-Process Monitor
16
Item DescriptionsOnlineoperationfunctions
User Con-figurationscreen
Graphicscreen
This screen displays changes in the plant status using graphic elementsrepresenting plant devices pasted to the screen from the graphic elementslibrary (provided with the CX-Process Monitor). The maximum number ofscreens is 200.
Fixed graphic elements provided in library: Devices, thermometers,transmitters, orifices, text
Variable graphic elements provided in library:
Analog input: Bar graph display, numeric indication, tanks
Analog output: Numeric setting (by AO Terminal Settings from Computerblock)
Contact input: Pumps, valves, indicators
Contact output: Switches (by DO Terminal Settings from Computer block)
Annunciatorscreen
This screen notifies the operator of alarms or errors that occur by changingthe display color and emitting sound. At the same time, a 32-charactermessage is displayed over two lines on screen elements.
A total of 16 screen elements (4 columns x 4 lines) can be displayed on eachscreen. The maximum number of screens is 5.
OperationGuideMessagescreen
This screen displays pre-registered 128-character messages over two linestogether with the date of occurrence when the specified internal switch is setto ON.
Max. number of registerable messages: 100, Number of display colors: 7
Up to 1000 messages are displayed in a single screen.
Output possible in CSV format.
Onlineoperationfunctions
SystemFixedscreen
Alarm Logscreen
A record of alarms (time of error occurrence, tag name, PV or MV currentvalue at occurrence, alarm type, etc.) that occur and that are input from theControl and Alarm blocks is saved and displayed as a list later.
Up to 1000 alarm messages are displayed in a single screen.
Output possible in CSV format.
OperationLog screen
A record of changes (date and time of change, tag name, original ITEM datasetting, new ITEM data setting, etc.) made to ITEM data on the Loop ControlUnit in the Control or Tuning screen is saved and displayed as a list later.
Up to 1000 operation messages are displayed in a single screen.
Output possible in CSV format.
SystemMonitorscreen
This screen displays the Loop Control Unit operation run/stop commands,operation start/stop status, execution errors, RAM sum errors, battery errors,and the status of the Controller Link Data Link.
SystemMonitor Logscreen
This screen displays a log of the run/stop history and a history of executionerrors that occur on the Loop Control Unit together with the date ofoccurrence.
Output possible in CSV format.

1-1SectionCX-Process Monitor
17
1-1-7 CX-Process Monitor Setting and Monitoring CapabilitiesTarget Function Block Read using
CX-ProcessMonitor
Written usingCX-Process
Monitor
Control Block (and part ofOperation Block) Tag ITEMs(See note 1)
1-Block Send Terminal to Computer (403) or4-Block Send Terminal to Computer (block 404)
OK OK
Contact signal (includingparameters) or analog signal(including parameters)
DO Terminal Settings from Computer (block401)/AO Terminal Settings from Computer (block402), or DO Terminal to all nodes (block 407)/AOTerminal to all nodes (block 408)
OK Not possible
Contact output or analogoutput
DO Terminal Settings fromComputer (block 409), AO
S
Resend signalto Network ON
OK OKou pu Co pu e (b oc 09), O
Terminal Settings fromComputer (block 410)
Resend signalto network OFF
Not possible(You cannot useCX-ProcessMonitor whenresend signal isOFF)
OK
Note 1. Refer to Appendix A ITEM Settings for Function Blocks for which tag ITEMsyou can monitor and set using CX-Process Monitor for Function Blocks spe-cified as send source using 1-Block Send Terminal to Computer or 4-BlockSend Terminal to Computer.
2. Using CX-Process Monitor, you can monitor and set only the data givenabove to which Tag names have been allocated. Also, be sure to use CX-Process Tool to make Tag name settings.
3. If using Tuning screen, be sure to use 1-Block Send Terminal to Computer(403). You cannot register data on the Tuning screen using 4-Block SendTerminal to Computer.
4. The Control Block and part of the Operation Block (with 4-Block Send Termi-nal to Computer) are the only Function Blocks that can send to CX-ProcessMonitor using 1-Block Send Terminal to Computer or 4-Block Send Terminalto Computer. Also, ITEMs within these blocks are determined beforehandfor each Function Block as the default. (Fixed names called Tag ITEMs areallocated to each ITEM.) To send other ITEMs (contact or analog value pa-rameters) to CX-Process Monitor, specify the required ITEM as the sendsource using DO to Computer or AO to Computer (or DO Terminal to allnodes or AO Terminal to all nodes).
1-1-8 Version Changes
Version 2.50 to 2.60The following functions have been added to the CX-Process Monitor with theupgrade from Ver. 2.50 to Ver. 2.60.
• Alarms can be selected to sound at recovery (recovery alarm setting).
• Tag ITEMs MHA and MLA can be selected to function as warnings (MHA, MLAalarm setting).
• The alarm sound can be stopped for a specified tag (alarm stop function).
• The Next/Prev. Buttons can be set to move in Block Database registration or-der or Builder Window display order (page order function)
• The number of messages that can be registered as alarm messages has beenexpanded from 50 to 2,000.
• The Trend Screen has been changed.
• The pen can be changed, deleted, or added in the Trend Screen without hav-ing to shut down Monitor Plus (changing online trend definitions).
1-2SectionBasic Operating Procedure
18
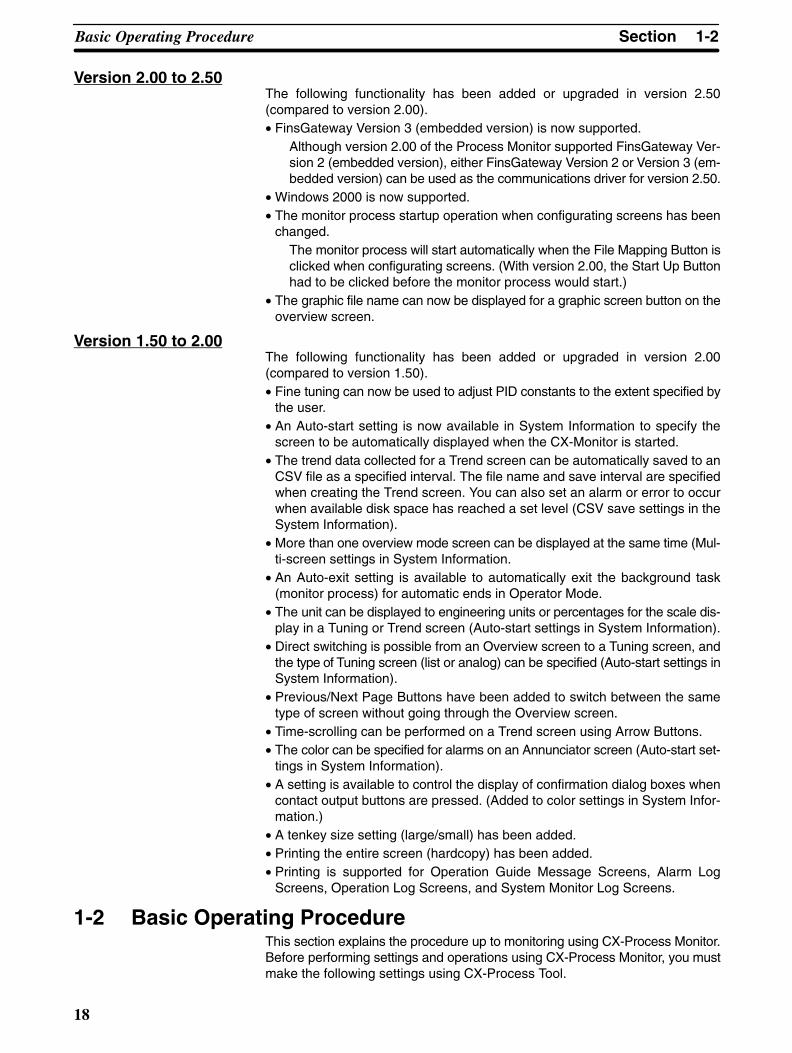
Version 2.00 to 2.50The following functionality has been added or upgraded in version 2.50(compared to version 2.00).• FinsGateway Version 3 (embedded version) is now supported.
Although version 2.00 of the Process Monitor supported FinsGateway Ver-sion 2 (embedded version), either FinsGateway Version 2 or Version 3 (em-bedded version) can be used as the communications driver for version 2.50.
• Windows 2000 is now supported.• The monitor process startup operation when configurating screens has been
changed.The monitor process will start automatically when the File Mapping Button isclicked when configurating screens. (With version 2.00, the Start Up Buttonhad to be clicked before the monitor process would start.)
• The graphic file name can now be displayed for a graphic screen button on theoverview screen.
Version 1.50 to 2.00The following functionality has been added or upgraded in version 2.00(compared to version 1.50).• Fine tuning can now be used to adjust PID constants to the extent specified by
the user.• An Auto-start setting is now available in System Information to specify the
screen to be automatically displayed when the CX-Monitor is started.• The trend data collected for a Trend screen can be automatically saved to an
CSV file as a specified interval. The file name and save interval are specifiedwhen creating the Trend screen. You can also set an alarm or error to occurwhen available disk space has reached a set level (CSV save settings in theSystem Information).
• More than one overview mode screen can be displayed at the same time (Mul-ti-screen settings in System Information.
• An Auto-exit setting is available to automatically exit the background task(monitor process) for automatic ends in Operator Mode.
• The unit can be displayed to engineering units or percentages for the scale dis-play in a Tuning or Trend screen (Auto-start settings in System Information).
• Direct switching is possible from an Overview screen to a Tuning screen, andthe type of Tuning screen (list or analog) can be specified (Auto-start settings inSystem Information).
• Previous/Next Page Buttons have been added to switch between the sametype of screen without going through the Overview screen.
• Time-scrolling can be performed on a Trend screen using Arrow Buttons.• The color can be specified for alarms on an Annunciator screen (Auto-start set-
tings in System Information).• A setting is available to control the display of confirmation dialog boxes when
contact output buttons are pressed. (Added to color settings in System Infor-mation.)
• A tenkey size setting (large/small) has been added.• Printing the entire screen (hardcopy) has been added.• Printing is supported for Operation Guide Message Screens, Alarm Log
Screens, Operation Log Screens, and System Monitor Log Screens.
1-2 Basic Operating ProcedureThis section explains the procedure up to monitoring using CX-Process Monitor.Before performing settings and operations using CX-Process Monitor, you mustmake the following settings using CX-Process Tool.
1-2SectionBasic Operating Procedure
19
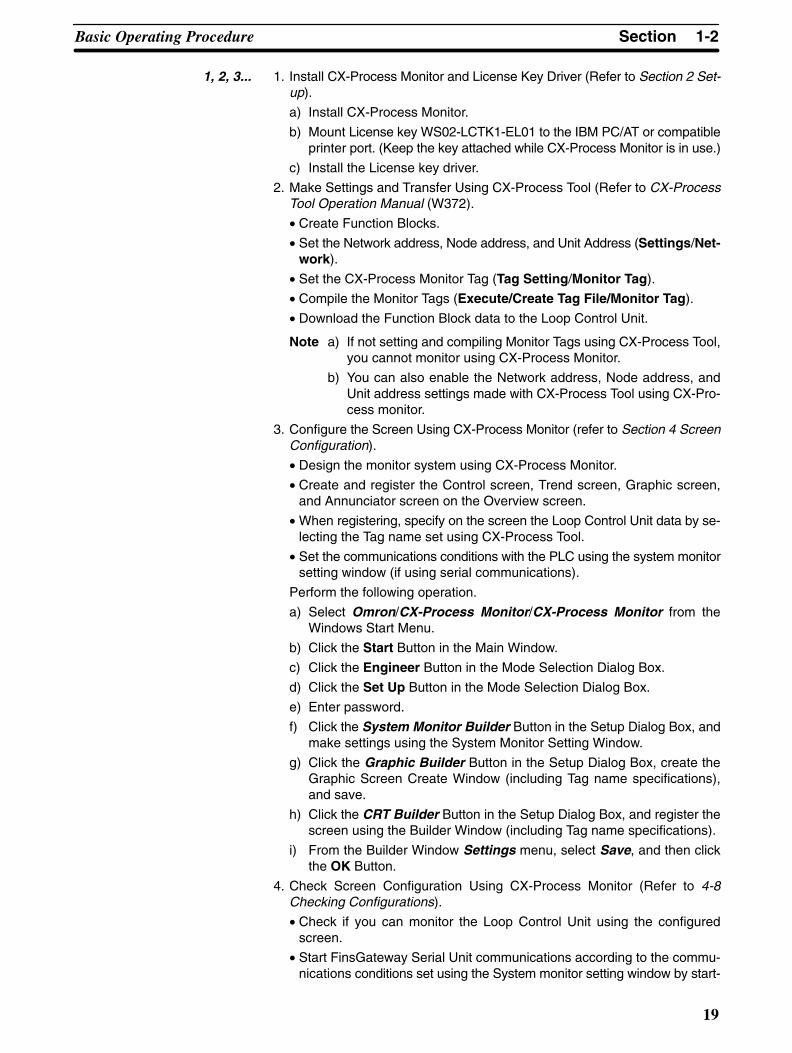
1, 2, 3... 1. Install CX-Process Monitor and License Key Driver (Refer to Section 2 Set-up).
a) Install CX-Process Monitor.
b) Mount License key WS02-LCTK1-EL01 to the IBM PC/AT or compatibleprinter port. (Keep the key attached while CX-Process Monitor is in use.)
c) Install the License key driver.
2. Make Settings and Transfer Using CX-Process Tool (Refer to CX-ProcessTool Operation Manual (W372).
• Create Function Blocks.
• Set the Network address, Node address, and Unit Address (Settings/Net-work).
• Set the CX-Process Monitor Tag (Tag Setting/Monitor Tag).
• Compile the Monitor Tags (Execute/Create Tag File/Monitor Tag).
• Download the Function Block data to the Loop Control Unit.
Note a) If not setting and compiling Monitor Tags using CX-Process Tool,you cannot monitor using CX-Process Monitor.
b) You can also enable the Network address, Node address, andUnit address settings made with CX-Process Tool using CX-Pro-cess monitor.
3. Configure the Screen Using CX-Process Monitor (refer to Section 4 ScreenConfiguration).
• Design the monitor system using CX-Process Monitor.
• Create and register the Control screen, Trend screen, Graphic screen,and Annunciator screen on the Overview screen.
• When registering, specify on the screen the Loop Control Unit data by se-lecting the Tag name set using CX-Process Tool.
• Set the communications conditions with the PLC using the system monitorsetting window (if using serial communications).
Perform the following operation.
a) Select Omron/CX-Process Monitor/CX-Process Monitor from theWindows Start Menu.
b) Click the Start Button in the Main Window.
c) Click the Engineer Button in the Mode Selection Dialog Box.
d) Click the Set Up Button in the Mode Selection Dialog Box.
e) Enter password.
f) Click the System Monitor Builder Button in the Setup Dialog Box, andmake settings using the System Monitor Setting Window.
g) Click the Graphic Builder Button in the Setup Dialog Box, create theGraphic Screen Create Window (including Tag name specifications),and save.
h) Click the CRT Builder Button in the Setup Dialog Box, and register thescreen using the Builder Window (including Tag name specifications).
i) From the Builder Window Settings menu, select Save, and then clickthe OK Button.
4. Check Screen Configuration Using CX-Process Monitor (Refer to 4-8Checking Configurations).
• Check if you can monitor the Loop Control Unit using the configuredscreen.
• Start FinsGateway Serial Unit communications according to the commu-nications conditions set using the System monitor setting window by start-

1-2SectionBasic Operating Procedure
20
ing the monitoring process (i.e., start FinsGateway Controller Link andEthernet manually).
Perform the following operation.
a) Click the Start Button in the Main Window.
b) Click the Engineer Button in the Mode Selection Dialog Box.
c) Click the Set Up Button in the Mode Selection Dialog Box.
d) Enter password.
e) Click the File Mapping Button in the Setup Dialog Box (mapping to theMonitor Tag File Screen).
f) Click the Overview Button in the Mode Selection Dialog Box.
g) Select the screens using the Overview Screen, and check that eachfunction is operating normally.
5. Start the Monitor Operation to monitor the Loop Control Unit (Refer to Sec-tion 3 Monitor Screen Functions and Operations for details).
Perform the following operation.
a) Click the Start Button in the Main Window.
b) Click the Operator Button in the Mode Selection Dialog Box.
c) Click the screens using the Overview Screen.

21
SECTION 2Setup
This section describes installing the CX-Process and connections to the PLC.
2-1 Installation 22. . . . . . . . . . . . . . . . . . . . . . . . . . . . . . . . . . . . . . . . . . . . . . . . . . . . . . . . . . . . . . 2-1-1 Before Installing FinsGateway 22. . . . . . . . . . . . . . . . . . . . . . . . . . . . . . . . . . . . . . . 2-1-2 Installing FinsGateway 23. . . . . . . . . . . . . . . . . . . . . . . . . . . . . . . . . . . . . . . . . . . . . 2-1-3 Installing CX-Process Monitor 28. . . . . . . . . . . . . . . . . . . . . . . . . . . . . . . . . . . . . . . 2-1-4 Installing the License Key Driver 32. . . . . . . . . . . . . . . . . . . . . . . . . . . . . . . . . . . . .
2-2 Connecting the PLC 33. . . . . . . . . . . . . . . . . . . . . . . . . . . . . . . . . . . . . . . . . . . . . . . . . . . . . . . 2-2-1 Connecting via Host Link 33. . . . . . . . . . . . . . . . . . . . . . . . . . . . . . . . . . . . . . . . . . . 2-2-2 Connecting through a Controller Link Support Board 35. . . . . . . . . . . . . . . . . . . . . 2-2-3 Connections via Ethernet 35. . . . . . . . . . . . . . . . . . . . . . . . . . . . . . . . . . . . . . . . . . . .

2-1SectionInstallation
22
2-1 InstallationTo use CX-Process Monitor, you must install the following software on the samecomputer. After installing FinsGateway Embedded Version 3, install CX-Pro-cess Monitor.• FinsGateway Embedded Version 3• CX-Process Monitor• License Key Driver
Note 1. To use the CX-Process Monitor, you also need the WS02-LCTK1-EL01 Li-cense Key (sold separately). In addition to installing the CX-Process Moni-tor, make sure to first connect the WS02-LCTK1-EL01 License Key to thecomputer printer port, and then install the License Key Driver before usingthe CX-Process Monitor. When using the CX-Process Monitor, make surethat the WS02-LCTK1-EL01 License Key is always connected to the printerport.
2. This software must be installed on an computer using Windows NT 4.0 orWindows 2000 as its OS. It will not operate on Windows 95, 98, or Me.
3. Be sure to install FinsGateway Embedded Version 3 before installing CX-Process Monitor. You cannot install CX-Process Monitor first.
4. Be aware that you cannot start CX-Process Monitor if FinsGateway Em-bedded Version 3 is not installed.
5. If connecting CX-Process online using a PLC and Host Link, you cannotinstall and use CX-Process on the same computer as FinsGateway Version1.
2-1-1 Before Installing FinsGatewayIf an earlier version of FinsGateway has been installed already, start from Step 1:Backing Up the FinsGateway Settings.If FinsGateway is being installed on the computer for the first time, skip to Step 5:ComCtl32.dll Update.
If necessary, back up the previous FinsGateway settings, as follows:
Note If FinsGateway is removed (uninstalled) without backing up the setting data, theprevious setting data will all be lost.
1, 2, 3... 1. Execute the Backup/Restore FinsGateway Setting Data program on theCD.<CD-ROM drive>:\Fgwv3\FgwUtils\SettingSalvage.exe
2. Select the Backup to File option, and click OK.
Remove the previous version of FinsGateway by referring to that manual for de-tails.
Step 1: Backing Up theFinsGateway Settings
Step 2: Removing thePrevious FinsGateway

2-1SectionInstallation
23
Note The FinsGateway removal process does not delete all of the FinsGateway filesand registry data used by FinsGateway. As a result, the FinsGateway reinstalla-tion process sometimes fails. If this happens, execute the following programfrom the distribution CD to remove all the files and registry data used by Fins-Gateway.
<CD-ROM drive>:\Fgwv3\FgwUtils\FgwRemover3.exe
After removing FinsGateway, restart the computer. If the following steps are per-formed without restarting the computer, the installation will not be completedproperly.
If Internet Explorer is not already installed, or if the version is old, the FinsGate-way installation will display a warning to update it. Update Internet Explorer.Internet Explorer is not included with FinsGateway. Refer to the Microsoft web-site for details, and install the newest version.
If the operating system is Windows 95, the Windows 95 ComCtl32.dll has a bugthat must be corrected. Be sure to update the ComCtl32.dll file.If using Windows NT 4, use the following procedure to update ComCtl32.dll forsystems where the display or other operations do not function properly.For Windows 2000 and Windows 98 no update is necessary for this file.Microsoft provides an update program called 401comupd.exe.
If the operating system is Windows 95, FinsGateway requires the DCOM95 forWindows 95, version 1.3 from Microsoft.
Note If the operating system is Windows 95, FinsGateway requires the DCOM95 forWindows 95, version 1.3 from Microsoft.
1, 2, 3... 1. Execute the following program from the FinsGateway CD:<CD-ROM drive>:\Fgwv3\Update\DCOM\English\dcom95.exe
2. The program will suggest a system restart when it finishes.Do not proceed to the next step without restarting the computer. If the instal-lation is continued without restarting the computer, the FinsGateway will notoperate properly.
If the HTML Help runtime component is not already installed, or if the version isold, the FinsGateway installation will display a warning to update it. Update theHTML Help runtime component as follows:
1, 2, 3... 1. Execute the following program from the FinsGateway CD:<CD-ROM drive>:\Fgwv3\Update\hhupd.exe
2. Update the HTML Help runtime component according to the instructionsdisplayed on the screen.
3. The program will suggest a system restart when it finishes.Do not proceed to the next step without restarting the computer. If the instal-lation is continued without restarting the computer, the FinsGateway will notoperate properly.
2-1-2 Installing FinsGatewayYou cannot install and use CX-Process Tool alone. You must install FinsGate-way Embedded Version 3 on the same computer.
Note FinsGateway Embedded Version 3 is bundled with CX-Process, but you canalso use FinsGateway Runtime Version 3. If FinsGateway Runtime Version 3 isalready installed, you do not need to install FinsGateway Embedded Version 3.
Use the following procedure to complete the installation.
1, 2, 3... 1. Install the FinsGateway drivers compatible with your communications pro-tocol.
Step 3: System Restart
Step 4: Internet ExplorerInstallation
Step 5: ComCtl32.dllUpdate
Step 6: DCOM95 forWindows 95, Version 1.3Installation
Step 7: Updating theHTML Help RuntimeComponent

2-1SectionInstallation
24
2. Update FinsGateway.
First, install the FinsGateway drivers compatible with your communications pro-tocol.
1, 2, 3... 1. Using Explorer, select one of the following folders from within the FinsGate-way V2 folder on the CD-ROM, depending on the communications protocolcompatible with your PLC.
CLK (PCI) Select if connecting CX-Process Tool and CX-Process Monitor to yourPLC (Programmable Controller) using the Controller Link SupportBoard for a PCI Bus.
Serial Select if connecting CX-Process Tool and CX-Process Monitor to yourPLC (Programmable Controller) using the Host Link.
Clk Select if connecting CX-Process Tool and CX-Process Monitor to yourPLC (Programmable Controller) using the the Controller Link SupportBoard for an ISA Bus.
Etn Select if connecting CX-Process Tool and CX-Process Monitor to yourPLC (Programmable Controller) using an Ethernet.
The following explanation is for Host Link.
2. On the CD-ROM, select Serial, and then disk1, and then double-click theSetup.exe icon as shown below.
The following screen will be displayed.
2-1SectionInstallation
25
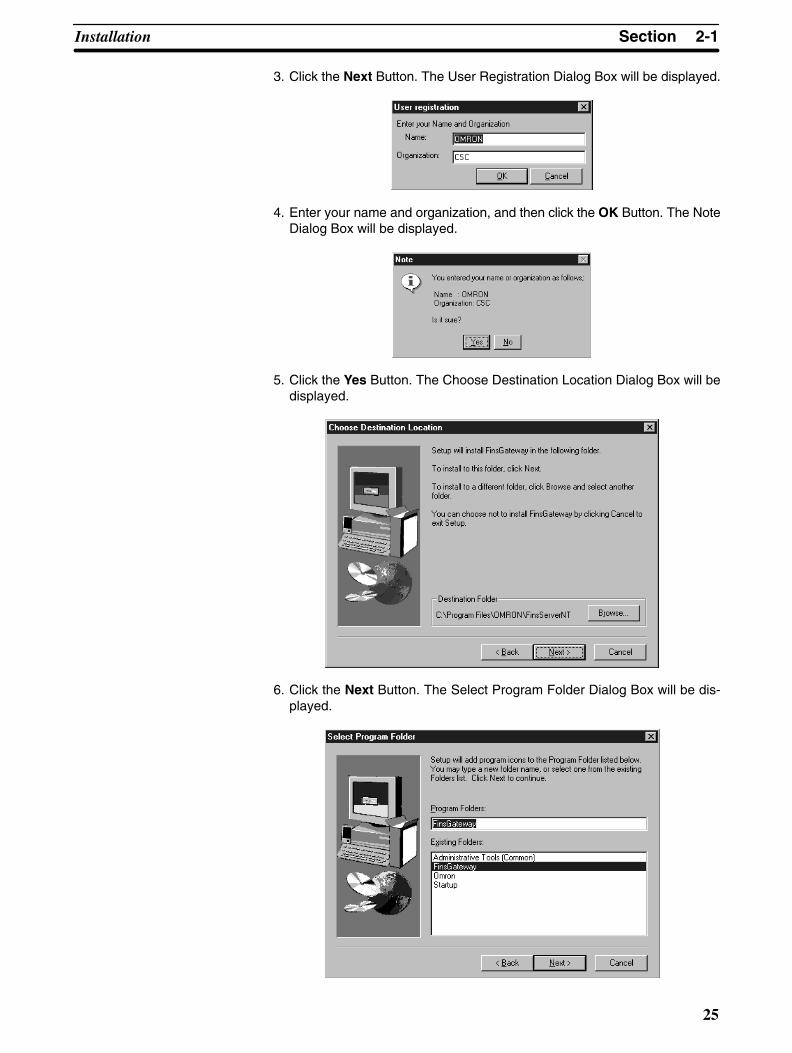
3. Click the Next Button. The User Registration Dialog Box will be displayed.
4. Enter your name and organization, and then click the OK Button. The NoteDialog Box will be displayed.
5. Click the Yes Button. The Choose Destination Location Dialog Box will bedisplayed.
6. Click the Next Button. The Select Program Folder Dialog Box will be dis-played.

2-1SectionInstallation
26
7. Check the installation destination is correct, and then click the Next Button.Installation will start automatically.
When installation is completed, the following dialog box will be displayed.
8. Click the Finish Button.
Next, update FinsGateway.
9. On the CD-ROM, select Fgwv3, and then FgwUpdate, and then double-click the FgwUpdate3.exe icon as shown below.
FgwUpdate3.exe
10. The following screen will be displayed.

2-1SectionInstallation
27
11. Click the Next Button. The Select Program Folder Dialog Box will be dis-played.
12. Check the installation destination is correct, and then click the Next Button.The Start Copying Files Dialog Box will be displayed.
13. Check the installation destination is correct, and click the Next Button.Installation will start automatically.When installation is completed, the following dialog box will be displayed.
14. Click the Finish Button.The FinsGateway installation is now completed.
Note You cannot start CX-Process Monitor if FinsGateway is not installed.

2-1SectionInstallation
28
2-1-3 Installing CX-Process Monitor1, 2, 3... 1. Insert the installation CD-ROM in the CD-ROM drive.
2. On the CD-ROM, select CX-Process Monitor, and then disk1, and thendouble-click the Setup.exe icon as shown below.
After the Preparing Setup Dialog Box has been displayed, the followingscreen will appear.
3. Click the Next button. The Software License Agreement Dialog Box will bedisplayed.
4. Click the Yes Button.
The Read Me Information Dialog Box will be displayed.
5. Click the Next Button.
The User Information Dialog Box will be displayed.
6. Enter your name and company name, and then click the Next Button.

2-1SectionInstallation
29
The Choose Destination Location Dialog Box will be displayed.
7. Specify the drive and folder to which you want to install CX-Process Monitor.The default is as follows:
C:\ Program Files\omron\CX-Process Monitor
You do not need to make any changes to install to the directory displayed.
To change the destination, click the Browse Button, and then select the di-rectory.
8. Click the Next Button. The Select Program Folder Dialog Box will be dis-played. Select the program folder. The default is as follows:
Omron/CX-Process Monitor
9. Click the Next Button.

2-1SectionInstallation
30
The Start Copying Files Dialog Box will be displayed.
10. Click the Next Button.
Installation will start automatically.
Note a) If there is already a DB folder (Monitor Tag file) in the destinationfolder, the following dialog box will be displayed.
• Click the Yes Button to import the existing DB folder.
• Click the No Button to not import the existing DB folder.
b) If trend data created on version 1.50 or earlier of the software ex-ists in the destination folder, a dialog box will be displayed asking ifthe trend data should be converted to data for version2.00/2.50/2.60.

2-1SectionInstallation
31
If conversion is specified, the following dialog box will be displayed.
Specify the path of the CX-Process Monitor tags (i.e., the db path)and click the Execute Button. (If there is more than one tag file,double-click TrgrpCnv.exe under Omron\CX-Process Monitor to dis-play the above Trend File Conversion Dialog Box. Then click theBrowse Button, specify the tag file, and click the Execute Button toconvert each file.) When conversion is completed, click the FinishButton.
The installation process will continue.If installation is completed normally, the following dialog box will be dis-played.
11. Click the Finish Button.
Note 1. To uninstall CX-Process Monitor, first end the Monitor process (from the Set-up Dialog Box, click the Shut Down Button), and then uninstall.
2. If the dialog box in step 10 is displayed while CX-Process Monitor is beinginstalled (refer to note (a) in step 10 on page 30), after installation select

2-1SectionInstallation
32
System Info from the Set up Menu and then open CRT Builder. After savingonce, set the main system settings.
2-1-4 Installing the License Key DriverThis section describes the License key driver installation procedure. You canalso install the License key driver before installing CX-Process Monitor.
1, 2, 3... 1. Connect the WS02-LCTK1-EL01 License Key to your computer printer port.
WS02-LCTK1-EL01
2. Using Explorer, select Setup.exe from the SystemDriver folder on the CD-ROM.
3. After installation is completed, be sure to restart Windows NT/2000.
Note If your computer is a Fujitsu FM/V, after installing the License KeyDriver, you must cycle the power supply to the computer, and thenrestart Windows NT/2000.
Note 1. When using the CX-Process Monitor, make sure that the theWS02-LCTK1-EL01 License Key is always connected to the printer port. Ifthe WS02-LCTK1-EL01 License Key is not connected to the computer print-er port, or even if it is connected, if the License key driver is not installed, youcannot use CX-Process Monitor.
2. Even if the License key driver is installed, nothing will be displayed on thescreen. To check that the driver is installed correctly, select Settings, andthen Control Panel, and then Multimedia. Check using the MultimediaProperties dialog box, by selecting Other Multimedia Devices, and thendisplaying Sentinel for i386 Systems.
3. To uninstall the License key driver, in the Multimedia Properties dialog box,select Sentinel for i386 Systems, and then select the Remove Button.

2-2SectionConnecting the PLC
33
2-2 Connecting the PLC
The following three methods can be used to connect to the PLC. Regardless ofthe connection method, the FinsGateway communications driver (embeddedversion 2) is used.
Communicationsnetwork
FinsGatewaycommunications
driver
Contents
Host Link Network(See note.)
Serial Unit Driver Connecting to the peripheral orRS-232C port of the PLC overHost Link.
Controller LinkNetwork
CLK (PCI slot) Driver(Not supported byFinsGateway Version2)
Connecting through the ControllerLink Support Board to a PLC witha Controller Link Unit mounted.
Ethernet Network ETN_UNIT Driver Connecting through the EthernetBoard to a PLC with an EthernetUnit mounted.
Note Host Link communications use FINS commands wrapped in header and termi-nator data (i.e., SYSWAY-CV for FinsGateway). Host Link communications(SYSMAC WAY) is set for the PLC.
2-2-1 Connecting via Host Link
The personal computer uses the FinsGateway’s Serial Unit Driver to connect tothe peripheral or RS-232C port of the PLC via Host Link communications.
CX-ProcessTool
IBM PC/AT orcompatible(9-pin male)
Loop Control UnitCS1 CPU Unit
Peripheralport
CS1W-CN226 orCS1W-CN626Connecting Cable
RS-232C Port
XW2Z-200S-CVConnecting Cable
Connections to the PeripheralPort of the CPU Unit
Connections to the RS-232C port of the CPUUnit or Serial Communications Board or Unit
CX-ProcessTool
IBM PC/AT orcompatible(9-pin male)
Loop Control UnitCS1 CPU Unit
Note 1. The Serial Communications Mode must be set to Host Link.Host Link communications use FINS commands wrapped in header and ter-minator data (i.e., SYSWAY-CV for FinsGateway). The peripheral bus can-not be used.
2. The FinsGateway Version 2 Serial Unit Driver must be installed to enableconnecting the PLC via Host Link communications.
3. The following Connecting Cables are used to connect the CX-Process Tool(personal computer) to the PLC (CPU Unit or Serial CommunicationsBoard/Unit).

2-2SectionConnecting the PLC
34
Connecting Cables
Unit Port on Unit Comput-er
Port oncomputer
Serial Com-munications
Mode
Model Length Remarks
CPU Unit Built-in pe-i h l
IBM PC/AT
Male 9-pin D-SUB
Host Link CS1W-CN226 2.0 m ---pripheral port AT or
compat-
pSUB CS1W-CN626 6.0 m
Built-inRS-232C port
compat-ible XW2Z-200S-CV 2 m Anti-static
connectorRS 232C portFemale 9-pinD-SUB
XW2Z-500S-CV 5 mconnector
Serial Com-munications
RS-232C portFemale 9 pin
XW2Z-200S-CV 2 m anti-staticconnectormunications
Board or UnitFemale 9-pinD-SUB XW2Z-500S-CV 5 m
connector
Note Touch a grounded metal to discharge all static electricity from your body beforeconnecting any of the above cable connectors to the RS-232C port of the PLC.The XW2Z-���S-CV Cable uses the anti-static XM2S-0911-E ConnectorHood. For safety sake, however, discharge all static electricity from your bodybefore touching the connector.
The following components are used to connect RS-232C cable to the peripheralport.
Unit Port on Unit Comput-er
Port oncomputer
Serial Com-munications
Mode
Model Length Remarks
CPU Unit Built-in pe-ripheral port
IBM PC/AT orcompat-ible
Male 9-pin D-SUB
SYSMACWAY (HostLink)
CS1W-CN118 +XW2Z-200S-CV/500S-CV
0.1 m +(2 or5 m)
TheXW-2Z���
S-CV is ananti-staticconnector.
CS1W-CN118 +XW2Z-200S-V/500S-V
---
The following components are available for connecting the CQM1-CIF01 orCQM1-CIF02 Cable to the peripheral port.
Unit Port on Unit Comput-er
Port oncomputer
Serial Com-munications
Mode
Model Length Remarks
CPU Unit Built-in pe-ripheral port
IBM PC/AT orcompat-ible
Male 9-pin D-SUB
SYSMACWAY (HostLink)
CS1W-CN114 +CQM1-CIF02
0.05 m +3.3 m
---
The following components are available for connecting the IBM PC/AT or com-patible over RS-232C
Unit Port on Unit PLC Port on PLC Serial Com-munications
Mode
Model Length Remarks
CPU Unit Built-inRS-232C port
IBM PC/AT or
Male 9-pin D-SUB
SYSMACWAY (Host
XW2Z-200S-V 2 m ---RS 232C portFemale 9-pinD-SUB
AT orcompat-ible
SUB WAY (HostLink) XW2Z-500S-V 5 m
Serial Com-munications
RS-232CPort
XW2Z-200S-V 2 mmunicationsBoard or Unit
PortFemale 9-pinD-SUB
XW2Z-500S-V 5 m

2-2SectionConnecting the PLC
35
2-2-2 Connecting through a Controller Link Support BoardThe personal computer uses the FinsGateway Version 2 Controller Link Driverto connect to the PLC over a Controller Link Network.
CX-Process Monitor(IBM PC/AT orcompatible) Controller
Link Unit
Loop Control Unit
Controller Link Network
Controller Link Support Board
ControllerLink Unit
Loop Control Unit
Note The FinsGateway Version 2 Controller Link Driver must be installed to enableconnecting the PLC via a Controller Link Network.
Controller LinkUnit
PLC Unit Type Transmissionpath
CS1W-CLK21-V1 CS1 CPU Bus Unit Wired Twisted-pair cable
CS1W-CLK11-V1 Optical Optical fiber cable
CS1W-CLK12-V1 Optical Ring Optical fiber cable
CS1W-CLK52-V1 Optical GI Optical fibercable
Controller LinkSupport Board
Transmissionmedium
Computer FinsGatewayDriver
3G8F7-CLK12-V1 Optical fiber cable(ring configuration)
IBM PC/AT orcompatible (PCI
CLK (PCI slot)Driver
3G8F7-CLK52-V1(ring configuration) compatible (PCI
slot)Driver
(FinsGatewayV i 2 t3G8F7-CLK21-V1 Wire
( yVersion 2 cannotbe used.)
3G8F5-CLK11-V1 Optical fiber cable IBM PC/AT oribl
Controller LinkD i3G8F5-CLK21-V1 Wire compatible Driver
Note When connecting the CX-Process Monitor to a PLC via Controller Link, refer toAppendix B FinsGateway Settings when Connected Using Controller Link fordetails on FinsGateway Settings.
2-2-3 Connections via EthernetThe personal computer uses the FinsGateway Version 2 ETN_UNIT Driver toconnects to the PLC via Ethernet.
CX-Process ToolIBM PC/AT orcompatible Ethernet Unit
Loop Control Unit
Ethernet
Ethernet Board
Ethernet Unit
Loop Control Unit
Note The FinsGateway Version 2 ETN_UNIT Driver must be installed to enable con-necting the PLC via Ethernet.
Model PLC Unit Transmission path
CS1W-ETN01 CS1 CPU Bus Unit Ethernet 10Base-5
CS1W-ETN11 Ethernet 10Base-T
Controller Link UnitModels
Controller Link SupportBoards
Ethernet Unit Model

37
SECTION 3Monitor Screen Functions and Operations
This section describes the monitor screens used with the CX-Process Monitor.
3-1 Outline 38. . . . . . . . . . . . . . . . . . . . . . . . . . . . . . . . . . . . . . . . . . . . . . . . . . . . . . . . . . . . . . . . . 3-2 Procedure to Start Monitoring 38. . . . . . . . . . . . . . . . . . . . . . . . . . . . . . . . . . . . . . . . . . . . . . . 3-3 Starting and Stopping 39. . . . . . . . . . . . . . . . . . . . . . . . . . . . . . . . . . . . . . . . . . . . . . . . . . . . . . 3-4 Overview Screen 40. . . . . . . . . . . . . . . . . . . . . . . . . . . . . . . . . . . . . . . . . . . . . . . . . . . . . . . . . 3-5 Screen Configurations 42. . . . . . . . . . . . . . . . . . . . . . . . . . . . . . . . . . . . . . . . . . . . . . . . . . . . . 3-6 Control Screens 44. . . . . . . . . . . . . . . . . . . . . . . . . . . . . . . . . . . . . . . . . . . . . . . . . . . . . . . . . .
3-6-1 Outline 44. . . . . . . . . . . . . . . . . . . . . . . . . . . . . . . . . . . . . . . . . . . . . . . . . . . . . . . . . . 3-6-2 Basic Displays and Operations 45. . . . . . . . . . . . . . . . . . . . . . . . . . . . . . . . . . . . . . . 3-6-3 Display Examples 47. . . . . . . . . . . . . . . . . . . . . . . . . . . . . . . . . . . . . . . . . . . . . . . . .
3-7 Tuning Screens 52. . . . . . . . . . . . . . . . . . . . . . . . . . . . . . . . . . . . . . . . . . . . . . . . . . . . . . . . . . . 3-8 Trend Screens 57. . . . . . . . . . . . . . . . . . . . . . . . . . . . . . . . . . . . . . . . . . . . . . . . . . . . . . . . . . . . 3-9 Graphic Screens 63. . . . . . . . . . . . . . . . . . . . . . . . . . . . . . . . . . . . . . . . . . . . . . . . . . . . . . . . . . 3-10 Annunciator Screens 64. . . . . . . . . . . . . . . . . . . . . . . . . . . . . . . . . . . . . . . . . . . . . . . . . . . . . . 3-11 Operation Guide Message Screens 65. . . . . . . . . . . . . . . . . . . . . . . . . . . . . . . . . . . . . . . . . . . . 3-12 Alarm Log Screens 67. . . . . . . . . . . . . . . . . . . . . . . . . . . . . . . . . . . . . . . . . . . . . . . . . . . . . . . . 3-13 Operation Log Screens 68. . . . . . . . . . . . . . . . . . . . . . . . . . . . . . . . . . . . . . . . . . . . . . . . . . . . . 3-14 System Monitor Screens 69. . . . . . . . . . . . . . . . . . . . . . . . . . . . . . . . . . . . . . . . . . . . . . . . . . . .
3-14-1 System Monitor Screen Outline 69. . . . . . . . . . . . . . . . . . . . . . . . . . . . . . . . . . . . . . . 3-14-2 Loop Control Unit Run/Stop 70. . . . . . . . . . . . . . . . . . . . . . . . . . . . . . . . . . . . . . . . . 3-14-3 Function Block Error Dialog Box Operations 71. . . . . . . . . . . . . . . . . . . . . . . . . . . . 3-14-4 Data Link Status 75. . . . . . . . . . . . . . . . . . . . . . . . . . . . . . . . . . . . . . . . . . . . . . . . . . .
3-15 System Monitor Log Screens 77. . . . . . . . . . . . . . . . . . . . . . . . . . . . . . . . . . . . . . . . . . . . . . . .

3-2SectionProcedure to Start Monitoring
38
3-1 OutlineThis section explains the functions and operations for each screen primarily forthose people who will operate CX-Process Monitor. The explanations assumethat CX-Process Tool settings and screen configuration for the CX-ProcessMonitor have already been completed.Refer to Section 4 Screen Configuration for how to configure CX-Process Moni-tor screens. Also, refer to CX-Process Tool Operation Manual (W372) for CX-Process Tool settings.CX-Process Monitor screen configuration is already completed, monitor theLoop Control Unit mainly by performing the following operations.
1, 2, 3... 1. Start CX-Process Monitor (refer to 3-3 Starting and Stopping CX-ProcessMonitor).
2. In the Mode Selection Dialog Box, click the Operator Button to display theOverview Screen (refer to 3-3 Starting and Stopping CX-Process Monitor).
3. From the Overview Screen, move to each of the following screens.• Control Screen (see 3-6 Control Screens)• Tuning Screen (see 3-7 Tuning Screens)• Trend Screen (see 3-8 Trend Screens)• Graphic Screen (see 3-9 Graphic Screens)• Annunciator Screen (see 3-10 Annunciator Screens)• Operation Guide Message Screen (see 3-11 Operation Guide Message
Screens)• Alarm Log Screen (see 3-12 Alarm Log Screens)• Operation Log Screen (see 3-13 Operation Log Screens)• System Monitor Screen (see 3-14 System Monitor Screens)• System Monitor Log Screen (see 3-15 System Monitor Log Screens)
Note If the WS02-LCTK1-JL01 License key is not connected to the computer printerport, or even if it is connected, if the License key driver is not installed, you can-not use the following monitor screens or configuration screens. (If you try toswitch to the following screens, an error message will be displayed.)
Monitor Screens
Item ScreenUser-defined screens Trend screen
Graphic screen
Operation Guide screen
System screens Alarm Log screeny
Operation Log screen
System Monitor Log screen
3-2 Procedure to Start MonitoringThe procedure until starting monitoring is as follows:
1, 2, 3... 1. Select Start, Programs, Omron, CX-Process Monitor, CX-Process Mon-itor.
2. In the Main Window, click the Start Button.3. In the Mode Selection Dialog Box, click the Operator Button.4. In the Overview Screen, select Control Screen, Trend Screen, etc. as re-
quired.
Note Steps 2 and 3 will not be required and a specified screen will be displayed if auto-starting is enabled. Autostarting can be enabled by clicking the System Info.

3-3SectionStarting and Stopping
39
Button when configuring the screen and then setting the Auto-start–Auto-startsetting to Enable.
3-3 Starting and StoppingThis section explains how to start and stop CX-Process Monitor.
1, 2, 3... 1. Select Start, Programs, Omron, CX-Process Monitor, CX-Process Mon-itor.The CX-Process Monitor’s Main Window will be displayed.
Main Window
Note When you have finished using CX-Process Monitor, click the ExitButton in the Main Window. The Main Window and CX-Process Moni-tor will both close.
2. Click the Start Button.
The Mode Selection Dialog Box will be displayed.
If configuration has already been completed, display the Overview Screenusing the step after next, and start monitoring. Refer to Section 4 ScreenConfiguration for configuration.
Mode Selection Dialog Box
Select the Operator Button
3. In the Mode field, select the Operator Button.

3-4SectionOverview Screen
40
The monitoring process will be started and the Overview Screen will be dis-played (Refer to 3-4 Overview Screen).
Note a) Steps 2 and 3, above, will not be required and the OverviewScreen will be displayed immediately if auto-starting has beenspecified by setting the Auto-start–Auto-start setting to Enable.
b) To finish using CX-Process Monitor while in Operator mode, clickthe Close Button in the top right of the Overview Screen, and themonitor process will automatically end. In Engineer mode, clickthe Close Button in the top right of the Overview Screen. If themonitor process is running, a dialog box will be displayed to con-firm whether the monitor process should be ended or not. SelectYes to end the monitor process. Select No to continue running themonitor process.
3-4 Overview ScreenThe Overview Screen displays all the menu screens and displays alarms.
Each button representsone loop. Click the buttonto display the Tuningscreen for the loop.
If a user-set erroroccurs, the button forthe Annunciatorscreen will flash.
Click this button to move to the Control screen
The button icons for the registered Control Screen, Trend Screen, GraphicScreen, and Annunciator Screen will be displayed.
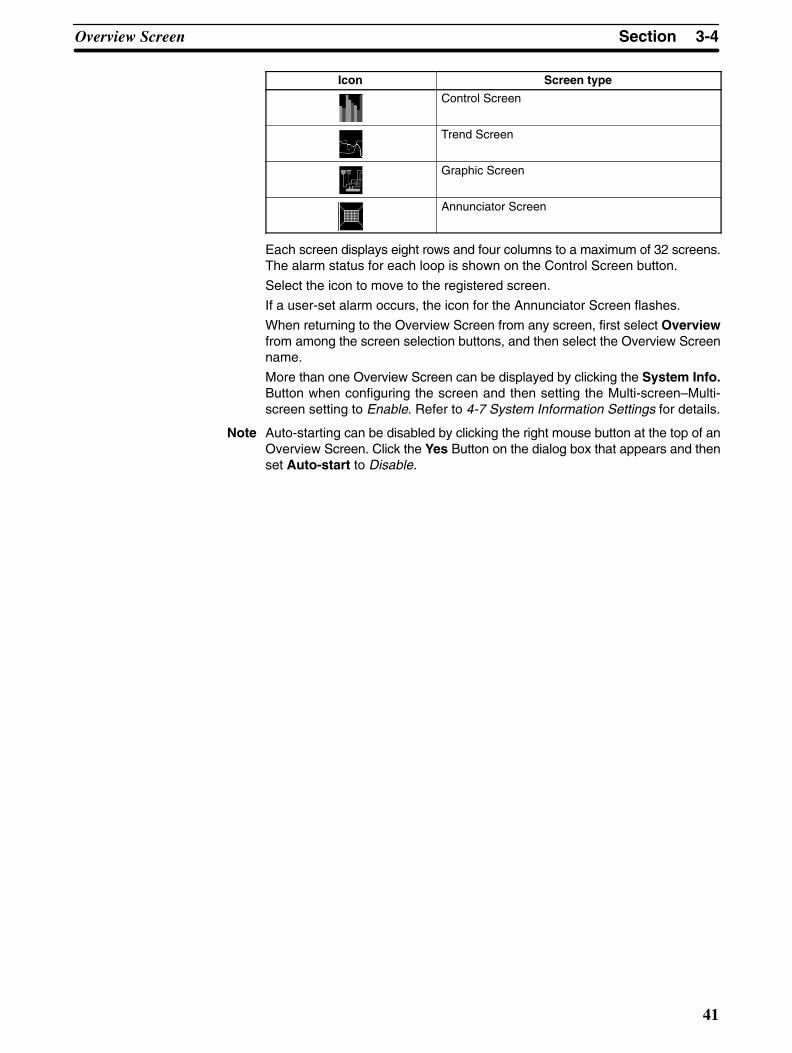
3-4SectionOverview Screen
41
Icon Screen type
Control Screen
Trend Screen
Graphic Screen
Annunciator Screen
Each screen displays eight rows and four columns to a maximum of 32 screens.The alarm status for each loop is shown on the Control Screen button.
Select the icon to move to the registered screen.
If a user-set alarm occurs, the icon for the Annunciator Screen flashes.
When returning to the Overview Screen from any screen, first select Overviewfrom among the screen selection buttons, and then select the Overview Screenname.
More than one Overview Screen can be displayed by clicking the System Info.Button when configuring the screen and then setting the Multi-screen–Multi-screen setting to Enable. Refer to 4-7 System Information Settings for details.
Note Auto-starting can be disabled by clicking the right mouse button at the top of anOverview Screen. Click the Yes Button on the dialog box that appears and thenset Auto-start to Disable.

3-5SectionScreen Configurations
42
3-5 Screen ConfigurationsThis section explains the configuration of the CX-Process Monitor Screen as awhole. The following example shows the Overview Screen.
Screen Selection Buttons: Right-clickhere to confirm the CRT-ID, groupnumber, and position of the screenspecified for automatic startup.
Refer to the table below for eachbutton’s function. When a new message
appears in theOperation GuideScreen, a red mark isdisplayed, and abuzzer will sound atthe same time.
System Monitor Message Display Area:Displays the most recent System Monitormessage, and a buzzer will sound at the sametime. The message is stored in the SystemMonitor Log.
Click the Button to delete the message.The buzzer will also stop at the same time.
Alarm MessageDisplay Area:Displays the mostrecent alarmmessage, and abuzzer will sound atthe same time. Themessage is stored onthe Alarm Logscreen.
Click the Buttonto delete themessage. Thebuzzer will also stopat the same time.
This area displaysall the MonitorScreens. Theexample shows theOverview Screen.Use the ScreenSelection Buttons tochange the display.
Displays the date and time
Return to previous screen
Click here and then set a tagname to select any TuningScreen.
Use these buttons toscroll to other displaysof the same typewithout going throughthe Overview Screen.
Prints a hardcopy of the screen.
Note The bottom line will appear as follows for some screens.
Prints error log data on Operation GuideMessage Screens, Alarm Log Screens,Operation Log Screens, and SystemMonitor Log Screens.

3-5SectionScreen Configurations
43
Button name Function
Overview Displays the Overview Screen. If multiple Overview Screensare registered, a pull-down menu will be displayed fromwhich you can select the Overview Screen you want.
Alarm Displays the Alarm Log Screen.
Operation Log Displays the Operation Log Screen.
Operation Guide Displays the Operation Guide Message Screen.
System Monitor Displays the System Monitor Screen to show system status.
System Monitor Log Displays the System Monitor Log Screen, which registerssystem messages.
About Displays information on the CX-Process Monitor version.
Screen SelectionButtons

3-6SectionControl Screens
44
3-6 Control Screens3-6-1 Outline
Use Control Screens to monitor and set the Control Block and part of the Opera-tion Block, to monitor analog signals, and to monitor and set contact signals. Forthe Control Block in particular, use the Control screen to perform such opera-tions as monitoring Set Point (SP), Process Variable (PV), Manipulated Variable(MV) run status, and Set Point (SP) changes, etc.Click the Control Screen Button in the Overview screen to display the followinginformation on the Control Screen.
• You can display up to a maximum of eight loops per screen of PID, Indica-tors, and other Control Blocks as on-site Instrument images. The maxi-mum is 400 screens x eight loops.
• You can perform SP changes, auto/manual switching, and manual opera-tions, etc. (Items indicated by a Button can be changed. Items without aButton are displayed only.)
• You can also move to the Tuning Screen.
Block name (mode) Send source function block, or ITEM
Target functionblock
1-Block Send Terminal toComputer (403)
Control Block: Basic PID (011), Advanced PID (012), Batchflowrate capture (014), Indication and Setting (031), Indication andOperation (032), Ratio Setting (033), Indicator (034), blended PID(013), 2-position ON/OFF (001), 3-position ON/OFF (002)
4-Block Send Terminal toComputer (404)
Control Block: Basic PID (011), Advanced PID (012), Indicationand Setting (031), Indication and Operation (032), Ratio Setting(033), Indicator (034), 2-position ON/OFF (001), 3-positionON/OFF (002)
Operation Block: High/Low Alarm (111), Segment Program 2(157),ON/OFF Valve Manipulator (221), Motor Manipulator (222),Reversible Motor Manipulator (223), Motor Opening Manipulator(224), Timer (205), Counter (208)
AO to Computer (402), AOTerminal to All Nodes (408)
Analog input signals or analog output signals for all functionblocks, or analog value parameters
DO to Computer (401), DOTerminal to All Nodes (407)
Contact input signals or contact output signals for all functionblocks, or contact value parameters
AO Terminal Settings fromComputer (410)
Analog output ITEM for AO Terminal Settings from Computer(Used to set ordinary analog values. Displays using networkresend monitoring.)
DO Terminal Settings fromComputer (409)
Contact output ITEM for DO Terminal Settings from Computer(Used to set ordinary contact values. Displays using networkresend monitoring.)
Display SP, PV, MV, A/M status, R/L status (See note 1), bar color changeanalog signal when an alarm occurs, contact signal
Setting SP, MV (only in manual mode), A/M switching (See note 3), R/Lswitching (See note 1 and note 2)
Contact signal (See note 4)
Note 1. When the SP setting (local only, or remote/local both possible) for ITEM024for Basic PID, Advanced PID, Indication and Setting, Ratio Setting, 2-posi-tion ON/OFF, and 3-position ON/OFF is 1 (remote/local both possible), CASis displayed. If the setting is 0 (local only), nothing is displayed.
2. When the SP setting (local only, or remote/local both possible) for ITEM024for Basic PID, Advanced PID, Indication and Setting, Ratio Setting, 2-posi-tion ON/OFF, and 3-position ON/OFF is 1 (remote/local both possible), CASis displayed, and settings can be made.
3. When set to remote, only auto is possible; manual is disabled (this limit onlyapplies to CX-Process Monitor).
4. Analog signals are not possible.

3-6SectionControl Screens
45
3-6-2 Basic Displays and OperationsBasic PID (011)
Click this button to move to the Tuningscreen. See 3-7 Tuning Screen for details.
Click this button to display the SetLabel Dialog Box.
PV numerical value display
SP numerical value display
Remote/local switch
Switch to AUTO Button
Switch to MAN Button
Display MV position
Display MVnumerical value
Up/Down Buttons tochange MV
SP Change Button
HH (High/High Alarm)
H (High Alarm)
Displays SP position
PV bar display
L (Low Alarm)
LL (Low/Low Alarm)
Manual Pointer
MV Change Button
Up/Down Buttons to change SP
Displays the PV range from upper to lower limit as a bar.Green: Status normalRed: PV Alarm (either HH, H, L, LL)Yellow: Deviation AlarmBlue: Alarm OFFLight blue: Function block calculations stopped
Change SP using the SP Change Up/Down Buttons.First press the SP Button, select the value column, and then enter the changeusing the ten-key dialog (using the mouse), or the keyboard. (The ten-key pad isdisplayed when the input box is selected. To enable inputting from the ten-key,click the System Info. Button in the Setup Dialog Box, and then change the set-ting to enable the ten-key.
Change the MP using the MP Change Up/Down Buttons.First press the MP Button, and then enter the change using the ten-key dialogbox (using the mouse), or the keyboard.
When the SP setting (local only, or remote/local both possible) for ITEM024 forBasic PID, Advanced PID, Indication and Setting, Ratio Setting, 2-position ON/OFF, and 3-position ON/OFF is 1 (remote/local both possible), CAS is displayed.When the CAS Button is red, the setting is on remote SP. When the CAS Buttonis blue, the setting is on local SP. Click the CAS Button to switch the setting.
Note When the CX-Process Monitor is set to Remote SP, A/M automatically switchesto AUTO. You cannot set Manual.
PV Bar Display
Changing SP
Changing MV
Remote/Local (R/L)Switching

3-6SectionControl Screens
46
When AUTO is lit red, the setting is AUTO. You can change the SP value. WhenMAN is lit blue, the setting is manual. You can change MV and SP values. SelectAUTO or MAN to switch.
MV Adjustment Area DetailsBasic PID (011), Advanced PID (012), Batch Flowrate Capture (014), Indication and Operation (032),Ratio Setting (033)
MV open directionenabled (0%)
AUTO orremote (CAS)
MV open directionenabled (100%)
Manual
No Manual Pointer
ManualPointer
MV open directiondisabled
Output limit (ML) Output limit (MH)
AUTO orremote (CAS)
Manual
Make Manual Pointer and MV open direction settings when registering the Con-trol Screen. Refer to 4-6 Screen Configuration for details.
Make output limit (ML, MH) settings using the Tuning screen. Refer to 3-7 TuningScreen for details.
AUTO or remote (CAS) AUTO or MAN AUTO or remote (CAS) AUTO or MAN
Output operation switches Output operation switches
2-position ON/OFF (001) 3-position ON/OFF (002)
A/M Switching

3-6SectionControl Screens
47
3-6-3 Display Examples
Indication and Setting (031) Indication and Operation (032)Click this button to move to the Tuning screen.See 3-7 Tuning Screen for details.
SP Change Button
H (High Alarm)
SP positiondisplay
PV bar display
L (Low Alarm)
LL (Low/Low Alarm)
Switch to Local Button
Up/Down Buttonsto change SP
Switch to Remote Button
SP numericalvalue display
PV numericalvalue display
Click this button to displaythe Set Label Dialog Box.
PV Bar DisplayDisplays the PV range from upper to lower limit as a bar.Green: Status normalRed: PV Alarm (either HH, H, L, LL)Blue: Alarm OFFLight blue: Function block calculations stopped
PV Bar DisplayDisplays the PV range from upper to lower limit as a bar.Green: Status normalRed: PV Alarm (either HH, H, L, LL)Blue: Alarm OFFLight blue: Function block calculations stopped
Click this button to move to the Tuning screen.See 3-7 Tuning Screen for details.
H (High Alarm)
PV bar display
L (Low Alarm)
LL (Low/Low Alarm)
Switch to AUTO Button
AUTO input numericalvalue display
PV numericalvalue display
Click this button todisplay the Set LabelDialog Box.
AUTO inputposition display
Switch to MAN Button
HH (High/High Alarm)HH (High/High Alarm)
Ratio Setting (033) Indicator (034)Click this button to move to the Tuning screen.See 3-7 Tuning Screen for details.
SP (Ratio)Change Button
SP (ratio)positiondisplay
PV bar displayUp/Down Buttons tochange SP (ratio)
Switch toRemote Button
SP (ratio) numericalvalue display
PV numericalvalue display
Click this button to displaythe Set Label Dialog Box.
PV Bar DisplayDisplays the PV range from upper to lower limit as a bar.Green: Status normalRed: PV Alarm (either HH, H, L, LL)Blue: Alarm OFFLight blue: Function block calculations stopped
PV Bar DisplayDisplays the PV range from upper to lower limit as a bar.Green: Status normalRed: PV Alarm (either HH, H, L, LL)Blue: Alarm OFFLight blue: Function block calculations stopped
Click this button to move to the Tuning screen.See 3-7 Tuning Screen for details.
H (High Alarm)
PV bar display
L (Low Alarm)
LL (Low/Low Alarm)
PV numericalvalue display
Click this button todisplay the Set LabelDialog Box.
HH (High/High Alarm)
Switch to MAN ButtonSwitch to AUTO Button

3-6SectionControl Screens
48
High/Low Alarm (111)Click this button to move to the Tuning screen.See 3-7 Tuning Screen for details.
H (High Alarm)
PV bar display
H (High Alarm)set value
PV numerical value display
PV Bar DisplayDisplays the PV range from upper to lower limit as a bar.Green: Status normalRed: AlarmLight blue: Function block calculations stopped
L (Low Alarm)
L (Low Alarm) set value
L (Low Alarm)Setting Button
H (High Alarm)Setting Button
Batch Flowrate Capture (014)
Accumulation CounterReset Button (S3)
Batch RunButton (S1 = ON)
Batch StopButton (S1 = OFF)
Preset value (BM) display
Instantaneous value offlowrate display
Control Interrupt Button(S2 = ON)
Control Restart Button(S2 = OFF)
Pre-batch displayMain batch display
SP numerical value display
Batch accumulated value(SM) display
Click this button to move to the Tuning screen.See 3-7 Tuning Screen for details.
Batch accumulatedvalue display
Switch toRemote Button
SP (1 Batch)Change Button
Switch to AUTO Button
Switch to MAN Button
Click this button to displaythe Set Label Dialog Box.
Blended PID (013)
PV Bar DisplayDisplays the PV range from upper to lower limit as a bar.Green: Status normalRed: Deviation Alarm (DHH, DH, DL, or DLL)Yellow: MV Limit High/LowBlue: Alarm OFFLight blue: Function block calculations stopped
Click this button to displaythe Set Label Dialog Box.
Click this button to moveto the Tuning screen.See 3-7 Tuning Screenfor details.
SP position display
Switch to AUTO Button
Switch to MAN Button
PV numerical value display
SP numerical value display
PV bar display
Segment Program 2 (157)
Position of programoutput value display
Move to Next WaitCommand Button(Red during WAIT)
Program outputnumerical value
Reference inputvalue display
Time Axis Hold Button
Time Axis HoldCancel Button
Move to Next StepCommand Button
Bar display forreference inputvalue
Run Command/Display Button
Stop Command/Display Button
Step numberexecuting

3-6SectionControl Screens
49
Timer (205) Counter (208)
ON/OFF Valve Manipulator (221)
Valve open midway(U3) indicator
Valve action timeerror (U2) indicator
ON/OFF Buttons
Indicates arrival atset value
Limit switch closedindicator
Motor Manipulation (222)
PV Bar DisplayDisplays the PV range from upper to lower limit as a bar.Green: Status normalRed: Alarm (H)
CT inputhigh alarm
Bar displayfor CT input
Stop Command(Timer Reset)Button
Prediction value display
Time unit display
Indicates arrival atprediction value
Operation Restart Button
Operation Interrupt Button
Count displaySet value display
Indicates when limitswitch is closed (S6)
Manipulation site (S4)selection indicator
Answer output(S5 = OFF)indicator
Answer error (U2) indicator
Answer input(S5 = ON) indicator
Click this button to displaythe Set Label Dialog Box.
SP (Set Value)Change Button
Prediction ValueChange Button
Run CommandButton
Click this button to displaythe Set Label Dialog Box.
SP (Set Value)Change Button
Prediction ValueChange Button
Run CommandButton
Stop Command(Counter Reset)Button
Prediction valuedisplay
Indicates arrival atset valueIndicates arrival atprediction value
Numerical display of time elapsedSet value display
Click this button to displaythe Set Label Dialog Box.
Switch to AUTO Button
Switch to MAN Button
Click this button to displaythe Set Label Dialog Box.
Switch to AUTO Button
ON/OFF Buttons
Switch to MAN ButtonManipulation site (S4)selection indicator

3-6SectionControl Screens
50
Reversible Motor Manipulator (223) Motor Opening Manipulator (224)
H (CT inputhigh alarm)
H (opening inputhigh alarm)
Bar display foropening input
Close manipulationoutput (U2) indicator
L (opening inputlow alarm)
SP numerical value display
Click this button to displaythe Set Label Dialog Box.
Bar displayfor CT input
STOP answerindicator
REV answer(S9) indicator
Switch to AUTO Button
FWD/REV/STOP Buttons
Manipulation site (S7)selection indicator
Switch to MAN Button
FWD answer(S8) indicator
Answer error (S8) indicator
PV Bar DisplayDisplays the PV range from upper to lower limit as a bar.Green: Status normalRed: Alarm (H)
Click this button to displaythe Set Label Dialog Box.
SP ChangeButton
Displays SP position
Stop manipulationoutput display
Opening input numericalvalue display
Switch to AUTO Button
FWD/REV/STOP Buttons
Switch to MAN Button
Manipulation site (S2)selection indicatorOpen manipulationoutput (U1) indicator
Thermal relay(S4) indicator
PV Bar DisplayDisplays the PV range from upper to lower limit as a bar.Green: Status normalRed: Alarm (H)
Control Screen for 1-Block Send Terminal to Computer

3-6SectionControl Screens
51
Control Screen for 4-Block Send Terminal to Computer
You cannot move tothe Tuning screen fromthe Control screen for4-Block Send Terminalto Computer.
Control Screen for AO Terminal Settings from Computer, AO to Computer, and AO Terminal to AllNodes
Note As shown above, the AO Terminal to All Nodes Function Block cannot be ad-justed using the display alone.

3-7SectionTuning Screens
52
Control Screen for DO Terminal Settings from Computer, DO to Computer, and DO Terminal to AllNodes
DO Terminal Settings fromComputer: You can turnON/OFF contactsdisplayed in red.
DO Terminal to Computer, and DOTerminal to All Nodes: For contactsmarked with a circle, ON/OFF isdisplayed only, and cannot bechanged manually.
3-7 Tuning ScreensUse Tuning Screens to change Control Block P, I, and D constants specified us-ing 1-Block Send Terminal to Computer.• You can set the parameters for PID Block P, I, D, and alarm set values.
• You can make adjustments while monitoring PV, SP, and MV trends.• A maximum of 3,200 screens can be displayed.• If an alarm occurs, the bar graph color changes.Use one of the following methods to display the Tuning Screen.• Select a button to move to the Tuning Screen using the Control Screen. Refer
to 3-6 Control Screen for details.• Click the button displayed by the Control Screen icon in the Overview Screen.
Refer to 3-4 Overview Screen for details.A pop-up menu of tag names or a dialog box to specify the tag name will be dis-played if the button on the upper left of an Overview Screen is displayed. (Referto 3-5 Screen Configurations.) (Either a pop-up menu or a dialog box can be se-lected by clicking the System Info. Button when configuring the screen and thensetting the Auto-start–Tuning screen list setting.
Block name (model) Signal source Function Block or ITEMTargetfunctionblock
1-Block SendTerminal toComputer (403)
Control Block: Basic PID (011), Advanced PID (012), Batch flowrate capture (014),Indication and Setting (031), Indication and Operation (032), Ratio Setting (033),Indicator (034), blended PID (013), 2-position ON/OFF (001), 3-position ON/OFF (002)
4-Block SendTerminal toComputer (404)
Segment Program 2 (157) (A 4-Block Send Terminal cannot be used.)
Display
Example: Basic or Advanced PID
SP, PV, and MV trends
Setting values for P, I, D, and MV limit High/Low, High/High Alarm, High Alarm, LowAlarm, Low/Low Alarm, and Deviation Alarm.
Alarm OFF switch, Stop block operation command, SP, PV, MV, and A/M status, R/Lstatus (See note 1), bar color change if alarm occurs.
Settings
Example: Basic or Advanced PID
Setting values for P, I, D, and MV limit High/Low, High/High Alarm, High Alarm, LowAlarm, Low/Low Alarm, and Deviation Alarm.
SP, MV (manual mode only), A/M switching (See note 1), R/L switching (See note 1).

3-7SectionTuning Screens
53
Note 1. Same as for Control Screen
2. If using the Tuning Screen, use the 1-Block Send Terminal to Computerfunction block (403). Tag names specified using the 4-Block Send Terminalto Computer function block(404) cannot be displayed on the Tuning Screen.
Click the text to display the dialog boxes for changing the settings. You canmake changes uses the ten-key dialog box (using the mouse), or thekeyboard. (The ten-key pad is displayed when you select the Enter box.Refer to 4-7 Labels, Alarm Sounds, and Ten-key Settings forten-key/keyboard switching settings.)
Refer to 3-6 Control Screenfor how to operate.
Set operation or alarm to1 to stop their operation.
Select these buttons to display the dialog boxes for changing the settings.
Click the Time Range Button to set the maximum amplitude for the time axisdisplayed on the screen.
The scale can be set to either percentages or engineering units. The setting canbe made by clicking the System Info. Button when configuring the screen andthen setting the Auto-start–Divisions in Tuning screen setting.
To zoom in on the scale displayed, click the Scale Button and change the setting.
To add bias to the display, click the Bias Button and change the setting.
Collection of Trend data for the Tuning Screen starts once you have moved tothe Tuning Screen, and is displayed only while the Tuning Screen is displayed.To continue to collect trend data even if you then move from the Tuning Screen toanother screen, and to display the data continuously if you return to the TuningScreen, click the Continuous Button. In this way, the data from three screens iscollected against the background of the Tuning Screen.
To cancel the Continuous function explained above, click the Cancel button.

3-7SectionTuning Screens
54
Note The display for Segment Program 2 (157) is shown below.
Step settings can be changed by clicking on the word.
It is possible to automatically calculate and store the PID constants used forBasic PID (011) or Advanced PID (012). This function is called auto-tuning (AT).For details of the AT function, refer to the section on Basic PID (011) in the LoopControl Unit Function Block Reference Manual. AT can be set in the same wayas the other settings, as shown below.
1, 2, 3... 1. If the value for AT displayed in the upper-left region of the Tuning Screen is 0,then AT will not be executed.
2. Click AT.
The Change Data Dialog Box shown below will be displayed.
3. To execute AT, input 1 in the New Data Field.
4. Click the OK Button. AT will be executed (see note). The value for AT dis-played in the upper-left region of the Tuning Screen will change to 1.
5. When the PID constants have been calculated and stored and AT has beencompleted, the value for AT displayed in the upper-left region of the TuningScreen will return to 0.
Auto-tuning (AT)

3-7SectionTuning Screens
55
Note Execution of AT can be cancelled from the above dialog box by inputting 0 in theNew Data Field and clicking the OK Button. (The value for AT displayed in theupper-left region of the Tuning Screen will return to 0.)
The following example shows how to change P (the proportional band).
1, 2, 3... 1. Click Proportional Band (P) displayed in the upper center of the screen.
The Change Data Dialog Box will be displayed.
2. Select the Change To Field.
The ten-key dialog box will be displayed as shown.
Note Refer to 4-7 Labels, Alarm Sounds, and Ten-key Settings for settingsto disable the ten-key pad (i.e., to input directly from the keyboard).
3. After using the mouse (or the keyboard) to enter a numerical value, click theOK Button (or press Enter).
The display will return to the Change Data Dialog Box shown in Step 1.
4. Click the OK Button.
You can change the settings for I (integral time) and D (differential time) in thesame way.
You can use the procedure explained above to change the settings for MV High/Low Limit, High/High Alarm, High Alarm, Low/Low Alarm, Low Alarm, and Devi-ation Alarm in the same way.
Fine tuning (FT) can be executed for either Basic PID (011) or Advanced PID(012). Fine tuning lets the user use fuzzy inferences to set PID constants as re-quired for more accurate control.
Changing P, I, D
Changing Other Settings
Executing Fine Tuning

3-7SectionTuning Screens
56
1, 2, 3... 1. Click Execute FT at the upper left portion of the Tuning Screen, as shownbelow.
The following FT Execution Dialog Box will be displayed.
2. Set the degree of Response improvement, Overshooting control, andHunting control to any of the five levels and then click the OK Button. Eitherone or two of these can be set for one executed, but all three cannot be set atthe same time.
Fine tuning will be executed according to the settings, the resulting PIDconstants will be stored automatically, and the new values will be displayedat the top of the Tuning Screen.
3. Repeat the above process as many times as required to achieve suitablesettings.
4. Click the Undo Button to return to the previous PID constant settings. If theUndo Button is pressed a second time, the FT settings will be returned to.
Execute fine tuning when the control performance produced by autotuning is notacceptable, when autotuning produces inconsistency in the PV, or when youcannot allow control to be interrupted.
Fine tuning uses three user settings for hunting control, overshooting, and re-sponse improvement along with fuzzy inferences from previous control condi-tions to improve control by automatically setting PID parameters.
Either one or two of the user settings for hunting control, overshooting, and re-sponse improvement can be set to any of five levels. For example, to better con-

3-8SectionTrend Screens
57
trol hunting and overshooting, the Overshoot and Hunting parameters can beset to to the desired levels.
Overshooting control
Hunting controlResponse improvement
For example, hunting control can beset to level 4 and overshooting con-trol can be set to 3.
3-8 Trend ScreensTrend Screens display changes in Control Block PV, SP, MV, and analog signalsacross the passage of time as recording meter images. To display the TrendScreen, click the Trend Screen Button in the Overview Window.
Real Time Trend Screen Display
Data setting values marked with thissymbol are graded on the graph. Selectthe number icon to change the setting.
Data values at the point in time displayed bythis mark (the current value for the default)are displayed in the upper part of the screen.You can drag this mark to move it about thescreen. All data is displayed as realnumbers.
Time Scroll
Shifts one screenfurther to the past.
Time Scroll
Shifts one screenfurther to the future.

3-8SectionTrend Screens
58
Function block PV, SP, MV, and analog signals output from the Send Terminal toComputer function block are collected in fixed cycles, the trend displayed, andsimultaneously stored in a file.
Trends are displayed as multi-dot recorder screen images to a maximum of eightdots per screen.
The following two Trend Screens are supported.
Data collection(Logger function)
Realtime Trend 10-s cycle, 480 Tags max.,stored for 12 hours( ogge u c o )
Historical Trend 60 s cycle, 960 Tags max.,stored for 10 days
Data display Horizontal axis: Time display axis: You can scroll through 2, 4, 8,12, and 24-hour axes.
Vertical axis: 8-dot all-points axis. You can magnify thegradations by 1x, 2x, 5x, or 10x.
Specify the display start time to display data from that point intime.
Display colors: Red, yellow, green, blue, magenta, purple, cyan,and white.
You can register a maximum of 60 Realtime Trend Screens, or 120 HistoricalTrend Screens.
Set either Realtime Trend or Historical Trend when configuring the screen.
Regardless of the trend, trend data collection itself starts at the same time as themonitor process is started (using the Start Up Button in the Set Up Dialog Box).
• Click the Start Time Button in the lower left of the screen to set the timefrom which data will be displayed.
• Click the Maximum Display Time Button to set the maximum width of thetime axis displayed on the screen.
• To zoom in on the scale displayed, click the Scale Button and change thesetting.
• To add bias to the display, click the Bias Button and change the setting.
• Use the Select Pen Button to select the pen you want to display.
Realtime trends can be recorded for up to 12 hours, after which the oldest data isdiscarded.
Function block name (format) Send source function block, or ITEM
Targetfunctionblock
1-Block Send Terminal to Computer (403) Control Block: PV, SP, MV, Y1, Y2, and HL only for Basic PID(011), Advanced PID (012), Batch flowrate capture (014),Indication and Setting (031), Indication and Operation (032),Ratio Setting (033), Indicator (034), blended PID (013),2-position ON/OFF (001), and 3-position ON/OFF (002).
4-Block Send Terminal to Computer (404) Control Block: PV, SP, and MV only for Basic PID (011),Advanced PID (012), Indication and Setting (031), Indicationand Operation (032), Ratio Setting (033), Indicator (034),2-position ON/OFF (001), and 3-position ON/OFF (002),Segment Program 2 (157), ON/OFF Valve Manipulation (223),Motor Manipulator (222), Reversible Motor Manipulator (223),Motor Opening Manipulator (224)
AO to Computer (402), AO Terminal to allnodes (408)
Analog input signals or analog output signals for all FunctionBlocks, or analog value parameters
DO to Computer (401), DO Terminal to allnodes (407)
Contact input signals or contact output signals for all FunctionBlocks, or contact value parameters
Display SP, PV, and MV, analog value, and contact (See note.)
Setting None
Note MV is displayed as an SP and PV range, not as a percentage.

3-8SectionTrend Screens
59
Historical Trend Screen Display
Time Scroll
Shifts one screenfurther to the past.
Time Scroll
Shifts one screenfurther to the future.
Data setting values marked with thissymbol are graded on the graph. Selectthe number icon to change the setting.
Data values at the point in time displayed bythis mark (the current value for the default)are displayed in the upper part of the screen.You can drag this mark to move it about thescreen. All data is displayed as realnumbers.
Realtime Trend data and Historical Trend data (data grouped by date, time, orTag Name) can be output in CSV (Comma Separated Value) file format using thefollowing procedure.
1, 2, 3... 1. Press the CSV Button to display the Export to CSV File Dialog Box.
2. Specify a name for the CSV file, and click the OK Button. A CSV file will becreated. (By clicking the Browse Button, the CSV file can be created in adesired folder. The default filename for Realtime Trend data is Trrl.csv andthe default filename for Historical Trend data is Trhl.csv.) The contents ofCSV files created are as follows.
Realtime Trend“Real-time Trend”(carriage return)<Screen_name>(carriage return)<Date_exported>(comma)<Time_exported>(carriage return)(comma)(comma)<Number_tag_number_1>(comma)<Number_tag_num-ber_2>(comma)...(comma)<Number_Tag_number_8>(carriage return)
CSV File Output

3-8SectionTrend Screens
60
(comma)(comma)<Configuration_tag_number_1>(comma)<Configura-tion_tag_number_2>(comma)...(comma)<Configuration_tag_number_8>(car-riage return)<Date_of_trend_data>(comma)<Time_of_trend_data>(comma)<Data_1>(comma)<Data_2>(comma)...(comma)<Data_8>(carriage return)
Note Data for tag names that have not been registered will be 0.
Historical Trend“Historical Trend”(carriage return)<Screen_name>(carriage return)<Date_exported>(comma)<Time_exported>(carriage return)(comma)(comma)<Number_tag_number_1>(comma)<Number_tag_num-ber_2>(comma)...(comma)<Number_Tag_number_8>(carriage return)(comma)(comma)<Configuration_tag_number_1>(comma)<Configura-tion_tag_number_2>(comma)...(comma)<Configuration_tag_number_8>(car-riage return)<Date_of_trend_data>(comma)<Time_of_trend_data>(comma)<Data_1>(comma)<Data_2>(comma)...(comma)<Data_8>(carriage return)
Note Data for tag names that have not been registered will be 0.
Example: The following screen shows how Realtime Trend data exportedto spreadsheet software (e.g., Microsoft Excel) will be displayed.
Time exportedScreen name
Date exportedNumber tag name
Configuration tag name
Data of trend data Time of trend dataTag data
Pens can be changed, deleted, or added to Trend Screens without shuttingdown the CX-Process Monitor Plus.
Changing/Deleting Pens from the Dialog Box
1, 2, 3... 1. Double-click the pen selection area.
Double-click.
Updating TrendDefinitions Online

3-8SectionTrend Screens
61
2. The following dialog box will be displayed. Click where indicated by num-bers 1 to 4 in the following diagram to set the items.
(1) (2) (3) (4)
(1) Tag Name Selection for CSV TagDisplays a list of tags registered in CX-Process Monitor Plus.
(2) ITEM Tag SelectionSet the type of ITEM to use to narrow the ITEM list displayed for the tagnames above.
(3) Detailed SettingsWhen the tag name is set above, the upper/lower limits of the specified tagwill be displayed by default. The setting can be changed.
(4) DeleteDeletes the selected pen.
Note a) When the button is pressed, all tag information will be deletedfrom the Trend Screen, including the graphic display for the pen.
b) After the four items above are set and the OK Button is clicked,some time will be required before the results are displayed on theTrend Screen. This time will be the collection cycle (approximately10 s for realtime trends and 60 s for historical trends) plus thescreen refresh cycle (a few seconds). If another screen isswitched to, the changes will be reflected in the screen as soon asit is returned to.

3-8SectionTrend Screens
62
Adding Pens from the Dialog BoxUse the following procedure to assign a tag to a pen for which one is not yet as-signed.
1, 2, 3... 1. Double-click in the area circled in the screen shown below.
The following dialog box will appear to change the pen.
2. Select a pen to which a tag is not yet assigned and click the OK Button.
3. Assign the pen using the same dialog box as used to change and deletepens in the previous procedure.

3-9SectionGraphic Screens
63
3-9 Graphic ScreensGraphic Screens display the status of the system or device in graphic form. Todisplay the Graphic Screen, click the Graphic Screen Icon in the OverviewScreen.
Graphic Screen
Paste to the screen graphic elements representing plant instrumentation, whichhave been pre-prepared, and use them to display the device status, to a maxi-mum of 200 screens.
Pre-prepared fixed graphic display elements: Text, instruments, thermometers,transmitters, orifices.
Pre-prepared changeable graphic display elements:
Analog inputs: Bar graph displays, numerical value displays, tanks
Analog settings: Numerical settings (See note.)
Contact inputs (display): Pumps, valves, pipes
Contact settings (operation): Switches (See note.)
Note If making analog values or contact settings, use AO Settings from Computer orDO Settings from Computer Tags function blocks.
For other fixed graphics, read and paste created using bitmap files. Basically,after cutting and pasting the background and other graphics, paste the pre-pre-pared fixed or changeable graphic display elements mentioned above to createthe complete Graphic Screen.
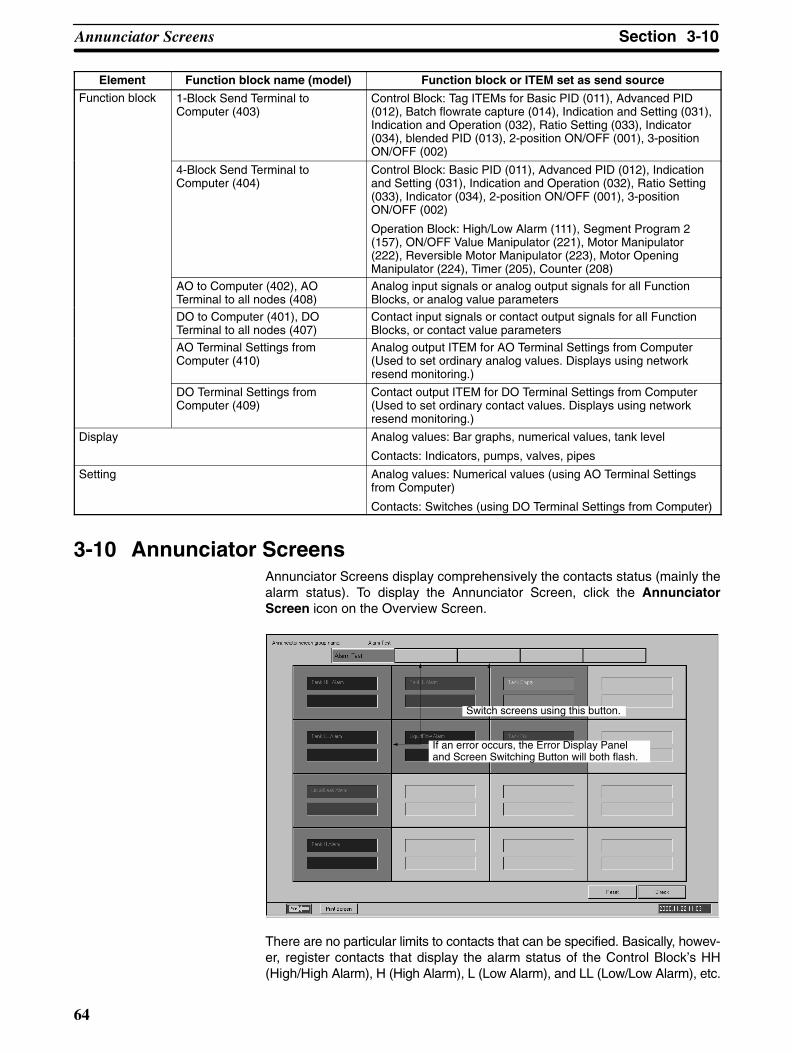
3-10SectionAnnunciator Screens
64
Element Function block name (model) Function block or ITEM set as send sourceFunction block 1-Block Send Terminal to
Computer (403)Control Block: Tag ITEMs for Basic PID (011), Advanced PID(012), Batch flowrate capture (014), Indication and Setting (031),Indication and Operation (032), Ratio Setting (033), Indicator(034), blended PID (013), 2-position ON/OFF (001), 3-positionON/OFF (002)
4-Block Send Terminal toComputer (404)
Control Block: Basic PID (011), Advanced PID (012), Indicationand Setting (031), Indication and Operation (032), Ratio Setting(033), Indicator (034), 2-position ON/OFF (001), 3-positionON/OFF (002)
Operation Block: High/Low Alarm (111), Segment Program 2(157), ON/OFF Value Manipulator (221), Motor Manipulator(222), Reversible Motor Manipulator (223), Motor OpeningManipulator (224), Timer (205), Counter (208)
AO to Computer (402), AOTerminal to all nodes (408)
Analog input signals or analog output signals for all FunctionBlocks, or analog value parameters
DO to Computer (401), DOTerminal to all nodes (407)
Contact input signals or contact output signals for all FunctionBlocks, or contact value parameters
AO Terminal Settings fromComputer (410)
Analog output ITEM for AO Terminal Settings from Computer(Used to set ordinary analog values. Displays using networkresend monitoring.)
DO Terminal Settings fromComputer (409)
Contact output ITEM for DO Terminal Settings from Computer(Used to set ordinary contact values. Displays using networkresend monitoring.)
Display Analog values: Bar graphs, numerical values, tank level
Contacts: Indicators, pumps, valves, pipes
Setting Analog values: Numerical values (using AO Terminal Settingsfrom Computer)
Contacts: Switches (using DO Terminal Settings from Computer)
3-10 Annunciator ScreensAnnunciator Screens display comprehensively the contacts status (mainly thealarm status). To display the Annunciator Screen, click the AnnunciatorScreen icon on the Overview Screen.
Switch screens using this button.
If an error occurs, the Error Display Paneland Screen Switching Button will both flash.
There are no particular limits to contacts that can be specified. Basically, howev-er, register contacts that display the alarm status of the Control Block’s HH(High/High Alarm), H (High Alarm), L (Low Alarm), and LL (Low/Low Alarm), etc.

3-11SectionOperation Guide Message Screens
65
If an alarm/error occurs, the icon color will change and a beep will sound. At thesame time, two rows of eight wide-size characters making a user-registeredmessage can be displayed.
You can display a total of 16 separate elements per screen as 4 rows x 4 col-umns, to a maximum of five screens.
Function block name (format) Send source Function Block, or ITEMTarget functionblock
1-Block Send Terminal to Computer(403)
Control Block: Contacts within Tag ITEMs for Basic PID (011),Advanced PID (012), Batch flowrate capture (014), Indicationand Setting (031), Indication and Operation (032), RatioSetting (033), Indicator (034), blended PID (013), 2-positionON/OFF (001), and 3-position ON/OFF (002).
4-Block Send Terminal to Computer(404)
Control Block: PV, SP, and MV only for Basic PID (011),Advanced PID (012), Indication and Setting (031), Indicationand Operation (032), Ratio Setting (033), Indicator (034),2-position ON/OFF (001), and 3-position ON/OFF (002).
Operation Block: High/Low Alarm (111), Segment Program2(157), ON/OFF Valve Manipulator (221), Motor Manipulator(222), Reversible Motor Manipulator (223), Motor OpeningManipulator (224), Timer (205), Counter (208)
DO to Computer (401), DO Terminalto all nodes (407)
Contact input signals or contact output signals for all FunctionBlocks, or contact value parameters
DO Terminal Settings fromComputer (409)
Contact output ITEM for DO Terminal Settings from Computer(Network resend only.)
Display Color, sound, and messages displayed when contact is ON.
Setting None
3-11 Operation Guide Message ScreensOperation Guide Message Screens display messages registered when the con-tact signal was turned ON. To display the Operation Guide Message Screen,click the Operation Guide Button.
When the specified contact (internal switch, etc.) is turned ON, the pre-preparedwide-size character message (32 characters x 2 lines) will be displayed togetherwith the time the contact was turned ON. (When the contact is turned ON, a redmark will be displayed next to the Operation Guide icon on the OverviewScreen.)
Possible No. of registrations: 100 messages max.

3-11SectionOperation Guide Message Screens
66
Message colors: 16 colors, displayed with sound.
You can display a message with a maximum of 1,000 elements on one screen.
Note The internal switches are collated as one by the DO to Computer and the AOTerminal to All Nodes function blocks, and then sent to the computer for use.
Function block name (format) Send source Function Block, or ITEMTargetfunctionblock
1-Block Send Terminal to Computer(403)
Control Block: Contacts within Tag ITEMs for Basic PID (011),Advanced PID (012), Batch flowrate capture (014), Indication andSetting (031), Indication and Operation (032), Ratio Setting (033),Indicator (034), blended PID (013), 2-position ON/OFF (001), and3-position ON/OFF (002).
4-Block Send Terminal to Computer(404)
Control Block: PV, SP, and MV only for Basic PID (011), AdvancedPID (012), Indication and Setting (031), Indication and Operation(032), Ratio Setting (033), Indicator (034), 2-position ON/OFF(001), and 3-position ON/OFF (002).
Operation Block: High/Low Alarm (111), Segment Program 2 (157),ON/OFF Value Manipulator (221), Motor Manipulator (222),Reversible Motor Manipulator (223), Motor Opening Manipulator(224), Timer (205), Counter (208)
DO to Computer (401) Contact input signals or contact output signals for all FunctionBlocks, or contact value parameters
DO Terminal Settings from Computer(409)
Contact output ITEM for DO Terminal Settings from Computer(Network resend only.)
Display Color, sound, and messages displayed when contact is ON.
Setting None
Operation Guide message data (date, time, contents of Operation Guide) canbe output in CSV (Comma Separated Value) file format using the following pro-cedure.
1, 2, 3... 1. Press the CSV Button to display the Export to CSV File Dialog Box.
2. Specify a name for the CSV file, and click the OK Button. A CSV file will becreated. (By clicking the Browse Button, the CSV file can be created in adesired folder. The default filename is Opglog.csv.) The contents of CSVfiles created are as follows.
“Operation Guide Message Log”(carriage return)<Screen_name>(carriage return)<Date_exported>(comma)<Time_exported>(carriage return)<Date_of_Operation_Guide>(comma)<Time_of_Opera-tion_Guide>(comma)<Contents_of_Operation_Guide>(carriage return)
Note “Contents of Operation Guide” refers to all the data in one line of anOperation Guide Message Screen.
CSV File Output

3-12SectionAlarm Log Screens
67
3-12 Alarm Log ScreensAlarm Log Screens display alarm logs. To display the Alarm Log Screen, clickthe Alarm Button.
The targets monitored for alarms are as follows: Control Block’s HH (High/HighAlarm), H (High Alarm), L (Low Alarm), LL (Low/Low Alarm), and DA (DeviationAlarm) contacts, and other contact signals (including parameters).
Display all Display only LIGHT (Light alarm),H (High alarm), or L (Low alarm)
Display only HEAVY (Heavy alarm), HH (High/High alarm), or LL (Low/Low alarm)
Display only current errors
Save and display comprehensively alarm records (time error occurred, Tagname, current value when PV or MV occurred, alarm type, etc.) occurring fromthe Controller and Alarm Blocks.
You can display a maximum of 1,000 alarm messages on one screen.
Element Function block name (model) Function block or ITEM set as send sourceFunction block 1-Block Send Terminal to Computer
(403)Control Block: High/High alarm, High alarm, Low alarm,Low/Low alarm, and Deviation alarm for Basic PID (011),Advanced PID (012), Batch flowrate capture (014), Indicationand Setting (031), Indication and Operation (032), RatioSetting (033), Indicator (034), blended PID (013), 2-positionON/OFF (001), and 3-position ON/OFF (002).
4-Block Send Terminal to Computer(404)
Control Block: High/High alarm, High alarm, Low alarm,Low/Low alarm, and Deviation alarm for Basic PID (011),Advanced PID (012), Indication and Setting (031), Indicationand Operation (032), Ratio Setting (033), Indicator (034),2-position ON/OFF (001), and 3-position ON/OFF (002),Segment Program 2 (157), ON/OFF Value Manipulator (221),Motor Manipulator (222), Reversible Motor Manipulator (223),Motor Opening Manipulator (224).
DO to Computer (401) Contact input signals or contact output signals for all FunctionBlocks, or contact value parameters
Display Alarm history (date and time of occurrence, and value whenalarm occurred)
Time of occurrence: Red; Time of recovery: Black
Setting None

3-13SectionOperation Log Screens
68
Alarm log data (date, time, current value when alarm occurred, type of alarm)can be output in CSV (Comma Separated Value) file format using the followingprocedure.
1, 2, 3... 1. Press the CSV Button to display the Export to CSV File Dialog Box.2. Specify a name for the CSV file, and click the OK Button. A CSV file will be
created. (By clicking the Browse Button, the CSV file can be created in adesired folder. The default filename is Almlog.csv.) The contents of CSVfiles created are as follows.“Alarm Log”(carriage return)<Date_exported>(comma)<Time_exported>(carriage return)<Date_of_alarm>(comma)<Time_of_alarm>(comma)<Con-tents_of_alarm>(carriage return)
Note “Contents of alarm” refers to all the data in one line of an Alarm LogScreen.
Example: The following screen shows how alarm log data exported tospreadsheet software (e.g., Microsoft Excel) will be displayed.
Date exported
Date ofalarm
Time ofalarm
Contents of alarm(All the data in one line ofan Alarm Log Screen)
3-13 Operation Log ScreensOperation Log Screens display operation logs. To display the Operation LogScreen, click the Operation Log Button.
Save and display comprehensively records (time and date operation occurred,Tag name, ITEM data before change, ITEM data after change, etc.) of ITEM datachanged within the Loop Control Unit, using the Control Screen or the TuningScreen.
CSV File Output

3-14SectionSystem Monitor Screens
69
You can display a maximum of 1,000 operation messages on one screen.
Operation log data (date, time, contents of operation) can be output in CSV(Comma Separated Value) file format using the following procedure.
1, 2, 3... 1. Press the CSV Button to display the Export to CSV File Dialog Box.
2. Specify a name for the CSV file, and click the OK Button. A CSV file will becreated. (By clicking the Browse Button, the CSV file can be created in adesired folder. The default filename is Ctrlog.csv.) The contents of CSV filescreated are as follows.
“Operation Log”(carriage return)<Screen_name>(carriage return)<Date_exported>(comma)<Time_exported>(carriage return)<Date_of_operation>(comma)<Time_of_operation>(comma)<Con-tents_of_operation>(carriage return)
Note “Contents of operation” refers to all the data in one line of an Opera-tion Log Screen.
Example: The following screen shows how operation log data exported tospreadsheet software (e.g., Microsoft Excel) will be displayed.
Date ofoperation
Time ofoperation
Contents of operation log(All the data in one line ofan Operation Log Screen)
Date exported
3-14 System Monitor Screens
3-14-1 System Monitor Screen OutlineSystem Monitor Screen display the system status, and runs/stops the Loop Con-trol Unit. To display the System Monitor Screen, click the System Monitor But-ton.
You can display and operate the following items.
Display/operation Item
Display All system allocationsp y
All CPU Unit modes
All Loop Control Unit statuses (run/stop)
Block errors (Execution errors, RAM checksum errors, batteryerrors)
Type of connection to computer (CLK, Ethernet, serial), andconnection status (OK, error)
Controller Link’s data link status (only with Controller Linkconnection)
Operation Loop Control Unit run/stop
CSV File Output

!
3-14SectionSystem Monitor Screens
70
Note The system status display on the System Monitor Screen depends on the set-tings made in the System Monitor Setting Window (using the System MonitorBuilder Button in the Setup Dialog Box).
Click the M Button to display the CPU Unit’s operation mode.
Click the E Button to display the Function Block Error dialog box. Refer to3-14-3 Block Error Dialog Box Operations later in this manual for details.
Displays 1 node
Shows the computerconnected to the CPU Unit.
Displays the connection type.
When connected to the ControllerLink, click the DTL Button todisplay the Controller Link DataLink Status Dialog Box. Refer to3-14-4 Data Link Status later inthis manual for details.
Displays the connection status
Select a number to display the run/stop command for the relevant Loop ControlUnit. Refer to 3-14-2 Loop Control Unit Run/Stop later in this manual foroperation details.
3-14-2 Loop Control Unit Run/Stop
WARNING Before starting a Loop Control Unit, check the following points.
• Make sure that I/O Units used in combination are correctly mounted. Also,make sure that the Unit number on the front of analog I/O Units agree with theUnit number set using the field terminals. If the Unit numbers do not agree, I/O(i.e., read and write) will be performed incorrectly, with data for another SpecialI/O Unit (with the Unit number set using the field terminal).
• Make sure that the initial settings for System Common Block within the LoopControl Unit are correct. In particular, check that data memory (DM) for nodeterminals within the CPU Unit used by the Loop Control Unit is not allocated toother applications in the PLC as well. If the same DM has been allocated twice,there is a risk that the PLC system will misoperate, resulting in injury.
• When writing data to the I/O memory in the CPU Unit with function blocks (e.g.,using Send All Blocks, Expanded DO/AO Terminal to CPU Unit, or DO/AO Ter-minal to CPU Unit), be sure that the words written to in the I/O memory are notbeing used for any other purpose. If I/O memory words are allocated to morethan one purpose, the PLC system may act unexpectedly and cause injury.
Note First sufficiently check system operation using the CX-Process Tool (check theload rate, etc.: Execution, Operation, Monitor Run Status), and sufficiently checkoperation (Monitor Run Status, Start) for the Function Block data that has beencreated, and then change to actual operation. In particular, first check that theload rate is 60% or less, and then change to actual operation. (Refer to the LoopControl Unit Operation Manual for load rate details.)

3-14SectionSystem Monitor Screens
71
1, 2, 3... 1. Click the number button for the Loop Control Unit you want to use, as shown.
Click here.
The Run/Stop Command Dialog Box will be displayed as shown.• Loop Control Unit is stopped.
• Loop Control Unit is running.
2. Select Stop, HOT START, or COLD START, and then click the ExecuteButton.Click the Refresh Button to check and redisplay the run status of the LoopControl Unit.
3-14-3 Function Block Error Dialog Box Operations1, 2, 3... 1. Click the E Button.
Click here
The Function Block Error Dialog Box will be displayed.
Note A Block database error indicates an error has occurred in the functionblock database.

3-14SectionSystem Monitor Screens
72
The Function Block Error Dialog Box is displayed in green during normal op-eration, and red if there is an error.
2. Click the Execution Error or the Block Database Error button (Battery Er-ror is displayed only and cannot be selected).
The Details of Function Block Error Dialog Box will be displayed.
0 = Normal (no errors), –1 = Block number not in use, 90 = Relevant FunctionBlock has a database error.
0 = Normal (no errors), –1 = Block number not in use, other numbers (1 to 89) =Error code.
The following table gives the function error codes.
Code Description Explanation Operation at Error Remedy
0 Normal
1 Connectionterminal/outputterminal connectionnot defined
Either the function block isnot registered to the blockaddress of the sourcedesignation or thedestination, or the ITEMnumber does not exist.
Running of the functionblock in question isstopped, and the functionsin question do not operatenormally.
Check the block addressand ITEM number of thesource designation ordestination designation.
2 Default error When run/stop commandS1 turned ON in the rampprogram or segmentprogram, the referenceinput was outside the riseramp range.
The program is not started. Check the connection ofthe reference input andprogram settings.
3 Variable value error A constant between A1and A8 or an intermediatebuffer between B1 and B4that is used in theconditional statement forArithmetic Operation(Block Model 126) is notdefined.
Execution of the ArithmeticOperation block will bestopped.
Set definitions for allconstants A1 to A8 and anintermediate buffers B1 toB4 that are used.
Block Database Error
Execution Error

3-14SectionSystem Monitor Screens
73
Code RemedyOperation at ErrorExplanationDescription10 Operation process:
Division by “0”An attempt was made toexecute division by a “0”denominator in theoperation process.
In the case ofMultiplication, DI/AITerminal from CPU Unit,DI/AI Terminal fromExpanded CPU Unit orField Terminal blocks, themaximum value is output.In the case of the SegmentLinearizer or Temperatureand Pressure Correctionblocks, the previous datais retained.
In the case of DI/AITerminal from CPU Unit,DI/AI Terminal fromExpanded CPU Unit orField Terminal blocks,check the scaling value,and in the case of theSegment Linearizer block,check the setting value ofthe input coordinate side.In the case of temperatureand pressure correction,check the gain bias value.
An attempt was made toexecute division by a ”0”denominator in ArithmeticOperation block (BlockModel 126).
Execution of the ArithmeticOperation block will bestopped.
Check the contents of theconditional statement andcalculation expressions fordivision by 0.
11 Operation process:Operation out ofrestricted value
The output value of theoperation result exceededthe data length of twobytes.
Note An error does not occureven if the outputrange (e.g., 320.00) isexceeded if the datalength of two bytes isnot exceeded.
Output becomes themaximum value orminimum value of theoutput range. (Forexample, when the outputrange is 320.00, the outputbecomes +320.00 or320.00.)
If there is a problem,review the settings ofrelated ITEMs.
The arguments or resultsfor a Arithmetic Operationblock exceed the definedlimits.
Execution of the ArithmeticOperation block will bestopped.
Check the contents of theconditional statement andcalculation expressionsand correct the mistake.
12 Argument beyonddefinition
An argument used inArithmetic Operation(Block Model 126) isbeyond the definition.
Execution of the ArithmeticOperation block will bestopped.
Check the range of thearguments and correct theconditional statement orcalculation expressions.
15 AT error A limit cycle cannot begenerated for Basic PID(Block Model 011) orAdvanced PID (BlockModel 012) or suitable PIDconstants cannot becalculated.
Execution of the relevantblock will be stopped.
Check the following ATparameters: ITEM 036 toITEM 040. Also, set ITEM051 to 2 s or less.
19 Inappropriateoperation
Two or more S1 to S3select switches are set to 1(ON) at the same time inthe 3-output Selector block(Block Model 163) or3-input Selector block(Block Model 164).
The output value that wasactive before the erroroccurred is held.
Re-program the StepLadder Program block sothat S1 to S3 selectswitches are set to 1 (ON)independent of each other.
20 Download terminaldata exchange error
Data exchange with theCPU Unit is not beingexecuted correctly on theCPU Unit Terminal,Expanded CPU UnitTerminal, Node Terminalsand Field Terminal blocks.
The data of the functionblock in question is notupdated.
If a malfunction hasoccurred on the CPU Unit,follow the remedy for thaterror. If the CPU Unit isnormal, turn ON the powersupply again.

3-14SectionSystem Monitor Screens
74
Code RemedyOperation at ErrorExplanationDescription
21 I/O memory addressout-of-range
An address out of the I/Omemory address rangehas been specified on theCPU Unit Terminal,Expanded CPU UnitTerminal, Node Terminalsand Field Terminal blocks.
Operation of the functionblock in question isstopped.
On the CPU Unit Terminaland Expanded CPU UnitTerminal blocks, check theleading address, and onfield terminals check thesetting of the CIO (channelI/O) Area number setting.
In the case of NodeTerminals, check thesetting of the “leadingaddress of the memory forthe node terminals”specified by SystemCommon block ITEM043.
29 Reception error forexternal device
A communications frameerror was generated by thedata received from anES100X Controller for anES100X ControllerTerminal (Block Model045). (An FCS check erroror frame error occurred 3times in a row.
Communications will bestopped with the specifiedES100X and tried withanother ES100X.
Check the communicationspath and thecommunications settings(7 data bits, even parity,and 2 stop bits).
30 Response timeout A response was notreturned after sending datato the Controller for aES100X ControllerTerminal (Block Model045). (Response was notreturned for 5 s 3 times.)
Communications will bestopped with the specifiedES100X and tried withanother ES100X.
Check the communicationspath, the communicationssettings (7 data bits, evenparity, and 2 stop bits), andother required settings inthe ES100X (parametersetting mode, unit number,etc.).
31 Controller unit numberduplicated
The unit number set inITEM 006 for a ES100XController Terminal (BlockModel 045) is the same asanother ES100X ControllerTerminal. (A responsetimeout will occur if the unitnumber does not exist.)
Communications will bestopped with the ES100XControllers
Change the unit numbersettings (ITEM 006)so thateach is used only once.
70 Illegal combination offunction blocks
The function block on theprimary loop side is notbasic PID or advanced PIDwhen bumplessprocessing betweenprimary/secondary loopswas specified in basic PIDor advanced PID.
Running of the functionblock in question isstopped.
Check the function blockmodel number on theprimary loop side.
71 Inappropriateparameter
a) When restricted conditionsare applied across twoITEMs:(example: when the unitpulse output is equal to orgreater than the operationcycle when there is unitpulse output in run time ac-cumulation)
b) An attempt has been madeto write out-of-range data atthe ITEM Setting block.3.
a) The function block in ques-tion is not executed.
b) Data cannot be written.
Check the settings of theITEMs.
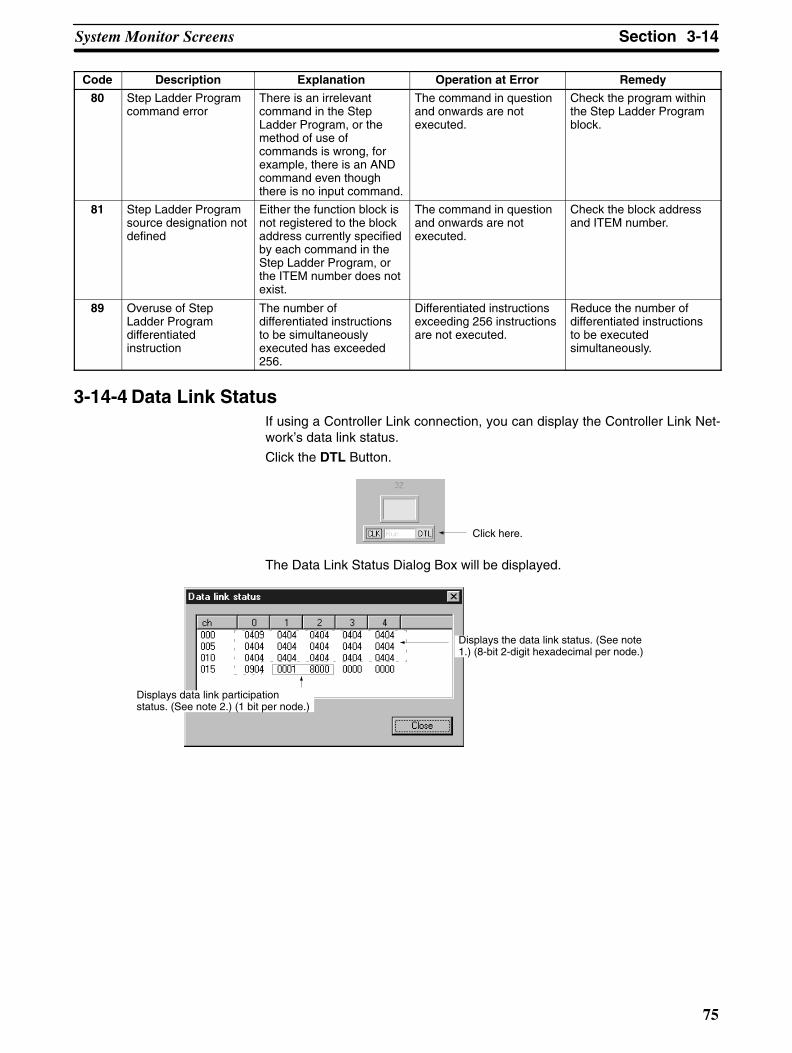
3-14SectionSystem Monitor Screens
75
Code RemedyOperation at ErrorExplanationDescription
80 Step Ladder Programcommand error
There is an irrelevantcommand in the StepLadder Program, or themethod of use ofcommands is wrong, forexample, there is an ANDcommand even thoughthere is no input command.
The command in questionand onwards are notexecuted.
Check the program withinthe Step Ladder Programblock.
81 Step Ladder Programsource designation notdefined
Either the function block isnot registered to the blockaddress currently specifiedby each command in theStep Ladder Program, orthe ITEM number does notexist.
The command in questionand onwards are notexecuted.
Check the block addressand ITEM number.
89 Overuse of StepLadder Programdifferentiatedinstruction
The number ofdifferentiated instructionsto be simultaneouslyexecuted has exceeded256.
Differentiated instructionsexceeding 256 instructionsare not executed.
Reduce the number ofdifferentiated instructionsto be executedsimultaneously.
3-14-4 Data Link StatusIf using a Controller Link connection, you can display the Controller Link Net-work’s data link status.
Click the DTL Button.
Click here.
The Data Link Status Dialog Box will be displayed.
Displays the data link status. (See note1.) (8-bit 2-digit hexadecimal per node.)
Displays data link participationstatus. (See note 2.) (1 bit per node.)

3-14SectionSystem Monitor Screens
76
Note 1. Data link status: The data link status is displayed for each node using thefollowing 8 bits (2-digit hexadecimal).
Bit Contents
Odd nodeaddresses
Even nodeaddresses
0 8 PLC status (0: Inactive, 1: Active)
1 9 PLC’s CPU Unit error (0: Normal, 1: Error)
2 10 Communications error (data link reception) (0:Normal, 1: Error)
3 11 Data link participation (0: Not in data link or datalink inactive, 1: In data link)
4 12 Offset error (0: Normal, 1: Error)
5 13 Insufficient (short) receive area (0: Sufficient, 1:Insufficient)
6 14 Remaining receive area (0: Not remaining, 1:Remaining)
7 15 Set to 0
The relationship between nodes and words displayed on the screen is asfollows:
Word 0 1 2 3 4
000 Node 2 Node 1 Node 4 Node 3 Node 6 Node 5 Node 8 Node 7 Node 10 Node 9
005 Node 12 Node 11 Node 14 Node 13 Node 16 Node 15 Node 18 Node 17 Node 20 Node 19
010 Node 22 Node 21 Node 24 Node 23 Node 26 Node 25 Node 28 Node 27 Node 30 Node 29
015 Node 32 Node 31 Data linkparticipation status(nodes 1 to 16)
Data linkparticipation status(nodes 17 to 32)
Set to00
Set to00
Set to00
Set to00
2. Data Link Participation Status
Network participation status (0: Not part of the network, 1: Part of the net-work)
The relationship between nodes and each bit in a word on the screen is asfollows:
Word Bit
15 14 13 12 11 10 9 8 7 6 5 4 3 2 1 0
016 16 15 14 13 12 11 10 9 8 7 6 5 4 3 2 1
017 32 31 30 29 28 27 26 25 24 23 22 21 20 19 18 17
Refer to the Controller Link Unit or Board manuals for details of data link sta-tus.

3-15SectionSystem Monitor Log Screens
77
3-15 System Monitor Log ScreensSystem Monitor Log Screens record and display run/stop logs and the executionerror logs as soon as they occur. To display the System Monitor Log Screen,click the System Monitor Log Button.
Display is red for an occurrence, and black following recovery.
System monitor log data (date, time, contents of runs/stops and executionerrors) can be output in CSV (Comma Separated Value) file format using the fol-lowing procedure.
1, 2, 3... 1. Press the CSV Button to display the Export to CSV File Dialog Box.
2. Specify a name for the CSV file, and click the OK Button. A CSV file will becreated. (By clicking the Browse Button, the CSV file can be created in adesired folder. The default filename is Sysmlog.csv.) The contents of CSVfiles created are as follows.
“System Monitor Log”(carriage return)<Date_exported>(comma)<Time_exported>(carriage return)<Date>(comma)<Time>(comma)<Contents_of_system_moni-tor_log>(carriage return)
Note “Contents of system monitor log” refers to all the data in one line of aSystem Monitor Log Screen.
CSV File Output

79
SECTION 4Configuration Screens
This section describes operating procedures to create screens and monitor using the CX-Process Monitor.
4-1 Before Configuring 80. . . . . . . . . . . . . . . . . . . . . . . . . . . . . . . . . . . . . . . . . . . . . . . . . . . . . . . 4-2 Basic Configuration Procedure 82. . . . . . . . . . . . . . . . . . . . . . . . . . . . . . . . . . . . . . . . . . . . . . 4-3 Basic Configuration Operations 83. . . . . . . . . . . . . . . . . . . . . . . . . . . . . . . . . . . . . . . . . . . . . .
4-3-1 Starting and Stopping 83. . . . . . . . . . . . . . . . . . . . . . . . . . . . . . . . . . . . . . . . . . . . . . 4-3-2 Mode Selection Dialog Box 83. . . . . . . . . . . . . . . . . . . . . . . . . . . . . . . . . . . . . . . . . . 4-3-3 Password 84. . . . . . . . . . . . . . . . . . . . . . . . . . . . . . . . . . . . . . . . . . . . . . . . . . . . . . . . 4-3-4 Setup Dialog Box 85. . . . . . . . . . . . . . . . . . . . . . . . . . . . . . . . . . . . . . . . . . . . . . . . . .
4-4 System Monitor Settings 86. . . . . . . . . . . . . . . . . . . . . . . . . . . . . . . . . . . . . . . . . . . . . . . . . . . 4-5 Creating Graphic Screens 89. . . . . . . . . . . . . . . . . . . . . . . . . . . . . . . . . . . . . . . . . . . . . . . . . . .
4-5-1 Outline 89. . . . . . . . . . . . . . . . . . . . . . . . . . . . . . . . . . . . . . . . . . . . . . . . . . . . . . . . . . 4-5-2 Graphic Screen Creation Window Operations 90. . . . . . . . . . . . . . . . . . . . . . . . . . . . 4-5-3 Basic Operations 94. . . . . . . . . . . . . . . . . . . . . . . . . . . . . . . . . . . . . . . . . . . . . . . . . . 4-5-4 Graphic Objects 94. . . . . . . . . . . . . . . . . . . . . . . . . . . . . . . . . . . . . . . . . . . . . . . . . . . 4-5-5 Creation Example 95. . . . . . . . . . . . . . . . . . . . . . . . . . . . . . . . . . . . . . . . . . . . . . . . .
4-6 Screen Configuration 99. . . . . . . . . . . . . . . . . . . . . . . . . . . . . . . . . . . . . . . . . . . . . . . . . . . . . . 4-6-1 CRT Builder Functions 99. . . . . . . . . . . . . . . . . . . . . . . . . . . . . . . . . . . . . . . . . . . . . 4-6-2 Overview of Screen Registration 100. . . . . . . . . . . . . . . . . . . . . . . . . . . . . . . . . . . . . . 4-6-3 Registering Operation Guide Messages 112. . . . . . . . . . . . . . . . . . . . . . . . . . . . . . . . . 4-6-4 Registering Alarm Messages 114. . . . . . . . . . . . . . . . . . . . . . . . . . . . . . . . . . . . . . . . . 4-6-5 Saving Settings 116. . . . . . . . . . . . . . . . . . . . . . . . . . . . . . . . . . . . . . . . . . . . . . . . . . . 4-6-6 Deleting Registered Screens 116. . . . . . . . . . . . . . . . . . . . . . . . . . . . . . . . . . . . . . . . . 4-6-7 Starting the Monitor Process 117. . . . . . . . . . . . . . . . . . . . . . . . . . . . . . . . . . . . . . . . .
4-7 System Information Settings 117. . . . . . . . . . . . . . . . . . . . . . . . . . . . . . . . . . . . . . . . . . . . . . . . 4-7-1 Setting for Stopping Alarm Sound 128. . . . . . . . . . . . . . . . . . . . . . . . . . . . . . . . . . . .
4-8 Checking Configurations 131. . . . . . . . . . . . . . . . . . . . . . . . . . . . . . . . . . . . . . . . . . . . . . . . . . . 4-8-1 Starting the Monitor Process 132. . . . . . . . . . . . . . . . . . . . . . . . . . . . . . . . . . . . . . . . . 4-8-2 Executing File Mapping and Starting the Monitor Process 132. . . . . . . . . . . . . . . . . . 4-8-3 Displaying the Overview Screen 134. . . . . . . . . . . . . . . . . . . . . . . . . . . . . . . . . . . . . . 4-8-4 Setting the Auto-start Function 134. . . . . . . . . . . . . . . . . . . . . . . . . . . . . . . . . . . . . . . 4-8-5 Ending the Monitor Process 134. . . . . . . . . . . . . . . . . . . . . . . . . . . . . . . . . . . . . . . . . .

4-1SectionBefore Configuring
80
4-1 Before ConfiguringTo send tag data to the CX-Process Monitor, you must first perform the followingthree operations using CX-Process Tool.
Register Function Blocks for Data Exchange
Note The function blocks include the Send to Computer Block (401 to 404), Send Ter-minal to All Nodes Block (407 and 408), and DO/AO Terminal Settings fromComputer (409 and 410).
Example: Register the 1-Block Send Terminal to Computer Function Block, andspecify block address 001 as the send source.
Specify send source
Enter the tag names. The CX-Process Monitor differentiates data using tagnames.
Example: 1-Block Send Terminal to Computer/4-Block Send Terminal to Com-puter (403 and 404)
Item Max. No. of characters Forbidden characters
Tag Name 8 standard characters None
Tag comment 16 standard characters None
Note Make sure to set the range high limit (RH) and range low limit (RL) to indicate thethe CX-Process Monitor scaling within the following range.
No. of digits 5 digits max. (Including symbols and digits below thedecimal point.)
Value range –5000 to 99999
Example: With one digit below the decimal point:–550.0 to 9999.9
Set the Tag Names

4-1SectionBefore Configuring
81
Compile monitor tags for CX-Process Monitor using the following operation.This operation is possible only when CX-Process Monitor is installed.
1, 2, 3... 1. From the Execution Menu, select Output Tag Files - Monitor Tags. TheCompile Monitor Tags Dialog Box, shown below, will be displayed.
2. Click the Compile Button. The Compiler Dialog Box, shown below, will bedisplayed.
3. Click the Start Button.
When compilation is complete, the following screen will be displayed.
Note The Monitor Tag file (i.e., Monitor Tag data for one CPU Unit) is com-piled automatically with a fixed file name in the following directory, us-ing the compile operation.
Directory: Omron/CX-Process Monitor/db (The underlined part is the direc-tory in which the CX-Process Monitor is installed.)
File names: mtagmst and mtagsubmst
Compiling Monitor Tags

4-2SectionBasic Configuration Procedure
82
4-2 Basic Configuration Procedure
Select Omron, CX-Process Monitor, CX-Process Monitor from Windows Start Menu.
In the Main Window, click the Start Button.
In the Mode Selection Dialog Box, click the Engineer Button.
In the Mode Selection Dialog Box, click the Set Up Button.
Enter the password.
In the Setup Dialog Box, click the System Monitor Builder Button, and set the communications conditions,etc., in the System Monitor Setting Window. (Only if using serial communications, when starting the monitorprocess, the FinsGateway Serial Unit may start depending on the communications conditions that have beenset.)
In the Setup Dialog Box, click the Graphic Builder Button, and then in the GraphicBuilder, create the Graphic Screen (including Tag name selection, etc.,), and save.
In the Setup Dialog Box, click the CRT Builder Button, and set the Builder window
1. Select Settings, Register Screen.
2. Select new screen type.
3. Click New.
4. Double-click Tag Name, and select the Tag name.
5. Double-click Detailed Settings, and make thedetailed settings.
1. Select Settings, Register Screen.
2. Select new screen type.
3. Click New.
4. Select the Graphic Screen that has been saved.
In CRT Builder, select the Settings Menu, and then select Save, and then click the OK Button.
Set the main system settings under System Information. (Refer to 4-7 System Information Settings.)
Check the screen configuration that has been set. (Refer to 4-8 Checking Configurations.)

4-3SectionBasic Configuration Operations
83
4-3 Basic Configuration Operations
4-3-1 Starting and StoppingStarting
1, 2, 3... 1. Select Programs, Omron, CX-Process Monitor, and CX-Process Moni-tor from the Windows Start Menu.
The CX-Process Monitor Main Window will be displayed.
2. Click the Start Button. The Mode Selection Dialog Box will be displayed asshown below.
3. Select the function.
In the Main Window, click the Exit Button.
The Main Window will close, and CX-Process Monitor will stop running.
4-3-2 Mode Selection Dialog BoxThis section explains the functions of the Mode Selection Dialog Box.
1, 2, 3... 1. In the Main window, click the Start Button.
Stopping

4-3SectionBasic Configuration Operations
84
The Mode Selection Dialog Box will be displayed.
You cannot configure the screenusing Operator mode.
1. Click the Engineer Button toconfigure the screen, and tostart and stop processing.
2. Click the Set Up Button toconfigure the screen, and tostart and stop processing.
When you click the Set UpButton, the Enter PasswordScreen will be displayed.
Click the Cancel Button to closethe dialog box and return to theMain Window.
Note If you did not set a password the first time you started CX-Process Monitor, whenyou click the Set Up Button, the password registration screen will be displayed.Register a password, and unless the correct password is entered thereafter, youcannot configure the screen or make any settings. Make sure that people whomake settings register a password.
2. To set the CX-Process Monitor (i.e., to configure the screens, edit theGraphic Screen, and run/stop processing, etc.), first click the Engineer But-ton (which is the default), and then click the Set Up Button. The input pass-word box will be displayed.
3. Enter the password, and click the OK Button. The Setup Dialog Box will bedisplayed.
4-3-3 PasswordSet the password to configure the CX-Process Monitor Screen and to protect thesettings you have made.
Note Register a password, and unless the correct password is entered thereafter, youcannot change to Engineer mode to make any settings (i.e., use the Set Up But-ton in the Mode Selection Dialog Box).
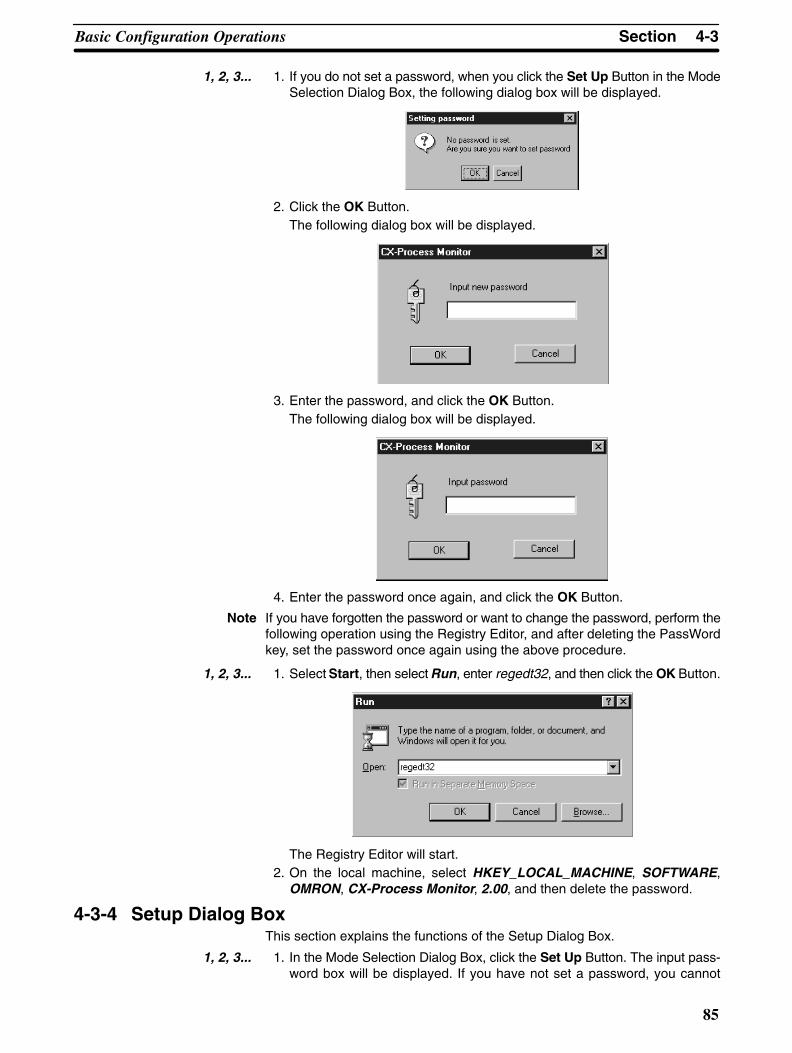
4-3SectionBasic Configuration Operations
85
1, 2, 3... 1. If you do not set a password, when you click the Set Up Button in the ModeSelection Dialog Box, the following dialog box will be displayed.
2. Click the OK Button.The following dialog box will be displayed.
3. Enter the password, and click the OK Button.The following dialog box will be displayed.
4. Enter the password once again, and click the OK Button.
Note If you have forgotten the password or want to change the password, perform thefollowing operation using the Registry Editor, and after deleting the PassWordkey, set the password once again using the above procedure.
1, 2, 3... 1. Select Start, then select Run, enter regedt32, and then click the OK Button.
The Registry Editor will start.2. On the local machine, select HKEY_LOCAL_MACHINE, SOFTWARE,
OMRON, CX-Process Monitor, 2.00, and then delete the password.
4-3-4 Setup Dialog BoxThis section explains the functions of the Setup Dialog Box.
1, 2, 3... 1. In the Mode Selection Dialog Box, click the Set Up Button. The input pass-word box will be displayed. If you have not set a password, you cannot

4-4SectionSystem Monitor Settings
86
change to Engineer mode. Refer to 4-3-3 Password Settings above for howto set the password.
2. Enter the password, and click the OK Button.
The Setup Dialog Box will be displayed.
3. Click any button, and then select a function.
Setup Dialog Box
Sets auto-start, tuningtrend scale display,multi-screen, labelinformation, alarm soundinformation, and ten-key.Refer to 4-7 SystemInformation Settings fordetails.
1. Sets the SystemMonitor Screen. Refer to4-4 System MonitorSettings for details.
2. Opens the GraphicScreen Create Window.Refer to 4-5 GraphicScreen Creation fordetails.3. Configures the screen.Refer to 4-6 ScreenConfiguration for details.
Refer to the following sections for details on the functions of each button.
4-4 System Monitor SettingsUsing the System Monitor Setting Window, register the PLC and Loop ControlUnit to be monitored using the System Monitor Screen. Also register the localcomputer to perform the monitoring.
The setting items are as follows:
PLC setting PLC node number (address) Use the System MonitorS f hi i
g
Loop Control Unit address
yScreen for this setting.
Computer setting Computer node number (default is 32)p g
Communications type (CLK, Serial, Ethernet) (Use theSystem Monitor Screen to set CLK or Ethernetcommunications.)
For serial connections, you must also set the COM port andbaud rate.
With serial (Host Link) communications only, when you start the Monitor Process(i.e., select Start Up in the Setup Dialog Box), FinsGateway communicationswill start according to the communications conditions given below that havebeen set.
• Communications type: Serial (Host Link)
• COM port used and baud rate
Note The PLC settings (node address, Unit address, etc.) set here can beused only from the System Monitor Screen. Actual communicationsprocessing depends on the network address, node address, and Unitaddress set using the CX-Process Tool. Controller Link and Ethernetsettings within the computer settings made here can also be usedonly from the System Monitor Screen. Perform actual communica-tions processing by manually starting FinsGateway.

4-4SectionSystem Monitor Settings
87
Note Set the PLC settings (node address, Unit address, etc.) made here to agree withthe network address, node address, and Unit address settings made using CX-Process Tool. If the settings do not agree, monitoring using the System MonitorScreen will not be performed correctly.
1, 2, 3... 1. In the Setup Dialog Box, click the System Monitor Builder Button.
Click here
The System Monitor Setting Window will be displayed.
Specify the node address of the computer connected tothe PLC (the default is 32). Normally, be sure to allocate32 to the computer connected to the PLC. Also set thenode address of the personal computer for FinsGatewayto 32.
2. Select the node address allocated to the PLC or computer. Select the buttondisplayed beneath the node address. Normally, the computer is node 32.The System Monitor Builder Dialog Box will be displayed.
Select PLC to enable the Settings Button.
Select computer to enable the NetworkType Button.
3. Select the device (PLC or computer), and then make the appropriate set-tings.

4-4SectionSystem Monitor Settings
88
In Node Type, select PC to enable the Settings Button.Click the Settings Button. The following dialog box will be displayed.
Note When mounting multiple Loop Control Units to a single PLC, register the Units inascending order of unit addresses and LCU numbers.
You can connect up to three Loop Control Units to one PLC. Select the check boxfor the Loop Control Unit mounted to the PLC, and enter the unit address.Click the OK Button to return to the Set Node Dialog Box.
Note The unit address value for each node Unit (address) set here can be used onlyfrom the System Monitor Screen. Which Loop Control Unit’s data and which PLCCX-Process Monitor will access depends on the network address, node ad-dress, and unit address set using CX-Process Tool. (This is linked to the Tag in-formation.)
In Node Type, select Computer to enable the Network Type Button.Click the Communication type setting Button. The following dialog box will ap-pear.
The Details button will be enabled if youselect Serial. If you click the Details Button,the following dialog box will be displayed.
In Network Type, select CLK, Serial, or Ethernet.If you select Serial, set the computer COM port, and the baud rate. If necessary,also set Initialize serial port. Refer to the following Note.Click the OK Button to return to the Set Node Dialog Box.
Note a) If you set the communications type to Serial (Host Link), when youstart the monitor process (i.e., select Start Up in the Setup DialogBox), FinsGateway Serial Unit driver will start according to thecommunications conditions set here. If you have not selected Ini-tialize serial port, however, the FinsGateway Serial Unit driverwill not start automatically.If you select another communications type (Controller Link orEthernet), the communications type set here can be used onlyfrom the System Monitor Screen. You must start the FinsGatewaymanually.
PLC Settings
Computer

4-5SectionCreating Graphic Screens
89
b) When using Controller Link as the communications network, youmust create Controller Link data link tables, and register to eachnode (refer to Appendix B FinsGateway Settings when Con-nected Using Controller Link). Use Ethernet as the communica-tions type if not creating data link tables.
4. When you have finished making all the PLC and computer settings, click theOK Button in the System Monitor Settings Window. This completes the Sys-tem Monitor settings.
4-5 Creating Graphic Screens
4-5-1 OutlineThe Graphic Screen displays schematically the device status.
Create the Graphic Screen using the Graphic Builder.
• Paste to the screen graphics representing plant instrumentation, which havebeen pre-prepared, and use them to display the device status, to a maximumof 200 screens.
• Pre-prepared fixed graphics: Text, instruments, thermometers, transmitters,orifices.
• Pre-prepared changeable graphics:
Analog inputs: Bar graph displays, numerical value displays, tanks
Analog settings: Numerical settings (See note.)
Contact inputs (display): Pumps, valves, pipes
Contact settings (operation): Switches (See note.)
Note If setting analog values or contact settings, use AO Settings from Computer orDO Settings from Computer Tags.
• For other fixed graphics, read and paste graphics created using bitmap files.Basically, after cutting and pasting the background and other graphics, pastethe pre-prepared fixed or changeable graphic display elements mentionedabove to create the complete Graphic Screen.

4-5SectionCreating Graphic Screens
90
Element Function block name (model) Function block or ITEM set as send sourceFunction block 1-Block Send Terminal to Computer
(403)Control Block: Tag ITEMs for Basic PID (011), Advanced PID(012), Batch flowrate capture (014), Indication and Setting(031), Indication and Operation (032), Ratio Setting (033),Indicator (034), blended PID (013), 2-position ON/OFF (001),3-position ON/OFF (002)
4-Block Send Terminal to Computer(404)
Control Block: Basic PID (011), Advanced PID (012),Indication and Setting (031), Indication and Operation (032),Ratio Setting (033), Indicator (034), 2-position ON/OFF (001),3-position ON/OFF (002)
Operation Block: High/Low Alarm (111), Segment Program2(157), ON/OFF Valve Manipulator (221), Motor Manipulator(222), Reversible Motor Manipulator (223), Motor OpeningManipulator (224), Timer (205), Counter (208)
AO to Computer (402), AO Terminalto all nodes (408)
Analog input signals or analog output signals for all FunctionBlocks, or analog value parameters
DO to Computer (401), DO Terminalto all nodes (407)
Contact input signals or contact output signals for all FunctionBlocks, or contact value parameters
AO Terminal Settings fromComputer (410)
Analog output ITEM for AO Terminal Settings from Computer(Used to set ordinary analog values. Displays using networkresend monitoring.)
DO Terminal Settings fromComputer (409)
Contact output ITEM for DO Terminal Settings from Computer(Used to set ordinary contact values. Displays using networkresend monitoring.)
Display Analog values: Bar graphs, numerical values, tank level
Contacts: Indicators, pumps, valves, pipes
Setting Analog values: Numerical values (using AO Terminal Settingsfrom Computer)
Contacts: Switches (using DO Terminal Settings fromComputer)
Note If the WS02-LCTK1-EL01 License Key is not connected to the computer printerport, or even if it is connected, if the License key driver is not installed, you can-not use the Graphic Builder. (If you try to click the Graphic Builder Button andchange to the Graphic Builder, an error message will be displayed.)
4-5-2 Graphic Screen Creation Window OperationsIn the Setup Dialog Box, click the Graphic Builder Button.
Click here
Starting

4-5SectionCreating Graphic Screens
91
The Graphic Builder will be displayed.
In the File menu, click Exit.The Graphic Builder will close.
Note 1. When using the Graphic Screen, first create and save the graphics usingGraphic Builder (using the CRT Builder Button in the Setup Dialog Box),and then register the saved graphics in the Overview Screen in the formatyou have selected. Consequently, before registering the graphics in theOverview screen, you must create and save the graphics using the GraphicBuilder.
2. If you have not saved the edited data when you click Exit, a window recom-mending that you save the data will be displayed. Save all necessary data.After performing this operation, the Graphic Builder will close.
3. You must configure the screen to display the Graphics Screen you havecreated using CX-Process Monitor. Refer to Graphic Screen Registration in4-6 Screen Configuration for how to make the settings.
This shows the commands available in the Graphics Builder.
Menu Command Shortcutkey
Function
File New Ctrl + N Create new Graphic Screen
Open Ctrl + O Close created Graphic Screen
Save Ctrl + S Overwrite project being edited
Save As --- Save project being edited with a new name
Delete File Information --- Specify name of a registered Graphic Screen, anddelete that file information
Modify File Information --- Specify name of a registered Graphic Screen, andchange the file information for it
Recent Files --- Display the most recent files
Exit --- Close Graphic Builder
Stopping
Menu Command

4-5SectionCreating Graphic Screens
92
Menu FunctionShortcutkey
Command
Edit Undo Ctrl + Z Undo the previous operation
Cut Ctrl + X Cut the specified range
Copy Ctrl + C Copy the specified range
Paste Ctrl + V Paste the contents of the clipboard
Delete Del Delete the specified range
Select All Ctrl + A Select all items
Create/Paste Objects --- Display the Insert Objects dialog box
Select and create objects from the menu of objectssupported by CX-Process Monitor and objects that canbe inserted into the Graphic Screen.
Specify and paste file names
Links ---
Object --- Open the selected object
View Toolbars --- Select whether to display or hide toolbars
Paper Color: BasicColor/System Color
--- Set the background color
Basic color: Set the background color
System color: Restore the default background color
Display Frame --- Select whether to display or hide object frame
Grid line --- Set the grid lines
20 point, 40 point, 60 point, none
You can also change the line color
Refresh --- Refresh the screen
Move To Front + Move the selected object to the front
To Back – Move the selected object to the back
To Top Ctrl + + Move the selected object to the top
To Bottom Ctrl + – Move the selected object to the bottom
Align: Vertical/Horizontal --- Vertical: Align vertically multiple selected objects
Horizontal: Align horizontally multiple selected objects
Insert Object Tank --- Insert a tankj
Pipe --- Insert a pipe
Pump --- Insert a pump
Valve --- Insert a valve
Meter bar --- Insert a meter bar
Parts --- Insert parts (instrument, thermometer, transmitter, ororifice)
Switch --- Insert a switch
Numerical Data Box --- Insert a data box
Text Box --- Insert a text box
Help Help Topics --- Display the Help Topics dialog boxp
About Graphic Builder --- Display the Graphics Builder version information

4-5SectionCreating Graphic Screens
93
To display or hide the toolbar, select View, Toolbars.
The following functions are displayed on the Graphic Builder toolbar.
Icon Function
New
Open
Save
Cut
Copy
Paste
To Top
To Bottom
To Front
To Back
Align multiple objects vertically
Align multiple objects horizontally
Insert a tank
Insert a pipe
Insert a pump
Insert a valve
Insert a meter bar
Insert a numerical data box
Insert parts (instrument, thermometer, transmitter, or orifice)
Insert a switch
Insert a text box
Refresh the screen
About Graphic Builder
Graphics Builder Toolbar

4-5SectionCreating Graphic Screens
94
4-5-3 Basic Operations
The following table displays the basic Graphic Builder operations (operationsother than those displayed on the menu and toolbars).
Objective Operation
Select object Double-click
Select multiple objects Drag to surround the multiple objects
Cancel selection Click an area outside of the selected object
Move object Select the object, and then drag it
Enlarge/reduce object Select the object, and then drag one of the 8 pointsdisplaying the outline of the object
Set object properties(shape, color, font, etc.)
Right-click the object, select Grf*** Control Object,Properties, and then select the tab for the item you want toset.
4-5-4 Graphic Objects
Ele-ments
Object name Shape (typical) Display/settingfunction
General properties
Change-ableobjects
Tank Displays analogvalue
Number of divisions, High limit, Low limit, type(Tank 1 to Tank 3), Tag data
Pipe Displays contact Display Frame, top line, bottom line, right line,left line, color, Tag data
Pump Displays contact Direction (Up, Down, Right, Left), color, Tagdata
Valve Displays contact Type (horizontal/vertical), Up square/Rightsquare/Left square/Up semicircle/Rightsemicircle/Left semicircle, Tag data
Meter bar Displays analogvalue
Number of divisions, High limit, Low limit,direction (vertical/horizontal), Tag data
Numerical Data Box Displays analogvalue (displaysnumerical value),and analog valuesetting (numericalvalue setting)
Type (3D display, display frame 0 to 4, flatdisplay), Tag data, display data/input data
Switch Displays contact(indicator), andcontact setting(switch)
ON text string, ON START/ON STOP, OFF textstring, OFF START/OFF STOP, ON color, OFFcolor, type (DI/DO), Tag data, operationconfirmation (Y/N)
Fixedobjects
Text box --- Text, Type (3D display/display frame 0 to 4/flatdisplay)objec s
Parts Transmitter Direction (up/down/right/left)
Orifice
Instrument
Temperaturemeter

4-5SectionCreating Graphic Screens
95
4-5-5 Creation ExampleThis section explains how to create a Graphic Screen, using the following exam-ple.
Creating a Graphic Screen
Operation Procedure
1, 2, 3... 1. Create fixed graphics and text (in this example, all graphics except for SPand PV data boxes, and tanks) using commercially-available graphic soft-ware.
2. Copy the graphics created in Step 1. using the graphics software, and thenin Graphic Builder select Edit, and then select Paste (Ctrl + V) to paste thegraphic, or in Graphic Builder, select Edit, and then select Create/PasteObjects, and then specify and insert the graphic file you have created.

4-5SectionCreating Graphic Screens
96
The following diagram will be displayed.
To enlarge or reduce the image, drag any of the eight points that display theimage frame.
3. First, insert the data box for the liquid temperature’s SP, and then set theproperties.
Select Insert Object, and then Data (or click the Data Box icon). A data boxwill be displayed in the upper right of the window, as shown below.
Click an area where nothing is displayed, next double-click the data box toselect it, and then drag the data box to the SP display position.
Correct the size by enlarging or reducing the object size.

4-5SectionCreating Graphic Screens
97
Right-click the data box, and then from the menu that is displayed selectGRFData Control Object, and then Properties. The GrfData Control Prop-erties Dialog Box will be displayed.
Select the Function Block’s Tag Name
Select display type
Select Input for SPs.
Select the SP forthe Tag Name’sFunction Block(above) as a TagITEM.
Note If you select Input for data, to enable settings using the ten-key, in theSetup Dialog Box, select System Info., and then set the ten-key set-ting to Use Ten-Key.
Click the OK Button.
4. Insert the data box for the liquid temperature’s PV, and then set the proper-ties.
Insert and position the data box by performing the operation in Step 3., andthen right-click and select GrfData Control Object, the Properties. TheGrfData Control Properties dialog box will be displayed.
Make the following settings.
Select the Function Block’s Tag Name
Select display type
Select Display for PVs
Select the PV forthe Tag Name’sFunction Block(above) as a TagITEM
Set Colors and Fonts as necessary.
Click the OK Button.
5. Repeat Step 3. and Step 4. to insert and set the properties for the steamflowrate’s SP and PV.
6. Insert and set the properties for the tank.

4-5SectionCreating Graphic Screens
98
Select Insert Object, and then Tank (or click the Insert Tank icon). A databox will be displayed in the top right of the window.
Insert the data box for the liquid temperature’s PV, and then set the proper-ties.
Insert and position the data box by performing the operation in Step 3., andthen right-click and select GrfData Control Object, the Properties. TheGrfData Control Properties Dialog Box will be displayed.
Make the following settings.
Select the Function Block’s Tag Name
Select this check boxto display the tank’sTag name
Select thetank’s shape
Select the PV forthe Tag Name’sFunction Block(above) as a TagITEM
In this example, theNumber of divisions isset to 5Set the display’s HighlimitSet the display’s Lowlimit
Click the OK Button.
This completes the Graphic Screen creation.
7. Save the data you have created.
Select File, and then Save or Save As (or click the Save icon).
Insert a file name, the click the Save Button.
Note To display the Graphic Screen you have created, you must configure the screen.Refer to 4-6 Screen Configuration for how to make the settings.
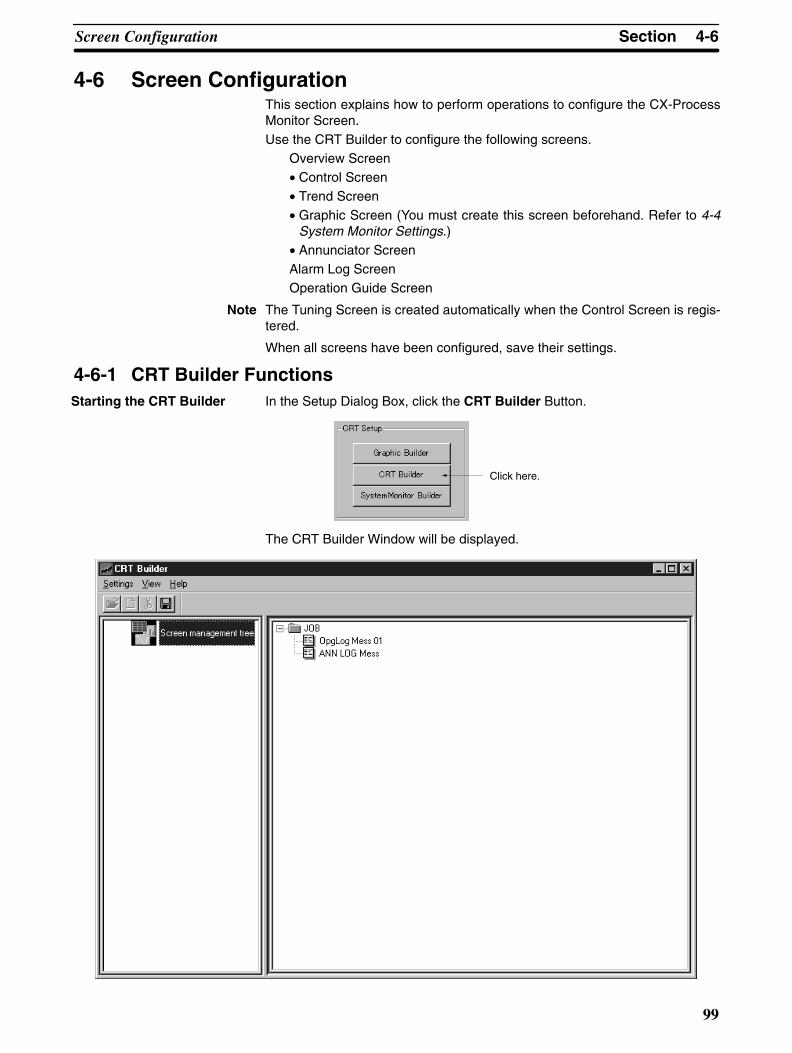
4-6SectionScreen Configuration
99
4-6 Screen ConfigurationThis section explains how to perform operations to configure the CX-ProcessMonitor Screen.Use the CRT Builder to configure the following screens.
Overview Screen• Control Screen• Trend Screen• Graphic Screen (You must create this screen beforehand. Refer to 4-4
System Monitor Settings.)• Annunciator ScreenAlarm Log ScreenOperation Guide Screen
Note The Tuning Screen is created automatically when the Control Screen is regis-tered.
When all screens have been configured, save their settings.
4-6-1 CRT Builder FunctionsIn the Setup Dialog Box, click the CRT Builder Button.
Click here.
The CRT Builder Window will be displayed.
Starting the CRT Builder

4-6SectionScreen Configuration
100
The CRT Builder menu contains the following functions.
Menu Commands FunctionSettings Create Overview
ScreenAdd a new Overview Screen based on thecurrent Overview Screen.
Register Screen Set and register screen items.
Enabled only when you have selected screenitems using the Screen Management Tree.
Delete Deletes registered screen items.
Save Saves setting in CRT Builder.
Exit Ends the application.
View Toolbars Select whether to display or hide toolbars.
Help About CRT Builder Display the CRT Builder version information.
The CRT Builder toolbar contains the following functions.
Set and Save
Set and Delete
Set and Register Screen
Set and Create Overview Screen(Enabled only when JOB isselected)
4-6-2 Overview of Screen RegistrationThis section explains how to register the Overview Screen and set and registerthe sub-elements of the Overview Screen given below.
Control Screen
Trend Screen
Graphic Screen (You must create the Graphic Screen beforehand. Refer to4-2 Basic Configuration Procedure.)
Annunciator Screen
Note The Tuning Screen is created automatically when the Tag Name is allocated.
Registering the Overview Screen
1, 2, 3... 1. Start CRT Builder, and then in the CRT Builder’s Screen Management Tree,select JOB, and then select Setting, and then select Create OverviewScreen. The CRT Builder Dialog Box will be displayed.
Enter the name of the Overview Screenusing 8 full-width characters or 16half-width characters. Make sure to entera name for the Overview Screen.
Note Make sure to enter a name for the Overview Screen. If you do not enter a name,you will be unable to move to the Overview Screen.
2. Enter a screen name, and then click the OK Button.
CRT Builder Menu
CRT Builder Toolbar

4-6SectionScreen Configuration
101
The Overview Screen will be registered, and the name of the screen you en-tered will be displayed in the Screen Management Tree.
Set and register thefollowing screens.Control ScreenTrend ScreenGraphic ScreenAnnunciator Screen
Screen ManagementTree
3. Select the screen item, and then select Set, and then select RegisterScreen (or double-click the screen item), to set and register the screens.
Settings differ for each screen item. Refer to later in this manual for how toset each screen.
To specify the Function Block data within the Loop Control Unit, specify a tagname when registering each screen.
Note To specify the Tag name, you must create a Monitor Tag file (select Execute, andthen select Compile Monitor Tags) using CX-Process Tool (on Windows NT). Ifyou do not create a Monitor Tag file, you cannot specify Tag Names from CX-Process Monitor.
There are two types of Tag names:
1, 2, 3... 1. Tag names for function blocks. If specifying tag names for Function Blocks,specify the function block ITEMs using tag ITEM. (See note.)
Note Tag ITEM is a fixed name allocated beforehand to specific ITEMs(PV, SP, and MV, etc.) for a specific Function Block (Control Block,and part of the Operation Block). Refer to Appendix A ITEM Settingsfor Function Blocks for details.
2. Tag names for analog ITEMs and contact ITEMs.
Setting the Screen TagNames

4-6SectionScreen Configuration
102
Refer to the following table for the relation between each screen and the tagname/tag ITEM given above.
Screen 1 2
Tag names forfunction blocks
Tag ITEMs for thefunction block
Tag names foranalog ITEMsand contact
ITEMsControl Screen Can be specified --- Can be specified
Trend Screen Can be specified Can be specified Can be specified
Graphic Screen Can be specified Can be specified Can be specified
Annunciator Screen Can be specified Can be specified Can be specified
Operation GuideMessage Screen
Can be specified Can be specified Can be specified
Alarm Log Screen Can be specified Can be specified Can be specified
Note Set tag names for the function blocks using the 1-Block Send Terminal to Com-puter (403) and 4-Block Send Terminal to Computer (404) function blocks.
Set tag names for analog ITEMs and contact ITEMs using the functions blocksDO to Computer (Block Model 401), AO to Computer (Block Model 402), DO Ter-minal to All Nodes (Block Model 307), AO Terminal to All Nodes (Block Model408), DO Terminal Settings from Computer (Block Model 409), and AO TerminalSettings from Computer (Block Model 410).
Example 1Specifying the Function Block for the Control Screen as Function Block with Tagname “ABC.”
Tag name ABC
CX-ProcessMonitor Control Screen
Tag Name: Specify ABC
Loop ControlUnit

4-6SectionScreen Configuration
103
Example 2Specifying the analog ITEM for the Trend Screen trends as Function Block TagITEM “MV” for Tag name “ABC.”
Tag name ABC
Tag ITEM MV
CX-ProcessMonitor
Trend Screen
Tag Name: Specify ABC
Tag ITEM: Specify MV
Loop Control Unit
Example 3Specifying the Trend Screen trend as analog ITEM for Tag name “IN1.”
Tag name IN1
CX-ProcessMonitor Trend Screen
Tag Name: Specify IN1
Loop Control Unit
Monitor Tag files are saved to the following directory at installation with a fixedfile name.Directory: Omron/CX-Process Monitor/db (The underlined part is the directoryin which the CX-Process Monitor is installed.)File names: mtagmst and mtagsubmstIt is possible to create several Monitor Tag files and switch between them bychanging the application path. In this way, by creating new Monitor Tag files in a
Changing Monitor TagFile Paths

4-6SectionScreen Configuration
104
directory different from the default one, and changing the application path to thisdirectory, the Monitor Tag files that are used by CX-Process Monitor can bechanged. The procedure is as follows.
1, 2, 3... 1. In the Mode Selection Dialog Box, click the Set Up Button. A box for enteringthe password will be displayed.
2. Enter the password and click the OK Button. The following Setup dialog Boxwill be displayed.
3. Click the DB Path Button. The following dialog box will be displayed.
4. The current path setting is displayed in the Setting DB Path field. (The de-fault setting, as in the above example, is Omron/CX-Process Monitor/db.)
5. Click the Browse Button and specify the new path in the dialog box that isdisplayed.
6. Select Yes in the Create New DB field and click the Execute Button. Initial-ized Monitor Tag files will be created at the specified path, and the applica-tion path will change to the specified one (i.e., the Monitor Tag files used byCX-Process Monitor will change to the newly created ones.)

4-6SectionScreen Configuration
105
Note a) Several files are created. Therefore, if a folder that is used only forMonitor Tag files is not specified, the Monitor Tag files will becreated in the same folder as other files.
b) When creating new Monitor Tag files, files will be created withnothing registered. Therefore, CX-Process Monitor tags must becreated (Execution – Output Tag Files - Monitor Tags), andCX-Process Monitor must be restarted.
c) Some time may be required until completion of new tag creation.
To return the Monitor Tag files that are use to the ones at the original path,select No in the Create New DB field and click the Execute Button. The ap-plication path will change to the original one (i.e., the files that CX-ProcessMonitor uses will change to the ones corresponding to the original path.) If,however, there are no Monitor Tag files at the specified path, an error will begenerated when file mapping is attempted (i.e., the File Mapping Button isclicked.)
Note Specifying No in the Create New DB field is used to return the ap-plication path to the original one after it has been changed by specify-ing Yes in the Create New DB field.
Registering Control Screens
1, 2, 3... 1. Select Screen in the Overview Screen sub-elements using Screen Man-agement Tree in CRT Builder.
Click to select. Double-click to omit Step2 of the operation.
2. From the Settings menu, select Register Screen, or double-click Screen.
The following dialog box will be displayed.
Select Control Screen
3. Select Control Screen, and then click the New Button.
The following dialog box will be displayed.

4-6SectionScreen Configuration
106
You can register up to eight function blocks in the Control Screen. Specifythe function blocks using Tag names.
Enter the name of theControl Screen using16characters.
Deletes theregistered Tags.When youregister a Tag,the button isenabled.
When you select a Tag Name, the Details Button is enabled.
Select the box. The following dialog box will be displayed.When you select this box, theManual Pointer is notdisplayed. Refer to the nextpage for details of displays.
Select this box, and thenselect the direction MV willopen. If you do not specify adirection, no direction will bedisplayed. Refer to the nextpage for details of displays.
Displays the settingsmade usingCX-Process Tool. Youcannot change thesettings.
Make the settings, and then click theOK Button.
The Manual Pointer and MVdirection settings will be reflected inthe MV adjustment area in the lowerpart of the instrument diagram.Refer to the next page for details ofdisplays.
Select this box to set theProminent Tag. When setting theProminent Tag, the following markwill be added to the icon on theOverview Screen, as shown.
Select the box. The following dialog boxwill be displayed.
Select the Tag Name corresponding tothe function block, analog ITEM, orcontact ITEM you want to register, andthen click the OK Button.
As shown in the screen on the right, youcan allocate up to eight Tag names.

4-6SectionScreen Configuration
107
MV Adjustment Area Display in the Lower Part of the Instrument Diagram
MV open directionenabled (0% side)
MV open directionenabled (100% side)
Manual Pointerdisabled
ManualPointerenabled
MV open directiondisabled
Manual ON
4. Enter the Screen Name, set the Tag Name and Detailed Settings, the clickthe OK Button.
The Control Screen will be registered, and the Screen Name you have en-tered will be displayed on the Screen Management Tree.
You can register up to 60 Realtime Trend Screens, and up to 120 HistoricalTrend Screens.
1, 2, 3... 1. Select the Overview Screen’s sub-element Screen in the CRT Builder’sScreen Management Tree.
Click to select. Double-click to omitStep 2 of the operation.
2. In the Settings Menu, select Register Screen, or double-click Screen.
The dialog box shown in Step 2 of the preceding section, Control ScreenRegistration, will be displayed.
3. Select the Trend Screen, and then click the New Button.
The following dialog box will appear.
You can register a maximum to eight analog ITEMs (PV, SP, MV, or otheranalog signals), or eight contact ITEMs in the Trend Screen. Specify analogITEMs or contact ITEMs using either a) or b) below.
a) Tag name and relevant Tag ITEM (either PV, SP, or MV) corresponding tothe function block.
Registering TrendScreens

4-6SectionScreen Configuration
108
b) The Tag name corresponding to the analog ITEM or contact ITEM.
Enter the name of the OverviewScreen using 16 characters.
Deletes the registered tags. Whenyou register a tag, the button isenabled.
Select the Trend type
Please a check here to enable automaticallysaving a CSV file. When automatic savinghas been enabled, the save period (time),save destination folder, save file name, andbrowse button will be enabled.
Click the box. The following dialog boxwill be displayed.
Select a) the tag name for the FunctionBlock (including the analog ITEMs youwant to register), or b) the tag name forthe for the analog ITEMs or contact ITEMsyou want to register. In this example, thetag name for the Function Block for a) hasbeen specified.
As shown in the screen on the right, youcan allocate up to eight tag names.
4. Enter the Screen Name, set the Trend Type, and then select Tag NameWhen you register the Tag name, the dialog box will change as follows.
Select the box. The following dialog boxwill be displayed.
Select the Tag ITEM corresponding tothe analog ITEM you want to register. Inthis example, Tag ITEM “PV” for theFunction Block for Tag name 4B009 hasbeen selected.
Select the box. The following dialog box will bedisplayed.
Normally, there is no need to make settings becausethey are set automatically.
Part of the data (PID constants, etc.), however, may notmatch the display on the chart. Set the settings for theHigh Limit and Low Limit for this data only.

4-6SectionScreen Configuration
109
5. Set Configure Tag Name, Tag ITEM, and Detailed Settings, and thenclick the OK Button.
The Trend Screen will be registered, and the name of the screen you en-tered will be displayed in the Screen Management Tree.
Automatically saving to an CSV file is described below.
To automatically save a CSV file, check Autosave enable on the above screenand then make the following settings.
Interval (hours)The time can be set to 1, 2, 3, 4 , 6, 10, 12, 18, 20, 24, 48, 72, 86, 120, or 240hours. The default for Real Time Trends is 12 hours, and the default for HistoricalTrends is 240 hours.
FolderSpecify the folder in which to save the file. The Browse Button can be use to sim-plify setting the folder.
FilenameSpecify the name of the file to save. Do not specify the file name extension. Theactual name of the file will be as follows: filename_date_number.csv. The datewill be in the form yymmdd. The number will be consecutively assigned from 00and will be reset to 00 when the date changes. For example, if the file name isspecified as “RealTime,” the actual name of the first file saved on 19 September2000 would be “RealTime_000919_00.csv.”
Note The number attached to the file name is not saved. If the system is shutdown andrestarted in the same day, files will be overwritten starting from 00.
The autosave function will start on the hour (00 minutes 00 seconds) after themonitoring process is started, possibly creating a waiting period of up to 59 min-utes and 59 seconds before the autosave function starts. For example, if thesave interval is set to 3 hours and the monitoring process starts at 3:32:47 pm,data collection would be started at 4:00:00 pm and the first file would be saved at7:00:00 pm.
You can register up to 200 Graphic Screens.
Note Before registering the Graphic Screen, you must create and save the GraphicScreen using the Graphic Builder Button. Refer to 4-5 Graphic Screen Creationfor how to create a Graphic Screen.
The registration procedure is as follows:
1, 2, 3... 1. Select Screen in the Overview Screen sub-elements using Screen Man-agement Tree in CRT Builder.
Click to select. Double-click toomit Step 2 of the operation.
2. From the Settings menu, select Register Screen, or double-click Screen.
The dialog box shown in Step 2 of the proceeding Control Screen Registra-tion will be displayed.
Saving to an CSV File
Registering GraphicScreens

4-6SectionScreen Configuration
110
3. Select Graphic Screen, and then click the New Button.
The following dialog box will be displayed.
Select the Graphic Screen you created and saved using CRT Builder (i.e.,the Graphic Builder Button).
Note Before registering the Overview Screen, you must create and savethe Graphic Screen using CRT Builder.
Select the name of Graphic Screento be allocated.
All of the saved Graphic Screennames will be displayed.
4. Select the screen name, and then click the OK Button.
The Overview Screen will be registered, and the name of the screen you en-tered will be displayed in the Screen Management Tree.
You can register up to five Annunciator Screens. The registration procedure isas follows:
1, 2, 3... 1. Select the Overview Screen’s sub-element Screen in the CRT Builder’sScreen Management Tree.
Click to select. Double-click toomit Step 2 of the operation.
2. In the Settings Menu, select Register Screen, or double-click Screen.
The dialog box shown in Step 2 of the preceding section, Control ScreenRegistration, will be displayed.
3. Select the Trend Screen, and then click the New Button.
The following dialog box will appear.
Registering AnnunciatorScreens
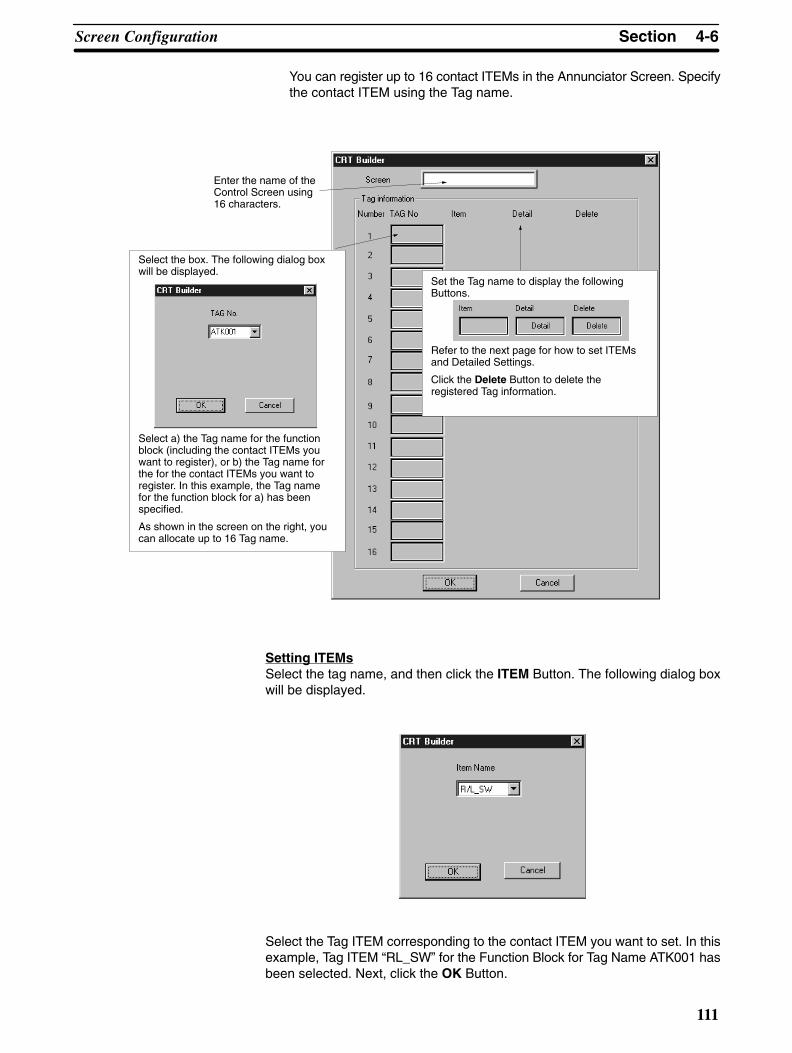
4-6SectionScreen Configuration
111
You can register up to 16 contact ITEMs in the Annunciator Screen. Specifythe contact ITEM using the Tag name.
Enter the name of theControl Screen using16 characters.
Set the Tag name to display the followingButtons.
Refer to the next page for how to set ITEMsand Detailed Settings.
Click the Delete Button to delete theregistered Tag information.
Select the box. The following dialog boxwill be displayed.
Select a) the Tag name for the functionblock (including the contact ITEMs youwant to register), or b) the Tag name forthe for the contact ITEMs you want toregister. In this example, the Tag namefor the function block for a) has beenspecified.
As shown in the screen on the right, youcan allocate up to 16 Tag name.
Setting ITEMsSelect the tag name, and then click the ITEM Button. The following dialog boxwill be displayed.
Select the Tag ITEM corresponding to the contact ITEM you want to set. In thisexample, Tag ITEM “RL_SW” for the Function Block for Tag Name ATK001 hasbeen selected. Next, click the OK Button.

4-6SectionScreen Configuration
112
Detailed SettingsSelect the Tag name, and then click the Details Button. The following dialog boxwill be displayed.
Select the character displaycolor
Enter the message to be displayedon the Annunciator Screen. You canenter up to eight full-widthcharacters x two rows.
Select Non-lock In (0), or Lock-in (1)
Select the sound type.
Click the Test Button to hear the sound selected.
Refer to 4-7 System Information Settings forallocating sound files and sound numbers.
Select the background color
Complete the settings, and then click the OK Button.
4. Make the above settings, and then click the OK Button.
The Annunciator Screen will be registered, and the name of the screen youentered will be displayed in the Screen Management Tree.
4-6-3 Registering Operation Guide MessagesThis section explains how to register Operation Guide Messages.
If the conditions registered here occur, the corresponding message will be dis-played on the Operation Guide Log Screen, and saved.
1, 2, 3... 1. Select OpgLog Mess01 int the CRT Builder’s Screen Management Tree.
Click to select. Double-click to omitStep 2 of the operation.
2. In the Settings Menu, select Register Screen, or double-click OpgLogMess01.
The following dialog box will appear.

4-6SectionScreen Configuration
113
You can register up to 100 contact ITEMs in the Operation Guide Messages.Specify the contact ITEM using the Tag names.
Enter the name of the OverviewScreen using 16 characters.
Switch the page numbers. Clickeither button to move up anddown the table of registered Tagnames below by 10 at a time.
Select the box. The following dialog boxwill be displayed.
Select a) the Tag name for the function block(including the contact ITEMs you want toregister), or b) the Tag name for the for thecontact ITEMs you want to register. In thisexample, the Tag name for the functionblock for a) has been specified.
Select the Tag name to display the DetailsButton as shown.
Refer to the next page for how to setITEM and Detailed Settings.
Click the Delete Button to delete theregistered Tag information.
Setting ItemsSelect the Tag name, and then click the ITEM Button. The following dialog boxwill be displayed.
Select the Tag ITEM corresponding to the contact ITEM you want to set. In thisexample, Tag ITEM “PV” for the Function Block for Tag Name ATK001 has beenselected. Next, click the OK Button.

4-6SectionScreen Configuration
114
Detailed Settings
Select the color of theOperation Guide MessageScreen characters
Enter the message to be displayed on theOperation Guide Message Screen. You canenter up to 160 characters.
After completing the settings, click the OK Button.
3. After completing the above settings, click the OK Button.
The Operation Guide Message Screen will be registered, and the name ofthe screen you entered will be displayed in the Screen Management Tree.
4-6-4 Registering Alarm MessagesThis section explains how to register alarm messages.
If the conditions registered here occur, the corresponding alarm message will bedisplayed in the second line of the Monitor Screen, and the alarm message willbe saved on the Alarm Log Screen.
1, 2, 3... 1. In the CRT Builder’s Screen Management Tree, select Register AlarmMessage.
Click to select. Double-click toomit Step 2 of the operation.
2. From the Settings Menu, select Register Screen, or double-click ANN LOGMess.
The following dialog box will be displayed.

4-6SectionScreen Configuration
115
You can register up to 50 contact ITEMs in the alarm messages. Specify thesetting ITEMs using the Tag name.
Enter the name of the AlarmMessage Registration Screenusing 16 characters.
Switch the page numbers.Click either button to move upand down the table ofregistered Tag names belowby 10 at a time.
Select the box. The following dialog boxwill be displayed.
Select a) the Tag name for the function block(including the contact ITEMs you want toregister), or b) the Tag name for the for thecontact ITEMs you want to register. In thisexample, the Tag name for the function blockfor a) has been specified.
Select the Tag name to display the DetailsButton as shown.
Refer to the next page for how to set ITEMand Detailed Settings.
Click the Delete Button to delete theregistered Tag information.
Setting ITEMsSelect the Tag name, and then click the ITEM Button. The following dialog boxwill be displayed.
Select the Tag ITEM corresponding to the contact ITEM you want to set. In thisexample, Tag ITEM “RL_SW” for the Function Block for Tag name ATK001 hasbeen selected. Next, click the OK Button.

4-6SectionScreen Configuration
116
Detailed SettingsSelect the Tag name, and then click the Details Button. The following dialog boxwill be displayed.
Set the timing to display themessages
Enter the alarm message. You can enter upto 94 characters.
After making the settings, click the OK Button.
Display is red for an occurrence, and black following recovery.
3. Complete the above settings, and then click the OK Button.
The alarm message will be registered, and the name of the screen you en-tered will be displayed in the Screen Management Tree.
4-6-5 Saving SettingsSave the screen configurations that you have set.
Note If setting or changing screen configurations, make sure to save the settings orchanges.
1, 2, 3... 1. From the Settings Menu in the CRT Builder, select Save.
2. Click the OK Button.
4-6-6 Deleting Registered ScreensTo delete registered screens, perform the following operation.
1, 2, 3... 1. In the CRT Builder’s Screen Management Tree, click to select the screenyou want to delete.
Click to select. Double-click toomit Step 2 of the operation.
2. From the CRT Builder Settings Menu, select Delete.

4-7SectionSystem Information Settings
117
3. Click the OK Button.
4-6-7 Starting the Monitor ProcessTo start the monitor process, perform the following operation.
1, 2, 3... 1. In the Mode Selection Dialog Box, click the Set Up Button.
2. In the Setup Dialog Box, click the File Mapping Button.
3. In the Setup Dialog Box, click the Start Up Button.
4. Click the OK Button.
5. In the Mode Selection Dialog Box, click the Overview Button.
4-7 System Information SettingsThis section explains label information, alarm sound information, and how tomake the ten-key, color, and key-lock settings.
The contents of the settings are as follows.
Item ContentsLabel information Label name
Label color
Alarm sound information Allocate an alarm sound file to each alarm number (1 to 10)
Ten-key settings Set whether you want to use the Ten-key Dialog Box whenentering numerical values. This setting will be enabled forall Monitor Screens.
If you enable the ten-key, the Ten-key Dialog Box will bedisplayed when you select the numerical input box.
Color settings Specify the color of the buttons used for the Function Blockdiagrams in the Control Screen and Tuning Screen.
Key-lock settings It is possible to prohibit the values of ITEMs being changedfrom the Control Screen or the Tuning Screen.
Multi-screen settings Specify if multiple screens can be displayed and automaticexiting of the background window for the monitoringprocess when automatically ending in operator mode. Setthe order in which pages are to change.
Auto-start settings Specify the scale display (engineering units orpercentages) for the Tuning and Trend Screens, the TuningScreen opening method, auto-starting, and the color ofalarms on Annunciator Screens.
CSV file auto-savesettings
Set automatic saving, the folder and file name, and theavailable disk space at which to generate an alarm or error.
Alarm sound stopsettings
• Set whether the alarm will sound during alarm recovery.
• Set whether MHA and MLA are handled as alarms.
• Register tags for which alarms will stop.
1, 2, 3... 1. In the Setup Dialog Box, click the System Info. Button.
Click here.

4-7SectionSystem Information Settings
118
The following window will be displayed.
2. In the leftmost window, select Label information, Alarm sound informa-tion, Set ten-key, Set color, or Set key lock.
3. Perform the following settings as shown.
4. When you have completed all the settings, click the Save and Exit Button.
In the leftmost window, select Label Information. The screen shown in Step 1will be displayed.
Set Label name and Label color.
Label InformationSettings

4-7SectionSystem Information Settings
119
In the leftmost window, select Alarm sound information. The following screenwill be displayed.
Allocate a sound file to each alarm sound number to register the sound you wantto use.
Click the Test Button to try sounding the alarm.
Alarm Sound InformationSettings

4-7SectionSystem Information Settings
120
In the leftmost window, select Set ten-key. The following screen will be dis-played.
Click the Use ten-key Button or the Don’t Use ten-key Button. The setting willbe enabled for all Monitor Screens.
If you set Use ten-key, when you select the input numerical value box, the InputData Dialog Box will be displayed.
Example
If you set Use Ten-key, whenyou select the input numericalvalue box, the Input Data DialogBox will be displayed.
Set the ten-key size to either large or small.
Ten-key Settings

4-7SectionSystem Information Settings
121
In the leftmost window, select Set color. The following screen will be displayed.
Color used to indicatebutton is ON.
Color used to indicatebutton is OFF.
Color setting for the buttons used in the AUT/MAN/CAS/FIELD/CONT/PAUSE/START/STOP/RESET Function Block diagrams
Color of Contactoutput button
Color of Contactinput status
Color used to indicatebutton is ON.
Color used to indicatebutton is OFF.
Color used to indicateContact input is ON.
Color used to indicateContact input is OFF.
Use the above screen to specify the color used for the AUT/MAN/CAS/FIELD/CONT/PAUSE/START/STOP/RESET Function Block diagrams, the Contactoutput buttons, and the Contact input status.
If the Display dialog box for confirming in pushing contact buttons settingis clicked, a confirmation dialog box like the one shown below will be displayed toconfirm operation when a contact output button, like AUTO/MAN is clicked.
In the leftmost window, select Set key lock. The following screen will be dis-played.It is possible to prohibit changing specified ITEM values (e.g., changing SP val-ues or PID constants) of specified Function Blocks (e.g., Basic PID Block) inscreens, such as the Control Screen and the Tuning Screen, that can be usingfor setting operations from the CX-Process Monitor. These settings are called“key locks.”
Color Settings
Key-lock Settings

4-7SectionSystem Information Settings
122
Note Key-lock specifications are made in terms of block models (setting in terms ofthe CX-Process Monitor’s tag names is not possible). The following operation isonly possible in Operator mode.
Setting Procedure
1, 2, 3... 1. Select Block Model. The Function Blocks will be displayed below it.
2. To set key locks for all the analog and contact ITEMs of the Function Blocksof the specified Block Model that can usually be changed using CX-ProcessMonitor, click the All Select Button. Similarly, to clear the key locks for all ofthe ITEMs, click the All Clear Button.
To set key locks for specific ITEMs, click in the check box of the requiredITEMs in either the analog ITEM or Contact ITEM fields.
3. Click the Save and exit Button to enable the key lock settings.
Operation with Key Locks Enabled
1, 2, 3... 1. If an attempt to change the value of an ITEM (e.g., SP) for which key lock hasbeen set (e.g., by pressing the SP Button), the following dialog box will bedisplayed.

4-7SectionSystem Information Settings
123
2. If Yes is clicked, the following dialog box, requesting entry of a password,will be displayed. (If No is clicked, the operation to change the ITEM will becancelled.)
If the password set in Engineer mode is entered (refer to 4-3-3 Password),the key lock for the ITEM will temporarily be cleared and it will be possible tochange the value. The next time, however, that an attempt to change thevalue of the same ITEM is made, the key lock will be enabled and the aboveprocedure will have to be repeated.
If Multi-screen is selected, the following screen will be displayed.
The following settings can be made.
Multi-screenSet whether or not more than one Overview Screen can be displayed at thesame time.
Auto-exit Background Tasks in Exiting Operator ModeSet whether or not to close the background tasks (monitoring processes) auto-matically when exiting the operator mode screen.
Note Always disable automatically exiting background tasks if more than one screenis going to be opened in operator mode.
Multi-screen Settings

4-7SectionSystem Information Settings
124
The order in which pages are changed when the Next and Previous Buttons areclicked can be set to either the order they are registered in the database or theorder they are displayed in the Builder Window. Both realtime trends and histori-cal trends are treated in the same group.
Note The first page in each group will be displayed when the Next Button is pressed atthe last page in the group. The last page in each group will be displayed when thePrevious Button is pressed at the first page in the group.
Order of Database RegistrationPages will change in the order they are registered using the Builder Window.Both realtime trends and historical trends are treated in the same group.Example:
If the pages were registered in the order 1, 2, 3, then they will be displayed in thatorder.
Order of DisplayPages will change in the order they are displayed in the Builder Window. Bothrealtime trends and historical trends are treated in the same group.Example:
The pages will be displayed in the order 1, 3, 2 regardless of the order in whichthey were registered.
Setting the Order of PageChanges

4-7SectionSystem Information Settings
125
If Auto-start is selected, the following screen will be displayed.
The following settings can be made.
Divisions in Tuning ScreenSpecify whether to use engineering units or percentages for the scale displayedin a Tuning Screen. The default is for percentages.
Auto-start Settings
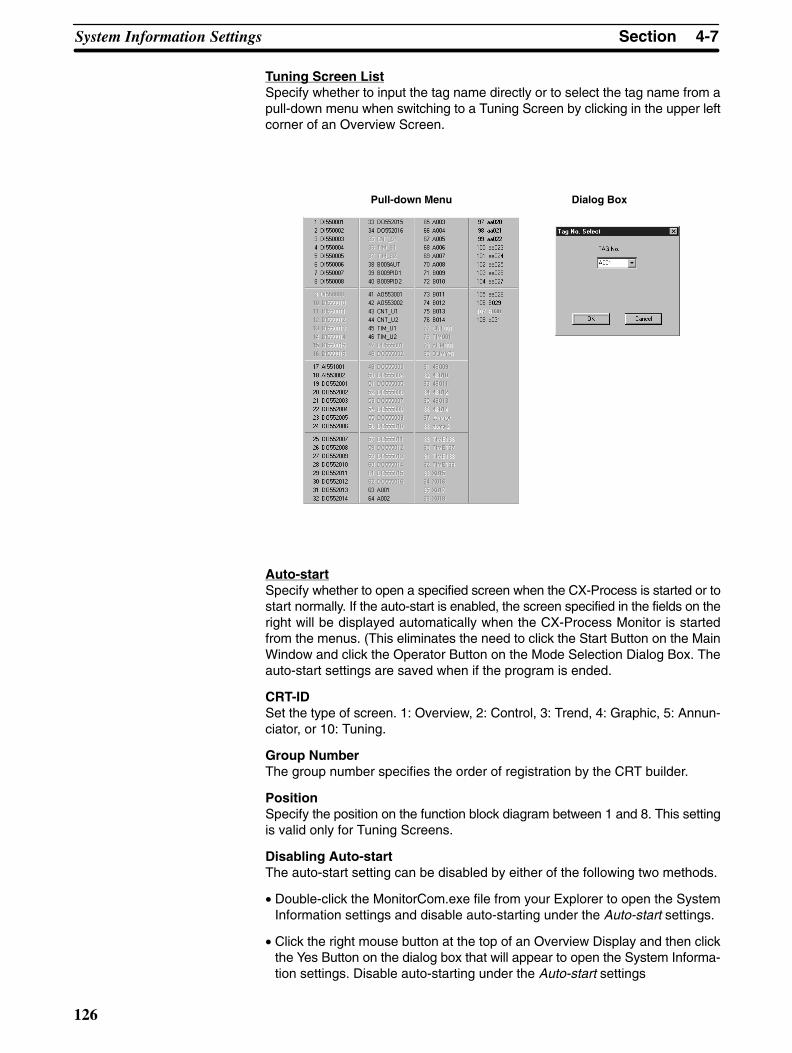
4-7SectionSystem Information Settings
126
Tuning Screen ListSpecify whether to input the tag name directly or to select the tag name from apull-down menu when switching to a Tuning Screen by clicking in the upper leftcorner of an Overview Screen.
Pull-down Menu Dialog Box
Auto-startSpecify whether to open a specified screen when the CX-Process is started or tostart normally. If the auto-start is enabled, the screen specified in the fields on theright will be displayed automatically when the CX-Process Monitor is startedfrom the menus. (This eliminates the need to click the Start Button on the MainWindow and click the Operator Button on the Mode Selection Dialog Box. Theauto-start settings are saved when if the program is ended.
CRT-IDSet the type of screen. 1: Overview, 2: Control, 3: Trend, 4: Graphic, 5: Annun-ciator, or 10: Tuning.
Group NumberThe group number specifies the order of registration by the CRT builder.
PositionSpecify the position on the function block diagram between 1 and 8. This settingis valid only for Tuning Screens.
Disabling Auto-startThe auto-start setting can be disabled by either of the following two methods.
• Double-click the MonitorCom.exe file from your Explorer to open the SystemInformation settings and disable auto-starting under the Auto-start settings.
• Click the right mouse button at the top of an Overview Display and then clickthe Yes Button on the dialog box that will appear to open the System Informa-tion settings. Disable auto-starting under the Auto-start settings

4-7SectionSystem Information Settings
127
Note The CRT-ID, group number, and position can be confirmed by clicking at the topof a screen as shown below.
CRT-ID and other in-formation displayedhere.
Click here.

4-7SectionSystem Information Settings
128
If Set auto-save of CSV file is selected, the following screen will be displayed.
Set the amount of disk space at which to generate an alarm or error when thedrive in which the CSV file is being saved starts becoming full. Setting the valuesas megabytes. An alarm or error will be generated when the drive set to save theCSV file in for Trend Screens reaches the specified level or lower.
The default for an alarm is 10 Mbytes and the default for an error is 1 Mbyte.
The CSV files will still be saved if an alarm occurs, but they will not be saved if anerror occurs.
The CX-Process Monitor does not provide functions to delete or overwrite oldfiles.
Note Although different drives can be set for the Trend Screens, the error and alarmsettings are used for all of them.
4-7-1 Setting for Stopping Alarm Sound
These settings specify whether or not an alarm sound will be produced whenalarms are reset. There are separate settings for process alarms and systemalarms.
• Process AlarmsAn alarm message is displayed in the Alarm Log Screen.
CSV File Auto-saveSettings
Alarm Reset Settings

4-7SectionSystem Information Settings
129
• System AlarmsAn alarm message is displayed in the System Monitor Screen.
Enable process alarm sounds to produce asound when an alarm message isdisplayed in the Alarm Log Screen.
Enable system alarm sounds to produce asound when an alarm message is displayedin the System Monitor Screen.
Both alarms are disabled by default.
Note When the alarm sound is disabled, no sound will be produced when the alarm isreset, but the alarm event will remain in the alarm log.
This setting specifies whether or not the MHA and MLA ITEM tags are treated asalarms. If MHA and MLA are treated as alarms, an alarm event will be recordedin the Alarm Log when MHA or MLA goes ON. If the alarm output is disabled,alarm events will not remain in the Alarm Log.
When the alarm output isenabled, MHA and MLA eventswill be recorded in the Alarm Log.
MHA and MLA AlarmSetting

4-7SectionSystem Information Settings
130
All alarm sounds can be silenced when the specified tag is ON.
When this function is enabled and the specified tag is ON, all alarm sounds (suchas process alarms, system alarms, and annunciator alarms) will be stopped.
If the alarm is enabled, all alarmwill be stopped when thespecified tag is ON.
Select the tag that willsilence alarms.
Setting the Alarm Stop TagClick the Browse Button next to the Tag Name field to display the following dia-log box. Select the tag name of the tag that will control alarm sounds and click theOK Button.
Note The following dialog box will be displayed if a tag name longer than 8 charactersis input directly into this field. In this case, input an existing tag name that is up to8 characters long.
Alarm Stop Function

4-8SectionChecking Configurations
131
The following dialog box will be displayed if a non–existent tag name is input.In this case, click the Browse Button and select a tag name.
Time Chart of Alarm Stop Tag Operation
Alarm sounds ON
Alarm sounds silencedVerify operation
Verify operation
Alarm Stop Tag
Pattern 1
Pattern 2
Pattern 3
Pattern 4
Alarm Stop Tag
Pattern 5
Pattern 6
4-8 Checking ConfigurationsIn Engineer Mode, start Monitor Process, and display the Overview Screen tocheck that the screen configurations have been set correctly.

4-8SectionChecking Configurations
132
Refer to 3-4 Overview Screen for details of operations in Monitor Screens se-lected from the Overview Screen.
Select Start, Program, Omron, CX-Process Monitor, and CX-Process Monitor.
In the main window, click the Start Button.
In the Mode Selection Dialog Box, click the Engineer Button.
In the Mode Selection Dialog Box, click the Set Up Button.
Enter the password.
In the Setup Dialog Box, click the File Mapping Button. (i.e., map to the Monitor Tag File Screen.)
Start the Monitor Process for the screen you have configured, and start FinsGateway Serial Unit communications.(See note.)
Note Set the FinsGateway communications type (Host Link), the COM port used by the Host Link, and thebaud rate using the configuration’s System Monitor Setting Window. You must start the FinsGatewayController Link and Ethernet manually.
In the Mode Selection Dialog Box, click the Overview Button.
In the Overview Screen, select the Control Screen, Trend Screen, etc., and check their operation.
(To enable auto-starting to an Overview Screen)
Click the System info. Button in the Setup Dialog and set the Auto-start–Auto-start setting to Enable.
4-8-1 Starting the Monitor ProcessPerform the following procedure to start the Monitor Process and display theOverview Screen.
1, 2, 3... 1. Perform file mapping (using the Setup Dialog Box).
2. Start the Monitor Process (using the Setup Dialog Box).
3. Display the Overview Screen (Using the Mode Selection Dialog Box).
Select the Monitor Screen you have created using the Overview Screen.
Note The above steps are not required if auto-starting has been set. Refer to 4-7 Sys-tem Information Settings for details.
4-8-2 Executing File Mapping and Starting the Monitor Process
1, 2, 3... 1. In the Mode Selection Dialog Box, click the Set Up Button.
The input password box will be displayed.
2. Enter the password, and then click the OK Button.
The following Setup Dialog Box will be displayed.

4-8SectionChecking Configurations
133
3. Click the File Mapping Button.
Setup Dialog Box
Click here
Click this button to change thepath for the Monitor Tag files.
File Mapping will be performed.
When file mapping is completed, you can click the Start Up Button.
4. The Monitor Process will start and the Setup Dialog Box will be closed. Only if using Serial (i.e., Host Link) communications, FinsGateway SerialUnit communications with the PLC will start according to the following com-munications conditions set using the System Monitor Setting Window (usingthe System Monitor Builder Button in the Setup Dialog Box) at the same timeas the Monitor Process starts. Unless Initialize Serial Port in the SerialCommunications Detailed Settings Dialog Box is selected, however, com-munications will not start automatically. Refer to 4-4 System Monitor Set-tings for details.
• Communications type: Serial (Host Link)
• COM port used and baud rate (if using Host Link)
Note a) PLC network address, node address, and Unit address commu-nications are based upon the settings made using the CX-Pro-cess Tool (select Settings, Network Settings). (Set the node ad-dress and Unit address using the System Monitor Settings Win-dow to use the System Monitor Screen).
b) If using Controller Link or Ethernet, you must start FinsGatewaycommunications manually. (Set Controller Link and Ethernetcommunications type using the System Monitor Settings Windowto use the System Monitor Screen).
5. In the Setup Dialog Box, click the OK Button.

4-8SectionChecking Configurations
134
The Mode Selection Dialog Box will be displayed.
Make sure CX-Process Monitor isset to Engineer Mode.
When the Monitor Process isoperating normally, you can clickthe Over View Button as shown.
4-8-3 Displaying the Overview Screen
1, 2, 3... 1. In the Mode Selection Dialog Box, click the Overview Button, as shownabove.
The Overview Screen will be displayed, as shown in 3-4 Overview Screen.
2. Select the screens using the Overview Screen, and check that the screensettings are operating normally. Refer to 3-5 Screen Configuration and laterfor details of each screen.
4-8-4 Setting the Auto-start Function
1, 2, 3... 1. Click the System Info. Button in the Setup Dialog Box.
2. Select Auto-start.
3. Set Auto-start to Enable.
Note If the auto-start function is enabled, an Overview Screen will be displayed assoon as the CX-Process is started. The auto-start setting can be disabled by ei-ther of the following two methods.
• Double-click the MonitorCom.exe file from your Explorer to open the SystemInformation settings and disable auto-starting under the Auto-start settings.
• Click the right mouse button at the top of an Overview Display and then clickthe Yes Button on the dialog box that will appear to open the System Informa-tion settings. Disable auto-starting under the Auto-start settings
4-8-5 Ending the Monitor Process
1, 2, 3... 1. Click the Set Up Button in the Mode Selection Dialog Box.
2. Input the password and click the OK Button.
The monitor process will be ended.

135
SECTION 5Troubleshooting
This section describes errors that can occur while using the CX-Process Monitor.

5SectionTroubleshooting
136
The following table shows the causes of errors that may occur during CX-Pro-cess Monitor operations, and the action to take to clear the errors. Clear thecause of the error using the table below.
Phenomenon Cause Action
Even pressing the Operator Button,the Overview Screen is not displayed.
No tag numbers have been registeredin the Monitor Tag Settings usingC
Register the tag using CX-ProcessTool, and then compile the Monitor
Even pressing the File MappingButton, the Start Button remainsdisabled.
e o o ag Se gs us gCX-Process Tool.
oo , a d e co p e e o oTags.
Cannot display Tag numbers.
The Loop Control Unit readsInformation Not Refreshed in theSystem Monitor Screen.
The computer communications typesetting in the System Monitor BuilderScreen is incorrect.
Change the communications typesetting.
y
The Loop Control Unit’s address in theSystem Monitor Screen’s nodesettings and the actual Loop ControlUnit’s address do not agree.
Change the Loop Control Unit’saddress in the node settings to agreewith the actual Loop Control Unit’saddress.
Error in Data Refresh Check isdisplayed in the System MonitorMessages.
If the communications type setting isCLK, the data link is stopped, or theFinsGateway CLK_UNITcommunications setting is incorrect.
Reset the communications settingcorrectly using FinsGatewayCLK_UNIT, or start the data link.
The Monitor Tag settings betweenCX-Process Tool and CX-ProcessMonitor agree, but the Function Blockdata when the Monitor Tag settingswere made using CX-Process Toolhave not been downloaded to theLoop Control Unit.
Download the Function Block fromwhen the Tags were set usingCX-Process Tool to the Loop ControlUnit, and restart the Loop ControlUnit.
Power supply to the PLC Unit isturned OFF.
Turn ON the power supply to the PLCUnit.
Communications cable is notconnected.
Connect the communications cable.
Cannot move from the OverviewScreen to the Control Screens orTuning Screens.
The Tag name registered usingCX-Process Tool is not set correctly inCX-Process Monitor.
Reset the Tags using the GraphicBuilder Screen and the CRT BuilderScreen.
Error in Data Link StatusCommunications is displayed in theSystem Monitor Messages.
If the communications type setting isCLK, the FinsGateway CLK_UNITcommunications setting is incorrect.
Reset the communications settingscorrectly using FinsGatewayCLK_UNIT.y g
If the communications type setting isnot CLK, the power supply to the PLCis turned OFF, or the communicationscable is not connected.
Turn ON the power supply to the PLCUnit, or connect the communicationscable.
The message dialog box Could NotInitialize FinsGateway is displayed.
FinsGateway Serial Unit initializationfailed. (i.e., network address set usingCX-Process Tool and FinsGatewaySerial Unit network address do notagree.)
1. Make sure the network address setusing CX-Process Tool, and FinsGate-way Serial Unit network address agree.
2. Compile the Monitor Tags, and thenreset the node PLC using the SystemMonitor Builder Screen.
3. (If the above two actions fail)
Clear the Initialize Serial Port check boxusing the System Monitor BuilderScreen.

5SectionTroubleshooting
137
Phenomenon ActionCauseDefinitions Don’t Agree With System isdisplayed in the System MonitorMessages.
The actual Loop Control Unit in theSystem Monitor Builder Screen hasnot been set using the System MonitorBuilder.
Register the actual Loop Control Unitusing all the System Monitor Builders.
The network address when the Tagsettings were made using CX-ProcessTool, and the node address settings,do not agree with the actual Unit.
1. Make sure the network address andnode address set using CX-Processtool, and the actual node addressagree.
2. Compile the monitor Tags usingCX-Process Tool, and then reset thenode PLC using the System MonitorBuilder Screen.
The message dialog box Could NotG S I f i i di l d
FinsGateway is not started. Start FinsGateway.g gGet System Information is displayed. The network address and node
address set using CX-Process Toolare different from the network addressand node address set usingFinsGateway.
1. Make sure the network address andnode address set using CX-Processtool, and the actual node addressagree.
2. Compile the monitor Tags usingCX-Process Tool, and then reset thenode PLC using the System MonitorBuilder Screen.
Block Execution Error is displayed inthe System Monitor Messages.
An execution error has occurred in theFunction Block data downloaded tothe Loop Control Unit.
3. Click the E Button on the LoopControl Unit in the System MonitorScreen.
4. Click the Execution Error Button inthe Function Block Error Dialog Box.
5. Check the Execution error’sFunction Block using the Details OfFunction Block Error Dialog Box.
6. Correct the settings for the relevantFunction Block using CX-ProcessTool.
Unit Address Setting Disagrees WithActual Unit Number is displayed in theSystem Monitor Messages.
The actual Loop Control Unit’saddress and the node PLC’s Unitaddress in the System Monitor BuilderScreen do not agree.
Make sure the actual Loop ControlUnit’s address and the SystemMonitor Builder’s node PLC Unit’saddress agree.
ERROR CODE: is displayed duringLoop Control Unit Run/stop in theSystem Monitor Screen.
The FinsGateway setting or thenetwork setting is incorrect.
Correct the FinsGateway setting andthe network settings.

139
Appendix AReading/Writing Function Block ITEMs
The following tables show which Tag ITEMs of Function Blocks that are specified as sources using either 1-Blockor 4-Block Send Terminal to Computer can be monitored/set with CX-Process Monitor.
For each of the Function Blocks, it is necessary to have specified CX-Process Monitor as the send destinationusing 1-Block or 4-Block Send Terminal to Computer as shown below.
O: Specification possible; –: Specification not possible
Function Blocks 1-Block Send Terminal toComputer (Block Model 403)
4-Block Send Terminal toComputer (Block Model 404)
Basic PID (Block Model 011) O OAdvanced PID (Block Model 012) O O2-position ON/OFF (Block Model 001) O O3-position ON/OFF (Block Model 002) O OBlended PID (Block Model 013) O –Batch Flowrate Capture (Block Model 014) O –Indication and Setting (Block Model 031) O OIndication and Operation (Block Model 032) O ORatio Setting (Block Model 033) O OIndicator (Block Model 034) O OHigh/Low Alarm (Block Model 111) – OSegment Program 2 (Block Model 157) – OON/OFF Valve Manipulator (Block Model 221) – OMotor Manipulator (Block Model 222) – OReversible Motor Manipulator (Block Model 223) – OMotor Opening Manipulator (Block Model 224) – OTimer (Block Model 205) – OCounter (Block Model 208) – O
Basic PID (Block Model 011)ITEMt
ITEM TagITEM
Data description Data CX-Process Monitor screen (R:Read W:Write)type
gITEM
prange Overview
ScreenControlScreens
TuningScreens
TrendScreens
GraphicScreens
Annun-ciator
Screens
AlarmLog
Screens
Contactinput
000 MT_ST Stop blockoperationcommand(0:Cancel stop, 1:Stop)
0 or 1 R (Color) R (Color) R/W R R R
Analoginput
007 PV PV input –15.00 to+115.00%
R R R R
Parameter 008 HH_SP High/high alarmsetting
–15.00 to+115.00%
R(– only)
R/W R R/W
009 H_SP High alarm setting –15.00 to+115.00%
R(– only)
R/W R R/W
010 L_SP Low alarm setting –15.00 to+115.00%
R(– only)
R/W R R/W
011 LL_SP Low/low alarmsetting
–15.00 to+115.00%
R(– only)
R/W R R/W
Contactoutput
013 HH High/high alarmoutput
0 or 1 R (Color) R R R R R Routput
014 H High alarm output 0 or 1 R (Color) R R R R R R
015 L Low alarm output 0 or 1 R (Color) R R R R R R

Appendix AReading/Writing Function Block ITEMs
140
ITEMtype
CX-Process Monitor screen (R:Read W:Write)Datarange
Data descriptionTagITEM
ITEMITEMtype Alarm
LogScreens
Annun-ciator
Screens
GraphicScreens
TrendScreens
TuningScreens
ControlScreens
OverviewScreen
Datarange
Data descriptionTagITEM
ITEM
Contactoutput
016 LL Low/low alarmoutput
0 or 1 R (Color) R R R R R Routput
017 ALM_OFF
Alarm stop switch
0: Alarm, 1: Stop
0 or 1 R (Color) R R/W R R/W R
Parameter 019 PV_ABN
PV execution errordisplay
0: Normal,
1: Error →MANUAL mod
0 or 1 R R R R R R
023 SP Local Set Pointsetting
–15.00 to+115.00%
W W W
024 CAS_SET
Set Point settingmode
0: Local only
1: Remote/Local
0 or 1 R R R R
026 R/L_ SW Remote/Localswitch0: Local1:RemoteNote: Valid onlywhen ITEM024 is1
0 or 1 R/W R/W R R/W R
Analogoutput
029 SP Current Set Pointoutput
–15.00 to+115.00%
R R R R
Parameter 035 AT AT command/ATExecuting
0.1 R/W R R/W R R
041 DVA_SP
Deviation alarmsetting (Hysteresisis set at ITEM012.)
0 to115.00%
R R/W R R/W
Contactoutput
042 DVA Deviation alarmoutput
0 or 1 R R R R R R
Parameter 054 P Proportional band 0.1 to999.9%
R/W R R/W
055 I Integral time (0:No integral action)
0 to 9999 s
R/W R R/W
056 D Differential time (0:No differentialaction)
0 to 9999 s
R/W R R/W
076 MH_LMT
High MV limit ±320.00% R R/W R R/W
077 ML_LMT
Low MV limit ±320.00% R R/W R R/W
Contactoutput
078 MHA MV upper limitoutput value
1: Upper limit ormore
0: Less than upperlimit
0 or 1 R R R R R
079 MLA MV lower limitoutput value
1: Lower limit orless
0: Greater thanlower limit
0 or 1 R R R R R
Contactinput
086 A/M_SW
Auto/Manualswitch
0: Manual, 1: Auto
0 or 1 R/W R/W R R/W R
Parameter 089 MV Host display of MV ±320.00% R/W R/W R R/W
091 MV_ABN
MV executionerror display
0: Normal, 1: Error
0 or 1 R R R R
098 MV_ IDX MV executionerror display
0: Normal, 1: Error
–15.00 to+115.00%
R R/W R R/W
099 OP_ MK Label 0 to 15 R/W R/W R R/W

Appendix AReading/Writing Function Block ITEMs
141
Advanced PID (Block Model 012)
ITEMt
ITEM TagITEM
Data description Data CX-Process Monitor screen (R:Read W:Write)type
gITEM
prange Overview
ScreenControlScreens
TuningScreens
TrendScreens
GraphicScreens
Annun-ciator
Screens
AlarmLog
Screens
Contactinput
000 MT_ST Stop blockoperationcommand(0:Cancel stop, 1:Stop)
0 or 1 R (Color) R (Color) R/W R R R
Analoginput
007 PV PV input –15.00 to+115.00%
R R R R
Parameter 008 HH_SP High/high alarmsetting
–15.00 to+115.00%
R(– only)
R/W R R/W
009 H_SP High alarm setting –15.00 to+115.00%
R(– only)
R/W R R/W
010 L_SP Low alarm setting –15.00 to+115.00%
R(– only)
R/W R R/W
011 LL_ SP Low/low alarmsetting
–15.00 to+115.00%
R(– only)
R/W R R/W
Contactoutput
013 HH High/high alarmoutput
0 or 1 R (Color) R R R R R Routput
014 H High alarm output 0 or 1 R (Color) R R R R R R
015 L Low alarm output 0 or 1 R (Color) R R R R R R
016 LL Low/low alarmoutput
0 or 1 R (Color) R R R R R R
Contactinput
017 ALM_OFF
Alarm stop switch
0: Alarm, 1: Stop
0 or 1 R (Color) R/W R R/W R
Parameter 019 PV_ABN
PV execution errordisplay
0: Normal,
1: Error →MANUAL mode
0 or 1 R R R R R
023 SP Local Set Pointsetting
–15.00 to+115.00%
W W W
024 CAS_SET
Set Point settingmode (default)0:Local only1:Remote/LocalNote: Setting to 0invalidatesITEM026.
0 or 1 R R R R
026 R/L_SW Remote/Localswitch
0: Local, 1:Remote
Note: Valid onlywhen ITEM024 is1
0 or 1 R/W R/W R/W R
Analogoutput
029 SP Current Set Pointoutput
–15.00 to+115.00%
R R R R
Parameter 035 AT AT command/ATExecuting
0.1 R/W R R/W R R
041 DVA_SP Deviation alarmsetting (Hysteresisis set at ITEM012.)
0 to115.00%
R/W R R/W
Contactoutput
042 DVA Deviation alarmoutput
0 or 1 R R R R R R R
Parameter 054 P Proportional band 0.1 to999.9%
R/W R R/W
055 I Integral time (0:No integral action)
0 to 9999 s
R/W R R/W
056 D Differential time (0:No differentialaction)
0 to 9999 s
R/W R R/W
076 MH_LMT High MV limit ±320.00% R R/W R R/W
077 ML_LMT
Low MV limit ±320.00% R R/W R R/W

Appendix AReading/Writing Function Block ITEMs
142
ITEMtype
CX-Process Monitor screen (R:Read W:Write)Datarange
Data descriptionTagITEM
ITEMITEMtype Alarm
LogScreens
Annun-ciator
Screens
GraphicScreens
TrendScreens
TuningScreens
ControlScreens
OverviewScreen
Datarange
Data descriptionTagITEM
ITEM
Contactoutput
078 MHA High MV limitarrival output
1: Limit or more,
0: Less than limit
0 or 1 R R R R R
Contactoutput
079 MLA Low MV limitarrival output
1: Limit or less,
0: Not limit or less
0 or 1 R R R R R
Contactinput/parameter
086 A/M_SW Auto/Manualswitch
0: Manual, 1: Auto
0 or 1 R/W R/W R R/W R
Parameter 089 MV Host display of MV ±320.00% R/W R/W R R/W
091 MV_ABN MV executionerror display
0: Normal, 1: Error
0 or 1 R R R R R R
098 MV_ IDX MV index position –15.00 to+115.00%
R R/W R R/W
099 OP_MK Label 0 to 15 R/W R/W R R/W

Appendix AReading/Writing Function Block ITEMs
143
2-position ON/OFF (Block Model 001)ITEMt
ITEM TagITEM
Data description Data CX-Process Monitor screen (R:Read W:Write)type
gITEM
prange Overview
ScreenControlScreens
TuningScreens
TrendScreens
GraphicScreens
Annun-ciator
Screens
AlarmLog
Screens
Contactinput
000 MT_ST Stop blockoperationcommand(0:Cancel stop, 1:Stop)
0 or 1 R (Color) R (Color) R/W R R R
Analoginput
007 PV PV input –15.00 to+115.00%
R R R R
Parameter 008 HH_SP High/high alarmsetting
–15.00 to+115.00%
R R/W R R/W
009 H_SP High alarm setting –15.00 to+115.00%
R R/W R R/W
010 L_SP Low alarm setting –15.00 to+115.00%
R R/W R R/W
011 LL_ SP Low/low alarmsetting
–15.00 to+115.00%
R R/W R R/W
041 DVA_SP Deviation alarmsetting
0 to115.00%
R R/W R W
Contactoutput
013 HH High/high alarmoutput
0 or 1 R (Color) R (Color) R (Color) R R R Routput
014 H High alarm output 0 or 1 R (Color) R (Color) R (Color) R R R R
015 L Low alarm output 0 or 1 R (Color) R (Color) R (Color) R R R R
016 LL Low/low alarmoutput
0 or 1 R (Color) R (Color) R (Color) R R R R
042 DVA Deviation alarmoutput
0 or 1 R (Color) R (Color) R (Color) R R R R
Contactinput
017 ALM_OFF
Alarm stop switch 0 or 1 R (Color) R/W
Parameter 019 PV_ABN
PV execution errordisplay
0 or 1 R R R R R
023 SP Local Set Pointsetting
–15.00 to+115.00%
W W W
024 CAS_SET
Set Point settingmode
0 or 1 R R R R
026 R/L_SW Remote/Localswitch
0 or 1 R/W R/W R R/W R
Analogoutput
029 SP Current Set Pointoutput
–15.00 to+115.00%
R R R R
Parameter 093 MV Host display of MV 0 or 1 R/W R/W R R/W
099 OP_MK Label 0 to 15 R/W R/W R R/W

Appendix AReading/Writing Function Block ITEMs
144
3-position ON/OFF (Block Model 002)ITEMt
ITEM TagITEM
Data description Data CX-Process Monitor screen (R:Read W:Write)type
gITEM
prange Overview
ScreenControlScreens
TuningScreens
TrendScreens
GraphicScreens
Annun-ciator
Screens
AlarmLog
Screens
Contactinput
000 MT_ST Stop blockoperationcommand(0:Cancel stop, 1:Stop)
0 or 1 R (Color) R (Color) R/W R R R
Analoginput
007 PV PV input –15.00 to+115.00%
R R R R
Parameter 008 HH_SP High/high alarmsetting
–15.00 to+115.00%
R R/W R R/W
009 H_SP High alarm setting –15.00 to+115.00%
R R/W R R/W
010 L_SP Low alarm setting –15.00 to+115.00%
R R/W R R/W
011 LL_ SP Low/low alarmsetting
–15.00 to+115.00%
R R/W R R/W
041 DVA_SP Deviation alarmsetting
0 to115.00%
R R/W R R/W
Contactoutput
013 HH High/high alarmoutput
0 or 1 R (Color) R (Color) R (Color) R R R Routput
014 H High alarm output 0 or 1 R (Color) R (Color) R (Color) R R R R
015 L Low alarm output 0 or 1 R (Color) R (Color) R (Color) R R R R
016 LL Low/low alarmoutput
0 or 1 R (Color) R (Color) R (Color) R R R R
042 DVA Deviation alarmoutput
0 or 1 R (Color) R (Color) R (Color) R R R R
Contactinput
017 ALM_OFF
Alarm stop switch 0 or 1 R (Color) R (Color) R/W R R/W
Parameter 019 PV_ABN PV execution errordisplay
0 or 1 R R R R
023 SP Local Set Pointsetting
–15.00 to+115.00%
W W W
024 CAS_SET
Set Point settingmode
0 or 1 R R R R
026 R/L_SW Remote/Localswitch
0 or 1 R/W R/W R R/W R
Analogoutput
029 SP Current Set Pointoutput
–15.00 to+115.00%
R R R Routput
093 MVH Host display ofMVH
0 or 1 R/W R/W R R/W
095 MVL Host display ofMVL
0 or 1 R/W R/W R R/W
Parameter 099 OP_MK Label 0 to 15 R/W R/W R R/W

Appendix AReading/Writing Function Block ITEMs
145
Blended PID (Block Model 013)
ITEMt
ITEM TagITEM
Data description Data CX-Process Monitor screen (R:Read W:Write)type
gITEM
prange Overview
ScreenControlScreens
TuningScreens
TrendScreens
GraphicScreens
Annun-ciator
Screens
AlarmLog
Screens
Contactinput
000 MT_ST Stop blockoperationcommand(0:Cancel stop, 1:Stop)
0 or 1 R (Color) R (Color) R R R
Analoginput
007 PV PV input 0 to 9999 R R R R
Parameter 027 K1 Ratio 0 to3.2000
R/W R R/W
Accumulated value
t t
012 Q1 Accumulatedvalue
0 to 9999 R R Rd valueoutput 013 Q2 Accumulated
value0 to 9999 R R R
Analogoutput
016 Y1 Instantaneousvalue output
0 to320.00%
R R R Routput
029 Y2 Current Set Pointinstantaneousvalue output
0 to320.00%
R R R R
Parameter 031 CumulativedeviationHigh/high alarmoutput
±320.00% R/W R R/W
032 Cumulativedeviation Highalarm setting
±320.00% R/W R R/W
033 Cumulativedeviation Lowalarm setting
±320.00% R/W R R/W
034 Cumulativedeviation Low/lowalarm setting
±320.00% R/W R R/W
Contactoutput
036 DHH CumulativedeviationHigh/high alarmoutput
0 or 1 R (Color) R (Color) R (Color) R R R R
037 DH Cumulativedeviation Highalarm output
0 or 1 R (Color) R (Color) R (Color) R R R R
038 DL Cumulativedeviation Lowalarm output
0 or 1 R (Color) R (Color) R (Color) R R R R
039 DLL Cumulativedeviation Low/lowalarm output
0 or 1 R (Color) R (Color) R (Color) R R R R
Contactinput
017 ALM_OFF
Alarm stop switch 0 or 1 R (Color) R (Color) R/W R R/Winput
014 S1 Counter reset 0 or 1 R/W R R/W
Parameter 054 P Proportional band 0.1 to999.9%
R/W R R/W
055 I Integral time 0 to 9999 s
R/W R R/W
056 D Differential time 0 to 9999 s
R/W R R/W
076 MH_LMT High MV limit ±320.00% R/W R R/W
077 ML_LMT
Low MV limit ±320.00% R/W R R/W
Contactinput
086 A/M_SW Auto/Manualswitch
0 or 1 R/W R/W R R/W
Parameter 089 MV Host display of MV ±320.00% R/W R/W R R/W
091 MV_ABN MV error display
0: Normal, 1: Error
0 or 1 R R R R
098 MV_ IDX MV index position –15.00 to+115.00%
R R/W R R/W
099 OP_MK Label 0 to 15 R/W R/W R R/W

Appendix AReading/Writing Function Block ITEMs
146
Batch Flowrate Capture (Block Model 014)ITEMt
ITEM TagITEM
Data description Data CX-Process Monitor screen (R:Read W:Write)type
gITEM
prange Overview
ScreenControlScreens
TuningScreens
TrendScreens
GraphicScreens
Annun-ciator
Screens
AlarmLog
Screens
Contactinput
000 MT_ST Stop blockoperationcommand(0:Cancel stop, 1:Stop)
0 or 1 R (Color) R (Color) R/W R R R
Accumulatedvalue input
007 P1 PV input 0 to 9999 R R
Accumulatedvalue output
012 Q1 Accumulatedvalue (lower 4digits)
0000 to9999
R R R
013 Q2 Accumulatedvalue (upper 4digits)
0000 to9999
R R R
Contactinput
014 S3 Accumulationcounter resetswitch (1: Reset)
0 or 1 R/W R R/W
Analogoutput
016 Y1 Instantaneousvalue output
0 to320.00%
R R R R
Parameter 023 SP Local SP setting 0 to 9999 W W W
Contactinput/parameter
026 R/L_SW Remote/Localswitching
0: Local, 1:Remote
0 or 1 R/W R/W R R/W R
Accumulatedvalue output
029 SP Current Set Pointoutput
0 to 9999 R R R R
032 B0 Overrun setting(value subtractedfrom BM)
0 to 9999 R/W R R/W
033 BP Pre-batch setting(value subtractedfrom BM)
0 to 9999 R/W R R/W
034 B1 Flowrate limitation 0 to 9999 R/W R R/W
Analogoutput
035 SM Batchaccumulated value(lower 4 digits)
Fixed value
0000 to9999
R R R R/W
Contactinput
036 S1 Run switch (0: Reset, 1: Run)
0 or 1 R/W R/W R R/W Rinput
037 S2 Control interruptswitch (1:Interrupt)
0 or 1 R/W R/W R R/W R
Contactt t
038 U1 Main batch output 0 or 1 R R R R/W RCoutput 039 U2 Pre-batch output 0 or 1 R R R R/W R
Contactinput/parameter
086 A/M_SW SW
0: Manual, 1: Auto
0 or 1 R/W R/W R R/W R
Parameter 089 MV Host display of MV ±320.00% R/W R/W R R/W
091 MV_ABN MV error display
0: Normal, 1: Error
0 or 1 R R R R R R
098 MV_IDX MV index position –15 to115.00%
R R/W R R/W
099 OP_MK Label 0 to 15 R/W R/W R R/W

Appendix AReading/Writing Function Block ITEMs
147
Indication and Setting (Block Model 031)ITEMt
ITEM TagITEM
Data description Data CX-Process Monitor screen (R:Read W:Write)type
gITEM
prange Overview
ScreenControlScreens
TuningScreens
TrendScreens
GraphicScreens
Annun-ciator
Screens
AlarmLog
Screens
Contactinput
000 MT_ST Stop blockoperationcommand(0:Cancel stop, 1:Stop)
0 or 1 R (Color) R (Color) R/W R R R
Analoginput
007 PV PV input –15.00 to+115.00%
R R R R
Parameter 008 HH_SP High/high alarmsetting
–15.00 to+115.00%
R(– only)
R/W R R/W
009 H_SP High alarm setting –15.00 to+115.00%
R(– only)
R/W R R/W
010 L_SP Low alarm setting –15.00 to+115.00%
R(– only)
R/W R R/W
011 LL_ SP Low/low alarmsetting
–15.00 to+115.00%
R(– only)
R/W R R/W
Contactoutput
013 HH High/high alarmoutput
0 or 1 R (Color) R R R R R Routput
014 H High alarm output 0 or 1 R (Color) R R R R R R
015 L Low alarm output 0 or 1 R (Color) R R R R R R
016 LL Low/low alarmoutput
0 or 1 R (Color) R R R R R R
Contactinput
017 ALM_OFF
Alarm stop switch
0: Alarm, 1: Stop
0 or 1 R (Color) R/W R R/W R
Parameter 019 PV_ABN PV error display
0: Normal, 1: Error
0 or 1 R R R R R
023 SP Local Set Pointsetting
–15.00 to+115.00%
W W W
024 CAS_SET
Set Point settingmode
0 or 1 R/W R R R R
Contactinput/parameter
026 R/L_SW Remote/Localswitch
0 or 1 R/W R R/W R
Analogoutput
029 SP Current Set Pointoutput
–15.00 to+115.00%
R R R R
Parameter 099 OP_MK Label 0 to 15 R/W R/W R R/W

Appendix AReading/Writing Function Block ITEMs
148
Indication and Operation (Block Model 032)ITEMt
ITEM TagITEM
Data description Data CX-Process Monitor screen (R:Read W:Write)type
gITEM
prange Overview
ScreenControlScreens
TuningScreens
TrendScreens
GraphicScreens
Annun-ciator
Screens
AlarmLog
Screens
Contactinput
000 MT_ST Stop blockoperationcommand(0:Cancel stop, 1:Stop)
0 or 1 R (Color) R (Color) R/W R R R
Analoginput
007 PV PV input –15.00 to+115.00%
R R R R/W
Parameter 008 HH_SP High/high alarmsetting
–15.00 to+115.00%
R(– only)
R/W R R/W
009 H_SP High alarm setting –15.00 to+115.00%
R(– only)
R/W R R/W
010 L_SP Low alarm setting –15.00 to+115.00%
R(– only)
R/W R R/W
011 LL_ SP Low/low alarmsetting
–15.00 to+115.00%
R(– only)
R/W R R/W
Contactoutput
013 HH High/high alarmoutput
0 or 1 R (Color) R R R R R Routput
014 H High alarm output 0 or 1 R (Color) R R R R R R
015 L Low alarm output 0 or 1 R (Color) R R R R R R
016 LL Low/low alarmoutput
0 or 1 R (Color) R R R R R R
Contactinput
017 ALM_OFF
Alarm stop switch
0: Alarm, 1: Stop
0 or 1 R (Color) R/W R R/W R
Parameter 019 PV_ABN PV error display
0: Normal, 1: Error
0 or 1 R R R R R
Parameter 076 MH_LMT High MV limit ±320.00% R R/W R R/W
077 ML_LMT
Low MV limit ±320.00% R R/W R R/W
078 MHA MV upper limitoutput value
1: Upper limit ormore
0: Less than upperlimit
0 or 1 R R R R R
079 MLA MV lower limitoutput value
1: Lower limit orless
0: Greater thanlower limit
0 or 1 R R R R R
Analoginput
084 X1 Auto input ±320.00% R R R R
Contactinput
086 A/M_SW Auto/Manualswitch
0: Manual, 1: Auto
0 or 1 R/W R/W R R/W R
Parameter 089 MV Inversion of hostdisplay of MV
±320.00% R/W R/W R R/W
091 MV_ABN
MV executionerror display
0: Normal, 1: Error
0 or 1 R R R R R R
098 MV_ IDX MV index position –15.00 to+115.00%
R R/W R R/W
099 OP_MK Label 0 to 15 R/W R/W R R/W

Appendix AReading/Writing Function Block ITEMs
149
Ratio Setting (Block Model 033)ITEMt
ITEM TagITEM
Data description Data CX-Process Monitor screen (R:Read W:Write)type
gITEM
prange Overview
ScreenControlScreens
TuningScreens
TrendScreens
GraphicScreens
Annun-ciator
Screens
AlarmLog
Screens
Contactinput
000 MT_ST Stop blockoperationcommand(0:Cancel stop, 1:Stop)
0 or 1 R (Color) R (Color) R/W R R R
Analoginput
007 PV Reference input –15.00 to+115.00%
R R R R
Parameter 019 PV_ABN
PV error display
0: Normal, 1: Error
0 or 1 R R R R R
023 SP Local ratio setting –15.00 to+115.00%
R/W R/W R R
Contactinput
024 CAS_SET
Ratio setting mode
0: Local only
1: Remote/Local
0 or 1 R R R R
026 R/L_SW Remote/Localswitch
0: Local, 1:Remote
0 or 1 R/W R/W R R/W R
Parameter 054 K1 Ratio range (setssignal ratio rangecorresponding toSet Point=100%)
±10.000 R/W R R/W
055 A1 Input bias ±320.00% R/W R R/W
056 B1 Output bias ±320.00% R/W R R/W
076 MH_LMT High MV limit ±320.00% R R/W R R/W
077 ML_LMT
Low MV limit ±320.00% R R/W R R/W
Contactinput
086 A/M_SW Auto/Manualswitch
0: Manual, 1: Auto
0 or 1 R/W R/W R R/W R
Parameter 089 MV Host display of MV ±320.00% R/W R/W R R/W
091 MV_ABN
MV error display
0: Normal, 1: Error
0 or 1 R R R R R R
098 MV_ IDX MV index position –15.00 to+115.00%
R R/W R R/W
099 OP_MK Label 0 to 15 R/W R/W R R/W

Appendix AReading/Writing Function Block ITEMs
150
Indicator (Block Model 034)ITEMt
ITEM TagITEM
Data description Data CX-Process Monitor screen (R:Read W:Write)type
gITEM
prange Overview
ScreenControlScreens
TuningScreens
TrendScreens
GraphicScreens
Annun-ciator
Screens
AlarmLog
Screens
Contactinput
000 MT_ST Stop blockoperationcommand(0:Cancel stop, 1:Stop)
0 or 1 R (Color) R (Color) R/W R R R
Analoginput
007 PV PV input –15.00 to+115.00%
R R R R
Parameter 008 HH_SP High/high alarmsetting
–15.00 to+115.00%
R(– only)
R/W R R/W
009 H_SP High alarm setting –15.00 to+115.00%
R(– only)
R/W R R/W
010 L_SP Low alarm setting –15.00 to+115.00%
R(– only)
R/W R R/W
011 LL_ SP Low/low alarmsetting
–15.00 to+115.00%
R(– only)
R/W R R/W
Contactoutput
013 HH High/high alarmoutput
0 or 1 R (Color) R R R R R Routput
014 H High alarm output 0 or 1 R (Color) R R R R R R
015 L Low alarm output 0 or 1 R (Color) R R R R R R
016 LL Low/low alarmoutput
0 or 1 R (Color) R R R R R R
Contactinput
017 ALM_OFF
Alarm stop switch
0: Alarm, 1: Stop
0 or 1 R (Color) R (Color) R/W R R/W R
Parameter 019 PV_ABN
PV error display
0: Normal, 1: Error
0 or 1 R R R R R
099 OP_MK Label 0 to 15 R/W R/W R R/W
High/Low Alarm (Block Model 111)ITEMt
ITEM TagITEM
Data description Data CX-Process Monitor screen (R:Read W:Write)type
gITEM
prange Overview
ScreenControlScreens
TuningScreens
TrendScreens
GraphicScreens
Annun-ciator
Screens
AlarmLog
Screens
Analoginput
008 PV PV input ±320.00% R R R
Parameter 009 H_SP High setting ±320.00% R/W R R/W
010 L_SP Low setting ±320.00% R/W R R/W
Contactt t
012 H High alarm output 0 or 1 R (Color) R R R R RCoutput 013 L Low alarm output 0 or 1 R (Color) R R R R R

Appendix AReading/Writing Function Block ITEMs
151
Segment Program 2 (Block Model 157)ITEMt
ITEM TagITEM
Data description Data range CX-Process Monitor screen (R:Read W:Write)type
gITEM
p g
OverviewScreen
ControlScreens
TuningScreens
TrendScreens
GraphicScreens
Annun-ciator
Screens
AlarmLog
Screens
Contactinput
000 MT_SW
Stop block operationcommand(0: Cancelstop, 1: Stop)
0 or 1 R R R/W R R
Analoginput
007 X1 Reference input ±320.00% R R R R
Analogoutput
008 Y1 Program output ±320.00% R/W R R R/W
Analogt t
009 Y2 Elapsed time unit 0 to 3200.0goutput 011 Y3 Step output 0 to 30 R R R R
Contacti t
013 S1 Run/stop command 0 or 1 R (Color) R/W R/W R RCinput 014 S2 Hold switch 0 or 1 R (Color) R/W R/W R R/W
Contactt t
015 U1 X1 input error 0 or 1 R R R R/WCoutput 016 U2 Arrival at final segment 0 or 1
Contactinput
017 S3 Move to next waitcommand
0 or 1 R/W R/W R Rinput
018 S4 Move to next stepcommand
0 or 1 R/W R/W R R
019 U10 Waiting 0 or 1 R R R R

Appendix AReading/Writing Function Block ITEMs
152
ITEMtype
CX-Process Monitor screen (R:Read W:Write)Data rangeData descriptionTagITEM
ITEMITEMtype Alarm
LogScreens
Annun-ciator
Screens
GraphicScreens
TrendScreens
TuningScreens
ControlScreens
OverviewScreen
Data rangeData descriptionTagITEM
ITEM
Parameter 022 B0 Default ±320.00% R R
023 Step1 Time width 0 to 3200.0 R/W forh024 Step1 Output value ±320.00%
/eachstep
025 Step1 Time unit 0 to 2step
026 Step2 Time width 0 to 3200.0
027 Step2 Output value ±320.00%
028 Step2 Time unit 0 to 2
029 Step3 Time width 0 to 3200.0
030 Step3 Output value ±320.00%
031 Step3 Time unit 0 to 2
032 Step4 Time width 0 to 3200.0
033 Step4 Output value ±320.00%
034 Step4 Time unit 0 to 2
035 Step5 Time width 0 to 3200.0
036 Step5 Output value ±320.00%
037 Step5 Time unit 0 to 2
038 Step6 Time width 0 to 2
039 Step6 Output value ±320.00%
040 Step6 Time unit 0 to 2
041 Step7 Time width 0 to 3200.0
042 Step7 Output value ±320.00%
043 Step7 Time unit 0 to 2
044 Step8 Time width 0 to 3200.0
045 Step8 Output value ±320.00%
046 Step8 Time unit 0 to 2
047 Step9 Time width 0 to 3200.0
048 Step9 Output value ±320.00%
049 Step9 Time unit 0 to 2
050 Step10 Time width 0 to 3200.0
051 Step10 Output value ±320.00%
052 Step11 Time unit 0 to 2
053 Step11 Time width 0 to 3200.0
054 Step11 Output value ±320.00%
055 Step11 Time unit 0 to 2
056 Step12 Time width 0 to 3200.0
057 Step12 Output value ±320.00%
058 Step12 Time unit 0 to 2
059 Step13 Time width 0 to 3200.0
060 Step13 Output value ±320.00%
061 Step13 Time unit 0 to 2
062 Step14 Time width 0 to 3200.0
063 Step14 Output value ±320.00%
064 Step14 Time unit 0 to 2
065 Step15 Time width 0 to 3200.0
066 Step15 Output value ±320.00%
067 Step15 Time unit 0 to 2
068 Step16 Time width 0 to 3200.0
069 Step16 Output value ±320.00%
070 Step16 Time unit 0 to 2
071 Step17 Time width 0 to 3200.0
072 Step17 Output value ±320.00%
073 Step17 Time unit 0 to 2
074 Step18 Time width 0 to 3200.0
075 Step18 Output value ±320.00%
076 Step18 Time unit 0 to 2
077 Step19 Time width 0 to 3200.0

Appendix AReading/Writing Function Block ITEMs
153
ITEMtype
CX-Process Monitor screen (R:Read W:Write)Data rangeData descriptionTagITEM
ITEMITEMtype Alarm
LogScreens
Annun-ciator
Screens
GraphicScreens
TrendScreens
TuningScreens
ControlScreens
OverviewScreen
Data rangeData descriptionTagITEM
ITEM
Parameter 078 Step19 Output value ±320.00% R/W forh
079 Step19 Time unit 0 to 2
/eachstep
080 Step20 Time width 0 to 3200.0step
081 Step20 Output value ±320.00%
082 Step20 Time unit 0 to 2
083 Step21 Time width 0 to 3200.0
084 Step21 Output value ±320.00%
085 Step21 Time unit 0 to 2
086 Step22 Time width 0 to 3200.0
087 Step22 Output value ±320.00%
088 Step22 Time unit 0 to 2
089 Step23 Time width 0 to 3200.0
090 Step23 Output value ±320.00%
091 Step23 Time unit 0 to 2
092 Step24 Time width 0 to 3200.0
093 Step24 Output value ±320.00%
094 Step24 Time unit 0 to 2
095 Step25 Time width 0 to 3200.0
096 Step25 Output value ±320.00%
097 Step25 Time unit 0 to 2
098 Step26 Time width 0 to 3200.0
099 Step26 Output value ±320.00%
100 Step26 Time unit 0 to 2
101 Step27 Time width 0 to 3200.0
102 Step27 Output value ±320.00%
103 Step27 Time unit 0 to 2
104 Step28 Time width 0 to 3200.0
105 Step28 Output value ±320.00%
106 Step28 Time unit 0 to 2
107 Step29 Time width 0 to 3200.0
108 Step29 Output value ±320.00%
109 Step29 Time unit 0 to 2
110 Step30 Time width 0 to 3200.0
111 Step30 Output value ±320.00%
112 Step30 Time unit 0 to 2

Appendix AReading/Writing Function Block ITEMs
154
ITEMtype
CX-Process Monitor screen (R:Read W:Write)Data rangeData descriptionTagITEM
ITEMITEMtype Alarm
LogScreens
Annun-ciator
Screens
GraphicScreens
TrendScreens
TuningScreens
ControlScreens
OverviewScreen
Data rangeData descriptionTagITEM
ITEM
� Wait setting
Parameter 121 Step1 Wait width 0 to 320.00% R/W forh122 Step1 Wait time 0 to 3200.0
/eachstep
123 Step2 Wait width 0 to 320.00%step
124 Step2 Wait time 0 to 3200.0
125 Step3 Wait width 0 to 320.00%
126 Step3 Wait time 0 to 3200.0
127 Step4 Wait width 0 to 320.00%
128 Step4 Wait time 0 to 3200.0
129 Step5 Wait width 0 to 320.00%
130 Step5 Wait time 0 to 3200.0
131 Step6 Wait width 0 to 320.00%
132 Step6 Wait time 0 to 3200.0
133 Step7 Wait width 0 to 320.00%
134 Step7 Wait time 0 to 3200.0
135 Step8 Wait width 0 to 320.00%
136 Step8 Wait time 0 to 3200.0
137 Step9 Wait width 0 to 320.00%
138 Step9 Wait time 0 to 320.0
139 Step10 Wait width 0 to 320.00%
140 Step10 Wait time 0 to 3200.0
141 Step11 Wait width 0 to 320.00%
142 Step11 Wait time 0 to 3200.0
143 Step12 Wait width 0 to 320.00%
144 Step12 Wait time 0 to 3200.0
145 Step13 Wait width 0 to 320.00%
146 Step13 Wait time 0 to 3200.0
147 Step14 Wait width 0 to 320.00%
148 Step14 Wait time 0 to 3200.0
149 Step15 Wait width 0 to 320.00%
150 Step15 Wait time 0 to 3200.0
151 Step16 Wait width 0 to 320.00%
152 Step16 Wait time 0 to 3200.0
153 Step17 Wait width 0 to 320.00%
154 Step17 Wait time 0 to 3200.0
155 Step18 Wait width 0 to 320.00%
156 Step18 Wait time 0 to 3200.0
157 Step19 Wait width 0 to 320.00%
158 Step19 Wait time 0 to 3200.0
159 Step20 Wait width 0 to 320.00%
160 Step20 Wait time 0 to 3200.0
161 Step21 Wait width 0 to 320.00%
162 Step21 Wait time 0 to 3200.0
163 Step22 Wait width 0 to 320.00%
164 Step22 Wait time 0 to 3200.0
165 Step23 Wait width 0 to 320.00%
166 Step23 Wait time 0 to 3200.0
167 Step24 Wait width 0 to 320.00%
168 Step24 Wait time 0 to 3200.0
169 Step25 Wait width 0 to 320.00%
170 Step25 Wait time 0 to 3200.0

Appendix AReading/Writing Function Block ITEMs
155
ITEMtype
CX-Process Monitor screen (R:Read W:Write)Data rangeData descriptionTagITEM
ITEMITEMtype Alarm
LogScreens
Annun-ciator
Screens
GraphicScreens
TrendScreens
TuningScreens
ControlScreens
OverviewScreen
Data rangeData descriptionTagITEM
ITEM
Parameter 171 Step26 Wait width 0 to 320.00% R/W forh172 Step26 Wait time 0 to 3200.0
/eachstep
173 Step27 Wait width 0 to 320.00%step
174 Step27 Wait time 0 to 3200.0
175 Step28 Wait width 0 to 320.00%
176 Step28 Wait time 0 to 3200.0
177 Step29 Wait width 0 to 320.00%
178 Step29 Wait time 0 to 3200.0
179 Step30 Wait width 0 to 320.00%
180 Step30 Wait time 0 to 3200.0
� Step Executing flag
Contactt t
221 U11 Step1 Executing flag 0 or 1Coutput 222 U12 Step2 Executing flag 0 or 1
223 U13 Step3 Executing flag 0 or 1
224 U14 Step4 Executing flag 0 or 1
225 U15 Step5 Executing flag 0 or 1
226 U16 Step6 Executing flag 0 or 1
227 U17 Step7 Executing flag 0 or 1
228 U18 Step8 Executing flag 0 or 1
229 U19 Step9 Executing flag 0 or 1
230 U20 Step10 Executing flag 0 or 1
231 U21 Step11 Executing flag 0 or 1
232 U22 Step12 Executing flag 0 or 1
233 U23 Step13 Executing flag 0 or 1
234 U24 Step14 Executing flag 0 or 1
235 U25 Step15 Executing flag 0 or 1
236 U26 Step16 Executing flag 0 or 1
237 U27 Step17 Executing flag 0 or 1
238 U28 Step18 Executing flag 0 or 1
239 U29 Step19 Executing flag 0 or 1
240 U30 Step20 Executing flag 0 or 1
241 U31 Step21 Executing flag 0 or 1
242 U32 Step22 Executing flag 0 or 1
243 U33 Step23 Executing flag 0 or 1
244 U34 Step24 Executing flag 0 or 1
245 U35 Step25 Executing flag 0 or 1
246 U36 Step26 Executing flag 0 or 1
247 U37 Step27 Executing flag 0 or 1
248 U38 Step28 Executing flag 0 or 1
249 U39 Step29 Executing flag 0 or 1
250 U40 Step30 Executing flag 0 or 1

Appendix AReading/Writing Function Block ITEMs
156
ON/OFF Valve Manipulator (Block Model 221)ITEMt
ITEM TagITEM
Data description Data range CX-Process Monitor screen (R:Read W:Write)type
gITEM
p g
OverviewScreen
ControlScreens
TuningScreens
TrendScreens
GraphicScreens
Annun-ciator
Screens
AlarmLog
Screens
Contactinput
000 MT_SW Stop block operationcommand(0: Cancelstop, 1: Stop)
0 or 1 R R R
012 S2 Auto input
0:OFF; 1:ON
0 or 1 R R R R
013 S3 Manual input
0:OFF; 1:ON
0 or 1 R/W R R R
015 S5 Open limit switch input 0 or 1 R R R R
016 S6 Close limit switch input 0 or 1 R R R R
022 U2 Valve action time error(1:error)
0 or 1 R(Color)
R R R R
023 U3 Valve open midway
(1: Open midway)
0 or 1 R R R R
085 S4 Site manipulation switchinput
(0:Central; 1:Site)
0 or 1 R(Color)
R R R
Parameter 086 A/M_SW
Auto/Manual switching
0: Manual, 1: Auto
0 or 1 R/W R R/W R
099 OP_MK Label 0 to 15 R/W R R/W
Motor Manipulator (Block Model 222)ITEMt
ITEM TagITEM
Data description Data range CX-Process Monitor screen (R:Read W:Write)type
gITEM
p g
OverviewScreen
ControlScreens
TuningScreens
TrendScreens
GraphicScreens
Annun-ciator
Screens
AlarmLog
Screens
Contactinput
000 MT_SW Stop block operationcommand(0: Cancelstop, 1: Stop)
0 or 1 R R R
012 S2 Auto input
0:OFF; 1:ON
0 or 1 R R R R
013 S3 Manual input
0:OFF; 1:ON
0 or 1 R/W R R R
015 S5 Answer input 0 or 1 R R R R
022 U2 Answer error
(1:error)
0 or 1 R(Color)
R R R R
Analog in-put
032 X1 CT input –320.00 to+320.00%
R R R
Parameter 033 H_SP CT input high alarm set-ting
–320.00 to+320.00%
R (–) R R/W
Contactoutput
036 H CT input high alarm out-put
0 or 1 R R R R R
Contactinput
085 S4 Site manipulation switchinput
(0:Central; 1:Site)
0 or 1 R(Color)
R R R
Parameter 086 A/M_SW
Auto/Manual switching
0: Manual, 1: Auto
0 or 1 R/W R R/W R
099 OP_MK Label 0 to 15 R/W R R/W
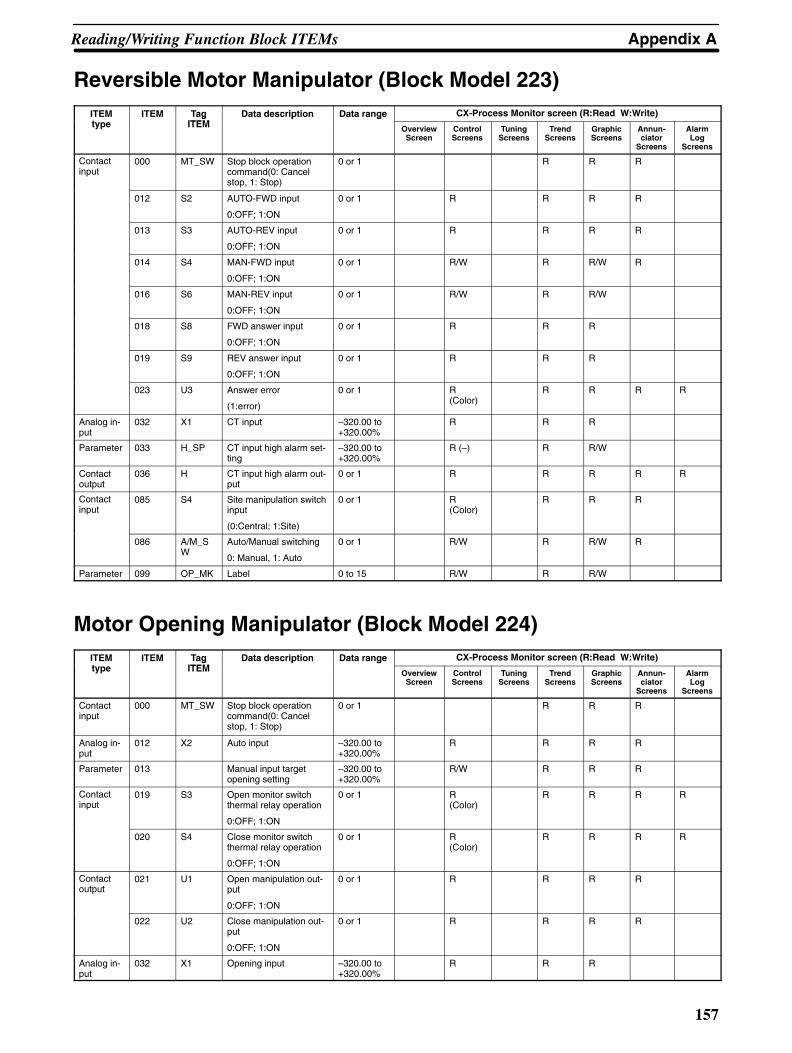
Appendix AReading/Writing Function Block ITEMs
157
Reversible Motor Manipulator (Block Model 223)ITEMt
ITEM TagITEM
Data description Data range CX-Process Monitor screen (R:Read W:Write)type
gITEM
p g
OverviewScreen
ControlScreens
TuningScreens
TrendScreens
GraphicScreens
Annun-ciator
Screens
AlarmLog
Screens
Contactinput
000 MT_SW Stop block operationcommand(0: Cancelstop, 1: Stop)
0 or 1 R R R
012 S2 AUTO-FWD input
0:OFF; 1:ON
0 or 1 R R R R
013 S3 AUTO-REV input
0:OFF; 1:ON
0 or 1 R R R R
014 S4 MAN-FWD input
0:OFF; 1:ON
0 or 1 R/W R R/W R
016 S6 MAN-REV input
0:OFF; 1:ON
0 or 1 R/W R R/W
018 S8 FWD answer input
0:OFF; 1:ON
0 or 1 R R R
019 S9 REV answer input
0:OFF; 1:ON
0 or 1 R R R
023 U3 Answer error
(1:error)
0 or 1 R(Color)
R R R R
Analog in-put
032 X1 CT input –320.00 to+320.00%
R R R
Parameter 033 H_SP CT input high alarm set-ting
–320.00 to+320.00%
R (–) R R/W
Contactoutput
036 H CT input high alarm out-put
0 or 1 R R R R R
Contactinput
085 S4 Site manipulation switchinput
(0:Central; 1:Site)
0 or 1 R(Color)
R R R
086 A/M_SW
Auto/Manual switching
0: Manual, 1: Auto
0 or 1 R/W R R/W R
Parameter 099 OP_MK Label 0 to 15 R/W R R/W
Motor Opening Manipulator (Block Model 224)ITEMt
ITEM TagITEM
Data description Data range CX-Process Monitor screen (R:Read W:Write)type
gITEM
p g
OverviewScreen
ControlScreens
TuningScreens
TrendScreens
GraphicScreens
Annun-ciator
Screens
AlarmLog
Screens
Contactinput
000 MT_SW Stop block operationcommand(0: Cancelstop, 1: Stop)
0 or 1 R R R
Analog in-put
012 X2 Auto input –320.00 to+320.00%
R R R R
Parameter 013 Manual input targetopening setting
–320.00 to+320.00%
R/W R R R
Contactinput
019 S3 Open monitor switchthermal relay operation
0:OFF; 1:ON
0 or 1 R(Color)
R R R R
020 S4 Close monitor switchthermal relay operation
0:OFF; 1:ON
0 or 1 R(Color)
R R R R
Contactoutput
021 U1 Open manipulation out-put
0:OFF; 1:ON
0 or 1 R R R R
022 U2 Close manipulation out-put
0:OFF; 1:ON
0 or 1 R R R R
Analog in-put
032 X1 Opening input –320.00 to+320.00%
R R R

Appendix AReading/Writing Function Block ITEMs
158
ITEMtype
CX-Process Monitor screen (R:Read W:Write)Data rangeData descriptionTagITEM
ITEMITEMtype Alarm
LogScreens
Annun-ciator
Screens
GraphicScreens
TrendScreens
TuningScreens
ControlScreens
OverviewScreen
Data rangeData descriptionTagITEM
ITEM
Parameter 033 H_SP Opening input high limitalarm setting
–320.00 to+320.00%
R (–) R
034 L_SP Opening input low limitalarm setting
–320.00 to+320.00%
R (–) R
Contactoutput
036 H Opening input high limitalarm output
0 or 1 R (Color) R(Color)
R R R Routput
037 L Opening input low limitalarm output
0 or 1 R (Color) R(Color)
R R R R
Contactinput
085 S2 Site manipulation switchinput
(1: Site, 1: Central)
0 or 1 R(Color)
R R R
086 A/M_SW Auto/Manual switching
0: Manual, 1: Auto
0 or 1 R/W R R/W R
Parameter 099 OP_MK Label 0 to 15 R/W R R/W
Timer (Block Model 205)ITEMt
ITEM TagITEM
Data description Data range CX-Process Monitor screen (R:Read W:Write)type
gITEM
p g
OverviewScreen
ControlScreens
TuningScreens
TrendScreens
GraphicScreens
Annun-ciator
Screens
AlarmLog
Screens
Parameter 007 SP Setting 0 to 3200.0 R/W R R/W
008 PRE-SET
Prediction (subtractedfrom setting)
0 to 3200.0 R/W R R/W
Analogoutput
009 PV Time elapsed 0 to 3200.0 R R R
Contacti t
011 S1 Run switch 0 or 1 R/W R R RCinput 012 S2 Interrupt switch 0 or 1 R/W R R R
Contactt t
013 U1 Arrival at setting 0 or 1 R R R RCoutput 014 U2 Arrival at prediction 0 or 1 R R R R
Counter (Block Model 208)ITEMt
ITEM TagITEM
Data description Data range CX-Process Monitor screen (R:Read W:Write)type
gITEM
p g
OverviewScreen
ControlScreens
TuningScreens
TrendScreens
GraphicScreens
Annun-ciator
Screens
AlarmLog
Screens
Parameter 007 SP Setting 0 to 9999 R/W R R/W
008 PRE-SET
Prediction (subtractedfrom setting)
0 to 9999 R/W R R/W
80 Analogoutput
009 PV Count 0 to 9999 R R R
Contactinput
010 S1 Run switch 0 or 1 R/W R R R
Contactt t
012 U1 Arrival at setting 0 or 1 R R R RCoutput 013 U2 Arrival at prediction 0 or 1 R R R R

159
Appendix BFinsGateway Settings when Connected
Using Controller Link
If connecting CX-Process Monitor over a Controller Link network, and sending and receiving data with the LoopControl Unit on a PLC via the Controller Link network, you must create a Controller Link data link table, and registerall the nodes.
Make the settings using the following procedure.
1. FinsGateway settings
2. Create and transfer the data link table.
Each procedure is shown in detail below.
1. FinsGateway SettingsAn outline of the setting procedure is as follows:
1) Start the FinsGateway Service Manager.
2) Set the Controller Link network.
3) Set the communications Unit.

Appendix BFinsGateway Settings when Connected Using Controller Link
160
1) Start the FinsGateway Settings ManagerSelect FinsGateway, and then select FinsGateway Settings to start the FinsGateway Settings.
The following dialog box will be displayed.
1, 2, 3... 1. Select CLK_UNIT0 and CPU_UNIT as shown in 1 above, and then click the Start Button to start thecommunications service.
2. Next, click the button marked 2 in the above diagram. The FinsGateway Network Navigator DialogBox will be displayed as shown below.
3. Click the Start Button.

Appendix BFinsGateway Settings when Connected Using Controller Link
161
2) Controller Link Network Settings1, 2, 3... 1. Select CLK (PCI) or Controller Link in the Network and Unit Settings, and click the Property But-
ton. The CLK (PCI) or Controller Link Properties Dialog Box will be displayed.
2. Select the Network Tab.
3. Set the parameters as follows:
Network number: 1
Local node number: 32
Communication unit number: 18

Appendix BFinsGateway Settings when Connected Using Controller Link
162
Communication Unit SettingsSelect the Communication Unit Tab.
Make the following settings in the Network Participation Status Field:
• Select the Map Network Participation Status To Event Memory Button.
• Set Memory Name to DM.
• Set Offset to 16 Words.
Make the following settings in the Data Link Status Field:
• Select the Map Data Link Status To Event Memory Button.
This completes the FinsGateway settings.
Creating and Transferring the Data Link TableThe flowchart outline for creating and transferring the data link table is as follows:
1) Create the local node (computer) data link table.
2) Create the data link table for other nodes (PLC).
3) Start the data link.
The data link table setting procedure is different when the number of other nodes (i.e., the number of PLCs con-nected to the network) is one, and when it is two or more. This section shows the data link setting procedure whenthe number of other nodes is one, and when the number of other nodes is two.

Appendix BFinsGateway Settings when Connected Using Controller Link
163
Example 1: Number of Other Nodes is 1 (There is Only 1 PLC)
Loop Control Unit
Controller Link Unit
Controller Link Controller Link SupportBoard
In the above configuration, one PLC is connected to the network. The Controller Link Unit’s node address is set to 1using the rotary switch on the front of the Unit.
Creating the Local Node’s Data Link Table1, 2, 3... 1. Select FinsGateway, and then select FinsGateway Settings, and then select Controller Link
Properties.
2. Click the Data Link. The following dialog box will be displayed.
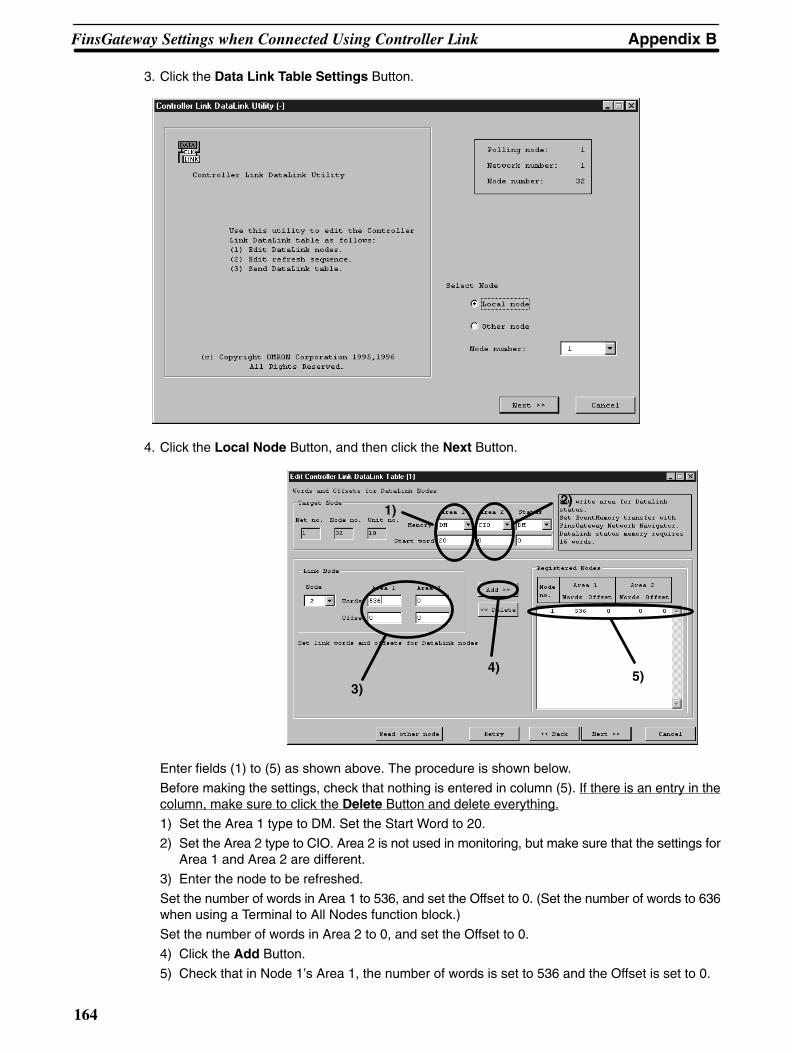
Appendix BFinsGateway Settings when Connected Using Controller Link
164
3. Click the Data Link Table Settings Button.
4. Click the Local Node Button, and then click the Next Button.
1)2)
5)4)
3)
Enter fields (1) to (5) as shown above. The procedure is shown below.
Before making the settings, check that nothing is entered in column (5). If there is an entry in thecolumn, make sure to click the Delete Button and delete everything.
1) Set the Area 1 type to DM. Set the Start Word to 20.
2) Set the Area 2 type to CIO. Area 2 is not used in monitoring, but make sure that the settings forArea 1 and Area 2 are different.
3) Enter the node to be refreshed.
Set the number of words in Area 1 to 536, and set the Offset to 0. (Set the number of words to 636when using a Terminal to All Nodes function block.)
Set the number of words in Area 2 to 0, and set the Offset to 0.
4) Click the Add Button.
5) Check that in Node 1’s Area 1, the number of words is set to 536 and the Offset is set to 0.

Appendix BFinsGateway Settings when Connected Using Controller Link
165
5. Click the Next Button to proceed to the next step.
6. Proceed to Edit Controller Link Data Link Table (2). Normally, use this screen to set the data linkrefresh order, but here click the Next Button to proceed to the next step.
7. Click the Finish Button. The verification dialog box will be displayed. Click the Start Button.
This completes the local node’s data link table settings. When you click the Start Button, the datalink will start immediately. Other node settings have not yet been completed, however, so stop thedata link using the Controller Link Properties Screen.
2) Creating Data Link Tables for Other Nodes1, 2, 3... 1. Select FinsGateway, and then select Service Manager, and then select Controller Link Proper-
ties.

Appendix BFinsGateway Settings when Connected Using Controller Link
166
2. Click the Data Link Tab. The following dialog box will be displayed.
3. Click the Data Link Table Settings Button.
4. Select the Other Node Button, and set the node number to 1. Refer to the above diagram.

Appendix BFinsGateway Settings when Connected Using Controller Link
167
5. Click the Next Button to proceed to the next step.
1)
2)
6)5)
4)
3)
Enter fields (1) to (6) as shown above. The procedure is shown below.Before making the settings, check that nothing is entered in column (5). If there is an entry in thecolumn, make sure to click the Delete Button and delete everything.1) Set the Area 1 type to DM. Set the Start Word to 16020.2) Set the Area 2 type to CIO. Area 2 is not used in monitoring, but make sure that the settings for
Area 1 and Area 2 are different.3) Set the Status Area type to DM. Set the Start Word to 16000.4) Enter the node to be refreshed.
• Set the number of words in Area 1 to 536, and set the Offset to 0. (Set the number of words to636 when using a Terminal to All Nodes function block.)
• Set the number of words in Area 2 to 0, and set the Offset to 0.5) Click the Add Button.6) Check that in Node 1’s Area 1, the number of words is set to 536 and the Offset is set to 0. (Set
the number of words to 636 when using a Terminal to All Nodes function block.)6. Click the Next Button to proceed to the next step.7. Proceed to Edit Controller Link Data Link Table (2). Normally, use this screen to set the data link
refresh order, but here click the Next Button to proceed to the next step.

Appendix BFinsGateway Settings when Connected Using Controller Link
168
8. Click the Finish Button. The verification dialog box will be displayed. Click the Start Button.
This completes the local node’s data link table settings. When you click the Start Button, the datalink will start.
Note Check that the Controller Link Unit’s indicator shows that the data link is operating. If there is an error, checkfor troubleshooting procedures using the Controller Link Unit Operation Manual.
Example 2: Number of Other Nodes is 2 (There are 2 PLCs)
Loop Control Unit Loop Control Unit
Controller Link Unit Controller Link Unit Controller Link SupportBoard
Controller Link
In the above configuration, one PLC is connected to the network. The Controller Link Unit’s node addresses areset to 1 and 2 respectively, using the rotary switch on the front of each Unit.
Creating the Local Node’s Data Link Table1, 2, 3... 1. Select FinsGateway, and then select FinsGateway Settings, and then select Controller Link
Properties.

Appendix BFinsGateway Settings when Connected Using Controller Link
169
2. Double click the Data Link Tab. The following dialog box will be displayed.
3. Click the Data Link Table Settings Button.
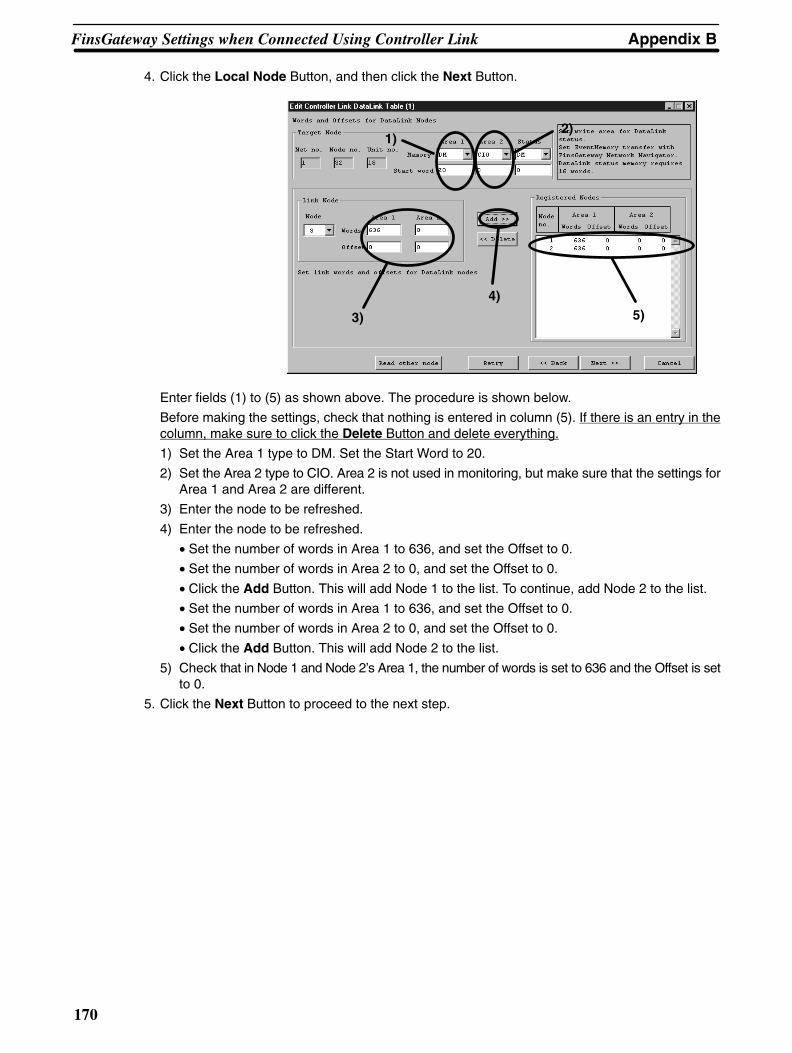
Appendix BFinsGateway Settings when Connected Using Controller Link
170
4. Click the Local Node Button, and then click the Next Button.
1)2)
5)4)
3)
Enter fields (1) to (5) as shown above. The procedure is shown below.
Before making the settings, check that nothing is entered in column (5). If there is an entry in thecolumn, make sure to click the Delete Button and delete everything.
1) Set the Area 1 type to DM. Set the Start Word to 20.
2) Set the Area 2 type to CIO. Area 2 is not used in monitoring, but make sure that the settings forArea 1 and Area 2 are different.
3) Enter the node to be refreshed.
4) Enter the node to be refreshed.
• Set the number of words in Area 1 to 636, and set the Offset to 0.
• Set the number of words in Area 2 to 0, and set the Offset to 0.
• Click the Add Button. This will add Node 1 to the list. To continue, add Node 2 to the list.
• Set the number of words in Area 1 to 636, and set the Offset to 0.
• Set the number of words in Area 2 to 0, and set the Offset to 0.
• Click the Add Button. This will add Node 2 to the list.
5) Check that in Node 1 and Node 2’s Area 1, the number of words is set to 636 and the Offset is setto 0.
5. Click the Next Button to proceed to the next step.

Appendix BFinsGateway Settings when Connected Using Controller Link
171
6. Proceed to Edit Controller Link Data Link Table (2). Normally, use this screen to set the data linkrefresh order, but here click the Next Button to proceed to the next step.
7. Click the Finish Button. The verification dialog box will be displayed. Click the Start Button.
This completes the local node’s data link table settings. When you click the Start Button, the datalink will start immediately. Other node settings have not yet been completed, however, so stop thedata link using the Controller Link Properties Screen.
2) Creating Data Link Tables for Other NodesSetting Node 1’s Data Link Table
1, 2, 3... 1. Select FinsGateway, and then select FinsGateway Settings, and then select Controller LinkProperties.

Appendix BFinsGateway Settings when Connected Using Controller Link
172
2. Click the Data Link Tab. The following dialog box will be displayed.
3. Click the Data Link Table Settings Button.
4. Select the Other Node Button, and set the node number to 1. Refer to the above diagram.

Appendix BFinsGateway Settings when Connected Using Controller Link
173
5. Click the Next Button to proceed to the next step.
1)
2)
6)5)
4)
3)
Enter fields (1) to (6) as shown above. The procedure is shown below.
Before making the settings, check that nothing is entered in column (5). If there is an entry in thecolumn, make sure to click the Delete Button and delete everything.
1) Set the Area 1 type to DM. Set the Start Word to 16020.
2) Set the Area 2 type to CIO. Area 2 is not used in monitoring, but make sure that the settings forArea 1 and Area 2 are different.
3) Set the Status Area type to DM. Set the Start Word to 16000.
4) Enter the node to be refreshed.
5) Enter the node to be refreshed.
• Set the number of words in Area 1 to 636, and set the Offset to 0.
• Set the number of words in Area 2 to 0, and set the Offset to 0.
• Click the Add Button. This will add Node 1 to the list. To continue, add Node 2 to the list.
• Set the number of words in Area 1 to 200, and set the Offset to 436.
• Set the number of words in Area 2 to 0, and set the Offset to 0.
• Click the Add Button. This will add Node 2 to the list.
6) Check that in Node 1’s Area 1, the number of words is set to 636 and the Offset is set to 0, andthat in Node 2’s Area 1, the number of words is set to 200 and the Offset is set to 436.
6. Click the Next Button to proceed to the next step.

Appendix BFinsGateway Settings when Connected Using Controller Link
174
7. Proceed to Edit Controller Link Data Link Table (2). Normally, use this screen to set the data linkrefresh order, but here click the Next Button to proceed to the next step.
8. Click the Finish Button. The verification dialog box will be displayed. Click the Start Button.
This completes Node 1’s data link table settings. When you click the Start Button, the data link willstart immediately. Node 2’s settings have not yet been completed, however, so stop the data linkusing the Controller Link Properties Screen.
Setting Node 2’s Data Link Table
1, 2, 3... 1. Select FinsGateway, and then select FinsGateway Settings, and then select Controller LinkProperties.

Appendix BFinsGateway Settings when Connected Using Controller Link
175
2. Click the Data Link Tab. The following dialog box will be displayed.
3. Click the Data Link Table Settings Button.
1)
2)
7)6)
5)
3)
4)
Enter fields (1) to (6) as shown above. The procedure is shown below.
Before making the settings, check that nothing is entered in column (5). If there is an entry in thecolumn, make sure to click the Delete Button and delete everything.
1) Set the Area 1 type to DM. Set the Start Word to 16020.
2) Set the Area 2 type to CIO. Area 2 is not used in monitoring, but make sure that the settings forArea 1 and Area 2 are different.
3) Set the Status Area type to DM. Set the Start Word to 16000.

Appendix BFinsGateway Settings when Connected Using Controller Link
176
4) Set the Node to 2.
5) Enter the node to be refreshed.
6) Enter the node to be refreshed.
• Set the number of words in Area 1 to 636, and set the Offset to 0.
• Set the number of words in Area 2 to 0, and set the Offset to 0.
• Click the Add Button. This will add Node 2 to the list. To continue, add Node 2 to the list.
• Check that the Node in Step (4) is set to 1.
• Set the number of words in Area 1 to 100, and set the Offset to 536.
• Set the number of words in Area 2 to 0, and set the Offset to 0.
• Click the Add Button. This will add Node 1 to the list.
7) Check that in Node 2’s Area 1, the number of words is set to 636 and the Offset is set to 0, andthat in Node 1’s Area 1, the number of words is set to 100 and the Offset is set to 536.
4. Click the Next Button to proceed to the next step.
5. Proceed to Edit Controller Link Data Link Table (2). Normally, use this screen to set the data linkrefresh order, but here click the Next Button to proceed to the next step.
6. Click the Finish Button. The verification dialog box will be displayed. Click the Start Button.
This completes the data link settings. When you click the Start Button, the data link will start.
Note Check that the Controller Link Unit’s indicator shows that the data link is operating. If there is an error, checkfor troubleshooting procedures using the Controller Link Unit Operation Manual.

177
Revision History
A manual revision code appears as a suffix to the catalog number on the front cover of the manual.
Cat. No. W373-E1-04
Revision code
The following table outlines the changes made to the manual during each revision. Page numbers refer to theprevious version.
Revision code Date Revised content
01 May 2000 Original production
02 December 2000 CX-Process Monitor version changed from 1.50 to 2.00. The manual has beenupdated for this version change as summarized in section 1-1-8.
03 September 2001 CX-Process Monitor version changed from 2.00 to 2.50. The manual has beenupdated for this version change as summarized in section 1-1-8.
04 December 2003 CX-Process Monitor version changed from 2.50 to 2.60. The manual has beenupdated for this version change as summarized in section 1-1-8.

OMRON CorporationFA Systems Division H.Q.66 Matsumoto Mishima-city, Shizuoka 411-8511 JapanTel: (81)55-977-9181/Fax: (81)55-977-9045
Regional Headquarters
OMRON EUROPE B.V.Wegalaan 67-69, NL-2132 JD HoofddorpThe NetherlandsTel: (31)2356-81-300/Fax: (31)2356-81-388
OMRON ELECTRONICS LLC1 East Commerce Drive, Schaumburg, IL 60173U.S.A.Tel: (1)847-843-7900/Fax: (1)847-843-8568
OMRON ASIA PACIFIC PTE. LTD.83 Clemenceau Avenue, #11-01, UE Square,Singapore 239920Tel: (65)6835-3011/Fax: (65)6835-2711

Cat. No. W373-E1-04 Note: Specifications subject to change without notice. Printed in Japan
Authorized Distributor:
This manual is printed on 100% recycled paper.

Cat. N
o. W
373-E1-04
CS
Series W
S02-L
CT
C1-E
CX
-Pro
cess Mo
nito
r (Ver. 2.60)
OP
ER
AT
ION
MA
NU
AL