Embed Size (px)
Citation preview
an employee owned company
System Diagnostics from Comprehensive Analysis of Measured Data
A System Diagnostics Framework
Comprehensive Statistical Analysis
System Mechanics
Measured Data
System Diagnostics Problem Identification and Mitigation
Risers: VIV, Jumpers: FIV, Floating systems: as-is response.
Examples on the following pages are a small snapshot of what kinds of useful information can be extracted from measured data. We believe that measured data is telling us something about the system, similar to an ECG informing us about health of a heart. We listen to that information about your floating and subsea systems. Our goal is to diagnose the system before it is too late, so that your drilling and production activities run uninterrupted.
Measured data contains a lot of valuable information about an offshore system, be it a riser, a jumper or anything else. At Stress Engineer-ing Services we go beyond providing a few tables and plots of statistics (RMS, PSD) estimated from the raw measured data, which may be corrupted. We combine decades of our experience about mechanics and behavior of floating and subsea systems with advanced data cleans-ing, signal processing, and statistical analyses to inform you about actual response and health of your system. We can identify damage hotspots and sources of damage, and suggest appropriate mitigation schemes. We can provide performance information you can rely on to maximize asset utilization and production rates.
You have spent a lot of effort and capital on collecting the data. We can help you realize the true value the data can provide.
13800 Westfair East Drive, Houston, Texas 77041-1101Phone: (281) 955-2900 Fax: (281) 955-2638
Website: [email protected] / puneet [email protected]
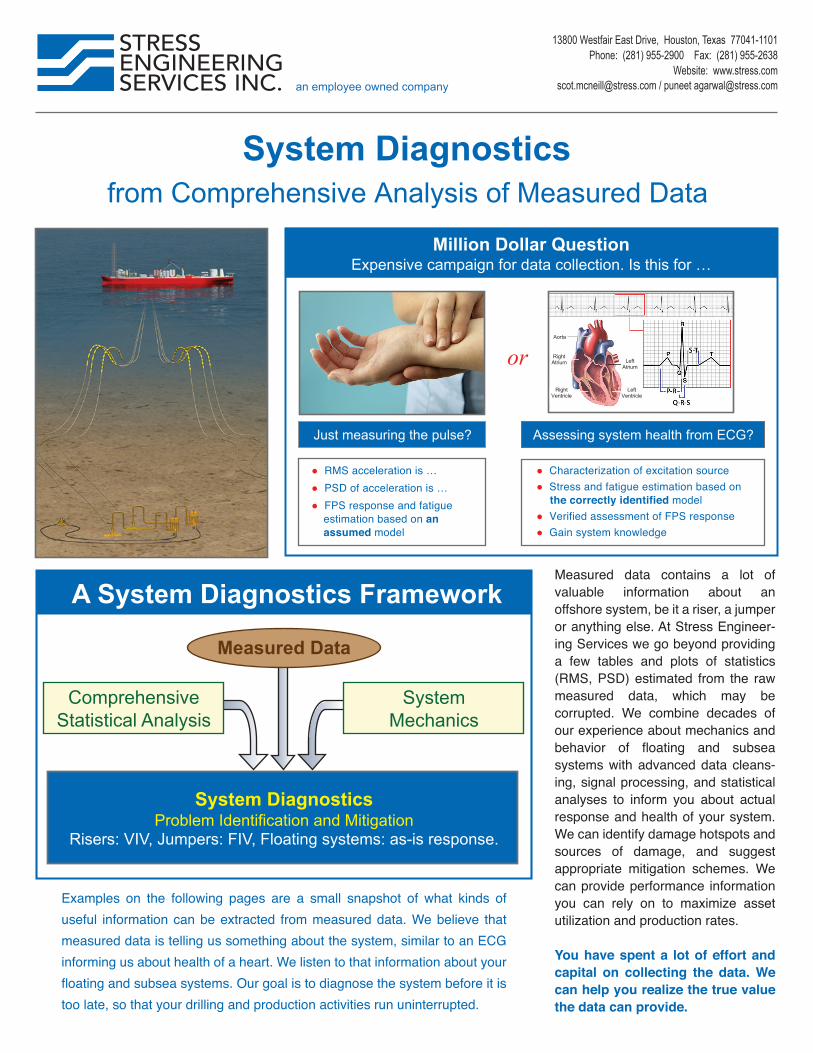
Million Dollar Question Expensive campaign for data collection. Is this for …
Just measuring the pulse? Assessing system health from ECG?
or
● Characterization of excitation source● Stress and fatigue estimation based on
the correctly identified model● Verified assessment of FPS response● Gain system knowledge
● RMS acceleration is …● PSD of acceleration is …● FPS response and fatigue
estimation based on an assumed model
Aorta
RightAtrium Left
Atrium
RightVentricle
LeftVentricle
Application to Risers
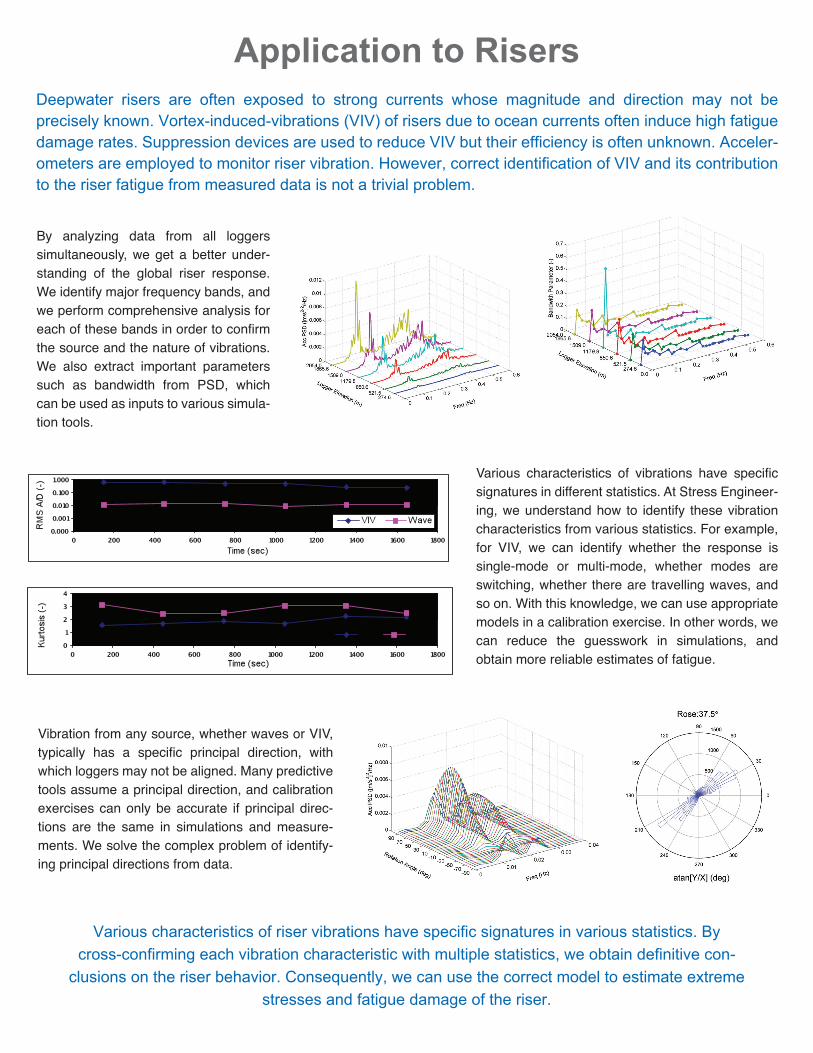
By analyzing data from all loggers simultaneously, we get a better under-standing of the global riser response. We identify major frequency bands, and we perform comprehensive analysis for each of these bands in order to confirm the source and the nature of vibrations. We also extract important parameters such as bandwidth from PSD, which can be used as inputs to various simula-tion tools.
Various characteristics of vibrations have specific signatures in different statistics. At Stress Engineer-ing, we understand how to identify these vibration characteristics from various statistics. For example, for VIV, we can identify whether the response is single-mode or multi-mode, whether modes are switching, whether there are travelling waves, and so on. With this knowledge, we can use appropriate models in a calibration exercise. In other words, we can reduce the guesswork in simulations, and obtain more reliable estimates of fatigue.
Deepwater risers are often exposed to strong currents whose magnitude and direction may not be precisely known. Vortex-induced-vibrations (VIV) of risers due to ocean currents often induce high fatigue damage rates. Suppression devices are used to reduce VIV but their efficiency is often unknown. Acceler-ometers are employed to monitor riser vibration. However, correct identification of VIV and its contribution to the riser fatigue from measured data is not a trivial problem.
Various characteristics of riser vibrations have specific signatures in various statistics. By cross-confirming each vibration characteristic with multiple statistics, we obtain definitive con-
clusions on the riser behavior. Consequently, we can use the correct model to estimate extreme stresses and fatigue damage of the riser.
Vibration from any source, whether waves or VIV, typically has a specific principal direction, with which loggers may not be aligned. Many predictive tools assume a principal direction, and calibration exercises can only be accurate if principal direc-tions are the same in simulations and measure-ments. We solve the complex problem of identify-ing principal directions from data.
Application to Floating SystemsFloating Production Systems (FPS) represent a major financial investment. Structural integrity and perfor-mance in harsh environmental conditions is necessary to ensure optimized production. Many operators have realized the importance of continuously monitoring metocean conditions and the FPS response to support design verification efforts, evaluate future expansion capacity, and extend the service life of the asset. To maximize the impact of the data measurement program requires integrating knowledge of the environment and FPS response with proper data cleansing and analysis techniques.
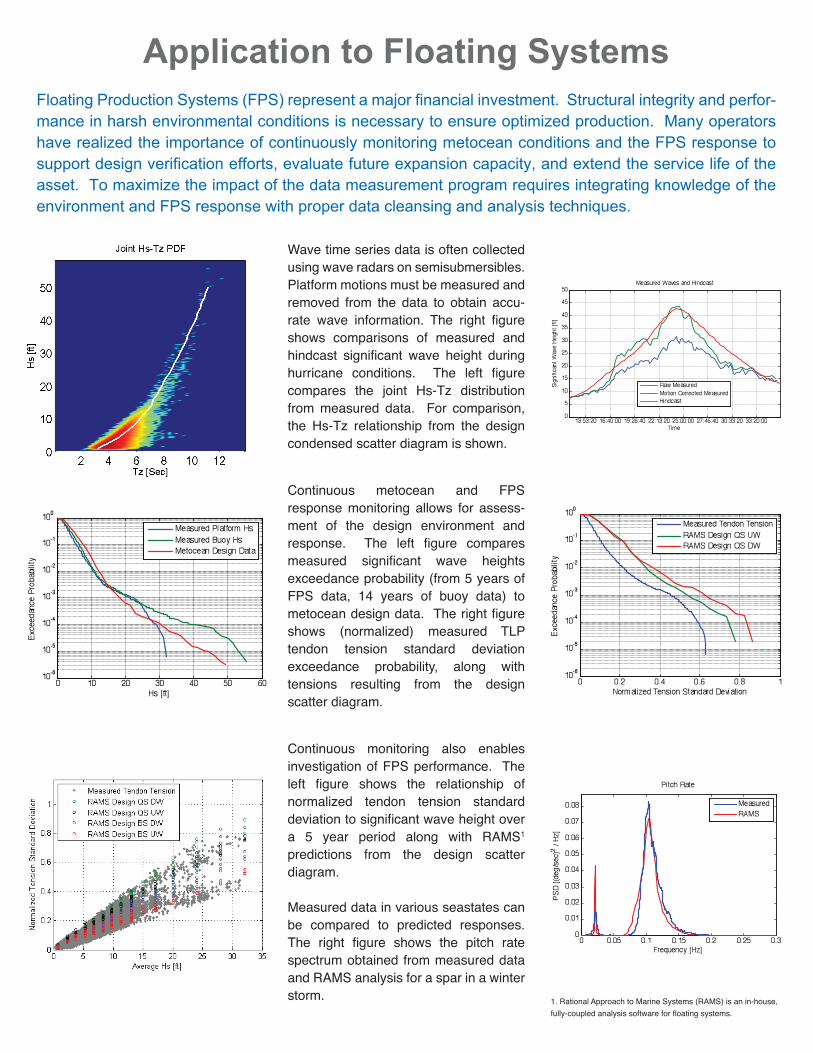
Wave time series data is often collected using wave radars on semisubmersibles. Platform motions must be measured and removed from the data to obtain accu-rate wave information. The right figure shows comparisons of measured and hindcast significant wave height during hurricane conditions. The left figure compares the joint Hs-Tz distribution from measured data. For comparison, the Hs-Tz relationship from the design condensed scatter diagram is shown.
Continuous metocean and FPS response monitoring allows for assess-ment of the design environment and response. The left figure compares measured significant wave heights exceedance probability (from 5 years of FPS data, 14 years of buoy data) to metocean design data. The right figure shows (normalized) measured TLP tendon tension standard deviation exceedance probability, along with tensions resulting from the design scatter diagram.
Continuous monitoring also enables investigation of FPS performance. The left figure shows the relationship of normalized tendon tension standard deviation to significant wave height over a 5 year period along with RAMS1 predictions from the design scatter diagram.
Measured data in various seastates can be compared to predicted responses. The right figure shows the pitch rate spectrum obtained from measured data and RAMS analysis for a spar in a winter storm. 1. Rational Approach to Marine Systems (RAMS) is an in-house,
fully-coupled analysis software for floating systems.
Application to Subsea SystemsFlow Induced Vibration (FIV) of piping systems is generated by flow restrictions such as elbows, tees and partially closed valves. Vibrations can be severe enough to impose restrictions on production rates. Pre-dictive analysis of subsea piping is limited due to lack of empirical data for common geometries and flow conditions. An alternative analysis approach, combining in-field measured data and Finite Element (FE) models can be taken to assess stress and fatigue damage. To obtain accurate results, understanding the nature of random response and applying appropriate data analysis methods are imperative.
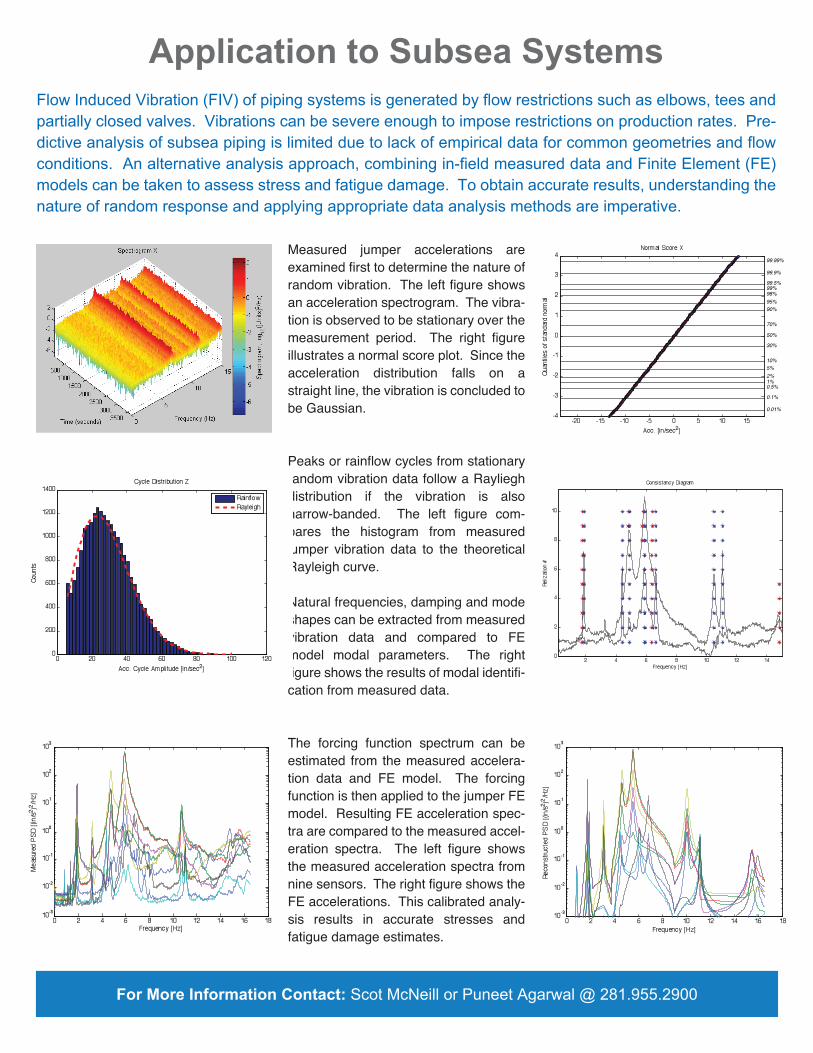
Measured jumper accelerations are examined first to determine the nature of random vibration. The left figure shows an acceleration spectrogram. The vibra-tion is observed to be stationary over the measurement period. The right figure illustrates a normal score plot. Since the acceleration distribution falls on a straight line, the vibration is concluded to be Gaussian.
Peaks or rainflow cycles from stationary random vibration data follow a Rayliegh distribution if the vibration is also narrow-banded. The left figure com-pares the histogram from measured jumper vibration data to the theoretical Rayleigh curve.
Natural frequencies, damping and mode shapes can be extracted from measured vibration data and compared to FE model modal parameters. The right figure shows the results of modal identifi-cation from measured data.
The forcing function spectrum can be estimated from the measured accelera-tion data and FE model. The forcing function is then applied to the jumper FE model. Resulting FE acceleration spec-tra are compared to the measured accel-eration spectra. The left figure shows the measured acceleration spectra from nine sensors. The right figure shows the FE accelerations. This calibrated analy-sis results in accurate stresses and fatigue damage estimates.
For More Information Contact: Scot McNeill or Puneet Agarwal @ 281.955.2900