Embed Size (px)
Citation preview
System Fact Book
2010-2011
Prepared by the
Office of Institutional Research
Dr. Katherine C. Coy, Director
Office of Institutional Research, Missouri State University
901 S. National Avenue, Springfield, MO 65897
Phone: (417) 836-5274, Fax: (417) 836-6486
Email: [email protected]
Web: http://missouristate.edu/oir


Contents
Executive Summary ...................................................................................................................... 1
General Information Highlights ...................................................................................................................................................... 2
System Overview ........................................................................................................................................... 4
University System Organization Chart .......................................................................................................... 5
History and Mission ...................................................................................................................................... 6
Organizational Officers ................................................................................................................................. 8
Missouri State Map with Public Colleges and Universities ........................................................................ 10
Accreditation ............................................................................................................................................... 11
Student Information Highlights .................................................................................................................................................... 12
Fall Headcount Enrollment, 2001-2010 ...................................................................................................... 13
Fall Enrollment by Enrollment Status, 2001-2010, chart ............................................................................ 13
Fall Enrollment by Ethnic Category and Gender, 2006-2010 ..................................................................... 14
Fall Enrollment by Gender, 2001-2010, chart ............................................................................................. 15
Fall Enrollment by Academic Level, chart .................................................................................................. 15
Headcount Enrollment by Class in Fall Semesters, 2006-2010 .................................................................. 16
Legal Residence of Students in Fall Semesters, 2006-2010 ........................................................................ 16
Student Enrollment by County of Residence, Fall 2010, map .................................................................... 17
Student Enrollment by State of Residence, Fall 2010, map ........................................................................ 18
International Student Enrollment, Fall 2010 ............................................................................................... 19
Credit Hour Production by Course Level by Semester, 2006-2007 to 2010-2011 ...................................... 19
Schedule of Resident Student Fees, 2006-2007 to 2010-2011 ................................................................... 20
Basic Fees per Hour for Resident Students, 2006-2007 to 2010-2011, chart .............................................. 20
Student Financial Aid, FY 2006-2010 ......................................................................................................... 21
Financial Aid Granted by Category, FY 2006-2010, chart.......................................................................... 21
Admissions Summary in Fall Semesters, 2006-2010 .................................................................................. 22
First-Time Undergraduate Admissions, 2006-2010, chart .......................................................................... 22
ACT Standard Scores for First-Time Freshmen, 2005-2006 to 2009-2010 ................................................ 23
High School Class Rank of First-Time Freshmen in Fall Semesters, 2006-2010 ....................................... 23
Cumulative GPA by Student Class in Fall Semesters, 2005-2009 .............................................................. 24
Percentage Distribution of Grades in Fall Semesters, 2005-2009 ............................................................... 24
Number of Departmental Majors by College in Fall Semesters, 2009-2010 ............................................... 25
Programs and Degrees Highlights .................................................................................................................................................... 26
Degree Programs Currently Available-Springfield Campus ....................................................................... 28
Academic Degrees and Certificates Currently Offered ............................................................................... 30
Number of Degrees Conferred, FY 2006-2010 ........................................................................................... 31
Degrees Conferred by Gender, FY 2006-2010, chart .................................................................................. 31
Degrees Conferred by Level, FY 2006-2010, chart .................................................................................... 31

Faculty and Staff Highlights .................................................................................................................................................... 32
Full-Time Instructional Faculty, 2006-2007 to 2010-2011 ......................................................................... 34
Average Salary of Nine-Month Instructional Staff, 2006-2007 to 2010-2011 ........................................... 35
Average Salary by Rank and Year, 2006-2007 to 2010-2011, chart ........................................................... 35
Full-Time and Part-Time Employees by Category, 2006-2007 to 2010-2011 ............................................ 36
Full-Time Employees by Job Category, chart ............................................................................................. 36
Highest Degree Held by Faculty and Professional Staff ............................................................................. 37
Degrees of Faculty and Professional Staff, chart ......................................................................................... 37
Financial Resources Highlights .................................................................................................................................................... 38
Revenues, FY 2010, chart............................................................................................................................ 40
Revenues, FY 2006-2010 ............................................................................................................................ 40
Operating Expenses, FY 2010, chart ........................................................................................................... 41
Operating Expenses, FY 2006-2010 ............................................................................................................ 41
Operating Expenses by Category, FY 2010 ................................................................................................ 42
Operating Expenses by Expense Category, FY 2010, chart ........................................................................ 42
Revenues and Expenses Budgeted .............................................................................................................. 43
Office of Sponsored Research and Programs .............................................................................................. 44
Sponsored Projects Activity: Comparison of Awards, FY 2006-2010 ........................................................ 45
Primary Use of Funds Awarded in FY 2010, chart ..................................................................................... 45
Facilities Highlights .................................................................................................................................................... 46
Classification of Students in University Housing by Level, 2006-2010 ..................................................... 48
Classification of Students in University Housing by Housing Unit, Fall 2010 ........................................... 48
Springfield Campus Map ............................................................................................................................. 49
General Characteristics of Major Physical Facilities, Fall 2010 ................................................................. 50
Distribution of Assignable Building Space by Room Use and Program Area, Fall 2010 ........................... 52
Building Space by Program Area, chart ...................................................................................................... 53
Building Space by Room Use, chart ............................................................................................................ 53
University Libraries ..................................................................................................................................... 54
Circulation Statistics, 2005-2006 to 2009-2010 .......................................................................................... 55
Collection at End of Academic Year, 2005-2006 to 2009-2010 ................................................................. 55
Library Expenditures, 2005-2006 to 2009-2010 ......................................................................................... 55
Missouri State University - West Plains Highlights .................................................................................................................................................... 56
General Information .................................................................................................................................... 58
Fall Headcount Enrollment, 2001-2010 ...................................................................................................... 60
Credit Hour Production by Semester, 2006-2007 to Fall 2010 ................................................................... 60
Fall Enrollment by Gender, 2001-2010, chart ............................................................................................. 61
Fall Enrollment by Enrollment Status, 2001-2010, chart ............................................................................ 61
Schedule of Resident Student Fees, 2006-2007 to 2010-2011 .................................................................... 62
Basic Fees per Hour for Resident Students, 2006-2007 to 2010-2011, chart .............................................. 62
Educational and General Funds, Budgeted FY 2011 ................................................................................... 63

Alumni and Development
Highlights .................................................................................................................................................... 64
Alumni by County of Residence, 2010, map ............................................................................................... 66
Alumni by State of Residence, 2010, map .................................................................................................. 67
Missouri State University Foundation ......................................................................................................... 68
Gift Activity, 2007-2008 to 2009-2010 ....................................................................................................... 69
Sources of Outright Gifts, 2007-2008 to 2009-2010 ................................................................................... 69
Purposes of Outright Gifts, 2007-2008 to 2009-2010 ................................................................................. 69
Missouri State University – Mountain Grove
Highlights .................................................................................................................................................... 70
History and General Information ................................................................................................................. 72
The Office of Institutional Research also publishes the Fact Book on its website.
View the Fact Book along with our other publications at:
www.missouristate.edu/oir
We welcome your comments, suggestions, and questions.


Executive Summary 2006-2007 2007-2008 2008-2009 2009-2010 2010-2011
Fall Maximum Registration** 21,319 21,751 22,090 22,949 23,309
Springfield 19,723 19,994 20,256 20,787 21,080
West Plains 1,596 1,757 1,834 2,162 2,229
Fall Headcount Enrollment 20,814 21,105 21,323 22,533 22,701
Undergraduate - Springfield 16,234 16,255 16,273 17,024 17,205
Undergraduate -West Plains 1,596 1,757 1,834 2,162 2,229
Graduate - Springfield 2,984 3,093 3,216 3,347 3,267
Fall Student Credit Hours 240,178 244,420 246,634 258,525 263,408
Undergraduate - Springfield 209,612 210,257 210,633 211,826 214,151
Undergraduate -West Plains 14,769 17,006 18,362 21,428 23,292
Graduate - Springfield 15,797 17,157 17,639 25,271 25,965
Degrees Awarded by Fiscal
Year* 3,614 3,617 3,959 4,204 N/A
Associate 0 0 0 N/A N/A
Bachelor's 2,807 2,795 3,015 3,185 N/A
Master's 777 773 889 978 N/A
Specialist 22 18 26 15 N/A
Doctorate 8 31 29 26 N/A
Instructional Staff Headcount* 716 737 718 721 699
Tenured 457 448 448 433 429
Non-Tenured 259 289 270 288 270
Revenues 250,994,112 264,765,444 296,436,751 300,270,091 N/A
Student Fees 77,624,110 79,399,259 82,710,569 96,686,518 N/A
State Appropriations 79,792,171 85,015,416 98,182,686 90,828,486 N/A
Other Sources 93,577,831 100,350,769 115,243,496 112,755,087 N/A
Expenses 231,394,347 247,175,242 268,476,250 277,094,738 N/A
Instruction and Research 96,985,447 87,575,713 110,355,866 108,836,474 N/A
Other Expenses 134,408,900 159,599,529 158,120,384 168,258,264 N/A
Education & General Space* 1,799,632 1,867,876 1,901,333 1,444,740 1,919,719
Library Circulation* 128,625 122,573 114,196 106,499 N/A
Music 9,132 8,010 8,286 7,205 N/A
Maps 421 529 301 278 N/A
Audio-Visual 11,086 11,091 7,453 6,128 N/A
General Circulation 97,934 92,510 88,226 83,054 N/A
Greenwood 10,052 10,433 9,930 9,834 N/A
Outright Gifts (dollars) 10,960,508 14,050,400 15,044,534 15,512,371 N/A
* Springfield only **Excludes China Campus
1
Executive Summary

General Information
Highlights
On August 28, 2005, the University became known as Missouri State University. This is the
University's fifth name after being founded as the Fourth District Normal School in 1905.
Missouri State University is one of the 13 four-year, public supported institutions of higher education
in Missouri.
In addition to the main campus in Springfield, there is a two-year branch campus in West Plains and
a research campus in Mountain Grove.
The University was given a regional mission by legislative act in 1919. That mission was expanded
in the spring of 1995. The name of the University's governing board was also changed to the Board
of Governors, and its composition reflects the change in mission.
The Springfield and West Plains campuses are separately accredited by the Higher Learning
Commission-North Central Association of Colleges and Secondary Schools.
2
Fact Book 2010-2011

Missouri State University System
3
General Information
Springfield Mountain Grove
West Plains The Extended Campus

System Overview
Missouri State University is a public, comprehensive university system with a statewide mission in public affairs,
composed of three component parts: ethical leadership, cultural competence, and community engagement. The
academic experience is grounded in a general education curriculum which draws heavily from the liberal arts and
sciences. This foundation provides the basis for mastery of disciplinary and professional studies. It also provides
essential forums in which students develop the capacity to make well-informed, independent critical judgments about
the cultures, values, and institutions in society.
The Missouri State University campuses are structured to address the special needs of the urban and rural populations
they serve. Missouri State University-Springfield is a selective admissions, graduate level teaching and research
institution. Missouri State University-West Plains is an open admissions campus serving seven counties in south central
Missouri. Missouri State University-Mountain Grove serves Missouri’s fruit industry through operation of the State
Fruit Experiment Station. The Extended Campus provides anytime, anyplace learning opportunities through telecourses,
Internet-based instruction and through its interactive video network (BearNet). The University also operates various
other special facilities, such as the Darr Agricultural Center in southwest Springfield, the Jordan Valley Innovation
Center in downtown Springfield, the Bull Shoals Field Station near Forsyth, Baker’s Acres and Observatory near
Marshfield, the Missouri State University Graduate Center in Joplin, and a branch campus at Liaoning Normal
University (LNU) in Dalian, China.
4
Fact Book 2010-2011

University System Organization Chart
The system is administered by a System President who reports to the Board of Governors. The Provost heads the
division of Academic Affairs. The Chief Financial Officer heads the division of Financial Services. The divisions of
Administrative and Information Services, Research and Economic Development, Student Affairs, and University
Advancement are each headed by a vice president.
The Vice President for Student Affairs reports to the Provost. Auxiliary services in student affairs – the bookstore,
residence halls, dining services, Taylor Health and Wellness Center, etc. – report to the President through the Vice
President for Student Affairs.
Other administrative positions which report directly to the System President include the Chief of Staff, the General
Counsel, the Chancellor of the West Plains campus, the Director of Intercollegiate Athletics, and the Equal Opportunity
Officer.
5
General Information

History and Mission
University Heritage
Missouri State University was founded in Springfield in 1905 as the Fourth District Normal School. During
its early years, the school's primary purpose was the preparation of teachers for the public school systems in
southwest Missouri. The School's first name change came in 1919, when it became the Southwest Missouri
State Teachers College, reflecting the institution's regional mission. By the mid-1940s, it had expanded
beyond teacher education to include instructional programs in the liberal arts and the sciences; as a
consequence, in 1945, the Missouri Legislature authorized an official name change to Southwest Missouri
State College. In the ensuing decades, with the implementation of more programs at the undergraduate level
and the development of a graduate education program, the College became an educationally diverse
institution. Recognition of its further growth and development resulted in yet another name change in 1972,
to that of Southwest Missouri State University. Finally, on March 17, 2005, the 100th anniversary of
Founders' Day, Governor Matt Blunt signed Senate Bill 98, which included changing Southwest Missouri
State University's name to Missouri State University. Today, Missouri State University is a multipurpose,
metropolitan university providing a broad array of instructional, research, and service programs.
In 1963, a residence center, offering freshman and sophomore level courses, was established in West Plains,
Missouri. Now, as a second campus of the University with its own mission and accreditation, the West Plains
campus offers a two-year general education program, which is fully integrated with programs on the main
campus, as well as other specialty and skills courses.
The State Fruit Experiment Station in Mountain Grove, Missouri, established by a legislative act in 1899, is
the oldest identifiable segment of Missouri State University. Until 1974, it operated as a state agency under a
board of trustees appointed by the Governor. As a result of the Omnibus State Reorganization Act of 1974,
administrative responsibility for the Station was given to the Board of Regents of the University. In 2006, the
Station was integrated into the Department of Agriculture in the College of Natural and Applied Sciences as
a part of a reorganization of the University.
University Setting
The main campus of the University is located in Springfield, the third largest population center in Missouri
with a metropolitan statistical area population of approximately 420,000. Supported by an
industrial/manufacturing base and an expanding service industry in tourism, the community serves as a
regional center for health and medical services for southwest Missouri, northwest Arkansas, southeast
Kansas, and northeast Oklahoma. The second academic campus is located 110 miles southeast of Springfield
in West Plains. This city of 11,000 serves as a regional hub for a seven-county area of south central Missouri
and several adjacent counties in north central Arkansas. The research campus of the University is in
Mountain Grove, a city of 4,900, which is approximately half way between Springfield and West Plains.
The University's primary service region of southwest Missouri has certain distinctive characteristics which
influence various activities and programs of the institution. The southwest region, the fastest growing area in
the state with a population of approximately 900,000, has a unique cultural heritage, a significant agricultural
economic base, and a rapidly expanding tourism and recreational industry.
Educationally, the region is served by a diverse mix of both public and private colleges and universities. As
the largest multipurpose university in southwest Missouri, Missouri State University provides educational
leadership in the region.
6
Fact Book 2010-2011

University System Mission Statement
Missouri State University is a public, comprehensive university system with a mission in public affairs,
whose purpose is to develop educated persons. The University is committed to achieving five major
goals: 1) democratizing society, 2) incubating new ideas, 3) imagining Missouri's future, 4) making
Missouri's future, and 5) modeling ethical and effective behavior as a public institution.
The University's statewide mission in public affairs, requiring a campus-wide commitment to foster
competence and responsibility in the common vocation of citizenship, distinguishes its identity. The
academic experience is grounded in a general education curriculum that draws heavily from the liberal arts
and sciences. This foundation provides the basis for mastery of focused disciplinary and professional
studies, as well as enables critical, independent and intellectual judgment about the culture, values, and
institutions of the larger society.
The task of developing educated persons obligates the University to expand the store of human
understanding through research, scholarship and creative endeavor, and drawing from that store of
understanding, to provide service to the communities that support it. In all of its programs, the University
uses the most effective methods of discovering and imparting knowledge and the appropriate use of
technology in support of these activities.
The University functions through a multi-campus system that is integrated to address the needs of its
constituents.
On June 15, 1995, Senate Bill 340 was signed into law, giving Missouri State University a statewide mission
in public affairs. The focus on public affairs grew out of mission-review discussions with the Missouri
Coordinating Board for Higher Education beginning in 1994. That mission review focused the institution's
efforts in six primary areas: professional (teacher) education, business and economic development, science
and the environment, the human dimension, health care and the performing arts. The public affairs focus is
the integrating theme that cuts across and informs all disciplines in their relation to society.
7
General Information

Organizational Officers
Board of Governors
Missouri State University is under the general control and management of the Board of Governors, which
according to statutes of the state of Missouri, possesses full power and authority to adopt all needful rules
and regulations for the guidance and supervision of the University.
Currently, Missouri State University is governed by a nine-member Board of Governors. All members are
appointed by the Governor, with the advice and consent of the Missouri Senate, to serve six-year terms.
The nine-member Board of Governors shall represent each of Missouri's nine congressional districts. A non-
voting member, a current Missouri State University student, also sits on the Board.
Elizabeth Bradbury
Ninth District
Chair
2008-2011
Gordon Elliott
Seventh District
Vice Chair
2007-2013
Orvin Kimbrough
First District
2009-2015
Michael Duggan
Second District
2005-2011
John L. Winston
Third District
2005-2011
Brian Hammons
Fourth District
2006-2011
Phyllis Washington
Fifth District
2005-2011
Cathy Smith
Sixth District
2006-2013
Mary Sheid
Eighth District
2005-2011
Brandt Shields
Student Member
2010-2011
8
Fact Book 2010-2011

Administrative Council
Dr. James E. Cofer, Sr.
President
Dr. Jim P. Baker
Vice President for Research and Economic Development
Dr. Drew Bennett
Chancellor Missouri State University-West Plains
Dr. Earle F. Doman
Vice President for Student Affairs & Dean of Students
Mr. Brent Dunn
Vice President for University Advancement
Ms. Nila B. Hayes
Chief Financial Officer
Mr. Paul K. Kincaid
Chief of Staff/Assistant to the President for University Relations
Mr. John McAlear
Secretary to the Board of Governors
Mr. Ken McClure
Vice President for Administrative & Information Services
Dr. Belinda McCarthy
Provost
Ms. June McHaney
Director, Internal Audit
Mr. Kyle Moats
Director of Athletics
Dr. Helen Reid
Dean, College of Health and Human Services
Mr. Clif Smart
General Counsel
Dr. Leslie Anderson
Interim Vice President for Diversity & Inclusion
Academic Colleges -- Springfield Campus
College of Arts &
Letters
Dr. Carey H. Adams,
Dean
Art & Design; Communication; English; Media, Journalism & Film; Modern & Classical
Languages; Music; Theatre & Dance
College of Business
Administration
Dr. Philip Harsha,
Interim Dean
School of Accountancy; Computer Information Systems; Fashion & Interior Design; Finance &
General Business; Management; Marketing; Technology & Construction Management
College of Education
Dr. Dennis Kear, Dean
Childhood Education & Family Studies; Counseling, Leadership, & Special Education; Greenwood
Laboratory School; Reading, Foundations, & Technology
College of Health &
Human Services
Dr. Helen Reid, Dean
Biomedical Sciences; Communication Sciences & Disorders; Health, Physical Education &
Recreation; Nursing; Physical Therapy; Physician Assistant Studies; Psychology; School of Social
Work; Sports Medicine & Athletic Training
College of Humanities
& Public Affairs
Dr. Victor H. Matthews,
Dean
Defense & Strategic Studies; Economics; History; Military Science; Philosophy; Political Science;
Religious Studies; Sociology, Anthropology, & Criminology
College of Natural and
Applied Sciences
Dr. Tamera S. Jahnke,
Dean
Biology; Chemistry; Computer Science; Geography, Geology, & Planning; Hospitality &
Restaurant Administration; Mathematics; Physics, Astronomy, & Materials Science
Graduate College
Dr. Frank A. Einhellig,
Dean
Office of the Provost Agriculture
Dr. Belinda McCarthy,
Provost
9
General Information

Missouri State Map with Public Colleges and Universities
Kansas City Area Institutions Two-Year Metropolitan Community College - Blue River
Metropolitan Community College - Longview
Metropolitan Community College - Maple Woods
Metropolitan Community College - Penn Valley
Four-Year University of Missouri - Kansas City
St. Louis Area Institutions Two-Year St. Louis Community College - Florissant Valley
St. Louis Community College - Forest Park
St. Louis Community College - Meramec
Four-Year Harris-Stowe State University
University of Missouri - St. Louis
10
Fact Book 2010-2011

Accreditation
The Springfield and West Plains campuses are separately accredited by the Higher Learning Commission -
North Central Association of Colleges and Secondary Schools. The University is professionally accredited or
approved by the following organizations:
AACSB International Council on Social Work Education
Accreditation Commission for Programs in
Hospitality Administration
National Association of Industrial Technology
Accreditation Review Commission for
Programs in Hospitality Administration
National Association of Schools of Music
American Chemical Society National Association of Schools of Public
Affairs and Administration
American Council for Construction Education National Association of Schools of Theatre
Commission on Accreditation – Dietetics
Education
National Council for Accreditation of Teacher
Education
Commission on Accreditation of Allied Health
Education Programs
National Council on Education of the Deaf
Commission on Accreditation - Physical
Therapy Education
National League for Nursing
Commission on Accreditation of Athletic
Training Education
Commission on Collegiate Nursing Education
Computing Accreditation Commission of ABET
National Recreation and Parks Association
Council on Accreditation
The Planning Accreditation Board
Council on Academic Accreditation –
Audiology & Speech-Language Pathology
Council on Accreditation of Nurse Anesthesia
Educational Programs
11
General Information

Student Information
Highlights
The headcount enrollment on the Springfield campus for fall 2010 was 20,472.
The fall 2010 enrollment included 1,896 minority students and 1,136 non-resident aliens.
Representing increases in both categories over fall 2009.
Most of Missouri's counties (114 out of 115) were represented in the student body of the Springfield
campus with 28 counties contributing 100 or more students.
In addition to Missouri, 49 states and 76 countries were represented in the fall enrollment.
More than $155 million in financial aid was awarded to Missouri State students at the Springfield
campus in fiscal year 2010, of which approximately 41 percent was based on need.
In the fall of 2010, more than 240,000 credit hours were generated by Missouri State students on the
Springfield campus.
12
Fact Book 2010-2011

Fall Headcount Enrollment, 2001-2010
2001 2002 2003 2004 2005 2006 2007 2008 2009 2010
Undergraduate
Full-Time Male 5,520 5,514 5,553 5,572 5,604 5,600 5,662 5,766 5,929 5,910
Full-Time Female 6,570 6,798 6,896 7,191 7,026 7,186 7,098 7,034 7,390 7,539
Part-Time Male 1,382 1,385 1,418 1,484 1,487 1,486 1,516 1,493 1,618 1,727
Part-Time Female 1,675 1,751 1,904 2,022 2,040 1,962 1,979 1,980 2,087 2,029
Total Undergraduate 15,147 15,448 15,771 16,269 16,157 16,234 16,255 16,273 17,024 17,205
Graduate
Full-Time Male 369 395 444 466 459 476 569 636 675 774
Full-Time Female 547 569 610 629 669 719 812 755 885 908
Part-Time Male 711 700 664 622 598 684 644 688 712 573
Part-Time Female 1,478 1,606 1,441 1,128 1,045 1,105 1,068 1,137 1,075 1,012
Total Graduate 3,105 3,270 3,159 2,845 2,771 2,984 3,093 3,216 3,347 3,267
Total, All Students 18,252 18,718 18,930 19,114 18,928 19,218 19,348 19,489 20,371 20,472
Note: includes off-campus
Source – ODSPROD-Student Enrollment Cube-Point in Time
Fall Enrollment – Springfield Campus
13
Student Information

Fall Enrollment by Ethnic Category and Gender, 2006-2010
2006 2007 2008 2009 2010
M F M F M F M F M F
Undergraduate
White or Caucasian 6,158 8,068 6,169 7,949 6,230 7,801 6,275 7,842 6,310 7,912
Black or African American 185 212 212 229 229 262 245 317 250 314
Hispanic or Latino 134 136 154 138 153 160 168 204 190 239
Asian 106 142 119 146 124 137 127 150 120 125
American Indian or Alaskan
Native 63 82 63 78 63 85 56 84 65 71
Native Hawaiian or Other
Pacific Islander* 0 0 0 0 0 0 0 0 13 18
More than on race* 0 0 0 0 0 0 0 0 101 164
Non-Resident Alien 106 141 132 164 136 210 209 304 255 397
Race/Ethnicity Unknown 334 367 329 373 324 359 467 576 333 328
Total Undergraduate 7,086 9,148 7,178 9,077 7,259 9,014 7,547 9,477 7,637 9,568
Graduate
White or Caucasian 894 1,536 883 1,526 964 1,539 1,029 1,571 917 1,479
Black or African American 23 35 20 39 23 26 28 25 23 21
Hispanic or Latino 11 20 5 31 17 30 17 29 25 37
Asian 9 15 11 22 22 26 17 36 21 37
American Indian or Alaskan
Native 8 16 5 13 6 4 4 7 9 14
Native Hawaiian or Other
Pacific Islander* 0 0 0 0 0 0 0 0 3 2
More than one race* 0 0 0 0 0 0 0 0 11 23
Non-Resident Alien 150 113 209 145 227 161 216 180 270 214
Race/Ethnicity Unknown 65 89 80 104 65 106 76 112 68 93
Total Graduate 1,160 1,824 1,213 1,880 1,324 1,892 1,387 1,960 1,347 1,920
Total, All Students 8,246 10,972 8,391 10,957 8,583 10,906 8,934 11,437 8,984 11,488
Note: In order to standardize race/ethnicity reporting with federal requirements additional categories were added in Fall 2009.
These new categories are Native Hawaiian or Other Pacific Islander, and More than one race. Prior to Fall 2009 only one primary
race/ethnicity was reported, and Native Hawaiian or Other Pacific Islander was included in the ‘Asian’ category.
Source: ODSPROD-Student Enrollment Cube-Point in Time
14
Fact Book 2010-2011

Fall Enrollment by Gender
Fall Enrollment by Academic Level
15
Student Information

Headcount Enrollment by Class in Fall Semesters, 2006-2010
2006 2007 2008 2009 2010
Undergraduate
Entering Freshman 2,775 2,649 2,568 2,655 2,676
Other Freshman 696 640 647 747 809
Sophomores 3,050 3,082 2,950 2,922 2,937
Juniors 3,408 3,416 3,487 3,560 3,621
Seniors 4,586 4,704 4,841 5,090 5,168
Unclassified 1,719 1,764 1,780 2,050 1,994
Total Undergraduate 16,234 16,255 16,273 17,024 17,205
Graduate
Degree Seeking 2,510 2,710 2,837 2,782 2,741
Undecided 474 383 379 565 526
Total Graduate 2,984 3,093 3,216 3,347 3,267
Total, All Students 19,218 19,348 19,489 20,371 20,472
Source – OSPROD-Student Enrollment Cube-Point in Time
Legal Residence of Students in Fall Semesters
(% of total), 2006-2010
2006 2007 2008 2009 2010
Greene County 24.7 25.0 24.2 22.3 21.8
Other Southwest District Counties 25.4 24.4 24.3 25.7 25.3
Kansas City Area 6.1 5.9 5.6 5.4 5.4
St. Louis Area 15.9 15.6 15.8 15.7 15.9
Other Missouri Counties 18.9 18.4 18.1 18.2 17.6
Missouri Total 91.0 89.3 88.0 87.3 86
Other States Total 5.9 6.4 6.8 8.1 8.2
Other Countries Total 3.1 4.3 5.2 4.6 5.8
Source – ODSPROD - Student Enrollment Cube - Point in Time
16
Fact Book 2010-2011

Student Enrollment by County of Residence - Fall 2010
Students from 114 of Missouri's 115 counties attended the Springfield campus of Missouri State University in the fall
semester, 2010. Counties contributing 100 or more students include: Barry 181 Howell 308 Pulaski 194
Boone 149 Jackson 744 St. Charles 969
Camden 136 Jasper 438 St. Louis 2121
Cass 204 Jefferson 296 St. Louis City 172
Christian 1104 Laclede 212 Stone 266
Clay 359 Lawrence 324 Taney 465
Cole 192 Newton 197 Webster 353
Dallas 152 Phelps 137 Wright 146
Franklin 204 Platte 169
Greene 4454 Polk 363
Source - ODSPROD-Student Enrollment Cube-Point in Time
17
Student Information

Student Enrollment by State of Residence - Fall 2010
The Missouri State University student body represented 49 states, all except Wyoming.
Sixteen states (Arkansas, California, Colorado, Florida, Illinois, Indiana, Iowa, Kansas, Minnesota, Missouri, Nebraska,
Ohio, Oklahoma, Texas, Virginia, and Wisconsin) contributed 25 or more students in the fall 2010 semester.
Source - ODSPROD-IPEDS Fall Enrollment, effective Fall 2010
18
Fact Book 2010-2011

International Student Enrollment, Fall 2010
In the fall of 2010, 1,136 international students from 76 countries attended Missouri State University.
These students came from all parts of the world and included:
992 from Asia
50 from Europe
30 from North America, South America, and Central America
51 from Africa
6 from Australia
China had the largest representation with 672 students.
Source - ODSPROD-Student Enrollment Cube-Point in Time
Credit Hour Production by Course Level by Semester –
Springfield Campus
Acad. Year Semester Undergraduate Graduate Total by Semester
2006-2007 Fall 209,612 15,797 225,409
Spring 190,442 15,899 206,341
Summer 25,321 7,095 32,416
Total by Level 425,375 38,791 464,166
2007-2008 Fall 210,257 17,157 227,414
Spring 190,209 17,202 207,411
Summer 23,137 7,528 30,665
Total by Level 423,603 41,887 465,490
2008-2009 Fall 210,633 17,639 228,272
Spring 189,697 16,930 206,627
Summer 20,922 7,469 28,391
Total by Level 421,252 42,038 463,290
2009-2010 Fall 211,826 25,271 237,097
Spring 188,305 25,456 213,761
Summer 21,418 10,239 31,657
Total by Level 421,549 60,966 482,515
2010-2011 Fall 214,151 25,965 240,116
Spring N/A N/A N/A
Summer N/A N/A N/A
Total by Level 214,151 25,965 240,116
Source - IPD 0900 through Summer 2009, ODSPROD - Student Enrollment - Point in Time (course),
effective Fall 2009.
19
Student Information

Schedule of Resident Student Fees (in dollars) - Springfield Campus
2006-2007 2007-2008 2008-2009 2009-2010 2010-2011
Basic Fees
Undergraduate Per Hour Fee 173 179 186 186 186
Masters/Specialist Per Hour Fee 199 206 214 214 224
Doctoral Per Hour Fee 199 206 214 214 224
Doctoral Per Hour Fee (University of
Missouri) 276 287 299 299 305
Student Service Fees
Enrollment in 1-6 Hours 84-214 92-240 100-262 106-271 106-271
Enrollment in over 6 Hours 274 309 338 348 348
Source - MSU 2010-2011 Required Student Fees, Office of the Registrar
Basic Fees Per Hour (in dollars) for Resident Students –
Springfield Campus
20
Fact Book 2010-2011

Student Financial Aid (in dollars) - Springfield Campus
Fiscal
Year
Grants
and
Scholarships Loans
Work
Study
Student
Employment Total
Percentage
of Total
Based on Need
Amounts Granted
2006 39,962,217 74,662,272 555,532 7,383,432 122,563,453 45.2
2007 35,802,443 89,736,152 568,490 8,539,316 134,646,401 37.8
2008 38,319,503 90,525,755 570,717 8,556,976 137,972,951 42.5
2009 55,224,890 87,065,682 522,550 9,068,684 151,881,806 41.2
2010 61,548,772 84,593,053 634,687 9,189,980 155,966,492 41.4
Students Served
2006 15,743 16,945 329 2,263 35,280 44.4
2007 11,097 21,799 345 2,490 35,731 43.1
2008 13,154 23,447 372 2,119 39,092 52.1
2009 18,564 18,153 307 2,197 39,221 48.6
2010 21,350 19,144 365 1,448 42,307 48.8
Source -- DHE 14
Financial Aid Granted by Category (in dollars) –
Springfield Campus
21
Student Information
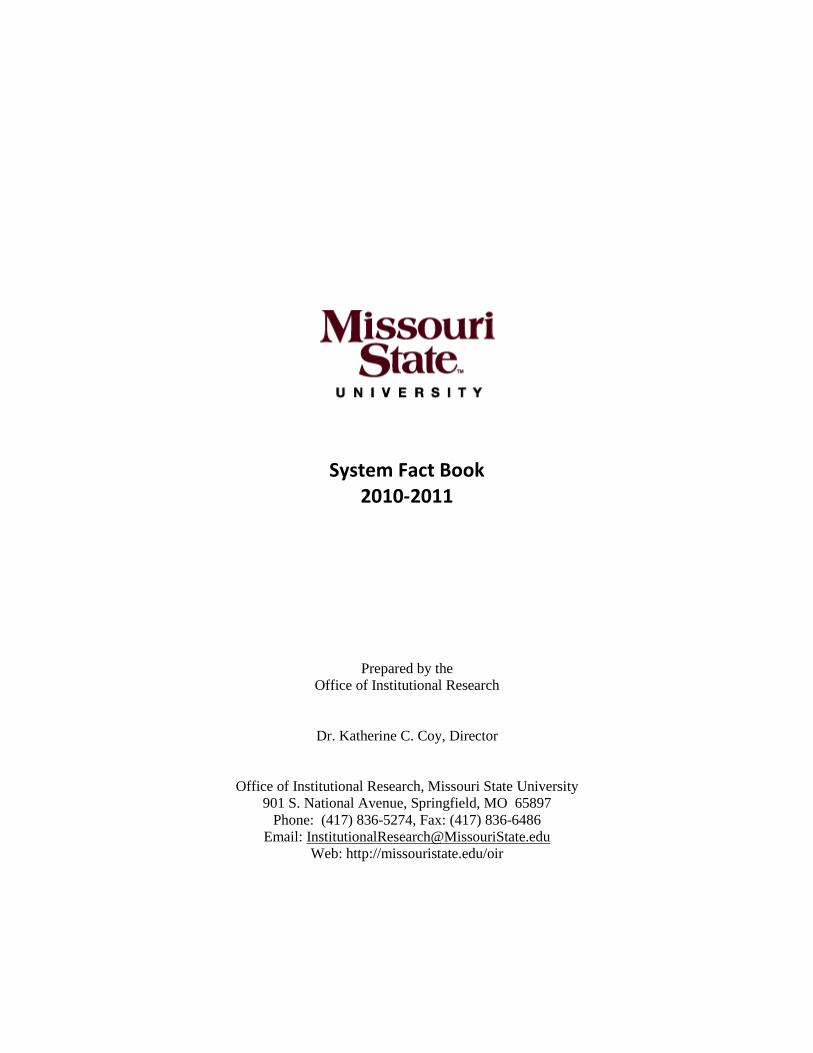
Admissions Summary in Fall Semesters - Springfield Campus
Number of
Applicants
Number of
Applicants
Accepted
Percent of
Applicants
Accepted
Number of
Actual
Enrollments
Percent of Accepted
Applicants Enrolled
First-Time Undergraduate
2006 7,291 5,613 77.0 2,775 49.4
2007 7,752 5,796 74.8 2,649 45.7
2008 7,538 5,582 74.1 2,568 46.0
2009 7,079 5,875 83.0 2,655 45.2
2010 7,664 5,927 77.3 2,676 45.1
Transfer Undergraduate
2006 2,040 1,660 81.4 1,130 68.1
2007 2,170 1,754 80.8 1,152 65.7
2008 2,234 1,849 82.8 1,199 64.8
2009 2,101 1,818 86.5 1,431 78.7
2010 2,646 2,221 84.0 1,605 72.3
Graduate
2006 1,265 877 69.3 537 61.2
2007 1,537 995 64.7 625 62.8
2008 1,295 837 64.6 610 72.9
2009 1,106 851 86.0 673 70.8
2010 1,093 861 78.8 626 72.7
Note: In an effort to maintain consistency with the standards set by governmental agencies for reporting admissions data,
incomplete applications will be removed from applicant counts for Fall 2009 and future semesters (Data for Fall 2005-2008
includes incomplete applications in applicant counts). A significant increase is noted in % Accepted in 2009 due to this
change in reporting methodology. Graduate admissions data includes only first-time degree-seeking graduate students. In
Fall 2010 the graduate admissions reporting methodology changed to exclude withdrawn students from accepted applicant
counts.
Source -- MDHE 07-2 (transfers), IPEDS EF1, and the Graduate College
First-Time Undergraduate Admissions - Springfield Campus
22
Fact Book 2010-2011

ACT Standard Scores for First-Time Freshmen –
Springfield Campus
2005-06
N = 2437
2006-07
N = 2640
2007-08
N = 2430
2008-09
N = 2452
2009-10
N = 2548
English
Missouri State Enrolled Norm 23.9 23.9 23.9 24.1 24.0
State Norm 21.4 21.5 21.5 21.4 21.5
National Enrolled Norm 21.6 21.7 21.8 21.8 N/A
Mathematics
Missouri State Enrolled Norm 22.6 22.5 22.6 22.9 22.5
State Norm 20.9 21.0 21.0 21.0 20.9
National Enrolled Norm 21.6 21.7 21.8 21.9 N/A
Reading
Missouri State Enrolled Norm 24.0 24.2 24.3 24.5 24.2
State Norm 21.9 22.0 22.1 22.0 22.1
National Enrolled Norm 22.3 22.4 22.5 22.5 N/A
Science Reasoning
Missouri State Enrolled Norm 23.0 22.8 23.0 23.1 23.0
State Norm 21.5 21.5 21.5 21.4 21.5
National Enrolled Norm 21.7 21.7 21.8 21.7 N/A
Composite
Missouri State Enrolled Norm 23.5 23.5 23.6 23.8 23.6
State Norm 21.6 21.6 21.6 21.6 21.6
National Enrolled Norm 21.9 22.0 22.1 22.1 N/A
Source -- ACT Class Profile (MSU - Enrolled) and ACT web site (National & State Norms)
High School Class Rank of First-Time Freshmen in Fall Semesters -
Springfield Campus
2006 2007 2008 2009 2010
Highest 20% 36.1% 36.9% 37.0% 36.5% 40.4%
Fourth 20% 27.9% 27.8% 24.6% 24.8% 24.4%
Third 20% 16.9% 16.4% 17.9% 16.1% 16.2%
Second 20% 7.7% 6.6% 7.2% 7.4% 6.4%
Lowest 20% 1.7% 1.3% 1.7% 1.8% 1.2%
Not Ranked 9.7% 11.0% 11.6% 13.4% 11.3%
Source - ODSPROD - First Time Student Quality Indicators
23
Student Information

Cumulative GPA by Student Class in Fall Semesters
Freshmen Sophomores Juniors Seniors Special Undergraduates Graduates
2005 2.73 2.89 2.93 3.08 3.12 3.01 3.72
2006 2.72 2.89 2.97 3.08 3.35 3.02 3.71
2007 2.74 2.93 2.98 3.08 3.50 3.02 3.71
2008 2.64 2.92 2.98 3.09 3.50 3.03 3.71
2009 2.87 2.98 3.03 3.12 3.43 3.06 3.68
Source - ODSPROD - GPA by College and Department
Note: Special = UG Non-Degree & Precollege
Percentage Distribution of Grades in Fall Semesters
2005 2006 2007 2008 2009
Excellent A 39.4% 40.1% 41.1% 40.1% 41.7%
Superior B 27.3% 26.9% 26.6% 27.0% 28.3%
Satisfactory C 14.2% 13.9% 13.5% 13.9% 14.3%
Minimum Passing D 4.4% 4.3% 4.2% 4.4% 4.5%
Unsatisfactory F 3.8% 3.5% 3.3% 3.4% 3.7%
Incomplete I 2.2% 3.4% 3.6% 3.6% 2.1%
Drop N 8.4% 7.6% 7.4% 7.3% 5.1%
Audit V 0.1% 0.1% 0.1% 0.1% 0.1%
Deferred Grade Z 0.2% 0.2% 0.2% 0.2% 0.2%
Source – GRA 2500 until 2008, ODSPROD Course/Section Grade Distributions FA 2009 & After (OLAP)
24
Fact Book 2010-2011

Number of Departmental Majors by College in Fall Semesters, Springfield Campus
2009 2010
College of Arts and Letters
Art & Design 548 560
Communication 323 327
English 534 563
Media, Journalism, & Film 440 449
Modern & Classical Languages 122 111
Music 326 298
Theatre & Dance 221 214
Total 2,514 2,522
College of Business Administration
Computer Information Systems 397 408
Fashion & Interior Design - 336
Finance & General Business 845 706
Industrial Management 384 360
M.B.A. 558 577
Management 902 908
Marketing 663 603
School of Accountancy 734 789
Total 4,483 4,687
College of Education
Childhood Education & Family Studies 1,139 1,099
Counseling, Leadership, & Special Ed 551 543
Education/Teacher Certification 91 136
Reading, Foundations, & Technology 325 320
Total 2,106 2,098
College of Health and Human Services
Biomedical Sciences 512 499
Communication Sci. & Disorders 269 288
Health, Physical Educ. & Recr. 712 731
Nursing 452 558
Physical Therapy 68 79
Physician Assistant Studies 49 54
Psychology 656 705
Public Health 53 29
School of Social Work 219 233
Sports Med. & Athletic Training 104 152
Total 3,094 3,328
2009 2010
College of Humanities and Public
Affairs
Defense & Strategic Studies 60 73
Economics 55 52
History 365 381
Philosophy 37 38
Political Science 254 248
Religious Studies 90 86
Sociology, Anthrop., & Criminology 589 611
Total 1,450 1,489
College of Natural and Applied Sciences
Agriculture 397 412
Biology 660 653
Chemistry 175 205
Computer Science 149 152
Fashion & Interior Design 340 -
Geography, Geology, & Planning 201 234
Hospitality & Restaurant Administration 213 208
Natural & App. Sci/Sci & Engineering 99 139
Mathematics 160 175
Physics, Astronomy, & Materials Sci. 83 101
Total 2,477 2,279
Graduate College
Total 77 75
Miscellaneous
Certificate Enrollments 33 26
Non-Degreed & Unclassified Grad. 437 340
Undeclared Undergraduates 3,641 3,572
Total 4,111 3,938
University College
Global Studies 51 55
Interdisciplinary Studies 8 1
Total 59 56
MSU - Springfield Campus
Total of All Students 20,371 20,472
Note: All Certificate Only Enrollments were Reported Separately under Miscellaneous
Source – Student Campus-wide Census (ODSPROD-Student Enrollment-Point in Time-Census)
25
Student Information

Programs and Degrees
Highlights
The University offers baccalaureate degrees in 93 disciplines and master's degrees in 44 disciplines.
An Educational Specialist degree is offered in Educational Administration.
Doctorates are offered in Audiology and Physical Therapy.
The University provides pre-professional programs for students planning to enter fields such as
dentistry, engineering, journalism, law, medicine, and theology.
In fiscal year 2010, 4,204 degrees were conferred.
The University offers undergraduate and graduate certificates to recognize students who complete a
core of prescribed courses designed to significantly increase competency in a stated discipline area.
26
Fact Book 2010-2011

27
Programs and Degrees

Degree
Programs
Currently
Available –
Springfield
Campus
Program Name Degree
Accounting BS, MAcc
Administrative Studies MS
Agricultural Business BS
Agriculture Education BSEd
Agronomy BS
Animal Science BS
Anthropology BA, BS
Antiquities BA
Applied Anthropology MS
Art BFA
Art and Design BA, BSEd
Art History BA
Athletic Training BS
Audiology AuD
Biology BA, BS, MS
Biology Education BSEd
Business Administration MBA
Business Education BSEd
Cell and Molecular Biology BS, MS
Chemistry BS, MS
Chemistry Education BSEd
Child and Family Development BS
Clinical Laboratory Sciences - Medical Technology BS
Communication BA, BS, MA
Communication Sciences and Disorders BS, MS
Computer Information Systems BS, MS
Computer Science BS
Construction Management BS
Counseling MS
Criminology BA, BS, MS
Dance BFA
Defense and Strategic Studies MS
Design BFA
Dietetics BS
Early Childhood and Family Development MS
Early Childhood Education BSEd
Earth Science Education BSEd
Economics BA, BS
Educational Administration MSEd, EdS
Electronic Arts BS
Elementary Education BSEd, MSEd
Engineering Physics BS
English BA, BSEd, MA
Entertainment Management BS
Entrepreneurship BS
Exercise and Movement Science BS
Facility Management BS
Family and Consumer Sciences BSEd
Fashion Merchandising and Design BS
Finance BS
French BA, BS, BSEd
General Agriculture BAS, BS
General Business BS
Geography BA, BS
Geology BS
Geospatial Sciences BS
Geospatial Sciences in Geography & Geology MS
German BA, BS, BSEd
Gerontology BS
Global Studies BA, MGS
Health Administration MHA
28
Fact Book 2010-2011

Degree
Programs
Currently
Available –
Springfield
Campus
Program Name Degree Health Promotion and Wellness Management MS
History BA, BSEd, MA
Horticulture BS
Hospitality and Restaurant Administration BS
Housing and Interior Design BS
Information Technology Service Management BS
Instructional Media Technology MSEd
Journalism BS
Latin BA, BSEd
Linguistics BA
Logistics and Supply Chain Management BS
Management BS
Marketing BS
Mass Media BA, BS
Materials Science MS
Mathematics BA, BS, BSEd, MS
Middle School Education BSEd
Music BA, BM, BME, MM
Musical Theatre BFA
Natural and Applied Science MNAS
Nurse Anesthesia MS
Nursing BSN, MSN
Philosophy BA, BS
Physical Education BSEd
Physical Therapy DPT
Physician Assistant Studies MS
Physics BS
Physics Education BSEd
Planning BS
Plant Science MS
Political Science BA, BS
Professional Writing BA, BS
Project Management MS
Psychology BA, BS, MS
Public Administration MPA
Public Health MPH
Public Relations BS
Radiography BS
Reading MSEd
Recreation, Sports, and Park Administration BS
Religious Studies BA, BS, MA
Respiratory Therapy BS
Risk Management and Insurance BS
Secondary Education MSEd
Social Work BSW, MSW
Socio-Political Communication BS
Sociology BA, BS
Spanish BA, BS, BSEd
Special Education MSEd
Special Education/Cross Categorical BSEd
Speech and Theatre Education BSEd
Student Affairs MS
Teaching MAT
Technology Education BSEd
Technology Management BAS, BS
Theatre BFA, MA
Theatre Studies BA
Wildlife Conservation and Management BS
Writing MA
29
Programs and Degrees
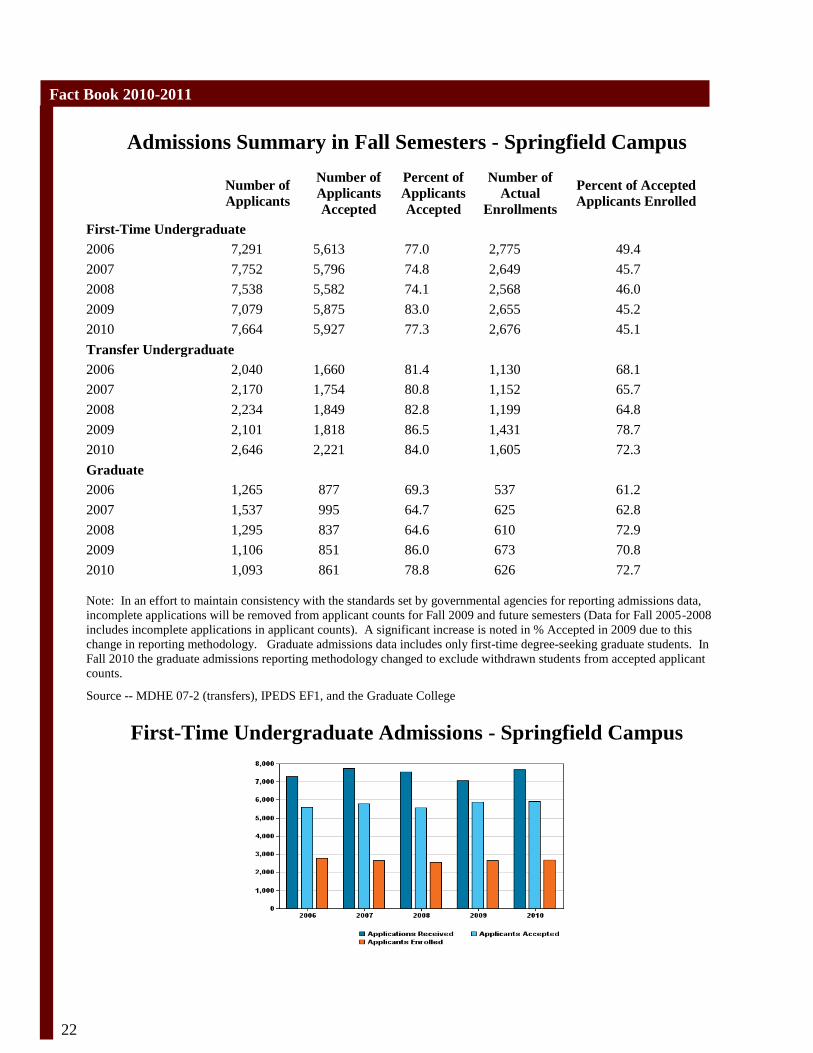
Academic Degrees and Certificates Currently Offered
Abbreviation Degree Name of Certificate Description
BA Bachelor of Arts
BAS Bachelor of Applied Science
BFA Bachelor of Fine Arts
BM Bachelor of Music
BME Bachelor of Music Education
BS Bachelor of Science
BSEd Bachelor of Science in Education
BSN Bachelor of Science in Nursing
BSW Bachelor of Social Work
MA Master of Arts
MAcc Master of Accountancy
MGS Master of Global Studies
MAT Master of Arts in Teaching
MBA Master of Business Administration
MHA Master of Health Administration
MM Master of Music
MNAS Master of Natural and Applied Science
MPA Master of Public Administration
MPH Master of Public Health
MSEd Master of Science in Education
MS Master of Science
MSN Master of Science in Nursing
MSW Master of Social Work
AuD Doctor of Audiology
DPT Doctor of Physical Therapy
EdS Specialist in Education
Cert.-PB Post-Baccalaureate Certificate
Cert.-PM Post-Master's Certificate
Cert.-UG Undergraduate, Less Than One Year
Certificate
30
Fact Book 2010-2011

Number of Degrees Conferred – Springfield Campus
Fiscal
Year By Level By Gender
Total
Degrees
Associate Bachelor's Master's Specialist Doctorate Male Female
2006 0 2,685 745 24 3 1,409 2,048 3,457
2007 0 2,807 777 22 8 1,441 2,173 3,614
2008 0 2,795 773 18 31 1,491 2,126 3,617
2009 0 3,015 889 26 29 1,640 2,319 3,959
2010 0 3,185 978 15 26 1,821 2,383 4,204
Sources – IPED-C1 through FY2009; ODSPROD Degrees Granted FA09 Forward (OLAP), and
ODSPROD First & Second Degrees Granted Before FA09 (OLAP)
Degrees Conferred by Gender
Degrees Conferred by Level
31
Programs and Degrees
Faculty and Staff
Highlights
The Springfield campus had 699 full-time instructional faculty in fall 2010, of which 46 percent
were female and 61 percent were tenured.
The average salary of all nine-month instructional staff for 2010-2011 was $59,675.
The University had 2,039 full-time employees and another 1,234 employees working part-time in
2010-2011.
32
Fact Book 2010-2011
33
Faculty and Staff

Full-Time Instructional Faculty 2006-2007 2007-2008 2008-2009 2009-2010 2010-2011
N
%
Tenured N
%
Tenured N
%
Tenured N
%
Tenured N
%
Tenured
Professor
Men 202 100 199 100 196 99 186 99 181 98
Women 67 100 73 100 70 100 70 100 69 100
Total 269 100 272 100 266 100 256 100 250 99
Associate Professor
Men 88 97 87 95 89 97 91 97 96 95
Women 66 88 64 92 65 67 67 91 69 93
Total 154 93 151 94 154 97 158 94 165 94
Assistant Professor
Men 82 21 75 19 88 17 70 16 64 14
Women 65 26 61 28 71 21 78 22 84 17
Total 147 23 136 23 159 19 148 19 148 16
Instructor
Men 2 - 42 - 40 - 36 - 37 -
Women 18 44 96 4 95 4 106 4 97 3
Total 20 40 138 3 135 3 142 3 134 2
Lecturer
Men 35 - - - - - - - - -
Women 72 - 1 - - - - - - -
Total 107 - 1 - - - - - - -
Other
Men 17 18 10 - 3 - 5 - 1 -
Women 2 - 10 - 20 - 12 - 1 -
Total 19 16 20 - 23 - 17 - 2 -
All Ranks Combined
Men 426 72 413 72 416 71 388 73 379 74
Women 290 52 305 50 321 48 333 46 320 47
Total 716 64 718 63 737 61 721 60 699 61
Source -- IPEDS Staff Survey
34
Fact Book 2010-2011

Average Salary of Nine-Month Instructional Staff
Rank 2006-07 2007-08 2008-09 2009-10 2010-11
Distinguished
Professor 76,506 77,607 83,548 81,850 78,617
Professor 67,563 71,736 75,863 75,000 75,420
Associate Professor 56,544 57,832 59,967 58,610 60,176
Assistant Professor 49,730 54,262 55,989 56,079 55,193
Instructor 41,240 34,504 36,206 37,193 36,790
Lecturer 32,291 31,595 N/A N/A N/A
All Ranks Combined 54,867 57,673 60,192 59,334 59,675
Source - IPEDS Staff Survey
Average Salary by Rank and Year
0
10,000
20,000
30,000
40,000
50,000
60,000
70,000
80,000
2006-07 2007-08 2008-09 2009-10 2010-11
Professor Associate Professor Assistant Professor Instructor
35
Faculty and Staff

Full-Time and Part-Time Employees by
Equal Employment Opportunity (EEO) Category
2006-2007 2007-2008 2008-2009 2009-2010 2010-2011
Full-
Time
Part-
Time
Full-
Time
Part-
Time
Full-
Time
Part-
Time
Full-
Time
Part-
Time
Full-
Time
Part-
Time
Exempt
Exec./Mgr./Admin. 74 - 73 - 77 - 77 - 81 -
Instruction/Research 716 330 718 329 737 356 734 306 699 314
Instruction/Research
Assist - 496 - 469 - 489 - 504 - 491
Specialist/Support 496 119 497 57 524 68 554 21 541 17
Exempt Total 1,286 945 1,288 855 1,338 913 1,365 831 1,321 822
Non-Exempt
Technical/Paraprof. 92 1 95 1 96 - 99 - 112 -
Secretarial/Clerical 356 330 355 452 364 497 360 578 346 412
Skilled Crafts 73 - 75 - 77 - 77 - 72 -
Service/Maintance 188 - 193 - 193 - 196 - 188 -
Nonexempt Total 709 331 718 453 730 497 732 578 718 412
Employee Total 1,995 1,276 2,006 1,308 2,068 1,410 2,097 1,409 2,039 1,234
Full-Time Equivalent 1,995 5839 2,006 599 2,068 645 2,097 654 2,039 567
Source - IPEDS Staff Survey
Full-Time Employees by Job Category, 2010-2011
36
Fact Book 2010-2011
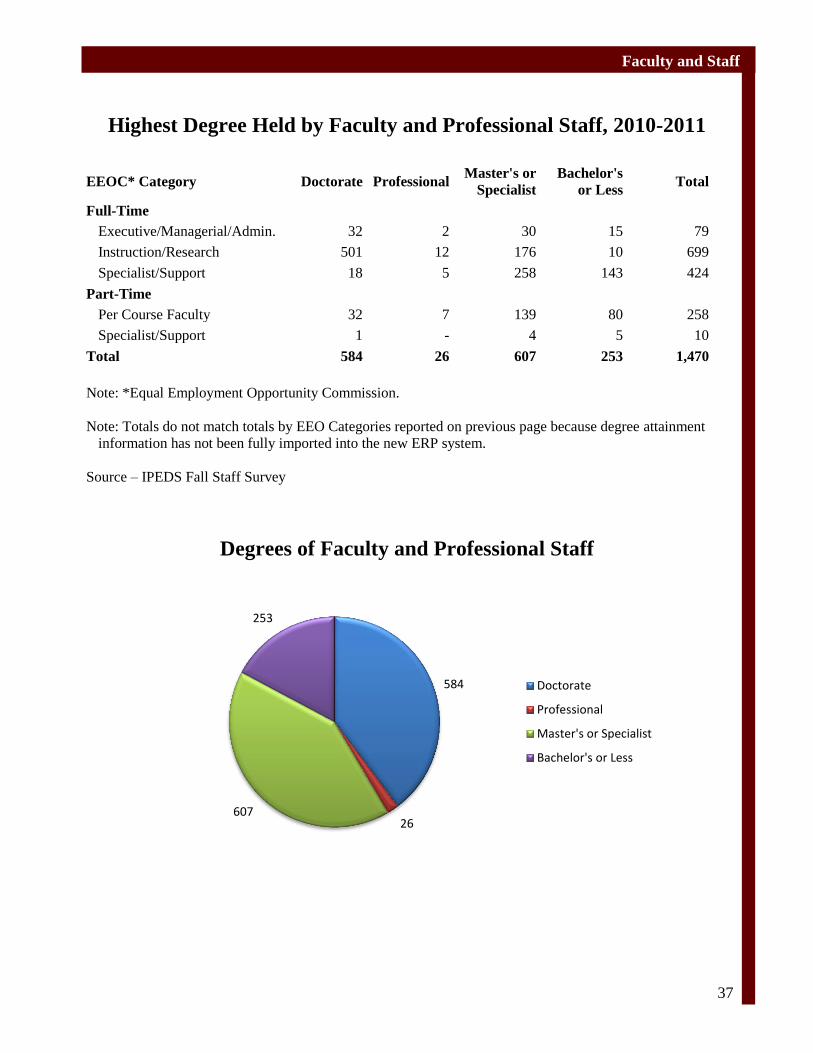
Highest Degree Held by Faculty and Professional Staff, 2010-2011
EEOC* Category Doctorate Professional Master's or
Specialist
Bachelor's
or Less Total
Full-Time
Executive/Managerial/Admin. 32 2 30 15 79
Instruction/Research 501 12 176 10 699
Specialist/Support 18 5 258 143 424
Part-Time
Per Course Faculty 32 7 139 80 258
Specialist/Support 1 - 4 5 10
Total 584 26 607 253 1,470
Note: *Equal Employment Opportunity Commission.
Note: Totals do not match totals by EEO Categories reported on previous page because degree attainment
information has not been fully imported into the new ERP system.
Source – IPEDS Fall Staff Survey
Degrees of Faculty and Professional Staff
584
26 607
253
Doctorate
Professional
Master's or Specialist
Bachelor's or Less
37
Faculty and Staff

Financial Resources
Highlights
The fiscal year 2009-2010 state appropriations and payments constituted 29 percent of the $310
million in total revenues to the University. Student fees accounted for over $96 million or 31 percent
of the revenues.
Instruction accounted for 33.6 percent of the total university expenses.
Salaries comprised 47 percent of the operating expenses for fiscal year 2010.
The Office of Sponsored Research and Programs assisted faculty and staff in obtaining over $20
million from external funding sources in fiscal year 2010.
38
Fact Book 2010-2011
39
Financial Resources

Revenues (in dollars)
FY2006 FY2007 FY2008 FY2009 FY2010
Operating Revenues
Student Fees 68,077,481 77,624,110 79,399,259 82,710,569 96,686,518
Sales & Service of Edu. Activities 12,764,088 12,596,222 12,732,949 18,150,174 10,782,382
Federal Grants and Contracts 23,479,713 27,787,381 25,003,326 34,267,313 44,248,075
State Grants and Contracts 2,197,198 1,772,990 4,937,812 7,322,289 8,070,685
Private Grants and Contracts 7,031,148 7,516,502 13,457,343 6,469,756 5,510,496
Sales & Services of Aux. Enterprises 30,944,079 33,480,336 33,822,218 34,877,413 32,169,659
Other Sources 3,241,874 2,876,781 3,053,593 2,947,729 3,648,113
Total Operating Revenues 147,735,581 163,654,322 172,406,500 186,745,243 201,115,928
Non-Operating Revenues
State Appropriations and Payments 77,933,951 79,792,171 85,015,416 98,182,686 90,828,486
Gifts 4,154,974 4,738,063 5,413,824 11,217,856 11,215,059
Investment Income 3,663,654 5,394,985 6,441,558 3,066,743 11,381,894
Interest on Capital Asset-Related Debt -1,741,847 -2,673,293 -4,376,132 -3,084,279 -4,323,028
Other Non-Operating Rev. & Exp. - - - - 2,305
Gains on Disposal of Fixed Assets -141,838 87,864 -135,722 8,502 49,447
Total Non-Operating Revenues 83,868,894 87,339,790 92,358,944 109,391,508 109,154,163
Total of All Revenues 231,604,475 250,994,112 264,765,444 296,136,751 310,270,091
Note: The University used the new required GASB rules of accounting set out in GASB Bulletin #35
Source -- MSU Financial Reports (Baird, Kurtz, & Dobson)
40
Fact Book 2010-2011

Operating Expenses
FY2006 FY2007 FY2008 FY2009 FY2010
Instruction 80,640,000 82,257,284 87,559,861 93,542,440 93,051,099
Research 10,497,033 14,728,163 15,286,566 16,813,426 15,785,375
Public Service 8,426,249 8,619,947 9,489,494 9,649,667 8,407,656
Academic Support 23,369,503 23,087,065 24,994,065 27,592,616 25,992,923
Student Service 14,319,900 11,463,665 12,121,370 12,666,370 13,173,400
Institutional Support 15,119,904 18,295,397 19,190,983 22,011,693 22,072,024
Plant Operation & Maintenance 15,145,771 16,828,787 19,522,517 20,248,599 16,992,106
Scholarships & Fellowships 5,298,324 8,415,248 9,843,122 13,525,121 23,158,212
Other - - - - -
Depreciation 12,174,425 13,619,146 14,247,820 16,344,581 18,558,372
Auxiliary Enterprises 30,443,203 34,079,645 34,919,444 36,081,737 39,903,571
Mandatory Transfers - - - -
Total of All Expenses 215,434,312 231,394,347 247,175,242 268,476,250 277,094,738
Note: The University used the new required GASB rules of accounting set out in GASB Bulletin #35
Source -- MSU Financial Reports (Baird, Kurtz, & Dobson)
41
Financial Resources
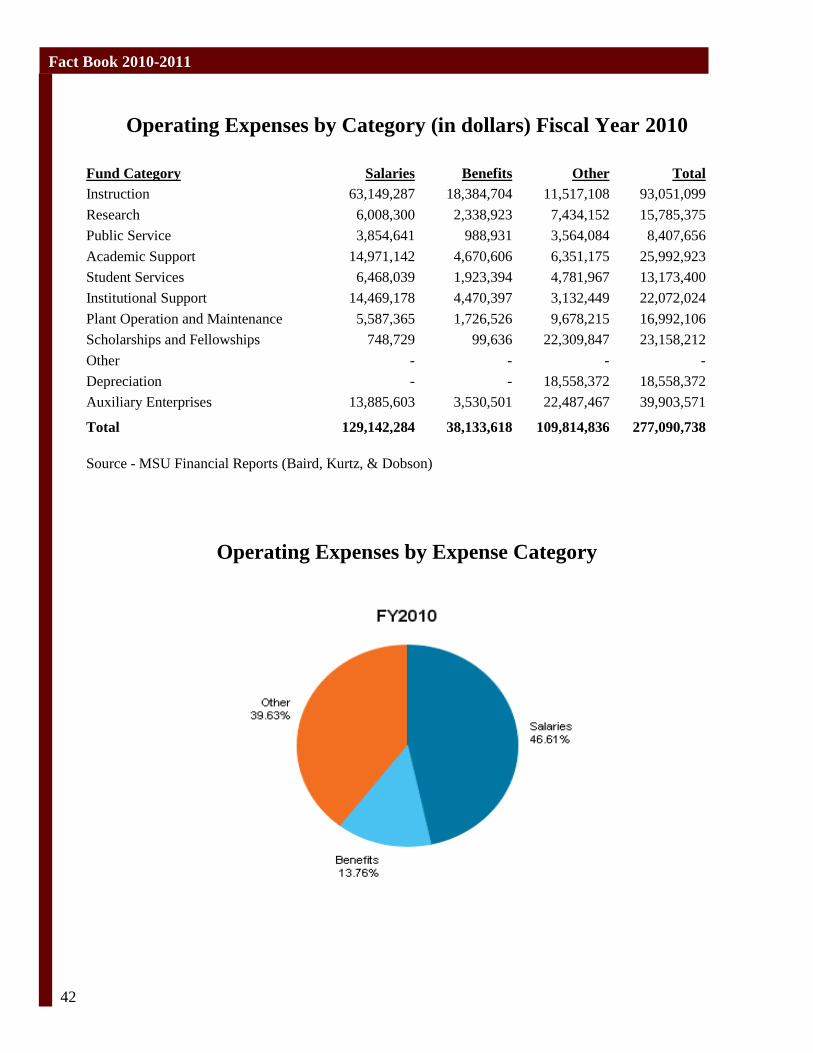
Operating Expenses by Category (in dollars) Fiscal Year 2010
Fund Category Salaries Benefits Other Total
Instruction 63,149,287 18,384,704 11,517,108 93,051,099
Research 6,008,300 2,338,923 7,434,152 15,785,375
Public Service 3,854,641 988,931 3,564,084 8,407,656
Academic Support 14,971,142 4,670,606 6,351,175 25,992,923
Student Services 6,468,039 1,923,394 4,781,967 13,173,400
Institutional Support 14,469,178 4,470,397 3,132,449 22,072,024
Plant Operation and Maintenance 5,587,365 1,726,526 9,678,215 16,992,106
Scholarships and Fellowships 748,729 99,636 22,309,847 23,158,212
Other - - - -
Depreciation - - 18,558,372 18,558,372
Auxiliary Enterprises 13,885,603 3,530,501 22,487,467 39,903,571
Total 129,142,284 38,133,618 109,814,836 277,090,738
Source - MSU Financial Reports (Baird, Kurtz, & Dobson)
Operating Expenses by Expense Category
Salaries
Other
Benefits
42
Fact Book 2010-2011

Revenues and Expenses (in dollars) Budgeted
Budgeted FY 2011
Unrestricted Restricted Total
Revenue
Tuition & Fees 122,456,388 6,980 122,463,368
Federal Grants & Contracts 1,330,000 41,642,405 42,972,405
State Appropriations 82,755,490 - 82,755,490
State Grants & Contracts - 13,591,916 13,591,916
Private Gifts/Grants/Contracts 1,973,661 5,881,692 7,855,353
Investment Income 667,000 36 667,036
Sales & Services 224,667 20,768 245,435
Other Sources 8,388,723 696,850 9,085,573
Total Revenues 217,795,929 61,840,647 279,636,576
Expenses
Instruction 88,270,208 572,756 88,842,964
Research 3,057,293 13,034,325 16,091,618
Public Service 4,645,472 2,180,649 6,826,121
Academic Support 26,254,334 294,014 26,548,348
Student Services 15,004,240 506,460 15,510,700
Institutional Support 29,510,187 581,457 30,091,644
Plant Operation & Maintenance 17,853,716 2,008 17,855,724
Scholarships & Fellowships 20,886,927 37,132,681 58,019,608
Transfers -1,629,523 110,731 -1,518,792
Total Expenses 203,852,854 54,415,081 258,267,935
Source – FY12 State Appropriations Request - Forms 1 & 2
43
Financial Resources

Office of Sponsored Research and Programs
The Office of Sponsored Research and Programs (SRP) is a "help center" for faculty, staff, and students
interested in pursuing external funding. The SRP staff provides individualized service to help University
personnel: (a) identify potential funding sources; (b) organize project development teams; (c) edit proposals;
and (d) develop project budgets. SRP coordinates the submission of proposals; provides guidance on
compliance issues; assists in the start-up of funded projects; offers guidance on the protection and transfer of
University-owned intellectual property; and leads training seminars for faculty, staff and students.
What is the University accomplishing with external funding?
Research projects such as the one that will be used to train graduate students in the use of multi-phase flow and transport models related to CO2 sequestration.
Education projects such as the one funded by the International Management Education Center, to fund a minimum of 30 students’ participation within the EMBA Program.
Service projects that will assist the Missouri Department of Health and Senior Services to conduct activities that will reduce the number of newborns who are lost to follow up after failure to pass a newborn hearing screening or missing a newborn hearing screening.
Externally-funded projects such as these promote multidisciplinary collaborations within the University, joint
ventures with business and industry, partnerships with K-12 schools, collaborations with other community
organizations, and alliances with other higher education institutions.
Outside funding, in the form of grants and contracts, provides millions of dollars to support University-based
projects each year. It is critical that the University continue to find new funding sources to sustain existing
research, education, and service programs and develop new ones. Outside funding enhances teaching,
learning, and research opportunities for faculty and staff, enables students to gain valuable experience, and
supports local and statewide programs. These projects strengthen collaborative efforts between the
University, community and statewide organizations.
Funding from outside sources has risen from $18.1 million in FY 2006 to over $20.1 million in FY 2010.
This was a 4% decrease from funding obtained in FY 2009 of $20.9 million. However, in light of the
economic downturn that occurred, and the funding sources that had funding cuts, this should still be
considered a commendable achievement for faculty and staff of Missouri State University.
In FY 2010, the University submitted 251 proposals for support of new or on-going projects. The University
received 184 awards in the form of grants or contracts totaling $20,108,260. Of the total awards, 22% were
for education projects, 31% for research and other scholarly projects, 42% were for community service
projects, and 5% was primarily used for facilities and infrastructure. Of the total awards, 25% were from
state agencies, 56% were from federal agencies, and 7% from non-profit organizations.
44
Fact Book 2010-2011

Sponsored Projects Activity: Comparison of Awards
Award Use FY 2006 FY 2007 FY 2008 FY 2009 FY 2010
Research 12,801,622 11,758,291 13,210,960 5,260,877 4,000,564
Education 3,298,803 3,158,303 4,557,500 4,279,029 3,010,196
Service 1,874,279 6,811,071 3,722,707 7,496,108 7,012,689
Equipment 159,205 51,490 - 2,499,254 1,098,302
Facilities &
Infrastructure
998,727 1,365,767 4,986,509
Total 18,133,909 21,779,155 22,489,894 20,901,035 20,108,260
Source -- Office of Sponsored Research
Primary Use of Funds Awarded
45
Financial Resources

Facilities
Highlights
The Springfield campus includes 38 educational and general buildings and 20 auxiliary enterprise
facilities.
Currently, 3,873 students are living in University housing, including 2,129 first-time freshmen.
Over 55% of students in University housing are classified as first-time freshmen.
The Missouri State University Library collection includes over 600,000 books, over 944,000
government documents, and over 29,000 journals are available on-line with full-text.
46
Fact Book 2010-2011

47
Facilities

Classification of Students in University Housing by Level
First-Time
Freshmen
Other
Freshmen Sophomores Juniors Seniors Graduates Others Total
2006 2,295 330 801 318 202 107 16 4,069
2007 2,149 337 754 320 203 109 24 3,896
2008 2,078 352 750 330 204 108 33 3,855
2009 2,212 356 802 294 178 93 - 3,935
2010 2,129 410 750 308 194 82 - 3,873
Source -- Residence Life and Services
Classification of Students in University Housing
by Housing Unit, 2010
Residence Hall
First-Time
Freshmen
Other
Freshmen Sophomores Juniors Seniors Graduates Others Total
Blair-Shannon
House 449 54 141 36 6 - - 686
Dogwood Apts. 1 3 3 3 7 32 - 49
Dogwood
Traditional - - - - - - - -
Freudenberger
House 564 50 86 14 13 1 - 728
Hammons House 369 65 108 18 7 - - 567
Hutchens House 223 82 155 61 23 - - 544
Kentwood Hall 3 18 28 31 28 3 - 111
Kentwood South
Apts. - 1 2 3 4 - - 10
Scholars House 33 1 34 17 24 - - 109
Sunvilla
Apartments - 6 1 2 7 37 - 53
Sunvilla Tower 1 38 41 47 45 7 - 179
Wells House 229 49 108 63 22 1 - 472
Woods House 257 43 43 13 8 1 - 365
Headcount by
Level 2,129 410 750 308 194 82 0 3,873
Percentage by
Level 54.97 10.59 19.36 7.95 5.01 2.12 0.00 100
Source -- Residence Life and Services
48
Fact Book 2010-2011

Springfield Campus Map
49
Facilities

General Characteristics of Major Physical Facilities, 2010-2011
Educational and General
Service Facilities
Year
Completed Original Cost
Replacement
Cost
Gross Square
Feet
Assignable
Square Feet
Agriculture Center 1989/2006 363,555 7,422,030 72,457 66,546
Alumni Center 1972 N/A 11,849,060 80,452 58,307
Archaeological Research 1975 88,750 717,933 4,742 3,945
Art Annex 1948 113,666 2,914,809 19,591 14,840
Bear Park North 1995 N/A 14,317,200 360,000 1,296
Bear Park South 2006 N/A 14,733,990 370,480 N/A
Burgess House N/A N/A 548,128 3,742 2,728
Carrington Hall 1908 201,393 15,820,219 106,936 56,529
Cheek Hall 1955 599,982 13,150,108 88,572 49,520
Craig Hall 1967 1,724,800 13,646,157 86,168 46,063
Ellis Hall 1959 826,991 7,538,151 45,198 26,136
Forsythe Athletic Ctr. 1980 780,316 6,171,967 41,324 26,638
Glass Hall 1987 12,408,345 27,078,148 176,094 159,406
Greenwood Lab School 1966 857,246 8,923,260 65,062 48,195
Hill Hall 1924 300,204 10,382,089 69,878 52,000
Jordan Valley Innovation Ctr. N/A N/A 13,815,481 51,610 45,367
Karls Hall 1958 290,420 7,694,337 46,003 27,582
Kemper Hall 1976 2,569,818 13,842,236 65,138 51,006
Kings Street Annex 1982 794,274 4,057,733 27,247 16,243
Madison Hall N/A N/A 1,307,421 8,760 9,183
McDonald Arena 1940 443,091 18,438,171 114,118 87,724
Meyer Library 1980 5,477,708 43,294,194 245,361 183,533
Morris Center 1912 N/A 8,732,335 58,648 60,561
One Room School House N/A N/A 73,734 600 563
Physical Therapy N/A 3,066,500 N/A 22,891 22,761
Power Plant 1908 21,000 23,039,255 17,478 13,760
Professional Bldg. 1940 1,575,000 25,095,894 140,258 133,837
Pummill Hall 1957 641,757 5,947,700 41,948 37,971
Siceluff Hall 1927 305,375 9,635,782 64,944 33,764
Stores & Maintenance 1977 495,367 2,397,645 30,175 30,175
Strong Hall 1998 N/A 27,516,552 185,440 152,334
Student Exhibition Ctr. 1894 62,500 1,167,326 6,548 6,043
Student Media Center N/A N/A N/A 3,061 2,040
Taylor Health N/A N/A N/A N/A N/A
Temple Hall 1971 3,601,473 28,393,061 142,202 137,147
Transit Operations 1974 N/A 472,984 3,210 2,945
University Hall N/A N/A 1,703,286 11,387 N/A
Wehr Band Hall 1996 N/A 7,503,882 50,531 23,668
50
Fact Book 2010-2011

Auxiliary Enterprise Facilities
Year
Completed
Original
Cost
Replacement
Cost
Gross Square
Feet
Assignable
Square Feet
Baker Bookstore N/A N/A N/A N/A N/A
Blair-Shannon House 1966 N/A 28,179,640 192,389 128,285
Dogwood Apartments N/A N/A 2,278,273 22,282 20,777
Elm Apartments N/A 50,000 610,031 12,162 10,688
Forensics Laboratory N/A N/A 263,664 1,800 1,660
Freudenberger Hall 1959 N/A 24,139,760 164,632 109,143
Garst Dining Center N/A N/A 3,657,287 20,739 31,881
Hammons House 1986 12,000,000 23,476,478 160,526 165,977
Hammons Student Center 1976 5,556,981 20,363,395 173,514 106,838
Hutchens House N/A N/A 24,343,207 166,447 165,329
JQH Arena 2008 67,000,000 N/A N/A N/A
Juanita K. Hammons Hall for the
Performing Arts 1992 N/A 19,996,063 125,000 62,500
Kentwood Hall 1926 850,000 7,816,528 53,451 43,711
Kentwood South N/A N/A 1,578,222 10,792 8,012
Plaster Sports Complex 1930 N/A 19,921,157 90,842 128,854
Plaster Student Union 1951 N/A 16,531,935 155,900 81,174
Scholars House 1992 N/A 5,386,604 36,834 29,007
Sunvilla Tower 1963 1,581,241 19,622,805 132,826 144,774
Wells House 1950 244,159 17,573,782 119,368 110,703
Woods House 1971 1,933,496 11,889,605 81,298 72,184
Source - FAC 0056
51
Facilities

Distribution of Assignable Building Space (in sq. ft.)
by Room Use & Program Area, 2009-2010
Program
Area Classroom Lab Office
Study
Facility
Special
Use
Facility
General
Use
Facility
Support
Facility
Health
Care
Facility
Residential
Facility Unclassified Total
Instruction 220,115 252,641 187,764 911 96,033 19,823 14,986 3,521 863 3,385 800,042
Research 44 34,914 8,110 - 423 290 1,840 - - - 45,621
Public Service - - 5,131 - 5,505 - 211 - - - 10,847
Library 1,511 406 18,657 124,651 4,217 - 161 - - 81 149,684
Academic Support 23,199 5,387 21,100 2,107 17,961 46,145 5,130 - - - 121,029
Student Services - 828 39,096 12,462 153,346 172,242 36,691 6,255 598,190 - 1,019,110
Institutional
Support 635 1,338 178,761 - 2,664 1,068 21,832 - - 55 206,353
Physical Plant 356 614 5,312 102 - 707 98,790 - - 215 106,096
Unassigned - - 25,071 - 4,437 43411 583 - 51,259 - 124,761
Total 245,860 296,128 489,002 140,233 284,586 283,686 180,224 9,776 650,312 3,736 2,583,543
Source - Office of Institutional Research (FAC 0061)
52
Fact Book 2010-2011
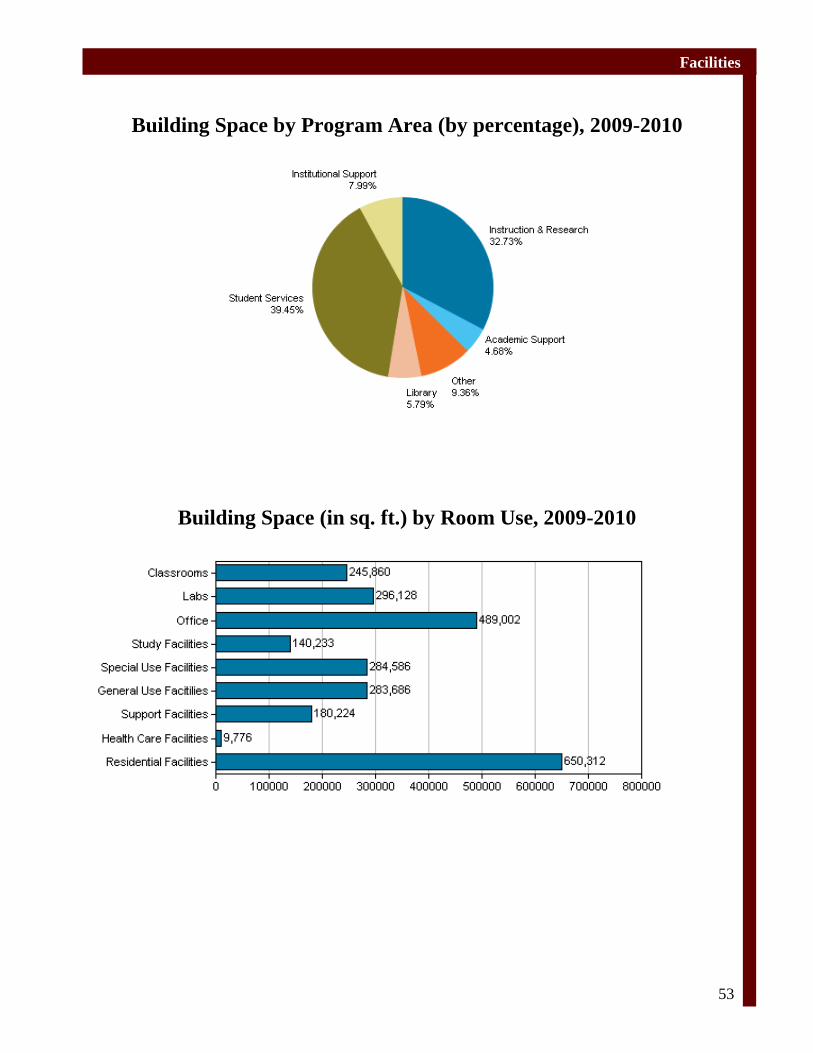
Building Space by Program Area (by percentage), 2009-2010
Building Space (in sq. ft.) by Room Use, 2009-2010
53
Facilities

University Libraries
The Missouri State University library system is comprised of the Duane G. Meyer Library the
Horace and "Pete" Haseltine Library in the Greenwood Laboratory School, and the Paul G. Evans
Library of Fruit Science on the Mountain Grove Campus. These three libraries have collections of
over 2,800,000 items including more than 600,000 accessioned volumes; subscriptions to over
3,300 periodicals, newspapers and other serials; and extensive back files of journals and
newspapers, many in micro-format. The Music Library was reincorporated into Meyer Library
during the summer of 2010. Over 29,000 journals are available on-line with full-text. Total
microform holdings amount to over one million items. More than 944,000 state, federal, and United
Nations documents are held as a result of Meyer Library being a designated depository library for
each of those areas. Meyer Library is the only UN depository library in the state of Missouri.
During the summer of 2010, many duplicate bound periodical volumes were discarded from the
collection. A large collection of audio and video material is fully cataloged and available from the
Music and Media Collections. Special Collections and Archives house a number of special groups
of materials: the William J. Jones collections of Rimbaud and Butor French Literature; the Ozarks
Labor Union Archives that document regional labor history; the Ozarkiana Collections covering life
and culture in the Ozarks, and the University Archives which have been enhanced by several grants
for organizing and processing these materials. The Curriculum Resource Center features a
children’s literature collection, a textbook collection, curriculum guides, and special learning
materials.
OCLC WorldCat, a database with more than 204 million bibliographic records, is utilized for
cataloging and for interlibrary loan and reference, with links to over 72,000 libraries in 171
countries. The statewide MOBIUS consortium, with a membership of 60 academic libraries, is
simplifying access to regional holdings. The MOBIUS database of over 20 million items can be
used by faculty, students and staff to borrow items with a three to four day delivery time from
anywhere in the state.
Electronic access is provided to reference resources, course reserve materials and licensed
commercial citation and full-text databases through the Libraries’ homepage
(http://library.missouristate.edu). Almost 180 electronic resources are available to the Missouri
State University community and they were used more than 267,000 times during the year. In
addition to citations from thousands of journals, newspapers, and books, these databases contain
articles from over 29,000 full-text journals and newspapers. Access is available both on and off-
campus for current MSU students, faculty, and staff. During the fall and spring semester, Meyer
Library is open 100 hours a week. Librarians and/or support staff are available all hours of
operation to assist patrons. In 2009-2010, over 650,000 people entered the libraries and during this
time, the Libraries’ Web server served out over 3.8 million pages. MSU electronic resources were
used over 267,000 times during the year. The top four resources were Academic Search Premier,
JSTOR, Academic OneFile, and Business Source Premier.
54
Fact Book 2010-2011

Circulation Statistics
Greenwood Music Maps Audio-Visual
General
Circulation
All
Circulation
2005-2006 10,643 10,765* 388 11,030** 109,778 142,604
2006-2007 10,052 9,132 421 11,086 97,934 128,625
2007-2008 10,433 8,010 529 11,091 92,510 122,573
2008-2009 9,930 8,286 301 7,453 88,226 114,196
2009-2010 9,834 7,205 278 6,128 83,054 106,499
*Music General Collection moved to Meyer Library
**Media includes Media Reserves.
Source – Meyer Library Head of Access Services
Collection at End of Academic Year
Book Stock
(volumes)
Separate
Government
Documents
Microforms
(Books and
Periodicals)
Audio-Visual
and Others
Serial
Subscriptions
(Titles)*
Maps and
Charts, etc.
2005-2006 866,786 930,195 1,050,614 36,372 3,351 178,168
2006-2007 877,968 934,060 1,052,181 37,148 3,511 178,766
2007-2008 890,330 926,148 1,053,333 37,583 3,550 178,990
2008-2009 900,738 929,696 1,054,262 37,400 3,534 179,156
2009-2010 612,468*** 944,079 1,054,555 23,275** 3,314 207,575**
*Through data-base subscriptions, there is access to over 20,000 full-text serials
**Changed method of counting items
***Bound serial volumes are no longer counted in this number
Source – Meyer Library Head of Access Services
Library Expenditures
Books
Periodicals
and Serials*
Audio-
Visual
Salaries and
Fringe
Benefits
Other Library
Expenses
Total Library
Expenses
2005-2006 276,130 1,705,270 23,864 3,261,327 445,058 5,711,649
2006-2007 292,517 1,627,964 29,223 3,311,790 423,529 5,685,023
2007-2008 269,210 1,807,879 17,895 3,370,039 458,942 5,923,965
2008-2009 226,164 1,908,799 26,810 3,551,791 421,304 6,134,868
2009-2010 226,101 1,974,439 24,760 3,392,188 406,860 6,024,348
*Includes cost of binding materials
Source - Meyer Library Head of Access Services
55
Facilities

Missouri State University – West Plains
Highlights
The West Plains campus is the "open admission" campus within the Missouri State University
System.
The campus offers one-year certificates and two-year associate degrees.
A total of 2,229 students enrolled at the West Plains Campus during Fall 2010.
Female students comprise 59% of the enrollment and 39% of the students attend part-time.
Basic fees (except for nursing and respiratory therapy courses) for the West Plains Campus are the
same as last year at $102 per credit hour for Missouri residents. Basic fees for nursing and
respiratory therapy courses remain the same at $130 per credit hour for Missouri residents.
56
Fact Book 2010-2011

57
West Plains

Campus History and Setting
Missouri State University-West Plains was established in 1963 as the West Plains Residence Center, and is a
semiautonomous, two-year campus within the Missouri State University system. Consistent with the
university mission, Missouri State University-West Plains is a teaching and learning institution of higher
education offering two-year associate of arts, associate of science and associate of applied science degrees;
certificates; and a variety of continuing education courses as needed by employers and citizens of the area
served.
In addition to courses and programs offered in West Plains, Missouri State University-West Plains offers the
Associate of Arts degree in General Studies (AA) at the Extended Campus, Shannon Hall, in Mountain
Grove, Missouri.
Missouri State University-West Plains is located 110 miles southeast of Springfield, Missouri, in the
community of West Plains, Missouri. The campus consists of five classroom and administrative buildings:
Kellett Hall, Looney Hall, Melton Hall, Lybyer Technology Center and the Respiratory Therapy building. In
addition, the campus includes the Garnett Library, a 60-person residence hall called the Grizzly House, the
Putnam Student Center, the V.H. Drago College Store, and the Smith-London Centennial Bell
Tower. Student Services are all located in Cass Hall. Maintenance and custodial operations are located in
the Broadway Building, and the Richards House serves as the residence for the Missouri State University-
West Plains Chancellor. The college primarily attracts students from a seven-county area of the south-
central Missouri Ozarks region and from adjacent counties in north Arkansas.
Mission
Missouri State University-West Plains was established in 1963 as the West Plains Residence Center, and is a
semiautonomous, two-year campus within the Missouri State University system. Consistent with the
university mission, Missouri State University-West Plains is a teaching and learning institution of higher
education offering two-year associate of arts, associate of science and associate of applied science degrees;
certificates; and a variety of continuing education courses as needed by employers and citizens of the area
served.
In addition to courses and programs offered in West Plains, Missouri State University-West Plains offers the
Associate of Arts degree in General Studies (AA) at the Extended Campus, Shannon Hall, in Mountain
Grove, Missouri.
Missouri State University-West Plains is located 110 miles southeast of Springfield, Missouri, in the
community of West Plains, Missouri. The campus consists of five classroom and administrative buildings:
Kellett Hall, Looney Hall, Melton Hall, Lybyer Technology Center and the Respiratory Therapy building. In
addition, the campus includes the Garnett Library, a 60-person residence hall called the Grizzly House, the
Putnam Student Center, the V.H. Drago College Store, and the Smith-London Centennial Bell
Tower. Student Services are all located in Cass Hall. Maintenance and custodial operations are located in
the Broadway Building, and the Richards House serves as the residence for the Missouri State University-
West Plains Chancellor. The college primarily attracts students from a seven-county area of the south-
central Missouri Ozarks region and from adjacent counties in north Arkansas.
58
Fact Book 2010-2011
Accreditation
The college is accredited by the Higher Learning Commission and is a member of the North Central
Association. The Associate of Science in Nursing Program is approved by the Missouri State Board of
Nursing and accredited by the National League for Nursing Accrediting Commission.
Associate Degrees Currently Offered-West Plains Campus
Associate of Arts in Teaching
Associate of Arts in General Studies
Associate of Science in Nursing
Associate of Applied Science in Business
Associate of Applied Science in Child and Family Development
Associate of Applied Science in Computer Graphics and Programming
Associate of Applied Science in Computer Technology
Associate of Applied Science in Enology
Associate of Applied Science in Entrepreneurship
Associate of Applied Science in General Agriculture
Associate of Applied Science in General Technology
Associate of Applied Science in Law Enforcement
Associate of Applied Science in Viticulture
59
West Plains

Fall Headcount Enrollment - West Plains Campus
2001 2002 2003 2004 2005 2006 2007 2008 2009 2010
Enrollment Status
Full-Time 814 864 925 877 886 795 961 1,073 1,260 1,360
Part-Time 839 856 776 769 792 801 796 761 902 869
Enrollment by Gender
Male 561 571 581 548 580 557 663 704 885 903
Female 1,092 1,149 1,120 1,098 1,098 1,039 1,094 1,130 1,277 1,326
Total Enrollment 1,653 1,720 1,701 1,646 1,678 1,596 1,757 1,834 2,162 2,229
Source -- West Plains Institutional Research
Credit Hour Production by Semester - West Plains Campus
Year Fall Spring Summer Total
2006-2007 14,769 12,843 2,176 29,788
2007-2008 17,006 14,809 2,518 34,333
2008-2009 18,362 15,848 2,764 36,974
2009-2010 21,428 19,753 3,438 44,619
2010-2011 23,292 N/A N/A N/A
Source -- West Plains Institutional Research
60
Fact Book 2010-2011

Fall Enrollment by Gender - West Plains Campus
Fall Enrollment by Enrollment Status- West Plains Campus
61
West Plains

Schedule of Resident Student Fees* (in dollars) –
West Plains Campus
2006-2007 2007-2008 2008-2009 2009-2010 2010-2011
Basic Fees
Resident 102 102 102 102 102
Nonresident (1-6 hours) 102 102 102 102 102
Nonresident (7 or more hours) 204 204 204 204 204
Student Service Fees*
Enrollment in 1-5 hours 22 22 22 27 52
Enrollment in over 5 hours 47 47 47 47 72
Computer & Technology Usage
(hourly)
5/hour
(1-11 hours)
5/hour
(1-23 hours)
5/hour
(1-23 hours)
5/hour
(1-18 hours)
5/hour
(1-18 hours)
Computer & Technology Usage
(maximum)
60
(12+ hours)
120
(24+ hours)
120
(24+ hours)
90
(18+ hours)
90
(18+ hours)
* Non-degree seeking students enrolled in one or two credit hours are not charged Student Services Fees.
Source -- MSU fee resolutions
Basic Fee Per Hour (in dollars) for Resident Students –
West Plains Campus
62
Fact Book 2010-2011

Educational and General Funds (in dollars)
West Plains Campus
Budgeted FY 2011
(Unrestricted)
Revenues
Student Fees 3,649,717
Appropriations 5,367,521
Investments 50,000
Other Sources 206,950
Total Revenues 9,274,188
Expenditures
Instruction 3,133,069
Public Service 411,113
Academic Support 956,970
Student Services 1,070,371
Institutional Support 2,108,622
Operations and Maintenance of Plant 1,060,043
Scholarships and Fellowships 575,260
Transfers -42,695
Total Expenditures 9,272,753
Source - FY10 Internal Operating Budget
63
West Plains

Alumni and Development
Highlights
According to the latest records of the Office of Development and Alumni Relations, most of
Missouri State University's alumni (over 65,000) currently reside in Missouri, representing every
county. Thirty-six counties have over 250 alumni, with over 19,000 residing in Greene County
alone.
Over 23,000 alumni live outside Missouri, representing every state in the United States and several
foreign countries.
The Alumni Association has developed programs and activities that allow alumni and former
students to continue their identification with the University. In the fiscal year 2010, 7,895 alumni
contributed over $3.7 million.
Gifts to the University Foundation during FY 2010 provided over $15 million for student aid,
endowments, capital projects, and other University programs.
64
Fact Book 2010-2011

65
Alumni and Development

Alumni by County of Residence
Counties in Missouri in which more than 250 alumni reside include:
Barry 588 Greene 19,272 Polk 794
Boone 889 Howell 1,781 Pulaski 355
Camden 471 Jackson 3,493 St. Charles 3,189
Cass 576 Jasper 1,503 St. Francois 262
Cedar 278 Jefferson 1,011 St. Louis 8,229
Christian 4,085 Laclede 861 St. Louis City 854
Clay 1,405 Lawrence 958 Stone 514
Cole 871 Newton 523 Taney 890
Dade 256 Oregon 326 Texas 537
Dallas 330 Ozark 281 Vernon 269
Douglas 280 Phelps 490 Webster 1,694
Franklin 1,009 Platte 656 Wright 661
Source -- Office of Development & Alumni Relations
66
Fact Book 2010-2011

Alumni by State of Residence
States in which more than 250 alumni reside include:
Arizona 601 Iowa 426 Ohio 440
Arkansas 1,564 Kansas 3,020 Oklahoma 1,110
California 1,445 Michigan 295 Tennessee 559
Colorado 972 Minnesota 327 Texas 2,521
Florida 1,258 Missouri 65,602 Virginia 668
Georgia 621 Nebraska 316 Washington 342
Illinois 1,550 New York 386
Indiana 411 North Carolina 427
Source -- Office of Development & Alumni Relations
67
Alumni and Development

Missouri State University Foundation
Formed in January 1981, the Missouri State University Foundation is a not-for-profit organization which has
as its mission:
"To develop an environment which promotes giving and therein seek, receive, manage, and distribute
resources in a manner appropriate to support programs of instruction, research, and public service of
the University."
Thus, the Foundation is empowered to solicit and receive gifts and bequests, to accept trusts subject to the
conditions imposed on them, and to hold, administer, manage, use, or distribute gifts, bequests and trusts for
the benefit of Missouri State University. The Foundation exists to benefit Missouri State University, its
faculty and students; to improve its standards and potentialities as an institution of higher learning; and to
promote the general welfare of the University.
The main emphasis of the Foundation is centered around major donor solicitation, the Missouri State Annual
Fund, the honor clubs, The Bears Fund, The Performance Society, and a planned and deferred giving
program. The Annual Fund solicits gifts from faculty and staff, alumni, and friends of the institution through
a Campus Campaign, the Nationwide Phone Campaign, and direct mail. The honor clubs, which offer special
recognition for individual giving, include:
The Founders Club Minimum of a $10,000 outright gift over a ten year
period, or a deferred gift with a present value of at
least $10,000
The President’s Society $1,000 or more annually or larger gifts from donors
who have not pledged at The Founders Club Level
The Carrington Club $500 or more annually or larger gifts from donors
who have not pledged at The Founders Club Level
The Maroon and White Club Gifts of $250 to $499 annually
The Century Club Gifts of $100 to $249 annually
The Bears Fund is the fundraising program for intercollegiate athletics. The Performance Society is the
fundraising program established to provide annual support for the operational needs of the Juanita K.
Hammons Hall for the Performing Arts. Planned and deferred giving programs offer educational seminars
and mailings for alumni and interested friends of the University, as well as provide donors opportunities to
endow scholarships, grant bequests through their wills, establish life income gifts, and utilize other estate
planning vehicles.
In fiscal year 2009-2010, 23,688 donors made 31,432 outright gifts of cash and property totaling over $15
million. The total deferred gift commitments made to the University total over $40 million. Gift and pledge
commitments to the Foundation since its formation in 1981 have reached over $205 million.
68
Fact Book 2010-2011

Gift Activity (in dollars)
2007-2008 2008-2009 2009-2010
Outright Gifts of Cash 11,599,063 13,744,876 12,726,506
Outright Gifts of Property 2,451,337 1,299,658 2,785,865
Total Value of Outright Gifts 14,050,400 15,044,534 15,512,371
Total Value of Deferred Gifts 567,258 3,296,200 7,495,000
Total Value of All Gifts 14,617,658 18,340,734 23,007,371
Source -- Missouri State University Foundation
Sources of Outright Gifts (in dollars)
2007-2008 2008-2009 2009-2010
Donors Amount Donors Amount Donor Amount
Alumni 8,030 3,014,196 7,654 2,854,235 7,895 3,701,947
Other Individuals 16,639 3,582,809 15,621 4,216,345 14,406 4,681,170
Corporations &
Businesses 1,497 5,676,705 1,418 6,790,647 1,230 5,814,411
Other Organizations 138 1,776,690 134 1,183,308 157 1,314,843
Total Value of
Outright Gifts 26,304 14,050,400 24,827 15,044,535 23,688 15,512,371
Source -- Missouri State University Foundation
Purposes of Outright Gifts (by dollar amount)
2007-2008 2008-2009 2009-2010
Student Aid 1,724,149 1,381,444 2,708,055
Endowment and Loan Funds 2,198,559 1,419,638 2,899,236
Capitial Purposes 5,287,286 6,485,098 3,785,724
University Programs* 4,840,486 5,758,354 6,119,356
Total Value of Outright Gifts 14,050,480 15,044,534 15,512,371
Note: * University programs assisted through these gifts included academic departments, research projects,
radio and other public service programs, library acquisitions, athletics and the general university
Source -- Missouri State University Foundation
69
Alumni and Development

Missouri State University – Mountain Grove
Highlights
The State Fruit Experiment Station is the oldest identifiable component of the University having
been founded in 1899.
In 2006, the Fruit Sciences Department became part of the Department of Agriculture.
Extensive experimentation on grapes has been conducted on the campus since 1900 and, today, the
grape and wine program ranks among the most comprehensive in the United States.
The campus is one of only three USDA quarantine facilities for the introduction and virus testing of
grape varieties originating outside of the U.S.
70
Fact Book 2010-2011

71
Mountain Grove

History and General Information
The oldest identifiable segment of Missouri State University is the State Fruit Experiment Station which is located on
the Mountain Grove Research Campus. The State Fruit Experiment Station has a legislated mandate to generate
knowledge through research, and to disseminate this knowledge to support and expand the productivity and profitability
of the Missouri fruit industry. The Station was founded by legislative act in 1899 and was assigned to the University on
July 1, 1974, under the Omnibus State Reorganization Act. In 1994, the Station became the location of the newly
designated research campus.
The Mountain Grove Research Campus (http://mtngrv.missouristate.edu/) is part of the Agriculture Department which
is one of the nine departments in the College of Natural and Applied Sciences at Missouri State. Permanent employees
at the Fruit Experiment Station include faculty, professional staff and support staff. The station also employs visiting
scientists and from 20 to 25 temporary and student employees throughout the year. In addition to carrying out research
and advisory programs, faculty guide graduate students in thesis research, and teach classes in their various disciplines.
Faculty and professional staff supervise undergraduates on internships.
Research is focused on pomology, plant pathology, entomology, genetics, plant physiology, viticulture and enology.
Plant pathogens and insect pests are studied to help reduce their damage to fruit crops. Reducing pesticide use for
management of diseases, insects, and weeds is a major ongoing research effort. Also investigation is ongoing on
nutrient and water requirements, pruning and training systems, growth regulators, and rootstocks. The fruit crops under
investigation include apples, grapes, blueberries, peaches, strawberries, blackberries, raspberries, and exotic native fruits
such as persimmon and pawpaw.
Grapes are of particular interest at Mountain Grove Research Campus. Located in a natural grape environment, the
campus has been the site of extensive grape experimentation since 1900. Today, research of the Vitis Gene Discovery
Program explores the genetic basis for disease resistance in native grapes. Research and advisory education efforts are
the basis for the recent rapid economic development of Missouri’s grape and wine industry. The grape and wine
program ranks among the most comprehensive in the United States. One of only three USDA quarantine facilities for
the introduction and virus testing of grape varieties originating outside of the United States is located in the Station.
Research on the Mountain Grove campus involves not only the permanent staff but also a number of the faculty from
the College of Natural and Applied Sciences in Springfield. These collaborations provide the expertise needed for grant
funding and continued success of the projects. The collaborations provide many research opportunities for our students.
Information derived from the Station’s research is disseminated by advisory programs to fruit growers and processors
through bulletins, newsletters, a newspaper column, conferences, workshops, and personal consultations.
An interdepartmental master’s degree program in plant science was initiated in August of 1997. This program includes
the Departments of Agriculture, Biology and Chemistry. Graduate students desiring an emphasis in pomology, pest
management, molecular genetics, or viticulture and enology take courses and conduct thesis research with faculty from
the Department of Agriculture’s State Fruit Experiment Station.
Facilities on the campus include Shepard Hall, a classroom building, a research winery, a shop and maintenance
building, duplex housing, green house facilities, cold storage, and fruit processing education building which houses an
interactive television teaching laboratory and commercial teaching winery and distillery. Historic Faurot Hall, renovated
in 1998, houses a library, an interactive television classroom, other classrooms, and a plant science laboratory.
72
Fact Book 2010-2011

Current Highlights Center for Grapevine Biotechnology
The center has received over $2 million in external funding over the past few years. A current project is mapping grape
defense genes which would facilitate plant breeding for disease resistance and placing other desired traits in new
varieties. Another project is to investigate the potential for new commercial products for enhanced plant and human
health. A third project is a survey and characterization of viruses in Missouri vineyards and native grapes. Each of these
projects has the capacity to effect scientific knowledge as well as the economic development of Missouri.
VESTA
A $2.927 million grant from the National Science Foundation is funding the Viticulture and Enology Science &
Technology Alliance (VESTA) Regional Center focusing on the educational needs of the viticulture and enology
industry located in twelve Midwest states. The program currently has over 350 students from 31 states and three
countries. The VESTA Regional Center of Excellence is one of 36 Advanced Technological Education Centers in the
United States and the only one located in Missouri.
Mountain Grove Cellars
Products from the vineyards are available for sale online. Wines, ports and jellies from a variety of crops are available at
the on campus store.
Other Research Activities
One researcher is studying the insect-deterrent properties of compounds in the Gingko tree. Another researcher is
studying and growing native flowers for dried cut-flower production and has started a rain garden on the campus. Other
researchers are studying forage and buffer strips for water management in rural areas.
Outreach Activities
A rain garden field day is held to educate the general public about the installation, care and use of rain gardens. Other
specialized field days are also held at the Station for education purposes and school tours are conducted for hundreds of
K-12 students in southwest Missouri. In addition, distillation, home winemaking, composting, and pruning workshops
are held at the Station.
73
Mountain Grove