Embed Size (px)
Citation preview

Fem
Contrac
Actual D
Author(
Particip
Workpa
Est. per
Security
Dissemi
Version
Total nu
AbstracThe scoinhomogmethodsat systemFAPs is adopt reof the soSystem environmlevel simfrom a L Keywor
mtocell-baand coo
ctual Date of
Date of Deliv
(s):
pant(s):
ackage:
son months
y:
nation Leve
:
umber of pa
ct: ope of D5.2geneous diss and benefim level of sopaired to th
esources alloftware mod
performanments, and
mulations arLTE covera
rd list: Netw
ICT
ased networdination
System
f Delivery to
very to the C
M. ArR. Cha
DUNE
WP5
: 33
P
el: PU
b
ages: 123
is to face tribution ofits from a clome optimizhe sharing oocation stradules for D5nce has bfinally eval
re completedge simulator
work plannin
T-248891
work enhn of infor
interferen
o the CEC:
CEC:
rbolino, G. arbonnier, Y
, SIR, INFO
the problef FAPs by mlustering strzation methoof slowly varategies for a5.2 simulatio
been testeduating MBS
d with an anr that is bas
ng, interfere
1 STP FR
ancemenrmation f
D5.2
nce mana
31 Dece
16 Janu
ImponenteY. Corre, F.
O
em of netwomanaging thrategy are evods devised rying metric
a realistic inons includes
d for real S traffic offnalysis of thesed on a sim
ence modelin
REEDO
nt by intefor seam
agement ev
ember 2011
uary 2011
e, F. PuccLetourneux
ork planninhe femto povaluated, toin 3A2. Thecs through t
nterference es coverage a
geographifload and Qoe femto-baseple MAC-la
ng
M
erference less conn
valuation
i, G. Rosi x, Y. Lostanl
ng in the propulation asgether with
e sensing capthe ISP backenvironmenand traffic fic deploymoS gained ined interfere
ayer abstrac
managenectivity
(DUN), Mlen (SIR)
resence of s a whole. D the implempability of tkhaul as the
nt. A full desflow in the n
ments, timen that case.
ence impact,ction.
ment
M. Brau,
a dense, Different
mentation he single e basis to scription network.
e-varying System-
, realized

1

ICT-2488DocumentTitle of D
Freedom
The scopby evalupresent. traffic fl
A relevamacro+fdeploymstreets ainterferenetwork modes, a The LTEconsidercharactenetwork techniqu The covdeploymchannel macro cwithin thmacro cebuildingsimulatiovery real The covand towa
Managemorder to shows tooptimiza20) withdifferentconsider Adaptivemodel opower inbeen condue to ittime slotparametenumber the runnand of resourceproposed
891 STP t number: M5eliverable: Int
m_5D2_DUN
pe of this douating both t
Such issuesows in the ne
ant part of acfemto LTE c
ments in syntand in diffeence maps an
capacity. Leand provide p
E coverage sr, in particurization of tperformanc
ue.
verage simuments in urba
macro coveroverage). Thhe deploymeell. Complem and transmons relies onlistic results.
erage simulaards the 2A3
ment of the run faster m
o be much mation algorithh respect to t cluster topored implemen
e resource aof the macron the joint tinsidered on ts running tits is spent foers: the accof iterations
ning of the aiterations. T
e allocation gd allocation s
.2.2 terference chan
Nb.docx
cument is tothe radio covs are mergedetwork, as w
ctivity 5A2 iscoverage perthetic and reerent buildinnd spectral efet us remarkperformance
simulator mular, inter-cethe useful ance that wou
ulations are an corporate rage (actuallyhe impact ofent floor, withmentarily, semit power) n real geogra.
ations provid3 business mo
network canmanagement amore efficienhms show fa
consideringologies and nting both tra
allocation alg-users interfime-frequencthe LTE frame: the time
or letting the curacy requ
s, and how oalgorithm hasThe achievabgame is run. strategy: the
nnel model at s
Execu
address the verage and thd in the dyn
well optimizat
s given by thrformance. Iteal geographng floors); fficiency ma
k that these se statistics for
akes simple ell interfere
nd interferenuld be obtain
conducted and suburbay only the urf a FAP dephin the deploeveral properand of FAPaphical map
de outcomes odel analysis
n be augmenalgorithms onnt when evaar less complg the networimplementatansmission e
gorithms havference activcy plane. Thame structuree available falgorithm ru
ired for the ften the algos been evaluble rate decFurthermoreknowledge o
system level
utive Sum
impact of nehe cell perfonamic simulaation strategie
he developmet is composehical environprediction o
aps); and finasimulation tor both FAP s
assumptionence coordinnce signal levned in abse
in a large an residentialrban corpora
ployment is aoyment buildrties of the FP traffic are data and sit
towards thes.
nted by desin selected se
aluating the ilexity when rk as a whotion of Geneevents and ne
ve been propvity and usinhe schedulinge. We evaluafor data tranun and conv
convergencorithm is runuated derivincreases whene, it is interesof interferen
mmary
etwork plannormances whator which ies designed i
ent of a simued of: contronments; predof the LTEally, estimateools support subscribers a
s on the intenation. The vels; or as aence of any
number ofl environmenate deploymeanalyzed at ding, in surroFAP deployme investigatete-specific p
e engineering
igning and eets of users. Aimpact of farun in parall
ole. Such sietic Optimizetwork data f
posed in D3ng alternativeg of these reated the datasmission becerge. The sig
ce of the algn. Then the nng its dependn increasingsting to emphnce statistical
ning for interhen a set of Mincludes tranin 3A2.
ulation chainolled or randdiction of 3DE downlink e of the delivboth the op
and non FAP
erference moresults mu
a pessimistic specific int
f scenarios nts, in presenent has been different scaounding streement (densityed. Part of path-loss pred
g rules elabo
evaluating clAssignment oast metric mlel on sets ofmulations, i
zation at systflow.
.2 by incorpe pricing meesource alloca-rate loss focomes shortegnaling overgorithm, whnumber of tidence on numg the frequehasize the prl parameters,
rference manMUEs and F
nsmission ev
n for evaluatidom large-scD path-loss coverage (s
vered througpen and closeP subscribers.
odeling and ust be view reference gterference m
to investignce or absenstudied in ab
ales: in FAPets, or withiny, location wthe urban cdictions, thu
orated in acti
lustering meof power and
measurementsf few units (including antem level, h
porating a Mechanisms tocation algorior the max-rer when a frrhead dependhich is relateime slots req
umber of actiency with wredictive natu, if properly
2
nagement FUEs are vents and
ion of the cale FAP maps (in signal-to-ghput and ed-access .
does not wed as a giving the mitigation
gate FAP nce of co-bsence of vicinity,
n a whole within the corporate
us lead to
ivity 6A2
ethods, in d/or band s. Indeed, (less than nalysis of have been
Markovian o allocate ithms has rate game raction of ds on two ed to the quired for ive FAPs
which the ure of the exploited

3
as in the proposed algorithms, yields a rate very similar to the ideal case assuming non-causal knowledge of the macro-users activity. Complementarily to activity 5A1 (see [Freedom-D51]), the metrics measuring system performances have also been tested to different combinations of variable band allocations which could be of interest for a Mobile Network Operator (MNO). Moreover, a temporal variation of the environment and of the users’ positions has been included in the system simulator.
The algorithms developed allow controlling events of transmission, related to the assignment of time slots in the LTE subframe, taking into account also data packets generated by applications running on mobile terminals and their encoding in the PRBs structure by the RRM scheduler.
The packet flow module, complemented with the transmission system dynamics, allows to evaluate the information data passing through the cell and the impact on all transmitters. A measurement of the QoS and traffic load has been put in relation to the energy needed to run a set of applications on UEs mobile terminals. The overall simulator has been tested in several cases of interest which can be summarized as:
- Impact of clustering on possibility to extend optimization methods at system level in a reliable way, in order to manage also high number of users;
- Inclusion of a set of real environments, providing metrics also for the mapped scenarios, produced by SIR, with geographic deployments of buildings and users;
- Mobility of users and temporal changes in the environment around transmitters have been included and evaluated;
- Evaluation of the system performances for different cases of varying band usage: equipartition of band between MBS and femto network, considering a fixed spectrum allocation for the MBS and varying that of second tier, or fixing the band usage of the femto network and increasing that of the macro network;
- Evaluation of system performances when including a GO for power assignment of FUEs/FAPs to mitigate indoor interference;
- Quantification of the MBS offload when routing traffic of a set of Ues indoor through FAPs instead of through the macro network.

ICT-2488DocumentTitle of D
Freedom
The workthe FREEwork in qwithin thethe suitab
Under nowhatsoevsummarywork and
891 STP t number: M5eliverable: Int
m_5D2_DUN
k associated wEDOM partnequestion. Howe report is to bbility and relia
o circumstancver arising ouy, publication d disclaim all l
.2.2 terference chan
Nb.docx
with this reporers have endewever since thbe put by any ability of the in
ces will any ut of any error dissemina
liability for an
nnel model at s
D
rt has been caravoured to ac
he partners haother party, anformation in
of the partnror or inaccuation of the inny loss, damag
system level
DISCLAIMER
rried out in acchieve the degave no controlany other suchn relation to an
ners, their seruracy containnformation coge, expenses,
R
ccordance withgree of accural over the use
h party shall beny particular u
rvants, emploed in this reontained withclaims or infr
h the highest acy and reliabe to which thee deemed to huse, purpose o
yees or ageneport (or any in this reportingement of th
technical stanbility approprie information have satisfied or application.
nts accept anyy further const) and/or the hird party righ
4
ndards and iate to the contained itself as to
y liability solidation, connected hts.

5
Table of Contents
1 INTRODUCTION ............................................................................................... 12
2 SCENARIOS ........................................................................................................ 14
2.1 BUSINESS SCENARIOS ............................................................................................... 14 2.2 ABSTRACT MODELS .................................................................................................. 14
2.2.1 Buildings deployment ......................................................................................... 15 2.2.2 Distribution of users/femto ................................................................................. 15
2.3 DEPLOYMENT COMPLEXITY .................................................................................... 17 2.3.1 One building, single floor ................................................................................... 17 2.3.2 One building, multiple floors .............................................................................. 17 2.3.3 Multiple buildings ............................................................................................... 17
2.4 REALISTIC DEPLOYMENT MODELS .......................................................................... 19 2.4.1 Geographical map data ...................................................................................... 19 2.4.2 Distribution of macro-BS/users/femtos ............................................................... 20
3 INTERFERENCE ANALYSIS .......................................................................... 22
3.1 SYSTEM ASSUMPTIONS ............................................................................................. 22 3.2 LTE COVERAGE SIMULATION ................................................................................. 22 3.3 SIMULATION WORKFLOW AND PERFORMANCE ANALYSIS .................................... 23 3.4 IDENTIFICATION OF FEMTO-BASED INTERFERENCE IMPACT ................................ 24
4 INTERFERENCE PLANNING ......................................................................... 26
4.1 CLUSTERING METRICS ............................................................................................. 26 4.1.1 Geographical deployment ................................................................................... 26 4.1.2 Interference relation ........................................................................................... 26
4.1.2.1 Pathloss ........................................................................................................... 26 4.1.2.2 SINR ............................................................................................................... 29 4.1.2.3 Methods for evaluating presence and relation to other transmitters ............... 30
4.1.3 Priority of user/service ....................................................................................... 30 4.1.3.1 Type of service ................................................................................................ 31 4.1.3.2 Traffic load/QoS ............................................................................................. 31 4.1.3.3 Latency ............................................................................................................ 31
4.1.4 Interference based on users activity ................................................................... 31 4.2 CLUSTERING AT SYSTEM LEVEL .............................................................................. 31
4.2.1 FAPs clustering .................................................................................................. 31 4.2.2 Centralized clustering ......................................................................................... 33 4.2.3 Local clustering .................................................................................................. 33 4.2.4 Hierarchical clustering: subclusters .................................................................. 33
5 INTERFERENCE MANAGEMENT ................................................................ 34
5.1 SENSING CAPABILITY ............................................................................................... 34 5.2 SYSTEM EVALUATION ............................................................................................... 35
5.2.1 Slowly varying metrics ........................................................................................ 35 5.2.2 Backhaul load ..................................................................................................... 38
5.3 SCALABILITY ............................................................................................................ 38 5.3.1 Cluster level ........................................................................................................ 38 5.3.2 Clusters of clusters ............................................................................................. 39
5.3.2.1 Parallelization topologies ................................................................................ 39 5.3.2.2 Ring Topologies .............................................................................................. 39
5.3.2.2.1 Ring-next, Ring-twist and Ring-generic ................................................... 39 5.4 OPTIMIZATIONS STRATEGIES .................................................................................. 41
5.4.1 Centralized resources allocation ........................................................................ 41

ICT-2488DocumentTitle of D
Freedom
5.5.
5.4.
6 ME
6.1 6.2
6.2.6.2.
6.3 6.4
6.4.6.4.
7 SYS
7.1 7.1.7.1.7.1.7.1.
7.7.
7.1.7.2
7.2.7.2.7.2.
8 PER
8.1 8.1.8.1.
8.8.
8.1.8.8.
8.1.8.1.cove
8.8.
8.2 8.2.8.2.
8.8.
8.3 8.3.8.3.8.3.
8.4 8.4.8.4.
891 STP t number: M5eliverable: Int
m_5D2_DUN
4.1.1 GA O4.1.2 Bloc2 Schedu
ETHODOL
SYSTEM SIM
SIMULATOR
1 Transm2 Events KEY PARAM
PERFORMA
1 System2 User-le
STEM LEV
DYNAMIC S
1 Environ2 Propag3 Low lev4 Resour1.4.1 Adap1.4.2 Sche5 UE reqSYSTEM-LE
1 GO and2 GO and3 Compa
RFORMAN
RESULTS F
1 Simula2 Scenar1.2.1 Scen1.2.2 Scen3 Scenar1.3.1 Initia1.3.2 Impa4 Scenar5 Scenarerage) ..........1.5.1 Scen1.5.2 ScenCELL PERF
1 Equipa2 Variab2.2.1 MBS2.2.2 FEMSYSTEM PE
1 Mappe2 System3 SystemSYSTEM PE
1 Homog2 Inhomo
.2.2 terference chan
Nb.docx
Optimizationcks Topologyuling in distri
LOGY FOR
MULATOR ...R PRINCIPLE
mission eventsequence ....
METERS ......ANCE METRI
-level metricevel metrics .
VEL SIMU
SIMULATOR nment and ngation and invel abstracti
rce managemptive MCS ..eduler and prquirements ...EVEL AND US
d ring topolod blocks topo
arison of resu
NCE EVAL
OR INTERFE
tion inputs ..rios IA-1 andnario IA-1 – Inario IA-2 – Irio IA-3 – Impal simulationact of FAP prrio IA-4 – Imprios IA-5 and....................
nario IA-5 – Snario IA-6 – SFORMANCES
artition of frele band part
S increasing bMTO tier incrERFORMANC
ed scenario .. behavior .... metrics ......
ERFORMANC
geneous scenogeneous sce
nnel model at s
n over the riny ...................ibuted RA alg
R SYSTEM
....................ES ................t ...........................................................
ICS ...............cs .....................................
ULATOR A
....................etwork .........
nterference ...on models ...
ment ..................................
riorities ............................SER-LEVEL P
ogy ...............ology ...........ults to the un
LUATION
ERENCE ANA
....................d IA-2 – ImpaImpact of a sImpact of a bpact on urba
ns from both roperties on pact on subud IA-6 – FA....................Spectral efficSpectral efficFOR DEPLO
equency bandtition ............band occupa
reasing band CES FOR DEP
....................
....................
....................CES FOR DEP
nario .............enario ..........
system level
ng ....................................lgorithms on
M LEVEL S
....................
....................
....................
....................
....................
....................
....................
....................
ARCHITEC
....................
....................
....................
....................
....................
....................
....................
....................PERFORMAN
....................
....................nclustered ap
N..................
ALYSIS .............................act on local usingle-floor Fbuilding FAPan network creal and synspectral effic
urban networAP coverage....................ciency of a sciency of a b
OYMENTS WI
d ......................................ancy .............occupancy .
PLOYMENTS
....................
....................
....................PLOYMENTS
....................
....................
....................
....................the LTE fram
SIMULATI
....................
....................
....................
....................
....................
....................
....................
....................
CTURE .....
....................
....................
....................
....................
....................
....................
....................
....................NCE ......................................................
pproach ........
...................
....................
....................urban corporFAP deploymP deploymenoverage .......
nthetic envirociency distribrk coverage .e in urban c....................
single-floor Fbuilding FAPITH SHARED
....................
....................
....................
....................WITH MOBIL
....................
....................
....................WITH GO ...........................................
....................
....................me structure
ION ...........
....................
....................
....................
....................
....................
....................
....................
....................
...................
....................
....................
....................
....................
....................
....................
....................
....................
....................
....................
....................
....................
...................
....................
....................rate coveragment on netwnt on network....................onments .......bution .............................corporate ar....................FAP deploymP deployment
BAND ALLO
....................
....................
....................
....................LITY ....................................................................................................................................
................. 41
................. 42e ............... 44
............... 47
................. 47
................. 47................ 48................ 50
................. 50
................. 51................ 51................ 51
............... 52
................. 52................ 52................ 53................ 55................ 55
................. 57
................. 59................ 62
................. 62................ 62................ 64................ 66
............... 68
................. 68................ 68
ge ............. 71work coveragk coverage76................ 82
................. 83
................. 84................ 85
rea (no initia................ 89
ment ......... 90nt ............... 91OCATION .. 94
................ 94
................ 96................. 96................. 98................. 98................ 98.............. 100.............. 104
............... 105.............. 105.............. 105
6
1 2 4
7
7 7 8 0 0 1 1 1
2
2 2 3 5 5 7 9 2 2 2 4 6
8
8 8 1 ge 72 6 2 3 4 5 al macro 9 0 1 4 4 6 6 8 8 8 0 4 5 5 5

7
8.4.3 Mapped scenario – SIR N1 ............................................................................... 106 8.4.4 Conclusions about GO implementation at system level .................................... 106
8.5 MBS OFFLOAD AND QOS ....................................................................................... 107 8.5.1 MBS traffic flow for 120 MUEs ........................................................................ 107 8.5.2 MBS traffic flow for 90 MUEs .......................................................................... 110 8.5.3 MBS offload by 30 FUEs on Femto network .................................................... 113
9 CONCLUSIONS ................................................................................................ 114
9.1 TECHNICAL CONCLUSIONS .................................................................................... 114 9.2 IMPACT ON THE BUSINESS CASE ............................................................................ 115
9.2.1 Scenarios IA-1 and IA-2 – Impact on local urban corporate coverage ........... 115 9.2.2 Scenarios IA-5 and IA-6 – FAP coverage in urban corporate area (no initial macro coverage) ......................................................................................................................... 117 9.2.3 Scenario IA-3 – Impact on urban network coverage ........................................ 118 9.2.4 Scenario IA-4 – Impact on suburban network coverage .................................. 120 9.2.5 Impact of methodologies at system level .......................................................... 122

ICT-2488DocumentTitle of D
Freedom
Refere
[Alcate
[AMR-
[Barbar
[Cisco2
[Clauss
[Eyers0
[Falaki
[FIREW
[Freedo
[Freedo
[Freedo
[Freedo
[Freedo
891 STP t number: M5eliverable: Int
m_5D2_DUN
ences & S
el09]
-codec]
rossa05]
2010]
sen08]
00]
10]
WORKS-D2]
om-D21]
om-D31]
om-D32]
om-D33]
om-D41]
.2.2 terference chan
Nb.docx
Standards
Alcateand pTSG-R
3GPPspeech
Tech.
S. BaHouse
Cisco Forec
H. ClaConce
T. Eydelay”citese
H. FaEstrinSan F
] C. HoCalvo“Advanetwo
ICT Frequir[Onlinfreedo
ICT FidentifAvailafreedo
ICT FcoordAvailafreedo
ICT Fschemhttp://freedo
ICT Fprocedhttp://
nnel model at s
s
el-Lucent, pparameters foRAN WG4,
, “TSG-SA Ch codec; Inte
Rep. TS 26.
arbarossa, Me, Norwell, M
Whitepaperast Update, 2
aussen, L. Tept”, Bell La
yers and H. ”, 2er.ist.psu.edu
laki, R. Mahn, “Diversity rancisco, US
oymann, J. Eo, O. Muñozanced radioorks”, deliver
FP7-248891 rements anne]. om.eu/docum
FP7-248891 fication in able om.eu/docum
FP7-248891 dination protoable om.eu/docum
FP7-248891 mes in th/www.ict-om.eu/docum
FP7-248891 dures for /www.ict-
system level
picoChip Defor FDD HeNMeeting 51,
Codec Workinerface to Iu a
.102, 1999. [
Multiantenna MA, 2005
r, Visual Ne2009-2014, F
T. W. Ho, L. bs Technical
Schulzrinne2000. u/eyers00pre
hajan, S. Kay in smartphoSA
Ellenbeck, B.z, Y. Liu, Ro resource rable report 2
STP FREEnd first b
Availablments/deliver
STP FREEDthe femto
ments/deliver
STP FREEDtocols in the f
at: ments/deliver
STP FREEDhe femto-ba
ments/deliver
STP FREEDhandover
esigns VodaNB RF requ San Francis
ng Group: Mand Uu,” 3rd
[Online]. Ava
Wireless Co
etworking IndFebruary 201
G. Samuel, l Journal 13(
e, “Predictin[Online].
edicting.html
andula, D. Lyone usage”,
. Wolz, K. K. Hoshyar, Rmanagemen
2D2, Firewo
DOM projecbusiness mle rables/Freedo
DOM projec-based netw
at: rables/FREE
DOM projectfemto-based
rables/FREE
DOM projectased netwo
rables/FREE
DOM projecin femtoc
afone, “Simuuirements (Rco, USA
Mandatory spGeneration P
ailable at: htt
ommunicatio
dex: Global M10
“An Overvie(1), 2008, pp
g internet teAv
l
ymberopouloMobisys’10
Klagges, J. VR. Bestak, Znt algorithmrks EC-ICT
ct Tech. Repodel analy
at:om_D21SEQ
ct Tech Rep.works”, Jun
DOM_3D3.
t deliverable d networks”,
DOM_3D2U
t deliverable orks”, Jan.
DOM_3D3C
ct deliverablcells”, Nov
ulation assuR4-092042)”
peech codec;Partnership P
ttp://www.3g
ons Systems,
Mobile Data
ew of the Fep. 221-246
telephony cavailable
os, R. Govin0, June 15-18
Vidal, A. AguZ. Becvar, Pms for rela
project, July
p. D2.1, “Scysis”, Jun.
http://wQc.doc
. D31, “Intern. 2011. [O
http://w1INFOa.doc
D3.2, “InterNov.2011. [
http://wUPCe.pdf
D3.3, “Coop. 2011. [
CEAc.doc
le D4.1, “Adv 2011. [
8
mptions ”, 3GPP
AMR Project,
gpp.org
Artech
a Traffic
emtocell
all setup at:
ndan, D. 8, 2010,
ustin, E. . Mach,
ay-based y 2007
cenario, 2010.
www.ict-
rference Online].
www.ict-
rference [Online]
www.ict-
perative [Online]
dvanced [Online]

9
freedom.eu/documents/deliverables/FREEDOM_D41_CTUe.pdf
[Freedom-D511] ICT FP7-248891 STP FREEDOM project Tech Rep.M5.1.1,, “Definition of the system-level simulation framework and the femto-relays trade-off analysis”, Sept. 2010. [Online] Available at: http://www.ict-freedom.eu/documents/deliverables/Freedom_5D511DUNd.doc
[Freedom-D51] ICT FP7-248891 STP FREEDOM project deliverable D5.1 “Evaluation of the interference management algorithms and femto-relays tradeoff analysis”, Dec. 2011. [Online]. Available http://www.ict-freedom.eu/documents/deliverables/Freedom_5D1UPCa.pdf
[H.263] ITU-T, “ITU-T rec. H.263 Video coding for low bit-rate communication,” ITU, Tech. Rep., 2005. [Online]. Available: http://www.itu.int/rec/T-REC-H.263/en
[Ludwig06] R. Ludwig et al., “An Evolved 3GPP QoS Concept,” IEEE, 2006.
[Online] Available at: http://www.ericsson.com/technology/research papers/wireless access/papers/evolved 3gpp qos.shtml
[Mehlführer09] C. Mehlführer, M. Wrulich, J. C. Ikuno, D. Bosanska and M. Rupp, “Simulating the Long Term Evolution Physical Layer,” in Proc. Of the 17th European Signal Processing Conference (EUSIPCO 2009), Aug. 2009, Glasgow, Scotland.
[RFC3550] H. Schulzrinne, S. Casner, R. Frederick, and V. Jacobson, “RFC3550 RTP: A Transport Protocol for Real-Time Applications,” IETF, 2003. [Online]. Available: http://www.ietf.org/rfc/rfc3550.txt
[Rocket-3D1] Reconfigurable OFDMA-based Cooperative NetworKs Enabled by Agile SpecTrum Use (ROCKET) consortium, “Single User Cooperative Transmission Techniques for OFDMA Multi-hop Cellular Networks”, IST Project FP6-215282, Tech. Rep. 3D1, Jan. 2009. [Online] Available at:http://www.ict-rocket.eu/documents/Deliverables/ROCKET_3D1UPCi.pdf
[Rosenberg04] J. Rosenberg, “RFC3856 A Presence Event Package for the Session Initiation Protocol SIP,” IETF, 2004. [Online]. Available: http://www.ietf.org/rfc/rfc3856.txt
[Sjodberg02] J. Sjoberg et al., “Real-Time Transport Protocol (RTP) Payload Format and File Storage Format for the Adaptive Multi-Rate (AMR) and Adaptive Multi-Rate Wideband (AMR-WB) Audio Codecs,” IETF, 2002. [Online]. Available at: http://www.ietf.org/rfc/rfc3267.txt
[Yu09] C. Yu, W. Xiangming, L. Xinqi, and Z. Wei, “Research on the modulation and coding scheme in LTE TDD wireless network,” International Conference on Industrial Mechatronics and Automation (ICIMA 2009), May 2009, pp. 468 – 471

ICT-2488DocumentTitle of D
Freedom
List of ACK APN AWGNBER BS BW CDF CRC CSG CSIT DF DL ESM FAP FCS FDD FUE GA GO LOS LTE MBS MCS MIMO MNO MS MUE NACK NLOS OFDMOFDMOWRCPER PPS PS QAM QoS QPSK RB RE RRM RS RSSI RTP SDU SINR SNR SSID TDD TDMATWRCUDP
891 STP t number: M5eliverable: Int
m_5D2_DUN
f abbrevia
AcknAcce
N AddiBit EBaseBandCumCyclCloseChanDecoDowEffecFemtFramFrequFemtGeneGeneLine LongMacrModu
MultMobMobMacr
Not A
M Non Ortho
MA OrthoC One-
PackPackPackQuadQualQuadResoResoRadiRelayReceReal ServiSignaSignaServiTime
A TimeC Two-
User
.2.2 terference chan
Nb.docx
ations & s
nowledge ess Point Namitive White G
Error Rate Station
dwidth mulative Distr
ic Redundane Subscriber nnel State Infode and Forw
wnlink ctive SNR Mto Access Po
me Check Sequency Divisito User Equietic Algorithmetic OptimizaOf Sight
g Term Evoluro Base Statiulation and Ctiple Input Mile Network ile Station ro User EquiACK Line Of Sighogonal Frequogonal Frequ-Way Relay Cket Error Ratekets Per Secoket Schedulerdrature Ampllity of Servicdrature Phaseource Block ource Elemeno Resource My Station
eived Signal Time protocice Data Unial to Interferal to Noise Rice Set Idente Division Due division mu-Way Relay Datagram P
nnel model at s
symbols
me Gaussian Noi
ribution Funcncy Check
Group formation in
ward
Mapping oint quence ion Duplex pment m ation
ution ion Coding
Multiple OutpOperator
ipment
ht uency Divisiuency DivisiChannel e nd r litude Modul
ce e Shift Keyin
nt Management
Strength Indcol it rence plus NoRatio tifier uplex ultiplexing acChannel
Protocol
system level
ise
ction
Transmissio
put
ion Modulatiion Multiplex
lation
ng
t
dicator
oise Ratio
ccess
on
ion xing Access
10

11
UE User Equipment UL Uplink VoIP Voice over IP WNO Wireless Network Operator

ICT-2488DocumentTitle of D
Freedom
1 INThe puroptimizinetwork single fe Current adaptivepower c25.820])coordinasingle deand clusdegree o[Freedom The reqconstraincan be co The taskdense, infor each requiremfemto poparties. The maithe netwmethodofemtocelfairness. The purp
a) Cb) Hc) C
The topicapabilitcore netw The schalternativconsideralgorithmconvergeFurthermthe propknowled
891 STP t number: M5eliverable: Int
m_5D2_DUN
NTRODUCrpose of thing the presewith an app
emtocell inter
femtocells fae pilot powecapping and ). Indeed, acation/cooperaevice. On thestered resourof coordinatim-D32], [Fre
quirements innts on maximonsidered fro
k addressed inhomogeneosingle femto
ments on the opulation as
in goal foreswork plannologies devell is paid in
pose of this d
Can the whoHow does clCan the RRM
ic here addrety of the singwork and the
heduling on ve pricing red in order m and to thence of the
more by explposed resourcdge of the ma
.2.2 terference chan
Nb.docx
CTION is documentence of a denproach basicarfered by the
face the interer control, d
extended fctually impleation among e opposite, arces that canion with theeedom-D33]
n terms of mum latencyom a system
in the currenous distributioocell in the pbackhaul baa whole, req
seen within ting for theloped in W
n the perspe
document is
ole FAP deploustering affe
M deal with a
essed is to dgle FAPs ande femtocells t
the LTE frmechanismsto evaluate
he frequencyalgorithm deloiting the stce allocationacro interfere
nnel model at s
t is to analynse, distribually differente macro netw
rference probdynamic femfemtocell recemented tecthe different
a population be seen as
e core netwoand [Freedo
computationy admitted to
level point o
nt activity is on of FAPs. population (thandwidth), buquiring a very
this framewoe interferenP3, as in th
ective of ach
to answer th
oyment be reect network paggregated m
design new td on the shartrough the IS
rame structus to allocate the loss on
y with whicepends on thtatistical knon game yieldence activity
system level
yze methodsuted and clust from the op
work.
blem at PHYmtocell receiv
ceiver dynachniques on t entities andof femtocelleither interf
ork (topics som-D41] ).
n load, incro perform opof view.
to face the pThe target is
that is not scaut the (sub)oy limited am
ork is optimince managemhis approachhieving majo
he following
epresented asperformancesmetrics, refer
techniques bring of aggreSP backhaul.
ure of distrie power inn the data rach it is run.he number oowledge of thds a rate ver.
s and solutistered populaptimization (
Y level by imver gain mamic range (the market
d are basicallls can be bettference or usspotted in W
eased trafficptimization ad
problem of ns not the besalable and ca
optimal manamount of info
ization with ment is su
h some degror gains in
questions:
s a set of clus? rred to differe
based on the gated and slo.
ibuted resoun the joint ate due to t The numb
of iterations he macro-usery similar to
ions to addration of femwith selfish
mplementing anagement, m(e.g. standardo not enco
ly selfish appter viewed asseful resourc
WP3 and WP
c on the badaptation for
network planst suited interan be very deagement of thrmation flow
system scalb-optimal wee of optimterms of sy
usters and und
ent clustering
joint exploiowly varying
urce allocatitime-frequen
the running er of time and the numer activity it
o the ideal ca
dress the promtocells with
mechanisms
workaroundmobile phonrds [TS25.1ompass anyproaches tails spatially di
ces, dependinP4, for refere
ackhaul linkr resources a
nning in presrference man
demanding inhe interferen
w among the
lability. In thwith respect
mality for eacystem scalab
der which cr
ng hierarchy?
itation of theg metrics bet
ion algorithmncy plane htime of theslots needed
mber of activt has been shase assumin
12
oblem of hin a core s) of each
ds such as ne uplink 04], [TR form of ored on a istributed ng on the ence, see
and the allocation
ence of a nagement n terms of nce of the
involved
his sense, t to the ch single bility and
riteria?
?
e sensing tween the
ms using has been
iterative d for the ve FAPs. hown that ng perfect

13
The analysis are based either on a set of scenarios designed in 2A1 for common FAPs deployments, either on some scenarios designed ad hoc for the current tasks. In both cases, the methodologies will be tested highlighting the requirements for the FAP deployment in terms of
- Network hardware (e.g., FAP gateway, IP backhaul) - FAPs software (e.g., local processing load, sensing capabilities and dedicated channel for
signaling).
This task will be based on the analysis and implementation of approaches such as (but not limited to) time/power/subcarriers allocation strategies with low reuse patterns of the radio resources. System-level simulations are completed with an analysis of the femto-based interference impact, in the perspective of dense femto deployments. This is realized with a LTE coverage simulator that makes simple assumptions on the interference modeling and does not consider, in particular, inter-cell interference coordination. Simulations make profit of the path-loss models defined in [Freedom-D21] and enhanced in [Freedom-D31] to provide realistic SINR and throughput maps, then allowing the analysis of the femto interference versus a large number of parameters: FAP deployment scenario, FAP location inside the building, transmit power, traffic load, etc. The simulation methodology is detailed in section 3, supporting both the open- and closed-access modes. The results, given in section 8.1, may be viewed in two different ways: as a characterization of the useful and interference signal levels; but also as a pessimistic reference giving the network performance that would be obtained in absence of any specific interference mitigation technique. Six main scenarios have been investigated:
- Urban corporate FAP deployment within one floor, in presence of co-channel macro coverage;
- Urban corporate FAP deployment within one building, in presence of co-channel macro coverage;
- Urban corporate FAP deployment within a whole co-channel urban macro-cell;
- Suburban residential FAP deployment within a whole co-channel suburban macro-cell;
- Urban corporate FAP deployment within one floor, in absence of any co-channel macro coverage;
- Urban corporate FAP deployment within one building, in absence of any co-channel macro coverage.
Finally, the coverage simulations provide outcomes towards the engineering rules elaborated in activity 6A2 and towards the 2A3 business model analysis. For this later application, network capacity has been evaluated considering different traffic evolution scenarios (section 8.1).

ICT-2488DocumentTitle of D
Freedom
2 SCThe scenin this seof each scenariobuilding
2.1 B
[Freedom
Bi
B B
i The 5A2end-user
T D I
All threinvestiga3) focusinterest f
2.2 A
In view o
1. C2. I3. I
The techparticuladetailed AdditionpenetratiMUEs/Fto applicoverheadterminal Scenarioonly. Thnetwork point of
891 STP t number: M5eliverable: Int
m_5D2_DUN
CENARIOnarios of inteection for 5Aindividual 5s not referre used for sys
Business sc
m-D21] intro
BM1: Corpoinsufficient iBM2: CorpoBM3: Resideinsufficient i
2 simulationsrs, considerin
The above mDifferent FAInterference
ee business ated with theses on BM1,for operation
bstract mo
of the three m
Clustering, Interference Interference
hnical scenarar interest. Win 2D1, the p
nally to theion levels,
FUEs, an addcations runnid, ACK/NAC to the servin
os described he problem a
to be taken view of clus
.2.2 terference chan
Nb.docx
OS erest for systA2 tasks, wit5A2 task areed to a mappstem simulati
cenarios
oduces three
orate customeindoor cover
orate customeential customindoor cover
s aim at provng:
mentioned buAP and user d
managemen
scenarios are same level , which is junal deployme
odels
main problem
planning, analysis,
rios describeWhile the gpeculiarities
e scenario pFAP positio
ditional issueing on mobilCK and retrang BS (MBS
so far in 2Daddressed inin considera
stering and of
nnel model at s
tem simulatioth reference te detailed latped deploymions can be f
different bus
er in urban/drage and capaer in remote
mer in urban/rage and capa
viding results
usiness scenardeployments,nt techniques.
re addressedof priority. I
udged as theents.
ms addressed
ed in 2D1 wgeneral set u
of 5D2 indu
properties adoning (e.g., e addressed inle terminals.ansmissions
S or FAP).
1 consider thn 5A2 systemation, such af resources m
system level
ons and releto 2D1 businter in the de
ment, such asfound in the
siness scenar
dense urban aacity. area, withou/suburban areacity.
s to evaluate
arios, , .
d in 5A2 aIn particular,
e most challe
d in activity 5
will be addresup of the reuce to some e
ddressed in deep or lig
n the present. Simulationsof packet to
he FAP deplom-level simuas FAP gatewmanagement
vant deploymness and techedicated techs the homogdocument [F
rios:
area, with ex
ut macrocell nea, with exis
the service q
activities; ho, the activityenging in ter
5A2, which c
ssed taking iesidential/corextensions.
details in ght indoor) t activity is ts include dato reproduce
oyment on aulations invoway, IP gateat scheduler
ments are rephnical scenarhnical sectioneneous or in
Freedom-D51
isting macro
network. ting macroce
quality that is
owever they on interfererms of interf
can be summ
into account rporate envi
[Freedom-Doverall cell
the traffic loata packet genthe complete
physical intlves differenway, RRM a
r level.
ported in synrios. The spens. Details a
nhomogeneo1], Section 5
ocell network
ell network b
s experience
are not neence analysisference and
marized as
t some realizironment are
D51] regardl load andad in the netwneration, ince flux of dat
terference pent componenand control,
14
nthesis in ecificities about the us multi-
5.1.1.
k but
but
d by the
ecessarily s (Section of major
zations of e already
ing FAP d balance work due
clusion of ta from a
erspective nts of the from the

15
Several aspects of interference relations among transmitters can be inferred by direct measurements at PHY level. A complementary approach will be devoted to identify possible range of values of characteristic parameters, such as for example pathlosses, which will be useful for the purposes of the activity, devised in 5A2 and related to deployment peculiarities (e.g., FAP installed in several buildings, geographic location, etc.). In the first case, transmitters can perform either standard evaluations, such as SNR measurement, or by implementing targeted procedures (e.g. enable listening and identification phases for each FAP) to obtain a list of other transmitters and pathloss evaluation. Possible methods to address this task will be developed in another section of this document (see 4.1.2).
2.2.1 Buildings deployment
The basic parameters about the buildings deployment for residential suburban and corporate urban scenarios, are described in details in Section 5.2 of 2D1 [Freedom-D21]. Appropriate issues regarding the activity 5A2 have been included in that document. The realistic building deployments are
- Residential suburban scenario (from [Freedom-D21]); Femtocell areas are dropped with a random uniform distribution subject to a minimum separation. The density of femtocells is a variable in the simulations. Each femtocell area has one FAP that is assumed active, i.e. there is at least one active call/service. Each femtocell area is modeled as a 2-D rectangular house plus a surrounding lot. FAPs are randomly dropped within each house. FUEs are randomly dropped within each house or outdoor in the surrounding lot. MUEs are dropped uniformly and randomly within the macrocell. It is possible that some MUEs are dropped within a FAP area. MUEs are assumed to be indoor or outdoor.
- Corporate urban scenario (from [Freedom-D21]; Femtocells are deployed in urban building blocks, which are randomly dropped within the macrocell. Each femtocell block is represented by two stripes of offices separated by a street. Each femtocell block has L floors, where L is uniformly randomly distributed between 1 and 10.
- Inhomogeneous deployment: urban (used in clustering evaluation, i.e. devoted to investigate
properties of several kinds of transmitters grouping in different ways); Femtocells are deployed in a strongly inhomogeneous scenario with four nearby building (4 to 8 floors) at the vertices of a square. Size of buildings and dimensions of the square and streets in between can be varied in the simulator. Deployment of femtocells is homogeneous within each building along floors and households. Part of MUEs is deployed indoor on different floors of the buildings and part is deployed homogeneously outdoor in the cell. FUEs are attached to FAPs indoor only. Number of FAPs, number of FUEs, number of MUEs (indoor and outdoor) are among simulation parameters.
2.2.2 Distribution of users/femto
Rules for random users and femtocells distribution are described in [Freedom-D21]. A program is implemented in MatLab to automatically generate random building blocks, FAPs and UEs deployments. Figure 1 gives an example of residential deployment using the house model (i.e. 24m24m FAP areas) and distribution rules defined in Table 17 of [Freedom-D21]. Figure 2 illustrates a corporate deployment using the two-buildings-stripe model and reference distribution values defined in Table 18 of [Freedom-D21]. For clarity, the figure shows only the elements at street-level or ground-floor level; however FAPs and UEs are distributed within all

ICT-2488DocumentTitle of D
Freedom
buildinginter-site
Figurgen
Figurgen
891 STP t number: M5eliverable: Int
m_5D2_DUN
floors. The e distance.
re 1: Exampneral view (
re 2: Examneral view (
.2.2 terference chan
Nb.docx
deployments
ple of a res(a); All acti
mple of a cor(a); All acti
nnel model at s
s are generat
sidential deive and ina
rporate depive and ina
system level
ted within th
eployment; active FAPs
ployment; active FAPs
he central cel
only actives are displa
only actives are displa
ls of a macro
e FAPs areayed in the z
e FAPs are ayed in the z
o network w
e displayed zoom view
displayed zoom view
16
with 500m
in the (b).
in the (b).

17
FocusingintroduchousehohousehoThe effespecificaconsider
2.3 D
The analwill have
2.3.1 O
Clusterinscenariooptimiza
2.3.2 O
Similarlynumber transmitt
2.3.3 M
Activity depend oparameteVolcano
Cn
Cne
g on the effed, represenlds with alds/offices v
ective deployally to test ring strategie
Deployment
lysis of netwe increased c
One buildin
ng methods . Indoor pr
ation strategi
One buildin
y to the case of floors i
ters.
Figur
Multiple bu
5A2 will inon the builder from rea
oLab. Considering necessarily iConsidering necessarily explored in F
fect of the nnting penetraa couple Fvaries from 0yment will ta
different ces to mitigate
N Flo
Table 1
t complexit
work activity complexity, a
ng, single flo
will be firsropagation eies.
ng, multiple
of single floin a buildin
re 3. Schem
uildings
nvestigate adding block mal environm
that adjacein the same o
that adjacenin the sameFigure 4.
number of tation of FAPFUE/FAP in0.125 to 1 FAake also in clustering str
e or coordina
oors
2
3
4
1. FAPs den
ty
is focused toas number an
oor
st analyzed ieffects are c
floors
oor, clusterinng, leading
me for incre
dditional depmodel. The obments, such
ent offices boffice as FAPnt buildings e building a
transmitters Ps adoption inside. The AP (unity hoconsiderationrategies. Th
ate interferen
FAP d
N F
8
0.25
0.17
0.125
nsity inside
o address scand dimension
in a simple,considered
ng property eto a partiti
easing buil
ployments tobtained resuas adoptin
belong to thPs; belong to t
as FAPs; see
in a single in a certain
density oflds when eacn inhomogenhis is a mance.
density FAPs
16
0.5
0.3
0.25
e a single b
alable algoritns of floors a
, one floor bfor grouping
emerges withion criterion
dings struc
o determine ilts will be cg the prop
he same cor
the same coe different c
building, a area, given
f users/femtch householdneous distribacro-paramet
32
1
0.7
0.5
uilding.
thms and the and number o
building, resg users to
h more clarityn based on
cture comp
if and how tompared to agation prop
rporate unit,
orporate unitcorporate sc
parameter by the percetos couplesd has an acti
bution of tranter of intere
e scenarios coof buildings.
sembling a ctest the be
y when increinterference
plexity
the simulatiosimulations
operties prov
, then FUEs
t, then FUEscenarios that
has been entage of s in the ive FAP). nsmitters, est when
onsidered
corporate enefits of
easing the e among
on results adopting
vided by
s are not
s are not t may be

ICT-2488DocumentTitle of D
Freedom
Oe
Figur
represeInt
In view FUEs/FAare unifoonly indimplemetask, i.e.
- S- N
The effevarying in differe
FiguRi
o
891 STP t number: M5eliverable: Int
m_5D2_DUN
Or working wexisting urba
re 4. Schement possibleerference a
of analyzingAPs, a majorormly deployoor. An algo
ented, allowi:
Size of buildNumber of M
ects of interfnumber of Ment condition
ure 5: Examight: 3D vioutdoor/ind
.2.2 terference chan
Nb.docx
with real envan area (prec
me of severe deploymeamong tran
g network anr focus has byed both out
orithm to deping to modif
ding (width, lMUEs indoor
ference can fMUEs also ins. Figure 5 r
mple of an iew of the sdoor, respe
A)
B)
C)
nnel model at s
vironments, wcise building
al buildingents of buildnsmitters d
clus
d interferenceen given totdoor and w
ploy a variabfy a set of pa
length, numbr, MUEs outd
for example ndoor. This reports a visu
inhomogename distrib
ectively; in
system level
where the bucontour and
gs deploymedings, righ
deployed in stering crit
ce propertieso a deploymewithin each sible number (earameters wh
ber of floors,door, FAPs,
be addressedallows testin
ualization of
eous deplobution. Blared, circles
uilding moded height); see
ents and pat side repredifferent beria.
s for a strongent with four ingle buildine.g., 10 to 80hich have be
, ceiling heigmaximum d
d in the caseng macro/femf a possible d
yment. Lefack and blus represent
el is a precisedetails in se
atterns. Lefesents the s
buildings is
gly inhomogebuildings. In
ng, FUEs and00) of MUE, een considere
ght, size of stdistance FAP/
e of MUEs omto-network
deployment.
ft: highlighe stars rep
t FUEs, tria
e representatection 2.4.
ft side of fischeme on s coherent w
eneous distrin the cell ared FAPs are FUE, FAPs
ed of interes
treet in betweP/FUE.
outdoor onlyk resources a
ht of 4 buildresent MUangles FAP
18
tion of an
gures ground. with
ibution of ea, MUEs deployed has been
st for this
een);
y, or for a allocation
dings.
UEs Ps

19
2.4 R
Even mo Real Site-
pathenvithe p
Realdata
The objeis twofol To g To c
realireali
Realisticon the de
2.4.1 G
Geograp Outd Terr IndoFigure 6indoor re
Realistic dep
ore realistic d
l description -specific pat
h-loss modelsironment (difpath-loss shalistic MBS, , and depend
ective of runld:
get additionacompare resuistic but speistic deploym
c scenarios wensity of hum
Geographic
phical map dadoor 3D builrain altitude; oor partitions6 gives an exepresentation
Fig
ployment m
deployments
of the enviroth-loss modes simulate phffraction on badowing. FAP, UE an
ding on the F
nning scenari
l simulation ults obtained
ecific deployment were als
will be also sman activity,
cal map data
ata used in Flding layout;
s (optional). xample of oun of a real co
gure 6: 3D
models
may be obta
onment, alsoels defined inhysical interabuilding top
nd FUE deplFAP density a
ios based on
results aboutd from theo
yments; in pso caught fro
simulated fro as proposed
a
FREEDOM s
utdoor repreorporate build
outdoor bu
ained by the
o called geogin [Freedom-action betwes, reflection
loyments, baand FUE den
this realistic
ut interferencoretical and gparticular, weom analysis o
om the introdd in [Freedom
simulations w
esentation inding.
uilding lay
association o
graphical map-D21] and eeen the propaon building
ased on an ansity.
c deploymen
e in scenariogeneric deple can verifyof theoretical
duction of a m-D31].
will be comp
a European
out and ter
of:
p data. enhanced in agation wavefaçades, etc)
analysis of th
nt and enviro
os very close loyments to y if conclusil scenarios.
shadowing c
osed of three
n city and Fi
rrain altitu
[Freedom-De and the pro), then predi
the geograph
onment repre
to reality; those obtain
ions obtained
component d
e different la
igure 7 illust
ude.
D31]. The opagation ct part of
hical map
esentation
ned from d from a
depending
ayers:
trates the

ICT-2488DocumentTitle of D
Freedom
Figure
2.4.2 D
MBSs arthe cell eis a func Macro udeploymtaking in As wellbuildingFAP drothe horizbuildingRemark activity. Finally, constrain
891 STP t number: M5eliverable: Int
m_5D2_DUN
e 7: Indoor
Distribution
re “manuallyedge. This ca
ction of the su
users are rament scenarionto account th
, the FAPs ) but with a p
ops inside thzontal conto floors, withthat all rules
the FUEs ant on the FA
.2.2 terference chan
Nb.docx
r partition i
n of macro-B
y” distributedannot be donurrounding e
andomly andos. Indoor uhe real build
are randomprobability th
he horizontal our of a 2-flh a constrains for this FA
re uniformlyP – FUE dist
nnel model at s
inside a rea
BS/users/fem
d in the simune from a fixenvironment
d uniformly users are theding height pr
ly distributehat depends contour of
oor buildingnt on the m
AP distributio
y distributedtance. Here a
system level
al corporat(top view).
mtos
ulation enviroxed inter-site
(terrain vari
distributed en uniformlyrovided by th
ed in the hoon the builda 4-floor bu
g). Then FAminimum diston are not ye
d within builalso, the prec
te building .
onment to acdistance, asations, build
in the horiy distributed he geographi
orizontal planing height (m
uilding is twiAPs are unifo
tance betweet defined an
lding contoucise distribut
with surro
hieve a targethe coverag
dings).
izontal planin the diffe
ical map data
ne (providedmeaning that ice the probaormly distriben two FAP
nd will be de
urs, at the FAtion rules hav
ounding bu
et mean througe range of ea
ne, as for therent buildina.
d they drop t the probabilability it drobuted in the Ps at the samerived during
AP floor, anve to be deci
20
ildings
ughput at ach MBS
heoretical ng floors,
inside a lity that a
ops inside different
me floor. g the 5A2
nd with a ided.

21
Figure 8: Example of a urbaan corporatbuilding fi
te deploymirst floor is
ment; For cls displayed.
arity, only .
deploymen
nt in the

ICT-2488DocumentTitle of D
Freedom
3 IN This secfemto-baon systeinterfereof the inbusiness
3.1 Sy
LTE sysin this sethe calcuimpact oUE are t
3.2 L
The simu(SINR) locationsanalysis simulatioof the Mmaximumtraffic loresourceinterfereand ind[Mehlfühthroughp The LTEin the nfemto-pr No-F FAP
neigthis
The LTEUE femtuser or a The covmap gen One Seve
floor
891 STP t number: M5eliverable: Int
m_5D2_DUN
NTERFER
ction describased interferem-level simence modelinnterference ms models.
ystem assu
stem operatinection do notulation of anof the MAC the ones prov
TE coverag
ulation basicon downlins of the Useis extended
on of any paMAC layer p
m transmit poad (TL). Tes that are aence mitigatioependent. Fhrer09]. Reput enhancem
E coverage setwork descrofiles:
FAP subscribP-subscriber: ghbor FAP wFAP).
E coverage sto-profile. Ina femto subsc
verage simulanerally used i
outdoor-layeral indoor-lar heights.
.2.2 terference chan
Nb.docx
RENCE A
bes the simulrence, in the mulation, butng. The conclmitigation te
umptions
ng around tht consider ann effective slayer protoc
vided in Tabl
ge simulati
cally relies onnk (DL) whier Equipmento multiple
articular scherotocols, whpower times
This TL in thallocated to on technique
Finally, the mark that
ment from sp
imulator is acription, defi
ber: UE mayUE may be
when the UE
simulator pren that way, thcriber.
ation requirein this kind o
yer (or pixel gayers (or pix
nnel model at s
ANALYSI
lation tools perspective
t on coveraglusions of thechniques (b
e frequency ny particular signal to intecols and resoles 13, 14, an
ion
n the calculaich is calculnt (UE), i.e. floor recepti
eduling or reshere the total
the channelhe range frothe cell use
e, thus the seavailable spmulti-antenn
patial multipl
adapted to feining the acc
y be served be served by is located in
edicts serviche simulation
es a 3D pathof tool). It is
grid) for pathxel grids) for
system level
IS
and methodof dense fem
ge predictionhis analysis shbased on sys
2.0 GHz is cscheduling o
erference pluource allocatnd 15 of [Fre
ation of the elated over athe 2D pixe
ion heights. source allocal power recel path-loss (om 0 to 100ers. The MAet of resourcepectral efficnas are emplexing is not
emtocell deplcess mode o
by any MBS any MBS o
n a FAP area
ce coverage an provides a
h-loss map acomposed o
h-loss betweepath-loss be
dology that amto deploymns making should be use
stem-level si
considered. Tor resource aus noise ratition. The keeedom-D21].
effective signa 3D pixel el grid that This effectivation schemeeived from aincluding an0% represenAC layer abes allocated
ciency is givployed hereconsidered.
loyment by iof each FAP
or FAP in opor FAP in opa (assuming t
and spectral-a result that w
around each f:
en MBS/FAPetween MBS/
are elaboratements. This asome simpleed as a referemulation) an
The coveragallocation algo (SINR) thy parameters.
nal to interfergrid that repis usually cove DL SINRe, but rely onan interferingntenna radiatnts the averabstraction doby each cell ven by a S
e only for
introducing aP, and adding
pen access mpen access mthat the UE
-efficiency mwould experi
MBS and F
P to outdoor /FAP to indo
ed for analysanalysis doese assumptionence in the end elaboratio
ge simulationgorithm. Thehat fully abstrs for MBS,
erence plus nepresents all omputed in
R does not ren a simple abg cell is givetion gains) aage portion oes not consl is viewed aSINR mappidiversity ga
active and idg the concep
mode. mode, as weis part of the
maps for oneiences either
FAP (instead
UE. oor UE at dif
22
sis of the s not rely ns on the valuation on of the
ns studied ey rely on tracts the FAP and
oise ratio possible
coverage sult from
bstraction en by the and a DL of signal sider any s random ing table ain, thus
dle FAP’s pt of UE
ell as the e CSG of
e specific r a macro
d of a 2D
fferent

23
The mean path-loss and shadowing component are provided either by the analytical models (for theoretical deployment scenarios) or site-specific models (for realistic deployment scenarios) defined in [Freedom-D21] and [Freedom-D31].
3.3 Simulation workflow and Performance analysis
The simulation workflow is divided in the three successive steps illustrated in Figure 9. The first step defines the network topology. The macro layout is fixed, organized as two rings around a central three-sector site, as shown in Figure 10. The FAPs are randomly deployed into buildings within the three central cells. In studies based on a synthetic environment (i.e. buildings are represented by rectangular blocks separated by a 20m wide street), the buildings are randomly dropped in the study area. In study based on a real environment, a 3D geographical map data is used. Corporate buildings where FAPs are installed are randomly selected among the buildings located in the study area, using an average corporate building ratio. In both cases, buildings are divided in 100m² small areas, where at most one FAP is authorized to be installed. Then small areas with a FAP are randomly selected depending on a FAP density, i.e. percentage of small areas owning a FAP. Finally, the location of the FAP within the small area is generated from a random distribution law. A FAP is not necessarily active, meaning that there may be no user in communication with this FAP, except the user for which the coverage is simulated. The activation of a FAP is random, based on an average activation ratio in range from 0 to 100%. Coverage is simulated in the second step from respectively the macro-only and random two-tier networks. Outputs are 3D maps providing the service coverage area, the best-server and the available spectral efficiency at any possible UE location in the streets or in building floors. Two different FAP access modes are simulated: open or closed. In case of the closed access mode, two different types of user are simulated: FAP subscriber or non-subscriber. This simulation step includes a part of randomness, as a spatially-correlated lognormal shadowing term is added to the predicted mean path-loss. This lognormal term actually represents the unpredicted or mis-predicted part of the shadowing. This is an alternative to the error margin that is usually accounted in the radio planning simulation methodology. It permits a more realistic evaluation of the network performance evolution from the macro-only to the two-tier network topology, however at the expense of a time costly Monte-Carlo computation (composed of N random realizations as shown in Figure 9). The third step provides statistics on the coverage simulation outputs, and in particular compares the coverage performance in the macro-only and two-tier networks. Remark the second step (coverage simulation) is implemented in the VolcanoLAB platform, while the generation of the network topology and the LTE output processing are run in MatLab. This workflow has been facilitated by the development of VolcanoLAB-Matlab interface features that allows the simulation chain to be mostly automatic.

ICT-2488DocumentTitle of D
Freedom
3.4 Id
The impenhancemonly outpFAP den
891 STP t number: M5eliverable: Int
m_5D2_DUN
Fig
Figu
dentificatio
pact of femment is chartputs, femto-nsity into th
.2.2 terference chan
Nb.docx
gure 9: Out
re 10: Mac
on of femto
mtocell deploracterized byonly outputse network, F
nnel model at s
tline of the
cro layout a
-based inte
oyments in y comparisons and macro+FAP density
system level
simulation
and study a
erference i
terms of inn of the sim+femto outpuy into a build
n and analy
area in a re
impact
nterference bmulation outputs. This impding floor, F
yse procedu
eal environm
but also covputs: comparpact is studieFAP transmit
ure.
ment.
verage and rison betweeed as a functiit power, FA
24
capacity n macro-ion of the
AP access

25
mode, FAP location into the building (random, close to window, regular deployment, etc.), FAP distance to MBS, MUE distance to FAP (inside same FAP area, inside same floor, …) and network traffic load. Several inter-site distances are simulated to address both noise-limited and interference-limited macro networks. Co-channel macro and femtocell layers are considered. Highest priority is given to the investigation of the DL femto-to-macro interference in urban area. This is expected to be the most critical issue, where a dense femto deployment can significantly degrade the macro-layer coverage. Six distinct simulation scenarios have been designed so far, based on DL network coverage, and covering all 3 FREEDOM business scenarios: - Scenario IA-1: Evaluating the local impact of a single-floor corporate FAP deployment in an
urban macro-cell (addressing BM1). - Scenario IA-2: Evaluating the local impact of a multi-floor corporate FAP deployment in an urban
macro-cell (addressing BM1). - Scenario IA-3: Evaluating the impact of a dense corporate FAP deployment on the coverage
quality of an urban network (addressing BM1). - Scenario IA-4: Evaluating the impact of a dense residential FAP deployment on the coverage
quality of a suburban network (addressing BM3). - Scenario IA-5: Evaluating the local impact of a single-floor corporate FAP deployment in absence
of macro-cell signal (addressing BM2). - Scenario IA-6: Evaluating the local impact of a dense corporate FAP deployment in absence of of
macro-cell signal (addressing BM2). Results are given in section 8.1.

ICT-2488DocumentTitle of D
Freedom
4 IN4.1 C
The probdistancesto the cocase of t
4.1.1 G
The netwbuildingstructuregeolocat
- Tosu
- Gmag
- As
- Arfo
AlthoughoperationFAPs caaccuracy
4.1.2 I
From thwhereas course, pevaluate performa
4.1.2.1
The evadependinand optiman arbitr Case 1 iusers, aspathloss FUEs (la
891 STP t number: M5eliverable: Int
m_5D2_DUN
NTERFERClustering m
blem of cluss, classified
orrespondingtype or prope
Geographic
work infrastr or in anoth
e for the FAtion of a FAP
Triangulationof 1 m) thussoftware andup. For actuaGPS positionmeters requialready on generation. TAn approximstructure of tA different (reference, wfloor level, doperator cho
h the positions (signal pran anyway y required fo
Interference
he system’s is described
pathloss by it SNR. Difances in term
Pathloss
aluation of png on the permization of rrary number
is considereds for examplmatrix, sum
abeling colum
.2.2 terference chan
Nb.docx
RENCE Pmetrics
stering in a on the basis
g interferenceerties of serv
cal deployme
ructure provher. DependAP tier withP/FUE, come
n towards su allowing an
d needs to beal smartphonning which, ires a dedicathe market,
This is presenmate estimatethe subnetwo(although sti
whose accuradepending onoice.
oning througrocessing) whobtain the pr clustering i
e relation
perspective, d in terms otself is not ex
fferent stratems of through
pathloss amrformed systresources allof MUEs.
d for the optle FAPs in a
mmarizing thmns).
nnel model at s
PLANNIN
telecommun of their natue and pathlosice applicatio
ent
vides differending on the h varying les from the lo
urrounding Bn accuracy ofe run only onnes it is a buitogether wit
ated hardwareis planned
nt on most sme comes fromork the systemill raw) estimcy comes fron the cabling
gh triangulahich could npositioning iis within the
interferenceof SNR fromxhaustive unegies for thhput, call dro
mong transmitem analysislocation; case
timization ofa single buile pathloss am
system level
NG
nication netwure: it can bss or otherwons running
nt ways to amethod use
levels of acocalization c
BSs (whose pf order of tennce, when inilt-in operatioth assisted Gre and, althou
for some marthpones
m the IP numm can exclud
mate comes fom the deplo
g of the build
ation or GPSnot be alreadyinformation range of a F
e among tram the point onless includinhe allocatioops, change o
itters has be: the followie 2 consider
f transmissiolding, thus thmong the se
work is treatee a proper gise an abstraon the termi
assess if and ed, the systecuracy. Of
capabilities o
positions are ns of meters;stalling the son.
GPS, can provugh not incluadvanced min the marke
mber assignedde or includefrom the knooyment choi
ding. For the
S requires dy implemente
from the cFUE with its
ansmitters isof view of thng transmitti
on of the rof MCS (affe
een consideng case 1 is s the whole n
on resources he abstractiot of FAPs (e
ed considerieographical
act distance, nals.
how the FAem can evalu
course, the of the single d
known with; this methodsingle FAP, o
vide accuracuded in some
models and ft.
d to single FAe a FAP fromowledge of tices: it couldactual busin
devoted harded in all femompanion mFAP.
described ihe units depng power an
resources caecting energy
red from difocused on snetwork, inc
among one on has been e.g., labeling
ing several cdistance witas for examp
APs are instauate the int
accuracy adevices:
h an accuracyd requires a dor eventually
cy to the ordme of the FAP
for next com
APs. From thm a cluster; the femto-gad be to buildness models,
dware (GPS mtos in the mmobile termi
in terms of ployed in thend band assigan provide y consumptio
ifferent perssmall scale c
cluding macr
set or severlimited to c
g rows) and t
26
clustering th respect ple in the
alled in a erference
about the
y of order dedicated y at start-
er of few P devices mmercial
he known
ateway of ding or to this is an
chip) or arket, the inal. The
pathloss, e cell. Of gnment to
different on).
spectives, clustering o BS and
al sets of onsider a the set of

27
Case 2 outlooks the whole cell, thus, due to its complexity, further details will be provided in the second part of current Section. Case 1 The analysis of the pathloss matrix, providing the pathloss relation among all transmitters in the network, provide a method to group users on the basis of their capability to interfere each other and for transmitting with their intended counterpart (i.e., FAP-FUE or FUE-FAP). Since it is natural that a physical deployment of transmitters provides a scenario in which not all transmitters have appreciable interference from all others, several realistic cases are considered in relation to explicit scenarios, which allow inferring a clustered structure. We will address several methods to provide an estimate or a measurement of the pathloss matrix, i.e. a matrix with a number of rows (columns) corresponding to the index of MUEs (FAPs) whose elements are the relative pathlosses (e.g. in dB). Elements on the diagonal represent the pathloss of the signal from the transmitter to the intended receiver, off-diagonal elements represent the loss of power for the interfering components. For example, a computation ab initio shows that, for a regular type of building with several floors (the approach has been tested from 2 to 5 floors), the pathloss matrix shows a peculiar pattern with squares reflecting the floors distribution, as is visible in Figure 11.
Figure 11. Examples of pathloss distribution, in dB, for a single building with different number of floors: left, 27 FAPs, 3 floors; center, 64 FAPs, 3 floors ; right, 125 FAPs, 5
floors.
Figure 12. Example of pathloss distribution, in dB, for 3 nearby buildings, assuming a
homogeneous FAPs distribution within each one.

ICT-2488DocumentTitle of D
Freedom
Another panel ofintersecteach vertransmittbuildingfrom tho Case 2Considerdevelopecapabilitprovide assumedtime gridtemporalmacro netwo tiersthe adopand eval Indeed, sresourcesynchronpossible
- SIqotwibap
- Sad
The systfor each
- B- B- B
From anperiodic environm
891 STP t number: M5eliverable: Int
m_5D2_DUN
situation is f Figure 12.tion with neartical rectanters overlap s interfere w
ose on the sid
2 ring a singleed to computy of single tthe sensed S
d constant, thd of events l variation oetwork can bs could be impted scheme. luated in Sec
synchronizates appears unnization metsynchroniza
SynchronizaIn the first cquality to deof few ns. Tthe BS signawould be uimplementedbackhaul linaffected by processing. Synchronizaapply, worsedeteriorates
tem simulatotransmitting
Between BS Between MUBetween FA
n operational(for examp
ment, based o
.2.2 terference chan
Nb.docx
represented The colorearby sets. Frgle in dashewith those n
with all from des. Such a s
e cell, a geoute pathlosstransmitters tSNR at each he instantaneallocations if the SNR hbe temporallymplemented
Synchronizaction 6.1.3 of
tion is a verynlikely in ththod, the cluation cases: B
ation BS/femcase, one haecode pilot s
This is not thal has very bunlikely to d (e.g., alwank would dean arbitrary
ation FAP/FAened by coneven faster th
or evaluates g unit with re
and MUEs, UEs and FUE
APs and FUEs
l point of viple, at starton preambles
nnel model at s
by the depled circles grrom the pathed line reprnearby buildithe central bituation is in
ographical deand SNR
to evaluate psimulation t
eous SNR deis at the ms
has a compley independenor not, depenation at systef [Freedom-D
y demandinghe addressedustering proBS/femto-net
to-network. as to supposesymbols or pe case whenbad quality. register to
ys register toepend on a
random var
AP. For thisnsidering thathat the link t
pathloss relaespect to all o
FUEs, FAPsEs; s, MUEs.
iew, this cout-up and ats or pilot sym
system level
loyment of Froup FAPs ihloss matrix,resents a cluings, thus 2 building, and
ndeed very co
eployment osensed by a
pathloss withtime epoch. epends on th
scale (in coex varying tent from the fnding on opeem level andD51].
g task whose d scenarios aocedures are twork and FA
This can be e that the B
preambles to n the FAPs ar
In fact, if ththe FAP,
to the FAP, wsignal sent
rying delay w
s case the sat when FAPto the BS.
ations followothers:
s;
uld be achiet the minutmbols with k
FAPs in neain a specific, representeduster. This efrom the lef
d 2 couples fommon.
of transmitterall transmitteh respect to aAlthough in
he sequence oompliance wexture on thefemto-netwoerators netwoimplications
complexity and use case
speed up. AP/FAP.
either througBS is in rang
perform synre deployed he signal of
unless somwhen in ranthrough thewhich would
ame considerPs are distrib
wing the pro
eved by supptes time-scaknown power
rby buildingc building, ad in the rightexample is dft-most and 2from the cen
rs is given. ers. The simall other trann a static scenof single tran
with the LTEsame time s
ork, as synchrork design ans have been e
and cost in tes. If the opLet us brief
gh the radio ge and the sinchronizationin absence othe BS wou
me other mge). Synchro
e IP networkd not be con
rations expobuted, the rad
pagation mo
posing that ele) sensing r values.
gs, as depicteand every seht panel of Fdesigned suc2 form the rintral interfere
A software mulator emunsmitters in rnario pathlonsmissions.
E frame strucscale. Eventu
hronization amand can be drextensively d
terms of metperator implfly examine
link, or the bignal has a sn process upof macro BSuld be good,
mechanism wonization thrk, but this wntrolled by t
osed for the dio link amo
odels detaile
each unit peof the sur
28
ed in left et has an igure 12, ch that 2 ight-most e with all
has been ulates the range and ss can be Since the cture) the ually, the mong the ropped in discussed
thods and ements a the two
backhaul. sufficient
p to order S or when
the FUE would be rough the would be the femto
last case ong them
d in 2D1
erforms a rrounding

29
4.1.2.2
The sysagreemeand to SAt each network,
For eachregards traffic simplemespecific apply a streaminhigher Dregisterethe UL.
Figur/FUEYell
The temgraphicsinhomogunits andsome FA(MBS inquantity can be ad
SINR
tem simulatent with the Section 5 of
time epoch,, thus provid
h receiver, Dall MUEs, w
scheduler anented time grequirementscheduler w
ng applicatioDL data flowed to that FA
re 13. ExamEs(circles) low triangl
sym
mporal evoluts in Figure 1geneous depd MUEs are APs are recen UL) and th
whose fast dopted as a s
tor implemeLTE frame [Freedom-D, the simulat
ding the insta
DL/UL subfrawhile the femnd thus DL/grid can pickts of the acce
with an even ons, it could w. AlternativAP, each requ
mple of an idistributede representmbols tran
tion of the S3 and Figureloyment of mainly outd
eiving and sohe FAP netwtemporal behslowly varyin
ented by DUstructure (re51] for a detor reproduceantaneous SIN
ames are in mto-network/UL phases ked from thess point. Fosharing of Uadopt an sh
vely, the chouiring a diffe
nhomogened in 4 nearbts the BS. F
nsmitting on
SINR depende 14 represenFAPs in fou
door: in Figuome others a
work is still ihavior is evang metric de
UN reproducefer to sectioetailed descries to milliseNR for every
an ordered sk can be mor
could be hose reportedor example, aUL/DL trans
haring with moice could beerent type of
eous deployby buildingFilled symbnes: in this
ds on the insnt two instanur adjacent bure 13 MUEare transmittin a composialuated at sy
escribing syst
ces the sequons 6.2.1 andiption of theecond scale ty unit due to
sequence. Thre complex ainverted wi
d in Table 2a FAP handlsmission oppmore room fe also driven
f service and
yment of 1gs and 100 bols represe timeshot M
stantaneous nts of time (obuildings. Fi
Es (squares) ating. In Figuite activity.
ystem level.tem (or of a p
uence of trad 6.2.2 for so
transmissionthe activity oall transmitt
he texture foas each FAPth respect t
2 on p. 49, ing VoIP apportunities; ifor the DL pn by the numthus assignin
00 couples MUEs (squent receivinMBS is in D
DL/UL activone millisecoilled markerare receivingre 14, all MThe evaluateThe averagepart of it) pro
ansmission eome technicn events proof transmitteters in range.
or the macroP has an indto other FAwhich are r
pplications onin the case ophase to copmber of actiing more tim
FAPs (triauares) outdng units, emDL.
vity of all uond subfram
rs represent g (BS is in D
MUEs are traned SINR is ae value of suoperties.
events in al details
ocessing). ers in the .
o-network dependent APs. The related to nly could of video-pe with a ive FUEs
me slots to
angles) door. mpty
sers. The me) for an
receiving DL) while nsmitting a varying uch SINR
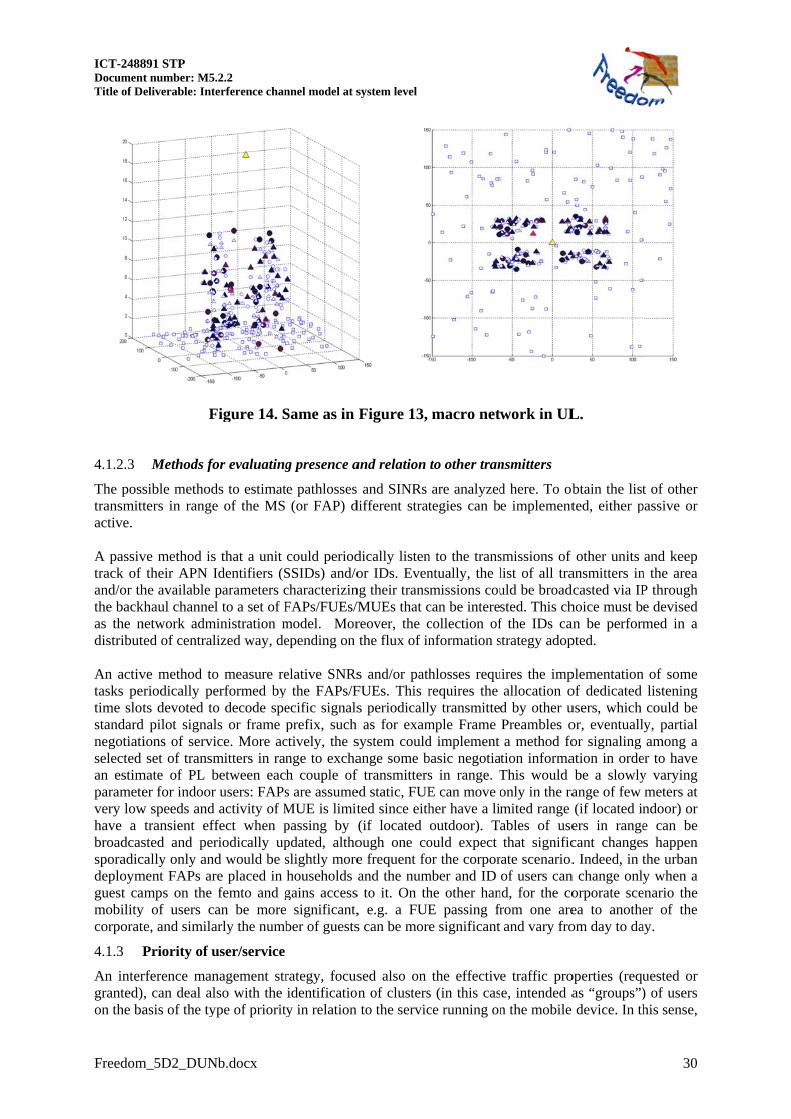
ICT-2488DocumentTitle of D
Freedom
4.1.2.3
The posstransmittactive. A passivtrack of and/or ththe backas the ndistribut An activtasks petime slotstandardnegotiatiselected an estimparametevery lowhave a broadcassporadicdeploymguest camobilitycorporat
4.1.3 P
An intergranted)on the ba
891 STP t number: M5eliverable: Int
m_5D2_DUN
F
Methods fo
sible methodters in range
ve method istheir APN I
he available khaul channenetwork admted of central
ve method toriodically pets devoted to
d pilot signalions of serviset of transm
mate of PL ber for indoor
w speeds andtransient effsted and percally only anment FAPs aramps on the y of users cte, and simila
Priority of u
rference man, can deal alasis of the ty
.2.2 terference chan
Nb.docx
Figure 14. S
for evaluating
ds to estimate of the MS
s that a unit Identifiers (Sparameters cl to a set of F
ministration mlized way, de
o measure reerformed byo decode spels or frame pice. More acmitters in ranbetween eacr users: FAPs
d activity of Mffect when priodically upd would be sre placed in femto and gan be morearly the numb
user/service
nagement strlso with the ype of priorit
nnel model at s
Same as in
g presence a
te pathlosses (or FAP) d
could periodSSIDs) and/ocharacterizinFAPs/FUEs/Mmodel. Morepending on
elative SNRsy the FAPs/Fecific signalsprefix, such
ctively, the snge to exchah couple of s are assumeMUE is limitpassing by pdated, althoslightly morehouseholds gains access significant,ber of guests
rategy, focusidentificatioy in relation
system level
Figure 13,
and relation
and SINRs different strat
dically listenor IDs. Even
ng their trans/MUEs that creover, the cthe flux of in
s and/or pathFUEs. This rs periodicallas for exam
system couldange some bf transmittersed static, FUEted since eith(if located ough one coe frequent foand the num
s to it. On th, e.g. a FUEs can be mor
sed also on n of clustersto the servic
macro net
to other tran
are analyzedtegies can b
n to the transntually, the lmissions cou
can be interecollection ofnformation s
hlosses requrequires the ly transmittemple Frame d implement basic negotias in range. TE can move oher have a limoutdoor). T
ould expect or the corpor
mber and ID he other hanE passing fre significant
the effectivs (in this casce running on
work in UL
nsmitters
d here. To obe implement
smissions of list of all trauld be broadsted. This chf the IDs castrategy adop
uires the impallocation o
d by other uPreambles oa method fo
tion informaThis would only in the ramited range ables of usethat signific
rate scenario.of users can
nd, for the cofrom one are
and vary fro
e traffic proe, intended an the mobile
L.
btain the listted, either p
f other units ansmitters indcasted via IPhoice must ban be performpted.
plementationof dedicated users, which or, eventuallor signaling ation in ordebe a slowlyange of few (if located iners in rangecant change. Indeed, in t
n change onlyorporate sceea to anotheom day to da
operties (requas “groups”)
e device. In th
30
t of other passive or
and keep n the area P through e devised med in a
of some listening could be y, partial among a
er to have y varying meters at ndoor) or e can be s happen the urban y when a
enario the er of the
ay.
uested or ) of users his sense,

31
we can for example distinguish among voice, web browsing, video streaming and so on. Priority for an operator would focus on guaranteeing QoS first on basic services, than on delay tolerant applications. Similarly, resources allocation can rely on the type of service requested by a terminal, such that an optimization strategy can assign priority of a service (e.g., voice) with respect to others. An overall fairness criterion can depend on the quantity of services running on each terminal and on the requirements that such services have to run.
4.1.3.1 Type of service
Simulations will consider VoIP, web browsing, streaming as the main types of service to simulate. Different types of data flux can be represented as FTP or video/audio streaming by tuning parameters of generation (e.g., average packets dimensions depending on coding, interarrival time) which are proper of the specific application and can be considered more or less relevant applications with respect to others, in view of the different requirements on latency.
4.1.3.2 Traffic load/QoS
Different services can be grouped on the basis of traffic load and/or QoS to run. A fairness policy could consider this characteristic as a reference, thus leading to a different fairness criterion.
4.1.3.3 Latency
Some services are not delay-tolerant and pose the most stringent requirements on packet queues. Evaluation of backhaul quality will be considered for its impact on packets delay and jitter affecting IP traffic from the FAPs, providing input to the business model treated in WP2. This aspect can be dealt at radio level (considering link quality improvement) or at scheduler level, assigning more time slots for transmission to impaired users with longer queues to digest.
4.1.4 Interference based on users activity
Different activity profiles can be defined from a selection of characteristics above mentioned: for example, a type of activity can be a high latency tolerant application with high traffic load (e.g., ftp).
4.2 Clustering at system level
The mentioned distances and the related metrics can be treated at a local or at centralized level, as well as with different levels of hierarchy. In fact, a distributed algorithm can be locally run to identify a set of transmitters interfering each other in view of feeding back to the RRM a slowly varying metric describing an aggregate measure of the transmission properties characterizing such local cluster. This is provided by:
- Overall capacity/throughput of the local cluster - Distribution of throughput among transmitters belonging to such cluster - Distribution of SINRs among such transmitters - Fairness of the resources allocation - Number of disconnections.
The possible metrics will allow the comparison among different solutions, thus considering the benefits of the clustering strategy on the overall network.
4.2.1 FAPs clustering
Given a deployment of N FAPs, the system can be represented as p clusters 1 , …, n. Each cluster
a, a=1,…,p, is a set of FAPs including a FAPs each, so that 1
p
aa
N
, since it can also be verified
that a b , i.e. a single transmitter can be included in two separate clusters. Labeling the
FAPs by j, j=1,…,N, the overlap between any two clusters composed as

ICT-2488DocumentTitle of D
Freedom
is measu In view and testereduce it Based onusers cananalysis is to reduthe FAPbuildingr2+s1 FA The phythe inter(r1 and r2
Thus, in GO or itan advanthe bordif the nucluster. Iimplies l Dealing For the s
- Blbu
- Clwhin
- Su
The bestsub-sets:process belonginimplemeinterfere
891 STP t number: M5eliverable: Int
m_5D2_DUN
ured by r whe
of large popued for the Gets complexity
n the criterian be introduthe criterion
uce the wholPs deployed i
B1 and s2 in APs and the c
sical charactrference amo2, respectivel
case an optit is split intontage if the ser effects, qu
umber of FAIf this is notless complex
with bordersake of clarit
locks: FAPsuilding. Som
luster: FAPhich is proce
n an adjacent
ub-set: any s
t-case for pa: in this eveN independ
ng to a certaent a strategence scheme
.2.2 terference chan
Nb.docx
n1={
en r FAPs be
ulation deploenetic Optimy from the w
a mentioned iuced. For then based on thle set into p sin two nearbB2. A portio
cluster 2 is g
teristics of thong FAPs wily) interfere
imization proo p sub-sets tsystem, in teuantified by
APs belongint verified, thxity than the
r effects is a ty, we specify
s grouped inme of them ca
s grouped inessed in a sinone.
sub-group wi
arallelizationent, the coment computa
ain sub-set ingy to deal wamong FAP
nnel model at s
1, …, s},
elong to both
oyments, themization (GO)whole set of F
in section 4.e sake of clahe pathloss msub-sets a (
by buildings, on r1 of s1 intgiven by r1+s
he deploymenthin the samalso with som
ocess is implthat are procerms of pathr1 and r2, are
ng to both clhe system is management
focal point fy the meanin
n terms of tan receive int
n terms of thngle optimiz
ithin the set o
results whemplexity of tations. The cnterferes witwith the pars belonging t
system level
n2={s-r, s
h sets.
e algorithm s) algorithm dFAPs to ever
1 (and its subarity, we wilmatrix. Whena=1,…,p), in B1, B2 (for
nterferes also s2 FAPs.
nt can be refme building (e
me FAPs in
lemented, eitcessed in parhloss distribue computatiolusters is lesnot reducedt of the whol
to express thng of the term
their geograterference fro
heir interferenzation run, e.
of N FAPs.
en the wholethe optimizacomplexity th some FArameters proto different s
-r+1, …, t}
scalability pedeveloped inry single a.
bsections), all use as a ren a FAP can nterpreted assimplicity, pwith r2 of s
flected by thee.g., s1 or s2)the building
ther the entirallel. The ad
ution, can beonally feasiblss the numbed to a set of le system at
he efficiencyms adopted f
phical locatiom other tran
nce relation..g., those wi
set of FAPsation dependgrows when
APs of anotheovided by twsub-sets) ind
t>s ,
erformances hWP3, outlin
a formalism teference exabe assigned
s clusters. Anp=2): supposs2. The cluste
e structure o) is dominantnearby.
re set of FAPdoption of a c split into sule such that rer of FAPs bsub-systemsonce.
y of the parafor treating th
ion, e.g., thnsmitters in o
A cluster isthin the sam
s can be splids on the han an increasier sub-set anwo (or moreependent opt
have been inning some m
to describe cample to desd to a sub-setn example is se that s1 FAer 1 is const
of the pathlosnt while some
Ps is forwardclustering crub-systems fra < sa a=1belonging tos whose man
allelization ahe scalability
hose within tother blocks
s the sub-setme building p
it into N indardware capaing number nd the systere, dependintimizations.
32
ntroduced methods to
lusters of scribe the t, the task given by
APs are in tituted by
ss matrix: e of them
ded to the riterion is for which ,…,p, i.e.
o a single nagement
lgorithm. y issues:
the same .
t of FAPs plus some
dependent ability to of FAPs m has to g on the

33
Figure 15. Scheme of clustering with different hierarchy levels. Different colors
represent difference clustering criteria adopted (abstract distances) whose knowledge can be available to the network through dedicated tables.
4.2.2 Centralized clustering
The RRM can collect all users’ information and transmission parameters, although for a huge deployment of FAPs this would lead to shortcomings related to the amount of data and to requirements on processing. A more realistic approach for the network to have control on possible clusters of users supporting adaptation of heterogeneous users requirements arises from the possibility to deal with aggregated slowly varying metrics got from local subclusters or measured with a timing of order of minutes, or tens of minutes, to have an overall scheme of the traffic levels and services.
4.2.3 Local clustering
Users are aware of others transmitters in range and implement one (or more) of the clustering strategies among mentioned.
4.2.4 Hierarchical clustering: subclusters
Once a cluster is identified, the value of a metric (as mentioned above) considered over the current cluster is available. A cluster can be isolated if only transmitters belonging to it are in range. If some transmitter belonging to that cluster receives the interference of transmitters external to that cluster, one can identify the presence of other clusters. Using the information running through the femto gateways, it is possible to identify and classify clusters of clusters. This way, aggregated information can be fed back to the RRM with limited load on the network in a semi-centralized way.

ICT-2488DocumentTitle of D
Freedom
5 INIn this sinterfereassumingon selfisclusterinobtainedmanagemimpleme
5.1 S
The infoimplemeboth casuse them A functiin rangeinhomoganalyzinprovide develope Let us debe receivspecificisurrounddesignedtradeoff permits ta (reducperform For an uinterferesuch numdistributunits. Codeploymclusterinmanagem
891 STP t number: M5eliverable: Int
m_5D2_DUN
NTERFERsection the cence mitigatig a clusterizsh approacheng structure d by decompment. This henting or not
ensing cap
ormation avented as an ies, metrics t
m for paramet
ion of the sye of a selegeneous or fng their inter
a benefit toed by SIR, al
efine the signved with a mities of the Lding users ind for activitysuitable for to consider a
ce) level of ca local optim
urban environers is indeed mber can vartion is reportonsidering t
ment resemblng analysis ment (at core
.2.2 terference chan
Nb.docx
RENCE Mclustering stion from a ation strateg
es. Evaluatio(e.g., cluster
posing the pas as a byproclustering cr
pability
vailable to einput for disto evaluate syters assignm
ystem simulaected user. from real mrference rela the system.lthough conc
nificant interminimum SNLTE and typn active statey 5A1 and the analysis
a transmitter communicatimization proc
nment, Figurlimited and
ry of some unted in Figurehat the scenles a realisticfor network
e level) and f
nnel model at s
MANAGErategies abonetwork po
gy and to comon of pros anrs must haveroblem of (soduct the evariteria for an
each transmistributed optystem perfor
ment.
tor has beenEvaluation
ap data) andations in ord. Figures preclusions appl
rferers as theNR. Such leve
ical environme and suffersreported in performed inin range bothion, such as cess.
re 16 displayis given by
nits but it is e 17 and sho
nario analyzec one withou
k managemenfor distribute
system level
EMENT ove introduceoint of viewmpare with ond contras oe a small ovsub)optimal aluation of h
n inhomogene
itter about ttimization prrmances can
n developed tconcerned
d a deploymder to selectesented in thly similarly t
e transmittersel must be coment propags the impact[Freedom-D
n this Sectionth an interfer one that co
s, at a fixed at most by anyway limiows how theed corresponut specific lint. Indeed,
ed algorithms
ed are discuw. The purpooptimization f methods is
verlap) and oresources as
how interfereeous deploym
the surroundrocedures, ei
n rely on such
to extract nuthe set up
ment of usert the clusterhis Section rto other scen
s in range caponsidered as
gation conditt of the MBS
D51] about tn has been fi
rer as well asould be inclu
instant of tim12 other useited in the rae majority onds to a reaimits, this recomplexity
s
ussed at systose is to ascriteria desc
s based mainon the compssignment wence, and thument.
ding environither fed to h informatio
umber and id of a scens (MUEs, Fing scheme refer to the arios.
pable to tran a threshold tions, averagS DL. Followthe dynamic ixed to a levea unit with w
uded in a clu
me, how the ners. Simulatioange of less tf clusters is l environmeesult supportis reduced
tem level inssess the becribed in WPnly on reliabplexity reducwith respect us QoS, is af
nment can bthe core net
on and the sy
dentity of tranario (homoFUEs and FA
more approScenario N1
nsmit a signawhich must
ge interferencwing the sim system simel of 1 dB. Twhich is stilluster, for ex
number of sions have shothan 20. The
composed bent map datats the signifiboth for ce
34
n view of enefits of P3, based bility of a ction gain to global
ffected by
be either twork. In
ystem can
ansmitters ogeneous, APs) and opriate to 1 and N5
al that can t consider ce due to mulations
mulator, a This value l possible
xmpale to
ignificant own how effective
by 4 to 8 a and the ficance of entralized

35
Figurescenar
Figure
5.2 Sy
Inputs anon the ninduce dby the Pcan be rMBS ormetrics bThe systbackhau
5.2.1 S
The adoapproachto be conconvergeThe necalgorithmusers.
e 16. Numbio N5, with
e 17. Distrib252 UEs
ystem eval
nd outputs fonetwork. Thedelays on datDU-ER for treliably relatr a FAP). Pbased on avetem has bee
ul.
Slowly vary
option of onhes in view onsidered notence and nec
cessity of a mms and to the
ber of interfh 252 UEs, o
bution of ns, of which
luation
or the resource time of pacta flow suffethe traffic floted to the linerformanceserage values en tested in
ying metrics
ne or more of a possiblet only in termcessity to excmetric with e stability of
ferers to a sof which 19
number of i199 FUEs,
ces allocatiocket allocatiered from apow. Thus, a snk quality be of groups characteriziterms of di
slowly var reduction of
ms of complechange informslow variati
f the choice o
single user99 FUEs, 4
interferers 40 MUEs i
ons for all useion and repepplications rustrategy aimietween eachof users can
ing the statusifferent aggr
rying metricf computatioexity of the mation with ion with tim
of a set of par
r, shown for0 MUEs in
to a single indoor and
ers corresponetitions due tunning on ming to increa
h user and thn be implems of the systeregated metr
cs will be con for the algsingle algoriother entitie
me is relatedrameters lead
r a fixed in
ndoor and 1
user. SIR s
d 13 MUEs
nd to series oto errors of Aobile terminse packet flu
he serving Bmented by cem and slowrics and of
considered tgorithms. Theithm, but alss of the netw
d to the convding the tran
nstant of tim13 MUEs o
scenario Noutdoor.
of packets traACK/NACK
nals and are mux for groupsBS (which caconsidering awly varying w
requirement
to compare he computingso in terms owork. vergence tim
nsmissions fo
me. SIR utdoor.
N5, with
ansmitted K process measured s of users an be the aggregate with time. ts for the
different g load has of time of
me of the or a set of

ICT-2488DocumentTitle of D
Freedom
The mosaverage
1) Aveof tr
2) Aveinfo
3) Aveexpa coof n
A servicthat usersystem sMCS anmore favconsidersame doand a miwhich, dset a strofrequentBoth cas
The follFigure 1
Figure
Several eof 120 dUEs. Figure 1relativelyMUEs o
891 STP t number: M5eliverable: Int
m_5D2_DUN
st fruitful mepower increa
erage SNR. Iransmission
erage pathlosormation ind
erage power penditure oveonsequence onet data prod
ce running onr and can gisimulator. Innd transmissivorable MCSred in [Freedocument). Indinimum servdue to PDU-onger MCS tly but with fses are well t
lowing plots8.
e 18. Deplo
evaluations odB can be co
19 reports thy few users
outdoor. Few
.2.2 terference chan
Nb.docx
etrics considease.
It measures tand activity
ss. Althoughependent on
increase. Ger the effectivof bad PDU-
duced by an a
n a mobile teive rise to twn the first caion power, sS. The averadom-5D1], Sdeed, in that ice must be ER level, shwith fixed p
fewer errors,treated by co
s refer to th
oyment of S
of pathloss aonsidered as
he average pare below sindoor users
nnel model at s
ered so far ha
the transmissof surroundi
h is providesactivity of o
iven a periove transmitti-ER, force thapplication.
erminal prodwo interestinase, the applio that the syage SNR per
Section 6.1.5case the SN
ensured to uhows an increpower, gaini, thus offload
onsidering the
he Scenario
SIR scenariindoor an
and simulatioa value to d
athloss in dBsuch threshos and most ou
system level
ave proven to
sion quality fing users.
s a rough meother users.
od of transmiing instants ohe transmitte
duces a data ng options foication data ystem sets a r user is at t, the so-calle
NR is the leausers. The secease of data ing a better Pding the quee above men
SIR N1, wh
io N1, withnd 8 MUEs
ons performedistinguish a
B between eold. First 98 utdoor ones
o be average
for the link s
easurement o
ission, averaof time. Repeer to spend m
flow that coor the trafficflow is too higher trans
the basis of ed “target po
ading criteriocond case is queue to be
PDU-ER andeue and provntioned metri
hose geogra
153 UEs, os outdoor.
ed in [Freedomajor impac
each transmiIDs are FUare under a s
e users SNR,
serving a use
of the link q
age power is etitions of pamore energy
ould saturatec scheduler, high to be s
smission powthe method
ower” (see Son to assign pgiven by an
e processed. Td then transm
viding a bettecs.
phic deploy
of which 98
om-D51] sugct of the MB
itter and the Es, then 47 significant in
average path
er. Depends o
quality, it pro
s given by thackets, for ex
for the sam
e the slots asboth includ
served by thwer with inc
for power aSection 5.1.4power to traapplication dThus, the symitting packer service to
yment corres
8 FUEs, 47
ggest that a tBS transmissi
MBS, showindoor MU
nfluence of th
36
hloss and
on power
ovides an
he energy xample as e amount
signed to ed in the
he current reasingly
allocation 4.3 of the ansmitters data flow
ystem can kets more
the user.
sponds to
MUEs
threshold ions over
wing how Es and 8 he MBS.

37
Figure
The analin rangeInclusionin the fig
Figure
e 19. Distri
lysis of Figue, expressed n in a clustergures by colo
20. Distrib
bution of p
ure 20 and Fby the pathlr at system leors blue to re
bution of pa
pathloss in d
igure 21 proloss values ievel and mea
ed.
athloss in d
dB for all t
ovides a cleain dB and casurement o
dB for all co
transmitter
r signal of thonsidering tf average SN
ombination
rs vs MBS.
he limited nuhe sets FAP
NR can inclu
ns FAP/MS
SIR scena
umber of traPs/UEs, of Fude only user
S. SIR scena
rio N1.
ansmitters FAP/FAP. rs spotted
ario N1.

ICT-2488DocumentTitle of D
Freedom
Figur
5.2.2 B
Simulatitogether among uminimumand jitteanalysis
5.3 S
5.3.1 C
In both evaluatiooptimizasignificaLet us debelongin Labelingcluster for everyFAPs lyvalue of eqs. (1)-values fo
-
-
Finally, values obrelated tthresholdthe FAP
891 STP t number: M5eliverable: Int
m_5D2_DUN
re 21. Distri
Backhaul lo
ions considerwith the loa
users. Differm guarantee)er, as input f
of the impac
calability
Cluster leve
centralized on (slowly-vation algoritant computatescribe how ng to more th
g the genericpj providingy user in the
ying within tf parameters -(2)) before ror the next ru
- for FAPs
- for those
two stop cribtained at twto the assignd when the ss to be used
.2.2 terference chan
Nb.docx
ibution of p
oad
red the effecad required bent levels of), good or avfrom WP6, act of backhau
el
and local varying) metthms, especitional load, can optimizat
han one clust
c cluster as pg a set of outpe cluster. Onthe intersectibefore procerunning the un is chosen
s parameters
e rj FAPs pa
iteria are imwo successivenment of thestop is reachefor transmiss
nnel model at s
pathloss in
ctive backhauby the optimf backhaul qverage (e.g., and are usefuul quality has
clustering, ttrics describiially those can have fastion strategy ter.
pj, the optimput paramete
n the other sion. If the aleeding by twalgorithm seas
s with unique
arameters dou
mplemented: oe iterations fe maximum ed, a unique sion.
system level
dB for all N1.
ul service prmization stratquality have
xDSL). Parful as input ts been perfor
the networking system pproposed fo
ster convergey is applied to
mization algoers (for examide, such oulgorithm has
wo modalitieseveral (typic
e value, take
uble valued,
one is achiefall below a g
number of value is obta
combinatio
rovided by thegies to run,been includameters inclto business mrmed in 5A1
k can impleperformanceor a centralence in sceno a system sp
orithm (for emple, transmiutput provides to be iterats: swap or avcally a dozen
last paramet
swap or ave
ved when thgiven threshoiterations. In
ained by aver
ons FAP/FA
he fiber/xDS, i.e. the exched, i.e. exceude evaluatimodel treated and reported
ement optims for a limitlized approa
narios with aplit in cluster
example, theission poweres two paramted, the systverage of then) times ove
ter value;
rage values.
he differenceold (e.g., 10-
n case convraging such t
AP. SIR sc
SL link and ichange of infellent (e.g., fion of backhd in 2A3. Ad in [Freedo
mization stratted set of uach and reqa limited set rs with units
e GO) is runr and band almeter values tem can set e obtained vaer each cluste
e between pa1); the other
vergence is ntwo values a
38
enario
its limits, formation fiber with aul delay
A detailed m-D51].
tegies or sers. The quiring a of users. logically
n on each llocation) for all rj an initial
alues (see er. Initial
arameters is simply
not under and fed to

39
Considering the GA case, the constrained search for (sub)-optimal parameters starts from random (satisfying the system constraints) initial values and outputs the (sub)-optimum value for the transmission power to adopt for transmission between each FUE and the corresponding FAP. Given the power levels pscl1 and pscl2 coming out from two GAs running on the sub-cluster scl1 and scl2, before next iteration the system can implement the two mentioned options to select which value will serve as initial condition for the next run. The average or the switch are expressed as
1 2 1 21 2, ,
2 2out outscl scl scl scl
scl scl
p p p pp p
(1)
1 2 2 1,out outscl scl scl sclp p p p
, (2)
respectively. At next step of optimization, 1out
sclp and 2out
sclp will be adopted as initial values, and so on, until the constraint is fulfilled. The choices both for setting the output power value and for the constraint type (threshold value or maximum number of iterations), provide similar results and do not affect the computing time. Simulations show that both criteria bring to convergence of the optimization algorithm.
5.3.2 Clusters of clusters
5.3.2.1 Parallelization topologies
The analysis of the cluster structures leads to identify several topologies of interest to investigate the scalability of the system optimization methods.
We will describe a ring topology and a blocks topology. The first is an abstraction to tackle a system of FAPs which interfere with the closest ones only, whose number can be indeed high (several tens) and the optimization is split among NFAPs/2 very fast sub-processes. The second topology proposed represents several sets of FAPs. The interference to be considered can occur within FUEs belonging to the same set, and for some of them at the borders it can occur also with transmitters in an adjacent set.
5.3.2.2 Ring Topologies
Dealing with interference among nearby FAPs can be successfully approached on the basis of the topology underlying the propagation distances characterizing the environment. This case has been tested for the GA optimization in a scenario in which the frequency bands have already been assigned by other resources, such for example by a former GA-based algorithm parameters search, thus corresponding to the case of different transmitters competing within one frequency chunk.
The idea is to propose a method to identify some sub-clusters (typically including 3 FAPs each) over which running fast GA algorithms. A precise strategy has been implemented to deal with FAPs belonging to two adjacent mini-clusters and is detailed by Eq. (1) or Eq. (2).
5.3.2.2.1 Ring-next, Ring-twist and Ring-generic
The whole set of FAPs can be considered as belonging to a cluster schematized as a ring where every FAP interferes only with few nearby ones. There are several levels of complexity in the interaction between FAPs increasing from a pathloss matrix with the diagonal form as for example the one shown in Figure 23, to less regular ones.

ICT-2488DocumentTitle of D
Freedom
Figur
Two exaring-skipcase, evecover the
If the topdeploymfeatures
Figur
To study
891 STP t number: M5eliverable: Int
m_5D2_DUN
re 22. Pathl
amples in Figp. The arrowery FUE pare whole set.
Figure 23
pology of intment reduces
useful for an
re 24. Ring
y the parallel
.2.2 terference chan
Nb.docx
loss represe
gure 23, shows represent t
rameter sear
3. Example
terference geto the type
nalyzing the
g topology w
lization and s
nnel model at s
entation for
ow on the lefthe link betwrch needs to
of ring top
ets more comof a genericscalability.
without hin
scalability fo
system level
r a system
ft the topoloween those Fo include thr
pologies. Le
mplex, as for c one (addre
nts for addr
or a system o
of 32 FUEs
gy that we cFAPs/FUEs wee units at a
eft: ring-ne
example theessed in prev
ressing par
of FAPs in Fi
s with a rin
call ring-nextwhich interfea time (a sub
ext. Right:
one represenvious Section
rallelization
igure 23, we
ng-next top
t and on the ere each otheb-cluster) in
ring-skip.
nted in Figurns) without
n and scala
follow the st
40
pology.
right the er; in this
n order to
re 24, the topology
bility.
teps:

41
1. Ic
2. R
3.
4. Rcp
Fig
Let us cothe sub-involvinso on, un
5.4 O
5.4.1 C
5.4.1.1
A systemcharactesecondarusers withat the few gene
For deta
Identify NFA
common.
Run the GA
Set the doub
Repeat stepscriterion is parameters, o
gure 25. Sca
onsider for e-cluster highng the users hntil the const
Optimization
Centralized
GA Optimi
m with topolrized by a mry diagonals ith one unit asmall numberations (less
ils about GO
APs/2 sub-clu
on every sub
ble-valued qu
s 2 and 3 ufulfilled (it
or a maximu
alability of
example the phlighted at sthighlighted atraint mentio
ns strategi
d resources a
ization over
logy of type minimum foand the high
at the interseer of variabls than 15) to
O terms we re
usters provid
b-cluster.
uantities (see
sing the GAcan be a
um number o
the ring to
process in Ftep 1, or to
at runs 1 and oned in step 4
ies
allocation
the ring
ring-next haor the elemenhest values foection amongles to be optconverge. In
efer to [Freed
ded by grou
Figure 25, r
A output as threshold on
of iterations).
opology iter
igure 25 andthat highlig2, 1
outsclp and
4 is fulfilled.
as a pathlossnts on the d
for all other eg two nearbytimized allown terms of tim
dom-D32].
ups of three
right panel).
initial condin the differ
rating the G
d focus on FUghted at stepd 2
outsclp wil
s matrix reprdiagonal, a selements. Cluy clusters. Tws a small pme this corre
e, having at
ition for a nrence among
GA over th
UE number 3p 2. At the nll be adopted
esented as inslightly highusters are com
The algorithmpopulation sizesponds to les
t most one
new run, untg two doub
he sub-clust
3. It belongsnext step of
d as initial va
n Figure 26, her value onmposed of 3
m is fast, in ize (less thanss than 200 f
unity in
til a stop le-valued
ters.
s either to f the GA alues, and
which is n the two 3 adjacent the sense n 10) and frames.

ICT-2488DocumentTitle of D
Freedom
Figur
5.4.1.2
The FAPstructurebuildingwith simnumber aggregat
---
The pathdeterminare instato speedsystems.
The assithe abovconsiderwith oth
In the caroad, it ione builothers in
The intenegligibl
The algo
1. i
2. i
3. dw
4. r
891 STP t number: M5eliverable: Int
m_5D2_DUN
re 26. Pathl
Blocks Top
Ps deploymee of the sign with severa
milar structurof blocks aloted by severa
- The FAP- The inte- The RRM
the singl
hloss can thned by settinalled (this is id up the para.
ignment of ave mentionering the preseer nearby on
ase of severalis straightforlding. In pren the nearby c
erference amle for the oth
orithm dealin
identify diffe
identify FUE
define a cluswith them fr
run the GA p
.2.2 terference chan
Nb.docx
loss represe
pology
ent in a spenal propagatal floors, eacre of internaong the diagoal means:
P can sense irference canM can make le FAPs.
hus be estimng thresholdsindeed alwayameters optim
a FUE to oneed criteria anence of a clu
nes geograph
l clusters, as rward to indsence of sevcluster; the s
mong nearby hers.
ng with this p
erent blocks;
Es at the inte
ster as one brom a nearby
parameters se
nnel model at s
entation for
cific environtion due to sch accommol walls will onal equal to
ts environme be evaluateda guess at sy
mated by a ms to let emerys the case) tmization alg
e cluster or tnd is expresuster structurically distrib
in a urban sdentify to firsveral clusterssame is true f
clusters is m
problem is th
;
rsection inte
block plus thy block;
earch separa
system level
r a system
nment (e.g. some physicodating a sim
give rise to o the number
ent; d by a centraystem level
measurementrge it. If the the system ca
gorithm and t
to another cossed by the re and how tbuted (see Fig
scenario withst approximas, some FUEfor the next c
more relevan
he following:
erfering with
he maximum
ately on each
of 12 FUEs
urban, suburcal peculiaritmilar (often
a pathloss mr of floors. T
alized unit atand adapt it
t or guessedRRM has inan implemento divide the
omes from epathloss str
o deal in thegure 27).
h several builation a clusteEs belongingcluster and so
nt for the FU
:
users from t
m number of
cluster;
s with a rin
rban) determties of the ethe same) numatrix with he resources
RRM level;to the measu
d by simulatnformation abnt a clusterizae whole syst
empirical conructure. In te case of a no
lding over a ger of FAPS
g to a clustero on.
UEs near the
wo blocks;
FUEs interf
ng-next top
mines a charenvironment number of ap
a typical strs of the syste
; urements fed
tion and its bout where tation schemetem into sma
nsiderations this activity ot isolated cl
grid and sepas FAPs depr interfere w
e borders an
fering simult
42
pology.
racteristic itself. A
partments ructure: a em can be
d back by
structure the FAPs e in order aller sub-
based on DUN is
luster but
arated by ployed in
with some
d will be
taneously

43
5. s
6. r
Similarlylevel of overall sover theblocks, ilying at tto the ge
The adoscenario matrix resame for
The use set of daggregatlevel. Thdifferent
1. C
2. C
3. C
The first
highligh
FiguFUEs
set the powe
repeat steps
y to the casethree MSs t
set of MSs ise reduced sei.e. allowing the intersecti
eographical d
opted schem with three epresented ar all blocks) a
of the term devices that te easily recohus, the GAt blocks. In th
Cluster 1 inc
Cluster 2 inc
Cluster 3 inc
t example te
ht the FUEs in
ure 28. MSsof the sam
er values for t
3 and 4 with
Figure
e of the ringto the entire
s divided in bet of MSs bto parallelizion of differe
deployment,
e, on the bablocks emu
as in Figure 2and the num
“block” is tocan be insid
ognizable. ThA processes he diagram o
cludes all FU
cludes all FU
cludes all FU
ested is the o
nterfering wi
s interferenme color und
an
A
the FUEs at
h 5 until a sto
27. Examp
g topology, we set constitublocks (labelbelonging to e the computent blocks foclusters refer
asis of the Pulating a dep28, whose paber of FUEs
o keep referede a buildinhe term “clusone cluster
of Figure 12,
UEs from blo
UEs from blo
UEs from blo
one in Figure
ith next bloc
nce scheme derline the nd some FU
A
cluster 1
the intersect
op criterion is
ple of nearb
where the puting the rined as A, B, Ceach cluste
utation. Analoollow from Ers to the GA
PHY layer pployment sucarameters ar simultaneou
ence to the gng and whosster” refers tat a time (i
, for example
ck 1 and som
ck 2, some f
ck 3 and som
e 28, for wh
ck.
for 12 FAPnecessity o
UEs from n
B
cluster 2
tion of two cl
s fulfilled.
by blocks o
problem was ng, in the bloC, see Figureer, composedogously, the Eq. (1) or Eq
A optimization
parameters ich as in Fig
re the numbeusly interferi
geographical se position o the set of Fi.e., in parale, one can de
me from bloc
from block 1
me from bloc
hich MSblockN
Ps deployedof a cluster earby bloc
C
cluster 3
lusters;
f FUEs.
the scaling ocks schemee 12). The GAd of MSs bepower levels. (2). We remn.
implementedgure 12 wither of FUEs png with two
deploymentcan be mapFAPs mutualllel) whose evise the clus
ck 2;
and either so
ck 2.
5 and MSoveN
d in three aincluding tks.
C
from the sue here introd
GA optimizatielonging to s assigned tomind that blo
d so far, addh an overallper block MN
blocks MSovN
t of FAPs supped to belolly interferinFUEs can b
ster populatio
ome from bl
2erlap and t
adjacent blthe current
ub-cluster duced the ion is run different
o the MSs ocks refer
dresses a pathloss
MSblock (the
verlap.
uch as the ong to an g at PHY belong to on as:
ock 3;
he colors
locks. t block

ICT-2488DocumentTitle of D
Freedom
Figurean ove
wh
5.4.2 S
In the LTgiven nuare referradio fra0.5 ms amay alsoIn this seof [Freedon the LMore spavailablealgorithmmany iteparameteresourceIn our si4000 tim
proposedmacro-u
Where Nthe algor
1. Fi
2. T
i
te
1 For simpduration.
891 STP t number: M5eliverable: Int
m_5D2_DUN
e 29. Grapherlap of 2. Thich are pro
Scheduling
TE specificaumber of subrred as physiame structureand is divideo have even dection we widom-D3.2] uTE frame str
pecifically, we for data tram run and coerations of ther being inve
es. imulation resme slots. Th
d in section 7users activity)
FapsN represe
rithm to conv
For a time interference The term 2
interference
the FAPs areeach FUE ca
plicity, we assu
.2.2 terference chan
Nb.docx
hic represeThe verticaocessed at e
in distribute
ations, users bcarriers (12 ical resourcee has time dued into 6 or 7durations. Till show how
under a Markructure.
we evaluate tansmission bonverge. Thehe algorithmersely propor
sults we havehe number o
7.3.2 of [Fre) is given by
cn
ents the num
verge. More
equal to 1power assum
FapsN take
powers. In d
e scheduled tan estimate t
ume the subfram
nnel model at s
ntation of tal shapes onevery step o
dif
ed RA algor
can allocate in most of t
e blocks (PRuration of 10 7 OFDM sy
The size of a Pw the dynamikovian statis
the rate loss becomes shoe impact of t
m are desired rtional to the
e consideredof time slots
eedom-D3.2]1
(2 FapN mber of active
specifically
OFDM syming that all es into accou
details, for a
to transmit othe overall F
me configuratio
system level
the pathlosn the right of the GA wfferent bloc
rithms on th
power and bthe cases) an
RBs). Allocams consistin
ymbols intervPRB in the tic resource astical model
for the maxorter when a this signallinin each run,
e time horizo
d the macro-u cn needed
(under a fir
1)ps itN
e FAPs and N
the algorithm
ymbol intervthe MUEs an
unt the numb
time of dura
one by one, iFAPs interfer
on in which eac
ss matrix fopanel high
while the dcks.
he LTE fram
bits (i.e choond for a predtion of PRBng of 20 timevals (dependtime dimensiallocation algof the macro
x-rate game fraction of
ng overhead , and how ofon over whic
users activityd for the con
rst-order Mar
/ 7t [time
4itN is th
m can be sch
val each FAnd FAPs areber of slots r
ation equal to
instead of trarence. Finally
ch slot is divide
or a systemhlight the thdotted shap
me structure
ose a consteletermined ams is handled
e slots. Each ing on the chon is one timgorithm propo-users activ
due to its rutime slots isdepends on ften the algoch the algorit
y on 200 framnvergence of
rkovian mod
slots]
he number of
heduled as fo
AP can estimnot transmit
required for
o FapsN OFD
ansmitting simy each FUE
ed in 7 OFDM
m of 15 FUEhree sets of
pes refer to
e
llation) to blmount of tim
d by a schedslot has a duhosen forma
me slot. posed in sectvity can be s
unning time:s spent for letwo paramet
orithm is runthms is set to
mes correspof the sum ra
del assumptio
f iterations ne
ollows:
mate the mtting; estimating th
DM symbol
imultaneouslone by one
symbol interva
44
Es, with f FUEs the
ocks of a me. These uler. The uration of at), which
tion 7.3.2 scheduled
the time etting the ters: how , this last o allocate
onding to ate game
on for the
eeded for
acro-user
he FAP’s
intervals,
y, so that transmits
als of equal

45
the estimate interference to the associated FAP so that 2 FapsN OFDM symbol intervals are
spent for each iteration of the algorithm.
We are now in the position to evaluate the loss on the data transmission rate due to the time spent for the algorithm to converge. To this end, we assume that all the slots in the 200 frames can be potentially used for data transmission. Under this assumption the rate loss depends on how often the resource allocation algorithm is run. More specifically if we assume that the maximum-rate game is run Tn times on 200 frames the overall time slots available for data transmission are given by
4000 T cn n where Tn can be also expressed as 4000 / ( )T d cnn n denoting with dn the
number of time slots over which the FAPs allocate every time that the algorithm is run. Therefore, the algorithm works as follows:
1. Each FAP observes for a single time slot the macro-user activity; 2. cn time slots are spent for running the maximum rate game, assuming that for this time
interval the macro-user activity does not change. The game predicts the time-frequency power allocation over the next dn time slots.
3. After dn time slots return to step 1.
As a consequence, there exists a trade-off between the overall rate and Tn : for a fixed cn by
increasing Tn the available data transmission time slots dn decrease. In order to quantify this
behaviour we introduce the parameter c
c d
n
n n
, representing the loss in terms of data time slots
due to the running time ( / 2cn ms) of the game. Observe that 0 when cdn n , i.e. if the
convergence time can be neglected with respect to the data transmission time, while 1 if the loss in the transmission time due to the convergence time is non-negligible. Therefore we report in Figure 30 the sum of the rate per-FAP over 200 frames and 25 frequency resource blocks versus the parameter . We can observe that as the rate loss is low, i.e. for small values the achievable rate is higher and it decreases as we increase the frequency with which the resource allocation game is run over 200 frames. Furthermore it can be noted that as the number of active FAPs is increased (lower subplot) a lower rate can be achieved due to the higher interference levels among the FAPs. Finally, from Figure 31 we can assess a fundamental feature of the proposed algorithms. As extensively discussed in section 7 of [Freedom-D3.2] the predictive behaviour of the resource allocation strategy assuming that the macro-users activity can be modelled by a first order Markov chain is more effective when the number of time slots dn composing the block over which the
algorithm is performed is low. As we increase dn the mismatching between what is predicted and the
real interference increases.
According to these observations, in Figure 31 we report versus dn the relative gap nck sk
nck
R R
R
between the rate with non-causal knowledge of the interference activity, denotes as nckR , and the rate
obtained with statistical knowledge of the macro-user activity skR . We can note that, as expected,
such performance measure is an increasing function of dn . What is interesting to notice from Figure
31 is that the knowledge of interference statistical parameters, if properly exploited as in the method

ICT-2488DocumentTitle of D
Freedom
proposedpercenta
Figure
891 STP t number: M5eliverable: Int
m_5D2_DUN
d above, yieage loss is les
Figure 3
e 31: Relatsta
.2.2 terference chan
Nb.docx
elds a rate vss than 0.004
30: Average
ive gap betatistical kno
nnel model at s
very similar 4).
e per-FAP
tween the rowledge of
system level
to the idea
achievable
rate with nof the macro
al case assum
e rate versu
on-causal ko-users activ
ming non-ca
us the param
knowledge avity versus
ausal knowle
meter .
and the rat
s dn .
46
edge (the
te with

47
6 METHODOLOGY FOR SYSTEM LEVEL SIMULATION In this section the methodologies introduced in the previous part will be considered in view of a comparison of the network properties (SNRs of users, traffic load, fairness, etc.). The dynamic simulator has been designed to evaluate system performances to address problems for both activities 5A1 (reported in [Freedom-D51]) and 5A2. The objective of this part of activity is to complete and merge the evaluations at system level regarding the impact of a femto network in a cell with focus on traffic and applications running on mobile terminals. Several system level evaluations are a follow up of 5A1: the output measurements and QoS indicator for the activities in 5A1 could be summarized by SINR levels over time and their impact on transmission events, while the “event-unit” is the transmission by a MS of FAP. On the other hand, in the present activity the SINR (and its time variation) can be considered as the input parameter at the basis of the system processing whose basic “event” is the single packet exchanged by a certain application running on the mobile terminal.
6.1 System simulator
The dynamic simulator manages the evolving aspects of the network. The dynamics is given mainly by two factors:
- different applications running on a smartphone generate a variation over time of packet flux to/from that unit. Such data flow is encoded and transmitted following a scheduling function which manages queues and simulates retransmission of NACK packets, thus request of resources varies from subframe to subframe;
- the environment changes over time due to motion of transmitters or motion of object around transmitters (e.g., a car passing by, a door opens or closes) on the timescale of human movements, providing significant changes in the pathloss (and consequently on the SINR) on the timescale of few frames (i.e., some tens of ms).
The system simulator addresses both cases, focusing attention depending on the problem under analysis. The output is expressed, for example, in terms of advantage or disadvantage of the MBS offload measured in terms of resources otherwise made available or energy consumption. Different evaluations about possible choices are left as business case issues under the MNO decision At this level, system simulator is developed in parallel for 5A1 and 5A2. We refer to [Freedom-D51] for the dynamic simulator structure.
6.2 Simulator principles
Simulator developed for this activity is based on the dynamic simulator elaborated in WP5 (see also [Freedom-D51]), which is an event-driven system level simulator. Overall simulator scheme is represented in Figure 32. One aspect is given by the evaluation of the clustering strategies and their impact on network performances. The simulator has a modular structure in which every block corresponds to a functional aspect of system: structure, geometry, propagation, interferences, management, applications etc. The system evaluation is based on a set of system-level metrics allowing the assessment of network performances from a system-level perspective.

ICT-2488DocumentTitle of D
Freedom
6.2.1 T
The systsynchronindependdocumenAlthoughof small traffic bewhich, in The systapplicatioverhead The traffhave bee
V
bab
F
da
B
t
Simulati
- T
- T
891 STP t number: M5eliverable: Int
m_5D2_DUN
Figu
Transmissio
tem is represnized time dent BSs andnt they are noh consideredsubsystems
etween the mn total, contr
tem simulatoion of each d requested a
ffic types emen implemen
VoIP. Is mobitrate is 6assumptionsbytes for Eth
FTP. Unifordelay of aballows to set
Bursty. Packtype of traffi
ions have bee
Type 1. User
Type 2. User
.2.2 terference chan
Nb.docx
ure 32. Sche
on event
sented as maframe, i.e. d thus can reot relevant and as a separamade by the
mobile users ribute to the b
or has a moduuser. Each e
as a service b
mulated are dnted in the dy
odeled as a 4Kbps. Voi to compute
hernet header
rm flux of daout 10%. Sut output avera
kets dimensioic is designed
en run for thr
r has voice tr
r generates V
nnel model at s
ematic repr
cro- and femwhen BS isealize differend have been
ate entity, thee single FAPregistered tobackhaul loa
ule to emulaevent of simby the user to
described in ynamic system
two state Mice payload IP overhead
rs, FCS and C
ata packet wiuch values age FTP thro
ons and interd to emulate
ree types of u
raffic only, e
VoIP and FTP
system level
resentation
mto-network.s in DL, alent synchronn presented ie femto netws. Indeed, eao it. Every usad toward the
ate data packmulation is go its serving
details in Sem simulator
Markov procesize is 16
d are includeCRC.
ith small varvary depend
oughput and
r-packet delHTTP, gam
users:
encoded as V
P traffic.
Scenario deployment
Set clusterinstrategy
Dynamic simulator run
Performanceevaluation asystem leve
n of the dyn
. The macro ll MUEs arnization casein details in Swork is a uniach FAP has ser has diffee core netwo
kets inclusivegiven by a pBS (MBS or
ection 5.6 ofin three cate
ess and ado0 bytes, 20d: 40 bytes f
riations in pading on avepacket dime
lay have highming or applic
VoIP.
t
ng
n
e at l
namic simu
network (Mre silent. Thes, which forSection 6.1.3ique system its own scherent types ofrk over the I
e of applicatipacket of datr FAP).
f Deliverableegories: VoIP
pting the G0 PPS. Furtfor IP, 8 for U
acket dimensrage data th
ensions.
her variabilitcation driven
ulator
MBS and MUhe femtocellr the purpose3 of [Freedomsimulated as
eduler to manf traffic overIP link.
ion overheadta and corre
e [Freedom-DP, FTP and b
G.711 codec. ther protocoUDP, 12 for
sions and inthroughput. S
ty of order 8n data reques
48
Es) has a ls act as es of this m-D51] s the sum nage data r the FAP
d for each sponding
D21] and bursty.
Average ol header r RTP, 18
er-packet Simulator
0%. This ts.

49
- T
In view MBS, a flow is amerged aThe typedepictedof data request. be transmand real summari
Table
Figure 3longer tiset accorother typ
Type 3. User
of the compscript emula
available sepas a unique de of data flow
d in Figure 3as representFigure 33 shmitted in ordtime slots o
ized in Table
Figure 3
2: Possible
34 representsime scale. Fording to the Gpes of traffic
rs generate th
parison of syating the traffarated for eadata flow forw for a user 3. Different ted by filledhows the netder to have
of transmissioe 2.
33. Exampl
case
case case
case
case
case
case
e subframe
s the temporaor the case oG.711 codec, such as FTP
hree types of
ystem evaluafic reproduceach applicatior processing wof Type 3, wapplications
d markers int request, i.ea reliable Qon follow on
le of data lo
0
1 2 [
3 [
4 [
5 [
6 [
e partitions
al data outpuof VoIP the mc, otherwise tP at variable
f traffic: VoI
ation of traffes exactly theon for the uswhen the samwith a richers (FTP, VoIPn the figure. e. the numbeoS. Then, scne of the pos
oad for a u
Subframe[-1 0 1 1 1 -
[-1 0 1 1 -1 -[-1 0 1 -1 -1 -
[-1 0 1 1 1 -
[-1 0 1 1 -1 -
[-1 0 1 -1 -1 -
[-1 0 1 1 1 -
s slots. 1=U
ut for 4 usermaximum pathey are a sy
e rates, HTTP
IP, FTP and b
fic flow for ue same packeer in the femme user is a Mr set of appliP and bursty
Empty red er of bits, inccheduler pacssible structu
ser with th
structure -1 0 1 1 1]
-1 0 1 1 -1]-1 0 1 -1 -1]
-1 -1 -1 -1 -1]
-1 -1 -1 -1 -1]
-1 -1 -1 -1 -1]
-1 0 1 1 -1]
L; -1=DL;
rs performingacket size anystem parameP, gaming or
bursty.
users attacheet flow for th
mto network; MUE attacheications runntraffic) genesquares are
cluding overhcks into PRBures for the s
hree types o
]
]
0=includes
g different tyd inter-packeeter and can video/audio
ed to a FAP he two casesthe same da
ed to the MBning on the merate a packee the sum ofrheads, whichBs accordingsubframe pa
of traffic.
s control pa
ypes of traffet time interbe changed
o streaming.
or to the : the data ta flow is
BS. mobile, is et request f all data h need to
g to MCS artition as
ackets.
fic over a rval are is to mimic

ICT-2488DocumentTitle of D
Freedom
Figure
6.2.2 E
The seqtransmisthe macrsynchronsame subsystem l
Figure FUEs
6.3 K
Coheren
-
891 STP t number: M5eliverable: Int
m_5D2_DUN
e 34. Exam
Events sequ
quence of evssion of all uro network inized also am
ubframe strucevel of this p
35. Tempoand their c
Key parame
ntly with 5D1
- Wireless
.2.2 terference chan
Nb.docx
mple of fourmedium
uence
vents, causinusers in the nis synchronizmong FAPs cture, so thaproperty has
oral structucorrespond
eters
1 ([Freedom-
s system (3G
nnel model at s
types of trm rate, 2 u
ng also intenetwork and zed with all themselves.
at MUEs andbeen extensi
ure of framding FAPs.
FAPs “ca
-D51]), simu
GPP LTE-A)
system level
raffic. Fromusers with V
erference in is representFAPs of th
In this examd FUEs are ively analyze
mes for a setMUEs imp
ase 6” from
ulations cons
characteristi
m top to botVoIP codec
the networed, as an exe femto netwmple both Msimultaneoued in [Freedo
t of transmplement tra
m Table 2.
idered in WP
ics;
ttom: FTP G.711.
rk, derives fample, in Fiwork and the
MBS and all usly in DL oom-D51].
itters. Examansmitting
P5 regard the
high rate,
from the ovigure 35. In te system is FAPs adopt
or UL. The i
mple of 2 Mscheme “c
e following a
50
bursty
verlap of this case, supposed t also the impact at
MUEs, 2 ase 0”,
aspects:

51
- Propagation models; - Interference power models; - Spectrum usage;
- Traffic models;
- Synchronization error models;
- PHY-layer abstraction and backhaul abstraction (link quality);
- Mobility and handover; The simulation parameters are directly related to the aspects listed above. The details about these simulation parameters are given in paragraph 5 of [Freedom-D21].
6.4 Performance metrics
A detailed description of selected metrics is given in section 5.2 of [Freedom-D21]. The focus is towards system oriented metrics, describing the efficiency of the overall network. The performance evaluation of a system-level network based on LTE-A standard will allow also to comment on the targets of LTE-A.
6.4.1 System-level metrics
Metrics used for performance evaluation at system level (according to the definitions given in paragraph 5.2 of [Freedom-D21]) are:
- Overall cell throughput
- Clusters cell throughput
- Overall spectral efficiency
- Clusters distribution of spectral efficiency
- Overall QoS
- Cluster distribution of QoS
- Fairness
- Call drop rate
- Latency
- Backhaul overhead
- Average power per user.
6.4.2 User-level metrics
As a reference, system can evaluate also user level metrics, in order to assess a comparison with a network without implementation of optimization strategies for interference management. For the performance evaluation at user-level the following metrics are selected:
- Distribution of users throughput
- Distribution of users spectral efficiency
- Distribution of users QoS
- Call drop rate per user
- Distribution of latency
- Power per user.
Such metrics can be measured for both MUEs and FUEs. The objective for this type of metrics is to give the performance evaluation of the network as seen by a single user (UE).

ICT-2488DocumentTitle of D
Freedom
7 SY7.1 D
We repoorder toINFOCOThe sysarchitect(architec
F
For a dethe other
7.1.1 E
The netwFAP andconsiderThen, thwhich M
(Blockabstra
(Block A
(BS
GMob
(BS
a
891 STP t number: M5eliverable: Int
m_5D2_DUN
YSTEM LDynamic sim
ort here, for s underline t
OM activity. stem-level sture is basedcture based o
Figure 36.
edicated descr blocks are a
Environmen
work deploymd MS (MUEring the varihe definition MBS or FAP
k E) – Low level action models
A & B) – Enviro
(Block A1) S, FAP & MS Geometry & bility(x,y,z)(t)
(Block A2) S, FAP & MS
Links
(Block E1) PHY-MAC layerabstraction mode
(Block E2) Backhaul
abstraction mode
.2.2 terference chan
Nb.docx
LEVEL Smulator
simplicity of the interchan
imulator ded on the imon the modul
Schematic
cription of thaddressed he
nt and netw
ment summaE or FUE) ation of theiof the links
P) is establish
nment & Networ
(BlSc
r el
el
nnel model at s
SIMULAT
f explanationnge of infor
veloped by mplementation
es).
block diag
he blocks A, ere for their s
ork
arizes the thrpresent in t
ir positions abetween BShed. Pathlos
rk
(Block F) –
lock B) enario
Re(p
system level
TOR ARC
n, the schemermation betw
DUNE hasn of system
gram of the
B, E, H, wespecific refer
ree-dimensiothe scenarioas the functi, FAP and M
ss temporal v
(Block C &and interfer
– Resource mana
(BlockFor F
(FREEDO
(BlockUE requir
(applica
Prop
Inter
(Blockesources managempower, frequency,
CHITECT
e of the systeween DUN a
s a block-s’s functiona
e dynamic s
e refer to therence to the t
onal coordinao. The mobiions of time
MS (how MSvariation inc
D) – Propagatiorences
agement
k F1) FAP OM WP3)
k G) rements ations)
(Block C) pagation models
(see 2D1)
(Block D) rference models
k F0) ment/optimisation, time/scheduling
TURE
em level simuand SIR act
cheme giveal aspects in
system leve
e document [tasks of 5A2
ates of the poility of MSse and the impS is connecteludes both m
on
n g)
ulator archittivity, and D
en in Figuren a modular
el simulator
[Freedom-D5.
osition of eas is implem
mpact on the ed to the netwmobility of u
(Block H) - Performance
(Block HSystem-le
metric
(Block HUser-lev
metric
52
ecture, in DUN and
e 36. Its structure
r.
51] while
ach MBS, mented by
pathloss. work: via users and
H1) evel
cs
H2) vel cs

53
change iopening) The cont
7.1.2 P
The modcomposeprovidedbut also In a firstcompletefading isfrom themodel. In a secmodel bused, thcomponewhole siSystem-lwhole si As this considerpropertiechangingat differesmall UElink duri
in the surrou).
tent of the bl
Propagation
deling of thed of: macrod by the propfor each MB
t approach, ted in [Freedos modeled bye vector sum
ond approacbased on a 3Dhe channel ent. The pathignal bandwilevel simulaimulation tim
simulation tred necessaryes are assumg, as a conseent successivE move. Figing 1s.
Fig
unding enviro
locks A and
n and interfe
he path-losseoscopic pathpagation modBS-FAP and
the pathloss om-D31], bay a lognorm
m of the com
ch, the pathlD vector repmulti-paths h-loss is proidth (i.e. smaations requireme.
ime is of ory. The UE m
med to be conequence of cve UE locatiure 37 show
gure 37: Tim
onment, i.e.
B is covered
ference
es due to prh loss, shadodule for eachFAP-FAP co
is computedased on a the
mal variable wmplex chann
loss and shapresentation
are construovided eitherall-scale fadine time-varian
rder of 1 or motion is repnstant. Only thanges in thons as a func
ws an exampl
me-variant
human activ
d by WP2 (se
ropagation bow fading anh UE-BS cououple when r
d from the aneoretical (or awith spatial cnel coefficien
adow fading of a real en
ucted and sr for each reng componen
ant channel i
2 seconds, presented by the relative p
he length of mction of the le time-varia
t channel o
vity or motio
ee [Freedom-
between the nd micro scauple, where trequired for s
nalytical modabstract) buicorrelation. Ants generate
are simulatenvironment [summed to source blocknt is averageinputs, i.e. a
complex UEa mean velo
phase shift bemulti-paths. multi-path a
ant channel r
n a FAP –
n of objects
-D21] for det
transmitter ale fading. Tthe BS is eithsimulating co
dels given inlding represeAnd the smad by the sto
ed by a site-Freedom-D3provide the
k or as an aved). a path-loss th
E mobility mocity and diretween the cThese phaserrival anglesealization ob
UE radio li
(for exampl
tails).
and the recThese path-lher a MBS ooordination.
n [Freedom-Dentation. Theall-scale fadiochastic WIN
-specific pro31]. As ray-te small-scalverage value
hat varies du
models have rection. Moschannel coeffe shifts are cs and geometbtained on a
ink.
le, a door
eiver are osses are or a FAP,
D21] and e shadow ing result NNER II
opagation tracing is le fading e over the
uring the
not been t channel ficients is calculated try of the FAP-UE

ICT-2488DocumentTitle of D
Freedom
Time-vaduring thvariationused. Techniquthe chanpropertie Figure 3rest of twhere aVolcanorepresenhuman aMAT fosimulato
Fi
891 STP t number: M5eliverable: Int
m_5D2_DUN
ariant channehe simulations that occur
ues that explnnel module es like delay
38 gives a scthe simulatorall path-loss oLAB script ntation, MBSactivity) into ormat, whichor.
igure 38: P
.2.2 terference chan
Nb.docx
el properties on time. Ther mainly in a
loit MIMO cgives the p
s, departure
chematic viewr. The propaand channegenerator is
S network, Fa command
h is conver
ropagation
nnel model at s
are predictee move of hua bursty man
capabilities mossibility to and arrival a
w of the proagation model models des run from MFAP deploymd file fed to Vted to the f
n module: g
system level
ed in a diffeuman bodies
nner. The sto
may require e output addi
angles of mai
opagation module is basicaescribed in Matlab® to ment, UE deVolcanoLABformat of p
generation
erent way ws in the UE chastic mod
enriched chaitional propein contributio
odule architeally compos[Freedom-Dtransform th
eployment, UB. The channpropagation
of path-los
hen the UE or FAP vic
el presented
annel realizaterties, i.e. alons.
ecture and itsed of the V
D21] have bhe scenario
UE mobility,nel output matraces read
ss and chan
is indoors acinity creates
in [Freedom
tions. For thill space-time
s interactionVolcanoLAB been implem
description , and possiblatrices are reby the syst
nnel matric
54
and fixed s channel
m-D31] is
is reason, e channel
n with the platform
mented. A (building ly indoor
eturned in tem-level
ces.

55
7.1.3 Low level abstraction models
The PHY-MAC layer abstraction model and the backhaul abstraction model are represented by block E. The system simulator is based on PDU-ER vs SNR curves for different MCS, allowing the assignment to each transmitter of the appropriate modulation for the propagation conditions. The MCS is assigned or changed to each user after measurement of the current PDU-ER which varies with interference levels around each transmitter. To avoid excessive changes of MCS, such measurement is performed over a number of transmission opportunities which for the simulator has been fixed to 50 as a compromise for data fluxes with scarce transmission requests and necessity to ensure reliable QoS.
7.1.4 Resource management
The radio resource management (RRM) includes the core of the packet scheduler (PS) allocation. It has been implemented both for the MBS where several MUEs compete for radio resources, and for the FAPs where much less users (1 to 4) have to share the corresponding radio resources. The user scheduler is a function, implemented at BS level (MBS or FAP) which manages the data packets allocations within one single time slot, i.e. one column of the sequence reported in Figure 35. The scheduler has been implemented taking into account
- Frequency selective channels. The band is divided in PRBs and the central unit knows which are the most favorable channels for each users’ transmission.
- Traffic level. A priority engine takes into account the number of packets queued for each user and the priority of the traffic type. A score is assigned following such criteria and a classification is fed to the scheduler. Priority is given to users with longer queues, and VoIP, delay sensitive applications.
- Optimization strategies. If an optimization strategy has been implemented (for the femto network) simulator takes into account possible clustering strategies and slowly-varying metrics describing parts of the network.
In particular, the core unit is functional for transmitting aggregate slowly-varying metrics across the network to implement hierarchical clustering, including the scheduler engine for the single FAPs which is also affected by the presence of clustering. On the basis of information about the links (if requested by the optimization algorithms implemented) and the UEs requirements (services requested by UEs), the RRM assigns the radio resources in terms of system efficiency criteria (time-frequency elements) and power to every single transmission. In case of distributed algorithms, the action of RRM can be reduced to scheduling traffic on the basis of competitive resources assignment run in a decentralized way. Figure 39 represents one of the two temporal slots which constitute the basic unit of the LTE PRBs resources scheme. The scheduler has to fill the PRB texture by assigning the most favorable frequency interval to all users.

ICT-2488DocumentTitle of D
Freedom
Figure 4FTP trafbe sent packet erin this spMCS is a
Figutypes
effecti
891 STP t number: M5eliverable: Int
m_5D2_DUN
40 representsffic and 2 witin the netwrror rate). Thpecific examassigned to t
re 40: Effes of traffic ive packets
wit
.2.2 terference chan
Nb.docx
Figure 39
an exampleth VoIP (cod
work and thehe peaks pre
mple) are the that user.
ective data prequests: r
s transmitteth traffic F
nnel model at s
9: Design of
e of packets fdec G.711). T effective dsent around packets that
packet allored symboled, includin
FPT-like an
system level
Physical Re
flow in the nThe red and b
data sent (incT=500ms ar
t must be res
ocation by als, packet rng retransm
nd 2 users w
esource Bloc
network in thblue symbolcluding packre due to the ent and accu
a round-robequests witmisssions. Fwith VoIP (
ck (PRBs).
he case of 4 us represent thket re-sendinworsening o
umulate in qu
bin scheduthout errorFrom top to(codec G.71
users, 2 of thhe net data png repetitionof SINR (forueues until a
uler for diffrs; blue symo bottom, 211).
56
hem with packets to ns due to
that user a stronger
ferent mbols 2 users

57
7.1.4.1 Adaptive MCS
The architecture allocation of data packets is summarized in the block scheme of Figure 41: the traffic requests are synthesized at the millisecond scale coherently with the LTE standard. Packets are transmitted in the order set by the scheduler and correctness receipt is evaluated. Packets received with errors are postponed and added to the transmitter’s queue. At the beginning of the simulation, a MCS is assigned on the basis of the initial SINR. As the flux of packets proceeds with time, PDU-ER changes when SINR varies due to the environment evolution and activity (e.g., dynamics of the surrounding transmitters) and each unit measures the current PDU-ER by evaluating the number of packets with negative ACK from the companion receiver (PDU-ER is indeed evaluated at level of the radio link, and not at application level). The current PDU-ER is computed averaging the last 50 transmission events, whose effective time lapse depends on the application type. Such value is chosen in order to prevent excessive changes of MCS, although maintaining a sufficient QoS. The MCS module takes into account both improved or worsened link conditions by setting an upper and a lower threshold. At each simulation time epoch, PDU-ER is updated on the basis of the last transmission opportunities (of order of 50) and eventually the MCS is adapted if the measured PDU-ER is above (or below) an upper (lower) threshold. When the measured PDU-ER decreases under the lower value, and lasts for at least 50 transmission events, the scheduler changes MCS to a more favorable level. The opposite happens when the PDU-ER is higher than the upper value. The considered PDU-ER is an averaged quantity, which in normal conditions is assumed to vary in the range [0.05-0.6], as adopted for the simulations.
Figure 41: Scheme of the realization of traffic flow for the system simulator.
Simulator time START
Read initial SINR
Compute initial PDU-ER (based on PHY simulations)
TRAFFIC SCHEDULE
Measure PDU-ER
Read next TRAFFIC
TRAFFIC end
Measure SINR

ICT-2488DocumentTitle of D
Freedom
The scheMCS schwhile inrepresenchanges changes
Figure
Fi
Figure 4PDU-ERdue to thwhile thfor the umuch les
891 STP t number: M5eliverable: Int
m_5D2_DUN
eduler flow dheme: when
n the oppositnted for 4 us
that appear which, for th
e 43. Exam
gure 44 rep
43. The PDUR measured he change toe blue horizousers with a ss traffic flow
.2.2 terference chan
Nb.docx
described in n PDU-ER ise case a strosers. The efin this samp
his test only,
Figure 4
mple of MC
ports the Ppar
U-ER value over the las
o a stronger ontal lines ahigh rate FT
w, at timesca
nnel model at s
Figure 41 cs below lowonger MCS.ffect over Mple run are a, have been s
2. Example
S variation
DU-ER meameters ar
at a certain t 50 transmiMCS which
are fixed to thTP (user 1 aale of ms.
system level
considers sucwer limit, the
Figure 42 sMCS assignm
a consequenset to conditi
e of SNR v
n for 4 userFigure 42.
easured overe shown in
instant of tiission oppor
h reduces PDhe two thresand 2), while
ch interval ase RRM assighows an exa
ment in reponce of the traons particula
ariation for
rs, correspo.
er time for n Figure 42
ime is the tirtunities. TheDU-ER well sholds. In thie users 3 an
s the thresholgns a MCS wample of SNorted in Figuaffic load anarly demandi
r 4 users.
onding to S
the 4 usersand
ime average e abrupt chaabove the upis example, td 4 are perf
ld values to with higher
NR temporal ure 43. The nd of the abring.
SNR varyin
s whose oth
of the instaanges downwupper threshothere is moreforming VoIP
58
adapt the capacity, variation frequent
rupt SNR
ng as in
her
antaneous wards are old value, e activity P, with a

59
Figure
7.1.4.2
The assigallocatiowhich ha
----
Consider
-
-
-
The PRBeach use100. At each
-
-
-
e 44: Exampin Figur
Scheduler
gnment of raon has been cave in part be
- Maximu
- Minimum
- Target th
- Optimiz
ring frequen
- The MBof MUE
- Rigid banetwork
- MBS haoptimiza
B texture shoer. The modu
transmission
- current q
- priority o
- number competit
ple of PDUre 42. User
and prioritie
adio resourceconsidered aseen consider
um power, 20
m power, 10
hroughput po
ation output,
cy allocation
BS transmits os.
and sharing s is reduced
as a band usation strategi
own in Figuule develope
n event, every
queue length
of the type o
of past occastions in whic
U-ER variatrs 1 and 2 r
es
es has been ds a parameterred in Section
0 dBm
0 dBm
ower, assigne
, i.e. assigned
n, resources c
over the enti
between Mat the expen
sage indepenies for interfe
ure 39 is filled allows em
y user receiv
h,
of traffic runn
sions to transch that user h
tion for 4 urun FTP tra
designed bothr which can n 6.1.5 of [F
ed on the bas
d on the basi
can be assign
ire licensed b
Macro and fnses of efficie
ndent of theerence mitiga
led by assignmulating all d
ves a score de
ning (e.g., fo
smit, which dhas been post
users, correaffic, users
h for power be set depenreedom-D51
sis of the des
is of an optim
ned by sever
band, adaptin
femto netwoent re-use of
e femto netwation.
ning the mosdimensions o
epending on
or delay sensi
depend both tponed due t
esponding t3 and 4 ru
and frequencnding on diffe1] that we rec
sired QoS
mization strat
al methods:
ng to frequen
rk. Interfereresources.
work, while t
st favorable of LTE PRB
itive applicat
on traffic loo a low score
to SNR varun VoIP.
cy assignmenferent possiblcall here for
ategy.
ncy selective
ence among
the FAPs im
frequency inB standard, f
tions such as
oad and past rre.
rying as
nt. Power le criteria clarity:
channels
the two
mplement
nterval to from 6 to
s VoIP)
resources

ICT-2488DocumentTitle of D
Freedom
The highFigure 4refer to only; blu
Figuridenti
Transmimore pac
891 STP t number: M5eliverable: Int
m_5D2_DUN
her the score46 shows a sthree types oue, VoIP and
F
re 46: Priofy differen
ssion allocatcket is transm
MP
.2.2 terference chan
Nb.docx
e, the higher snapshot of tof users on t
d FTP; green
Figure 45: S
ority metrict types of u
VoIP
tions are gromitted, the s
Re
tra
Measure PDU-ER
nnel model at s
the priority the priority vthe basis of , add also bu
Scheme of
cs for the scusers, on thP and FTP;
ouped accordsystem count
Initial SINR
ead transmiss
Is time-slansmission?
Go to trans
Up
Schedule P
Qu
no
ye
system level
given a uservalues for uthe number
ursty traffic.
the networ
cheduler athe basis of a
green, VoI
ding to the scts the numbe
R, PDU-ER,
sion requests
lot T allowed(e.g., DL/UL
smission requT=T+1
pdate MCS
PRBs assignm
eue update
s
r by the schesers attachedand types of
rk traffic m
t a fixed timapplicationIP, FTP, bu
cheme repreer of ACKs o
, MCS
s at time T
d for L/control)
uest at
ment
yes
eduler to allod to a MBS.f application
managemen
me instant. s running. ursty.
sented in Figor NACKs p
EvaluatePDU-ER
no
ocate a set of. The differens running: r
nt.
Different cRed, VoIP
gure 47. Oncpackets (20 b
e R
60
f packets. ent colors red, VoIP
colors P; blue,
ce one or byte long)

61
received(i.e., 30 m
Figure 4basis of result invertical positions
Fig
d and eventuams from NA
Figure 4
48 representsmaximum 2
n a figure diaxis frequens are unassig
gure 48: Tecorre
ally rescheduACK), updatin
47: Scheme
s the output 25 PRBs forfficult to reancy band ofgned frequen
emporal strespond to u
ules the bad png the curren
e of PRBs a
of the schedr the sake ofad. The horif PRBs, colocies.
ructure of Puser ID, all
Group user(QPSK,
Assignblocks ba
a
Evaluate nu
Resched
Q
packets at a nt queue.
assignment
duler for timef graphic claizontal axis ors refer to
PRBs allococation tim
rs based on m 16QAM, 64
n physical resased on usersand PS score
umber of corr
dule NACK p
Queue update
later instant
and queue
e interval of arity. The adrepresents susers ID, w
ations for ame must be
modulation 4QAM)
source requests
rect packets
packets
e
of time, at le
e load mana
f transmissiondoption of 10sequence tim
which in this
a set of 44 Mmatched to
east after 3 s
agement.
n, shown he00 PRBs wo
me of allocats case are 4
MUEs. Colo DL.
ubframes
ere on the ould only tions, the
44. White
lors

ICT-2488DocumentTitle of D
Freedom
7.1.5 U
User equbrowsingsuch as twhich co UE requ The userand num
- T
- T
- T
In our si
7.2 Sy
The clusterms of of the nstrategietopologisignificaof resouare baseDetails aSection 8
7.2.1 G
In this Scompose
The outpGA resuthe clust
The GA the follo
891 STP t number: M5eliverable: Int
m_5D2_DUN
UE requirem
uipment (UEg, interactivethroughput, onstitutes on
uirements, in
rs deployed mber of servic
Type 1. VoIP
Type 2. VoIP
Type 3. VoIP
mulations ha
ystem-leve
stering stratef network peretwork has b
es extensiveles of intere
ant gain in teurces assignmd on a set oabout the ge8 of [Freedom
GO and rin
Section are pred of 12, 32 a
put of the GAult for a singlter after 15 it
Figure 49
parameters owing figure
.2.2 terference chan
Nb.docx
ments
E) can havee gaming, dalatency etc.
ne of the main
terms of serv
in the netwoces running o
P traffic only
P and FTP tr
P, FTP and b
as been cons
el and user
egies for a Frformance anbeen comparly in 5A1 (sest, clusterinerms of comment and amf metrics def
enetic algoritm-D32].
g topology
resented the and 186 FAP
A providing te triplet of thterations.
9. GA outpu
search for a are reported
nnel model at s
e several seata transmissEvery servicn inputs for t
vices request
ork have beeon the mobil
y.
raffic.
bursty traffic
idered on av
r-level perfo
FAP-based nend convergenred with a nsee [Freedomng before op
mplexity, convount of overfined to highthm terminol
results of thPs/FUEs.
the power alhe ring while
ut for a syst
more populad the cases o
system level
ervices (applsion, streamice has its trathe scheduler
ted, are repo
en divided ine devices:
c.
verage an equ
formance
etwork are ence time of tnetwork withm-D51]). In
optimization vergence timrhead traffic hlight peculilogy and par
he GA applie
location is de the right pa
tem of 12 F
ated system wof 32 and 18
lications) simng etc.), eac
affic model (r (see Sectio
orted in WP2
n three possi
ual number o
evaluated frothe algorithmhout implemn this Sectio
and runninme, though g
over the baciar propertiesrameters me
d to differen
depicted in Fianel reports t
FUEs with
was applied 6 FAPs, who
multaneouslyh with its owsee Section n 3 of [Freed
(see [Freedo
ible types, de
of users for th
om a system ms. The systeentation of in we will sg parallel p
getting equivckbone. Thes of the systeaning are rep
nt levels of p
igure 49. Thehe final alloc
a ring-next
to rings of seose outputs a
y active (vown QoS requ3 of [Freedodom-D51]).
om-D21] for
epending on
he three type
m level perspeem-level perfinterference show how, processes prvalent resultse performancem (see Sec
eported exten
population fo
e left panel scation for all
t topology.
everal dimenare plotted i
62
oice, web uirements om-D51])
r details).
n the type
es.
ective, in formance planning
for some rovides a s in terms ce classes tion 6.4).
nsively in
or clusters
shows the l FUEs in
nsions. In n the left

63
panels o50, and Fin the sepower) oeffect is the proclimit to t
f Figure 50 Figure 52, shense that canor a decreaseapparent foress is cycledthe number o
Figure 50
Figure 51.
and Figure 5how the num
n imply a hige of transmisr the first sted over the riof iterations n
0. GA outpu
. GA outpu
51, respectivmber of nearbgher level ofsion power (
eps of the GAng after fewnecessary for
ut for a syst
ut for a syst
vely. For bothby FUEs whf interference(both transmA involving
w steps (5 at r the GA con
tem of 32 F
tem of 186 F
h FAPs popuhose power ae (both trans
mitters withoua large nummost in our
nvergence ov
FUEs with
FUEs with
ulations, the allocation is ssmitters comut transmissi
mber of FAPstests) and o
ver the whole
a ring-next
a ring-nex
right panel strongly sub
mpeting with ion opportuns and decreaoffers a meane ring.
t topology.
xt topology.
of Figure b-optimal,
the same nity). This ses when n to set a
.

ICT-2488DocumentTitle of D
Freedom
Figu
7.2.2 G
The GAscalabili(express
- F
- F
- F
From thenearby badjacent
Finally, resemble
891 STP t number: M5eliverable: Int
m_5D2_DUN
re 52. Evalnu
GO and blo
A optimizatioty, and has bed by the ov
Figure 53 sh
Figure 54 rep
Figure 55 fo
e GA outputblocks, undet one, result a
it has been es the one of
Figure 53.
.2.2 terference chan
Nb.docx
luation of nmber for a
ocks topology
on for the sbeen tested f
verlap parame
hows the case
ports 9 FUE
r 19 FUEs p
t in this implrgoing the dalways to be
verified thaf three indepe
GA optim
nnel model at s
nearby MSsa system of
y
scenario of for three popeter). The ou
e of 5 FUEs p
s per block w
er block and
lementation double interfdepressed by
at the algoriendent block
ization. Th
system level
s competin186 MSs w
three blockpulations’ sizutput of the G
per block wi
with and ove
d overlap 5.
scheme, oneference fromy the optimiz
ithm implemks when the o
hree blocks,
ng for the sawith a ring-
ks is made ozes with diff
GA is as follo
ith an overlap
rlap 3;
e sees that thm other FUEs
zation proces
mented for a overlap is set
, 5 FUEs pe
ame resournext topolo
of three cluferent levels ows:
p of 2;
e FUEs at ths in the samess.
set-up of tht to zero, as s
er block, ov
rces vs. iterogy.
usters to evaof cross-int
he intersectioe block and
hree blocks shown in Fig
verlap of 2
64
ration
aluate its erference
on of two from the
of FUEs gure 56.
.

65
Figure
Figur
Figure 54.
e 55. Three
re 56. Three
GA optim
e blocks, 19R
e blocks, 7 R
ization. Th
FUEs per ight panel:
FUEs per bight panel:
hree blocks,
block, over: pathloss m
block, over: pathloss m
, 9 FUEs pe
rlap of 5. Lmatrix, in d
rlap of 0. Lmatrix, in d
er block, ov
Left panel: dB.
eft panel: GdB.
verlap of 3
GA optimi
GA optimiz
.
ization.
zation.

ICT-2488DocumentTitle of D
Freedom
7.2.3 C
The comperformethe amousub-optima compaconvergeinterestinclusters. The relev
- na
- peu
- gf
For a cluoptimizathe GO expressetransmisaspect, rThe comone ordeclusters i In real sorder of blocks.
Tab
891 STP t number: M5eliverable: Int
m_5D2_DUN
Comparison
mparison of ed by evaluaunt of resourmal parametarable resourence for clung cases for
vant parame
number of itafter setting
population Pevery individusers;
generations Gfitness funct
ustered systeation processto converge
ed in numbession pathlosrefer to [Freemparison of cer of magnitincluding lar
scenarios ema few (i.e., 2
N Faps
12
32
64
186
ble 3: Com
.2.2 terference chan
Nb.docx
n of results t
f system perating resourcrces needed iters such as Grces assignm
ustered (linesr increasing
ters to get co
terations J, rethe double-v
P, i.e. the numdual is a poss
G, i.e. the hoion.
em, at each ses. Populatio
Tc as Tc=Jxer of framesses among edom-D32]) Tclustered vs tude the quanrger number
merges that c2-10 units), a
Iterations
3
1
4
1
4
1
4 1
mparison of
nnel model at s
to the unclu
rformances ces assignmeis strongly inGO shows smment. Table s highlightednumber of F
onvergence a
epresenting tvalued param
mber of GA isible solution
ow many tim
iteration theon and gener
xPxG. If the es. On the
transmittersTc reduces tounclusterd intity Tc, andof FAPs.
lusters are ualthough the
Population
15 40 120 15 40 120 15 150 250 15 250
optimizatioimplement
system level
ustered appr
between cluent after GOn favour of thmall variation3 and Table
d in grey) vFAPs and w
are
the number ometers;
individuals pn to be score
mes the GA h
ere is an excrations valueprocessing other hand,
s under optio a measuremimplementatid more than
usually comptopology of
Generatio
5 160 110
5 500 230
5 550 490
5 >700
on performtation. Rin
roach
ustered and O in both cashe clustered ns in output,e 4 report ths unclustered
with different
of times the G
parameterizined by the fitn
as to generat
change of soes are directlunit collects, if the cenimization (foment of compion shows h2 orders of
posed of lessthe overlaps
ons Cluste
6
1
16
1
32
1
981
mances for g topology.
unclusteredses, showing scheme. Alththe two imp
he parameterd (clusters=levels of ov
GO must be r
ng the diversness function
te new indivi
olutions amoly related to s only SINRsntral unit haor a detailedplexity for CPow clusterinmagnitude f
s than 20 uncould includ
ers Conv
T
>
clustered v.
d approach hg how at systhough an intplementationrs’ values to1) scenariosverlap amon
run on each
sity of trial son or tested by
iduals to eva
ong the (indethe time nec
Rs from all uas knowledgd discussionPU processin
ng reduced ofor deploym
nits and overde more that
vergence timeT=JxPxG
225 6400
13200 300
20000 27600 300
82500 122500
300 >175000
vs. not clust
66
has been tem level rinsically s provide
o get GO in some
ng nearby
cluster
olutions; y the
aluate the
ependent) cessary to sers Tc is ge of all n on this ng time.
of at least ents with
rlap is of 3 nearby
e
terd

67
N FAPs parameters Iterations Population Generations clusters Convergence time
T=JxPxG
30
N FAPs per block
N blocks overlap
10 3 3
8 25 10 3 2000
1 100 230 1 23000
75
N FAPs per block
N blocks overlap
25 3 7
10 25 10 3 2500
1 100 250 1 25000
105
N FAPs per block
N blocks overlap
35 3
10
15 25 10 3 6250
1 100 >400 1 >40000
Table 4: Comparison of optimization performances for clustered vs. not clusterd implementation. Blocks topology.

ICT-2488DocumentTitle of D
Freedom
8 PE The FAPlevel anstudy sh Analysescoordinain Sectio Analysesstudied i The perrecomme
- W- C- H- I
The expesystem lthe adopand if th Compariwithout deploymaddresse
8.1 R
8.1.1 S
Networksummaritools and The simspectral exploits multiple
891 STP t number: M5eliverable: Int
m_5D2_DUN
ERFORM
P-based netwalysis) and ould take als
s of the inteation techniqon 3.
s in Sectionin activities 3
formance anendations in
Which benefComputing lHow clusteriIs it possible
ected resultslevel and theption of the phis implies al
ison of soluinterference
ment characteed.
Results for i
Simulation
k parametersized in Tabld methodolog
mulation toolsefficiency athe MIMO xing; therefo
.2.2 terference chan
Nb.docx
MANCE E
work is analyuser experie
so into accou
erference anques, are repo
n 8.1 precede3A2 (coordin
nalysis will function of t
fits gets the oload (iteratioing affect alge to highlight
have to asseeir effect on proposed straso some cost
utions for neplanning wi
eristics when
interferenc
inputs
s, key aspece 5 and Tabgy.
s does not imand capacityconfiguratio
ore the maxim
nnel model at s
VALUAT
yzed from twence (individunt the econo
nd radio covorted in Sect
e the systemnation) and 3
allow evaluthe deploym
overall netwoons, exchangegorithm effict different hie
ess the efficithe network ategies provit, for exampl
etwork simuill provide ren a strategy i
ce analysis
cts of the sble 6 below.
mplement any outputs mon to generatmum LTE sp
system level
TION
wo different dual UE anaomical aspect
verage perfortion 8.1, base
m-level evalu3A3 (coopera
uating netwoment type. Th
ork from thee of informatciency? erarchies am
iency of clusarchitecture
ides an enhanle in terms o
ulations impecommendatiis particularl
s
simulation mSee Section
ny interferenmust be conste average dipectral effici
perspectivealysis). The t of both solu
rmance, withed on the LT
uation of a sation) of WP
ork enhanceme task is to a
e implementation, comple
mong clusters
tering and ine. The evaluancement of tf user-level p
plementing cions on netwy performing
methodologyn 3 for a wh
nce mitigatiosidered as piversity gainency is 5.2bp
s: network pconsideratio
utions.
hout any speTE coverage
selected subsP3.
ment solutionswer the fo
ation? xity issue) is
of users?
nterference pation of the rthe overall nperformance
clustering crwork implemeg. Complexi
and simulahole descripti
n, therefore essimistic. T
n, but do notps/Hz.
performance ons made w
ecific coopesimulator in
set of the al
ons and giviollowing que
s reduced?
planning algoresults will a
network perfoes or fairness
riteria with entation, higity issues wi
ation paramion of the si
outputs expThe simulatt consider an
68
(system-ithin this
eration or ntroduced
lgorithms
ing some stions:
orithms at address if ormances .
solutions ghlighting ll also be
meters are imulation
ressed as ion tools ny spatial

69
System
Technology LTE FDD
Frequency band 2.0GHz
Channel bandwidth 210MHz
Macro layout (optional)
Sectorisation Three sectors (or cells) per site
Macro network design - Hexagonal site deployment
- Two rings around the central site, i.e. 19 sites corresponding to 57 cells
Environment - Urban
- Suburban
Inter-site distance (ISD) - Urban: 500m
- Suburban: 1732m
Average MBS (macro base station) density
- ISD=500m: 4.62 sites/km², 13.86 MBS/km²
- ISD=1732m: 0.38 sites/km², 1.15 MBS/km²
MBS antenna height 32m
MBS total transmit power 46dBm
MBS antenna Directional, 14dBi gain
MBS antenna elect. down-tilt - ISD=500m: 6°
- ISD=1732m: 2°
MBS nb antennas 4
Femto layout
Deployment zone Within the study area shown in Figure 57
Deployment type - Urban: in corporate buildings
- Suburban: in houses
Spectrum usage Co-channel
Access mode - Closed
- Open
FAP (femto access point) antenna height 1m above floor
FAP max transmit power - 10dBm
- 20dBm
FAP antenna Omnidirectional, 5dBi gain
FAP nb antennas 2
User
Indoor / Outdoor distribution - Indoor: 80%
- Outdoor: 20%
UE antenna height 1.5m
UE antenna Omnidirectional, 0dBi
UE noise figure 9dB
Table 5: Network parameters.

ICT-2488DocumentTitle of D
Freedom
Random FA
Path-loss (i
LTE cover
891 STP t number: M5eliverable: Int
m_5D2_DUN
AP deployment
incl. shadowing)
age
.2.2 terference chan
Nb.docx
Figure
U
S
F
F
) S
R
L
P
C
nnel model at s
57. Macro n
Urban
uburban
AP density
AP activation rat
ynthetic environm
Real environment
Link
HY/MAC layers
Coverage predictio
Table 6: Si
system level
network layo
tio
ment
abstraction
on
imulation m
out and Stu
- Randobuilding
- Uni-Reg- Non- Non
- At mo
- Rando- At mo
Variabl
Variabl
Analyti
Site-spe
DL only
- Rando- No int- No spgain - Averaeach MRB’s al- TL for- TL for
- Avera- SINR–- 3D (m
methodology.
dy area.
om distribution ofgs: iformly
gularly in staggeren uniformly – disn uniformly – dis
ost 1 FAP per 10m
om uniform distriost one FAP per h
le
le
cal models define
ecific models defi
y
om RB allocationterference managatial multiplexing
age downlink traffBS or FAP (TL =llocated by the cer MBS: 50% by dr FAP: variable
age inter-cell inter–MCS mapping
multi-floor) covera
f FAPs in corpora
ed rows (see Figustance to exterior stance to exterior m10m small-are
ibution of FAPs ihouse
ed in [D21] and [
fined in [D21] and
n gement g, only average d
ffic load (TL) assi= average percentell) default
rference calculati
age matrices
70
ate
ure 58) wall < 1m wall > 5m
ea
n houses
[D31]
d [D31]
diversity
igned to tage of
ion
MBS Study area
a

71
8.1.2 S
Scenarioarea (com Scenarioin scena20m40 Several Table 7.otherwis Three di
F C
w N
Figure 5
Scenarios IA
os IA-1 and mposed of a
o IA-1 evaluaario IA-2, FAm to 20m8
sub-scenario. The paramse mentioned
ifferent typesFAP subscribCorporate Fwhole buildiNon-subscrib
Macro network
Size of a corpo
(considering ththe surface of asingle corporat
FAP deployme
FAP distance t
FAP density
Traffic in femt
FAP Access mo
FAP max trans
58. Examp
A-1 and IA-
IA-2 evaluatfew building
ates FAP depAPs are depl0m).
os are investimeters of thed.
s of user are ber, who is lAP subscribings) as the Fber, who is n
k design
orate unit
hat all FAPs depa corporate unitte unit)
ent
to the MBS
to layout
ode
smit power
Table 7: P
le of a regu
2 – Impact o
te the impacgs only) in pr
ployments aloyed at all
igated from e reference s
evaluated:ocated in the
ber, who is lFAPs. not part of an
loyed within own to this
Parameters
ular FAP d
on local urb
ct of a FAP resence of ex
at the groundfloors of tw
changing thescenario hig
e same 10mlocated in th
ny FAP close
- ISD = 500m
- ISD = 1732m
- 10m10m sm
- One floor
- One building
- Random distri- Uniformly- Regularly i- Non uniform
- Non unifor
- Greater than
- Inferior to ISD
20% and 50% o
20% density = 0
50% density = 0
- FAP activationactive FAP’s
- Closed
- Open
- 20dBm
- 10dBm
for IA-1 an
eployment
ban corpora
deployment xisting macro
d-floor of a 2wo neighbor
e FAP propeghlighted in
10m small ahe same cor
ed subscriber
mall area
ibution of FAPs i
n staggered rowsmly – distance to
mly – distance to
ISD/3
D/3
of 10m10m sma
0.002 FAP / m² w
0.005 FAP / m² w
n ratios 50% and
nd IA-2 sub-
in staggere
te coverage
in one restrio coverage.
20m60m wibuildings of
erties and FAbold are alw
area as a FAPrporate unit
r group.
n corporate build
(see Figure 58) exterior wall < 1
o exterior wall > 5
all areas
within the floor
within the floor
d 100% with TL=
scenarios.
ed rows.
icted urban c
ide building,f random siz
AP locationsways applie
P. area (whole
dings:
1m
5m
=10% for
corporate
, whereas ze (from
s given in d, unless
e floor or

ICT-2488DocumentTitle of D
Freedom
8.1.2.1
The locaexampleFAP andcalculateresponsibthis one The indoSINR sigFAP; upFAPs. UFAPs, SassumedFAP. FinFAPs; th
Figure 6the sameincrease SINR m38dB in Thus, FAsubscribobserved
891 STP t number: M5eliverable: Int
m_5D2_DUN
Scenario IA
al impact of e in Figure 59d one activeed for a newble of the inis the best se
oor SINR forgnificantly i
p to 5dB at 3Users inside INR levels i
d to be non-snally, Figurehe SINR leve
Figure 59
60 shows the e range as aby up to 36
map for non-sareas located
APs have a ers, at the sad from the w
.2.2 terference chan
Nb.docx
IA-1 – Impac
FAPs on SI9 shows SINe FAP depl
w connectingnitial FAP acerver.
r the macro-oncrease in o0m indoors. the FAP sm
increase by usubscribers: e 59 (d) showels decrease u
. Scenario I
SINR maps at ground flo6dB in the asubscribers ind above the a
significant imame floor bu
whole random
nnel model at s
ct of a single
INR maps mNR maps simloyed at theg user who mctivity, i.e. th
only networkopen-access m
Figure 59 (cmall areas arup to 65dB. the SINR le
ws the SINR up to 54dB i
IA-1 – SINR
at the first foor. The SINareas locatedn presence oactive FAP.
mpact on theut also at nei
m simulation
system level
e-floor FAP
may be obsermulated at thee ground-floomay be locahis new user
k ranges frommode: up to c) illustrates re assumed On the other
evels decreasmap for non
in the active
R maps at th
floor. The SINR levels ind just abovef closed-acc
e SINR leveighbor floorsin terms of s
deployment
rved from eae ground-flooor of one o
ated at any pr can be conn
m –2dB to 965dB in thethe SINR leto be FAP r hand, usersse up to 38d
n-subscribersFAP small-a
e deploymen
INR levels frn the two-tie the FAPs. ess FAPs. Th
els experiencs. The next sspectral effic
on network
ach random For of two bu
of these builpixel in the mnected to the
dB, wherease same 10mevels in presesubscribers: s outside thedB within 20s still in presearea.
nt floor (gro
rom the macrer network iFinally, Figuhe SINR lev
ced by FAP subsections diency distrib
coverage
FAP realizauildings fromldings. The map, and we initially idl
s the two-tier10m small ence of closeas with ope
e FAP small-0m around tence of close
ound floor).
ro-only netwin open-acceure 60 (c) sh
vels decrease
subscribers deals with th
butions.
72
tion. The m one idle
SINR is ho is not le FAP is
r network area as a ed-access en-access -areas are the active ed-access
work have ess mode hows the
e by up to
and non-he impact

73
Firstly, wFAP. Figure 6network FAPs enmaximumopen-accto neighnetwork than 2bpnetwork (<ISD/3)
Figur
we focus on
61 compares(MBS + FA
nable a tremm spectral ecess mode. T
hbor FAPs ifcannot prov
ps/Hz and 1configuratio
) in the refer
re 61. Scenar
Figure 60.
n the impact
s the spectraAP) for FAP
mendous imprefficiency ofThe differencf one of thosvide such spe00% above
ons: a macro rence macro n
rio IA-1 - Sp
. Scenario IA
for FAP su
al efficiencyP subscribersrovement in f the systemce comes fromse FAPs becectral efficien
3.6bps/Hz. network wit
network.
pectral efficexperience
A-1 – SINR
ubscribers loc
y CDFs in ts. The threethe coverag
m (5.2bps/Hzm the fact th
comes its besncy: 88% ouFigure 62 p
th an ISD of
ciency CDFsd by a FAP
R maps at the
cated in the
the macro-one cases provige quality sinz) is 10% inhat, in open-ast-server. On
utage probabiprovides thef 1732m and
s of macro osubscriber.
e first floor.
same 10m
nly networkide full servnce the outa
n closed-acceaccess mode,n the other hility for spec
comparisona FAP deplo
nly and two
10m small
k and in thevice coveragage probabiliess mode an, the user canhand, the mactral efficiencns for two aoyment at sh
o-tier networ
area as a
e two-tier e but the ity of the nd 5% in n connect acro only cy higher additional hort range
rks, as

ICT-2488DocumentTitle of D
Freedom
Figure
Figure 6subscribdensity=maximum
Figure
SecondlyFAPs. TFAPs arewho belo Figure 6floor. Inprobabilof 1732mlower. Omacro on
891 STP t number: M5eliverable: Int
m_5D2_DUN
e 62. Scenari
63 illustrates ers. The ben
=50% or FAm spectral ef
63. Scenari
y, we focus oThese results e in open-acongs to the C
64 illustrates n the referencity of the mam, the spect
On the opposnly spectral e
.2.2 terference chan
Nb.docx
io IA-1 – Im
the impact nefit is sligh
AP activatiofficiency of t
io IA-1 - Imp
on the impacillustrate th
cess mode; oClosed Subsc
the impact oce scenario, aximum spectral efficiencsite, at short efficiency is
nnel model at s
mpact of netwby a
of some FAPhtly lower wn ratio=100the system (5
pact of FAPFA
ct for corporae performanor (2) FAPs criber Group
of FAPs on ththe average
ctral efficiency increase range, the spbetter and th
system level
work properFAP subscr
P propertieswhen the FA0%) or whe5.2bps/Hz) is
P properties AP subscrib
ate FAP subsnce that shouare in closed(CSG) of al
he spectral e spectral eff
ncy (5.2bps/His higher sinpectral efficihe MBS-to-F
rties on specriber.
on the specAP-to-FAP inn the FAP s reached wi
on spectral ber.
scriber, who uld be experid-access and l FAPs.
fficiency CDficiency increHz) is 75%. Fnce the MBiency increasFAP interfere
ctral efficien
ctral efficiencnterference ltransmit po
th 5% to 26%
efficiency, a
is located inienced in twthe predicte
DFs at the wheases by 1bpFor a macro S-to-FAP inse is significence levels a
ncy, as expe
cy predictedlevel increasower decrea% outage pro
as experienc
n the same flowo different ced user is a s
hole FAP depps/Hz and thnetwork wit
nterference lcantly lower are higher.
74
rienced
d for FAP ses (FAP ases. The obability.
ced by a
oor as the cases: (1) ubscriber
ployment he outage th an ISD evels are since the

75
Figur
Figure 6
I0
R0
Is
Figure
Finally, zones (nimpact oscenario
re 64. Scenaexperienced
65 shows the Increasing th0.9bps/Hz onReducing th0.7bps/Hz onIncreasing thspectral effic
65. Scenariocor
we focus onno service coof FAPs on t, a dead zon
ario IA-1 - Spd by a corpo
impact of sohe FAP depln average.
he FAP transn average. he FAP activciency.
o IA-1 – Imprporate FAP
n the impact overage) in ththe spectral ene of 20% of
pectral efficorate FAP su
ome FAP prooyment dens
mit power fr
vation ratio f
pact of FAPP subscriber
of a FAP dheir whole sefficiency CDf the deploym
ciency CDFsubscriber lo
operties on thsity from 20%
from 20dBm
from 50% to
P properties r located at t
deployment fsmall areas (DFs at the wment floor is
s of macro oocated at the
he spectral ef% to 50% in
to 10dBm r
o 100% does
on spectralthe FAP dep
for non-subs10mx10m).
whole FAP ds observed an
only and twoe FAP deploy
fficiency: ncreases the s
reduces the s
not have a
efficiency, aployment flo
cribers. ActiFurthermore
deployment fnd the averag
o-tier netwoyment floor
spectral effic
spectral effic
significant im
as experiencoor.
ive FAPs cree, Figure 66 floor. In the ge spectral e
rks as r.
ciency by
ciency by
mpact on
ced by a
eate dead gives the reference
efficiency

ICT-2488DocumentTitle of D
Freedom
slightly MBS sig
Figur
Figure 6floor: Incre
42% Redu Incre
Figure
8.1.2.2
Firstly, win the mnetwork the FAP
891 STP t number: M5eliverable: Int
m_5D2_DUN
decreases. Tgnal levels ar
re 66. Scenarexperi
67 shows the
easing the F%.
ucing the FAeasing the FA
67. Scenario
Scenario I
we focus on macro-only n
and for a ms enable a tre
.2.2 terference chan
Nb.docx
The dead zonre respective
rio IA-1 - Spienced by a
e impact of
FAP deploym
AP transmit pAP activation
o IA-1 – Impnon-subs
IA-2 – Impa
the impact fetwork and
macro networkemendous im
nnel model at s
ne surface isly lower and
pectral efficnon-subscri
some FAP p
ment density
power from 2n ratio from
pact of FAPscriber locat
act of a build
for FAP subsin the two-tik with an ISDmprovement
system level
s 30% for ISd greater than
ciency CDFsiber located
properties fo
from 20% t
20dBm to 1050% to 100%
P properties ted at the FA
ding FAP dep
scribers. Figuier network D of 1732min the cover
SD=1732m an in the refer
s of macro o at the FAP
or non-subsc
to 50% incre
0dBm reduce% increases t
on spectralAP deploym
ployment on
ure 68 compfor FAP sub. Both cases age quality s
and 10% at ence scenari
nly and twodeployment
cribers locate
eases the dea
s the dead zothe dead zon
efficiency, ament floor.
n network cov
ares the specbscribers forprovide full
since the outa
short range io.
o-tier networt floor.
ed at the dep
ad zone from
one to 13%. ne to 35%.
as experienc
verage ctral efficienr the referenl service covage probabil
76
since the
rks, as
ployment
m 20% to
ced by a
ncy CDFs ce macro erage but lity of the

77
maximumaccess mneighbornetwork than 2bp
Figur
Figure 6subscribdensity=maximum
Figure
Figure 7same inefficiencsystem (
m spectral efmode. The dir FAPs if oncannot prov
ps/Hz and 10
re 68. Scenar
69 illustrates ers. The ben
=50% or FAm spectral ef
69. Scenari
70 illustrates nside FAP acy since the (5.2bps/Hz) i
fficiency of ifference comne of those
vide such spe00% above 3.
rio IA-2 - Sp
the impact nefit is bare
AP activatiofficiency of t
io IA-2 - Imp
the impact areas. FAP
FAP-to-FAis reached wi
the system (mes from theFAPs becom
ectral efficien.6bps/Hz in t
pectral efficexperience
of some FAPely lower won ratio=100the system (5
pact of FAPFA
of FAP locadeployment
AP interferenith 3% outag
(5.2bps/Hz) ie fact that, imes its bestncy: 92% outhe reference
ciency CDFsd by a FAP
P propertieswhen the FA0%) or whe5.2bps/Hz) is
P properties AP subscrib
ations. The sin staggere
nce is lowerge probability
is 7% in closin open-accet-server. On utage probabie scenario.
s of macro osubscriber.
on the specAP-to-FAP inen the FAP s reached wi
on spectral ber.
spectral efficed rows proed: the maxy against 7%
sed-access mss mode, thethe other h
ility for spec
nly and two
ctral efficiencnterference l
transmit pth 7% to 16%
efficiency, a
iency distribovides a sliximum spect
% for other FA
mode and 4%e user can co
hand, the mactral efficienc
o-tier networ
cy predictedlevel increas
power decrea% outage pro
as experienc
butions are bightly bettertral efficiencAP locations
% in open-onnect to acro only cy higher
rks, as
d for FAP ses (FAP ases: the obability.
ced by a
barely the r spectral cy of the .

ICT-2488DocumentTitle of D
Freedom
Figure
Secondlyas the Fexperienaccess anFAPs. Figure 7referenceoutage pan ISD oare lowe
Figurex
Figure 7
It
891 STP t number: M5eliverable: Int
m_5D2_DUN
e 70. Scenar
y, we focus FAPs or in tnced in two nd the predic
71 illustrates e scenario, t
probability ofof 1732m, ther.
re 71. Scenarxperienced b
2 shows the Increasing ththe maximum
.2.2 terference chan
Nb.docx
rio IA-2 - Im
on the impacthe surrounddifferent cascted user is a
the impact othe average sf the maximuhe spectral ef
rio IA-2 - Spby a corpora
impact of sohe FAP deplm spectral ef
nnel model at s
mpact of FAFA
ct for corpording streets.ses: (1) FAPa subscriber w
of FAPs on tspectral efficum spectral fficiency inc
pectral efficate FAP subs
ome FAP prooyment dens
fficiency (5.2
system level
AP locationsAP subscrib
rate FAP subThese resul
Ps are in opwho belongs
the spectral eciency increaefficiency (5
crease is high
ciency CDFsscriber loca
operties on thsity from 20%2bps/Hz) from
on spectral ber.
bscriber, wholts illustrate
pen-access ms to the Close
efficiency CDases by 3bps5.2bps/Hz) isher since the
s of macro oated in the F
he spectral ef% to 50% dem 60% to 43
efficiency, a
o is located ithe perform
mode; or (2) ed Subscribe
DFs in the ws/Hz, reachins 61%. For a MBS-to-FA
nly and twoAP deploym
fficiency: ecreases the 3%.
as experienc
in the same mance that s
FAPs are iner Group (CS
whole buildinng 4.1bps/Hza macro netwAP interferen
o-tier networment buildin
outage prob
78
ced by a
buildings hould be n closed-SG) of all
ng. In the z and the
work with nce levels
rks, as ngs.
ability of

79
Rte
Ime
Figure
Figure 7building
Rpr
Fs
Fse
Figure 7the FAP
Ri
Fe
Fda
Reducing ththe maximuefficiency byIncreasing thmaximum sefficiency by
72. Scenariocorpo
73 shows ths, as experieRegular FAPprobability reference sceFAP deploymspectral efficFAP deploymspectral efficefficiency).
74 shows thedeployment
Regular FAPin the referenFAP deployefficiency thFAP deploydecreased spaverage.
e FAP transmum spectral ey 1.7bps/Hz he FAP activspectral effiy 2.2bps/Hz
o IA-2 – Imporate FAP s
he impact ofenced by a coP deploymenfor the maxenario (unifoment with a ciency (66% ment with a ciency as in
e impact of Ft buildings, aP deploymennce scenarioment with a
han in the refyment with pectral effici
mit power frefficiency (5on average.
vation ratio fciency (5.2bon average.
pact of FAPubscriber lo
f FAP locatiorporate FAPnt in staggerximum specorm distributidistance to toutage probdistance to
reference sce
FAP locationas experiencent in staggere: 1.4bps/Hz a
a distance to ference scenaa distance ency than in
rom 20dBm 5.2bps/Hz) f
from 50% tobps/Hz) from
P properties ocated in the
ions on the P subscriber: red rows offctral efficienion). the exterior wbability for th
the exteriorenario (58%
ns on the speed by a corpoed rows offeragainst 1.8bp the exteriorario: 2.3bps/Hto the exter
n the referen
to 10dBm infrom 60% t
100% increm 60% to
on spectrale FAP deplo
spectral eff
fers the bestncy (5.2bps/
wall lower thhe maximum
wall greater% outage prob
ectral efficieorate FAP surs a slightly dps/Hz on aver wall lowerHz against 1rior wall gr
nce scenario:
ncreases the o 76% and
ases the outa95% and r
efficiency, aoyment build
ficiency in t
t spectral eff/Hz) compar
han 1m offersspectral effi
r than 5m ofbability for th
ency in the subscriber: decreased sperage. r than 1m of.8bps/Hz on reater than 5 1.5bps/Hz a
outage probreduces the
age probabilreduces the
as experiencdings.
the FAP dep
ficiency: 53%ared to 60%
rs a slightly diciency). ffers barely he maximum
surrounding
pectral efficie
ffers a betteraverage.
5m offers aagainst 1.8b
ability of e spectral
ity of the spectral
ced by a
ployment
% outage % for the
decreased
the same m spectral
streets of
ency than
r spectral
a slightly ps/Hz on

ICT-2488DocumentTitle of D
Freedom
Figure
Figure corpor
Finally, the servion the spof the FAefficienc(see Figu66) since
891 STP t number: M5eliverable: Int
m_5D2_DUN
e 73. Scenarcorpo
74. Scenarirate FAP sub
let us focus ice coveragepectral efficiAP deploym
cy increases bure 71). Thee FAPs are d
.2.2 terference chan
Nb.docx
rio IA-2 – Imorate FAP s
io IA-2 – Imbscriber loc
on the impa is fully deteiency CDFs
ment buildingby 3bps/Hz
e impact of thdeployed at a
nnel model at s
mpact of FAubscriber lo
mpact of FAPated in the s
act of a FAPeriorated insiin the whole
gs is not covand the outahe FAP depl
all floors.
system level
AP locationsocated in the
P propertiessurrounding
P deploymenide active FAe FAP deplovered, whereage probabilitloyment is m
on spectral e FAP deplo
s on spectralg streets of t
nt on non-subAP areas. Figoyment buildeas in open-aty of the max
much larger t
efficiency, aoyment build
l efficiency, the FAP dep
bscribers. In gure 75 give
ding. In closeaccess modeximum spectthan in scena
as experiencdings.
as experienployment bu
n closed-accees the impacted-access moe the averagetral efficiencario IA-1 (se
80
ced by a
nced by a uildings.
ess mode, t of FAPs ode, 46% e spectral cy is 61% ee Figure

81
Figur
Figure 7deploym
It
R I
Figure
Figure 8non-subslocations
re 75. Scenarexperien
76 shows thment building
Increasing thto 76%. Reducing theIncreasing th
76. Scenario
81 shows thescriber, for ds: a dead zon
rio IA-2 - Spnced by a no
he impact og: he FAP depl
e FAP transmhe FAP activ
o IA-2 – Impnon-subscr
e spectral effdifferent FAne of 45%-50
pectral efficon-subscribe
of some FA
oyment dens
mit power frovation ratio fr
pact of FAPriber located
ficiency CDFAP locations.0% for non-s
ciency CDFser located in
AP propertie
sity from 20
om 20dBm trom 50% to
P properties d in the FAP
Fs in the FA. The impactsubscriber.
s of macro on the FAP de
es for non-s
% to 50% in
o 10dBm red100% increa
on spectralP deploymen
AP deploymet of FAPs is
nly and twoeployment b
subscribers
ncreases the
duces the deaases the dead
efficiency, ant buildings.
nt buildings,s barely the
o-tier networbuildings.
located in
dead zone fr
ad zone to 24d zone to 72%
as experienc.
, as experiensame for co
rks, as
the FAP
from 46%
4%. %.
ced by a
nced by a onsidered

ICT-2488DocumentTitle of D
Freedom
Figure
Figure 7the FAP
I R F
2 F
5
Figuren
8.1.3 S
Scenarioscale ana
891 STP t number: M5eliverable: Int
m_5D2_DUN
e 77. Scenar
78 shows thedeployment
In the referenRegular FAPFAP deploym27%. FAP deploym5%.
e 78. Scenarnon-subscrib
Scenario IA
o IA-3 evaluaalyses are pe
.2.2 terference chan
Nb.docx
rio IA-2 – Imnon-subscr
e impact of Ft buildings, ance scenarioP deploymenment with a
ment with a
rio IA-2 – Imber located i
A-3 – Impact
ates the impaerformed in b
nnel model at s
mpact of FAriber located
FAP locationas experience, a 10% dead
nt in staggeredistance to t
distance to t
mpact of FAn the surrou
t on urban n
act of a densboth syntheti
system level
AP locationsd in the FAP
ns on the speed by a non-sd zone is obsed rows reduthe exterior w
the exterior w
AP locationsunding stree
network cov
se corporate Fic and real en
on spectral P deploymen
ectral efficiesubscriber: served. ces the dead wall lower th
wall greater t
on spectral ets of the FA
verage
FAP deploymnvironments.
efficiency, ant buildings.
ency in the s
zone to 4%.han 1m incre
than 5m redu
efficiency, aAP deployme
ment in an u
as experienc.
surrounding
. eases the dea
uces the dea
as experiencent building
urban networ
82
ced by a
streets of
d zone to
d zone to
ced by a gs.
rk. Large-

83
8.1.3.1
The sam2). Simudata that
Table 8
Figure 7real envtwo-tier observedtwo-tier Main exprovidesresult ofnetworkspattern aSuch adjIt is decirealistic
Figur
Initial simu
me scenario dulations in ret represents t
Macro netwo
FAP density
FAP propert
Traffic in fem
FAP access m
8: Scenario
79 and Figureironments fonetwork, CD
d in the macrnetwork as w
xplanation iss much highf a long expes. In particu
and the anguljustment is nided to contiresults.
re 79. Scenarexperience
ulations from
described aboeal environmthe downtow
ork design
ties
mto layout
mode
IA-3 – Simu
e 80 show thor respectiveDFs are givero only netwwell.
s that the SIher inter-cell erience in mular, the molar signal dis
not present ininue IA-3 stu
rio IA-3 - Sped by an ind
m both real a
ove is simulments use sitewn area of a E
- ISD = 500m
- Corporate rabuildings and
- FAP density
- Transmit pow
- FAP activati
- TL for active
- Open
- Closed
ulation para
he spectral efely an indooen in both op
work, especia
IRADEL siteinterference
model tuning odel tuning tspersion at thn the analyticudy with rea
pectral efficdoor non-sub
and syntheti
ated in bothe-specific m
European larg
m
atio within the stuall buildings): 20
y within corporate
wer: 20dBm.
ion ratio: 50%
e FAP’s = 10%
ameters used
fficiency CDor non-subscrpen and clos
ally for an ou
e-specific pre in the vicibased on se
takes into ahe base-statiocal path-loss al environme
ciency CDFsbscriber – in
ic environme
synthetic anmodels [FREE
ge city.
udy area (i.e. ratio0%
e buildings: 20%.
d in both rea
DFs obtainedriber and ansed access mutdoor user. I
ropagation minity of the everal benchaccount the on. model used
ent only, as t
s of macro on real and sy
ents
nd real envirEDOM-D21]
o between corpora
al and synth
from simulan outdoor nomodes. SignifIt leads to lar
models used macro base
hmarks in opinteraction b
in synthetic this is the on
nly and twoynthetic env
ronments (se] and 3D ve
rate
hetic environ
ation in synton-subscriberficant differe
arge differenc
in real env-stations. Th
perational 2Gbetween the
environmentne providing
o-tier networvironments.
ee section ector map
nments.
thetic and r. For the ences are ces in the
vironment his is the G and 3G e antenna
ts. the most
rks, as

ICT-2488DocumentTitle of D
Freedom
Figur
Remark areas (esanalytica
8.1.3.2
Figure 8for an i(describeoutage pzone of dead zonnot reallysame res
Figur
Scenariooutcome
891 STP t number: M5eliverable: Int
m_5D2_DUN
re 80. Scenarexperienced
the differencspecially becal models in
Impact of F
81 shows theindoor non-sed in Table probability co14% is obse
ne to 3% in y impacted. sults as the se
e 81. Scena
o IA-3 is fures have main
.2.2 terference chan
Nb.docx
rio IA-3 - Spd by an outd
ce between acause the angIA-4 suburb
FAP propert
e spectral effsubscriber. I8) on spectrompared to erved. Besidclosed acceA third sub-econd sub-sc
ario IA-3 - Sp
rther exploitely been gene
nnel model at s
pectral efficdoor non-su
analytical andgular dispers
ban scenarios
ties on spect
ficiency CDFIt illustratesral efficiency1.8bps/Hz in
des, reducingss-mode. In scenario withcenario.
pectral efficexperienc
ed for througerated for bus
system level
ciency CDFsubscriber – i
d site-specifision at the bs, as presente
tral efficienc
Fs of the macs the strong y: In open an the macro g the FAP ac
open accessh 10% FAP
ciency CDFsced by an in
ghput and msiness model
s of macro oin real and s
ic path-loss mase-station is
ed in section
cy distributio
cro only netwimpact of
access-mode,only networctivation ratis-mode, the activation ra
s of macro odoor user.
macro-offloadl study, they
nly and twosynthetic env
models is nots significantl0, is thus per
on
work and of FAPs in th, 5.2bps/Hz rk. In closed io from 50%spectral effic
atio and 50%
only and two
d assessmentare summar
o-tier networvironments.
ot as large in ly lower). Thrfectly relev
f the two-tierhe reference
is reached waccess-mod
% to 10% redciency distri
% traffic load
o-tier netwo
t. As these arized in sectio
84
rks, as .
suburban he use of ant.
r network scenario
with 85% de, a dead duces the ibution is gives the
rks, as
additional on 9.2.3.

85
8.1.4 S
Scenariomacro co Several sof the re
A first reload. Figure 8network access m Note the2% outanon-substhe housand 30%
Figur
Figure 8can takeprobabilwhen tra
Scenario IA
o IA-4 evaluoverage. Sim
sub-scenarioference scen
Macro ne
FAP dens
FAP prop
Traffic in
FAP acce
esult is the e
82 comparesfor an indoo
mode.
e large increaage) or for anscribers in clse surface. In
% of the hous
re 82. Scenar
83 gives simie advantage ity for spect
affic load is 1
A-4 – Impact
uates the impmulations are
os are investinario highligh
etwork design
sity
perties
n femto layout
ess mode
Table 9
evolution of o
the spectraor user locate
ase in spectrny user in oplosed-accessncreasing trae surface res
rio IA-4 - Spexpe
ilar result buof open-acc
tral efficienc10%. It decre
t on suburba
pact of a FAP conducted i
gated from chted in bold a
- ISD = 17
- Density o
- FAP depl
- Transmit
- FAP activ
- TL for ac
- Open
- Closed
9: Scenario
outage proba
l efficiency ed in a house
ral efficiencypen-access m mode (i.e. m
affic load frospectively.
pectral efficerienced by
ut for an indoess FAP cov
cy 3.0bps/Hzeases only to
an network
P deploymenin synthetic e
changing theare always a
732m
of houses with ne
loyment probabil
t power: 20dBm
vation ratio: 10%
ctive FAP’s = 10%
IA-4 – Simu
ability agains
CDFs in boe with a FAP
y for a subscmode. Note amacro deadz
om 10% to 30
ciency CDFs
an indoor u
oor user locaverage from z decreases fo 72% when
coverage
nt in residenenvironment
e parameters applied, unles
etwork subscriber
lity in a house: 50
%, 25% and 50%
% , 30% and 50%
ulation para
st spectral ef
oth the macrP, considering
criber in closalso the largezone). Servic0% and 50%
s of macro ouser in FAP
ated in a houFAPs deplo
from 89% inthe traffic lo
ntial areas in.
given in Tabss otherwise
rs: 123 house/km2
0%
%
ameters.
fficiency acc
ro-only netwg deploymen
sed-access me reduction oe is availabl
% reduces the
nly and twoarea
use without aoyed in neign the macro-ooad is 50% (b
n presence of
ble 9. The pamentioned.
2
cording to FA
work and thents in closed-
mode (5.2bpsof the servicele in less thane service are
o-tier networ
any FAP. Thghbor housesonly network(because of a
f existing
arameters
AP traffic
e two-tier - or open-
s/Hz with e area for n 38% of
ea to 32%
rks, as
hese users s. Outage k to 61% additional

ICT-2488DocumentTitle of D
Freedom
interferepercenta
Figur
Tabaccor
Figure 8the two-probabilnetwork strongly
891 STP t number: M5eliverable: Int
m_5D2_DUN
ence. Besideage decrease
re 83. Scenar
ble 10: Scenrding to FA
84 shows the-tier networity increaseto 76%. In depend on th
.2.2 terference chan
Nb.docx
es, the impafrom 100% t
rio IA-4 - Spexperienc
narios IA-4AP traffic lo
e outdoor (i.erk. In closeds; i.e. the 3open-access he FAP traff
nnel model at s
act of closeto respective
pectral efficced by an ind
4 – Macro ooad for an i
e. in-street) d access mo3bps/Hz spemode, the o
fic load. Tabl
system level
ed-access mely 79% and
ciency CDFsdoor user in
only and twindoor user
spectral effiode FAPs bectral efficieoutage probale 11 gives a
mode FAPs 63% (see Ta
s of macro on houses wit
wo-tier netwr located in
ciency CDFbehave onlyency increasability decreaadditional res
makes the able 10).
nly and twohout FAP.
work outagn a house w
s of the macas interfere
e from 71%ase significansults for a tra
indoor serv
o-tier networ
ge probabilwithout any
cro only netwrers, thus th% in the mantly, but the affic load of
86
vice area
rks, as
lities y FAP.
work and he outage acro-only decrease
30%.

87
Figur
Tab
Figure 8FAP submacro-oadvantagfor traffi Second rFigure 8for activ
re 84. Scenar
ble 11: Scenacco
85 shows thebscribers in cnly networkge of FAP coic loads of 30
result is the 86. The macrvation ratios 5
rio IA-4 - Spexpe
narios IA-4ording to F
e spectral effclosed-accessk to 68% at overage from0% and 50%
evolution ofro indoor de50%, 25% an
pectral efficerienced by
4 – Macro oFAP traffic
ficiency CDFs mode, the o
3bps/Hz spm FAPs deplo%.
f outage probad-zone surfnd 10%.
ciency CDFs
an outdoor
only and twload for an
Fs outside inoutage probapectral efficioyed in neigh
bability as aface percenta
s of macro or (in-street) u
wo-tier netwn outdoor (
n the house lability signifiiency. In ophbor houses.
a function ofage reaches
nly and twouser.
work outag(in-street) u
lot where a icantly decrepen-access m. Table 12 gi
f the activatiorespectively
o-tier networ
ge probabiluser.
FAP is instaeases from 94mode, users ives addition
on ratio, as y 62%, 34%
rks, as
lities
alled. For 4% in the can take
nal results
shown in and 15%

ICT-2488DocumentTitle of D
Freedom
Figur
Tabac
Figur
891 STP t number: M5eliverable: Int
m_5D2_DUN
re 85. Scenarex
ble 12: Scenccording to
re 86. Scenarexperience
.2.2 terference chan
Nb.docx
rio IA-4 - Spperienced b
narios IA-4o FAP traff
rio IA-4 - Sped by an ind
nnel model at s
pectral efficby an outdoo
4 – Macro ofic load for
pectral efficdoor user in
system level
ciency CDFsor user locat
only and twr an outdoor
ciency CDFsFAP area fo
s of macro oted outside i
wo-tier netwr user locate
s of macro ofor different
nly and twoin its house l
work outaged outside in
nly and twoFAP activa
o-tier networlot.
ge probabiln its house lo
o-tier networation ratios.
88
rks, as
lities ot.
rks, as

89
The impconstant the interclosed-a
Tab
Third reconsider(50%). For outd
Ft
Ft
For outd F
s F
8.1.5 Sc
Scenarioarea (coscenarioscenario Two diff
F C
w
pact of FAPt traffic load rference leveaccess mode.
ble 13: Scenaccordin
esult is the ring similar
door users wiFAP traffic lto 7% with 3FAP traffic lto 19% with
door users wiFAP traffic subscriber hoFAP traffic l
Scenarios Icoverage)
os IA-5 and mposed of as IA-1 and Is details.
ferent types oFAP subscribCorporate Fwhole buildi
activation r(10%) are su
els, thus lead
narios IA-4ng to activa
evolution oFAP density
ith FAP closeload = 10%:360 subscribeload = 50%:360 subscrib
ith FAP openload = 10%
ouse/km² andload = 50%:
A-5 and IA
IA-6 evaluata few buildiIA-2, except
of user are evber, who is lAP subscribings) as the F
ratio in bothummarized i
ds to coverag
4 – Macro otion ratio f
of the specy (50%), FA
ed-access modead-zone s
er house/km²dead-zone s
ber house/km
n-mode deplo%: the averad 0.4bps/Hz no visible ga
A-6 – FAP
te the impacngs only) inthat MBS a
valuated: ocated in the
ber, who is lFAPs.
h closed andin Table 13. ge performan
only and twfor an outd
ctral efficienAP traffic lo
ode deploymsurface incre². surface increm².
oyment: age gain onwith 360 subain whatever
coverage in
ct of a FAP n absence ofare not taken
e same 10mlocated in th
d open-accesAs expected
nce degradati
wo-tier netwdoor non-su
ncy accordinoad (10% or
ment: eases from 2%
eases from 7%
n spectral efbscriber hour the subscrib
n urban cor
deployment f any macro n into accoun
10m small ahe same cor
ss modes ford, higher activion. This deg
work outagubscriber (i
ng to subscr 50%) and
% with 123
% with 123
fficiency is se/km². ber house den
rporate are
in one restricoverage. T
nt. Thus, refe
area as a FAPrporate unit
or outdoor uivation ratiosgradation is
ge probabilin-street).
criber house FAP activat
subscriber h
subscriber h
0.2bps/Hz w
nsity is.
ea (no initia
icted urban cThey are theer to section
P. area (whole
sers with s increase higher in
lities
density, tion ratio
ouse/km²
ouse/km²
with 123
al macro
corporate e same as
8.1.2 for
e floor or

ICT-2488DocumentTitle of D
Freedom
8.1.5.1
Firstly, wFAP. Figof the min open-connect
Figu
Figure 8subscribdensity=transmit
Figure
SecondlyFAPs. TFAPs arewho belo Figure 8scenarioexisting
891 STP t number: M5eliverable: Int
m_5D2_DUN
Scenario IA
we focus ongure 87 com
maximum spe-access modto neighbor F
ure 87. Scen
88 illustrates ers. The ben
=50% or FApower is alm
88. Scenari
y, we focus oThese results e in open-acongs to the C
89 gives the , the averagmacro cover
.2.2 terference chan
Nb.docx
IA-5 – Spectr
n the impact mpares the spectral efficiene. The diffeFAPs if one
nario IA-5 - S
the impact nefit is sligh
AP activationmost the sam
io IA-5 - Imp
on the impacillustrate th
cess mode; oClosed Subsc
spectral effge spectral erage (see Fig
nnel model at s
ral efficiency
for FAP suectral efficiency of the sy
erence comesof those FAP
Spectral effi
of some FAPhtly lower wn ratio=100%
me as for 20dB
pact of FAPFA
ct for corporae performanor (2) FAPs criber Group
ficiency CDFfficiency is
gure 64). It al
system level
y of a single
ubscribers locency CDFs inystem (5.2bps from the fPs becomes
ficiency CDF
P propertieswhen the FA%). HoweveBm.
P properties AP subscrib
ate FAP subsnce that shouare in closed(CSG) of al
Fs at the wh3.6bps/Hz a
lso shows th
e-floor FAP d
cated in the n the two-tieps/Hz) is 10%fact that, in its best-serve
Fs, as experi
on the specAP-to-FAP iner, the spec
on spectral ber.
scriber, who uld be experid-access and l FAPs.
hole FAP deagainst 2.2bpe impact of s
deployment same 10m
er network: th% in closed-open-access
er.
ienced by a F
ctral efficiencnterference ltral efficien
efficiency, a
is located inienced in twthe predicte
eployment flps/Hz in thesome FAP pr
10m small the outage pr-access modes mode, the
FAP subscr
cy predictedlevel increas
ncy for 10dB
as experienc
n the same flowo different ced user is a s
loor. In the e same scenroperties:
90
area as a robability e and 3% user can
riber.
d for FAP ses (FAP Bm FAP
ced by a
oor as the cases: (1) ubscriber
reference ario with

91
I0
R
I
Figure
8.1.5.2
Figure 9maximumaccess m
Figu
Figure 9subscribdensity=transmit
Increasing th0.6bps/Hz onReducing the1.8bps/Hz onIncreasing th1.2bps/Hz on
89. Scenariocorpo
Scenario IA
90 compares m spectral ef
mode.
ure 90. Scen
91 illustrates ers. The ben
=50% or FApower is the
he FAP deplon average. e FAP transmn average. he FAP actin average.
o IA-5 – Imporate FAP s
IA-6 – Spectr
the spectral fficiency of
nario IA-6 - S
the impact nefit is sligh
AP activatione same as wit
oyment dens
mit power fro
ivation ratio
pact of FAPubscriber lo
ral efficiency
efficiency Cthe system (
Spectral effi
of some FAPhtly lower wn ratio=100%th 20dBm.
sity from 20%
om 20dBm t
o from 50%
P properties ocated in the
y of a buildi
CDFs in the tw(5.2bps/Hz) i
ficiency CDF
P propertieswhen the FA%). Howeve
% to 50% inc
o 10dBm red
to 100% re
on spectrale FAP deplo
ng FAP dep
wo-tier netwis 7% in clos
Fs, as experi
on the specAP-to-FAP iner, the spectr
creases the sp
duces the spe
educes the sp
efficiency, aoyment build
loyment work: the outased-access m
ienced by a F
ctral efficiencnterference lral efficienc
pectral effici
ectral efficien
pectral effic
as experiencdings.
age probabilmode and 4%
FAP subscr
cy predictedlevel increas
cy with 10dB
iency by
ncy by
ciency by
ced by a
lity of the % in open-
riber.
d for FAP ses (FAP Bm FAP

ICT-2488DocumentTitle of D
Freedom
Figure
Figure 9subscribdeployminterfere1% outa
Figure
SecondlyFAPs. TFAPs arewho belo Figure 9scenarioexisting against 6
2 R
e
891 STP t number: M5eliverable: Int
m_5D2_DUN
91. Scenario
92 illustrateers. The sp
ment in staggence is lowerge probabilit
e 92. Scenar
y, we focus oThese results e in open-acongs to the C
93 gives the , the averagmacro cove
61% (see Fig20% FAP deReducing thefficiency.
.2.2 terference chan
Nb.docx
o IA-6 – Imp
s the impacpectral efficgered rows pred: the maxty against 5%
rio IA-6 - Im
on the impacillustrate th
cess mode; oClosed Subsc
spectral effge spectral eerage; and tgure 71). It alensity is enouhe FAP tran
nnel model at s
pact of FAPFA
ct of FAP liency distribprovides a sximum spect%-7% for oth
mpact of FAPFA
ct for corporae performanor (2) FAPs criber Group
ficiency CDFfficiency is the outage plso shows theugh since 50nsmit power
system level
P properties AP subscrib
locations onbutions are slightly bettetral efficiencher FAP loca
P locationsAP subscrib
ate FAP subsnce that shouare in closed(CSG) of al
Fs at the wh4.8bps/Hz a
probability oe impact of F% FAP dens
r from 20dB
on spectralber.
n the spectrabarely the
er spectral ecy of the sysations.
on spectral ber.
scriber, who uld be experid-access and l FAPs.
hole FAP deagainst 2.5bpof the maximFAP propertisity does not Bm to 10dB
efficiency, a
al efficiencysame insid
efficiency sinstem (5.2bps
efficiency, a
is located inienced in twthe predicte
eployment flps/Hz in themum spectraies: increase the m does not
as experienc
y predicted de FAP arence the FAPs/Hz) is reac
as experienc
n the same flowo different ced user is a s
loor. In the e same scenal efficiency
e spectral effit reduce the
92
ced by a
for FAP eas. FAP P-to-FAP ched with
ced by a
oor as the cases: (1) ubscriber
reference ario with y is 37%
iciency. e spectral

93
I
Figure
Figure 9building
Rs
Fp
Fe
Figure
Figure 9surroundefficiencshows th
R(
Increasing th1.8bps/Hz on
93. Scenariocorpo
94 shows ths, as experieRegular FAPspectral efficFAP deployprobability oFAP deploymefficiency th
e 94. Scenarcorpo
95 gives the sding streets ocy is 3.7bps/he impact of Regular FA(3.7bps/Hz o
he FAP actin average.
o IA-6 – Imporate FAP s
he impact ofenced by a coP deploymenciency (5.2bpyment with aof the maximment with a
han a uniform
rio IA-6 – Imorate FAP s
spectral efficof the FAP dHz and the oFAP location
AP deploymeon average).
ivation ratio
pact of FAPubscriber lo
f FAP locatiorporate FAPnt in staggerps/Hz) from a distance to
mum spectral distance to t
m distribution
mpact of FAubscriber lo
ciency CDFs deployment outage probans: ent in stagg
o from 50%
P properties ocated in the
ions on the P subscriber: red rows red37% to 27%o the exterioefficiency (5the exterior n.
AP locationsocated in the
experiencedbuildings. In
ability of the
gered rows
to 100% re
on spectrale FAP deplo
spectral eff
duces the out%.
or wall lowe5.2bps/Hz) towall greater
on spectral e FAP deplo
d by a corporn the referene maximum s
offers barel
educes the sp
efficiency, aoyment build
ficiency in t
tage probabi
er than 1m o 43%. than 5m off
efficiency, aoyment build
rate FAP subnce scenario,spectral effic
ly the same
pectral effic
as experiencdings.
the FAP dep
ility of the m
increases th
fers the same
as experiencdings.
bscriber locat, the averageciency is 76%
e spectral e
ciency by
ced by a
ployment
maximum
he outage
e spectral
ced by a
ted in the e spectral %. It also
efficiency

ICT-2488DocumentTitle of D
Freedom
Fe7
Fse
Figurecorpor
8.2 C
8.2.1 E
This Sec7.1, andevaluatioframe str The algopenetratiand the propagatthe evalu The averpanel copartitionconsiderusers un(includin For a neby a capcase of bprovides(complet20% (i.eother han
891 STP t number: M5eliverable: Int
m_5D2_DUN
FAP deployefficiency to73%. FAP deploymspectral efficefficiency to
e 95. Scenarrate FAP sub
Cell perform
Equipartitio
ction summad complemenon of interferructure, at th
orithms havion (10 to 6femto netw
tion losses amuations made
rage nominaorresponds toned band. Inr also the resunable to corng the MBS)
etwork implepacity increasband partitios the worst tely unable t
e. better netwnd outage in
.2.2 terference chan
Nb.docx
yment with ao 4.2bps/Hz a
ment with a dciency to 3.1o 86%.
rio IA-6 – Imbscriber loc
mances for
on of freque
arizes the resunting analysirence variati
he ms scale.
e been run 0 indoor FA
work. The comong all trane in [Freedom
al capacity po the case ofn order to asults in Figurerrectly perfo).
emented withse of about 1oning. On thtransmission
to communicwork conditio
creases of ab
nnel model at s
a distance toand reduces
distance to thbps/Hz and i
mpact of FAated in the s
deploymen
ency band
ults obtainedis performedion with time
for a homoAPs) addressiomparison isnsmitters. Mm-D51].
per user, mef full band ossess some ce 97, represeorm a comm
h a full band15%, while ihe other handn conditionscate in the caons at systembout 12% wit
system level
o the exteriothe outage p
he exterior wincreases the
AP locationssurrounding
nts with sh
d by means od in [Freedoe for a series
ogeneous deping a coarse
s made overMoreover, this
asured in Koverlap, whiconsiderationenting the oumunication,
d overlap, anin the same cd, in the cases: indoor Mase of full ov
m level) whenth the numbe
or wall loweprobability o
wall greater the outage prob
on spectral g streets of t
hared band
of the dynamom-D51]) des of transmis
ployment ofe band partitr two sets ofs activity can
Kbit/s/PRB, isile on the rigns about the
utage percentas a result
n increase of conditions it e of full oveUEs strongl
verlap). The n increasing ter of FAPs in
r than 1m if maximum
han 5m decrebability of m
efficiency, athe FAP dep
d allocation
mic system simeveloped by ssion events,
f 150 UEs, wion (half/half identical c
n be consider
s reported inght is reportfinal capaci
age per cell, of the surr
FAP penetrais decreased
erlap, the intly suffer frooverall outagthe number on the case of
increases thespectral effi
reases the avemaximum spe
as experiencployment bu
n
mulator (desDUN, base
, compliant w
with increaslf) between cell deploymred complem
n Figure 96.ted the outpuity, it is neci.e. the perc
rounding tra
ation is chard of about 50terference coom FAP intge decreasesof FAPs, whf band partitio
94
e spectral ciency to
erage ectral
ced by a uildings.
scribed in ed on the with LTE
sing FAP the MBS
ments and mentary to
The left ut for the cessary to entage of
ansmitters
racterized 0% in the omponent erference
s of about ile on the oned.

95
Figu
Figu
From thbetween massive Of courstechniquroom to The resu
ure 96. Ave
ure 97. Out
he above con macro netwFAP deploy
se, the test isues which, aimplementat
ults are summ
erage capac
tage percen
nsiderations,work and femyment the ovs based on anyway, havetion issues, w
marized in Ta
city per useequa
ntage per cp
one can comto network cverall systema very simplee to tackle awhich are notable 14.
er per PRBally partitio
cell. Left: fupartitioned
onclude thatcan significan
m gains majoe partition ma strongly int within the s
B. Left: full oned.
ull overlap d.
t although atntly damp in
or benefits wmethod and lencreasing nuscope of the
overlap ba
band; righ
t a first sighnterference, inhen the bandeaves room tmber of inteanalysis of t
and; right b
ht band equ
ht the band n the persped is fully ovto more sopherferers, thuthis activity.
band
ually
partition ctive of a erlapped. histicated s leaving

ICT-2488DocumentTitle of D
Freedom
TCom
8.2.2 V
In this SSection be desigapplicatiof 5-10% The systcharacte
-
-
-
The outcsection.
We presoccupanover thecomparis
8.2.2.1
The simfemto tieMUEs) o
The averand Figu
891 STP t number: M5eliverable: Int
m_5D2_DUN
Effect of iNW FAP p
Overall
Out
Table 14. Symparison b
Variable ba
Section we p6 of docume
gned as a rigions running%.
tem simulatoristics:
Scenario 1: H
Scenario 2: I
Scenario 3: I
comes in term
sent results ncy increasese whole banson of result
MBS incre
mulation resuer with potenoccupy an in
rage throughure 100, resp
.2.2 terference chan
Nb.docx
increasing penetration
Capacity
tage
ystem perfbetween ful
and partition
present the rent [Freedomgid sharing
g on a mobile
or has been
Homogeneou
Inhomogeneo
Inhomogeneo
ms of averag
in the case from 10% tnd and the ts.
easing band
ults presentedntial occupanncreasing num
hput per userectively.
nnel model at s
MUE
MUE indMUE out
FUEUE=MUE+
MUEMUE indMUE out
FUEUE=MUE+
formances vll band ovechanges w
n
results of sym-D51]. The
or as a dyne terminal, th
run for a se
us dense, (78
ous sparse, 4
ous dense, 20
ge throughpu
the femto to 100% ovefemto tier
occupancy
d in this Secncy of the whmber of band
r per PRB fo
system level
F
E door tdoor
E +FUE
E door tdoor
E +FUE
variation werlap and bwith FAP pe
ystem simulaband partitio
namic sharinhe used PRB
et of scenari
85 UEs, 254
4 buildings, 1
0 buildings,
ut per PRB a
network traerlap and in t
occupies an
ction summawhole band ands, from 10 t
or the three
Full overlap
+50% 0 0
-60% +19% -16%
0 0
30% -20%
when increaband equipaenetration.
ations, compon between tng. Indeed, t
Bs by a FUE
os considere
FAPs);
150 UEs, 60
300 UEs, 12
and outage a
ansmits overthe opposite n increasing
arize the sysnd while the o 100% of ov
scenarios is
Band equ
-
-6-3
+3+1
asing FAP partition. No
plementary tthe MBS andtraffic analyhave an occu
ed of interes
FUEs;
20 FAPs.
are reported
r the whole case in whicnumber of
stem performtransmissionverlap.
reported in
uipartition
8% 0 0
66% 35% 0 0 0
31% 13%
penetrationote that out
to those pred the femto
ysis shows thupancy level
st for the dep
in the follow
band and tch the MBS f PRBs, pro
mances consn of the MB
Figure 98, F
96
n. tage
sented in layer can hat for 3 l of order
ployment
wing sub-
the MBS transmits
oviding a
idering a S (and of
Figure 99

97
FigurFAPs)
Figbuil
Figubuil
The plotusage byof outagthe femt
re 98. Varia. Increasin
gure 99. Valdings. Incr
ure 100. Valdings. Incr
ts show howy the MBS ime for indoor o network, w
ation of perng band occ
ariation of preasing ban
ariation of preasing ban
w the same cmplies an incusers which
whose band i
rformance mcupancy by
performannd occupan
performannd occupan
conclusions crease of thr
h are those ms fixed, is po
metrics fory MBS tier.
nce metrics ncy by MBS
outage.
nce metrics ncy by MBS
outage.
can be driveroughput per
most sufferingoorly affected
r homogene Left: capa
for inhomoS tier. Left:
for inhomoS tier. Left:
en for all causer for the
g for interferd by a band o
eous scenaracity per PR
ogeneous sc: capacity p
ogeneous sc: capacity p
ases considermacro netw
rence from thoverlap incre
rio (785 UERB; right, o
cenario witper PRB; r
cenario witper PRB; r
red. Increasework, with a rhe FAPs. Beease.
Es, 254 outage.
th 4 ight,
th 20 ight,
e of band reduction havior of

ICT-2488DocumentTitle of D
Freedom
8.2.2.2
For the cof overladeployedthroughpby a grow
Figubuild
8.3 Sy
The dynof a scenvironmvariationpurpose,used as i
8.3.1 M
Very reavector mcomposethe grouthe buildsimulatioFUEs anapplies o Channel been use1. Con2. Con
path
891 STP t number: M5eliverable: Int
m_5D2_DUN
FEMTO ti
case in whichapping bandd in the cellput of indoorwth also of o
ure 101. Vadings. Incr
ystem perf
amic systemenario whosment, or becns of the re, SIR has proinput for the
Mapped sce
alistic deploymap and siteed of one ba
und). The FAding blocks on parameternd MUEs, hoon scenarios
traces are oed to generatsidering the sidering the
h obstructions
.2.2 terference chan
Nb.docx
ier increasin
h the MBS u, Figure 101l. The throur MUEs decoutage of ind
ariation of preasing ban
formances
m simulator hse characterause personselative pathloduced somesystem simu
enario
yment scenae-specific prase-station w
APs are rando(20% actualrs for each rowever theyN3 and N4.
obtained frome channel (anuser is moviuser is stati
s
nnel model at s
ng band occu
uses the whol reports the ghput of thereases steadi
door MUEs.
performannd occupan
for deploy
as been implristics vary s and objectlosses, thus e deploymenulator and pro
arios are simropagation m
with an omni-omly distribuly) have beeealized scen
y result fromAs well on s
m the procesnd path-loss)ng with veloc, but rando
system level
upancy
le band and trelevant sce
e FAPs incrily, as effect
nce metrics cy by femt
outage.
yments with
lemented to with time,
ts in the surrimplying v
nts of users iocessed to g
mulated in Pamodels (ray--directional
uted in the dien randomly nario. Scenarim two differescenarios N5
ss described ) variations o
ocity 3km/h iom surroundi
the femto neenario of 5 Freases linearlt of increasin
for inhomoo tier. Left
h mobility
evaluate systeither beca
rounding movariations onin a real urbet system me
aris dense ur-tracing in pantenna locaifferent corpodetermined
ios N1 and Nent random d5 and N6.
in section 7.over the 1-sein a random ding human a
twork occupFAP areas, inly with the ng indoor int
ogeneous sc: capacity p
tem performause transmiove around, ln interferencan environmetrics.
rban, using particular). Tated above aorate buildinas corporate
N2 have simdeployment r
.1.2. Two dicond simuladirection;
activity can p
pies an increancluding 20 bband increaterference, c
cenario witper PRB; r
mances also initters move leading to shce relations.
ment which h
a high-resolThe macro a rooftop (42ng floors, afte. Table 15
milar number runs. Same
ifferent methation duration
produce time
98
asing part buildings se, while onfirmed
th 20 right,
n the case in their
hort term To this
have been
lution 3D layout is
2m above er part of gives the of FAPs, comment
hods have n:
e-varying

99
Scenari
# FAPs
#FUEs
# outdo
# indoo
FUE mo
MBS tx
MBS an
FAP tx
FAP an
Central
Signal b
Fig
Only sce Half Half Con
usernot u
Figure 1thus chafor movstatic use
io Id
oor MUEs
r MUEs
obility
x power
ntenna gain
power
ntenna gain
l frequency
bandwidth
T
gure 102: F
enario “N1_af the indoor uf the static ussequently, 50s undergo chundergo any
03 gives thearacterizes chving users (1er to another
N1 98
98
8
47
moving
Table 15: Si
FAP and us
a” is making users are consers have no 0% indoor uhannel variatchannel vari
e statistical dhannel variat1.4dB againsr; a standard
N1_a 98
98
8
47
50% moving /
50% static
m
imulation p
er distribus
use of this snsidered statisurrounding
users undergotions resultiniation.
distribution otions for botst 0.1dB), hodeviation gre
N2 98
98
7
46
moving m
4
1
2
2
10
parameters
ution in the scenario N3
second approic; g human activo channel vang from surro
of the channeth static and owever the reater than 6d
N3 N154 1
154 1
7 1
50 5
moving mo
6dBm
10dBi
0dBm
5dBi
2GHz
0MHz
s for mappe
street and 3.
oach, where
vity; riations simiounding hum
el gain standmoving use
channel behdB is observe
N4 N551 19
51 19
10 13
52 40
oving mov
ed scenario
building gr
ilar to scenarman activity;
dard deviatioers. Median vhavior is veryed for 5% sta
5 N6 99 201
99 201
3 13
0 42
ving movin
os.
round-floo
rio “N1”; 2525% indoor
on over 1 secvalue is muc
ry different fatic users.
ng
or in
% indoor r users do
cond, and ch higher from one

ICT-2488DocumentTitle of D
Freedom
Figure 1the user on a dom
Figu
Figuremovin
8.3.2 S
The sumscenario
891 STP t number: M5eliverable: Int
m_5D2_DUN
04 gives anoconsidered a
minant path.
ure 103: Stduratio
(ae 104: Timeng in scenar
System beha
mmary of re is reported i
.2.2 terference chan
Nb.docx
other illustratas moving an
andard devn, for diffe
a) Moving use-varying prio “N1” an
avior
esults producin Table 16,
nnel model at s
tion of the hnd (b) the sam
viation of trent user c
ser. path-loss fornd (b) cons
in sc
ced by runnincluding ch
system level
human activitme user cons
the averagecategories s
r a FAP-FUidered as s
cenario “N1
ning the systharacteristics
ty impact, timsidered as sta
e channel gasimulated in
(b) Static us
UE link whstatic with s1_a”.
tem simulato of the differ
me variationsatic with an o
ain over thn scenario
er with surrou
here FUE issurroundin
or with a rerent deploym
ns are observeobstruction o
he 1s simula
“N1_a”.
unding human
s (a) considng human a
ealistic, timements.
100
ed for (a) occurring
ation
n activity.
dered as activity
e-varying

101
deployment 'SIR_N1' 'SIR_N1_a' 'SIR_N2' 'SIR_N3' 'SIR_N4'FUEs 98 98 98 154 151 UEs 153 153 151 211 213
FAP_on_balcony 0 0 0 0 0 MUE_indoor 47 47 46 50 52
MUE_outdoor 8 8 7 7 10 capaMUEs_overall 95.3 97.0 69.8 65.7 77.5
capaMUEs_out 192.5 187.7 182.6 98.7 185.6 capaMUEs_in 78.7 81.6 52.7 61.0 56.6 outageMUE 0.42 0.42 0.42 0.39 0.48
outageMUEin 0.49 0.49 0.46 0.42 0.58 outageMUEout 0 0 0.1429 0.1429 0
capaFUEs 254.2 233.3 255.7 219.7 187.3 outageFUE 0.18 0.17 0.13 0.16 0.19 capaFAPs 61.3 57.5 62.9 54.4 45.1 outageFAP 0.18 0.17 0.13 0.1558 0.19 outageUE 0.27 0.26 0.23 0.2180 0.28
capa_overallUE 167.2 158.4 168.4 153.1 128.9 UE 153 153 151 211 213
FAP 98 98 98 154 151
Table 16. System performances for different realizations of a mapped scenario, based on SIR realizations. The meaning of the adopted variables is explained in the following
Table 17.
FUEs Number of FUEs
UEs Number of overall UEs FAP_on_balcony Number of FAPs on balcony
MUE_indoor Number of MUEs indoor MUE_outdoor Number of MUEs outdoor
capaMUEs_overall Capacity of all MUEs, in Kbit/s/PRB capaMUEs_out Capacity of MUEs outdoor only, in Kbit/s/PRB capaMUEs_in Capacity of MUEs indoor only, in Kbit/s/PRB outageMUE Outage of all MUEs (ratio, percentage/100)
outageMUEin Outage of MUEs indoor only (ratio, percentage/100) outageMUEout Outage of MUEs outdoor only (ratio, percentage/100)
capaFUEs Capacity of FUEs, in Kbit/s/PRB outageFUE Outage of FUEs (ratio, percentage/100) capaFAPs Capacity of FAPs, in Kbit/s/PRB outageFAP Outage of FAPs (ratio, percentage/100) outageUE Outage of overall UEs (ratio, percentage/100)
capa_overallUE Capacity of overall MUEs, in Kbit/s/PRB UE Number of UEs (MUEs and FUEs)
FAP Number of FAPs
Table 17. Meaning of system variables. The plots in Figure 105, Figure 106 and Figure 107 report the temporal variation of MUEs, FAPs and FUEs SINR and capacity for SIR scenario N1, with a summary of average throughput per user in Figure 108. The same can be said for Figure 109, Figure 110 and Figure 111 for the SIR scenario N1a. The change in the environment and thus on all pathloss relations among transmitters reflects in the

ICT-2488DocumentTitle of D
Freedom
SINR tethat can
Figu
Figu
Figu
891 STP t number: M5eliverable: Int
m_5D2_DUN
emporal variabe gained by
ure 105. Varcapa
ure 106. Va
ure 107. Va
.2.2 terference chan
Nb.docx
ation. The foy users.
riation of Macity per P
ariation of F
ariation of F
nnel model at s
ollowing fig
MUEs perfoRB; right,
FUEs perfocapacity pe
FAPs perfocapacity pe
system level
gures address
formance moutage. Re
ormance mer PRB; rig
ormance mer PRB; rig
s the impact
metrics for med, indoor;
metrics for mght, outage
metrics for mght, outage
on average
mapped N1blues, outd
mapped N1e.
mapped N1e.
throughput
1 scenario. door.
1 scenario.
1 scenario. L
102
per PRB
Left:
Left:
Left:

103
Figu
Figur
Figur
ure 108. Di
re 109. Varcapa
re 110. Var
istribution
riation of Macity per P
riation of F
of average
MUEs perfoRB; right,
FUEs perfocapacity pe
e throughpu
ormance moutage. Re
rmance meer PRB; rig
ut per user
etrics for med, indoor;
etrics for mght, outage
for mappe
mapped N1blues, outd
mapped N1ae.
ed N1 scena
1a scenario.door.
a scenario.
ario.
. Left:
Left:

ICT-2488DocumentTitle of D
Freedom
Figu
8.3.3 S
A compaFigure 1transmittmetrics azero outa
F
891 STP t number: M5eliverable: Int
m_5D2_DUN
re 111. Var
System met
arison of sys113 expresseters. Apart fassociated toage.
Figure 112.
.2.2 terference chan
Nb.docx
riation of F
rics
stem performed by averagfrom slight vo MUEs and
. Variation
Figure 113
nnel model at s
FAPs perforcapacity pe
mance for the e throughpu
variations in d FUEs. For
n of average
3. Variation
system level
rmance meer PRB; rig
SIR scenariut per user p
absolute terr SIR scenari
e throughp
n of outage
etrics for mght, outage
os evaluateder PRB and
rms, all scenios N1, N1a
ut per user
for mappe
mapped N1ae.
d is summarizoutage, for arios show sand N4, all
r for mappe
ed scenario
a scenario.
zed in Figureall different
similar valueoutdoor MU
ed scenario
o.
104
Left:
e 112 and t types of es for the UEs show
o.

105
8.4 Sy
This Secrealized
- H
- I
- M
The metwhile Fi
8.4.1 H
Figure of G
8.4.2 I
Figure of G
ystem perf
ction reportsin three scen
Homogeneou
Inhomogene
Mapped, as S
trics for threegure 116 sho
Homogeneo
114. CompGO for FAP
perfor
Inhomogene
115. CompGO for FAP
perform
formances
s the system narios of inte
us
eous
SIR N1 with
e study casesows the GO o
ous scenario
parison of oPs DL. Leftrmed in a h
eous scenari
parison of oPs DL. Left
med in an in
for deploy
performancerest:
hout time var
s are reporteoutput for on
overall systt, average tomogeneou
io
overall systt, average tnhomogene
yments with
ces when a G
riation.
ed in Figure ne of them.
tem performthroughputus scenario
tem performthroughputeous scenar
h GO
GO is imple
114, Figure
mances witt per PRB; o with 150 U
mances witt per PRB;
rio with 150
mented for t
115 and Figu
th or withouright, outa
UEs and 60
th or withouright, outa
0 UEs and 6
the DL of th
ure 117, resp
ut implemeage. Evalua0 FAPs.
ut implemeage. Evalua60 FAPs.
he FAPs,
pectively,
entation ation
entation ation

ICT-2488DocumentTitle of D
Freedom
8.4.3 M
Figure of G
8.4.4 C
The threthe overthroughpassigns dmaximumexampletransmisthat nomhand, varesourcefemto nethen the traffic flcomparaand MUE
891 STP t number: M5eliverable: Int
m_5D2_DUN
Mapped sce
Figu
117. CompGO for FAP
Conclusions
ee study caserall system pput and of odifferent valm power se
e in Figure 1ssion of otherminal throughalues of metres assignmenetwork the siapparent dec
flow. Thus, ably the sameEs in the sur
.2.2 terference chan
Nb.docx
enario – SIR
ure 116. GO
parison of oPs DL. Left
perform
s about GO
es, whose meperformanceoutage, especlues of transet for the un116) is indeer interferers hput per PRrics refer to nt, sharing atituation is farcrease of thra reduction e QoS to FUrroundings).
nnel model at s
R N1
O algorithm
overall systt, average t
med in a sta
implementa
etrics are repes benefit frcially when mission pown-optimized ed reduced to(mainly indo
RB of FAPs throughput p
t most 100 Pr more sustaioughput per
of transmisUEs while sig
system level
m optimiza
tem performthroughputatic scenari
ation at syst
orted in Figurom the opti
focusing onwer to differ
case. The tto minimizeoor MUEs) isis reduced, per PRB. If
PRBs (or lesinable. In facuser per PRssion powergnificantly im
ation for SI
mances witt per PRB; o, mapped
em level
ure 114, Figuimization prn MUEs. Indent units, whtransmissiontheir recipros still at maxwhile that oall MUEs ins, dependingct, one FAP B is not goinr according mproving pe
IR scenario
th or withouright, outaSIR N1.
ure 115 and ocess, both deed, the ophich are typ
n power of Focal interfereximum valueof MUEs impn the macro g on the LTEcan serve up
ng to impact to the GO
erformances
o N1.
ut implemeage. Evalua
Figure 117 sin terms of
ptimization apically lowerFAPs (as shence, while
e. The overalmproves. On
network comE bandwidthp to 4 FUEs significantlycriterion gu
of other use
106
entation ation
show that f average algorithm r than the hown for power of l effect is the other
mpete for h), for the only, and y the data uarantees
ers (FUEs

107
A difference between the tested scenarios is that the design of synthetic ones (i.e., homogeneous and inhomogeneous) is characterized by a deep penetration of indoor MUEs which are much closer to FAPs, while in the mapped developed by SIR indoor MUEs are more sparse. Analyzing the right panels of the Figure 114, Figure 115, emerges that in the synthetic in more dense deployments scenarios outage is reduced of up to 80%, while from Figure 117 referring to SIR scenario outage is improved of about 10%, as it is sparser.
8.5 MBS offload and QoS
In this Section we report the system performances evaluation in a scenario deployment where traffic is produced by UEs running specific applications. For this test, the inhomogeneous scenario (150 UEs, 60 FUEs, 4 buildings) has been chosen as a reference case. The system simulator takes into account:
- Deployment
- SINR of UEs
- Packet data flow.
In order to quantify the impact on QoS of each unit (both MUEs and FUEs) when deploying FAPs, this activity has been designed by comparing the system performances of a macro network when offloading traffic by attaching some (indoor) MUEs to (indoor) FAPs. The simulations take into account different traffic flows:
- in a macro network with 120 MUEs
- in the same macro network with 90 MUEs
- data transmitted when the 30 MUEs are FUEs attached to nearby FAPs.
The comparison is carried out by considering the different levels of SINR for indoor UEs when attached to the MBS or to a FAP, its impact on PDU-ER and thus on QoS. Finally, we provide an estimate on the extra energy consumption as a consequence of NACK packets that need retransmissions, evaluated in both cases of UE attached to the MBS or to a FAP.
8.5.1 MBS traffic flow for 120 MUEs
In this Section is reported the dynamic simulator output of traffic flow through the MBS. 120 MUEs are equally divided in three types, depending on the number and type of applications running on mobile devices:
- VoIP - VoIP and homogeneous stream (FTP-like) - VoIP, FTP, and bursty (HTTP-like).
Figure 118 shows a snapshot at certain instant of time users’ queues, while the right panel reports the instantaneous PDU-ER of the first four MUEs.

ICT-2488DocumentTitle of D
Freedom
Figur
The leftvariationassignmeefficient
Figur
Figure 1describelines mu
- Nl
- Eh
- GMm
891 STP t number: M5eliverable: Int
m_5D2_DUN
re 118. Tra
t panel of Fns, for the fients (see, fortly served kee
re 119. Tra
120 shows thd in Section
ust be interpr
Noerr. Net link connect
Effective. Dhigher than N
Gross. OnceMCS, on airmuch less th
.2.2 terference chan
Nb.docx
affic proces
Figure 119 rirst 4 users. r reference, eping the cur
affic proces
varia
he temporal n 7.1.4.2, wheted as follow
information ion (PDU-ER
Data output Noerr.
e a user hasr it is transm
hat the availa
nnel model at s
sing snapshPDU-ER
reports the pMCS is chanTable 5 of [Frrent MCS.
ssing snapsation vs tim
flow of pachile Figure 1ws:
data output R=0), every
including re
s been assignmitted the wble number o
system level
hot. Left: qR vs time fo
plot of SINnged when SFreedom-D5
hot for 4 ume dependi
ckets allocat21 shows a
as from thepacket sent i
etransmission
ned by the Rwhole PRB, a
of bits.
queue per uor 4 users.
NR vs time, SINR values51]) or when
sers. Left, ing on PDU
ted by the Mdetail of on
application,is received an
ns due to N
RRM a certalthough the
user. Right:
while the rs are near thn the packet f
SINR vs timU-ER.
MBS RRM ae of the pac
, which wound there are
NACK of pa
ain PRB winet informa
: visualizat
right panel the threshold flux is too h
me; Right,
adopting the cket fluxes. T
uld be case ono retransmi
ackets. It is
ith the correation encode
108
tion of
the MCS for MCS
high to be
MCS
schedler The three
of perfect issions;
typically
esponding ed can be

109
Fig
Figuapplica
Some ofdistributwithout NACK prequiremnew transummedthe MCStime. The righpackets w
gure 120. Tr
re 121. Traation traffi
f the results otion of extrarepetitions opackets tran
ments alreadynsmission evd with the repS and eventu
ht panel sumwith NACK
raffic procep
affic procesic and effec
of the procesa power consof packets, asmitted at tiy scheduled vent is addedpeated ones,
ually a portion
mmarizes theand needing
essing outppackets resc
ssing outpuctive traffic
ssed traffic osumption beand effectiveime T1 are ia packet at Td to the userthey need agn of this cou
e distributiong re-sending,
put, shown cheduling o
ut, detail ofc including
outputs are shetween traffie traffic necindeed reschT2, then no er queue. Alsgain to be fr
uld again rece
n of packet thus lengthe
for 4 MUEon data flow
f traffic forPDU-ER a
hown in Figuc consideredessary to co
heduled at a extra transmiso in the firsagmented ineive a NACK
loss for MUening the use
Es. Effect ofw.
one MUE.and fixed pa
ure 122. The d for perfectorrectly recei
later time Tissions are nst case, once
n packets withK and be (par
UEs, measurer’s queue.
f PDU-ER
. Comparisacket dime
left panel ret link conditive informatT2. If the ap
necessary, othe the bits quth the size alartly) queued
red as the nu
and
son of ensions.
eports the tions, i.e. tion data. pplication herwise a ueued are lowed by at a later
umber of

ICT-2488DocumentTitle of D
Freedom
Figure to p
Figure 1rescheduthose inattachinggaining b
Firesched
Figure 1colours ifirst part Figure 1
8.5.2 M
This Secattached features better tra
891 STP t number: M5eliverable: Int
m_5D2_DUN
122. Traffipackets resc
123 shows fuled packets)door users tg some usersbetter overal
igure 123. Tduling. Top
24 summarizis the same at of transmiss
25 shows for
MBS traffic
ction reports d to a FAP. T
but the loadansmission c
.2.2 terference chan
Nb.docx
ic processincheduling.
for each MU), and extra that will be s to FAPs enll performanc
Traffic prop, power ov
zes the load as above whesions when M
r each user th
c flow for 90
the same meThe traffic ofd on the MBconditions, as
nnel model at s
ng output. LRight, dist
UE the relapower expeattached to sures to provces to the wh
ocessing ouver-expend
on the MBS en detailed foMCS is adap
he difference
0 MUEs
etrics discussf the remaininBS is indeed s summarized
system level
Left, distritribution of
ation betweeenditure due
a FAP whevide better linhole system.
utput per usditure; midd
due to the tror a single us
pted to ensure
e between in
sed for the cng 90 MUEs
d reduced, wd in next Sec
ibution of ef percentag
en SINR anto retransm
en offloadingnks to users
ser, effect odle, packet
raffic of 120ser. Note howe QoS such a
nformation da
ase of 120 Ms and its flowhile disadvaction.
extra powerge of packet
d packet loissions. Userg the MBS. in worse tran
of PDU-ERloss; botto
MUEs. Thew effective tras to process
ata and packe
MUEs when 3w through thentaged MUE
r consumptts reschedu
ss (in perceers from 51 t
Thus, the bnsmission co
R and packeom, average
e meaning of traffic increa
queues.
ets sent over
30 of them he MBS showEs indoor ar
110
tion due uled.
entage of to 80 are
benefit of onditions,
ets e SINR.
f the three ses in the
r the air.
have been ws similar re now in

111
Figure
Figure to p
e 125. Traf
126. Traffipackets resc
Figur
ffic processzo
ic processincheduling.
re 124. MB
ing outputoom over th
ng output. LRight, dist
BS Traffic f
. Left, comhe set of ou
Left, distritribution of
flow, 120 M
mparison of utdoor MUE
ibution of ef percentag
MUEs.
traffic loadEs.
extra powerge of packet
d per user.
r consumptts reschedu
Right,
tion due uled.

ICT-2488DocumentTitle of D
Freedom
Firesched
Figure
891 STP t number: M5eliverable: Int
m_5D2_DUN
igure 127. Tduling. Top
e 129. Traf
.2.2 terference chan
Nb.docx
Traffic prop, power ov
Figu
ffic processzo
nnel model at s
ocessing ouver-expend
ure 128. MB
ing outputoom over th
system level
utput per usditure; midd
BS Traffic
. Left, comhe set of ou
ser, effect odle, packet
flow, 90 M
mparison of utdoor MUE
of PDU-ERloss; botto
MUEs.
traffic loadEs.
R and packeom, average
d per user.
112
ets e SINR.
Right,

113
8.5.3 MBS offload by 30 FUEs on Femto network
The effect of attaching 30 indoor MUEs to a FAP has several outcomes, which are summarized in Table 18. In this simulation, the FUEs have transmission power set to 15 dBm, while when they are MUEs it is 20 dBm, thus the overall power per user is reduced. The average power increase per user, due to the necessity to transmit NACK packets is significantly less than in other cases; the same is valid for the average power increase per user. Thus simulations confirm that FAPs allow MBS offload and ensure comparable or better transmission conditions to indoor users attached to them. MBS with
120 MUEs MBS with 90
MUEs FEMTO layer
30 FUEs
Traffic increase due to rescheduled packets 124 % [total]
97 % 58%
Overall Power expenditure [tot]/user 99.85 mW 99.85 mW 5.42 mW Tx Power dBm 20 20 15 Average power increase – percentage/user 163.5 % 88.9 % 37% Average power increase - mW/user 0.23 mW 0.13 mW 0.029 mW Overall power increase 27.99 mW 11.42 mW 0.88 mW 30 usrs – overall power expenditure [tot] mW 748.9 329.2 Overall power expenditure/user mW 24.96 10.9 30 usrs – power increase – percentage/user 25.5 % 37.9 % 30 usrs - power increase - mW/user 0.036 0.036 30 usrs - Traffic increase due to rescheduled packets 89 % 53% 30 usrs - Traffic increase/user due to rescheduled packets (avg.)
2.9 % 1.95 %
90 usrs - overall power [tot] 26.9 mW 90 usrs - power increase – percentage/user 210 % 90 usrs - power increase - mW/user 0.299 mW 90 usrs - Traffic increase due to rescheduled packets 140 % Flux tot - th MBps 6.1 4.3 1.0 Flux tot - out MBps 23.3 14.1 5.3 Flux tot - gross MBps 26.3 15.9 6.2
Table 18. Comparison of system performances when offloading the traffic of 30 MUEs and attaching them to FAPs.

ICT-2488DocumentTitle of D
Freedom
9 CO The objeperspectnetworkmodel foimpact oprovidinFreedomvariable These sythe perspmaking consider
9.1 Te
Downlinmacro+fcontrollepredictiodeliveredFREEDOoperation The simu
- T
- Tm
- Tn
This chaoffice oranywher Results aprovidedmacro coco-channto assess
- Impa
- Gain
- Increto de
- Impa
- Impa The maielaborati
891 STP t number: M5eliverable: Int
m_5D2_DUN
ONCLUSI
ective of thistive, overcom. The methoor the scenaron the overang a viable tm-D51]), the
band allocat
ystem-level spective of desimple MA
red).
Technical co
nk coveragefemto signaled or randomon of 3D pathd throughpuOM studies; nal two-tier n
ulation resul
The FAP cov
The FAP comode FAP d
The degradanon FAP sub
aracterizationr same housere but indoor
are mainly ed for three doverage (connel macro cos the impact o
act of the tra
n from a regu
ease of the oeeper indoor
act of the FA
act of the FA
in conclusionion the engin
.2.2 terference chan
Nb.docx
IONS
s activity is toming selfish dologies imprios considerall cell perfotechnique to metrics mea
tion and in a
simulations aense femto dAC-layer ab
onclusions
e simulationl and interf
m large-scaleh-loss maps;ut and netw
we think itnetworks, as
ts (Section 8
verage and s
overage and deployment;
ation of the bscriber, in c
n is done at e as the FAPrs within the
expressed as different depnsidering twooverage; andof several de
ansmit power
ular multi-FA
outdoor interdeployment
AP traffic on
AP density.
ns from all tneering rules
nnel model at s
o consider inapproaches wplemented inred. Clusteriormances, al
improve neasuring systetemporal va
are precededdeployments.straction (in
s
n tools havference levee FAP deplo prediction o
work capacitcould also
s an extension
8.1) give a ch
ervice impro
service impr
coverage (dcase of a clos
different scaP; in the sammacro-cell;
a statistical ployment eno inter-site d
d suburban reeployment FA
r (10dBm or
AP deployme
rference fromt;
the interfere
these simula [FREEDOM
system level
nterference mwhich can hn this WP5 aing methods llowing a faetwork data em performa
arying enviro
d by an analy. This analysn particular,
ve been elaels based onoyments in syof the LTE dty. This apbe of interen of usual ra
haracterizatio
ovement offe
rovement of
deadzone sursed-access FA
ales, i.e. the me floor as thanywhere bu
distribution nvironments:distances 500esidential. BAP paramete
20dBm) on
ent compared
m a FAP dep
ence indoors
ations are suM-D62b].
management ave an overa
are considereand strategi
aster convergflow. Comp
ances have aonment.
ysis of the femsis is realize, no inter-c
aborated forn the followynthetic andownlink cov
pproach wasst for design
adio-planning
on of:
ered to a FAP
ffered to any
rface) and seAP deploym
considered he FAP, or iut outdoors w
of the availa urban corp
0m and 1732mesides, sever
ers:
the coverage
d to a random
ployment clo
and outdoor
ummarized a
and planningall negative ied in their imies have beegence of optplementarily also been ext
mto-based ind with a LTE
cell interfere
r characteriwing metho
d real geograverage; and fi
relevant inn, evaluationg methods.
P customer;
y user, in ca
ervice perforent.
user may bein the same
within the ma
able spectralporate in prem); urban coral analyses
e and interfer
m FAP deplo
ose to the ext
rs;
nd employed
g from a sysimpact on th
mpact on theen consideredtimization mto activity
tended to th
nterference imE coverage sence coordin
ization of todology (Seaphical envirfinally, estimn the frame
n and optimi
ase of an ope
rmance suffe
e located in building as
acro-cell.
l efficiency. esence of coorporate in abhave been c
rence;
oyment;
xternal wall c
d in activity
114
tem level he overall
business d in their
methods a 5A1 (see e case of
mpact, in simulator nation is
the LTE ction 3):
ronments; ate of the e of the ization of
en-access
ered by a
the same the FAP;
They are o-channel bsence of onducted
compared
y 6A2 for

115
The dynamic system simulator has been complemented including packet flow module to evaluate the information data passing through the cell and the impact of all transmitters on the QoS and energy needed to run a set of applications on UE mobile terminals. The overall simulator has been tested in several cases of interest that can be summarized as:
- Impact of clustering on possibility to extend optimization methods at system level in a reliable way, in order to manage also high number of users;
- A set of real environments have been included, providing metrics also for a mapped scenario with geographic deployments of buildings and users;
- Mobility of users and temporal changes in the environment where transmitters are positioned have been included and evaluated;
- Evaluation on the system performances for different cases of varying band usage: equipartition of band between MBS and femto network, considering a fixed spectrum allocation for the MBS and varying that of second tier, or fixing the band usage of the femto network and increasing that of the macro network;
- Evaluation of system performances when including a GO for power assignment of FUEs/FAPs to mitigate indoor interference;
- Quantification of the MBS offload when routing traffic of a set of UEs indoor through FAPs instead of through the macro network.
9.2 Impact on the business case
This section summarizes the outcomes used in 2A3 activity for business model analysis. All inputs and key methodology aspects of the LTE coverage simulations presented in sections 9.2.1 to 9.2.4 are given section 3. These results are extension of those provided in section 8.1. The development of some activities (clustering and optimization methods) developed in 3A2, evaluated at system level in 5A1 and 5A2 and their impact on the business case are reported in section 9.2.5. The overall conclusions that can be drawn from a list of simulations are also presented for their impact on possible choices for a MNO.
9.2.1 Scenarios IA-1 and IA-2 – Impact on local urban corporate coverage
Scenarios IA-1 and IA-2 evaluate the impact of a FAP deployment in one restricted urban corporate area (composed of a few buildings only) in presence of existing macro coverage. Figure 130 gives spectral efficiency statistics for a FAP subscriber located into the same small 10m10m area as the FAP. These statistics are compared to the spectral efficiency provided by the macro-only network. These figures will help a LTE network operator to assess the gain in quality of coverage it can offer to its corporate customers, in case a closed-access FAP is installed for subscribers located in a restricted area. Remark that the simulation outputs are highly sensitive to the realized FAP deployments (generated from a random process); therefore only statistics given in one same table may be directly compared in order to assess gains or degradations in spectral efficiency.

ICT-2488DocumentTitle of D
Freedom
Figure
Figure 1has acceconsiderThese figcorporatRemark
Figure (or
Figure 1deploymcontrol t
891 STP t number: M5eliverable: Int
m_5D2_DUN
130: Scenar
31 give simiess to all FAPred: one singgures help a te customers,these same r
131: Scenarr any user if
32 give simiment in closethe degradati
.2.2 terference chan
Nb.docx
rios IA-1 andint
ilar results foPs deployed le building fLTE networ
, in case severesults apply
rios IA-1 andf FAPs are i
ilar results bud-access moion in quality
nnel model at s
d IA-2 - Speto a small co
or a corporatwithin the c
floor (the grork operator teral closed-ato any user w
d IA-2 - Spen open-acce
ut for a non-de. These fig
y of coverage
system level
ectral efficieorporate are
te FAP subsccorporate unound-floor acto assess the
access FAPs awhen FAPs
ectral efficieess mode) wi
subscriber (igures will he that will be
ency offeredea (10m10m
criber but conit area. Two
ctually) or thgain in qual
are deployedare in open-a
ency offeredithin the wh
i.e. a macro uelp a LTE n
e experienced
to a corporm).
nsidering herdifferent co
e whole two lity of coverad within the caccess mode
to a corporhole FAP dep
user) who is etwork operad by the non-
rate FAP sub
re that this suorporate unit neighbor bu
rage it will ocustomer pree.
rate FAP subployment ar
located withrator to antic-subscribers.
116
bscriber
ubscriber sizes are
uildings. ffer to its
emises.
bscriber rea.
hin a FAP ipate and .

117
Figur
9.2.2 Sc
Scenarioarea (comScenarioaccount. Figure 110m10presenceThese figits corpoarea in a Remark random to assess
Figure
e 132: Scenause
Scenarios Icoverage)
os IA-5 and mposed of a os IA-5 and I
133 gives spm area as th
e of macro cogures will heorate customabsence of an
the simulatioprocess); the
s gains or deg
133: Scenar
arios IA-1 aer) located w
A-5 and IA
IA-6 evaluatfew buildingIA-6 are the
pectral effice FAP. Noteoverage) sincelp a LTE neers, in case a
ny macro cov
on outputs arerefore only gradations in
rios IA-5 andint
and IA-2 - Spwithin a corp
A-6 – FAP
te the impacgs only) in absame as sce
ciency statiste that performce MBS do network operaa closed-acceverage.
re highly senstatistics giv
n spectral eff
d IA-6 - Speto a small co
pectral efficporate close
coverage in
ct of a FAP bsence of an
enarios IA-1
tics for a Fmances are thnot impact coator to assessess FAP is in
nsitive to theven in one sficiency.
ectral efficieorporate are
ciency offereed-access FA
n urban cor
deployment ny macro cov
and IA-2, ex
FAP subscribhe same as ioverage quals the gain in nstalled for
e realized FAame table m
ency offeredea (10m10m
ed to a non-sAP deployme
rporate are
in one restriverage. xcept that MB
ber located n scenarios Iity in these squality of cosubscribers l
AP deploymenmay be direct
to a corporm).
subscriber (ent.
ea (no initia
icted urban c
MBS are not t
into the samIA-1 and IAsmall areas. overage it canlocated in a
ents (generatetly compared
rate FAP sub
(macro
al macro
corporate
aken into
me small -2 (i.e. in
n offer to restricted
ed from a d in order
bscriber

ICT-2488DocumentTitle of D
Freedom
Figure 1has acceconsiderThese figcorporatand in ab Remark
Figure (or
9.2.3 S
Scenarioscale anaThe scen First restwo-tier constant Figure 13Mbps. TFigure 1throughp In the o256kbpsIn the twwho reqmore thaassume tFAP actiof open-anywher We get t
T
891 STP t number: M5eliverable: Int
m_5D2_DUN
34 give simiess to all FAPred: one singgures help a te customersbsence of any
these same r
134: Scenarr any user if
Scenario IA
o IA-3 evaluaalyses are penario is based
ult is the evnetwork (M
t traffic load
35 gives theThese statist136 gives siputs take into
riginal macrs and MBS trwo-tier netwoquire 256kbpan 3Mbps orthe deploymivation ratio-access FAPre in the cell.
the two folloThe average1Gb/hour an
- For thto 10%
.2.2 terference chan
Nb.docx
ilar results foPs deployed le building fLTE networ
, in case sevy macro cov
results apply
rios IA-5 andf FAPs are i
A-3 – Impact
ates the impaerformed in rd on a downt
volution of thMBS+FAP), on the macro
network thrtics are compimilar resulto account the
ro only netwraffic load TLork, we mak
ps and are ur 15 Mbps an
ment of FAPss are 10% an
Ps in the env.
wing resultse amount ofnd peak data
his high data %.
nnel model at s
for a corporatwithin the c
floor (the grork operator tveral closed-erage.
to any user w
d IA-6 - Spen open-acce
t on urban n
act of a densreal environmtown area of
he total throuin open-acc
o layout.
roughputs of pared to the tts for a peae physical lay
work, 36 useL=50%. Theke distinctionuniformly spand are locates encouragesnd 20%) in ivironment pe
: f data deliverate is more
rate usage, t
system level
te FAP subscorporate unound-floor acto assess the -access FAP
when FAPs
ectral efficieess mode) wi
network cov
se corporate Fments using f a European
ughput fromcess mode,
f the two-tier throughput pak data rateyer overhead
ers (active sue user activatn between twatially distri
ed in the closs the use of hits close vicinermit an inc
ered by a Fthan 3Mbps
the FAP activ
criber but coit area. Two
ctually) or thgain in qual
s are deploy
are in open-a
ency offeredithin the wh
verage
FAP deploymsite-specificlarge city.
m the originalconsidering
network forprovided by t higher than
d.
ubscribers) ation ratio is 4wo different buted; and h
se FAP vicinhigh data ratnity. Besides
crease in the
FAP to high:
vation ratio a
onsidering hedifferent co
e whole two lity of covera
yed within th
access mode
to a corporhole FAP dep
ment in an u models and
l macro-onlya growing
a FAP peakhe macro-onn 15Mbps.
are served w4.7%. user profileshigh data rat
nity (in same te mobile ses, the macro usage of lo
h data rate u
and the FAP
ere that this orporate unit neighbor bu
rage it will ohe customer
e.
rate FAP subployment ar
urban netword 3D vector m
y network touser deman
k data rate hignly network. Peak data r
with peak dat
s: low data rate users wh 10m10m a
ervices (i.e. soffload and
ow data rate
users is gre
P traffic load
118
customer sizes are
uildings. ffer to its premises
bscriber rea.
rk. Large-map data.
oward the nd, and a
gher than
rates and
ta rate of
rate users o require area). We simulated presence
e services
ater than
are fixed

119
TG
Figur
Figur
Second rlow dataSimulatiFAP actFigure 1data rate
- The nscenar
- The nu43 or 4
- See al
The averageGb/hour and
- For thtraffic
- ObservFAPs
- See al
re 135. Mac
re 136. Macr
result is basa rate users ion results artivation ratio135 and Figue users; how
number of acrio), without
umber of ac44, with abo
l results in F
amount of dd peak data ra
his high data load to 50%
vations are shas still a ve
l results in F
cro only and
ro only and
ed on the saare assumedre given for o. They can ure 136 for o
wever the num
ctive high dany significa
tive low datut 15% serve
Figure 135.
data delivereate is more th
a rate usage,%.
similar to preery limited im
Figure 136.
d two-tier neO
two-tier netO
ame scenariod to be non-F
10% FAP dbe compared
open access mber of low
data rate useant impact o
ta rate users ed by the FA
ed by a FAP han 15Mbps
, the FAP a
evious ones,mpact on the
etwork throuOpen-access
twork throuOpen-access
o and same uFAP subscri
density (462 d to the firsmode. We gdata rate us
ers reaches on the global
increase fromAPs.
to high data:
ctivation rat
as the interfglobal macr
ughputs - FAs.
ughputs - FAs.
user profilesibers and canFAPs/km² o
st two-tier neget similar dsers is limite
10, 20 or 4macro servic
m 36 (in ma
a rate users is
io is fixed t
ference genero performan
AP high dat
AP high data
, but in closn thus only or 0.13 FAP/etwork perfo
delivered throd to 36 as in
0 (dependince coverage.
acro-only net
s greater tha
to 10% and
erated from tnce.
ta rate > 3M
a rate > 15M
sed-access mbe attached /subscriber) ormance preoughput to Fn the origina
ng on the
twork) to
an several
the FAP
the active
Mbps –
Mbps –
mode. The to MBS. and 10% sented in FAP high al macro-

ICT-2488DocumentTitle of D
Freedom
only netwrate.
Figur
Third rei.e. consdeploymbeen sim A constawith FA27% of t
Figu
9.2.4 S
ScenarioFirst restwo-tier constant Figure 13Mbps acompare In the o256kbpsIn the twwho reqmore thaWe assu
891 STP t number: M5eliverable: Int
m_5D2_DUN
work. Beside
re 137. Macr
sult is the evtant number
ment with 10%mulated.
ant network tAP activation
the macro ne
ure 138: Ma
Scenario IA
o IA-4 evaluault is the evnetwork (M
t traffic load
40 gives theand 15 Mbpsed to the thro
riginal macrs and MBS trwo-tier netwoquire 256kbpan 3Mbps orume the dep
.2.2 terference chan
Nb.docx
es the macro
ro only and
volution of tof users and
% FAP densi
throughput sn ratio 10%. etwork capac
acro only an
A-4 – Impact
ates the impavolution of thMBS+FAP), on the macro
network thrs (obtained roughput prov
ro-only netwraffic load TLork, we mak
ps and are ur 15 Mbps anployment of
nnel model at s
o coverage is
two-tier net15Mbp
the macro dod constant toity (462 FAP
hown in FiguThe macro d
city is offload
nd open-acce
t on suburba
act of a densehe total throuin open-acc
o layout.
roughputs of respectively wvided by the m
work, 18 userL=50%. Theke distinctionuniformly spand are locatef FAPs enco
system level
s degraded in
twork throups – Closed-
ownlink traffotal throughpPs/km² or 0.1
ure 138 is obdownlink TLded.
ess two-tier
an network
e residential ughput fromcess mode,
f the two-tier with FAP tramacro-only n
rs (active sue user activatn between twatially distri
ed in the closourages the
n the vicinity
ughputs - FA-access.
fic load, conput in the net13 FAP/subs
btained for a L is reduced
network for
coverage
FAP deploym the original
considering
network foraffic load 10network.
ubscribers) ation ratio is 3wo different buted; and hse FAP vicinuse of high
y of the FAPs
AP high data
nsidering a cotwork servicecriber) and o
FAP downlifrom 50% t
r a constant
yment in a sul macro-onlya growing
a FAP peak0% and 50%
are served w3.0%. user profileshigh data ratnity (same 24h data rate m
s delivering
a rate > 3Mb
onstant user e area. Only
open-access m
ink traffic loto 23%, mea
traffic dem
uburban netwy network touser deman
k data rate hig%). These stat
with peak dat
s: low data rate users wh4m24m houmobile serv
120
high data
bps or
demand, y the FAP mode has
oad of 1% aning that
mand.
work. oward the nd, and a
gher than tistics are
ta rate of
rate users o require use area).
vices (i.e.

121
simulateopen-accanywher We get t
T
TG
Second rsimilar dlimited tonly netwa subscriusers inc Note tha“dead zo
Figu
ed FAP activcess FAPs ire in the cell.
the two folloThe average1Gb/hour an
- For fixed
- The
- The serve3.0%
- The substo ne
- See a
The averageGb/hour and
- For traffi
- The
- As tserve
- See a
result is basedelivered throto 23 or 25: work, while iber (i.e. usecreases from
at the macro ones” appear
ure 139. M
ation ratio isin the enviro.
wing resultse amount ofnd peak data
this high dad to 10%.
number of a
number of ed by the FA
% to 13.0%.
percentage ocriber houseeighbor hous
all results in
amount of dd peak data ra
this high dafic load to 50
number of a
the macro ced by the FA
all results in
ed on the samoughput to Fthe number the closed-a
ers located in3.0% (in ma
coverage is r.
Macro only a3
s 10%) in its onment perm
: f data deliverate is more
ata rate usag
ctive high da
active low dAPs. The act
of users servs are assume
ses.
Figure 139.
data delivereate is more th
ta rate usage%.
ctive high da
overage is lAP increases
Figure 139.
me scenario aFAP high dat
of users servccess FAPs p
n the same 24acro-only net
degraded in
and two-tie3Mbps or 1
close vicinitmit an incre
ered by a Fthan 3Mbps
e, the FAP
ata rate users
data rate usetivation ratio
ved by the Fed to have a
ed by a FAP han 15Mbps
e, the FAP a
ata rate users
locally degracompared to
and same useta rate users. ved by the Mprovide low 4m24m houtwork) to 5.5
n the vicinity
er network 15Mbps – O
ty. Besides, tease in the
FAP to high:
activation ra
s reaches 10.
ers increase o for this low
FAPs is high FAP; further
to high data:
activation ra
s reaches 10.
aded, the peo the previou
er profiles, bHowever th
MBS is quitedata rate ser
use area). Th5% or 5.8%.
of the FAPs
throughpuOpen-acces
the macro offusage of low
h data rate u
atio and the
from 18 to w data rate u
in this scenrmore some F
a rate users is
atio is fixed t
ercentage of s result: from
but in closed-e number of e similar to trvice only to he activation
s delivering
uts - FAP hs.
ffload and prow data rate
users is gre
FAP traffic
68, with abusage increa
nario, as halfFAPs provid
s greater tha
to 10% and
f low data rm 65% to 68
-access modef low data ratthe one in th the users likratio of low
high data ra
high data ra
esence of services
ater than
load are
bout 65% ases from
f network de service
an several
the FAP
rate users %.
e. We get te users is he macro-kely to be
data rate
te so that
ate >

ICT-2488DocumentTitle of D
Freedom
Figu
9.2.5 I
The simtransmissituationMUEs. Twith it. Power aconsideroperatormethodoconsideranother, In this vat systemperformathe methpower almanagem Transmipower) bandwidboth for Differenreduce in
891 STP t number: M5eliverable: Int
m_5D2_DUN
ure 140. M
Impact of m
mulations perssion conditin, the additioThis situatio
and spectrumred by a MNrs can adopologies for rered from a bespecially d
view, simulatm level, alloances, both ihodologies exllow gainingment of resou
ssion power and similarl
dth usage to FFUEs and, m
nt types of banterference,
.2.2 terference chan
Nb.docx
Macro only a3M
methodologie
rformed so ions for UEnal interferenn is even wo
m managemeNO to improvpt different esources optbusiness poi
depending on
tions show howing reduciin terms of axposed in thig a better syurces by diff
can be assigly the spectrFAPs in a rigmoreover, forand partition improving Q
nnel model at s
and two-tieMbps or 15
es at system
far, confirmEs. Moreovence introducorsened whe
ent have beeve network pstrategies toimization imnt of view a
n transmitter’
ow a modesting power coaverage throuis activity shstem perform
ferent optimi
gned with a srum can begid or adaptivr MUEs, whhave been an
QoS and traff
system level
er network 5Mbps – C
level
m how the ier, althoughced in the sysen inside bui
en demonstrperformanceo maintain
mposes someand which a’s density.
t managemenonsumption ughput per u
how how manmance. Indeeization metho
set of criteriae partitioned ve way) such
hich are the onalyzed and fic flow.
throughpulosed-acces
ndoor envirh deploymenstem is one oildings there
rated to be es. Since tran
average Qoe constraints apply with d
nt of transmiand signific
user per PRBnagement of ed, clusterinods.
a (minimum in differen
h that overallones most suf
offer to a M
uts - FAP hss.
onment has nt of FAPs of the major d
is a FAP de
relevant parnsmissions aoS. Implemeon spectrum
differences f
ission powercantly improvB, and in termf the spectrumg strategies
power, adapt ways (by l experience ffering from NO several m
high data ra
the less pecan overco
drawbacks feployment in
rameters thaare in licenseentation of
m usages thatfrom one sc
r can be impving overallms of outagem and/or tranopen the wa
pted power, oassigning mof users is imindoor interfmeans to ma
122
ate >
erforming ome such for indoor nterfering
at can be ed bands, different
t must be enario to
lemented l network e. Indeed, nsmission ay to fast
optimized maximum mproved, ference. anage and