Embed Size (px)
Citation preview
Green Mountain Care Board
Vermont Hospital Enforcement Analysis
System Summary
FY 2015 Actuals
Updated May 2016

This report compares the actual 2015 operating results to the 2015 Budgets of the Vermont hospitals. Included is an overview of key trends and indicators for the system.
For fiscal year 2015, the Green Mountain Care Board’s Enforcement policy is in effect. This report also provides an analysis of whether or not each hospital is within the allowed 0.5% variance for 2015 (budget to actual).
If you have questions about the report, please contact Michael Davis, Janeen Morrison, or Lori Perry at the GMCB (802) 828-2177.
Originally prepared March 2016
Updated May 2016
2
Purpose of the report

Vermont Hospital System 2015 Summary
Operating results and trends
3
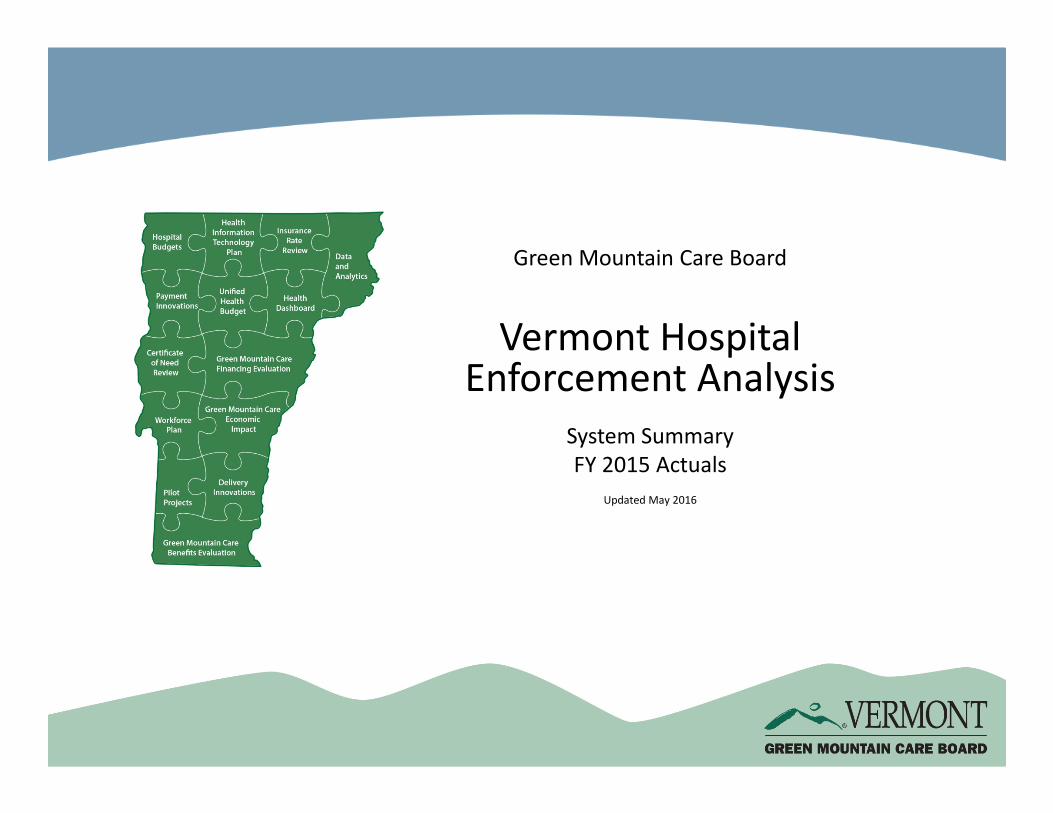
The following slides present the system findings comparing the 2015 actuals to the 2015 approved hospital budgets. My findings are as follows:
The overall net patient revenues in the system were higher than budget by $49 million,
This increase in revenues was primarily driven by favorable bad debt and free care of $47 million,
Overall utilization was higher than budget and offset reductions in payer reimbursement,
And the operating surplus across the system was higher by $34 million.
Summary Comments
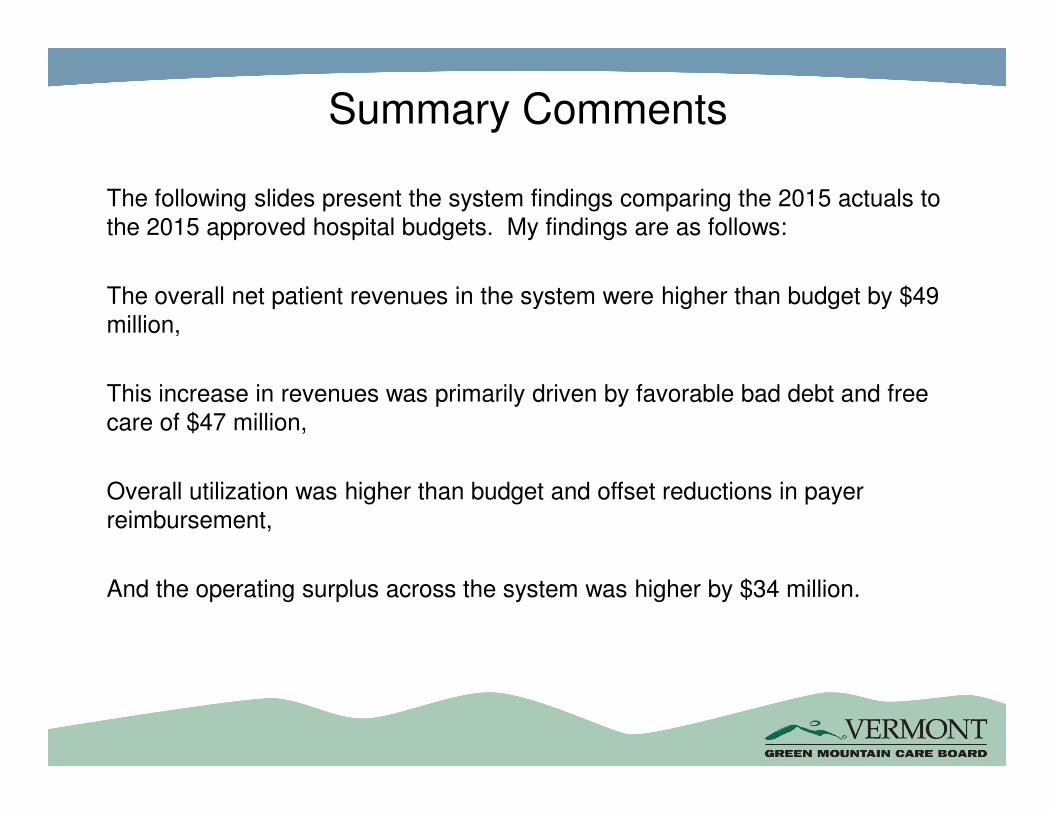
Hospital System Budget Performance
2.2%
3.1%
3.8%
4.4%
0.0%
0.5%
1.0%
1.5%
2.0%
2.5%
3.0%
3.5%
4.0%
4.5%
5.0%
2014B to 2015B As Approved 2014B to 2015B As Approved
with Adjustments*
2014B to 2015B As Allowed per
Guidance
2014B to 2015A As Happened
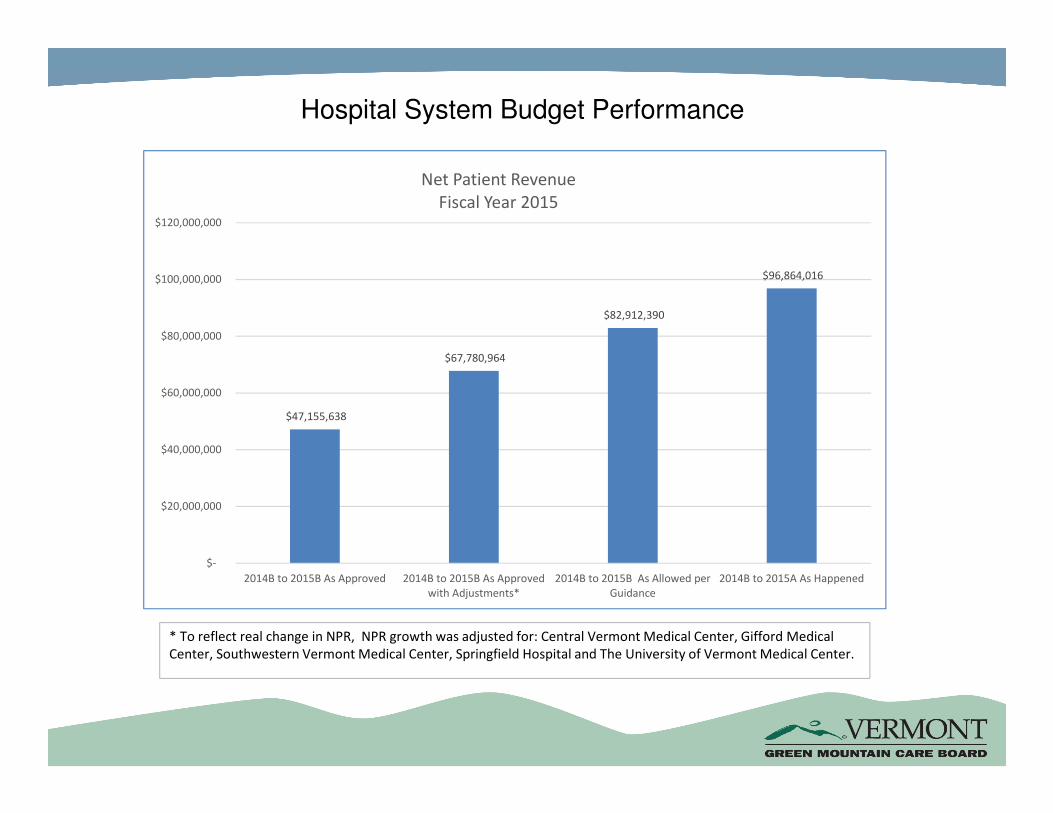
Net Patient Revenue
Fiscal Year 2015
* To reflect real change in NPR, NPR growth was adjusted for: Central Vermont Medical Center, Gifford Medical
Center, Southwestern Vermont Medical Center, Springfield Hospital and The University of Vermont Medical Center.
Hospital System Budget Performance
$47,155,638
$67,780,964
$82,912,390
$96,864,016
$-
$20,000,000
$40,000,000
$60,000,000
$80,000,000
$100,000,000
$120,000,000
2014B to 2015B As Approved 2014B to 2015B As Approved
with Adjustments*
2014B to 2015B As Allowed per
Guidance
2014B to 2015A As Happened
Net Patient Revenue
Fiscal Year 2015
* To reflect real change in NPR, NPR growth was adjusted for: Central Vermont Medical Center, Gifford Medical
Center, Southwestern Vermont Medical Center, Springfield Hospital and The University of Vermont Medical Center.

7
Actual net patient revenues came in 2.2% over the 2015 approved budgets. This explains most of the operating income (aka surplus) increase of $34 million.
Budget to Actual 2015 Operating Results
2015B - 2015A
Profit and Loss Statement 2015B 2015A $ Difference % Change
Gross Patient Care Revenue $4,735,245,480 $4,823,931,803 $88,686,323 1.9%
Net Revenue Deductions ($2,506,184,843) ($2,545,661,498) ($39,476,654) 1.6%
Net Patient Care Revenue $2,229,060,637 $2,278,270,306 $49,209,669 2.2%
Other Operating Revenue $127,360,793 $141,381,096 $14,020,303 11.0%
Total Operating Revenue $2,356,421,429 $2,419,651,402 $63,229,972 2.7%
Operating Expense $2,280,130,288 $2,309,283,512 $29,153,225 1.3%
Net Operating Income (Loss) $76,291,142 $110,367,890 $34,076,748 44.7%
Non-Operating Revenue $30,523,392 ($20,910,214) ($51,433,605) -168.5%
Excess (Deficit) Rev over Exp $106,814,533 $89,457,676 ($17,356,857) -16.2%
Budget to Actual Operating ResultsIndividual Hospital Budgets
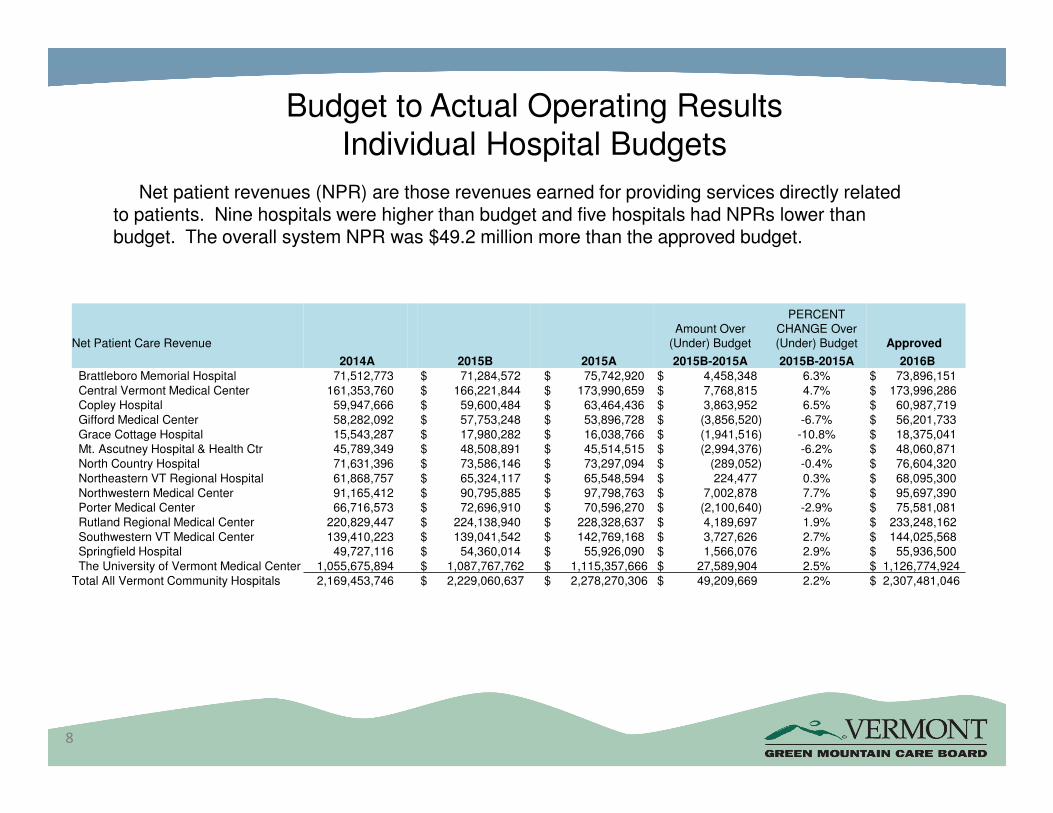
Net patient revenues (NPR) are those revenues earned for providing services directly related to patients. Nine hospitals were higher than budget and five hospitals had NPRs lower than budget. The overall system NPR was $49.2 million more than the approved budget.
8
Net Patient Care RevenueAmount Over
(Under) Budget
PERCENT CHANGE Over (Under) Budget Approved
2014A 2015B 2015A 2015B-2015A 2015B-2015A 2016B Brattleboro Memorial Hospital 71,512,773 $ 71,284,572 $ 75,742,920 $ 4,458,348 6.3% $ 73,896,151 Central Vermont Medical Center 161,353,760 $ 166,221,844 $ 173,990,659 $ 7,768,815 4.7% $ 173,996,286 Copley Hospital 59,947,666 $ 59,600,484 $ 63,464,436 $ 3,863,952 6.5% $ 60,987,719 Gifford Medical Center 58,282,092 $ 57,753,248 $ 53,896,728 $ (3,856,520) -6.7% $ 56,201,733 Grace Cottage Hospital 15,543,287 $ 17,980,282 $ 16,038,766 $ (1,941,516) -10.8% $ 18,375,041 Mt. Ascutney Hospital & Health Ctr 45,789,349 $ 48,508,891 $ 45,514,515 $ (2,994,376) -6.2% $ 48,060,871 North Country Hospital 71,631,396 $ 73,586,146 $ 73,297,094 $ (289,052) -0.4% $ 76,604,320 Northeastern VT Regional Hospital 61,868,757 $ 65,324,117 $ 65,548,594 $ 224,477 0.3% $ 68,095,300 Northwestern Medical Center 91,165,412 $ 90,795,885 $ 97,798,763 $ 7,002,878 7.7% $ 95,697,390 Porter Medical Center 66,716,573 $ 72,696,910 $ 70,596,270 $ (2,100,640) -2.9% $ 75,581,081 Rutland Regional Medical Center 220,829,447 $ 224,138,940 $ 228,328,637 $ 4,189,697 1.9% $ 233,248,162 Southwestern VT Medical Center 139,410,223 $ 139,041,542 $ 142,769,168 $ 3,727,626 2.7% $ 144,025,568 Springfield Hospital 49,727,116 $ 54,360,014 $ 55,926,090 $ 1,566,076 2.9% $ 55,936,500 The University of Vermont Medical Center 1,055,675,894 $ 1,087,767,762 $ 1,115,357,666 $ 27,589,904 2.5% $ 1,126,774,924
Total All Vermont Community Hospitals 2,169,453,746 $ 2,229,060,637 $ 2,278,270,306 $ 49,209,669 2.2% $ 2,307,481,046
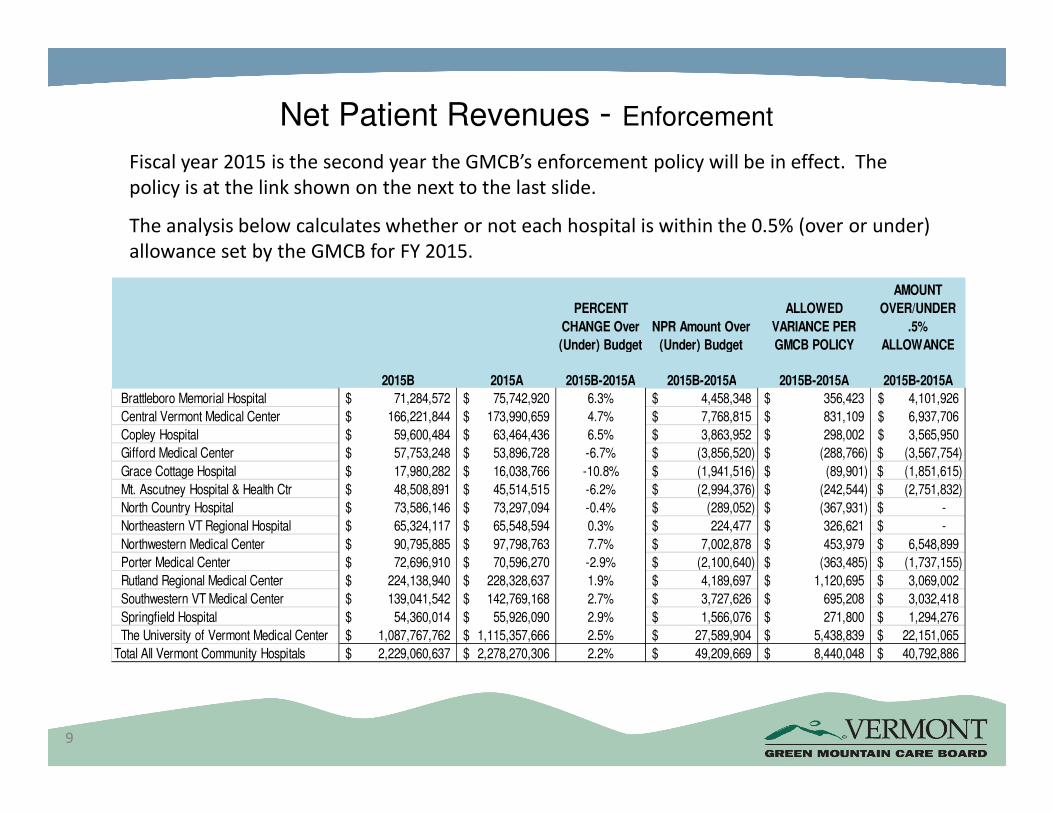
Net Patient Revenues - Enforcement
9
Fiscal year 2015 is the second year the GMCB’s enforcement policy will be in effect. The
policy is at the link shown on the next to the last slide.
The analysis below calculates whether or not each hospital is within the 0.5% (over or under)
allowance set by the GMCB for FY 2015.
PERCENT
CHANGE Over
(Under) Budget
NPR Amount Over
(Under) Budget
ALLOWED
VARIANCE PER
GMCB POLICY
AMOUNT
OVER/UNDER
.5%
ALLOWANCE
2015B 2015A 2015B-2015A 2015B-2015A 2015B-2015A 2015B-2015A
Brattleboro Memorial Hospital 71,284,572$ 75,742,920$ 6.3% 4,458,348$ 356,423$ 4,101,926$
Central Vermont Medical Center 166,221,844$ 173,990,659$ 4.7% 7,768,815$ 831,109$ 6,937,706$
Copley Hospital 59,600,484$ 63,464,436$ 6.5% 3,863,952$ 298,002$ 3,565,950$
Gifford Medical Center 57,753,248$ 53,896,728$ -6.7% (3,856,520)$ (288,766)$ (3,567,754)$
Grace Cottage Hospital 17,980,282$ 16,038,766$ -10.8% (1,941,516)$ (89,901)$ (1,851,615)$
Mt. Ascutney Hospital & Health Ctr 48,508,891$ 45,514,515$ -6.2% (2,994,376)$ (242,544)$ (2,751,832)$
North Country Hospital 73,586,146$ 73,297,094$ -0.4% (289,052)$ (367,931)$ -$
Northeastern VT Regional Hospital 65,324,117$ 65,548,594$ 0.3% 224,477$ 326,621$ -$
Northwestern Medical Center 90,795,885$ 97,798,763$ 7.7% 7,002,878$ 453,979$ 6,548,899$
Porter Medical Center 72,696,910$ 70,596,270$ -2.9% (2,100,640)$ (363,485)$ (1,737,155)$
Rutland Regional Medical Center 224,138,940$ 228,328,637$ 1.9% 4,189,697$ 1,120,695$ 3,069,002$
Southwestern VT Medical Center 139,041,542$ 142,769,168$ 2.7% 3,727,626$ 695,208$ 3,032,418$
Springfield Hospital 54,360,014$ 55,926,090$ 2.9% 1,566,076$ 271,800$ 1,294,276$
The University of Vermont Medical Center 1,087,767,762$ 1,115,357,666$ 2.5% 27,589,904$ 5,438,839$ 22,151,065$
Total All Vermont Community Hospitals 2,229,060,637$ 2,278,270,306$ 2.2% 49,209,669$ 8,440,048$ 40,792,886$
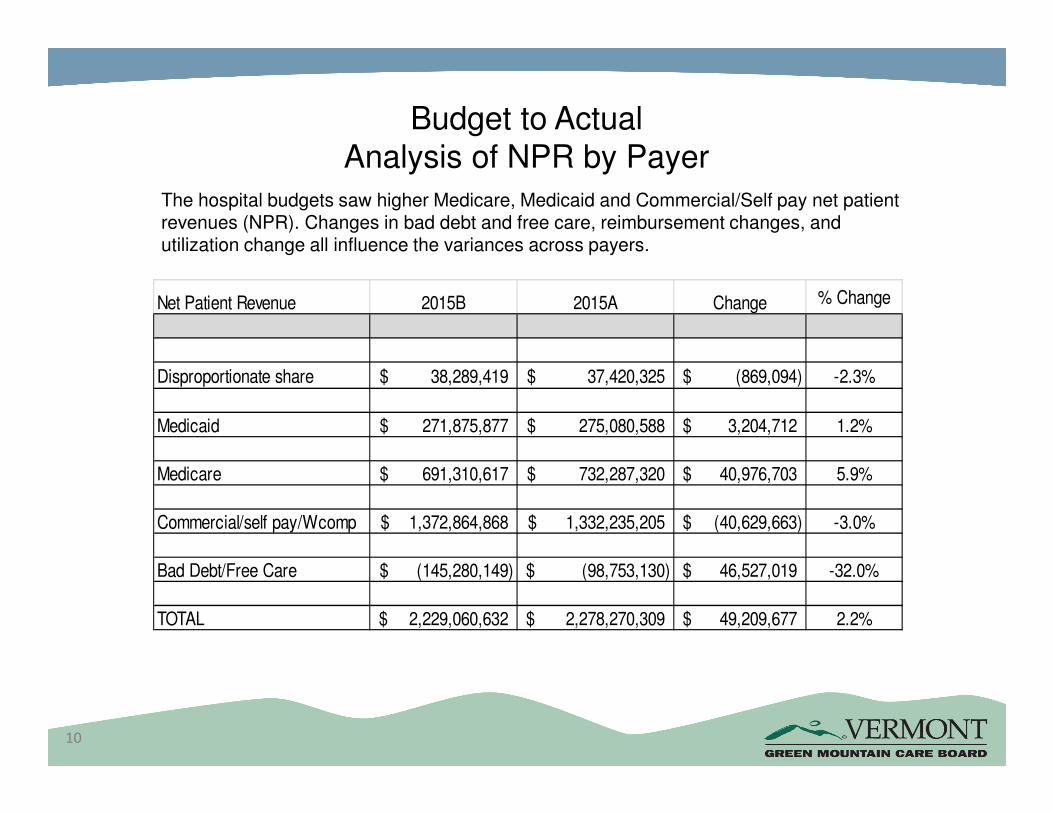
Budget to ActualAnalysis of NPR by Payer
The hospital budgets saw higher Medicare, Medicaid and Commercial/Self pay net patient revenues (NPR). Changes in bad debt and free care, reimbursement changes, and utilization change all influence the variances across payers.
10
Net Patient Revenue 2015B 2015A Change % Change
Disproportionate share 38,289,419$ 37,420,325$ (869,094)$ -2.3%
Medicaid 271,875,877$ 275,080,588$ 3,204,712$ 1.2%
Medicare 691,310,617$ 732,287,320$ 40,976,703$ 5.9%
Commercial/self pay/Wcomp 1,372,864,868$ 1,332,235,205$ (40,629,663)$ -3.0%
Bad Debt/Free Care (145,280,149)$ (98,753,130)$ 46,527,019$ -32.0%
TOTAL 2,229,060,632$ 2,278,270,309$ 49,209,677$ 2.2%
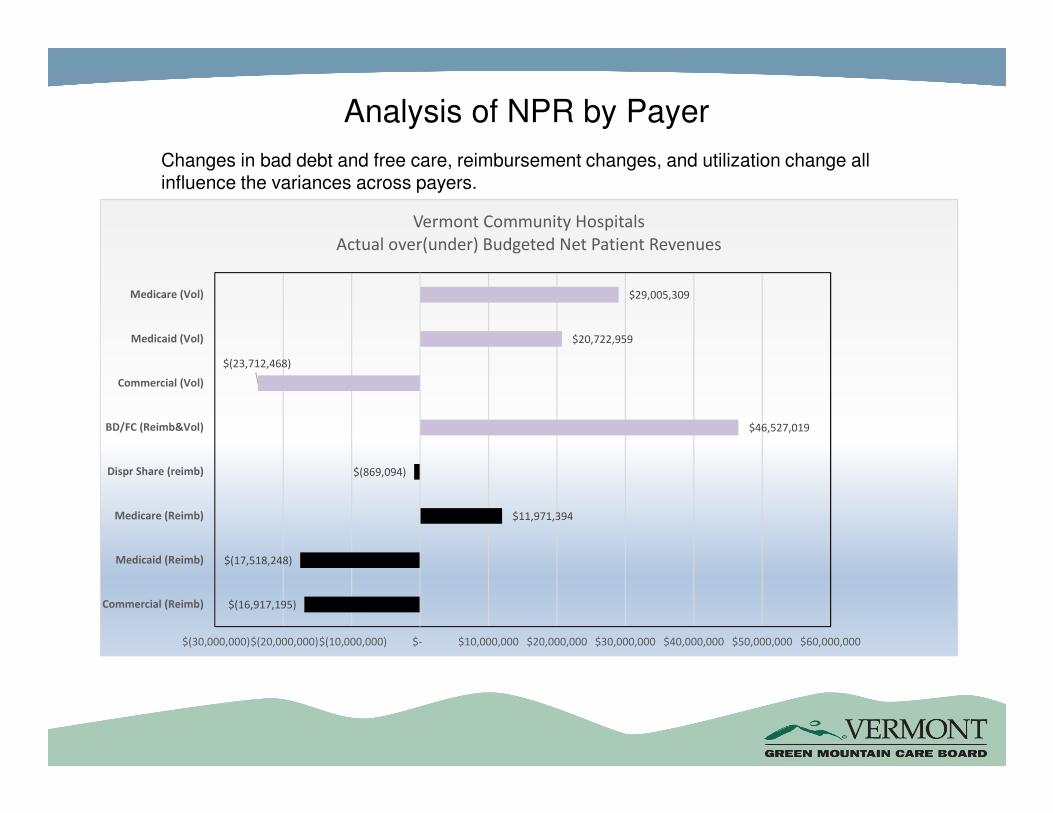
Analysis of NPR by Payer
Changes in bad debt and free care, reimbursement changes, and utilization change all influence the variances across payers.
$(16,917,195)
$(17,518,248)
$11,971,394
$(869,094)
$46,527,019
$(23,712,468)
$20,722,959
$29,005,309
$(30,000,000) $(20,000,000) $(10,000,000) $- $10,000,000 $20,000,000 $30,000,000 $40,000,000 $50,000,000 $60,000,000
Commercial (Reimb)
Medicaid (Reimb)
Medicare (Reimb)
Dispr Share (reimb)
BD/FC (Reimb&Vol)
Commercial (Vol)
Medicaid (Vol)
Medicare (Vol)
Vermont Community Hospitals
Actual over(under) Budgeted Net Patient Revenues
Net Patient Revenue
12
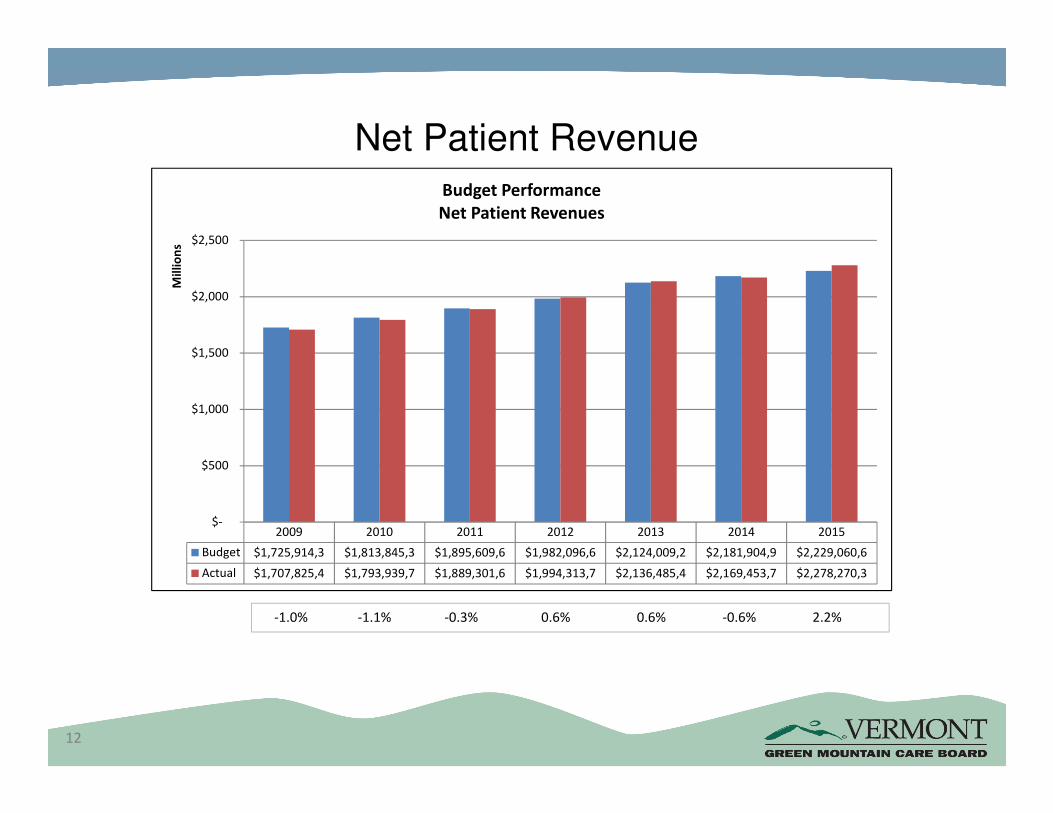
-1.0% -1.1% -0.3% 0.6% 0.6% -0.6% 2.2%
2009 2010 2011 2012 2013 2014 2015
Budget $1,725,914,3 $1,813,845,3 $1,895,609,6 $1,982,096,6 $2,124,009,2 $2,181,904,9 $2,229,060,6
Actual $1,707,825,4 $1,793,939,7 $1,889,301,6 $1,994,313,7 $2,136,485,4 $2,169,453,7 $2,278,270,3
$-
$500
$1,000
$1,500
$2,000
$2,500
Mil
lio
ns
Budget Performance
Net Patient Revenues
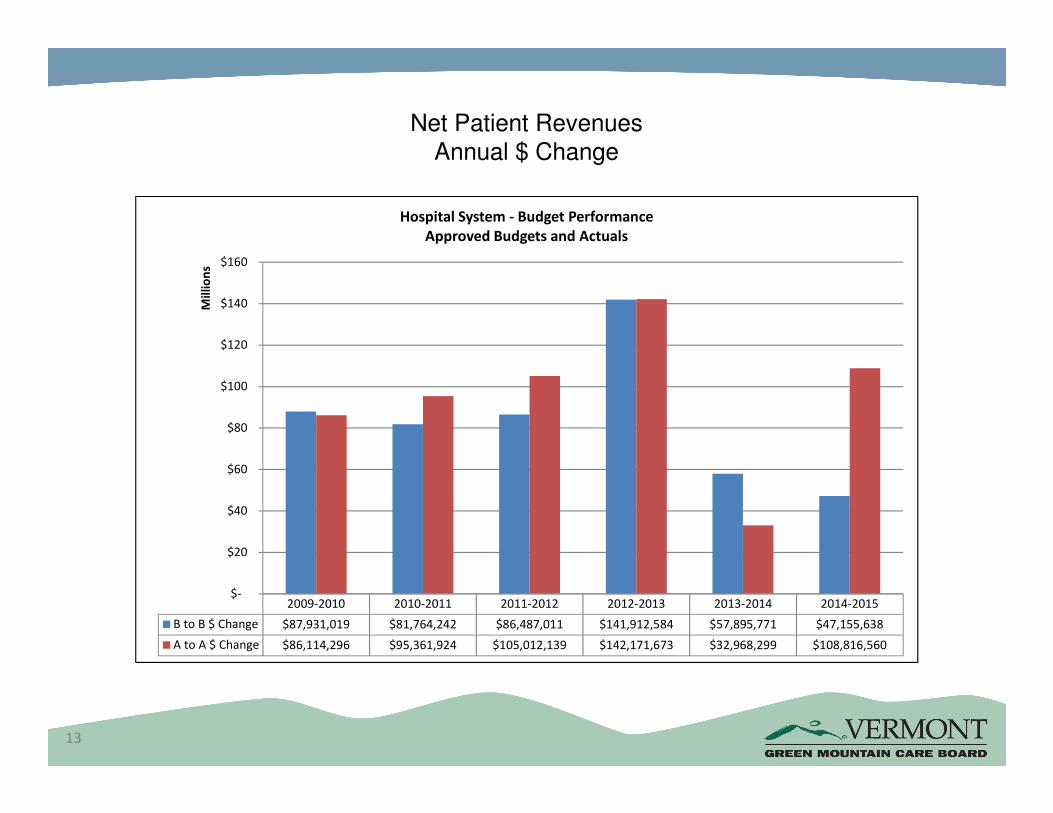
Net Patient RevenuesAnnual $ Change
13
2009-2010 2010-2011 2011-2012 2012-2013 2013-2014 2014-2015
B to B $ Change $87,931,019 $81,764,242 $86,487,011 $141,912,584 $57,895,771 $47,155,638
A to A $ Change $86,114,296 $95,361,924 $105,012,139 $142,171,673 $32,968,299 $108,816,560
$-
$20
$40
$60
$80
$100
$120
$140
$160
Mil
lio
ns
Hospital System - Budget Performance
Approved Budgets and Actuals
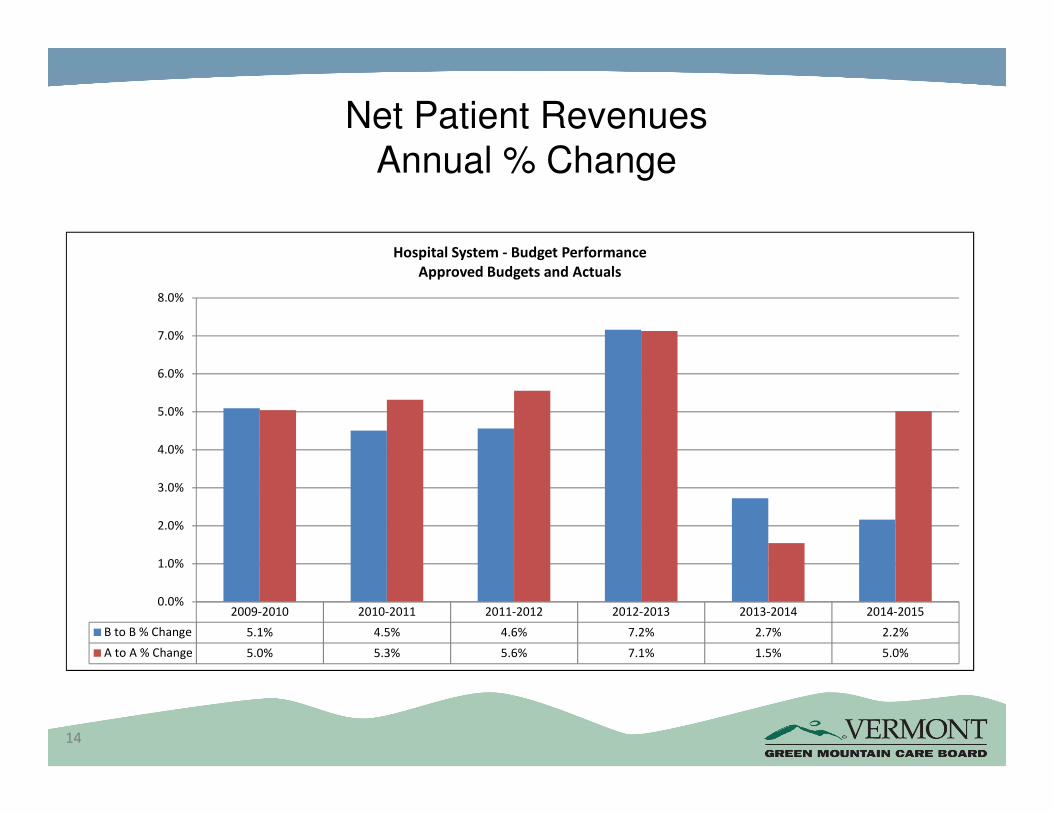
Net Patient RevenuesAnnual % Change
14
2009-2010 2010-2011 2011-2012 2012-2013 2013-2014 2014-2015
B to B % Change 5.1% 4.5% 4.6% 7.2% 2.7% 2.2%
A to A % Change 5.0% 5.3% 5.6% 7.1% 1.5% 5.0%
0.0%
1.0%
2.0%
3.0%
4.0%
5.0%
6.0%
7.0%
8.0%
Hospital System - Budget Performance
Approved Budgets and Actuals
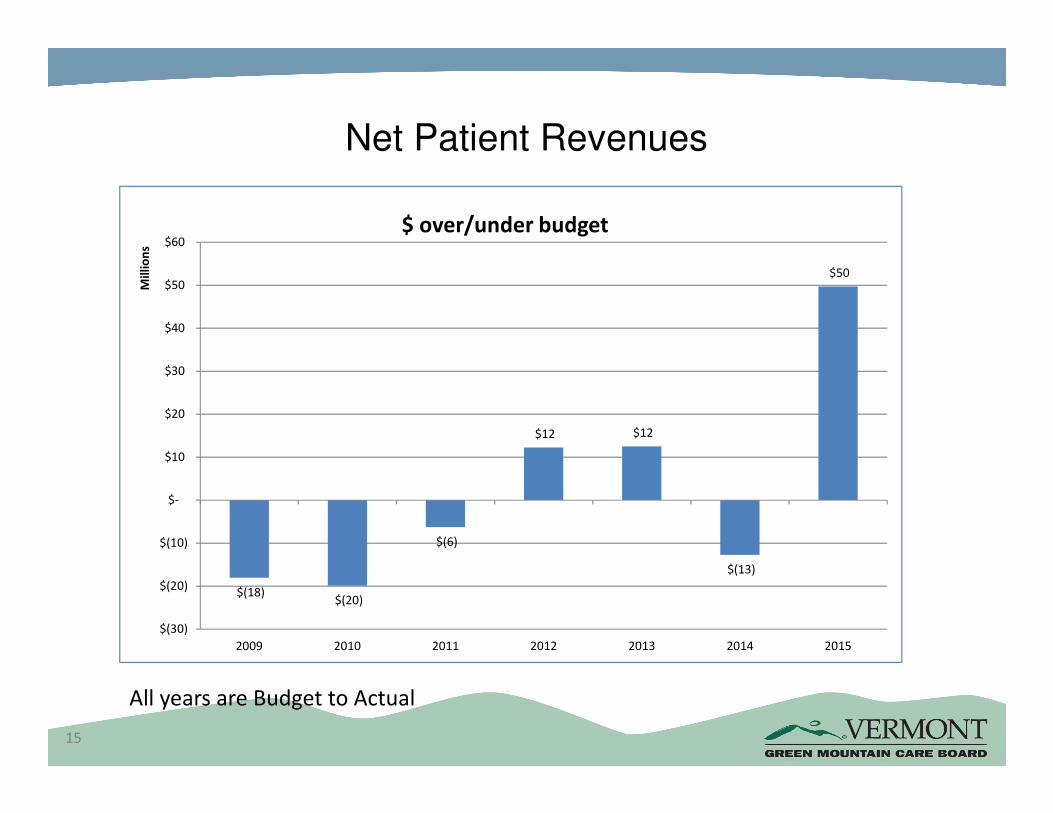
Net Patient Revenues
15
$(18)$(20)
$(6)
$12 $12
$(13)
$50
$(30)
$(20)
$(10)
$-
$10
$20
$30
$40
$50
$60
2009 2010 2011 2012 2013 2014 2015
Mil
lio
ns
$ over/under budget
All years are Budget to Actual
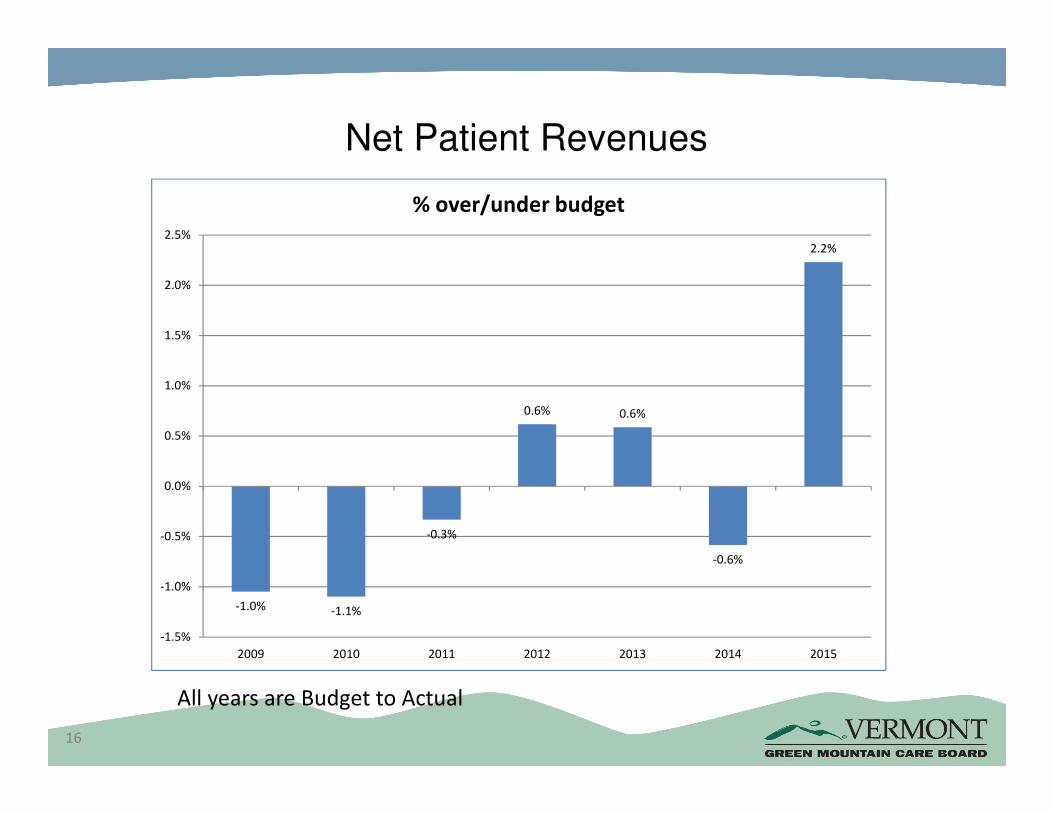
Net Patient Revenues
16
-1.0% -1.1%
-0.3%
0.6% 0.6%
-0.6%
2.2%
-1.5%
-1.0%
-0.5%
0.0%
0.5%
1.0%
1.5%
2.0%
2.5%
2009 2010 2011 2012 2013 2014 2015
% over/under budget
All years are Budget to Actual
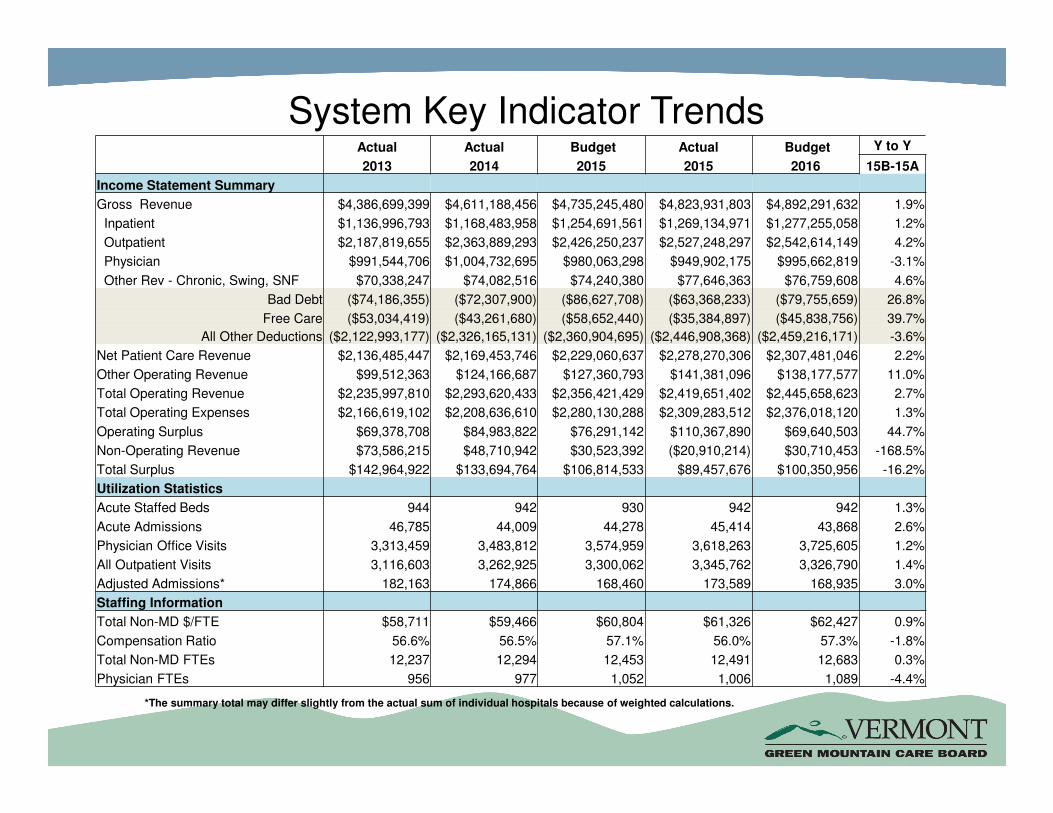
System Key Indicator Trends
*The summary total may differ slightly from the actual sum of individual hospitals because of weighted calculations.
Actual Actual Budget Actual Budget Y to Y
2013 2014 2015 2015 2016 15B-15A
Income Statement Summary
Gross Revenue $4,386,699,399 $4,611,188,456 $4,735,245,480 $4,823,931,803 $4,892,291,632 1.9%
Inpatient $1,136,996,793 $1,168,483,958 $1,254,691,561 $1,269,134,971 $1,277,255,058 1.2%
Outpatient $2,187,819,655 $2,363,889,293 $2,426,250,237 $2,527,248,297 $2,542,614,149 4.2%
Physician $991,544,706 $1,004,732,695 $980,063,298 $949,902,175 $995,662,819 -3.1%
Other Rev - Chronic, Swing, SNF $70,338,247 $74,082,516 $74,240,380 $77,646,363 $76,759,608 4.6%
Bad Debt ($74,186,355) ($72,307,900) ($86,627,708) ($63,368,233) ($79,755,659) 26.8%
Free Care ($53,034,419) ($43,261,680) ($58,652,440) ($35,384,897) ($45,838,756) 39.7%
All Other Deductions ($2,122,993,177) ($2,326,165,131) ($2,360,904,695) ($2,446,908,368) ($2,459,216,171) -3.6%
Net Patient Care Revenue $2,136,485,447 $2,169,453,746 $2,229,060,637 $2,278,270,306 $2,307,481,046 2.2%
Other Operating Revenue $99,512,363 $124,166,687 $127,360,793 $141,381,096 $138,177,577 11.0%
Total Operating Revenue $2,235,997,810 $2,293,620,433 $2,356,421,429 $2,419,651,402 $2,445,658,623 2.7%
Total Operating Expenses $2,166,619,102 $2,208,636,610 $2,280,130,288 $2,309,283,512 $2,376,018,120 1.3%
Operating Surplus $69,378,708 $84,983,822 $76,291,142 $110,367,890 $69,640,503 44.7%
Non-Operating Revenue $73,586,215 $48,710,942 $30,523,392 ($20,910,214) $30,710,453 -168.5%
Total Surplus $142,964,922 $133,694,764 $106,814,533 $89,457,676 $100,350,956 -16.2%
Utilization Statistics
Acute Staffed Beds 944 942 930 942 942 1.3%
Acute Admissions 46,785 44,009 44,278 45,414 43,868 2.6%
Physician Office Visits 3,313,459 3,483,812 3,574,959 3,618,263 3,725,605 1.2%
All Outpatient Visits 3,116,603 3,262,925 3,300,062 3,345,762 3,326,790 1.4%
Adjusted Admissions* 182,163 174,866 168,460 173,589 168,935 3.0%
Staffing Information
Total Non-MD $/FTE $58,711 $59,466 $60,804 $61,326 $62,427 0.9%
Compensation Ratio 56.6% 56.5% 57.1% 56.0% 57.3% -1.8%
Total Non-MD FTEs 12,237 12,294 12,453 12,491 12,683 0.3%
Physician FTEs 956 977 1,052 1,006 1,089 -4.4%

System Key Indicator Trends
Actual Actual Budget Actual Budget Y to Y
2013 2014 2015 2015 2016 15B-15A
Uncompensated Care
Free Care (Gross Revenue) $53,034,419 $43,261,680 $58,652,440 $35,384,897 $45,838,756 -39.7%
Free Care % of Gross Revenue 1.2% 0.9% 1.2% 0.7% 0.9% -40.8%
Bad Debt (Gross Revenue) $74,186,355 $72,603,879 $86,627,708 $62,869,524 $79,755,659 -27.4%
Bad Debt % of Gross Revenue 1.7% 1.6% 1.8% 1.3% 1.6% -28.8%
% share of total Gross Revenue
Medicare 38.8% 41.6% 41.2% 42.1% 41.5% 2.2%
Medicaid 15.8% 16.4% 16.3% 17.6% 17.3% 7.6%
Commercial 45.4% 42.0% 42.5% 40.4% 41.2% -5.0%
% share of total Net Revenue
Medicare 31.4% 32.7% 31.6% 32.7% 31.3% 3.6%
Medicaid 13.8% 12.5% 12.4% 12.3% 12.5% -1.1%
Commercial 54.8% 54.8% 56.0% 55.0% 56.1% -1.8%
Capital & Assets
Capital Budget - no unapproved CONs $103,089,799 $115,704,108 $137,226,456 $100,225,338 $105,967,269 -27.0%
Unapproved CONs n/a n/a $111,980,482 $37,754,369 $106,138,550 -66.3%
Major Movable Equipment Budget $55,662,713 $60,919,828 $70,791,693 $53,724,642 $64,383,916 -24.1%
Board Designated Assets $633,301,557 $679,858,975 $765,248,168 $750,142,965 $829,279,565 -2.0%
Net Property, Plant & Equipment $788,118,113 $785,724,257 $945,557,089 $818,767,048 $992,034,203 -13.4%
Net Assets $1,144,438,796 $1,270,702,489 $1,387,888,631 $1,326,738,221 $1,449,299,262 -4.4%
Financial Indicators
Capital Cost % of Total Expense 6.0% 5.9% 6.0% 5.4% 5.8% -9.4%
Days Cash on Hand 161 176 181 178 180 -1.1%
Operating Surplus % of Net Rev 3.1% 3.7% 3.2% 4.6% 2.8% 40.9%
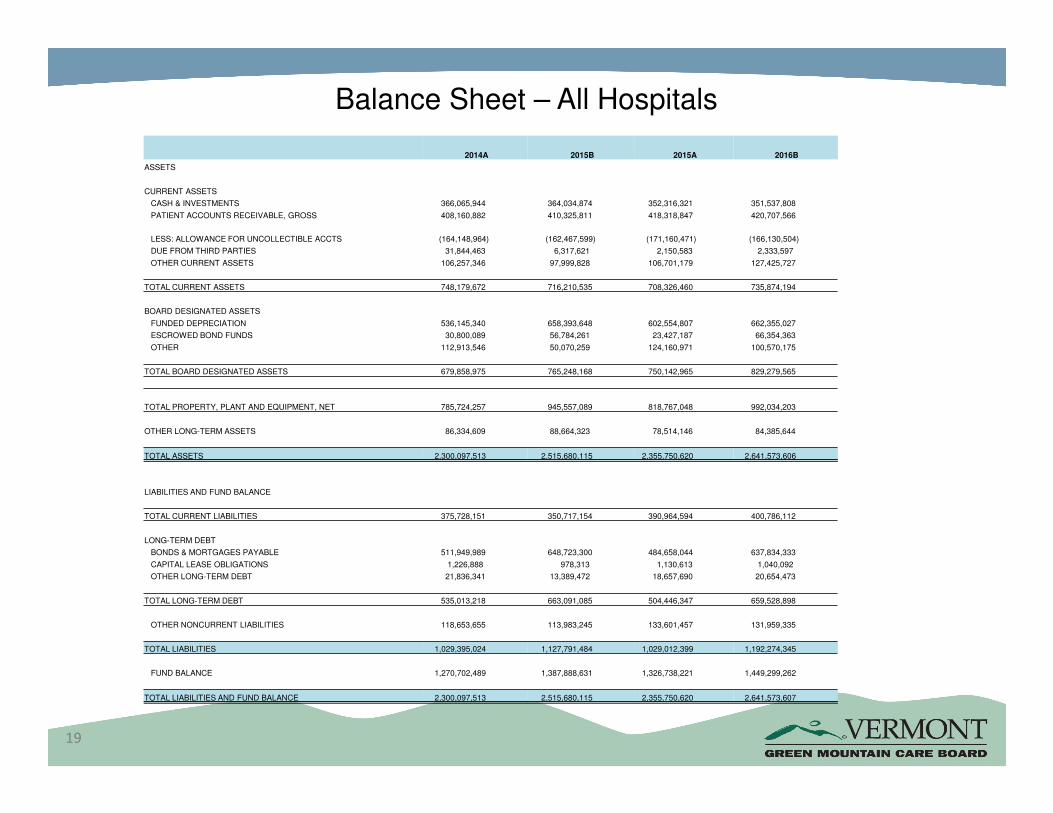
Balance Sheet – All Hospitals
19
2014A 2015B 2015A 2016B
ASSETS
CURRENT ASSETS
CASH & INVESTMENTS 366,065,944 364,034,874 352,316,321 351,537,808
PATIENT ACCOUNTS RECEIVABLE, GROSS 408,160,882 410,325,811 418,318,847 420,707,566
LESS: ALLOWANCE FOR UNCOLLECTIBLE ACCTS (164,148,964) (162,467,599) (171,160,471) (166,130,504)
DUE FROM THIRD PARTIES 31,844,463 6,317,621 2,150,583 2,333,597
OTHER CURRENT ASSETS 106,257,346 97,999,828 106,701,179 127,425,727
TOTAL CURRENT ASSETS 748,179,672 716,210,535 708,326,460 735,874,194
BOARD DESIGNATED ASSETS
FUNDED DEPRECIATION 536,145,340 658,393,648 602,554,807 662,355,027
ESCROWED BOND FUNDS 30,800,089 56,784,261 23,427,187 66,354,363
OTHER 112,913,546 50,070,259 124,160,971 100,570,175
TOTAL BOARD DESIGNATED ASSETS 679,858,975 765,248,168 750,142,965 829,279,565
TOTAL PROPERTY, PLANT AND EQUIPMENT, NET 785,724,257 945,557,089 818,767,048 992,034,203
OTHER LONG-TERM ASSETS 86,334,609 88,664,323 78,514,146 84,385,644
TOTAL ASSETS 2,300,097,513 2,515,680,115 2,355,750,620 2,641,573,606
LIABILITIES AND FUND BALANCE
TOTAL CURRENT LIABILITIES 375,728,151 350,717,154 390,964,594 400,786,112
LONG-TERM DEBT
BONDS & MORTGAGES PAYABLE 511,949,989 648,723,300 484,658,044 637,834,333
CAPITAL LEASE OBLIGATIONS 1,226,888 978,313 1,130,613 1,040,092
OTHER LONG-TERM DEBT 21,836,341 13,389,472 18,657,690 20,654,473
TOTAL LONG-TERM DEBT 535,013,218 663,091,085 504,446,347 659,528,898
OTHER NONCURRENT LIABILITIES 118,653,655 113,983,245 133,601,457 131,959,335
TOTAL LIABILITIES 1,029,395,024 1,127,791,484 1,029,012,399 1,192,274,345
FUND BALANCE 1,270,702,489 1,387,888,631 1,326,738,221 1,449,299,262
TOTAL LIABILITIES AND FUND BALANCE 2,300,097,513 2,515,680,115 2,355,750,620 2,641,573,607
20
Appendix
Actual 2015Supporting Schedules
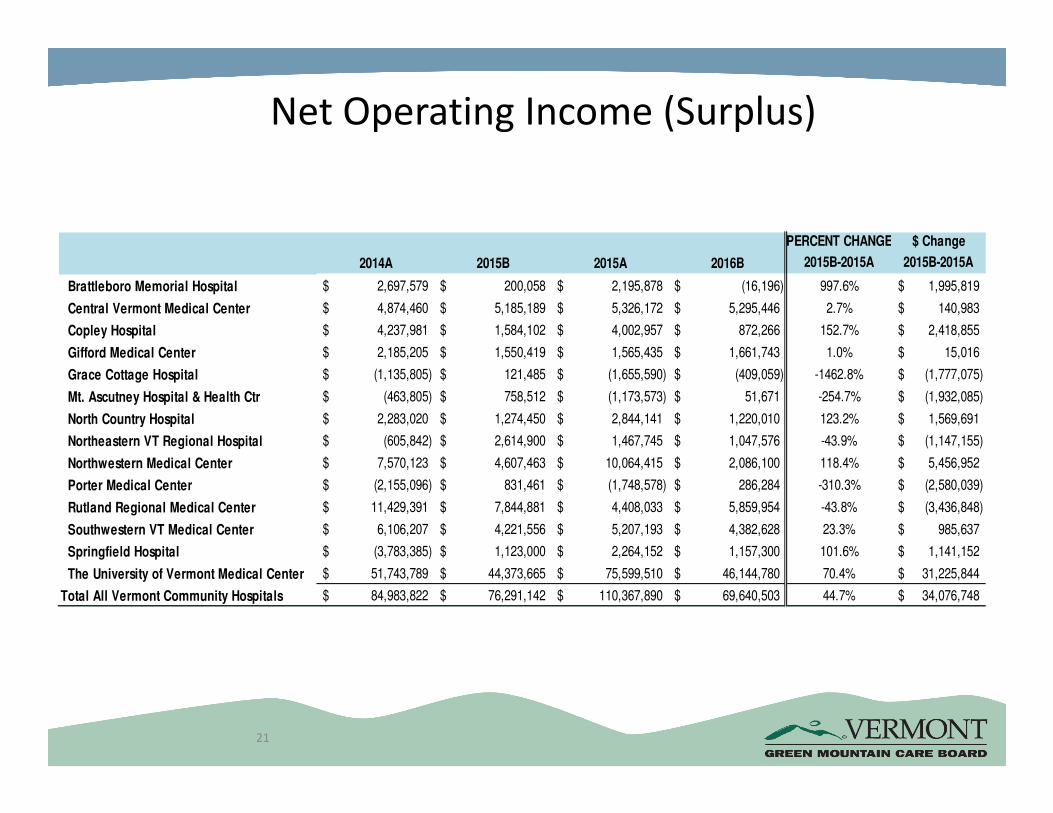
Net Operating Income (Surplus)
21
$ Change
2014A 2015B 2015A 2016B 2015B-2015A 2015B-2015A
Brattleboro Memorial Hospital 2,697,579$ 200,058$ 2,195,878$ (16,196)$ 997.6% 1,995,819$
Central Vermont Medical Center 4,874,460$ 5,185,189$ 5,326,172$ 5,295,446$ 2.7% 140,983$
Copley Hospital 4,237,981$ 1,584,102$ 4,002,957$ 872,266$ 152.7% 2,418,855$
Gifford Medical Center 2,185,205$ 1,550,419$ 1,565,435$ 1,661,743$ 1.0% 15,016$
Grace Cottage Hospital (1,135,805)$ 121,485$ (1,655,590)$ (409,059)$ -1462.8% (1,777,075)$
Mt. Ascutney Hospital & Health Ctr (463,805)$ 758,512$ (1,173,573)$ 51,671$ -254.7% (1,932,085)$
North Country Hospital 2,283,020$ 1,274,450$ 2,844,141$ 1,220,010$ 123.2% 1,569,691$
Northeastern VT Regional Hospital (605,842)$ 2,614,900$ 1,467,745$ 1,047,576$ -43.9% (1,147,155)$
Northwestern Medical Center 7,570,123$ 4,607,463$ 10,064,415$ 2,086,100$ 118.4% 5,456,952$
Porter Medical Center (2,155,096)$ 831,461$ (1,748,578)$ 286,284$ -310.3% (2,580,039)$
Rutland Regional Medical Center 11,429,391$ 7,844,881$ 4,408,033$ 5,859,954$ -43.8% (3,436,848)$
Southwestern VT Medical Center 6,106,207$ 4,221,556$ 5,207,193$ 4,382,628$ 23.3% 985,637$
Springfield Hospital (3,783,385)$ 1,123,000$ 2,264,152$ 1,157,300$ 101.6% 1,141,152$
The University of Vermont Medical Center 51,743,789$ 44,373,665$ 75,599,510$ 46,144,780$ 70.4% 31,225,844$
Total All Vermont Community Hospitals 84,983,822$ 76,291,142$ 110,367,890$ 69,640,503$ 44.7% 34,076,748$
PERCENT CHANGE
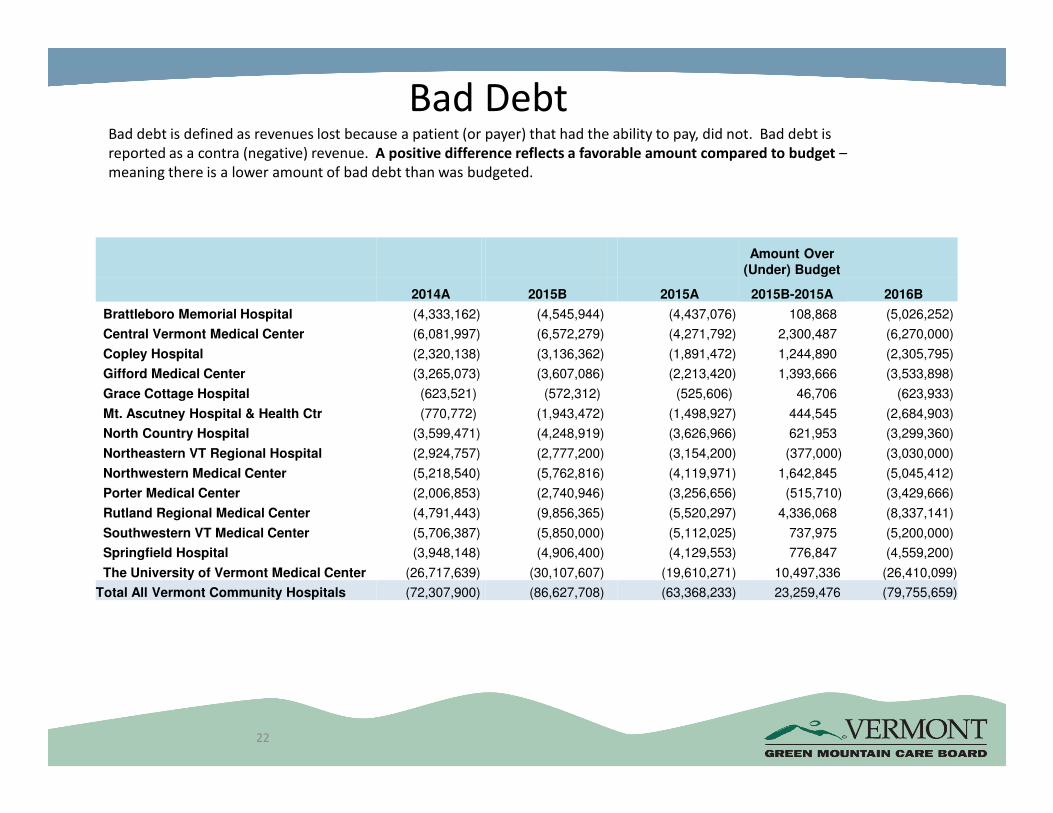
Bad DebtBad debt is defined as revenues lost because a patient (or payer) that had the ability to pay, did not. Bad debt is
reported as a contra (negative) revenue. A positive difference reflects a favorable amount compared to budget –
meaning there is a lower amount of bad debt than was budgeted.
22
Amount Over (Under) Budget
2014A 2015B 2015A 2015B-2015A 2016B
Brattleboro Memorial Hospital (4,333,162) (4,545,944) (4,437,076) 108,868 (5,026,252)
Central Vermont Medical Center (6,081,997) (6,572,279) (4,271,792) 2,300,487 (6,270,000)
Copley Hospital (2,320,138) (3,136,362) (1,891,472) 1,244,890 (2,305,795)
Gifford Medical Center (3,265,073) (3,607,086) (2,213,420) 1,393,666 (3,533,898)
Grace Cottage Hospital (623,521) (572,312) (525,606) 46,706 (623,933)
Mt. Ascutney Hospital & Health Ctr (770,772) (1,943,472) (1,498,927) 444,545 (2,684,903)
North Country Hospital (3,599,471) (4,248,919) (3,626,966) 621,953 (3,299,360)
Northeastern VT Regional Hospital (2,924,757) (2,777,200) (3,154,200) (377,000) (3,030,000)
Northwestern Medical Center (5,218,540) (5,762,816) (4,119,971) 1,642,845 (5,045,412)
Porter Medical Center (2,006,853) (2,740,946) (3,256,656) (515,710) (3,429,666)
Rutland Regional Medical Center (4,791,443) (9,856,365) (5,520,297) 4,336,068 (8,337,141)
Southwestern VT Medical Center (5,706,387) (5,850,000) (5,112,025) 737,975 (5,200,000)
Springfield Hospital (3,948,148) (4,906,400) (4,129,553) 776,847 (4,559,200)
The University of Vermont Medical Center (26,717,639) (30,107,607) (19,610,271) 10,497,336 (26,410,099)
Total All Vermont Community Hospitals (72,307,900) (86,627,708) (63,368,233) 23,259,476 (79,755,659)
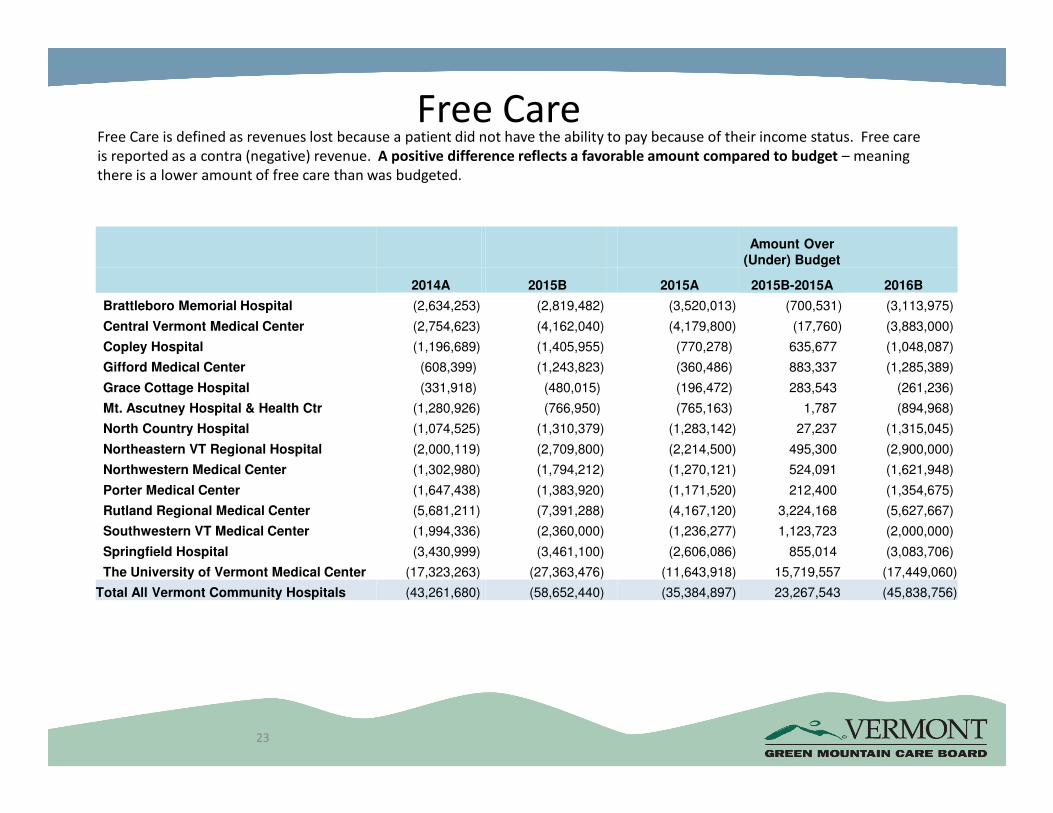
Free CareFree Care is defined as revenues lost because a patient did not have the ability to pay because of their income status. Free care
is reported as a contra (negative) revenue. A positive difference reflects a favorable amount compared to budget – meaning
there is a lower amount of free care than was budgeted.
23
Amount Over (Under) Budget
2014A 2015B 2015A 2015B-2015A 2016B
Brattleboro Memorial Hospital (2,634,253) (2,819,482) (3,520,013) (700,531) (3,113,975)
Central Vermont Medical Center (2,754,623) (4,162,040) (4,179,800) (17,760) (3,883,000)
Copley Hospital (1,196,689) (1,405,955) (770,278) 635,677 (1,048,087)
Gifford Medical Center (608,399) (1,243,823) (360,486) 883,337 (1,285,389)
Grace Cottage Hospital (331,918) (480,015) (196,472) 283,543 (261,236)
Mt. Ascutney Hospital & Health Ctr (1,280,926) (766,950) (765,163) 1,787 (894,968)
North Country Hospital (1,074,525) (1,310,379) (1,283,142) 27,237 (1,315,045)
Northeastern VT Regional Hospital (2,000,119) (2,709,800) (2,214,500) 495,300 (2,900,000)
Northwestern Medical Center (1,302,980) (1,794,212) (1,270,121) 524,091 (1,621,948)
Porter Medical Center (1,647,438) (1,383,920) (1,171,520) 212,400 (1,354,675)
Rutland Regional Medical Center (5,681,211) (7,391,288) (4,167,120) 3,224,168 (5,627,667)
Southwestern VT Medical Center (1,994,336) (2,360,000) (1,236,277) 1,123,723 (2,000,000)
Springfield Hospital (3,430,999) (3,461,100) (2,606,086) 855,014 (3,083,706)
The University of Vermont Medical Center (17,323,263) (27,363,476) (11,643,918) 15,719,557 (17,449,060)
Total All Vermont Community Hospitals (43,261,680) (58,652,440) (35,384,897) 23,267,543 (45,838,756)
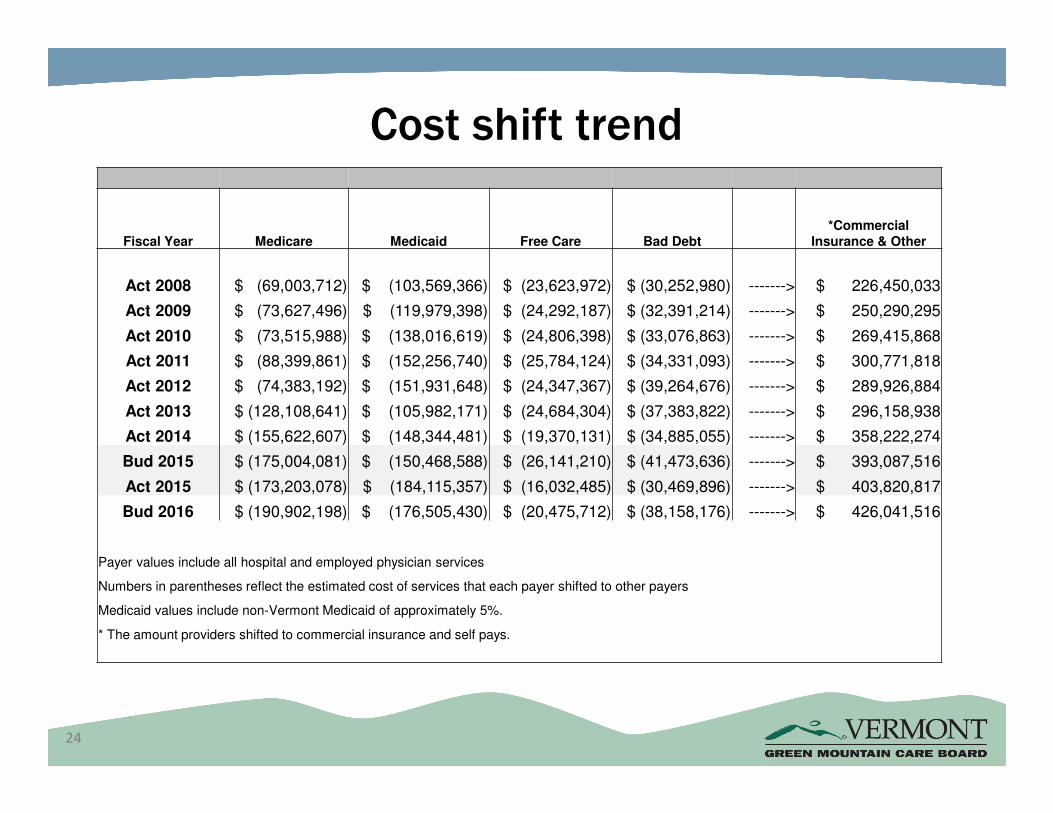
Cost shift trend
24
Medicare Medicaid Free Care Bad Debt*Commercial
Insurance & OtherFiscal Year
Act 2008 $ (69,003,712) $ (103,569,366) $ (23,623,972) $ (30,252,980) -------> $ 226,450,033
Act 2009 $ (73,627,496) $ (119,979,398) $ (24,292,187) $ (32,391,214) -------> $ 250,290,295
Act 2010 $ (73,515,988) $ (138,016,619) $ (24,806,398) $ (33,076,863) -------> $ 269,415,868
Act 2011 $ (88,399,861) $ (152,256,740) $ (25,784,124) $ (34,331,093) -------> $ 300,771,818
Act 2012 $ (74,383,192) $ (151,931,648) $ (24,347,367) $ (39,264,676) -------> $ 289,926,884
Act 2013 $ (128,108,641) $ (105,982,171) $ (24,684,304) $ (37,383,822) -------> $ 296,158,938
Act 2014 $ (155,622,607) $ (148,344,481) $ (19,370,131) $ (34,885,055) -------> $ 358,222,274
Bud 2015 $ (175,004,081) $ (150,468,588) $ (26,141,210) $ (41,473,636) -------> $ 393,087,516
Act 2015 $ (173,203,078) $ (184,115,357) $ (16,032,485) $ (30,469,896) -------> $ 403,820,817
Bud 2016 $ (190,902,198) $ (176,505,430) $ (20,475,712) $ (38,158,176) -------> $ 426,041,516
Payer values include all hospital and employed physician services
Numbers in parentheses reflect the estimated cost of services that each payer shifted to other payers
Medicaid values include non-Vermont Medicaid of approximately 5%.
* The amount providers shifted to commercial insurance and self pays.

2015 Cost Shift Vermont Community Hospitals
25
Fiscal Year 2015 Actual
Provider
Brattleboro Memorial Hospital (2,195,592)$ (1,642,625)$ ($3,426,464) ($8,751,860) ---------------> $16,016,541
Central Vermont Hospital (2,236,245)$ (2,067,193)$ ($8,706,874) ($9,857,975) ---------------> $22,868,288
Copley Hospital (1,098,586)$ (422,162)$ ($2,830,563) ($7,563,622) ---------------> $11,914,933
Gifford Medical Center (1,082,545)$ (166,202)$ ($1,922,917) ($5,116,477) ---------------> $8,288,141
Grace Cottage Hospital (372,180)$ (134,470)$ $2,238,505 ($1,688,976) ---------------> ($42,879)
Mount Ascutney Hospital (817,681)$ (400,635)$ ($124,947) ($3,843,478) ---------------> $5,186,742
North Country Hospital (1,599,332)$ (532,740)$ ($2,530,920) ($9,480,767) ---------------> $14,143,759
Northeastern VT Regional Hospital (1,567,608)$ (1,039,965)$ ($3,413,007) ($6,410,084) ---------------> $12,430,664
Northwestern Medical Center (2,123,208)$ (616,891)$ ($3,668,440) ($8,883,688) ---------------> $15,292,227
Porter Medical Center (1,622,105)$ (550,072)$ ($232,505) ($6,567,790) ---------------> $8,972,472
Rutland Regional Medical Center (2,554,633)$ (1,818,605)$ ($28,953,781) ($22,079,674) ---------------> $55,406,693
Southwestern Vermont Medical Center (2,472,606)$ (563,702)$ ($9,186,771) ($11,888,259) ---------------> $24,111,338
Springfield Hospital (1,931,635)$ (1,149,855)$ ($739,847) ($5,188,647) ---------------> $9,009,986
The University of Vermont Medical Center (8,795,939)$ (4,927,367)$ ($109,704,545) ($76,794,060) ---------------> $200,221,911
SYSTEM (30,469,896)$ (16,032,485)$ (173,203,078)$ (184,115,357)$ ---------------> 403,820,817$
CommericalMedicaidMedicareFree CareBad Debt

� Individual Hospital and System Budget Schedules (for example: income statement, balance sheet, payer schedule)
� Trend Reports (takes an account or statistic (or several) over time for a hospital or the system as a whole
� Profile Reports (takes an account or statistic (or several) for one given year and details them by hospital and a system total)
� Analytical Reports: budget data presented in various ways to aid in our analyses
� Green Mountain Care Board Enforcement policy for FY 2014 – 2015 Hospital Budget Submissions can be found at:
http://www.gmcboard.vermont.gov/sites/gmcboard/files/Hospital/Enforcement_Policy.pdf
� Reports Done Annually:
� Summary of Approved (FY) Budgets (Nov/Dec)� Summary of Actual (FY) Results (Apr/May)
26
Available Reports and Information
The contents of this report has been compiled from budget submissions provided to the
GMCB . The specific hospital budget orders as well as other hospital reports and policies can be found on our website at http://gmcboard.vermont.gov/HospitalBudgets.
If you have questions about this report or if you would like more detail, please contact Michael Davis, Janeen Morrison, or Lori Perry at the GMCB (802) 828-2177.
27
End