Embed Size (px)
Citation preview

Szke, M., & Azarpeyvand, M. (2016). Reduction of the Hydrodynamic Noiseon a Beamforming Array. Paper presented at 6th Berlin BeamformingConference, Berlin, Germany.
Publisher's PDF, also known as Version of record
Link to publication record in Explore Bristol ResearchPDF-document
This is the final published version of the article (version of record). It first appeared online via [insert publishername] at [insert hyperlink]. Please refer to any applicable terms of use of the publisher.
University of Bristol - Explore Bristol ResearchGeneral rights
This document is made available in accordance with publisher policies. Please cite only the publishedversion using the reference above. Full terms of use are available:http://www.bristol.ac.uk/pure/about/ebr-terms

BeBeC-2016-D2
REDUCTION OF THE HYDRODYNAMIC NOISE ON A
BEAMFORMING ARRAY
Mate Szoke1 and Mahdi Azarpeyvand1
1Aeroacoustics and Aerodynamics Research Group, Faculty of Engineering
University of Bristol, Queens Building, University Walk, BS8 1TR, Bristol, United Kingdom
Abstract
The design and build process of an 80 microphone beamforming array is reported. The
array is designed to be installed on the wall of a large closed circuit wind tunnel, primarily
for helicopter rotor noise measurement and source identification studies. The acoustic data
collected using the array is prone to contamination due to the presence of a strong hydrody-
namic field on the wall of the wind tunnel, caused by the wall boundary layer and also the
down-wash flow from the helicopter rig. A study has been carried out for the reduction of
the hydrodynamic noise using different stainless steel wire-mesh materials, recessing the
microphones behind the screen and adding porous foam material in the space behind the
screen and microphones. The effect of these treatments are investigated and evaluated for a
number of test cases. In addition, different beamforming algorithms, such as the delay-and-
sum and functional beamforming are used and compared in this study for different type of
noise sources over the entire frequency range of interest. The designed array can deliver a
dynamic range of 13-15 dB and low sidelobe levels.
1 INTRODUCTION
Aerodynamic related measurements, such as aerodynamic loading and flow visualization, are
usually carried out in closed section wind tunnels, while aeroacoustic tests are preferably done
in open-section anechoic wind tunnels. The main aeroacoustic limitation of the open-section
tunnels comes from the background noise due to jet flow, particularly at high velocities. High
flow velocities can be achieved in closed section wind tunnels, which from an acoustic point of
view is not an ideal environment for acoustic and beamforming measurements. In such cases,
the microphones are usually mounted on the wall of the wind tunnel, where the presence of
strong hydrodynamic fluctuations, mainly due to the presence of the boundary layer, swamp the
acoustic signal and leads to the contamination of the data.
1

6th Berlin Beamforming Conference 2016 M. Szoke and M. Azarpeyvand
The effect of such pressure fluctuations can be reduced by increasing the number of micro-
phones, which inevitably leads to cost increase and larger space requirements. Increasing the
data acquisition time also reduces the influence of these fluctuations. Subtracting out the back-
ground noise is a well defined approach [3], which on the other hand still requires multiple
test-runs to achieve a statistically reliable result.
The physical separation of the flow from the microphones have been studied before [6, 12],
and such approaches have been widely used [10, 11, 13]. In these cases, the beamforming array
is recessed behind a stretched fabric. This material must satisfy the following requirements:
It shall (a) be acoustically transparent, (b) filter out the hydrodynamic noise field, (c) preserve
the acoustic noise signal and (d) have sufficient mechanical resistance. The most widely used
material for this purpose is Kevlar, which is usually installed such that it is flush mounted on the
side of the wind tunnel. The microphones are mounted behind the Kevlar with a given recess
depth. It has been reported that this layout gives a reasonably low acoustic loss, while the
drawback of the layout is that the flow might interact with the filaments of the Kevlar which in
turn results in high frequency noise [8]. This flow-induced high frequency noise can affect the
quality of the data at high frequencies, which is of particular interest for noise mapping of scaled
models. The use of woven wire-mesh cloth has also been suggested, for example by Fleury et
al. [8] and it has been reported that with a carefully chosen wire-mesh, one can effectively
reduce the hydrodynamic noise without the emergence of flow-induced high frequency noise.
In this paper, we further investigate the use of woven meshes to reduce the hydrodynamic
noise field. Prior research [8] had shown that the use of Dutch twilled woven wire-mesh gives
reasonably good results for the reduction of the unwanted pressure fluctuations, however the
effect of different wire-meshes with different properties (pore sizes, directionality, transparency)
of this particular material has not yet been studied. As a first step, three different wire-meshes
have been investigated in the closed-circuit low turbulence wind tunnel at the University of
Bristol. The effects of the stretching direction of the materials with respect to the flow and the
recess depth of the microphones behind the mesh are also studied. From the presented test cases
a layout is chosen as the most effective for hydrodynamic noise reduction, and will be applied
to a recently designed and built 80 microphone beamforming array. The array design and build
will be discussed in Section 3.
As a second step, a beamforming array is designed in the framework of the National Rotor
Rig Project. The main purpose is to construct an 80 microphone array for helicopter rotor
noise measurements. A helicopter rig is built in the framework of the project, with rotor span
of 1.8 m and blade rotation speed of 3000 RPM, equivalent to a tip velocity of approximately
280 m/s (Mach number of ≈0.8). The rig will be installed in the De Havilland Tunnel at the
University of Glasgow, where tests will be carried out with wind speeds of up to 80 m/s. This
configuration poses challenges both in terms of the design of the beamforming array and the
post-processing of the acquired data. Due to the wind speed and the down-wash flow from
the helicopter rotor, special care has to be taken during the beamforming array design for the
reduction of the hydrodynamic noise. This is addressed with the application of woven wire-
mesh material and recessing of the microphones behind the mesh, which will be discussed in
Section 2. The measurements will include high speed rotating sources, and it will also have to
take into consideration the non-anechoic conditions of the tunnel. Appropriate signal processing
method will be employed to address these issues.
2

6th Berlin Beamforming Conference 2016 M. Szoke and M. Azarpeyvand
2 WALL HYDRODYNAMIC NOISE REDUCTION
In this section, the reduction of wall hydrodynamic noise is addressed. A small rig was built to
study the reduction of the wall hydrodynamic noise field. The rig consists of 7 microphones, 5
of which installed behind exchangeable wire meshes and the recess depth of the microphones
distance behind the wire mesh can be adjusted. The remaining two microphones were mounted
flush upstream and downstream of the wire mesh, see Fig. 1. The rig was mounted on the wall
of the closed circuit low turbulence wind tunnel at the University of Bristol [4]. The properties
of the wire meshes will be discussed in subsection 2.1.
(a) The stretch rig in the wind tunnel
U
hrecess
depth
plywood
microphone
wire -mesh
(b) Cross section of the rig
Figure 1: Layout of the hydrodynamic noise reduction tests
Three different stainless steel Dutch twilled weave wire meshes have been tested. The prop-
erties of these materials are listed in Table 1. The three different wire meshes are referred to as
WM1, WM2 and WM3 in the followings. The wire meshes are manufactured by GKD UK Ltd.
The original purpose of these wire-meshes is to filter different types of fluids, where a reason-
ably high pressure difference drives the filtration process. The structure of a sample wire-mesh
is shown in Fig. 2. The figure shows that the material is made of filaments woven perpendicu-
larly to each other, where the vertical and horizontal filaments are referred to as the warp and
the weft filaments respectively, see Fig. 2.
The first wire-mesh (WM1) is much thicker than the other two, leading to much higher tensile
strength. Therefore, the surface of the first material is also rougher compared to the other two,
which may result in interaction between the turbulence present in the boundary layer with the
filaments.
2.1 Tested wire-meshes
The acoustic transparency of these materials depends on their pores which are triangular in
shape and formed between the weft filaments, see Fig. 2. In our case, the materials have been
chosen such that the number of filaments in the warp direction gradually increases to achieve
3

6th Berlin Beamforming Conference 2016 M. Szoke and M. Azarpeyvand
Figure 2: Dutch twill weave mesh structure [9]
different pore sizes. From an acoustical point of view, it has been proven that these materials
are acoustically transparent with an attenuation loss of 2-3 dB [8]. In the current tests, the effect
of pores size and material type on the noise reduction level and any potential broadband and
tonal noise contamination is investigated. Two scenarios were considered: (a) when the area of
the pores are parallel and (b) when the pores are perpendicular to the wind speed.
The wire-meshes are fully stretched by the rig to avoid any vibration of the meshes above
the microphones, which ensures that the pressure measurements are not contaminated by any
noise related to the motion of the wire-mesh. From the mechanical point of view, it is important
to note that the maximum elongation in the weft direction that these materials can withstand
without tearing is approximately 3-5 %. The other drawback of these materials is that they are
highly sensitive to local mechanical impacts (for example scratches), therefore extra care needs
to be taken during the handling and stretching process.
Table 1: Dutch twilled weave wire mesh properties
Number of filaments Pore size Thickness Tensile strength [N/mm]
Warp dir. Weft dir. [µm] [mm] Warp dir. Weft dir.
Mesh 1 80 700 47 0.256 18.9 82.6
Mesh 2 165 1400 21 0.146 15.6 48.4
Mesh 3 200 1400 15 0.143 23.9 45.7
2.2 Test set-up
In order to test the hydrodynamic noise reduction capability of the wire-meshes listed in Table 1,
a test rig has been built to hold and fully stretch the wire-mesh, see Fig. 1. As seen in Fig. 1(a),
microphones are located beneath the wire-mesh and the space between the microphones and
the wire-mesh is filled with porous foam. The rig has been flush mounted on the wall of a
low turbulence wind tunnel with a hexagonal cross section. The layout of the rig installed
in the tunnel is shown in Fig. 1(a). Five microphones have been installed 30 mm from each
other forming a cross shape, see Fig. 1(a). Two additional microphones were flush mounted
upstream and downstream of the rig, 150 mm from the centre microphone in the cross shape.
4

6th Berlin Beamforming Conference 2016 M. Szoke and M. Azarpeyvand
The microphones used in this experiment are the G.R.A.S. 40PL high pressure microphones
with a maximum of 150 dB dynamic range.
The microphones were recessed behind the stretched wire-mesh, as shown schematically in
Fig. 1(b). The space between the stretched material and the microphone has been filled with
polypropylene acoustic foam with a typical pore number of 80 PPI (pores per inch). The recess
depth is noted by h and has been set to 2, 7 and 13 mm (small, medium and large). The direction
of stretching can be changed by rotating the rig 90◦ relative to the flow direction. The effective
area of the stretched wire mesh is 150 mm × 150 mm.
Tests have been carried out for wind speeds of 20, 30, 40 and 50 m/s. A loudspeaker was
installed flush mounted to the wall of the tunnel opposite to the rig behind a WM2 type material.
The speaker is used to produce different type of noises inside the wind tunnel and test the
acoustic transparency of the wire meshes. The data was recorded for 32 seconds using the
National Instrument PXIe-4499 cards, with a sampling frequency of 204,800 Hz. The applied
frequency resolution in the post-processing was ∆ f = 64 Hz.
2.3 Hydrodynamic noise reduction results
As a first step, the different wire-meshes have been investigated at different flow speeds inside
the wind tunnel. The tunnel has not been treated acoustically and therefore has strong acoustic
tones that are clearly identifiable in the sound spectra. The power spectrum of the pressure
data are plotted in Figs. 3 to 5. The sensitivity of the microphones drops approximately 5 dB
at 20 kHz, and above 30 kHz the results become flat and non-reliable. The black curves in
the following figures always represent the results of the flush mounted microphone upstream
of the rig, while the coloured curves are obtained by averaging the data from the five recessed
microphones.
102
103
104
105
−20
0
20
40
60
80
100
f [Hz]
10log(p2/p2 ref)[dB/Hz]
ReferenceWire-mesh 1Wire-mesh 2Wire-mesh 3
(a) The comparison of the three different wire-
meshes
102
103
104
105
−20
0
20
40
60
80
100
f [Hz]
10log(p2/p2 ref)[dB/Hz]
ReferenceSmall recessMedium recessLarge recess
(b) The effect of recess depth
Figure 3: The comparison of the noise reduction of the wire meshes at 40 m/s wind speed (a)
and the effect of recess depth on WM2 at 40 m/s wind speed (b)
Figure 3 shows the comparison of the noise reduction obtained using different wire meshes
5

6th Berlin Beamforming Conference 2016 M. Szoke and M. Azarpeyvand
(Fig. 3(a)) and the effect of the changes to the recess depth (Fig. 3(b)) at 40 m/s. The acoustic
results from the wind tunnel showed the lowest number of tonal peaks at 40 m/s, while the trend
of the noise reduction was found to be the same at all wind speeds, therefore only the 40 m/s
case is shown here.
By comparing the three different wire meshes, we can see that they show similar behaviour
to each other. The tones of the wind tunnel in the region of 300-900 Hz are clearly visible for all
the cases, while they remain hidden in the reference microphones data, which is contaminated
by the hydrodynamic noise. This means that the hydrodynamic noise has been successfully
reduced using the wire-meshes. To quantify the results, the overall sound pressure levels (Lp)
have been calculated for all the four lines, from which the noise reduction (∆Lp) was calculated.
The Lp calculation was performed between 100 Hz and 30 kHz and the noise reduction achieved
with WM1, WM2 and WM3 was 12.8, 14.2 and 14.7 dB, respectively. It can therefore be
concluded that the noise reduction level increases by decreasing the pore size of the wire-mesh.
These results suggest that, bearing in mind that the difference between WM2 and WM3 is only
0.5 dB, and the third material is significantly weaker and more fragile, the use of the second
material is rather more practical.
The effect of the recess depth on the power spectra has also been investigated. Figure 3(b)
shows the effect of microphone recess depth for the WM2 case at 40 m/s wind speed. The
results show that increasing the recess depth can improve the proper capture of the tones over
the entire frequency range, particularly at low frequencies. The calculated sound pressure level
reductions for the three different recess depths compared to the reference microphone are 11.35,
12.80 and 13.47 dB, respectively. It is evident from the results that the use of small recess depth
gives less clear tonal peaks.
102
103
104
105
−20
0
20
40
60
80
100
f [Hz]
10log(p2/p2 ref)[dB/Hz]
ReferenceParallelPerpendicular
Figure 4: Directional sensitivity of the wire-mesh: WM2 stretched parallel and perpendicular
to the flow
The interaction of the boundary layer with the pores and the wire-mesh filaments and its po-
tential impact on the hydrodynamic noise reduction has also been investigated. Figure 4 shows
the results for WM2 in two configurations: (a) when the areas defined by the pores were par-
allel with the flow and (b) when these areas were perpendicular to the flow. Results have been
obtained for microphones with medium recess depth (7 mm) at 40 m/s. For the case when the
6

6th Berlin Beamforming Conference 2016 M. Szoke and M. Azarpeyvand
pores were parallel with the flow the tones are slightly clearer than when the pores were facing
perpendicular to the flow. There are slight differences between the tones at low frequencies
(100 – 900 Hz), while all the higher frequencies show almost identical results. It has there-
fore been concluded that the parallel stretch is slightly more effective than the perpendicular
configuration.
To test the acoustic transparency of the wire-meshes, a test has been carried out using a loud-
speaker mounted on the opposite side of the rig. The acoustic transparency of the wire meshes
has been investigated for the following cases: (a) at non-zero flow conditions (40 m/s) the
speaker has been turned on and its volume has been set such that the speaker is approximately
as loud as the background noise and (b) the wind tunnel was turned off while the speaker had
the same volume as in case (a). In this test, the loudspeaker was excited at 7 kHz. From the
results in Fig. 5 , it is clearly visible that the wire-mesh is highly transparent, and the tone stands
out significantly more for the microphones recessed behind the wire-mesh. The calculated ∆Lp
for this case is 10.82 dB. In Fig. 5(b) the flow velocity is zero (the tunnel was turned off, and
therefore no hydrodynamic noise) while the 7 kHz tone was still emitted from the speaker. The
two curves are almost identical, with only some negligible losses present at low frequencies.
This case allows to approximate the attenuation of the pressure signals through the wire mesh,
which was 2.05 dB, which is in agreement with the finding of Fleury et al. [8] who reported a
typical attenuation of 2.5 dB for a similar material.
102
103
104
105
−20
0
20
40
60
80
100
f [Hz]
10log(p2/p2 ref)[dB/Hz]
ReferenceRecessed
(a) 40 m/s, medium recess depth
102
103
104
105
−20
0
20
40
60
80
100
f [Hz]
10log(p2/p2 ref)[dB/Hz]
ReferenceRecessed
(b) 0 m/s, medium recess depth
Figure 5: Transparency test on WM2, the speaker was emitting 7 kHz tonal noise
Based on the results presented in this section, it is evident that the choice wire-mesh, pore
size, direction of the filament and recess depth can have some effects on the detection of tonal
noises and the reduction of the broadband hydrodynamic noise. Also, considering the mechan-
ical properties of the wire-mesh investigated in this study, it was concluded that WM2 can
provide the best acoustic and mechanical performance.
7

6th Berlin Beamforming Conference 2016 M. Szoke and M. Azarpeyvand
3 ARRAY DESIGN
This section describes the process of the design and build of an 80 element beamforming array
for a helicopter rotor rig in a closed circuit wind tunnel. Based on the results obtained in
Section 2, it has been concluded that the layout with the WM2 wire-mesh, microphone recess
depth of 7 mm and wire-mesh stretched in the direction of the flow gives the most appropriate
results for beamforming application. In this section, we shall first introduce the design aims
and constraints, describe the array layout and finally present the assembly and preliminary test
results for some simple noise sources.
3.1 Design aims and limitations
The main purpose of the array is to measure and study helicopter rotor rig noise sources. The
array will be mounted in the De Havilland Tunnel (United Kingdom National Wind Tunnel
Facility) at the University of Glasgow. The test section of the tunnel is 9’ × 7’ (2.7 m × 2.1 m)
with an octagonal cross-section shape. The maximum achievable flow speed in the tunnel is
80 m/s. The rotor plane of the test rig is planned to be installed 1.8 m above the floor of the
tunnel. This means that the array must be mounted either on the floor or the ceiling (below
or above the rotor plane). The available space for the array on the walls of the wind tunnel is
1 m × 1 m. The array will be placed on the advancing side of the blades.
The microphones chosen for this array are the G.R.A.S. 40PL piezoelectric constant current
powered (CCP) microphones. They can deliver a large dynamic range which makes them a
suitable candidate for this array. The microphones are powered by the data acquisition hardware
(National Instruments PXIe-4499), which supports the use of CCP microphones.
3.2 Microphone layout
The array structure has been designed such that if the layout needs to be changed in the future,
it can be done easily. The layout of the array is based on the widely used logarithmic spiral
method. An example of the logarithmic arms is shown in Fig. 6(a). The microphones are
distributed along several logarithmic arms such that each microphone senses an equal aperture
area. The radial and polar coordinates of the microphones can be described by the following
equations:
rm,i = r0eθcotν, (1)
Ai = (r2c,i−1− r2
c,i)π , (2)
rm,i =rc,i−1 − rc,i
2, (3)
where rm,i is the radius of the ith microphone, r0 is the initial radius of the logarithmic arms, θ
is the angle of the ith microphone in the polar coordinate system, ν describes the “curviness”
of the logarithmic arms, Ai denotes the equal aperture areas defined between two neighbouring
blue circles in Fig. 6(a), and rc,i is the radius of the ith blue circle. The sensors are represented
by blue dots, the logarithmic arms are shown by red curves, and the inner and outer diameters
of the logarithmic spiral are denoted by r0 and rOut in Fig. 6(a).
8

6th Berlin Beamforming Conference 2016 M. Szoke and M. Azarpeyvand
æ
æ
æ
æ
æ
æ
æ
æ
æ
æ
æ
æ
æ
æ
æ
æ
æ
ææ
æ
æ
æ
æ æ
æ
æ
æ
æ
æ
æ
æ
æ
æ
æ
æ
æ
æ
æ
æ
æ
æ
æ
æ
æ
ææææ
æ
æ
æ
æ
æ
æ
æ
æ
æ
æ
æ
æ
æ
æ
æ
æ
æ
æ
æ
ææ
æ
æ
æ
æ æ
æ
æ
æ
æ
æ
ær0
rOut
rc ,1
- 400 - 200 200 400
- 400
- 200
200
400
(a) An example for equal aperture area
weighting of microphones
0°
45°
90°
135°
180°
225°
270°
315°
0.10.2
0.30.4
(b) The final array layout: 9 arms with 8 microphones on each
arm with an additional 8 microphones populated in the centre of
the array
Figure 6: Array layouts
In order to have the wire mesh stretched above the microphones, a metal frame was required
which slightly decreased the available space for the beamforming array to a circular space with
a diameter of D =950 mm.
Odd number of arms have been considered to avoid the redundancy of the layout [2]. As
shown in Fig. 6(b), the array consists of a number of microphones distributed along the arms
and a number of microphones at the centre of the array. By populating microphones in the centre
of the array, an inner radii weighting was achieved, while the formerly discussed equal aperture
weighting yields to an outer radii weighting [2]. The combination of this two is expected to
result in better dynamic range and lower number of sidelobes [2], compared to the layouts
where the microphones are distributed with an equal arc-length along one or more logarithmic
spirals.
A number of different array layouts have been considered and beamforming measurements
have been simulated with the aid of Acoular [1], which is an open source beamforming platform.
The basic delay-and-sum beamforming algorithm has been applied to calculate the beamform-
ing results. We have simulated (a) a single noise source, (b) two noise sources separated from
each other with a given distance and (c) distribution of point sources, forming a line source. In
each case, these noise sources were emitting 100 dB white noise. This parametric study formed
the basis for finding the array layout with acceptable dynamic range and minimum number of
sidelobes. We considered different number of arms (3, 5, 7, 9, 11), varied the inner radius
(r0 = 0.05. . . 0.15 m) and the “curviness” of the arms (ν = 0.4. . . 1.55) in the simulations. The
best results were achieved with the layout of 9 arms and 8 microphones distributed along each
arm, with an extra 8 microphones located at its centre. The layout of this array is presented
in Fig. 6(b). The central microphones are shown with black dots and those laid out along the
logarithmic arms are shown with red dots.
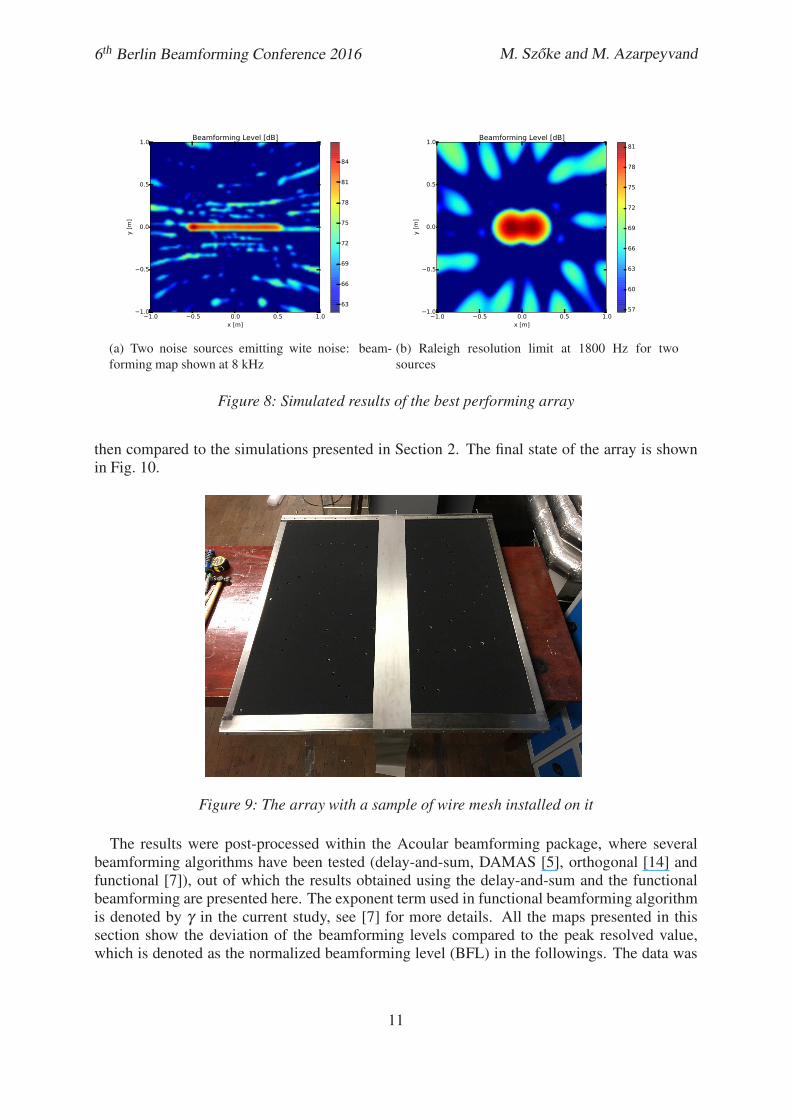
The simulated delay-and-sum beamforming results of this array are shown in Figs. 7 and 8.
9

6th Berlin Beamforming Conference 2016 M. Szoke and M. Azarpeyvand
Figure 7(a) shows the noise map at 8 kHz for a single white noise source located one meter
from the array centre, and Fig. 7(b) shows the beamforming maps at 8 kHz for two white noise
sources of the same kind located such that the array sees them 15◦ from each other. Figure 8(a)
shows the noise map evaluated at 8 kHz for a line white noise source formed using a fine
distribution of point white noise sources. Figure 8(b) shows the two sources case was evaluated
at the Raleigh resolution limit [10], which for this configuration is evaluated at 1800 Hz. From
these plots we can see that the array can reach up to 15 dB dynamic range and the observed
sidelobes have a reasonably low level of about 13-15 dB below the main noise source. Based
on these results, we expect the array to achieve a good dynamic range with low sidelobe levels
and that it can distinguish different noise sources at the Raleigh resolution limit, which might
be further improved using different beamforming methods.
−1.0 −0.5 0.0 0.5 1.0x [m]
−1.0
−0.5
0.0
0.5
1.0
y [
m]
Beamforming Level [dB]
57
60
63
66
69
72
75
78
81
(a) A single noise source emitting white noise: beam-
forming map shown at 8 kHz
−1.0 −0.5 0.0 0.5 1.0x [m]
−1.0
−0.5
0.0
0.5
1.0
y [
m]
Beamforming Level [dB]
57
60
63
66
69
72
75
78
81
(b) Two noise sources emitting white noise: beam-
forming map shown at 8 kHz
Figure 7: Simulated results of the best performing array
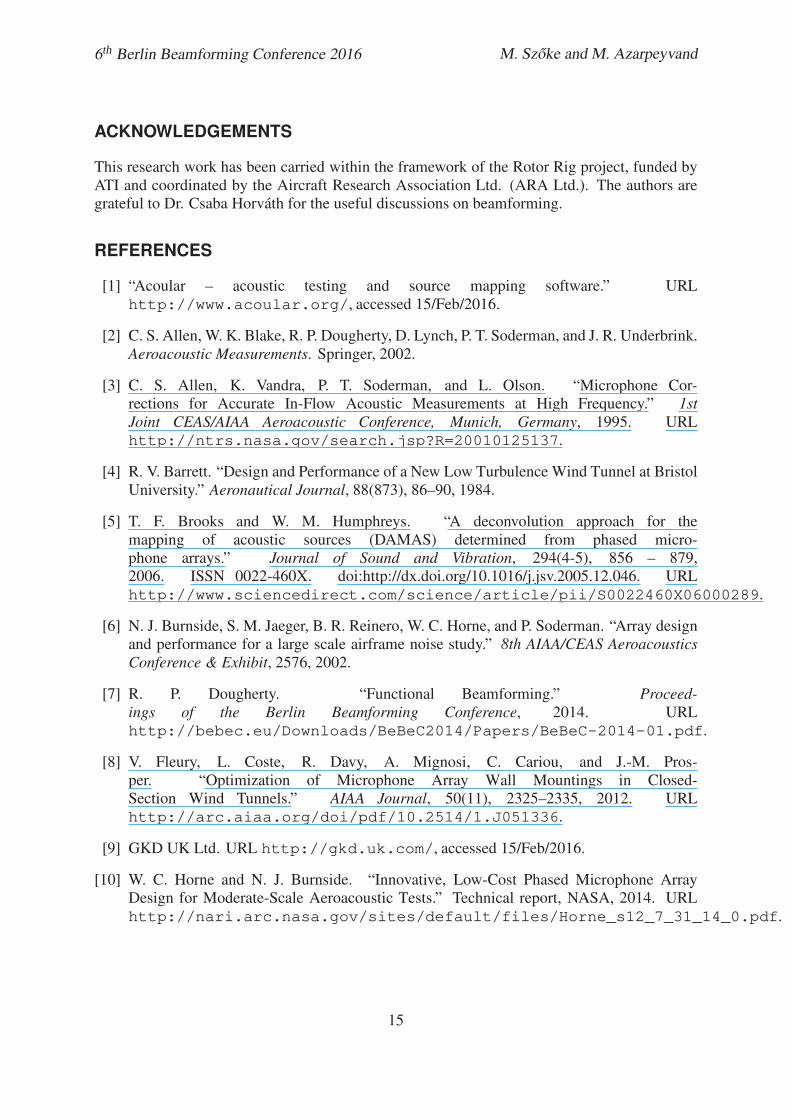
3.3 Beamforming array build
In the final stage, the beamforming array was built and its performance was tested for a variety
of noise sources. The array has a frame on which the wire mesh is mounted and it is supposed
to bring and hold the mesh in tension. The elongation of the mesh can be finely adjusted using
a mechanism. The frame incorporates a plywood sheet, on which the mounting points of the
microphones have been laser cut to ensure that the locations of the microphones are accurate.
On the top of the plywood, a layer of polypropylene acoustic foam has been installed. The use
of the porous layer is supposed to dampen any standing waves occurring between the wire mesh
and the plywood. Figure 9 shows a test, when a stripe of wire mesh was stretched on the frame
to find the longest elongation it can withstand.
The preliminary commissioning of the array was performed in a non-echoic condition. In
the testing process, the array was used for noise mapping of (a) a single speaker and (b) two
speakers, both of which were emitting white noise signals. These tests formed the basis to
investigate the performance of the array (dynamic range and the level of sidelobes), which were
10
6th Berlin Beamforming Conference 2016 M. Szoke and M. Azarpeyvand
−1.0 −0.5 0.0 0.5 1.0x [m]
−1.0
−0.5
0.0
0.5
1.0
y [
m]
Beamforming Level [dB]
63
66
69
72
75
78
81
84
(a) Two noise sources emitting wite noise: beam-
forming map shown at 8 kHz
−1.0 −0.5 0.0 0.5 1.0x [m]
−1.0
−0.5
0.0
0.5
1.0
y [
m]
Beamforming Level [dB]
57
60
63
66
69
72
75
78
81
(b) Raleigh resolution limit at 1800 Hz for two
sources
Figure 8: Simulated results of the best performing array
then compared to the simulations presented in Section 2. The final state of the array is shown
in Fig. 10.
Figure 9: The array with a sample of wire mesh installed on it
The results were post-processed within the Acoular beamforming package, where several
beamforming algorithms have been tested (delay-and-sum, DAMAS [5], orthogonal [14] and
functional [7]), out of which the results obtained using the delay-and-sum and the functional
beamforming are presented here. The exponent term used in functional beamforming algorithm
is denoted by γ in the current study, see [7] for more details. All the maps presented in this
section show the deviation of the beamforming levels compared to the peak resolved value,
which is denoted as the normalized beamforming level (BFL) in the followings. The data was
11

6th Berlin Beamforming Conference 2016 M. Szoke and M. Azarpeyvand
Figure 10: The array in its final condition
collected for 16 seconds and the sampling frequency was 65,536 Hz (= 216 Hz) in each case.
The window length of the Fourier transforms was set to 128 samples.
The speakers were located 2D (1.8 m) from the array for both the single and two speakers
test cases. The results in Fig. 11 show the comparison of the delay-and-sum and functional
beamforming methods for a single point source, evaluated at 8 kHz. It can be seen that the
dynamic range of the array for this configuration is in the range of 14-15 dB, while the sidelobes
have low amplitude and they are located farther from the noise source than those observed
previosuly in the simulations in Section 2. Figure 11(b) shows that the sidelobes can be further
eliminated and the source location can be sharpened with the use of functional beamforming,
using an exponent of γ =18 (see Ref. [7] for the definition).
As a next step, two speakers have been used to create two noise sources, such that they
were seen 15◦ apart from each other from the centre of the array. Figure 12 shows the same
comparison of the different methods as in the single speaker case. The dynamic range remained
approximately the same as before, while the noise sources spread over a smaller area in this test
case for the delay-and-sum beamforming. As observed, the functional beafmorming captures
the location of the two noise sources more accurately, i.e. the noise sources spread over a
smaller region for this case. The sidelobes have also been successfully eliminated for this case.
As the last step, the two speaker case was investigated at the Raleigh resolution limit, which
in this case was 1.8 kHz. The delay-and-sum and the functional beamforming maps were used
and the noise map results are presented in Figure 13(a) and 13(b). It can be concluded from
the results that the two sources can be hardly distinguished from each other with the use of
the conventional beamforming, while using functional beamforming with a higher exponent
(γ = 30), the noise sources become well distinguishable. The functional beamforming maps also
12

6th Berlin Beamforming Conference 2016 M. Szoke and M. Azarpeyvand
−0.6 −0.4 −0.2 0.0 0.2 0.4 0.6x [m]
−0.6
−0.4
−0.2
0.0
0.2
0.4
0.6
y [
m]
Normalized BFL [dB]
−25.0
−22.5
−20.0
−17.5
−15.0
−12.5
−10.0
−7.5
−5.0
−2.5
0.0
(a) Delay-and-sum beamforming map at 8 kHz
−0.6 −0.4 −0.2 0.0 0.2 0.4 0.6x [m]
−0.6
−0.4
−0.2
0.0
0.2
0.4
0.6
y [
m]
Normalized BFL [dB]
−25.0
−22.5
−20.0
−17.5
−15.0
−12.5
−10.0
−7.5
−5.0
−2.5
0.0
(b) Functional beamforming map at 8 kHz, γ = 18
Figure 11: Single speaker located 1.8 m from the array, different beamforming algorithms
−0.8 −0.6 −0.4 −0.2 0.0 0.2 0.4 0.6 0.8x [m]
−0.8
−0.6
−0.4
−0.2
0.0
0.2
0.4
0.6
0.8
y [
m]
Normalized BFL [dB]
−25.0
−22.5
−20.0
−17.5
−15.0
−12.5
−10.0
−7.5
−5.0
−2.5
0.0
(a) Delay-and-sum beamforming map at 8 kHz
−0.8 −0.6 −0.4 −0.2 0.0 0.2 0.4 0.6 0.8x [m]
−0.8
−0.6
−0.4
−0.2
0.0
0.2
0.4
0.6
0.8
y [
m]
Normalized BFL [dB]
−25.0
−22.5
−20.0
−17.5
−15.0
−12.5
−10.0
−7.5
−5.0
−2.5
0.0
(b) Functional beamforming map at 8 kHz, γ = 8
Figure 12: Two speakers located 1.8 m from the array, seen 15◦ apart from each other: com-
parison of different beamforming algorithms
suggests that the amplitude of the left noise source has a lower amplitude, which was caused
due to the fact that the amplifiers (two Bruel & Kjaer Type 2706) used in the measurements
were slightly different from each other and the gain was adjustable manually.
Based on the presented measurement results, it was concluded that the array can successfully
capture the noise source locations, as predicted by the preliminary simulations. Future work
will consist of the installation of the array in the De Havilland Wind Tunnel, testing the array
for fixed and rotating sources and the in-situ calibration of the array to calculate the exact
attenuation caused by the wire-mesh.
13

6th Berlin Beamforming Conference 2016 M. Szoke and M. Azarpeyvand
−0.8 −0.6 −0.4 −0.2 0.0 0.2 0.4 0.6 0.8x [m]
−0.8
−0.6
−0.4
−0.2
0.0
0.2
0.4
0.6
0.8
y [
m]
Normalized BFL [dB]
−25.0
−22.5
−20.0
−17.5
−15.0
−12.5
−10.0
−7.5
−5.0
−2.5
0.0
(a) Delay-and-sum beamforming map at 1.8 kHz
−0.8 −0.6 −0.4 −0.2 0.0 0.2 0.4 0.6 0.8x [m]
−0.8
−0.6
−0.4
−0.2
0.0
0.2
0.4
0.6
0.8
y [
m]
Normalized BFL [dB]
−25.0
−22.5
−20.0
−17.5
−15.0
−12.5
−10.0
−7.5
−5.0
−2.5
0.0
(b) Functional beamforming map at 1.8 kHz, γ = 30
Figure 13: Two speakers located 1.8 m from the array, seen 15◦ apart from each other: compar-
ison of different beamforming algorithms at the Raleigh resolution limit of 1800 Hz
4 SUMMARY
The current paper discusses the design and build of an 80 element beamforming array for he-
licopter rotor noise measurement purposes within a closed circuit wind tunnel in two steps. In
the first step, an effective hydrodynamic noise reduction method is developed, which consists of
the recessing of the microphones behind a Dutch twilled woven wire-mesh and the application
of acoustic foam in between the two. As a second step, the array design is introduced, where
the layout of the microphones in the array is carefully chosen by performing various acoustic
simulations, followed by the assembly and testing of the array.
With regard to the hydrodynamic noise reduction, three different woven wire-meshes with
different pore sizes and shapes have been investigated. It was found that the use of wire-meshes
with smaller pore sizes leads to greater reduction of the hydrodynamic noise. Three different
recess depths of the microphones were also investigated (2, 7 and 12 mm), from which the
second case was found to give the best results. Finally, the acoustic transparency of the mesh
was found to be within a range of 2-3 dB, which was in agreement with the previously published
studies.
The layout of the array was chosen using a parametric study for the location of the micro-
phones for different type of noise sources. The array layout is based on a number of widely
used logarithmic arms along which the microphones were distributed with an inner and outer
radii weighting. Increasing the population of the microphones at the inner and outer radius re-
sulted in higher dynamic range and lower number of sidelobes compared to the layouts where
the microphones are distributed with an equal arc-length along the logarithmic arms. The best
results were obtained from an array with 9 arms and 8 microphones distributed on each arm,
with an extra 8 sensors populated at the centre of the array. A dynamic range up to 15 dB has
been achieved using this array.
14
6th Berlin Beamforming Conference 2016 M. Szoke and M. Azarpeyvand
ACKNOWLEDGEMENTS
This research work has been carried within the framework of the Rotor Rig project, funded by
ATI and coordinated by the Aircraft Research Association Ltd. (ARA Ltd.). The authors are
grateful to Dr. Csaba Horvath for the useful discussions on beamforming.
REFERENCES
[1] “Acoular – acoustic testing and source mapping software.” URL
http://www.acoular.org/, accessed 15/Feb/2016.
[2] C. S. Allen, W. K. Blake, R. P. Dougherty, D. Lynch, P. T. Soderman, and J. R. Underbrink.
Aeroacoustic Measurements. Springer, 2002.
[3] C. S. Allen, K. Vandra, P. T. Soderman, and L. Olson. “Microphone Cor-
rections for Accurate In-Flow Acoustic Measurements at High Frequency.” 1st
Joint CEAS/AIAA Aeroacoustic Conference, Munich, Germany, 1995. URL
http://ntrs.nasa.gov/search.jsp?R=20010125137.
[4] R. V. Barrett. “Design and Performance of a New Low Turbulence Wind Tunnel at Bristol
University.” Aeronautical Journal, 88(873), 86–90, 1984.
[5] T. F. Brooks and W. M. Humphreys. “A deconvolution approach for the
mapping of acoustic sources (DAMAS) determined from phased micro-
phone arrays.” Journal of Sound and Vibration, 294(4-5), 856 – 879,
2006. ISSN 0022-460X. doi:http://dx.doi.org/10.1016/j.jsv.2005.12.046. URL
http://www.sciencedirect.com/science/article/pii/S0022460X06000289.
[6] N. J. Burnside, S. M. Jaeger, B. R. Reinero, W. C. Horne, and P. Soderman. “Array design
and performance for a large scale airframe noise study.” 8th AIAA/CEAS Aeroacoustics
Conference & Exhibit, 2576, 2002.
[7] R. P. Dougherty. “Functional Beamforming.” Proceed-
ings of the Berlin Beamforming Conference, 2014. URL
http://bebec.eu/Downloads/BeBeC2014/Papers/BeBeC-2014-01.pdf.
[8] V. Fleury, L. Coste, R. Davy, A. Mignosi, C. Cariou, and J.-M. Pros-
per. “Optimization of Microphone Array Wall Mountings in Closed-
Section Wind Tunnels.” AIAA Journal, 50(11), 2325–2335, 2012. URL
http://arc.aiaa.org/doi/pdf/10.2514/1.J051336.
[9] GKD UK Ltd. URL http://gkd.uk.com/, accessed 15/Feb/2016.
[10] W. C. Horne and N. J. Burnside. “Innovative, Low-Cost Phased Microphone Array
Design for Moderate-Scale Aeroacoustic Tests.” Technical report, NASA, 2014. URL
http://nari.arc.nasa.gov/sites/default/files/Horne_s12_7_31_14_0.pdf.
15

6th Berlin Beamforming Conference 2016 M. Szoke and M. Azarpeyvand
[11] C. Horvath, E. Envia, and G. G. Podboy. “Limitations of
Phased Array Beamforming in Open Rotor Noise Source Imag-
ing.” Technical report, NASA Technical Report, 2013. URL
http://ntrs.nasa.gov/archive/nasa/casi.ntrs.nasa.gov/20140002783.pdf.
[12] S. M. Jaeger, W. C. Horne, and C. S. Allen. “Effect of Surface Treatment on Array
Microphone Self-Noise.” AIAA Journal, 1937, 2000.
[13] P. A. Ravetta, R. A. Burdisso, and W. F. Ng. “Phased Array Technology
Development at Virginia Tech: Application to Landing Gear Noise Source
identification.” Mecanica Computacional, 23, 2721–2732, 2004. URL
http://www.cimec.org.ar/ojs/index.php/mc/article/viewFile/410/394.
[14] E. Sarradj. “A fast signal subspace approach for the determination of absolute levels from
phased microphone array measurements.” Journal of Sound and Vibration, 329(9), 1553–
1569, 2010.
16
View publication statsView publication stats