Embed Size (px)
Citation preview
Revised 11/17 TM491
T E C H N I C A L M A N U A L
T Cell Activation Bioassay (IL-2), Propagation Model Instructions for use of Product J1631.
Promega Corpora on · 2800 Woods Hollow Road · Madison, WI 53711-5399 USA · Toll Free in USA 800-356-9526 · 608-274-4330 · Fax 608-277-2516 1www.promega.com TM491 · Revised 11/17
1. Description .........................................................................................................................................1
2. Product Components and Storage Conditions ........................................................................................9
3. Before You Begin ............................................................................................................................... 103.A. Materials to Be Supplied by the User .......................................................................................... 103.B. Preparing TCR/CD3 Eff ector Cells (IL-2) ................................................................................... 11
4. Assay Protocol .................................................................................................................................. 134.A. Preparing Bio-Glo™ Reagent, Assay Buffer and Test and Reference Samples ................................. 154.B. Plate Layout Design .................................................................................................................. 164.C. Preparing and Plating Target Cells ............................................................................................. 164.D. Preparing and Adding Antibody Serial Dilutions ......................................................................... 184.E. Preparing and Plating TCR/CD3 Eff ector Cells (IL-2) .................................................................. 194.F. Adding Bio-Glo™ Reagent ......................................................................................................... 204.G. Data Analysis ........................................................................................................................... 20
5. Troubleshooting................................................................................................................................ 21
6. References ........................................................................................................................................ 22
7. Appendix .......................................................................................................................................... 227.A. Representative Assay Results ..................................................................................................... 227.B. Composition of Buff ers and Solutions ......................................................................................... 237.C. Related Products ...................................................................................................................... 247.D. Summary of Changes................................................................................................................. 25
All technical literature is available at: www.promega.com/protocols/ Visit the web site to verify that you are using the most current version of this Technical Manual.
E-mail Promega Technical Services if you have questions on use of this system: [email protected]
T Cell Activation Bioassay (IL-2), Propagation Model
1. Description
T cells play a central role in cell-mediated immunity and can mediate long-term, antigen-specifi c, eff ector and memory responses. In recent years, a variety of immunotherapy strategies aimed at inducing, strengthening and/or engineering T cell responses have emerged as promising approaches for the treatment of diseases such as cancer and autoimmunity (1).
T cell activation is initiated by engagement of the T cell antigen receptor (TCR)/CD3 complex and the co-stimulatory receptor CD28. Co-engagement of these receptors on the cell surface leads to intracellular signaling events and the activation of nuclear transcription factors such as Nuclear Factor of Activated T cells (NFAT), NF-B and AP-1. Specifi cally, engagement of the TCR/CD3 complex leads to the phosphorylation and activation of PLC-, intracellular calcium fl ux and transcriptional activation of NFAT pathway. By contrast, co-engagement of TCR/CD3 with the
2 Promega Corpora on · 2800 Woods Hollow Road · Madison, WI 53711-5399 USA · Toll Free in USA 800-356-9526 · 608-274-4330 · Fax 608-277-2516TM491 · Revised 11/17 www.promega.com
co-stimulatory receptor CD28 leads to activation of ERK/JNK and IB kinase (IKK), which in turn regulate transcriptional activation of AP-1 and NF-B pathways, respectively (2). The IL-2 promoter contains DNA binding sites for NFAT, NF-B and AP-1. Therefore, co-engagement of TCR/CD3 and CD28 results in IL-2 production, which is commonly used as a functional readout for T cell activation. Other endpoints used to measure T cell activation include cell proliferation and production of additional cytokines such as IFN.
Current methods used to measure TCR-mediated T cell proliferation and cytokine production rely on primary peripheral blood mononuclear cells (PBMCs) as a source of T cells, which must be stimulated via co-culture with antigen presenting cells (APCs) or anti-TCR/CD3 antibodies. These assays are laborious and highly variable due to their reliance on donor primary cells, complex assay protocols and nonqualified assay reagents. As a result, these assays are difficult to establish in quality-controlled drug development settings.
The T Cell Activation Bioassay (IL-2), Propagation Model(a,b) (Cat.# J1631), is a bioluminescent cell-based assay that overcomes the limitations of existing assays and can be used for the discovery and development of novel biologic and cell therapies aimed at inducing, strengthening and/or engineering T cell responses. The assay consists of a genetically engineered Jurkat T cell line that expresses a luciferase reporter driven by an IL-2 promoter. The TCR/CD3 Eff ector Cells (IL-2) are provided in Cell Propagation Model (CPM) format, which includes cryopreserved cells that can be thawed, propagated and banked for long-term use (3).
Note: A second version of the T Cell Activation Bioassay that expresses a luciferase reporter driven by an NFAT response element (NFAT-RE) is also available (see Related Products, Section 7.C). A schematic representation of the T Cell Activation Bioassays (NFAT or IL-2) is included in Figure 1 and data generated using TCR/CD3 Eff ector Cells (NFAT or IL-2) is included in Figure 2.
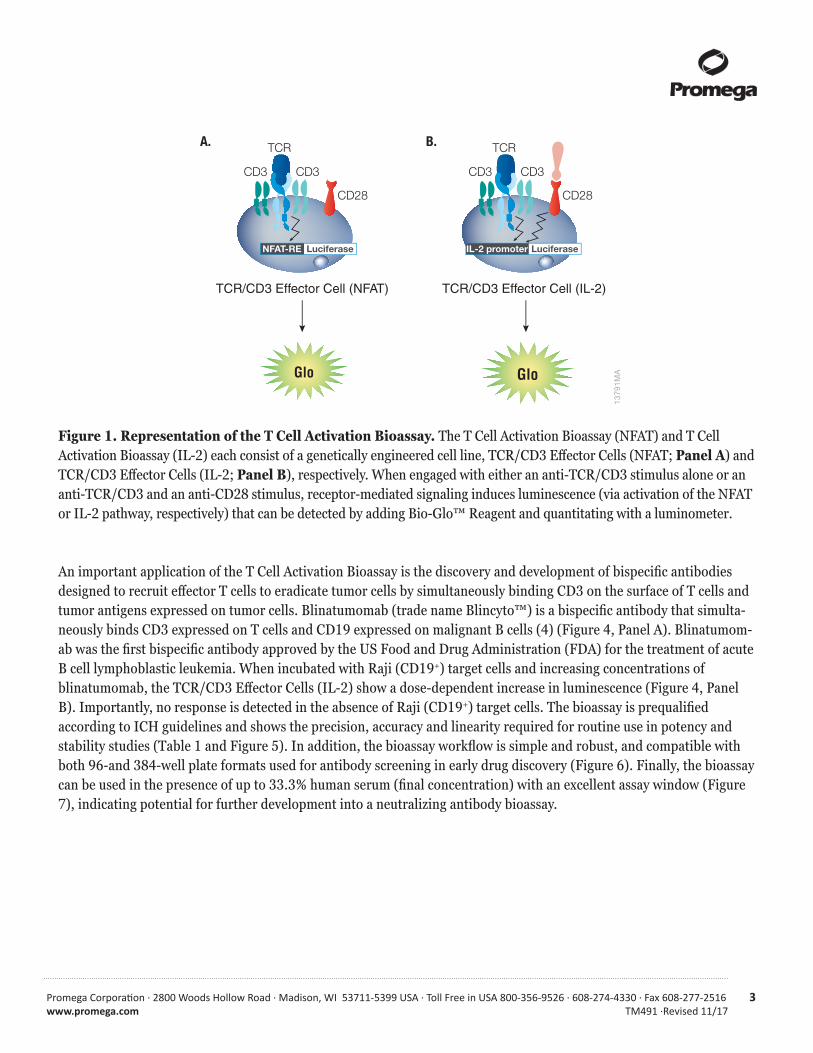
The TCR/CD3 Eff ector Cells express endogenous TCR, CD3 and CD28 receptors. When the TCR/CD3 Eff ector Cells (NFAT) are engaged with an appropriate TCR/CD3 ligand or anti-TCR/CD3 antibody, the TCR transduces intracellular signals resulting in NFAT-RE-mediated luminescence (Figure 1, Panel A). Similarly, when the TCR/CD3 Eff ector Cells (IL-2) are co-engaged with an anti-TCR/CD3 and an anti-CD28 stimulus, receptor-mediated signaling results in IL-2 promoter-mediated luminescence (Figure 1, Panel B). The bioluminescent signal is detected and quantified using Bio-Glo™ Luciferase Assay System (Cat.# G7940, G7941) and a standard luminometer, such as the GloMax® Discover System (see Related Products, Section 7.C).
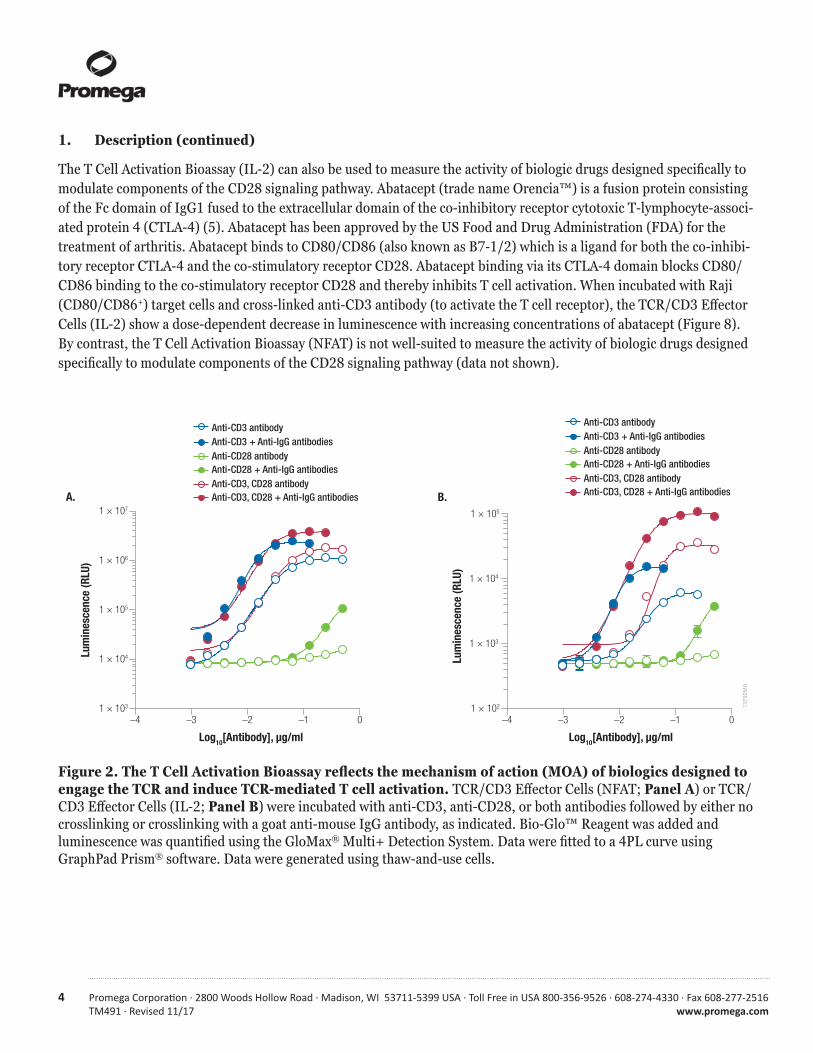
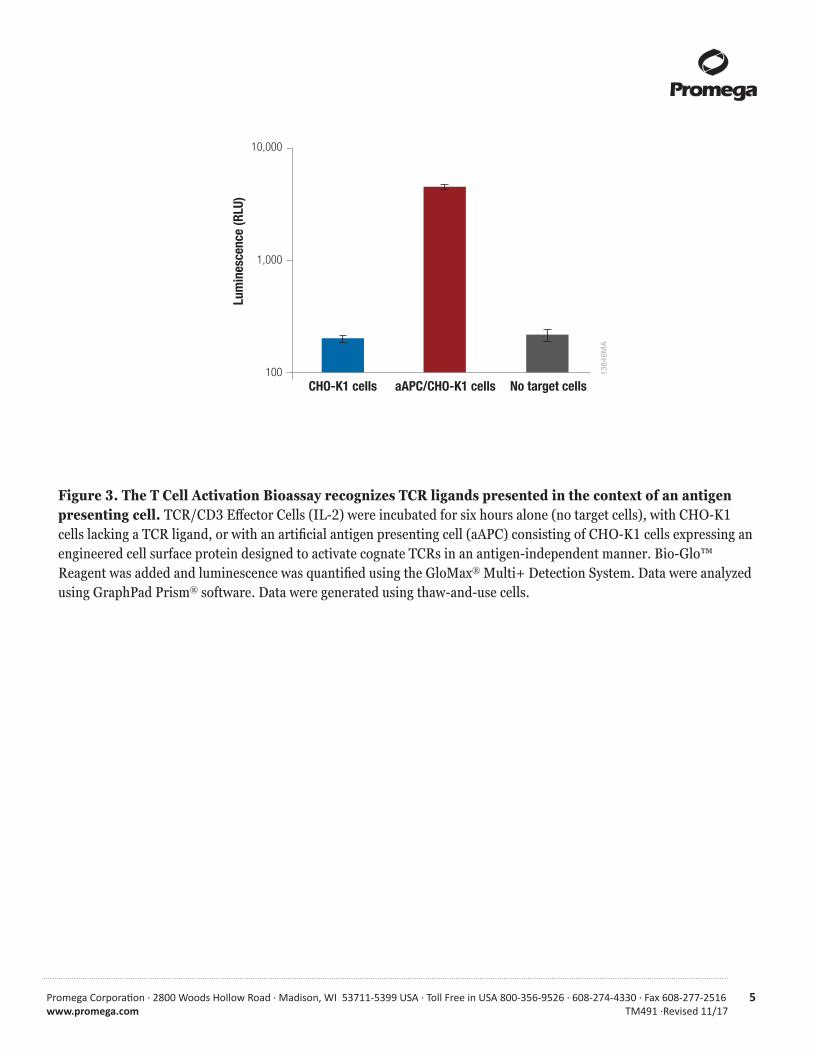
The T Cell Activation Bioassay reflects the mechanism of action (MOA) of biologics designed to engage the TCR and induce TCR-mediated T cell activation. Specifically, anti-CD3 antibody-mediated luminescence is detected using either the TCR/CD3 Eff ector Cells (NFAT) or the TCR/CD3 Eff ector Cells (IL-2), and the signal is enhanced following the addition of an anti-IgG crosslinking antibody (Figure 2). As expected, addition of an anti-CD28 co-stimulatory signal results in a further increase in luminescence using the TCR/CD3 Eff ector Cells (IL-2), but not the TCR/CD3 Eff ector Cells (NFAT). Importantly, TCR-mediated luminescence can also be detected in response to a TCR ligand presented in the context of an antigen presenting cell (Figure 3).
Promega Corpora on · 2800 Woods Hollow Road · Madison, WI 53711-5399 USA · Toll Free in USA 800-356-9526 · 608-274-4330 · Fax 608-277-2516 3www.promega.com TM491 ·Revised 11/17
1379
1MAGlo
TCR/CD3 Effector Cell (NFAT)
TCR
CD3CD3
CD28
Glo
TCR/CD3 Effector Cell (IL-2)
NFAT-RE Luciferase
TCR
CD3CD3
CD28
IL-2 promoter Luciferase
A. B.
Figure 1. Representation of the T Cell Activation Bioassay. The T Cell Activation Bioassay (NFAT) and T Cell Activation Bioassay (IL-2) each consist of a genetically engineered cell line, TCR/CD3 Eff ector Cells (NFAT; Panel A) and TCR/CD3 Eff ector Cells (IL-2; Panel B), respectively. When engaged with either an anti-TCR/CD3 stimulus alone or an anti-TCR/CD3 and an anti-CD28 stimulus, receptor-mediated signaling induces luminescence (via activation of the NFAT or IL-2 pathway, respectively) that can be detected by adding Bio-Glo™ Reagent and quantitating with a luminometer.
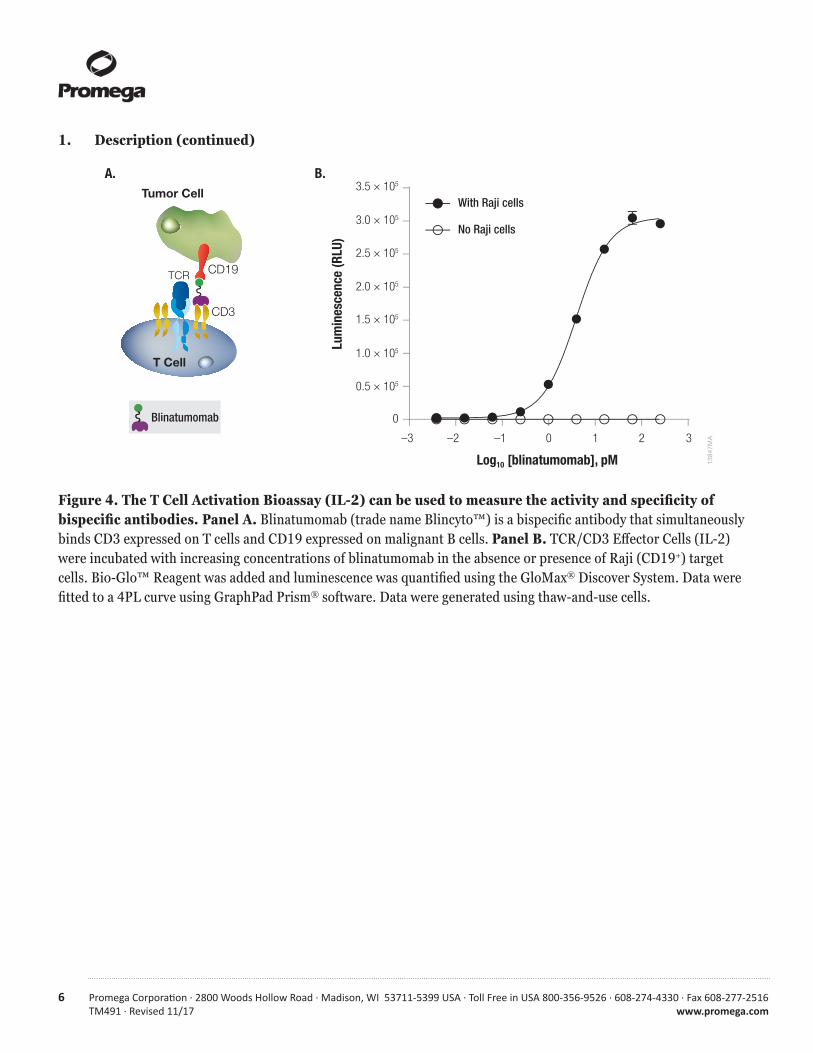
An important application of the T Cell Activation Bioassay is the discovery and development of bispecifi c antibodies designed to recruit eff ector T cells to eradicate tumor cells by simultaneously binding CD3 on the surface of T cells and tumor antigens expressed on tumor cells. Blinatumomab (trade name Blincyto™) is a bispecifi c antibody that simulta-neously binds CD3 expressed on T cells and CD19 expressed on malignant B cells (4) (Figure 4, Panel A). Blinatumom-ab was the fi rst bispecifi c antibody approved by the US Food and Drug Administration (FDA) for the treatment of acute B cell lymphoblastic leukemia. When incubated with Raji (CD19+) target cells and increasing concentrations of blinatumomab, the TCR/CD3 Eff ector Cells (IL-2) show a dose-dependent increase in luminescence (Figure 4, Panel B). Importantly, no response is detected in the absence of Raji (CD19+) target cells. The bioassay is prequalifi ed according to ICH guidelines and shows the precision, accuracy and linearity required for routine use in potency and stability studies (Table 1 and Figure 5). In addition, the bioassay workfl ow is simple and robust, and compatible with both 96-and 384-well plate formats used for antibody screening in early drug discovery (Figure 6). Finally, the bioassay can be used in the presence of up to 33.3% human serum (fi nal concentration) with an excellent assay window (Figure 7), indicating potential for further development into a neutralizing antibody bioassay.
4 Promega Corpora on · 2800 Woods Hollow Road · Madison, WI 53711-5399 USA · Toll Free in USA 800-356-9526 · 608-274-4330 · Fax 608-277-2516TM491 · Revised 11/17 www.promega.com
1. Description (continued)
The T Cell Activation Bioassay (IL-2) can also be used to measure the activity of biologic drugs designed specifi cally to modulate components of the CD28 signaling pathway. Abatacept (trade name Orencia™) is a fusion protein consisting of the Fc domain of IgG1 fused to the extracellular domain of the co-inhibitory receptor cytotoxic T-lymphocyte-associ-ated protein 4 (CTLA-4) (5). Abatacept has been approved by the US Food and Drug Administration (FDA) for the treatment of arthritis. Abatacept binds to CD80/CD86 (also known as B7-1/2) which is a ligand for both the co-inhibi-tory receptor CTLA-4 and the co-stimulatory receptor CD28. Abatacept binding via its CTLA-4 domain blocks CD80/CD86 binding to the co-stimulatory receptor CD28 and thereby inhibits T cell activation. When incubated with Raji (CD80/CD86+) target cells and cross-linked anti-CD3 antibody (to activate the T cell receptor), the TCR/CD3 Eff ector Cells (IL-2) show a dose-dependent decrease in luminescence with increasing concentrations of abatacept (Figure 8). By contrast, the T Cell Activation Bioassay (NFAT) is not well-suited to measure the activity of biologic drugs designed specifi cally to modulate components of the CD28 signaling pathway (data not shown).
Fig
1379
2MA
–4 –3 –2 –1 0
Log10[Antibody], µg/ml
–4 –3 –2 –1 0
Log10[Antibody], µg/ml
Lum
ines
cenc
e (R
LU)
Lum
ines
cenc
e (R
LU)
Anti-CD3 antibody
Anti-CD3, CD28 antibodyAnti-CD3, CD28 + Anti-IgG antibodies
Anti-CD28 antibodyAnti-CD28 + Anti-IgG antibodies
Anti-CD3 + Anti-IgG antibodies
Anti-CD3 antibody
Anti-CD3, CD28 antibodyAnti-CD3, CD28 + Anti-IgG antibodies
Anti-CD28 antibodyAnti-CD28 + Anti-IgG antibodies
Anti-CD3 + Anti-IgG antibodies
1 × 10⁷
1 × 10⁶
1 × 10⁵
1 × 10⁴
1 × 10³
1 × 10⁵
1 × 10⁴
1 × 10³
1 × 10²
A. B.
ure 2. The T Cell Activation Bioassay reflects the mechanism of action (MOA) of biologics designed to engage the TCR and induce TCR-mediated T cell activation. TCR/CD3 Eff ector Cells (NFAT; Panel A) or TCR/CD3 Eff ector Cells (IL-2; Panel B) were incubated with anti-CD3, anti-CD28, or both antibodies followed by either no crosslinking or crosslinking with a goat anti-mouse IgG antibody, as indicated. Bio-Glo™ Reagent was added and luminescence was quantified using the GloMax® Multi+ Detection System. Data were fi tted to a 4PL curve using GraphPad Prism® software. Data were generated using thaw-and-use cells.
Promega Corpora on · 2800 Woods Hollow Road · Madison, WI 53711-5399 USA · Toll Free in USA 800-356-9526 · 608-274-4330 · Fax 608-277-2516 5www.promega.com TM491 ·Revised 11/17
1384
6MA
100
1,000
10,000
Lum
ines
cenc
e (R
LU)
CHO-K1 cells aAPC/CHO-K1 cells No target cells
Figure 3. The T Cell Activation Bioassay recognizes TCR ligands presented in the context of an antigen presenting cell. TCR/CD3 Eff ector Cells (IL-2) were incubated for six hours alone (no target cells), with CHO-K1 cells lacking a TCR ligand, or with an artifi cial antigen presenting cell (aAPC) consisting of CHO-K1 cells expressing an engineered cell surface protein designed to activate cognate TCRs in an antigen-independent manner. Bio-Glo™ Reagent was added and luminescence was quantified using the GloMax® Multi+ Detection System. Data were analyzed using GraphPad Prism® software. Data were generated using thaw-and-use cells.
6 Promega Corpora on · 2800 Woods Hollow Road · Madison, WI 53711-5399 USA · Toll Free in USA 800-356-9526 · 608-274-4330 · Fax 608-277-2516TM491 · Revised 11/17 www.promega.com
1. Description (continued)
1384
7MA
Tumor Cell
T Cell
CD19
CD3
BlinatumomabBlinatumomab
A. B.
TCR
Log10 [blinatumomab], pM
With Raji cells
No Raji cells
0.5 × 10⁵
0
1.0 × 10⁵
1.5 × 10⁵
2.0 × 10⁵
2.5 × 10⁵
3.0 × 10⁵
3.5 × 10⁵
–2–3 –1 0 1 2 3
Lum
ines
cenc
e (R
LU)
Figure 4. The T Cell Activation Bioassay (IL-2) can be used to measure the activity and specifi city of bispecifi c antibodies. Panel A. Blinatumomab (trade name Blincyto™) is a bispecifi c antibody that simultaneously binds CD3 expressed on T cells and CD19 expressed on malignant B cells. Panel B. TCR/CD3 Eff ector Cells (IL-2) were incubated with increasing concentrations of blinatumomab in the absence or presence of Raji (CD19+) target cells. Bio-Glo™ Reagent was added and luminescence was quantified using the GloMax® Discover System. Data were fi tted to a 4PL curve using GraphPad Prism® software. Data were generated using thaw-and-use cells.
Promega Corpora on · 2800 Woods Hollow Road · Madison, WI 53711-5399 USA · Toll Free in USA 800-356-9526 · 608-274-4330 · Fax 608-277-2516 7www.promega.com TM491 ·Revised 11/17
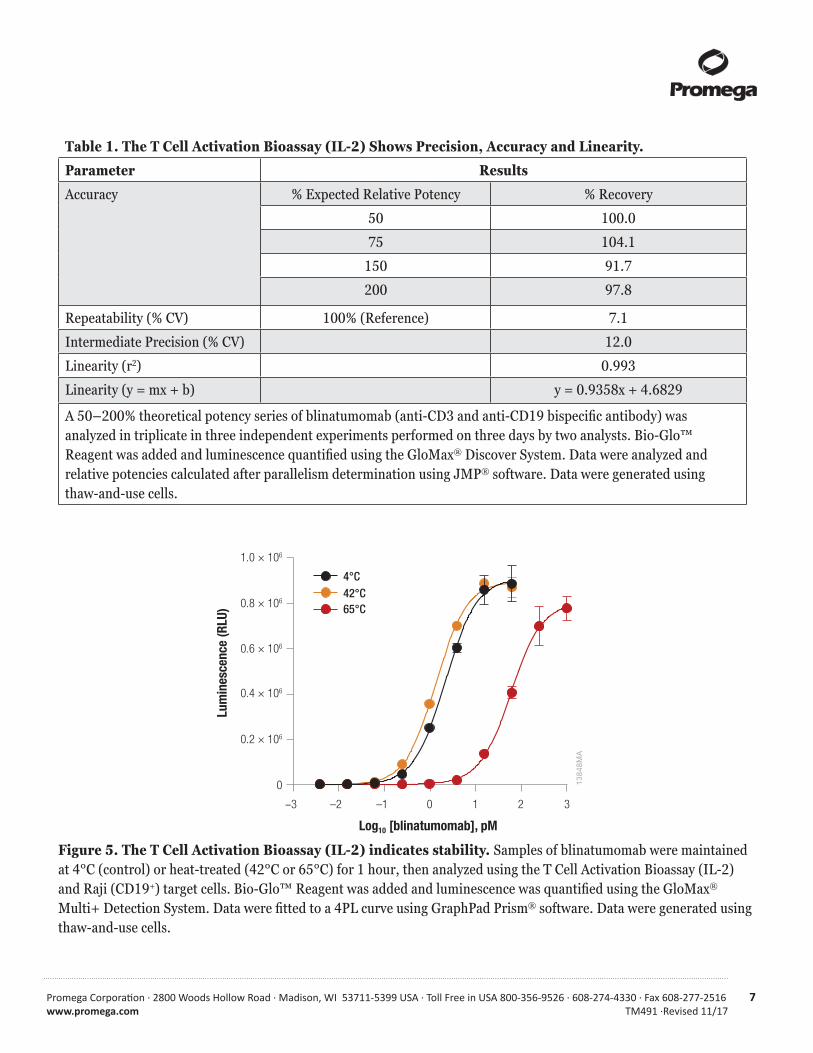
Table 1. The T Cell Activation Bioassay (IL-2) Shows Precision, Accuracy and Linearity.
Parameter Results
Accuracy
% Expected Relative Potency % Recovery
50 100.0
75 104.1
150 91.7
200 97.8
Repeatability (% CV) 100% (Reference) 7.1
Intermediate Precision (% CV) 12.0
Linearity (r2) 0.993
Linearity (y = mx + b) y = 0.9358x + 4.6829
A 50–200% theoretical potency series of blinatumomab (anti-CD3 and anti-CD19 bispecifi c antibody) was analyzed in triplicate in three independent experiments performed on three days by two analysts. Bio-Glo™ Reagent was added and luminescence quantifi ed using the GloMax® Discover System. Data were analyzed and relative potencies calculated after parallelism determination using JMP® software. Data were generated using thaw-and-use cells.
Fi
1384
8MA
Log10 [blinatumomab], pM
0.2 × 10⁶
0
0.4 × 10⁶
0.6 × 10⁶
0.8 × 10⁶
1.0 × 10⁶
–2–3 –1 0 1 2 3
Lum
ines
cenc
e (R
LU)
4°C42°C65°C
gure 5. The T Cell Activation Bioassay (IL-2) indicates stability. Samples of blinatumomab were maintained at 4°C (control) or heat-treated (42°C or 65°C) for 1 hour, then analyzed using the T Cell Activation Bioassay (IL-2) and Raji (CD19+) target cells. Bio-Glo™ Reagent was added and luminescence was quantified using the GloMax® Multi+ Detection System. Data were fi tted to a 4PL curve using GraphPad Prism® software. Data were generated using thaw-and-use cells.
8 Promega Corpora on · 2800 Woods Hollow Road · Madison, WI 53711-5399 USA · Toll Free in USA 800-356-9526 · 608-274-4330 · Fax 608-277-2516TM491 · Revised 11/17 www.promega.com
1. Description (continued)
1384
9MA
Log10 [blinatumomab], pM
0.5 × 10⁵
0
1.0 × 10⁵
1.5 × 10⁵
–2–3 –1 0 1 2
Lum
ines
cenc
e (R
LU)
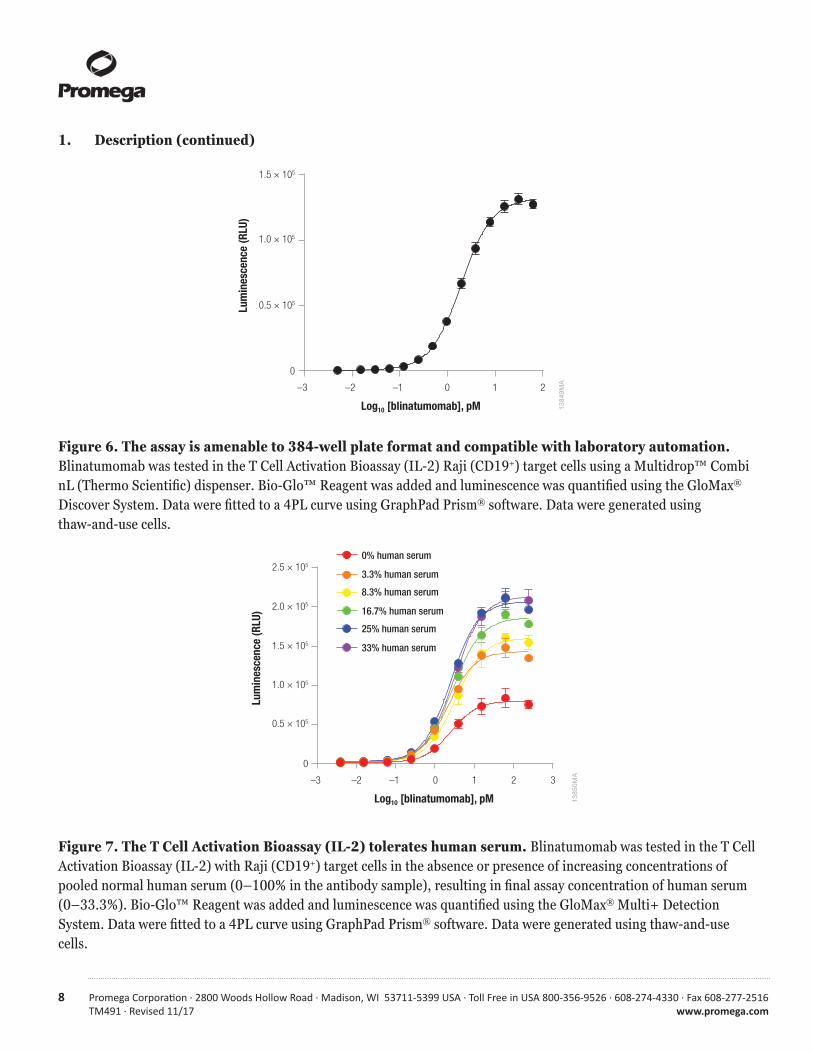
Figure 6. The assay is amenable to 384-well plate format and compatible with laboratory automation. Blinatumomab was tested in the T Cell Activation Bioassay (IL-2) Raji (CD19+) target cells using a Multidrop™ Combi nL (Thermo Scientific) dispenser. Bio-Glo™ Reagent was added and luminescence was quantified using the GloMax® Discover System. Data were fi tted to a 4PL curve using GraphPad Prism® software. Data were generated using thaw-and-use cells.
F
1385
0MA
Log10 [blinatumomab], pM
0
2.5 × 10⁵
2.0 × 10⁵
1.5 × 10⁵
1.0 × 10⁵
0.5 × 10⁵
–2–3 –1 0 1 32
Lum
ines
cenc
e (R
LU)
0% human serum
3.3% human serum
8.3% human serum
16.7% human serum
25% human serum
33% human serum
igure 7. The T Cell Activation Bioassay (IL-2) tolerates human serum. Blinatumomab was tested in the T Cell Activation Bioassay (IL-2) with Raji (CD19+) target cells in the absence or presence of increasing concentrations of pooled normal human serum (0–100% in the antibody sample), resulting in fi nal assay concentration of human serum (0–33.3%). Bio-Glo™ Reagent was added and luminescence was quantified using the GloMax® Multi+ Detection System. Data were fi tted to a 4PL curve using GraphPad Prism® software. Data were generated using thaw-and-use cells.
Promega Corpora on · 2800 Woods Hollow Road · Madison, WI 53711-5399 USA · Toll Free in USA 800-356-9526 · 608-274-4330 · Fax 608-277-2516 9www.promega.com TM491 ·Revised 11/17
F
1385
1MA
Log10 [abatacept], µM
Lum
ines
cenc
e (R
LU)
–5 –4 –3 –2 –1 0 10
20,000
40,000
60,000
80,000
100,000
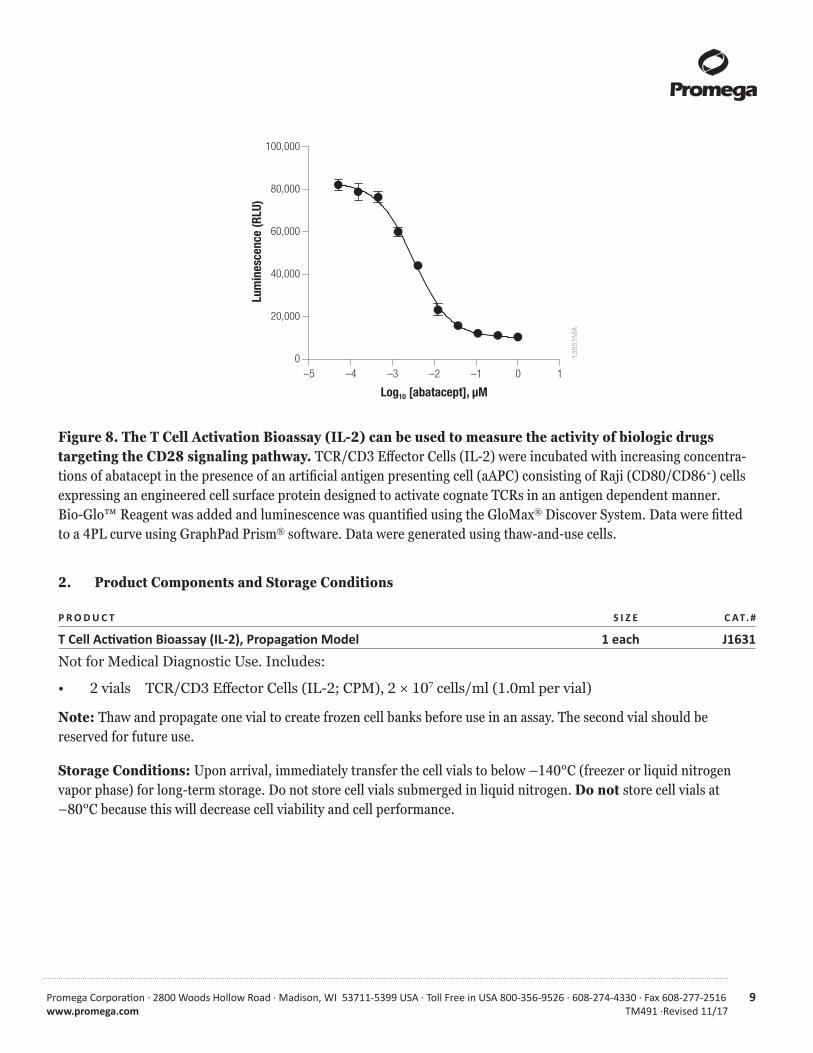
igure 8. The T Cell Activation Bioassay (IL-2) can be used to measure the activity of biologic drugs targeting the CD28 signaling pathway. TCR/CD3 Eff ector Cells (IL-2) were incubated with increasing concentra-tions of abatacept in the presence of an artifi cial antigen presenting cell (aAPC) consisting of Raji (CD80/CD86+) cells expressing an engineered cell surface protein designed to activate cognate TCRs in an antigen dependent manner. Bio-Glo™ Reagent was added and luminescence was quantified using the GloMax® Discover System. Data were fi tted to a 4PL curve using GraphPad Prism® software. Data were generated using thaw-and-use cells.
2. Product Components and Storage Conditions
P R O D U C T S I Z E C AT. #
T Cell Ac va on Bioassay (IL-2), Propaga on Model 1 each J1631
Not for Medical Diagnostic Use. Includes:
• 2 vials TCR/CD3 Eff ector Cells (IL-2; CPM), 2 × 10⁷ cells/ml (1.0ml per vial)
Note: Thaw and propagate one vial to create frozen cell banks before use in an assay. The second vial should be reserved for future use.
Storage Conditions: Upon arrival, immediately transfer the cell vials to below –140°C (freezer or liquid nitrogen vapor phase) for long-term storage. Do not store cell vials submerged in liquid nitrogen. Do not store cell vials at –80°C because this will decrease cell viability and cell performance.
10 Promega Corpora on · 2800 Woods Hollow Road · Madison, WI 53711-5399 USA · Toll Free in USA 800-356-9526 · 608-274-4330 · Fax 608-277-2516TM491 · Revised 11/17 www.promega.com
3. Before You Begin
Please read through the entire protocol to become familiar with the components and the assay procedure before beginning.
Cell thawing, propagation, and banking should be performed exactly as described in Section 3.A. Cell seeding and propagation densities have been optimized to ensure stable cell growth, which is reflected in a steady cell doubling rate, to achieve optimal, consistent performance. The recommended cell plating density, induction time and assay buffer components described in Section 4 were established using a research-grade anti-CD3 antibody and blinatumomab (anti-CD3 and anti-CD19 bispecifi c antibody). You may need to adjust the parameters provided here and optimize assay conditions for your own antibodies or other biologic samples.
The T Cell Activation Bioassay (IL-2) produces a bioluminescent signal and requires a sensitive luminometer or luminescence plate reader for the detection of luminescence. Bioassay development and performance data included in this Technical Manual were generated using the GloMax® Discover System and GloMax® Multi+ Detection System (see Related Products, Section 7.C). An integration time of 0.5 second/well was used for all readings. The bioassay is compatible with most other plate-reading luminometers; however, relative luminescence unit readings may vary due to the sensitivity and settings of each instrument. The use of different instruments should not affect the measured relative potency of test samples.
3.A. Materials to Be Supplied by the User(Composition of buffers and solutions is provided in Section 7.B.)
Reagents • user-defi ned anti-CD3/TCR antibodies or other biologics samples• user-defi ned target cells• RPMI 1640 Medium with L-glutamine and HEPES (e.g., Corning Cat.# 10-041-CV or Gibco Cat.# 22400) • fetal bovine serum (e.g., HyClone Cat.# SH300070.03 or Corning Cat.# 35-015-CV) • hygromycin B (e.g., Gibco Cat.# 10687-010) • sodium pyruvate (e.g., Gibco Cat.# 11360) • MEM nonessential amino acids (e.g., Gibco Cat.# 11140) • DMSO (e.g., Sigma Cat.# D2650) • Trypan blue solution (e.g., Sigma Cat.# T8154) • Bio-Glo™ Luciferase Assay System (Cat.# G7940, G7941)
Promega Corpora on · 2800 Woods Hollow Road · Madison, WI 53711-5399 USA · Toll Free in USA 800-356-9526 · 608-274-4330 · Fax 608-277-2516 11www.promega.com TM491 ·Revised 11/17
Supplies and Equipment • white, flat-bottom 96-well assay plates (e.g., Corning Cat.# 3917) • sterile clear 96-well plate with lid (e.g., Linbro Cat.# 76-223-05) for preparing antibody dilutions • pipettes (single-channel and 12-channel) • sterile 15ml and 50ml conical tubes • sterile reagent reservoirs (e.g., Corning Cat.# 4870) • 37°C, 5% CO2 incubator • 37°C water bath • plate reader with glow luminescence measuring capability or luminometer (e.g., GloMax® Discover System)
3.B. Preparing TCR/CD3 Eff ector Cells (IL-2)
Cell Thawing and Initial Cell Culture
1. Prepare 40ml of initial cell culture medium by adding 4ml of FBS to 36ml of RPMI 1640 medium prewarmed to 37°C. This initial cell culture medium will be used for culturing the cells immediately after thawing.
2. Transfer 9ml of prewarmed initial cell culture medium to a 50ml conical tube.
3. Remove one vial of TCR/CD3 Eff ector Cells (IL-2) from storage at –140°C and thaw in a 37°C water bath with gentle agitation (no inversion) until just thawed (typically 2–3 minutes).
4. Transfer all of the cells (approximately 1ml) to the 50ml conical tube containing 9ml of prewarmed initial cell culture medium.
5. Centrifuge at 90 × g for 10 minutes.
6. Carefully aspirate the medium, and resuspend the cell pellet in 25ml of prewarmed initial cell culture medium.
7. Transfer the cell suspension to a T75 tissue culture fl ask and place the fl ask horizontally in a 37°C, 5% CO2 humidifi ed incubator.
8. Incubate for approximately 48 hours before passaging the cells.
12 Promega Corpora on · 2800 Woods Hollow Road · Madison, WI 53711-5399 USA · Toll Free in USA 800-356-9526 · 608-274-4330 · Fax 608-277-2516TM491 · Revised 11/17 www.promega.com
3.B. Preparing TCR/CD3 Eff ector Cells (IL-2) (continued)
Cell Maintenance and Propagation
Note: For cell maintenance and propagation starting from the second cell passage, use the cell growth medium containing antibiotics, and monitor cell viability and doubling rate during propagation. The cell growth rate will stabilize by 7–10 days post-thaw, at which time cell viability is typically >95% and the average cell doubling rate is 28–30 hours. Passage number should be recorded for each passage. In our experience, cells maintain their functionality for up to 25 passages, or 46 cell doublings if passaging is performed on a Monday-Wednesday-Friday schedule.
9. On the day of cell passage, measure cell viability and density by Trypan blue staining.
10. Seed the cells at a density of 4.5 × 10⁵ cells/ml if passaging every two days (e.g., Monday-Wednesday, or Wednesday-Friday) or 2.5 × 10⁵ cells/ml if passaging every three days (e.g., Friday-Monday). Always maintain the fl asks in a horizontal position in the incubator.
11. Maintain the cell culture by adding fresh cell growth medium to the cell suspension in the original fl ask or by transferring the cells to a new fl ask while maintaining a consistent ratio of culture volume to fl ask surface area (e.g., 25ml volume per T75 fl ask or 50ml volume per T150 fl ask).
12. Place the fl asks horizontally in a 37°C, 5% CO2 incubator.
Cell Freezing and Banking
13. On the day of cell freezing, make new cell freezing medium and keep on ice.
14. Gently mix the cells with a pipette to create a homogenous cell suspension.
15. Remove a sample for cell counting by Trypan blue staining. Calculate the volume of cell freezing medium needed based on desired cell freezing densities of 5 × 10⁶–2 × 10⁷ cells/ml.
16. Transfer the cell suspension to 50ml sterile conical tubes or larger sized centrifuge tubes and centrifuge at 130–180 × g, 4°C, for 10–15 minutes.
17. Gently aspirate the medium taking care not to disturb the cell pellet.
18. Carefully resuspend the cell pellet in ice-cold cell freezing medium to a fi nal cell density of 5 × 10⁶–2 × 10⁷ cells/ml. Combine the cell suspensions in a single tube and dispense into cryovials.
19. Freeze the cells using a controlled-rate freezer (preferred), or a Mr. Frosty® or a Styrofoam® rack in a –80°C freezer overnight. Transfer the vials to at or below –140°C for long-term storage.
Promega Corpora on · 2800 Woods Hollow Road · Madison, WI 53711-5399 USA · Toll Free in USA 800-356-9526 · 608-274-4330 · Fax 608-277-2516 13www.promega.com TM491 ·Revised 11/17
4. Assay Protocol
This assay protocol illustrates the use of the T Cell Activation Bioassay (IL-2), Propagation Model, to test blinatumomab (anti-CD3 and anti-CD19 bispecifi c antibody) in the presence of Raji (CD19+) target cells, with two test antibody samples against a reference sample in a single assay run. Each test and reference antibody is run in triplicate, in a ten-point dilution series, in a single 96-well assay plate using the inner 60 wells. Other experimental and plate layouts are possible but may require further optimization.
Notes:
1. When preparing test and reference antibodies, choose an appropriate starting concentration and dilution scheme to achieve a full dose-response curve with proper upper and lower asymptotes and sufficient points on the slope. For reference, we use 1nM as a starting concentration (1X) and fourfold serial dilutions when testing blinatumomab to achieve full dose curves.
2. For testing blinatumomab, we use Raji (CD19+) target cells. For other bispecifi c or multivalent biologics, choose an antigen-expressing target cell relevant to your system. You may need to optimize the E:T (eff ector cell:target cell) ratio, cell densities, antibody dilution scheme, assay duration and any other assay conditions relevant to your system.
3. To minimize assay setup time, prepare antibody serial dilutions prior to harvesting cells, and harvest and count TCR/CD3 Eff ector Cells (IL-2) and Raji (CD19+) target cells at the same time.
14 Promega Corpora on · 2800 Woods Hollow Road · Madison, WI 53711-5399 USA · Toll Free in USA 800-356-9526 · 608-274-4330 · Fax 608-277-2516TM491 · Revised 11/17 www.promega.com
4. Assay Protocol (continued)
1379
8MB
Add antigen-expressingtumor cells to a 96-well plate.
Add anti-CD3 bispecific antibody and TCR/CD3 Effector Cells (IL-2).
Incubate at 37°C6 hours.
Add Bio-Glo™Reagent.
Incubate at roomtemperature 5–10 minutes.
Read on plate-reading luminometer.
GloMax® Discover System
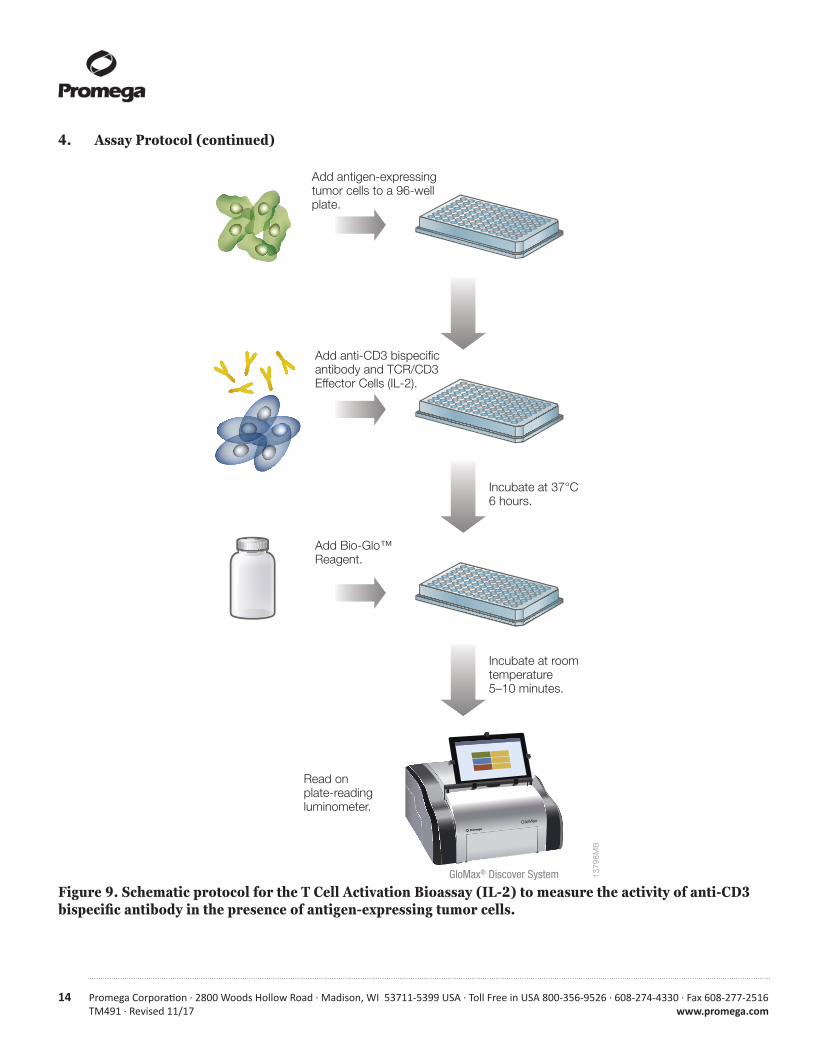
Figure 9. Schematic protocol for the T Cell Activation Bioassay (IL-2) to measure the activity of anti-CD3 bispecifi c antibody in the presence of antigen-expressing tumor cells.
Promega Corpora on · 2800 Woods Hollow Road · Madison, WI 53711-5399 USA · Toll Free in USA 800-356-9526 · 608-274-4330 · Fax 608-277-2516 15www.promega.com TM491 ·Revised 11/17
4.A. Preparing Bio-Glo™ Reagent, Assay Buffer and Test and Reference Samples
1. Bio-Glo™ Reagent: For reference, 10ml of Bio-Glo™ Reagent is suffi cient to assay 120 wells in a 96-well assay format. Thaw the Bio-Glo™ Luciferase Assay Buff er in a refrigerator overnight or in a room temperature water bath on the day of assay. Equilibrate the Bio-Glo™ Luciferase Assay Buff er to ambient temperature, protected from light. Transfer all of the Bio-Glo™ Luciferase Assay Buff er into the amber bottle containing the Bio-Glo™ Luciferase Assay Substrate and mix by inversion until the Substrate is thoroughly dissolved. Equilibrate and store the reconstituted Bio-Glo™ Reagent at ambient temperature (22–25°C) protected from light before adding to assay plates.
If you are using a large (100ml) size of Bio-Glo™ Luciferase Assay System, dispense the reconstituted Bio-Glo™ Reagent into 10ml aliquots and store at –20°C for up to six weeks. Avoid repeated freeze-thaw cycles. On the day of the assay, thaw the appropriate amount of reconstituted Bio-Glo™ Reagent in a room temperature water bath for at least 1–2 hours before use. Approximate stability of Bio-Glo™ Reagent after reconstitution is 18% loss of luminescence after 24 hours at ambient temperature.
2. Assay Buff er: Prepare an appropriate amount of assay buffer on the day of the assay. Thaw the fetal bovine serum (FBS) in a 37°C water bath taking care not to overheat it. Add an appropriate amount of FBS to RPMI 1640 medium to yield 90% RPMI 1640/10% FBS. Mix well and warm to 37°C prior to use. For reference, 50ml of assay buffer is typically sufficient for 120 wells in a 96-well assay format using the inner 60 wells.
Note: The recommended assay buff er contains 10% FBS. This concentration of FBS works well for all of the anti-CD3 antibodies we have tested. If you experience assay performance issues when using this assay buffer, we recommend testing serum concentrations in the range of 0.5–10%.
3. Test and Reference Samples: Prepare starting dilutions (dilu1, 3X final concentration) of test and reference antibodies. Using assay buff er as the diluent, prepare prepare 300µl of reference antibody starting dilution and 150µl of each test antibody starting dilution in 1.5ml tubes. Store the tubes containing antibody starting dilutions appropriately before making antibody serial dilutions.
16 Promega Corpora on · 2800 Woods Hollow Road · Madison, WI 53711-5399 USA · Toll Free in USA 800-356-9526 · 608-274-4330 · Fax 608-277-2516TM491 · Revised 11/17 www.promega.com
4.B. Plate Layout Design
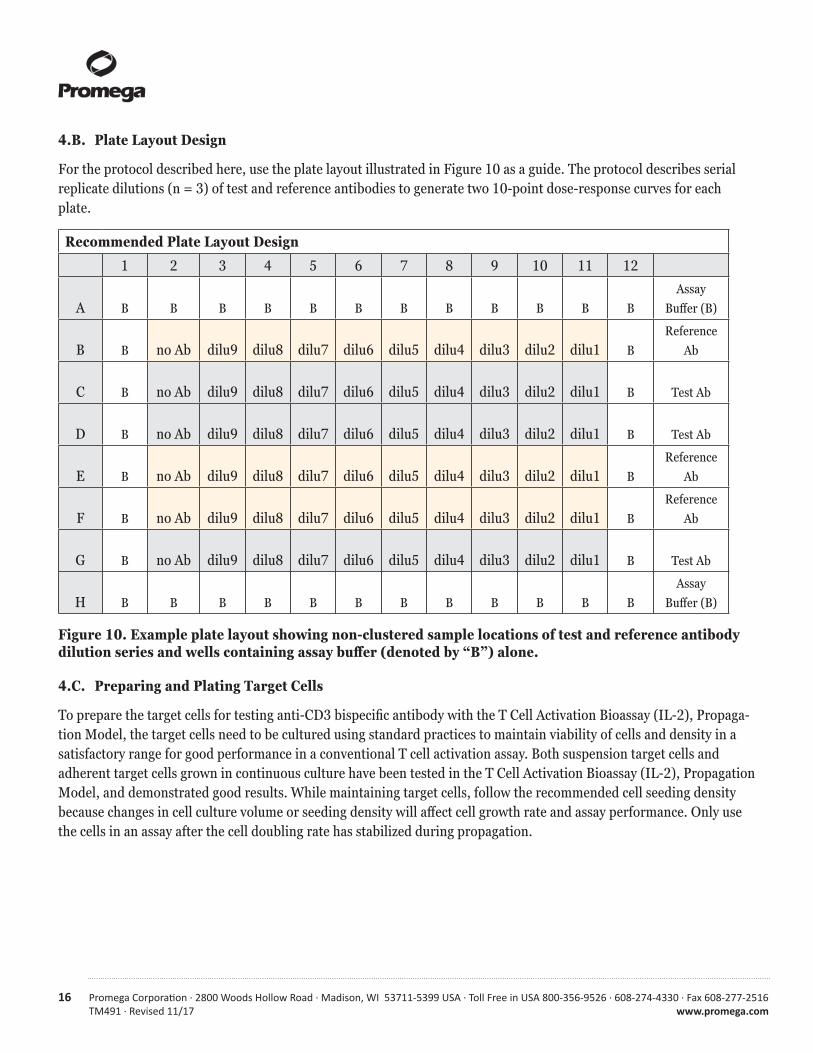
For the protocol described here, use the plate layout illustrated in Figure 10 as a guide. The protocol describes serial replicate dilutions (n = 3) of test and reference antibodies to generate two 10-point dose-response curves for each plate.
Recommended Plate Layout Design
1 2 3 4 5 6 7 8 9 10 11 12
A B B B B B B B B B B B BAssay
Buff er (B)
B B no Ab dilu9 dilu8 dilu7 dilu6 dilu5 dilu4 dilu3 dilu2 dilu1 BReference
Ab
C B no Ab dilu9 dilu8 dilu7 dilu6 dilu5 dilu4 dilu3 dilu2 dilu1 B Test Ab
D B no Ab dilu9 dilu8 dilu7 dilu6 dilu5 dilu4 dilu3 dilu2 dilu1 B Test Ab
E B no Ab dilu9 dilu8 dilu7 dilu6 dilu5 dilu4 dilu3 dilu2 dilu1 BReference
Ab
F B no Ab dilu9 dilu8 dilu7 dilu6 dilu5 dilu4 dilu3 dilu2 dilu1 BReference
Ab
G B no Ab dilu9 dilu8 dilu7 dilu6 dilu5 dilu4 dilu3 dilu2 dilu1 B Test Ab
H B B B B B B B B B B B BAssay
Buff er (B)
Figure 10. Example plate layout showing non-clustered sample locations of test and reference antibody dilution series and wells containing assay buff er (denoted by “B”) alone.
4.C. Preparing and Plating Target Cells
To prepare the target cells for testing anti-CD3 bispecifi c antibody with the T Cell Activation Bioassay (IL-2), Propaga-tion Model, the target cells need to be cultured using standard practices to maintain viability of cells and density in a satisfactory range for good performance in a conventional T cell activation assay. Both suspension target cells and adherent target cells grown in continuous culture have been tested in the T Cell Activation Bioassay (IL-2), Propagation Model, and demonstrated good results. While maintaining target cells, follow the recommended cell seeding density because changes in cell culture volume or seeding density will affect cell growth rate and assay performance. Only use the cells in an assay after the cell doubling rate has stabilized during propagation.
Promega Corpora on · 2800 Woods Hollow Road · Madison, WI 53711-5399 USA · Toll Free in USA 800-356-9526 · 608-274-4330 · Fax 608-277-2516 17www.promega.com TM491 ·Revised 11/17
Preparing Suspension Target Cell Lines from Continuous Culture
1. Passage the cells two days before performing the assay using the cell growth medium recommended for your specifi c target cell. As a reference, to ensure optimal and consistent assay performance of Raji (CD19+) target cells tested with blinatumomab, maintain the cell density, upon harvest, in the range of 1.0–1.6 × 10⁶ cells/ml and cell viability at greater than 95%.
2. On the day of assay, prepare an appropriate amount of assay buffer as described in Section 4.A.
3. Estimate the required target cell number needed for assay. Harvest and count the target cells by Trypan blue staining, and calculate the cell density and viability. Harvest at least twice the cell number needed for the assay.
4. Transfer an appropriate amount of target cells from the culture vessel to a 50ml conical tube or larger sized centrifuge tube.
5. Pellet the cells at 130–180 × g for 10 minutes at ambient temperature.
6. Resuspend the cells to a fi nal cell density suitable for your assay to ensure that there is an appropriate cell number per well when you dispense 25µl to each well. To prepare Raji (CD19+) target cells to test with blinatumomab, you will need at least 4ml of cell suspension at 1.6 × 10⁶ cells/ml to fi ll 120 assay wells, or the inner 60 wells of two assay plates, and includes extra volume for accurate pipetting.
7. Transfer the cell suspension to a sterile reagent reservoir.
8. Using a multichannel pipette, immediately dispense 25µl of the cell suspension suspension to each of the inner 60-wells of 96-well fl at, white-bottom assay plates.
9. Dispense 75µl of assay buff er into the outermost wells, labeled “B” in Figure 10, of both assay plates.
10. Cover the assay plates with a lid and proceed to Section 4.D.
Preparing Adherent Target Cell Lines from Continuous Culture
Follow the steps below using aseptic technique in a sterile cell culture hood if performing an overnight assay.
1. Passage cells 2–3 days before performing the assay using the cell growth medium recommended for your specifi c adherent target cell. To ensure optimal and consistent assay performance, maintain the cell density, upon harvest, below 100% confl uency and cell viability at greater than 95%.
2. The day before the T Cell Activation Bioassay, estimate the required target cell number needed. Harvest target cells using trypsin (or other standard procedure), count cells by Trypan blue staining, and calculate the cell density and viability. Harvest at least twice the cell number needed for the assay.
3. Transfer an appropriate amount of the cells from the culture vessel to a 50ml conical tube or larger sized centrifuge tube.
4. Pellet the cells at 180–200 × g for 10 minutes at ambient temperature.
5. Resuspend the cells in compatible complete culture medium to a fi nal cell density suitable for your assay to ensure that there is an appropriate cell number per well when you dispense 100µl to each well. As reference, we used cells at a density of 4 × 10⁵ cells/ml, and prepared 15ml of cell suspension (including extra volume for accurate pipetting) to fi ll 120 assay wells, or the inner 60 wells of two assay plates.
!
18 Promega Corpora on · 2800 Woods Hollow Road · Madison, WI 53711-5399 USA · Toll Free in USA 800-356-9526 · 608-274-4330 · Fax 608-277-2516TM491 · Revised 11/17 www.promega.com
4.C. Preparing and Plating Target Cells (continued)
Preparing Adherent Target Cell Lines from Continuous Culture (continued)
6. Transfer the resuspended cells to a sterile reagent reservoir.
7. Immediately dispense 100µl of the cell suspension to each of the inner 60 wells of 96-well fl at, white-bottom assay plates using a multichannel pipette. The fi nal cell concentration in each well should be around 4 × 10⁴ cells/well, and will vary depending on cell size. Target cells should be attached and 90–100% confl uent at the start of the assay.
8. Dispense 100µl of complete culture medium into the outermost wells, labeled “B” in Figure 10, of both assay plates.
9. Cover the plates with lids and incubate in a humid 37°C, 5% CO2 incubator for 20–24 hours.
10. On the morning of the T Cell Activation Bioassay, prepare an appropriate amount of assay buffer as described in Section 4.A.
11. Remove all of the culture medium from each of the wells using a multichannel pipette. Alternatively, fl ick medium from plates into a sink and blot plate dry on paper towels. If performing an overnight assay, do not use the alter-nate fl ick-and-blot method (see Section 4.E, Step 8).
12. Immediately dispense 25µl of Assay Buff er (prewarmed to 37°C) to each of the inner 60-wells of the assay plates using a multichannel pipette. Gently add medium by touching pipette tips to the walls of the wells to minimize disruption of the target cells.
13. Dispense 75µl of prewarmed assay buff er into the outermost wells, labeled “B” in Figure 10, of both assay plates.
14. Cover the plates with lids and proceed to Section 4.D.
4.D. Preparing and Adding Antibody Serial Dilutions
The instructions described here are for preparation of a single stock of fourfold serial dilutions of a single antibody for analysis in triplicate (100µl of each dilution provides a suffi cient volume for analysis in triplicate). Alternatively, you can prepare three independent stocks of serial dilutions to generate triplicate samples. To prepare fourfold serial dilutions, you will need 300µl of reference antibody at 3X the highest antibody concentration in your dose-response curve. You will need 150µl of each test antibody at 3X the highest antibody concentration in each of the test antibody dose-response curves. For other dilution schemes, adjust the volumes accordingly.
1. To a sterile clear 96-well plate, add 150µl of reference antibody starting dilution (dilu1, 3X fi nal concentration) to wells A11 and B11. (See Figure 11.)
3. Add 150µl of test antibodies 1 and 2 starting dilution (dilu1, 3X fi nal concentration) to wells E11 and G11, respectively.
4. Add 150µl of assay buff er to other wells in these four rows, from column 10 to column 2.
5. Transfer 50µl of the antibody starting dilutions from column 11 into column 10. Mix well by pipetting. Avoid creating bubbles.
Promega Corpora on · 2800 Woods Hollow Road · Madison, WI 53711-5399 USA · Toll Free in USA 800-356-9526 · 608-274-4330 · Fax 608-277-2516 19www.promega.com TM491 ·Revised 11/17
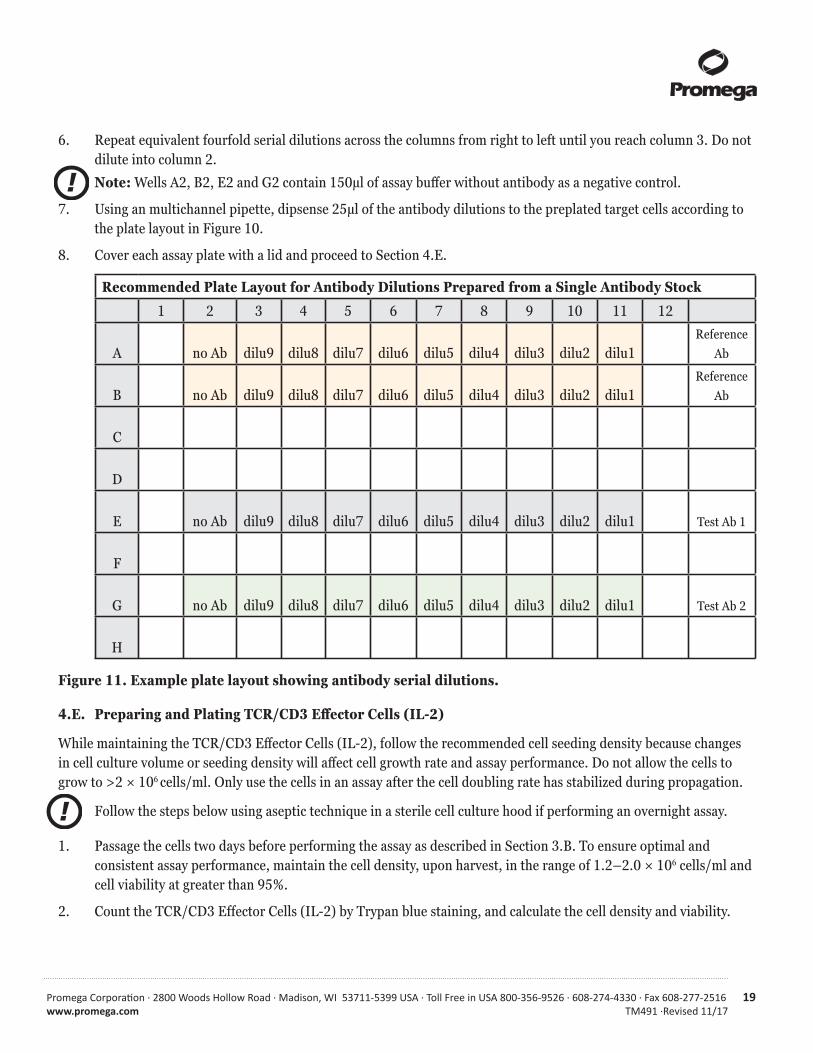
6. Repeat equivalent fourfold serial dilutions across the columns from right to left until you reach column 3. Do not dilute into column 2.
Note: Wells A2, B2, E2 and G2 contain 150µl of assay buff er without antibody as a negative control.
7. Using an multichannel pipette, dipsense 25μl of the antibody dilutions to the preplated target cells according to the plate layout in Figure 10.
8. Cover each assay plate with a lid and proceed to Section 4.E.
Recommended Plate Layout for Antibody Dilutions Prepared from a Single Antibody Stock
1 2 3 4 5 6 7 8 9 10 11 12
A no Ab dilu9 dilu8 dilu7 dilu6 dilu5 dilu4 dilu3 dilu2 dilu1Reference
Ab
B no Ab dilu9 dilu8 dilu7 dilu6 dilu5 dilu4 dilu3 dilu2 dilu1Reference
Ab
C
D
E no Ab dilu9 dilu8 dilu7 dilu6 dilu5 dilu4 dilu3 dilu2 dilu1 Test Ab 1
F
G no Ab dilu9 dilu8 dilu7 dilu6 dilu5 dilu4 dilu3 dilu2 dilu1 Test Ab 2
H
Figure 11. Example plate layout showing antibody serial dilutions.
4.E. Preparing and Plating TCR/CD3 Eff ector Cells (IL-2)
While maintaining the TCR/CD3 Eff ector Cells (IL-2), follow the recommended cell seeding density because changes in cell culture volume or seeding density will affect cell growth rate and assay performance. Do not allow the cells to grow to >2 × 10⁶ cells/ml. Only use the cells in an assay after the cell doubling rate has stabilized during propagation.
Follow the steps below using aseptic technique in a sterile cell culture hood if performing an overnight assay.
1. Passage the cells two days before performing the assay as described in Section 3.B. To ensure optimal and consistent assay performance, maintain the cell density, upon harvest, in the range of 1.2–2.0 × 10⁶ cells/ml and cell viability at greater than 95%.
2. Count the TCR/CD3 Effector Cells (IL-2) by Trypan blue staining, and calculate the cell density and viability.
!
!
20 Promega Corpora on · 2800 Woods Hollow Road · Madison, WI 53711-5399 USA · Toll Free in USA 800-356-9526 · 608-274-4330 · Fax 608-277-2516TM491 · Revised 11/17 www.promega.com
4.E. Preparing and Plating TCR/CD3 Eff ector Cells (IL-2) (continued)
3. Transfer an appropriate amount of cells from the culture vessel to a 50ml conical tube or larger sized centrifuge tube.
4. Pellet the cells at 130–180 × g for 10 minutes at ambient temperature.
5. Resuspend the cells in assay buffer to achieve final cell density of 4 × 10⁶ cells/ml. You will need at least 4ml of TCR/CD3 Effector Cells (IL-2) to fill 120 assay wells, or the inner 60 wells of two assay plates, and includes extra volume for accurate pipetting.
6. Transfer the cell suspension to a sterile reagent reservoir.
7. Using a multichannel pipette, immediately dispense 25µl of the cell suspension to each of the inner 60 wells containing target cells and antibody dilutions from Sections 4.B and 4.C. The final cell concentration in each well should be 1.0 × 10⁵ cells/well, and final assay volume 75µl.
8. Cover each assay plates with a lid, and incubate in a humid 37°C, 5% CO2 incubator for 6 hours.
Note: The 6 hour assay time was optimized using Raji (CD19+) target cells and blinatumomab bispecifi c antibody. We recommend optimizing assay time (3–24 hours) with your target cells and antibody.
4.F. Adding Bio-Glo™ Reagent
Note: Bio-Glo™ Reagent should be at ambient temperature (22–25°C) when added to assay plates.
1. Remove the assay plates from the incubator and equilibrate to ambient temperature for 10–15 minutes.
2. Using a manual multichannel pipette, add 75µl of Bio-Glo™ Reagent to the inner 60 wells of the assay plates, taking care not to create bubbles.
3. Add 75µl of Bio-Glo™ Reagent to wells B1, C1 and D1 of each assay plate to measure the background signal.
4. Incubate at ambient temperature for 5–10 minutes.
Note: Varying the incubation time will aff ect the raw RLU values but should not signifi cantly change the EC50 value and fold induction.
5. Measure luminescence using a luminometer or luminescence plate reader.
4.G. Data Analysis
1. Measure plate background by calculating the average relative light units (RLU) from wells B1, C1 and D1.
2. Calculate fold induction = RLU (induced–background)/RLU (no antibody control–background).
Note: When calculating fold induction, if sample RLUs are the same as or up to 100X the plate background RLU, there is no need to subtract plate background from sample RLU.
3. Graph data as RLU versus Log10 [antibody] and fold induction versus Log10 [antibody]. Fit curves and determine the EC50 value of antibody response using appropriate curve fi tting software (such as GraphPad Prism® software).
!
!
Promega Corpora on · 2800 Woods Hollow Road · Madison, WI 53711-5399 USA · Toll Free in USA 800-356-9526 · 608-274-4330 · Fax 608-277-2516 21www.promega.com TM491 ·Revised 11/17
5. Troubleshooting
For questions not addressed here, please contact your local Promega Branch Offi ce or Distributor. Contact information available at: www.promega.com. E-mail: [email protected]
Symptoms Possible Causes and CommentsCell viability is low during cell propagation Seeding cells at a density that is too low or too high could lead to
low cell viability. Handle and propagate the cells according to the instructions provided in Section 3. Do not let the cells overgrow.
Centrifugation above the recommended speed could lead to low cell viability.
Assay performance is variable If the cells were not grown under controlled and consistent conditions, assay performance will vary. Follow the cell culture guidelines and ensure accurate and consistent cell seeding density and culture volume. Monitor cell doubling rate for consistency.
Low luminescence measurements (RLU readout) Choose an instrument designed for plate-reading luminescence detection. Instruments designed primarily for fl uorescence detection are not recommended. Luminometers measure and report luminescence as relative values, and actual RLU numbers will vary between instruments.
Insuffi cient cells per well can lead to low RLU. Handle and plate the cells according to the instructions to ensure a suffi cient number of viable cells per well.
Low activity of Bio-Glo™ Reagent leads to low RLU. Store and handle the Bio-Glo™ Reagent according to the instructions.
Weak assay response (low fold induction) Optimize the concentration range of your test sample(s) to achieve a full dose response with complete upper and lower asymptotes. The EC50 value obtained in the T Cell Activation Bioassay (IL-2) may vary from the EC50 obtained using other methods such as primary T cell-based assays.
Optimize the assay incubation time within a range of 3–24 hours.
If untreated control RLU is less than tenfold above plate reader background RLU, subtract plate reader background RLU from all samples prior to calculating fold induction.
22 Promega Corpora on · 2800 Woods Hollow Road · Madison, WI 53711-5399 USA · Toll Free in USA 800-356-9526 · 608-274-4330 · Fax 608-277-2516TM491 · Revised 11/17 www.promega.com
6. References
1. Hout, R. et al. (2015) T-cell-based immunotherapy: Adoptive cell transfer and checkpoint inhibition. Cancer Immunol. Res. 3, 1115–22.
2. Fathman, C.G. and Lineberry, N.B. (2007) Molecular mechanisms of CD4+ T-cell anergy. Nat. Rev. Immunol. 7, 599–609.
3. Stecha, P. et al. (2015) Development of a robust reporter-based T-cell activation assay for bispecifi c therapeu-tic antibodies in immunotherapy. American Association of Cancer Research (AACR) Annual Meeting, Poster #5439
4. Löffl er, A. et al. (2000) A recombinant bispecifi c single-chain antibody, CD19 × CD3, induces rapid and high lymphoma-directed cytotoxicity by unstimulated T lymphocytes. Blood 95, 2098–103.
5. Moreland, L., Bate, G. and Kirkpatrick, P. (2006). Abatacept. Nature Reviews Drug Discovery. 5, 185–186.
7. Appendix
7.A. Representative Assay Results
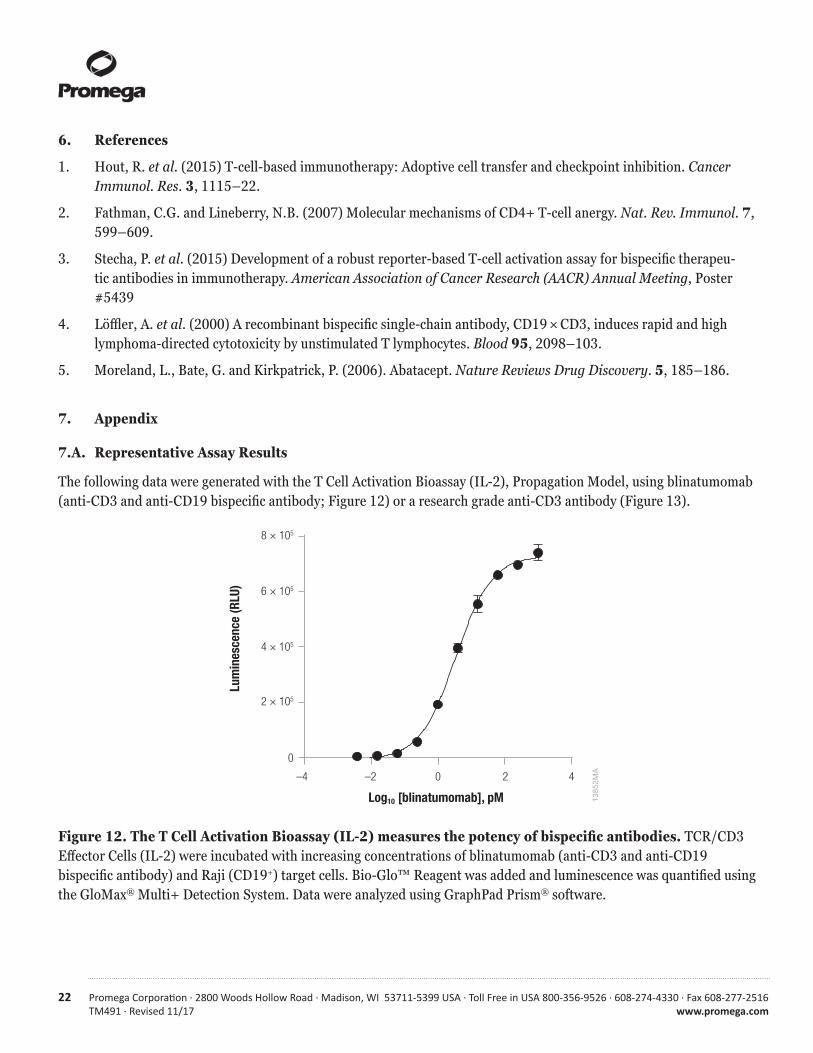
The following data were generated with the T Cell Activation Bioassay (IL-2), Propagation Model, using blinatumomab (anti-CD3 and anti-CD19 bispecifi c antibody; Figure 12) or a research grade anti-CD3 antibody (Figure 13).
1385
2MA
Log10 [blinatumomab], pM
0
–4 –2 0 2 4
Lum
ines
cenc
e (R
LU)
2 × 10⁵
4 × 10⁵
6 × 10⁵
8 × 10⁵
Figure 12. The T Cell Activation Bioassay (IL-2) measures the potency of bispecifi c antibodies. TCR/CD3 Eff ector Cells (IL-2) were incubated with increasing concentrations of blinatumomab (anti-CD3 and anti-CD19 bispecifi c antibody) and Raji (CD19+) target cells. Bio-Glo™ Reagent was added and luminescence was quantified using the GloMax® Multi+ Detection System. Data were analyzed using GraphPad Prism® software.
Promega Corpora on · 2800 Woods Hollow Road · Madison, WI 53711-5399 USA · Toll Free in USA 800-356-9526 · 608-274-4330 · Fax 608-277-2516 23www.promega.com TM491 ·Revised 11/17
1385
3MA
Log10 [anti-CD3 antibody], µg/ml
0
–4 –2 0 2 4
Lum
ines
cenc
e (R
LU)
0.4 × 10⁴
0.2 × 10⁴
0.6 × 10⁴
0.8 × 10⁴
1.0 × 10⁴
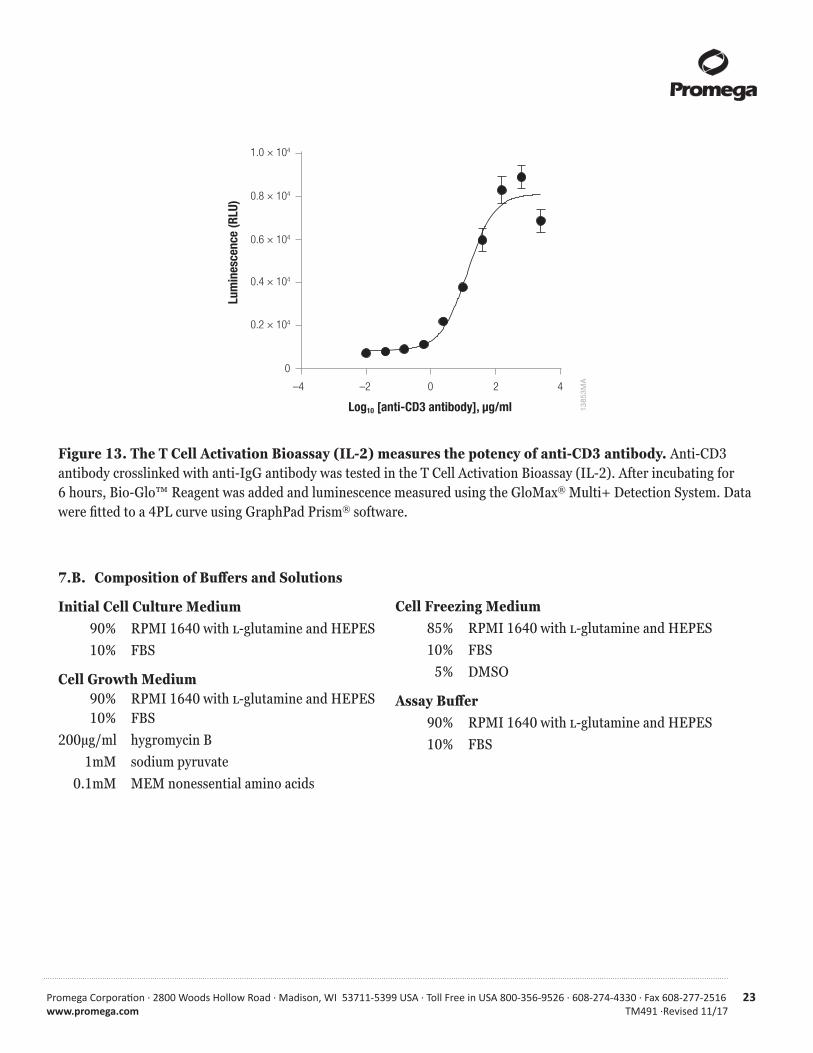
Figure 13. The T Cell Activation Bioassay (IL-2) measures the potency of anti-CD3 antibody. Anti-CD3 antibody crosslinked with anti-IgG antibody was tested in the T Cell Activation Bioassay (IL-2). After incubating for 6 hours, Bio-Glo™ Reagent was added and luminescence measured using the GloMax® Multi+ Detection System. Data were fitted to a 4PL curve using GraphPad Prism® software.
7.B. Composition of Buff ers and Solutions
Initial Cell Culture Medium 90% RPMI 1640 with L-glutamine and HEPES 10% FBS
Cell Growth Medium 90% RPMI 1640 with L-glutamine and HEPES 10% FBS 200µg/ml hygromycin B 1mM sodium pyruvate 0.1mM MEM nonessential amino acids
Cell Freezing Medium 85% RPMI 1640 with L-glutamine and HEPES 10% FBS 5% DMSO
Assay Buffer 90% RPMI 1640 with L-glutamine and HEPES 10% FBS
24 Promega Corpora on · 2800 Woods Hollow Road · Madison, WI 53711-5399 USA · Toll Free in USA 800-356-9526 · 608-274-4330 · Fax 608-277-2516TM491 · Revised 11/17 www.promega.com
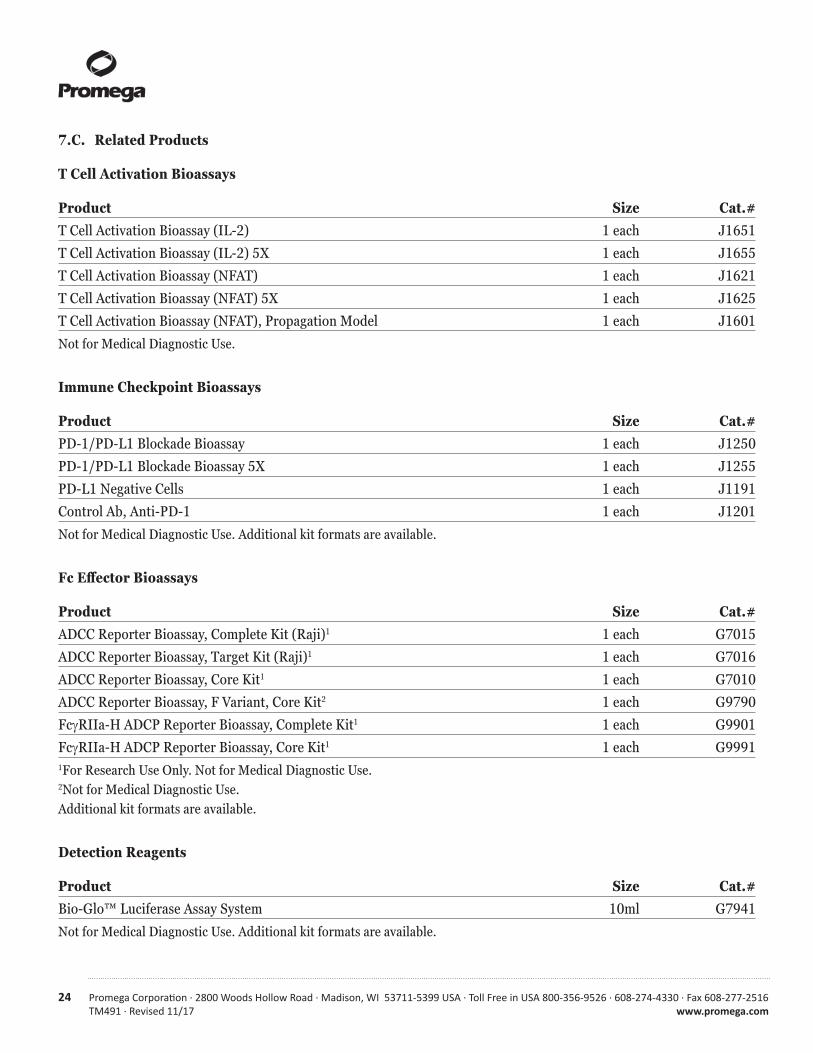
7.C. Related Products
T Cell Activation Bioassays
Product Size Cat.#T Cell Activation Bioassay (IL-2) 1 each J1651
T Cell Activation Bioassay (IL-2) 5X 1 each J1655
T Cell Activation Bioassay (NFAT) 1 each J1621
T Cell Activation Bioassay (NFAT) 5X 1 each J1625
T Cell Activation Bioassay (NFAT), Propagation Model 1 each J1601
Not for Medical Diagnostic Use.
Immune Checkpoint Bioassays
Product Size Cat.#PD-1/PD-L1 Blockade Bioassay 1 each J1250
PD-1/PD-L1 Blockade Bioassay 5X 1 each J1255
PD-L1 Negative Cells 1 each J1191
Control Ab, Anti-PD-1 1 each J1201
Not for Medical Diagnostic Use. Additional kit formats are available.
Fc Eff ector Bioassays
Product Size Cat.#ADCC Reporter Bioassay, Complete Kit (Raji)1 1 each G7015
ADCC Reporter Bioassay, Target Kit (Raji)1 1 each G7016
ADCC Reporter Bioassay, Core Kit1 1 each G7010
ADCC Reporter Bioassay, F Variant, Core Kit2 1 each G9790
FcRIIa-H ADCP Reporter Bioassay, Complete Kit1 1 each G9901
FcRIIa-H ADCP Reporter Bioassay, Core Kit1 1 each G99911For Research Use Only. Not for Medical Diagnostic Use.2Not for Medical Diagnostic Use.Additional kit formats are available.
Detection Reagents
Product Size Cat.#Bio-Glo™ Luciferase Assay System 10ml G7941
Not for Medical Diagnostic Use. Additional kit formats are available.
Promega Corpora on · 2800 Woods Hollow Road · Madison, WI 53711-5399 USA · Toll Free in USA 800-356-9526 · 608-274-4330 · Fax 608-277-2516 25www.promega.com TM491 ·Revised 11/17
Luminometers
Product Size Cat.#GloMax® Discover System 1 each GM3000
Not For Medical Diagnostic Use.
Note: Additional Immunotherapy and Fc Eff ector Bioassays are available from Promega Custom Assay Services. To view and order products from Custom Assay Services visit: www.promega.com/CAS or email: [email protected]
7.D. Summary of Changes
TM491 was revised 11/2017, to add “and HEPES” to RPMI 1640 Medium in Section 7.B.
(a)NOT FOR MEDICAL DIAGNOSTIC USE. FOR IN VITRO USE ONLY. BY USE OF THIS PRODUCT, RECIPIENT AGREES TO BE BOUND BY THE TERMS OF THIS LIMITED USE STATEMENT. If the recipient is not willing to accept the condi ons of this limited use statement, and the product is unused, Promega will accept return of the unused product and provide the recipient with a full refund.
This product may not be further sold or transferred by the recipient and may be used only by the recipient, and then only for (1) research use, (2) discovery, development and monitoring of biologic drugs and vaccines, (3) quality assurance tes ng of biologic drugs and vaccines, and (4) product release assays for biologic drugs and vaccines. No other commercial use is allowed. “Commercial use” means any and all uses of this product by recipient for monetary or other considera on, including providing a service, informa on or data to unaffi liated third par es, and resale of this product for any use. Recipient may gene cally engineer the cell line using exogenous nucleic acid sequences provided by Researcher. In addi on, recipient may propagate and store the cells for long-term use. Recipient must use Bio-Glo™ Luciferase Assay System purchased from Promega Corpora on for all luminescence assays using this product or contact Promega to obtain a license for use of this product with reagents other than Promega’s. PROMEGA MAKES NO REPRESENTATIONS OR WARRANTIES OF ANY KIND, EITHER EXPRESSED OR IMPLIED, INCLUDING AS TO MERCHANTABILITY OR FITNESS FOR A PARTICULAR PURPOSE WITH REGARDS TO THIS PRODUCT. The terms of this agreement shall be governed under the laws of the State of Wisconsin, USA.(b)U.S. Pat. No. 8,008,006 and European Pat. No. 1341808.
© 2016, 2017 Promega Corpora on. All Rights Reserved.
GloMax is a registered trademark of Promega Corpora on. Bio-Glo is a trademark of Promega Corpora on.
Blincyto is a trademark of Amgen Inc. GraphPad Prism is a registered trademark of GraphPad So ware, Inc. JMP is a registered trademark of SAS Ins tute, Inc. Mr. Frosty is a registered trademark of Nalge Nunc Interna onal Corpora on. Mul channel Arm is a trademark of Tecan Group Ltd. Mul drop is a trademark of Thermo Fisher Scien fi c, Ltd. Styrofoam is a registered trademark of Dow Chemical Company.
Products may be covered by pending or issued patents or may have certain limita ons. Please visit our Web site for more informa on.
All prices and specifi ca ons are subject to change without prior no ce.
Product claims are subject to change. Please contact Promega Technical Services or access the Promega online catalog for the most up-to-date informa on on Promega products.