Embed Size (px)
Citation preview
THE COUNCIL OF THE CITY OF NEW YORK
Hon. Corey Johnson Speaker of the Council
Hon. Daniel Dromm
Chair, Committee on Finance
Report to the Committee on Finance
Economic and Revenue Forecast for the Fiscal 2019 Preliminary Budget
March 5, 2018
Finance Division
Latonia R. McKinney, Director
Finance Division Briefing Paper Economic and Revenue Forecast
Finance Division
Counsel Rebecca Chasan
Eric Bernstein
Budget Unit Regina Poreda Ryan, Deputy Director
Nathan Toth, Deputy Director Crilhien Francisco, Unit Head Chima Obichere, Unit Head
John Russell, Unit Head Dohini Sompura, Unit Head
Eisha Wright, Unit Head Aliya Ali
Jessica Ackerman Sebastian Bacchi
John Basile Sarah Gastelum Kenneth Grace Zachary Harris
Elizabeth Hoffman Sheila Johnson Daniel Kroop
Jin Lee Jeanette Merrill Nameera Nuzhat Kaitlyn O’Hagan
Steve Riester Jonathan Seltzer Andrew Wilber
Revenue and Economics Unit
Raymond Majewski, Deputy Director, Chief Economist Emre Edev, Assistant Director
Paul Sturm, Supervising Economist Hector German Kira McDonald
William Kyeremateng Kendall Stephenson
Davis Winslow
Discretionary Funding and Data Support Unit Paul Scimone, Deputy Director
James Reyes Steven Williams
Administrative Support Unit
Nicole Anderson Maria Pagan
Finance Division Briefing Paper Economic and Revenue Forecast
Table of Contents Overview of the Report................................................................................................................... 1
Economic Forecast .......................................................................................................................... 1
National Economy ....................................................................................................................... 1
City Economy .............................................................................................................................. 1
Comparison to OMB’s Forecast .................................................................................................. 4
Tax Revenue Forecast ..................................................................................................................... 4
Real Property Tax .................................................................................................................... 5
Personal Income Tax (PIT) ....................................................................................................... 5
Business Taxes ........................................................................................................................ 5
Other Taxes ............................................................................................................................. 6
Comparison to OMB’s Forecast .................................................................................................. 6
Tax Cuts and Jobs Act ...................................................................................................................... 7
Impact on the National Economy ............................................................................................... 7
Impact on New York City........................................................................................................... 10
Impact on City Revenues .......................................................................................................... 10
Risks to Revenue Budget ............................................................................................................... 11
Risks to the Economic Forecast ................................................................................................ 11
Risks to Revenue Forecast ........................................................................................................ 12
Policy Risks ................................................................................................................................ 12
New York State ...................................................................................................................... 12
Federal Government ............................................................................................................. 12
Appendices .................................................................................................................................... 14
Tax Revenue Levels ................................................................................................................... 14
Revenue Plan ............................................................................................................................ 15
Revenue Plan Changes .............................................................................................................. 16
Finance Division Briefing Paper Economic and Revenue Forecast
1
Overview of the Report On March 5, 2018, the New York City Council’s Finance Committee will hold the first hearing on the Fiscal 2019 Preliminary Budget (the Budget), released on February 1, 2018, with the Mayor’s Office of Management and Budget (OMB). This report, one of two prepared for this hearing, discusses the City Council Finance Division’s economic and tax revenue forecast. It also provides a quick snapshot of the City’s economy and the revenue budget. The other report will focus on the overall budget and the Preliminary Mayor’s Management Report with an emphasis on the expense budget. The capital plan will be addressed in later hearing held jointly with the Subcommittee on Capital. Today, the Finance Division will also release a Revenue Note on Optimal Reserves along with the reports prepared for the hearing.
Economic Forecast
National Economy The Finance Division estimates that, in the coming years, the United States economy will feel both the stimulus from the federal tax cuts enacted in the Tax Cuts and Jobs Act (TCJA) of 2017, and the drag from saturated labor markets and rising interest rates. Real gross domestic product (GDP) is expected to grow by 2.7 percent in both 2018 and 2019, and then decelerate to 1.9 percent by 2022.1 Export growth and physical capital investment have recently been strong economic drivers, and this trend is expected to continue.2 Global demand is finally increasing and the dollar is falling, leading to growth in US exports.
The labor market is strong, but growing slowly. Due to a tightening labor market, growth in payroll employment will continue to slow from 1.8 percent in 2018 to only 0.5 percent by 2022.3 For the same reason, the unemployment rate will continue to fall, eventually bottoming out at 3.6 percent in 2019.4 Average wage growth is finally gaining traction, having grown 2.9 percent year-over-year as of January 2018,5 and will begin to rise in 2021.6
IHS forecasts that stronger growth and higher inflation will prompt the Federal Reserve to raise its benchmark rate Federal Funds rate four times in 2018.7 Higher interest rates will dampen economic growth, particularly by 2020.8
City Economy The Finance Division’s November 2017 forecast painted a picture of a continuously slowing City’s economy, due to diminishing slack in the labor market, climbing housing costs, and other quality of life challenges. The current forecast hardly discounts these bottlenecks to growth, but it acknowledges that the TCJA is likely to temporarily boost the national and City economies.
1 IHS Markit, ‘Executive Summaries,’ February 2018. 2 As percent of GDP, exports have risen by 3.3% and fixed investment in industrial equipment has grown 7.1%. 3 IHS Markit, supra 4 IHS Markit, supra 5 U.S. Bureau of Labor Statistics, ‘Employment Situation,’ January 2018. 6IHS Markit, supra 7 IHS Markit, supra 8 IHS Markit, supra
Finance Division Briefing Paper Economic and Revenue Forecast
2
However, in the long-run, the TCJA will spur higher interest rates, which will constrain investment and economic growth.9
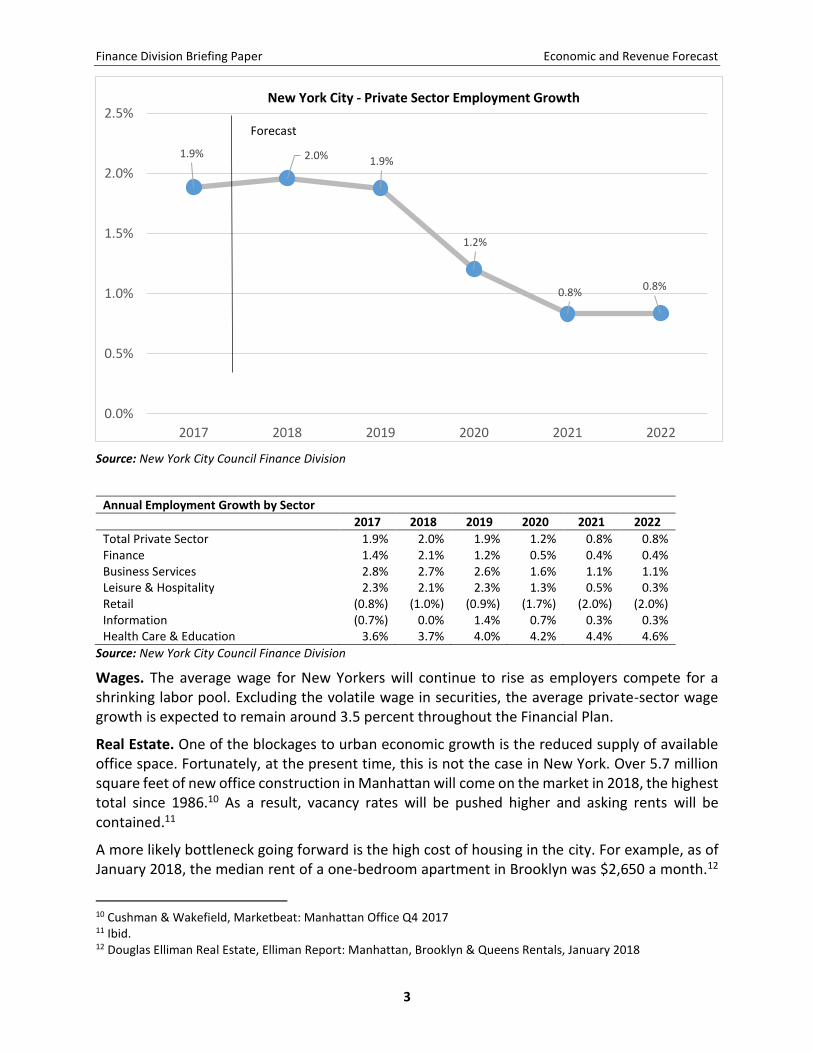
Labor Market. The roller-coaster effect caused by these factors is seen clearly in the Finance Division’s employment forecast (see figure 1 and table 1 below) which indicates a short-term strong uptick, followed by dramatic deceleration, in certain employment sectors.
From 2018 to 2019. After experiencing two years of slowed growth, payroll in the finance sector will expand in 2018, invigorated by the TCJA’s steep tax cuts for corporations and unincorporated firms, as well as ongoing business deregulation. The business services sector will maintain strong growth through 2019, also enjoying the same changes in taxation and regulation. Having a national clientele, this sector will directly benefit from a stimulated U.S. economy. Employment in the leisure and hospitality sector will continue to thrive through 2019 due to an upward trend in tourism, with visitors drawn by a weaker dollar, as well as New Yorkers having more disposable income to spend.
After 2019. These three important sectors are expected to experience a precipitous deceleration after 2019, as the stimulus runs its course and they face similar bottlenecks to growth experienced prior to the TCJA. The health care and education sectors may be the exceptions to this trend. Both sectors added jobs even during the last recession, and will likely maintain healthy payroll growth throughout the Financial Plan. Retiring baby-boomers will continue to increase the demand for health services. The only threat that remains to the health sector would come from a future, successful attempt to repeal the Affordable Care Act. Meanwhile, the retail employment sector is facing a very different prospect, with customers shifting from in-store to online purchasing. There is no indication that the two-year trend in falling retail payroll is about to bottom-out.
9 Both the Congressional Budget Office and Joint Committee on Taxation estimate increased deficits of around one trillion dollars over ten years. Joint Committee on Taxation, Macroeconomic Analysis of the Conference Agreement for H.R.1, the “Tax Cuts and Jobs Act”” JCX-69-17 December 22, 2017, Congressional Budget Office, Congressional Budget Office, “Estimated deficits and debt under the Chairman’s Mark of the Tax Cuts and Jobs Act”, November 13, 2017.
Finance Division Briefing Paper Economic and Revenue Forecast
3
Source: New York City Council Finance Division
Annual Employment Growth by Sector
2017 2018 2019 2020 2021 2022
Total Private Sector 1.9% 2.0% 1.9% 1.2% 0.8% 0.8% Finance 1.4% 2.1% 1.2% 0.5% 0.4% 0.4% Business Services 2.8% 2.7% 2.6% 1.6% 1.1% 1.1% Leisure & Hospitality 2.3% 2.1% 2.3% 1.3% 0.5% 0.3% Retail (0.8%) (1.0%) (0.9%) (1.7%) (2.0%) (2.0%) Information (0.7%) 0.0% 1.4% 0.7% 0.3% 0.3% Health Care & Education 3.6% 3.7% 4.0% 4.2% 4.4% 4.6%
Source: New York City Council Finance Division
Wages. The average wage for New Yorkers will continue to rise as employers compete for a shrinking labor pool. Excluding the volatile wage in securities, the average private-sector wage growth is expected to remain around 3.5 percent throughout the Financial Plan.
Real Estate. One of the blockages to urban economic growth is the reduced supply of available office space. Fortunately, at the present time, this is not the case in New York. Over 5.7 million square feet of new office construction in Manhattan will come on the market in 2018, the highest total since 1986.10 As a result, vacancy rates will be pushed higher and asking rents will be contained.11
A more likely bottleneck going forward is the high cost of housing in the city. For example, as of January 2018, the median rent of a one-bedroom apartment in Brooklyn was $2,650 a month.12
10 Cushman & Wakefield, Marketbeat: Manhattan Office Q4 2017 11 Ibid. 12 Douglas Elliman Real Estate, Elliman Report: Manhattan, Brooklyn & Queens Rentals, January 2018
1.9% 2.0% 1.9%
1.2%
0.8%0.8%
0.0%
0.5%
1.0%
1.5%
2.0%
2.5%
2017 2018 2019 2020 2021 2022
New York City - Private Sector Employment Growth
Forecast
Finance Division Briefing Paper Economic and Revenue Forecast
4
Workers and firms may increasingly prefer locations other than New York that offer a more manageable cost of living.
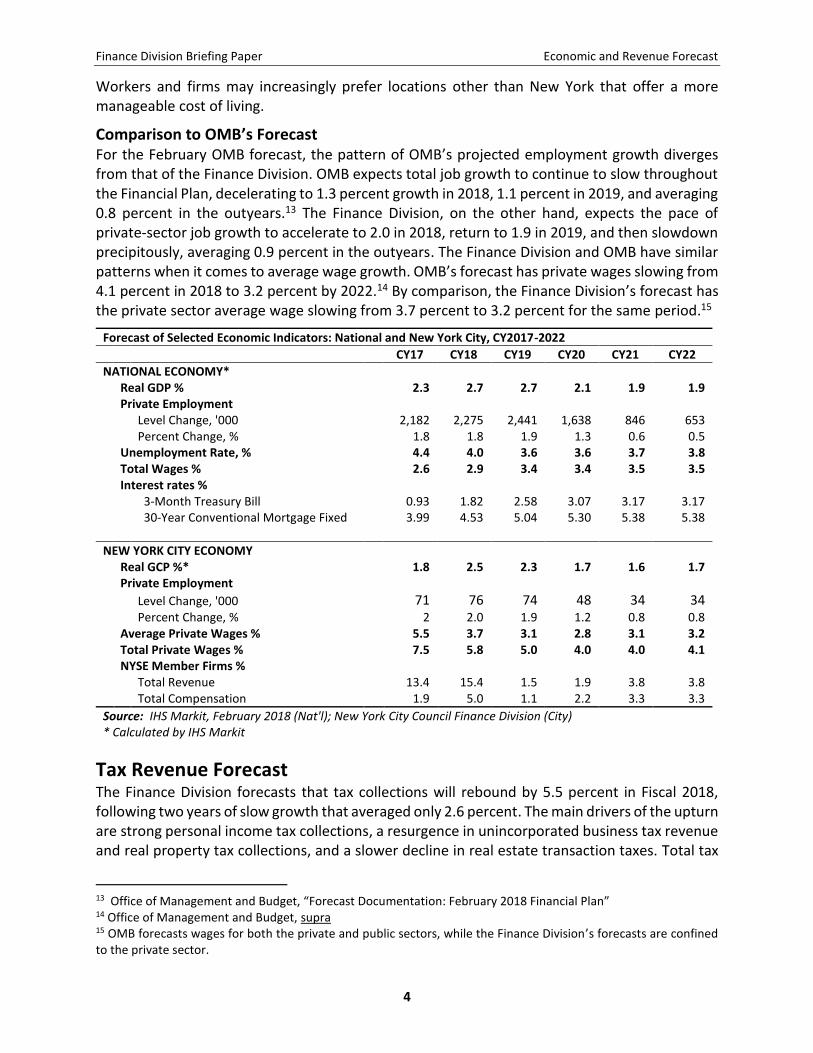
Comparison to OMB’s Forecast For the February OMB forecast, the pattern of OMB’s projected employment growth diverges from that of the Finance Division. OMB expects total job growth to continue to slow throughout the Financial Plan, decelerating to 1.3 percent growth in 2018, 1.1 percent in 2019, and averaging 0.8 percent in the outyears.13 The Finance Division, on the other hand, expects the pace of private-sector job growth to accelerate to 2.0 in 2018, return to 1.9 in 2019, and then slowdown precipitously, averaging 0.9 percent in the outyears. The Finance Division and OMB have similar patterns when it comes to average wage growth. OMB’s forecast has private wages slowing from 4.1 percent in 2018 to 3.2 percent by 2022.14 By comparison, the Finance Division’s forecast has the private sector average wage slowing from 3.7 percent to 3.2 percent for the same period.15
Forecast of Selected Economic Indicators: National and New York City, CY2017-2022
CY17 CY18 CY19 CY20 CY21 CY22
NATIONAL ECONOMY*
Real GDP % 2.3 2.7 2.7 2.1 1.9 1.9
Private Employment
Level Change, '000 2,182 2,275 2,441 1,638 846 653
Percent Change, % 1.8 1.8 1.9 1.3 0.6 0.5
Unemployment Rate, % 4.4 4.0 3.6 3.6 3.7 3.8
Total Wages % 2.6 2.9 3.4 3.4 3.5 3.5
Interest rates %
3-Month Treasury Bill 0.93 1.82 2.58 3.07 3.17 3.17
30-Year Conventional Mortgage Fixed 3.99 4.53 5.04 5.30 5.38 5.38
NEW YORK CITY ECONOMY
Real GCP %* 1.8 2.5 2.3 1.7 1.6 1.7
Private Employment
Level Change, '000 71 76 74 48 34 34
Percent Change, % 2 2.0 1.9 1.2 0.8 0.8
Average Private Wages % 5.5 3.7 3.1 2.8 3.1 3.2
Total Private Wages % 7.5 5.8 5.0 4.0 4.0 4.1
NYSE Member Firms %
Total Revenue 13.4 15.4 1.5 1.9 3.8 3.8 Total Compensation 1.9 5.0 1.1 2.2 3.3 3.3
Source: IHS Markit, February 2018 (Nat'l); New York City Council Finance Division (City) * Calculated by IHS Markit
Tax Revenue Forecast The Finance Division forecasts that tax collections will rebound by 5.5 percent in Fiscal 2018, following two years of slow growth that averaged only 2.6 percent. The main drivers of the upturn are strong personal income tax collections, a resurgence in unincorporated business tax revenue and real property tax collections, and a slower decline in real estate transaction taxes. Total tax
13 Office of Management and Budget, “Forecast Documentation: February 2018 Financial Plan” 14 Office of Management and Budget, supra 15 OMB forecasts wages for both the private and public sectors, while the Finance Division’s forecasts are confined to the private sector.
Finance Division Briefing Paper Economic and Revenue Forecast
5
collections will soften slightly to 4.6 percent growth in 2019, and more significantly in the outyears, averaging 3.9 percent growth during this period. The slowdown in the outyears reflects the expected slowdown in both the national and City economies, as interest rates rise and the initial stimulatory effects of the TCJA reverse.
Real Property Tax Property tax collections will maintain strong growth throughout the Financial Plan, driven by a recent history of strong market value growth. In January 2018, the New York City Department of Finance (DOF) released the preliminary assessment roll for Fiscal 2019, which showed that growth in property values were slightly slower than the growth experienced in Fiscal 2018. Market values are up 9.4 percent, with 8.1 percent of the growth due to market forces. Similarly, assessed values are up 8.4 percent, representing $243 billion in billable assessed value. Based on the preliminary roll, Fiscal 2019 real property tax collections are estimated to be approximately $27.7 billion.
Personal Income Tax (PIT) PIT collections are forecasted to rise 9.5 percent in Fiscal 2018 due to economic factors, federal tax policy changes and New York State’s administrative changes. Collections have benefited from continued employment gains, wage growth (including strong Wall Street bonuses), and huge capital gains. In addition, the federal tax changes prompted taxpayers who held off realizing their capital gains to finally “cash in their chips” before the end of tax year 2017, to be able to fully deduct state and local taxes on their federal taxes in advance of the changes to this deduction resulting from the TCJA. Beginning in tax year 2017, there was a major change in the State’s PIT School Tax Relief (STAR) program.16 This change effectively raised the revenues from the City’s PIT collections while lowering the state’s STAR aid to the city by exactly the same amount, making the city neither better nor worse. After taking the STAR changes into account, collections for Fiscal 2018 increased by a still-healthy 6.1 percent. Annual collections gradually moderate in the outyears, reaching 2.7 percent by 2022.
Business Taxes General Corporation Tax (GCT) collections continue the decline experienced since 2015, dropping by 1.6 percent in Fiscal 2018. When the New York State’s complicated business tax reforms were enacted in 2015, many corporations overpaid their taxes due to uncertainty as to their exact liabilities. Corporate tax collections have been declining since that time. The Finance Division expects that by Fiscal 2019, corporate tax payments will return to normal, with a rebound of 7.7 percent growth.
Unincorporated Business Tax (UBT) collections have been strong in Fiscal 2018, experiencing 6.2 percent growth. This is due to both the strong economy and growing small business confidence. Unincorporated businesses were not included in the 2015 business tax reforms discussed above.
16 The State’s School Tax Relief (STAR) program has subsidized the New York City PIT payers by paying a share of their taxes. This resulted in tax rates lower than they would normally be in the absence of the subsidy. The State reimbursed the City for the resulting reduced tax revenues through STAR aid. Starting in tax year 2017, the State changed the structure of the aid by stopping the subsidy to the City’s PIT payers and giving taxpayers a State credit on their State PIT. The State also discontinued the STAR aid to the City.
Finance Division Briefing Paper Economic and Revenue Forecast
6
Other Taxes Sales Tax collections increased by a strong 5.7 percent in Fiscal 2018, buoyed by higher disposable income from increased employment, rising wages, and lower federal tax withholdings from the federal tax changes. Growth in collections, along with employment and wages, will gradually soften during the outyears.
The real estate transaction taxes, Real Property Transfer (RPTT) and Mortgage Recording (MRT), declined in Fiscal 2017 compared to the previous year. After a five-year period of double-digit growth, the transaction taxes slowed in Fiscal 2016 before declining in Fiscal 2017, largely driven by a slowdown in the commercial real estate market. The mild downward trend is expected to continue through Fiscal 2019 before growth returns in Fiscal 2020.
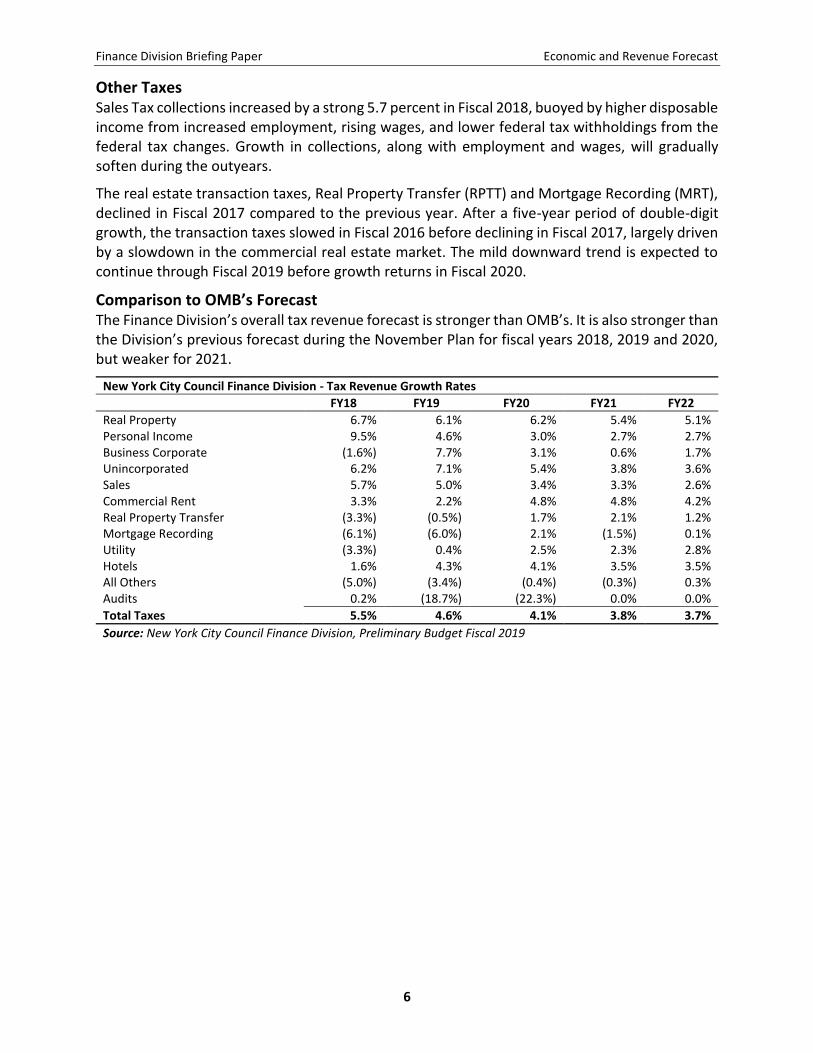
Comparison to OMB’s Forecast The Finance Division’s overall tax revenue forecast is stronger than OMB’s. It is also stronger than the Division’s previous forecast during the November Plan for fiscal years 2018, 2019 and 2020, but weaker for 2021.
New York City Council Finance Division - Tax Revenue Growth Rates
FY18 FY19 FY20 FY21 FY22
Real Property 6.7% 6.1% 6.2% 5.4% 5.1% Personal Income 9.5% 4.6% 3.0% 2.7% 2.7% Business Corporate (1.6%) 7.7% 3.1% 0.6% 1.7% Unincorporated 6.2% 7.1% 5.4% 3.8% 3.6% Sales 5.7% 5.0% 3.4% 3.3% 2.6% Commercial Rent 3.3% 2.2% 4.8% 4.8% 4.2% Real Property Transfer (3.3%) (0.5%) 1.7% 2.1% 1.2% Mortgage Recording (6.1%) (6.0%) 2.1% (1.5%) 0.1% Utility (3.3%) 0.4% 2.5% 2.3% 2.8% Hotels 1.6% 4.3% 4.1% 3.5% 3.5% All Others (5.0%) (3.4%) (0.4%) (0.3%) 0.3% Audits 0.2% (18.7%) (22.3%) 0.0% 0.0%
Total Taxes 5.5% 4.6% 4.1% 3.8% 3.7%
Source: New York City Council Finance Division, Preliminary Budget Fiscal 2019
Finance Division Briefing Paper Economic and Revenue Forecast
7
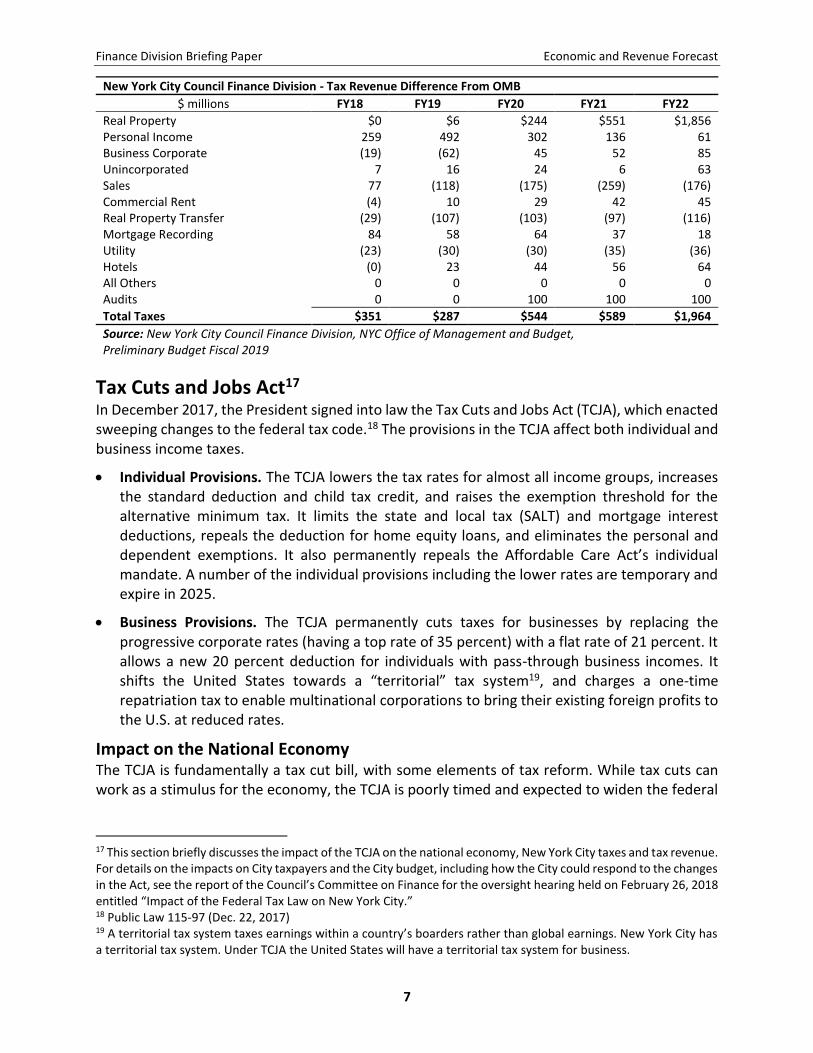
New York City Council Finance Division - Tax Revenue Difference From OMB
$ millions FY18 FY19 FY20 FY21 FY22
Real Property $0 $6 $244 $551 $1,856 Personal Income 259 492 302 136 61 Business Corporate (19) (62) 45 52 85 Unincorporated 7 16 24 6 63 Sales 77 (118) (175) (259) (176) Commercial Rent (4) 10 29 42 45 Real Property Transfer (29) (107) (103) (97) (116) Mortgage Recording 84 58 64 37 18 Utility (23) (30) (30) (35) (36) Hotels (0) 23 44 56 64 All Others 0 0 0 0 0 Audits 0 0 100 100 100
Total Taxes $351 $287 $544 $589 $1,964
Source: New York City Council Finance Division, NYC Office of Management and Budget, Preliminary Budget Fiscal 2019
Tax Cuts and Jobs Act17 In December 2017, the President signed into law the Tax Cuts and Jobs Act (TCJA), which enacted sweeping changes to the federal tax code.18 The provisions in the TCJA affect both individual and business income taxes.
Individual Provisions. The TCJA lowers the tax rates for almost all income groups, increases the standard deduction and child tax credit, and raises the exemption threshold for the alternative minimum tax. It limits the state and local tax (SALT) and mortgage interest deductions, repeals the deduction for home equity loans, and eliminates the personal and dependent exemptions. It also permanently repeals the Affordable Care Act’s individual mandate. A number of the individual provisions including the lower rates are temporary and expire in 2025.
Business Provisions. The TCJA permanently cuts taxes for businesses by replacing the progressive corporate rates (having a top rate of 35 percent) with a flat rate of 21 percent. It allows a new 20 percent deduction for individuals with pass-through business incomes. It shifts the United States towards a “territorial” tax system19, and charges a one-time repatriation tax to enable multinational corporations to bring their existing foreign profits to the U.S. at reduced rates.
Impact on the National Economy The TCJA is fundamentally a tax cut bill, with some elements of tax reform. While tax cuts can work as a stimulus for the economy, the TCJA is poorly timed and expected to widen the federal
17 This section briefly discusses the impact of the TCJA on the national economy, New York City taxes and tax revenue. For details on the impacts on City taxpayers and the City budget, including how the City could respond to the changes in the Act, see the report of the Council’s Committee on Finance for the oversight hearing held on February 26, 2018 entitled “Impact of the Federal Tax Law on New York City.” 18 Public Law 115-97 (Dec. 22, 2017) 19 A territorial tax system taxes earnings within a country’s boarders rather than global earnings. New York City has a territorial tax system. Under TCJA the United States will have a territorial tax system for business.
Finance Division Briefing Paper Economic and Revenue Forecast
8
deficit. As a result, the Finance Division estimates that it will have only modest impacts on GDP growth and unemployment.
Tax cuts are most effective when the economy is sluggish and there is high unemployment. With the U.S. economy close to full employment, it has little room for growth, making this bad timing for stimulus spending.
The act also works counter to current monetary policy. The Federal Reserve has been working diligently over the past year to slow down the economy in order to prevent overheating. For example, the Federal Reserve has increased its federal funds rate five times since December 2015. In all likelihood, the stimulus from TCJA would force the Federal Reserve to increase the rate faster than it otherwise would.
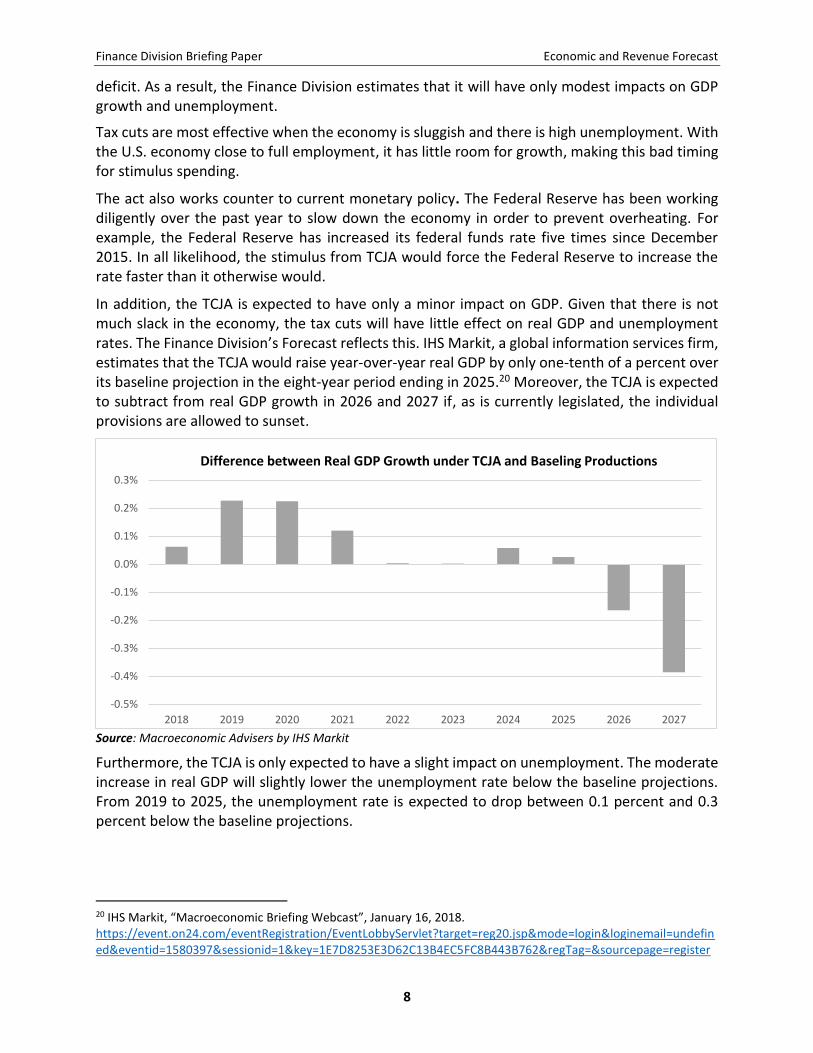
In addition, the TCJA is expected to have only a minor impact on GDP. Given that there is not much slack in the economy, the tax cuts will have little effect on real GDP and unemployment rates. The Finance Division’s Forecast reflects this. IHS Markit, a global information services firm, estimates that the TCJA would raise year-over-year real GDP by only one-tenth of a percent over its baseline projection in the eight-year period ending in 2025.20 Moreover, the TCJA is expected to subtract from real GDP growth in 2026 and 2027 if, as is currently legislated, the individual provisions are allowed to sunset.
Source: Macroeconomic Advisers by IHS Markit
Furthermore, the TCJA is only expected to have a slight impact on unemployment. The moderate increase in real GDP will slightly lower the unemployment rate below the baseline projections. From 2019 to 2025, the unemployment rate is expected to drop between 0.1 percent and 0.3 percent below the baseline projections.
20 IHS Markit, “Macroeconomic Briefing Webcast”, January 16, 2018. https://event.on24.com/eventRegistration/EventLobbyServlet?target=reg20.jsp&mode=login&loginemail=undefined&eventid=1580397&sessionid=1&key=1E7D8253E3D62C13B4EC5FC8B443B762®Tag=&sourcepage=register
-0.5%
-0.4%
-0.3%
-0.2%
-0.1%
0.0%
0.1%
0.2%
0.3%
2018 2019 2020 2021 2022 2023 2024 2025 2026 2027
Difference between Real GDP Growth under TCJA and Baseling Productions
Finance Division Briefing Paper Economic and Revenue Forecast
9
Source: Macroeconomic Advisers by IHS Markit
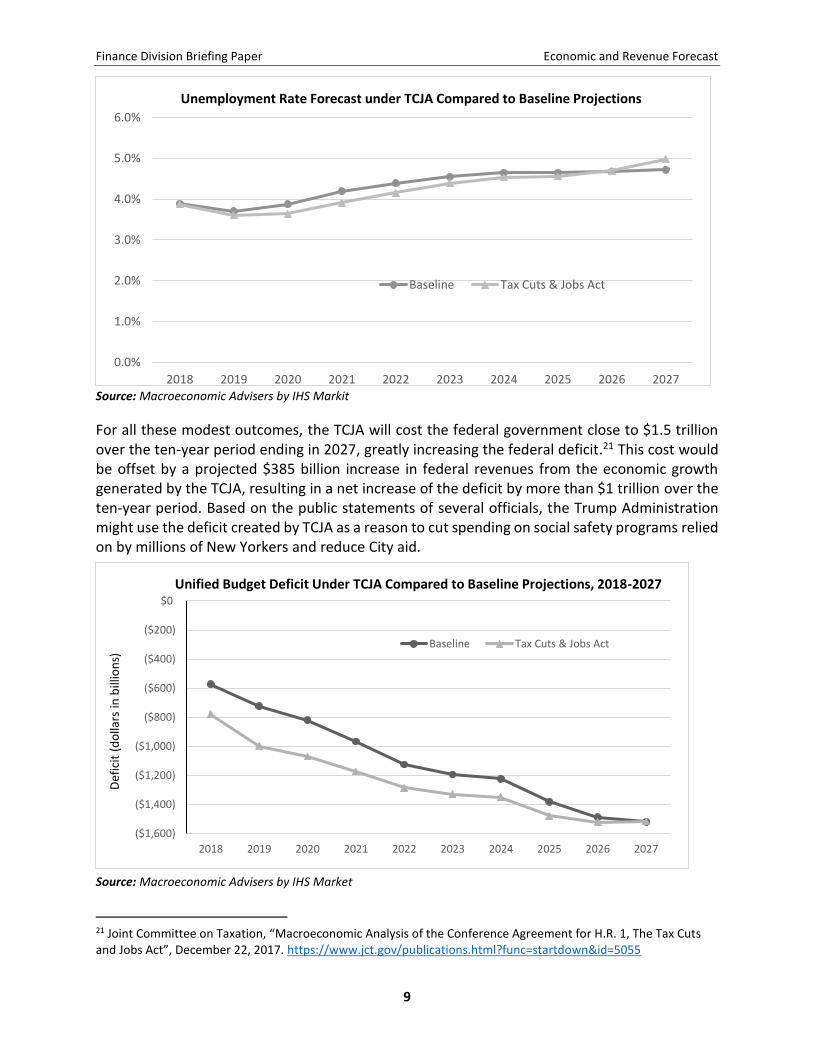
For all these modest outcomes, the TCJA will cost the federal government close to $1.5 trillion over the ten-year period ending in 2027, greatly increasing the federal deficit.21 This cost would be offset by a projected $385 billion increase in federal revenues from the economic growth generated by the TCJA, resulting in a net increase of the deficit by more than $1 trillion over the ten-year period. Based on the public statements of several officials, the Trump Administration might use the deficit created by TCJA as a reason to cut spending on social safety programs relied on by millions of New Yorkers and reduce City aid.
Source: Macroeconomic Advisers by IHS Market
21 Joint Committee on Taxation, “Macroeconomic Analysis of the Conference Agreement for H.R. 1, The Tax Cuts and Jobs Act”, December 22, 2017. https://www.jct.gov/publications.html?func=startdown&id=5055
0.0%
1.0%
2.0%
3.0%
4.0%
5.0%
6.0%
2018 2019 2020 2021 2022 2023 2024 2025 2026 2027
Baseline Tax Cuts & Jobs Act
Unemployment Rate Forecast under TCJA Compared to Baseline Projections
($1,600)
($1,400)
($1,200)
($1,000)
($800)
($600)
($400)
($200)
$0
2018 2019 2020 2021 2022 2023 2024 2025 2026 2027
Baseline Tax Cuts & Jobs Act
Def
icit
(d
olla
rsin
bill
ion
s)
Unified Budget Deficit Under TCJA Compared to Baseline Projections, 2018-2027
Finance Division Briefing Paper Economic and Revenue Forecast
10
Impact on New York City The Finance Division’s economic and tax forecasts do not assume any local impacts of the TCJA other than those associated with the national economy. However, the law includes several provisions that will affect the city’s residents, economy, and tax revenues. The major impact will result from the limitation on the SALT deduction. Previously, individuals were allowed to fully deduct their state and local property taxes, and either their income or sales tax (but not both).
The TCJA will now cap the amount of the SALT deduction at $10,000. This change will increase federal tax liabilities for the 1.3 million New Yorkers who claimed over $36 billion in SALT benefits in 2015.22 These people will also see increases in the effective cost of their state and city taxes.
High-income New Yorkers will endure most of the burden of the SALT limitation. Because they pay higher state and city taxes, high-income taxpayers tend to receive a disproportionate share of the benefits from SALT deductions. City filers with adjusted gross incomes (AGI) of $200,000 or more deducted an average SALT benefit of $119,100 in 2015, which far exceeds the new $10,000 cap.23
The SALT changes could lead to tax flight. There are some concerns that the cap on the SALT deduction could lead to “tax flight” from the City. Some New Yorkers may be encouraged to move to other areas in search of lower taxes. Finance Division expects this effect to be small, though small effects occurring over long periods can matter.
TCJA’s homeownership-related changes could reduce home values. Apart from the cap on SALT deductions, TCJA makes changes to two other key provisions that encourage homeownership: it limits the mortgage interest deduction to $750,000 from $1 million and eliminates the deduction for home-equity loans. These changes, along with the cap on SALT deductions, are expected to hurt housing prices in areas with high-property taxes, such as New York City. According to Moody’s Analytics, the TCJA provisions would cause home values to decline sharply in 17 counties in New York and New Jersey.24 In Manhattan alone, housing values could drop 10.4 percent from where they would have been without the TCJA.
The 30-day amendments to the New York State Executive Budget contain several proposals designed to reduce the impact of the cap on SALT deduction.25 The Finance Division is reviewing these proposals.
Impact on City Revenues The TCJA will unintentionally increase tax revenues for the City, but does so on the backs of low and middle-income households. Many of the changes included in the TCJA will flow-through to state and city taxes, notably the PIT, due to their conformity to federal tax laws. The Finance Division believes the impact on PIT revenues would be positive for the City, but burdensome on
22 IRS, Statistics of Income Division, Individual Master File System, August 2017. 23 Finance Division calculations based upon personal income tax data. 24 Will Parker, Chava Gourarie, “Tax Overhaul…for Better or Worse”, The Real Deal, January 1, 2018. 25 For more information, please see the report of the New York City Council Committee on Finance for the Committee’s February 26, 2018 hearing.
Finance Division Briefing Paper Economic and Revenue Forecast
11
individual taxpayers. To mitigate against these conformity issues, the State and City would need to pass legislation to decouple from some specific federal laws.
One such change that would need to be addressed is the elimination of the personal and dependent exemption. In order to claim the $8,000 New York State standard deduction available to non-dependent single filers, state law requires that a filer claim at least one of the federal personal and dependent exemptions. With the personal and dependent exemption eliminated at the federal level, state law would regard all single filers as dependents and therefore allow them to claim only $3,000 from the State standard deduction. As a result, approximately 2.4 million New Yorkers would see their State tax liabilities increase by about $210 million. 26
The 30-day amendments to the New York State Executive Budget have several proposals designed to address such conformity issues.27
Risks to Revenue Budget
Risks to the Economic Forecast There are three main risks to the economic forecast, though they are relatively modest:
An overheating economy spurring higher interest rates;
Weakness in the commercial real estate market; and
Wall Street’s exposure to those aforementioned higher interest rates.
The biggest risk to the forecast is the potential for an overheating national economy resulting in higher interest rates.28 TCJA tax cuts are expected to increase spending by consumers and firms in an economy that is at or near full employment. This raises the risk of inflation. The Finance Division’s forecast assumes the Federal Reserve will offset this effect by accelerating the expected increases in the Federal Funds rate. If this is insufficient, and inflation rises, the Federal Reserve may have to “step on the brakes” by rapidly raising interest rates. While this may slow inflation, it will also dampen economic output and increase unemployment. This is a risk for the later part of the Financial Plan.
While having recently seen a recent run up in prices, the commercial real estate market is showing signs of weakness.29 This is most notably apparent in the retail sector, and there is reasonable concern that the rising interest rates discussed above may push prices down. Should the market continue to weaken, it will reduce construction, GDP growth, and employment.
The City’s economic and tax revenue forecasts depend on the national forecast and share the same risks. An additional risk unique to the City comes from Wall Street banks’ exposure to higher interest rates. Income from Wall Street remains important to both the City’s economy and its tax revenue. Rising interest rates decrease the value of existing bonds and may cause losses for the
26 Council Finance estimate using data from the State Department of Taxation and Finance, and the Internal Revenue Services. 27 For more information, please see the report of the New York City Council Committee on Finance for the Committee’s February 26, 2018 hearing. 28 William C Dudley, “The Outlook for the U.S. Economy in 2018 and Beyond”, Speech before the Securities Industry and Financial Markets Association, New York City, January 11, 2018. 29 IHS Market, “US Executive Summary” January 2018.
Finance Division Briefing Paper Economic and Revenue Forecast
12
City’s banks.30 This is especially true if interest rates rise faster than expected. This could impact the real estate market, employment, and revenues from the personal income tax, business tax, and transfer tax. The uncertainty in the bond market appears to be frightening equity investors, as indicated by recent steep declines in the stock market.31
Risks to Revenue Forecast Risks to the revenue forecast generally follow from the risks to the economy. However, a significant self-imposed risk is the City’s unrealistic expectation of taxi medallion sale revenues. As in prior years, the Fiscal 2019 Preliminary Budget contains substantial funds from the sales of taxi medallions. The Financial Plan assumes sales of $107 million in Fiscal 2019, $257 million in Fiscal 2020, $367 million in Fiscal 2021 and $198 million in Fiscal 2022. These estimates remain unchanged from the 2017 November Plan. Given the continued weakness in the medallion market, it seems unlikely that these revenues will be received by the City.
Policy Risks
New York State The Fiscal 2018-2019 New York State Executive Budget contains a mix of unfunded mandates, shortfalls in meeting obligations of Campaign for Fiscal Equity funding, and misallocations of federal Disproportionate Share Hospital Payments, which could leave the City short millions compared to the expectations in the City’s Fiscal 2018 Preliminary Budget.32
In addition to the above risks, there are two significant state risks to the City’s tax revenues:
MTA Value Capture. A provision in the Executive Budget would allow the Metropolitan Transportation Authority (MTA) to capture up to 75 percent of new revenue from increased real estate tax receipts within one mile of large MTA capital projects. MTA would be collecting property taxes on New York City’s core business district in Midtown, as well as the Upper East and Upper West Sides. The proposal includes existing projects and property taxes already accounted for in the City’s Financial Plan.
Independent Democratic Conference’s Rider Relief Plan. A bill introduced in the State Senate, S.7658, would divert $428 million of New York City sales tax revenue to fund Phase 1 of the MTA's emergency repair plan.
Federal Government A positive step on the federal level is that the Bipartisan Budget Act of 2018 increases the cap on non-defense discretionary spending by $63 billion in federal Fiscal 2018 and $68 billion in federal Fiscal 2019. It also extends direct spending on several health programs, provides a few narrow
30 Nicole Gelinas, “Good Times for America Mean Trouble for New York City” New York Post,, February 5, 2018 31 Matt Egan “Dow plunges 1,033 points and sinks into correction” http://money.cnn.com/2018/02/08/investing/dow-jones-stock-market/index.html 32 Khurshid, Samar. "Under 'Threat' From D.C. And Albany, De Blasio Presents $88.67 Billion Preliminary Budget." Gotham Gazette. 2018. http://www.gothamgazette.com/city/7455-under-threat-from-dc-and-albany-de-blasio-presents-88-67-billion-preliminary-budget
Finance Division Briefing Paper Economic and Revenue Forecast
13
tax breaks, and raises the cap on non-defense appropriations. However, adjusted for inflation, this new cap in 2018 would still be 5.3 percent below the comparable 2010 level.33
Despite this, risks to federal aid remain substantial, especially in the outyears of the Financial Plan.
The Fiscal 2019 Executive Budget of the United States includes major cuts, while at the same time reluctantly accepting the spending increases of the Bipartisan Budget Act. Its priorities fit in with the general pattern of the Trump Administration, focusing on tax cuts for the wealthy and benefit cuts for working families and the poor. Two examples that would have a substantial impact on the City include:
Funding for the New York City Housing Authority (NYCHA). The Executive Budget proposes a 14 percent reduction in the budget of the Department of Housing and Urban Development, including major reductions in Section 8 vouchers and funding for public housing programs. NYCHA believes this could result in a loss of $346 million in capital funding, approximately $330 to $466 million in operating funds, and 9,853 vouchers, resulting in a $124 million budget shortfall.34
Social Service Block Grants (SSBG). The President’s Executive Budget eliminates these grants, which provide funding for services such as childcare, day programs for seniors, and services for the homeless.
As evidenced by the Bipartisan Budget Act, done with minimal input from the Executive Branch, Congress dominates the budget process.35 Thus, the Executive Budget is highly unlikely to be enacted as proposed, although the priorities it reflects remain prevalent in Washington, and therefore may be reflected in future budget legislation. These federal priorities remain a risk to both the City’s budget and to the wellbeing of the city’s residents. The federal risk will only become more important in the outyears of the City’s Financial Plan as deficits from the TCJA, and their resulting impacts, are realized.
33 David Reich, “Non-Defense Discretionary Funding Increases Under Bipartisan Deal Yet Remains Below Earlier Levels” https://www.cbpp.org/blog/non-defense-discretionary-funding-increases-under-bipartisan-deal-yet-remains-below-earlier 34 Statement from NYCHA Chair and CEO Shola Olatoye on the President’s Budget, http://www1.nyc.gov/assets/nycha/downloads/pdf/chair-shola-olatoye-on-the-presidents-budget.pdf 35 http://nymag.com/daily/intelligencer/2018/02/4-reasons-to-ignore-trumps-budget.html
Finance Division Briefing Paper Economic and Revenue Forecast
14
Appendices
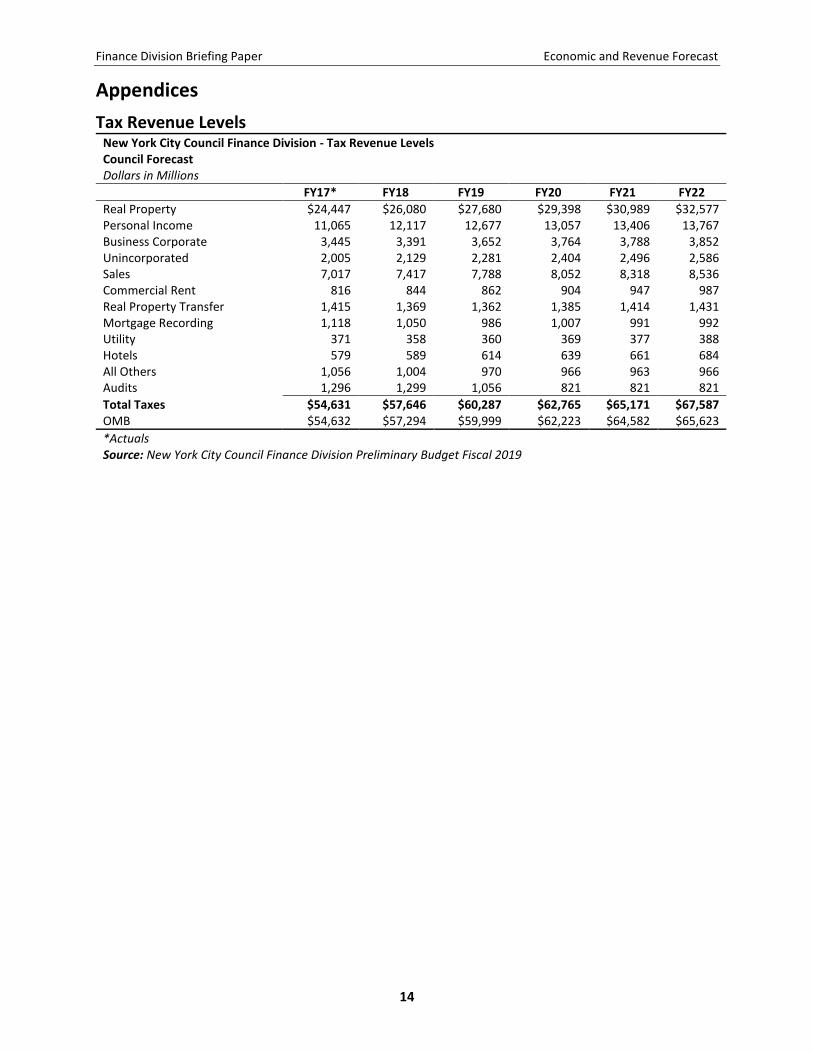
Tax Revenue Levels New York City Council Finance Division - Tax Revenue Levels Council Forecast Dollars in Millions
FY17* FY18 FY19 FY20 FY21 FY22
Real Property $24,447 $26,080 $27,680 $29,398 $30,989 $32,577 Personal Income 11,065 12,117 12,677 13,057 13,406 13,767 Business Corporate 3,445 3,391 3,652 3,764 3,788 3,852 Unincorporated 2,005 2,129 2,281 2,404 2,496 2,586 Sales 7,017 7,417 7,788 8,052 8,318 8,536 Commercial Rent 816 844 862 904 947 987 Real Property Transfer 1,415 1,369 1,362 1,385 1,414 1,431 Mortgage Recording 1,118 1,050 986 1,007 991 992 Utility 371 358 360 369 377 388 Hotels 579 589 614 639 661 684 All Others 1,056 1,004 970 966 963 966 Audits 1,296 1,299 1,056 821 821 821
Total Taxes $54,631 $57,646 $60,287 $62,765 $65,171 $67,587 OMB $54,632 $57,294 $59,999 $62,223 $64,582 $65,623
*Actuals
Source: New York City Council Finance Division Preliminary Budget Fiscal 2019
Finance Division Briefing Paper Economic and Revenue Forecast
15
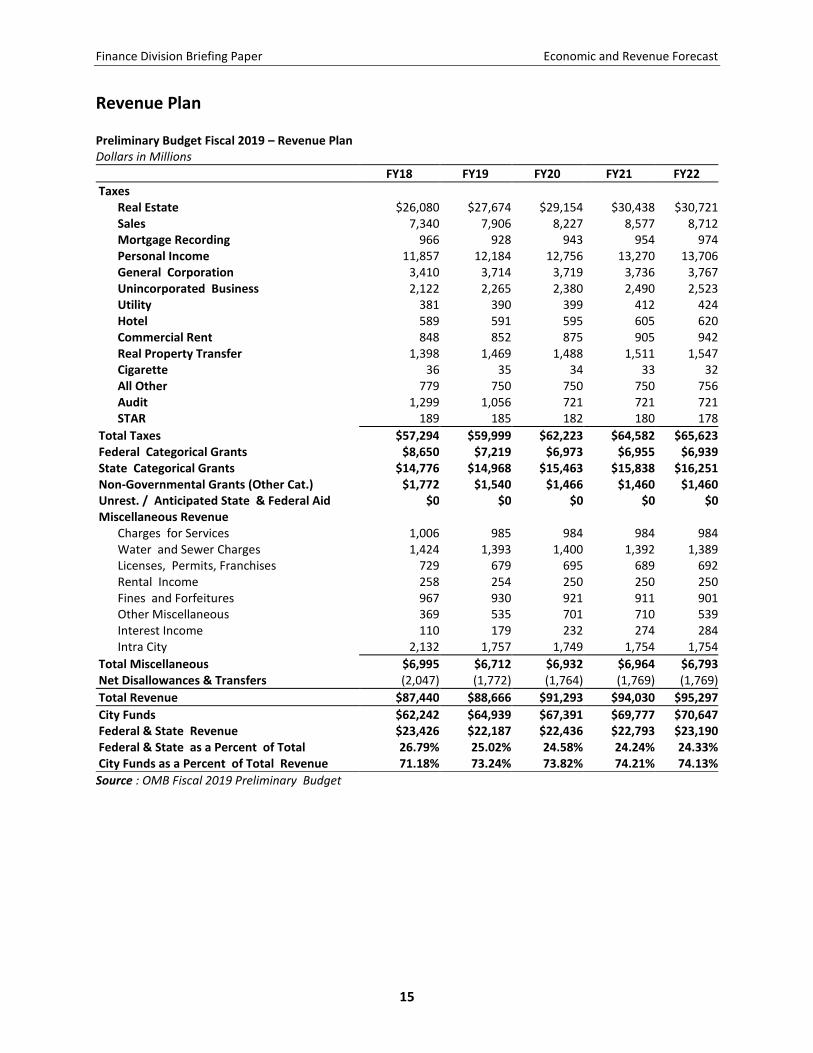
Revenue Plan
Preliminary Budget Fiscal 2019 – Revenue Plan Dollars in Millions
FY18 FY19 FY20 FY21 FY22
Taxes Real Estate $26,080 $27,674 $29,154 $30,438 $30,721 Sales 7,340 7,906 8,227 8,577 8,712 Mortgage Recording 966 928 943 954 974 Personal Income 11,857 12,184 12,756 13,270 13,706 General Corporation 3,410 3,714 3,719 3,736 3,767 Unincorporated Business 2,122 2,265 2,380 2,490 2,523 Utility 381 390 399 412 424 Hotel 589 591 595 605 620 Commercial Rent 848 852 875 905 942 Real Property Transfer 1,398 1,469 1,488 1,511 1,547 Cigarette 36 35 34 33 32 All Other 779 750 750 750 756 Audit 1,299 1,056 721 721 721 STAR 189 185 182 180 178
Total Taxes $57,294 $59,999 $62,223 $64,582 $65,623 Federal Categorical Grants $8,650 $7,219 $6,973 $6,955 $6,939 State Categorical Grants $14,776 $14,968 $15,463 $15,838 $16,251 Non-Governmental Grants (Other Cat.) $1,772 $1,540 $1,466 $1,460 $1,460 Unrest. / Anticipated State & Federal Aid $0 $0 $0 $0 $0 Miscellaneous Revenue
Charges for Services 1,006 985 984 984 984 Water and Sewer Charges 1,424 1,393 1,400 1,392 1,389 Licenses, Permits, Franchises 729 679 695 689 692 Rental Income 258 254 250 250 250 Fines and Forfeitures 967 930 921 911 901 Other Miscellaneous 369 535 701 710 539 Interest Income 110 179 232 274 284 Intra City 2,132 1,757 1,749 1,754 1,754
Total Miscellaneous $6,995 $6,712 $6,932 $6,964 $6,793 Net Disallowances & Transfers (2,047) (1,772) (1,764) (1,769) (1,769)
Total Revenue $87,440 $88,666 $91,293 $94,030 $95,297
City Funds $62,242 $64,939 $67,391 $69,777 $70,647 Federal & State Revenue $23,426 $22,187 $22,436 $22,793 $23,190 Federal & State as a Percent of Total 26.79% 25.02% 24.58% 24.24% 24.33% City Funds as a Percent of Total Revenue 71.18% 73.24% 73.82% 74.21% 74.13%
Source : OMB Fiscal 2019 Preliminary Budget
Finance Division Briefing Paper Economic and Revenue Forecast
16
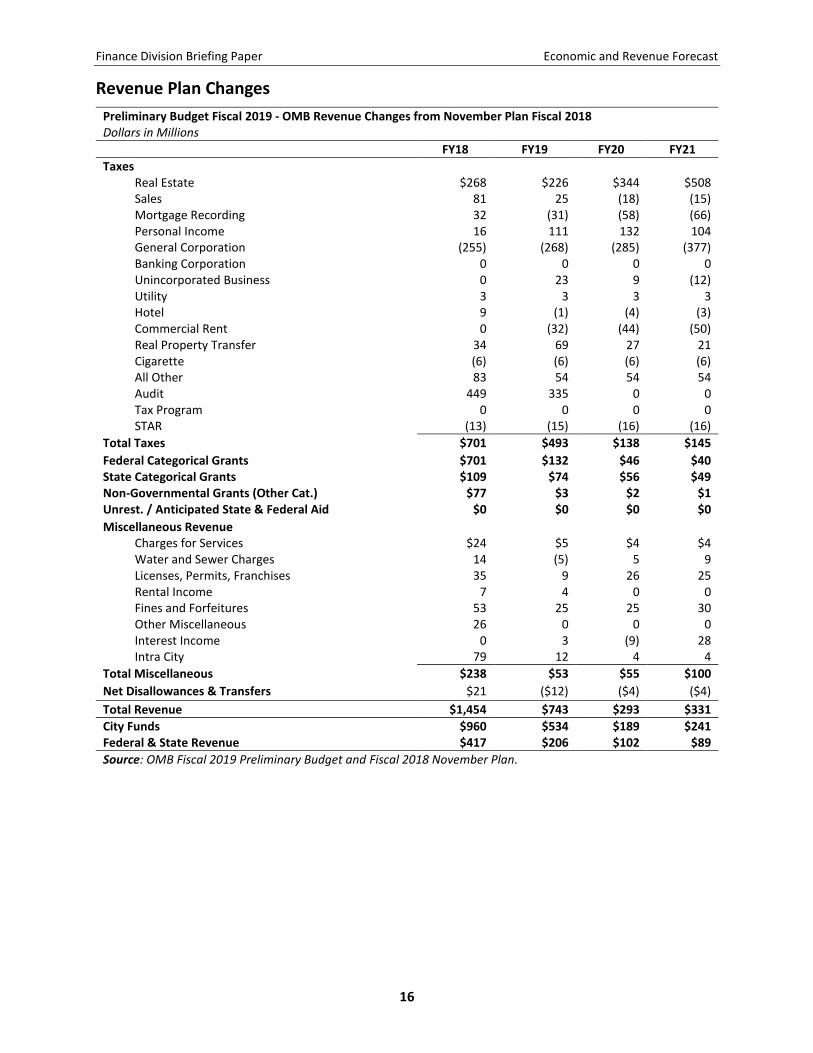
Revenue Plan Changes
Preliminary Budget Fiscal 2019 - OMB Revenue Changes from November Plan Fiscal 2018 Dollars in Millions
FY18 FY19 FY20 FY21
Taxes Real Estate $268 $226 $344 $508
Sales 81 25 (18) (15)
Mortgage Recording 32 (31) (58) (66)
Personal Income 16 111 132 104
General Corporation (255) (268) (285) (377)
Banking Corporation 0 0 0 0
Unincorporated Business 0 23 9 (12)
Utility 3 3 3 3
Hotel 9 (1) (4) (3)
Commercial Rent 0 (32) (44) (50)
Real Property Transfer 34 69 27 21
Cigarette (6) (6) (6) (6)
All Other 83 54 54 54
Audit 449 335 0 0
Tax Program 0 0 0 0
STAR (13) (15) (16) (16)
Total Taxes $701 $493 $138 $145 Federal Categorical Grants $701 $132 $46 $40 State Categorical Grants $109 $74 $56 $49 Non-Governmental Grants (Other Cat.) $77 $3 $2 $1 Unrest. / Anticipated State & Federal Aid $0 $0 $0 $0 Miscellaneous Revenue Charges for Services $24 $5 $4 $4
Water and Sewer Charges 14 (5) 5 9
Licenses, Permits, Franchises 35 9 26 25
Rental Income 7 4 0 0
Fines and Forfeitures 53 25 25 30
Other Miscellaneous 26 0 0 0
Interest Income 0 3 (9) 28
Intra City 79 12 4 4
Total Miscellaneous $238 $53 $55 $100 Net Disallowances & Transfers $21 ($12) ($4) ($4) Total Revenue $1,454 $743 $293 $331
City Funds $960 $534 $189 $241 Federal & State Revenue $417 $206 $102 $89
Source: OMB Fiscal 2019 Preliminary Budget and Fiscal 2018 November Plan.