Embed Size (px)
Citation preview
FY09-10 Annual IT SurveyFY09-10 Annual IT Survey
AASHTO Subcommittee onAASHTO Subcommittee on Information Systems
Helena MontanaHelena, MontanaMay 2010
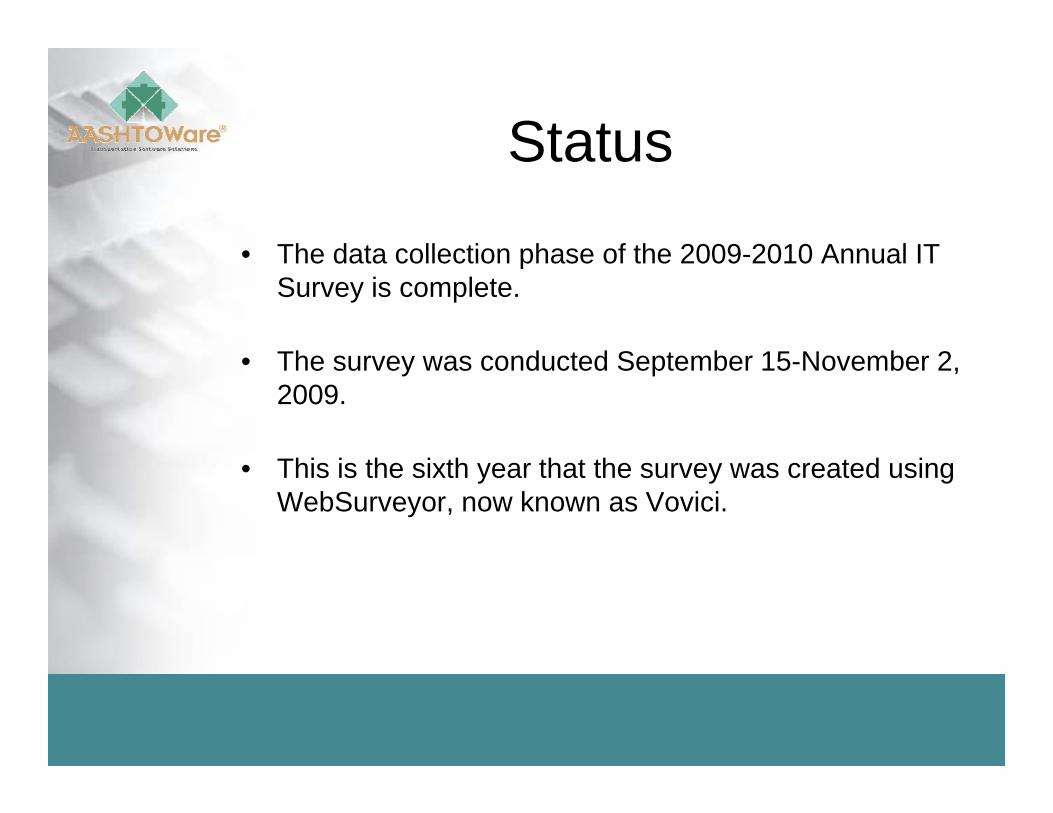
StatusStatus
• The data collection phase of the 2009 2010 Annual IT• The data collection phase of the 2009-2010 Annual IT Survey is complete.
Th d t d S t b 15 N b 2• The survey was conducted September 15-November 2, 2009.
Thi i h i h h h d i• This is the sixth year that the survey was created using WebSurveyor, now known as Vovici.
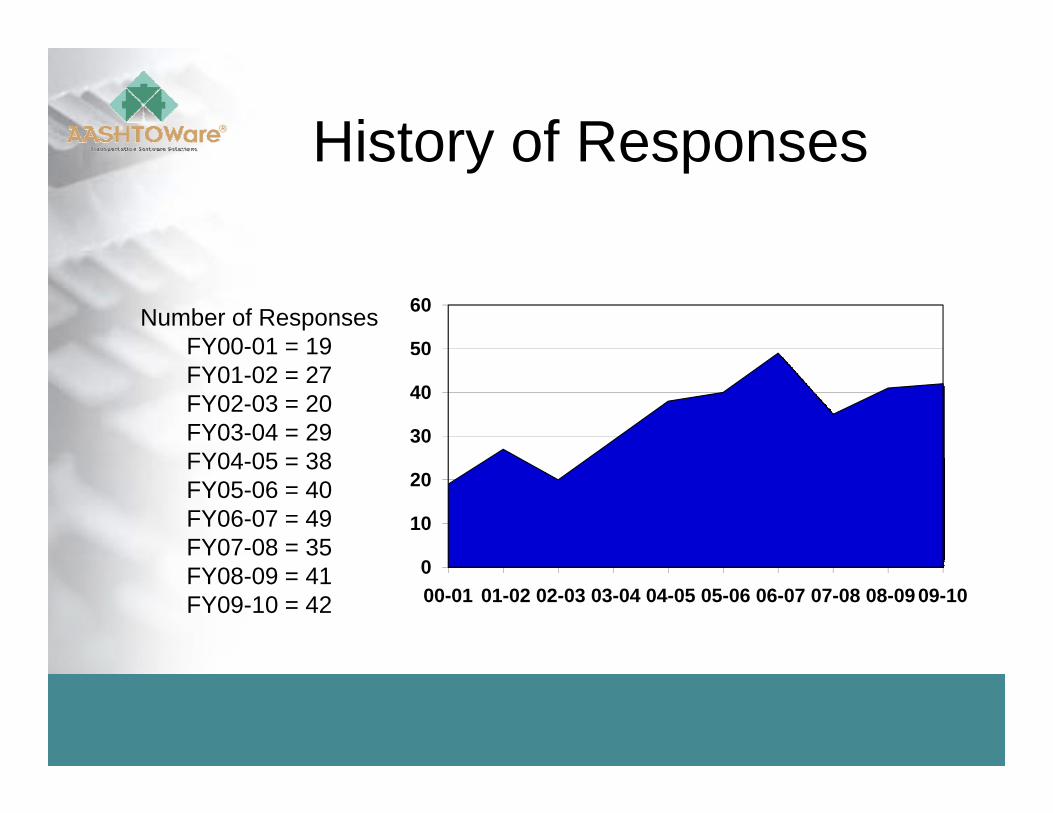
History of ResponsesHistory of Responses
Number of ResponsesFY00-01 = 19 50
60
FY01-02 = 27FY02-03 = 20FY03-04 = 29FY04 05 = 38
30
40
FY04-05 = 38FY05-06 = 40FY06-07 = 49FY07-08 = 35
0
10
20
FY08-09 = 41FY09-10 = 42
000-01 01-02 02-03 03-04 04-05 05-06 06-07 07-08 08-09 09-10
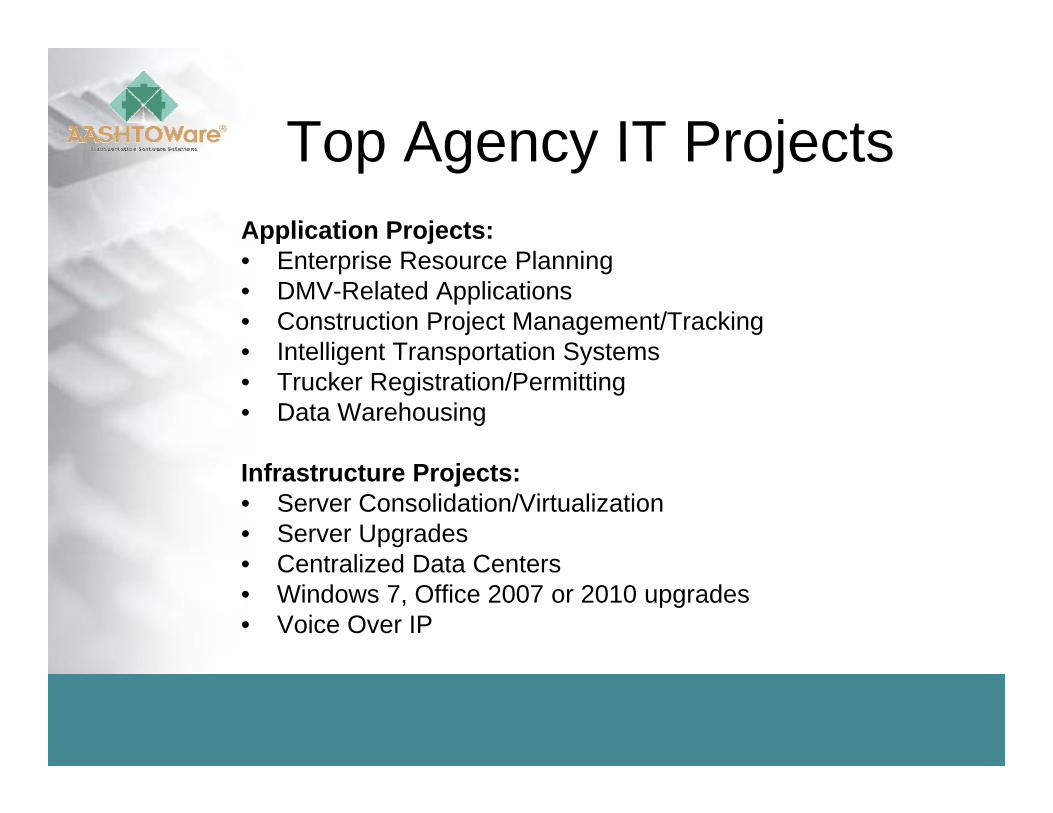
Top Agency IT ProjectsTop Agency IT ProjectsApplication Projects:
E t i R Pl i• Enterprise Resource Planning• DMV-Related Applications• Construction Project Management/Tracking• Intelligent Transportation SystemsIntelligent Transportation Systems• Trucker Registration/Permitting• Data Warehousing
Infrastructure Projects:• Server Consolidation/Virtualization• Server Upgrades• Centralized Data Centers• Centralized Data Centers• Windows 7, Office 2007 or 2010 upgrades• Voice Over IP
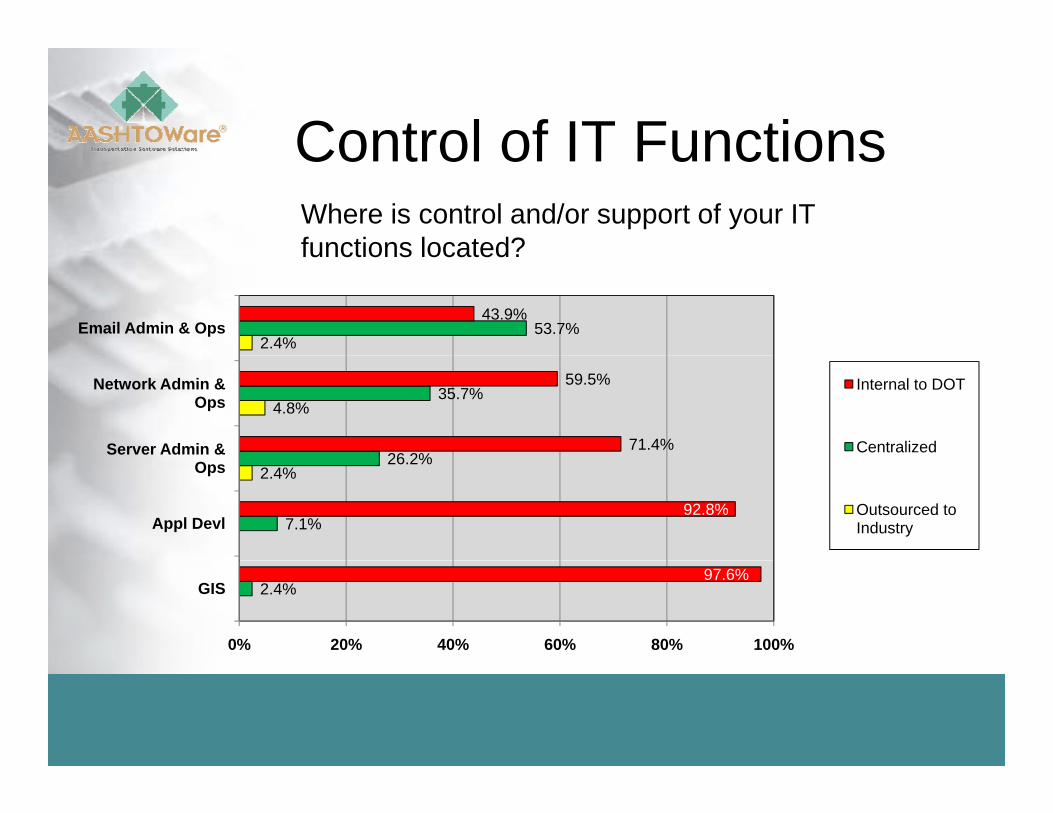
Control of IT FunctionsControl of IT FunctionsWhere is control and/or support of your IT functions located?functions located?
2.4%53.7%
43.9%Email Admin & Ops
4.8%
26 2%
35.7%
71.4%
59.5%
Server Admin &
Network Admin & Ops
Internal to DOT
Centralized2.4%
7.1%
26.2%
92.8%Appl Devl
Ops
Outsourced to Industry
2.4%97.6%
0% 20% 40% 60% 80% 100%
GIS
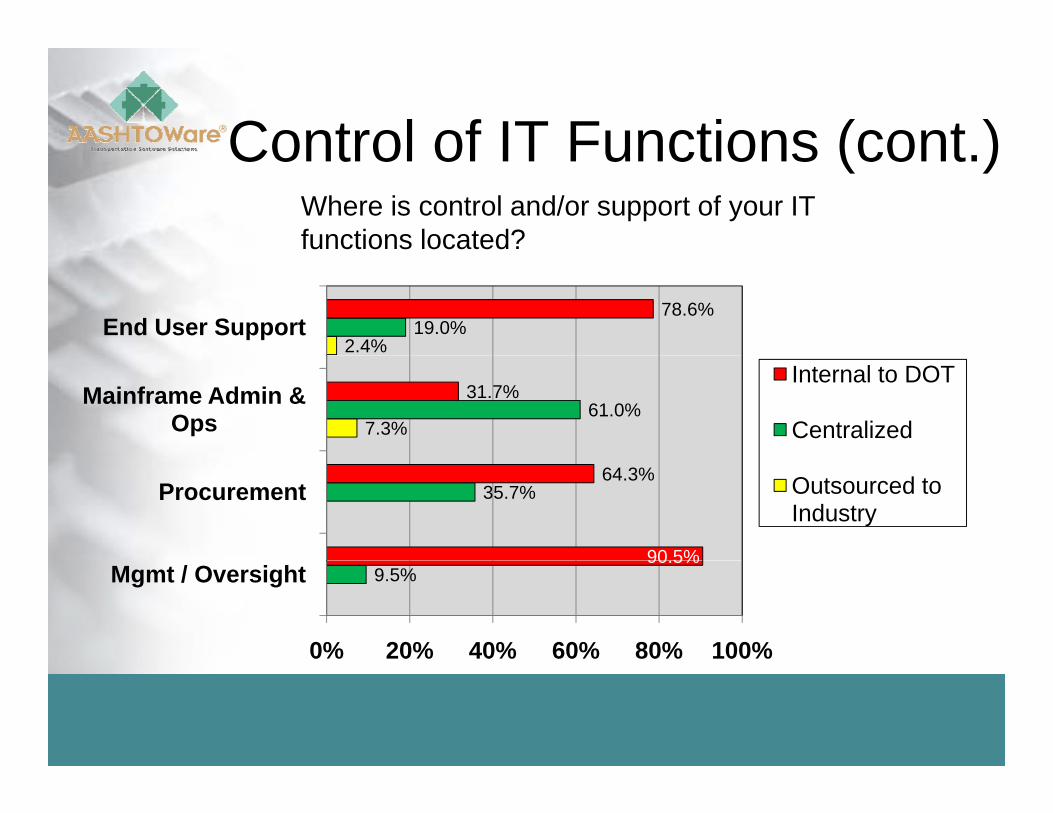
Control of IT Functions (cont )Control of IT Functions (cont.)Where is control and/or support of your IT functions located?
2.4%19.0%
78.6%End User Support
7.3%61.0%
31.7%Mainframe Admin & Ops
Internal to DOT
Centralized
35.7%
90 5%
64.3%Procurement Outsourced to
Industry
9.5%90.5%
0% 20% 40% 60% 80% 100%
Mgmt / Oversight
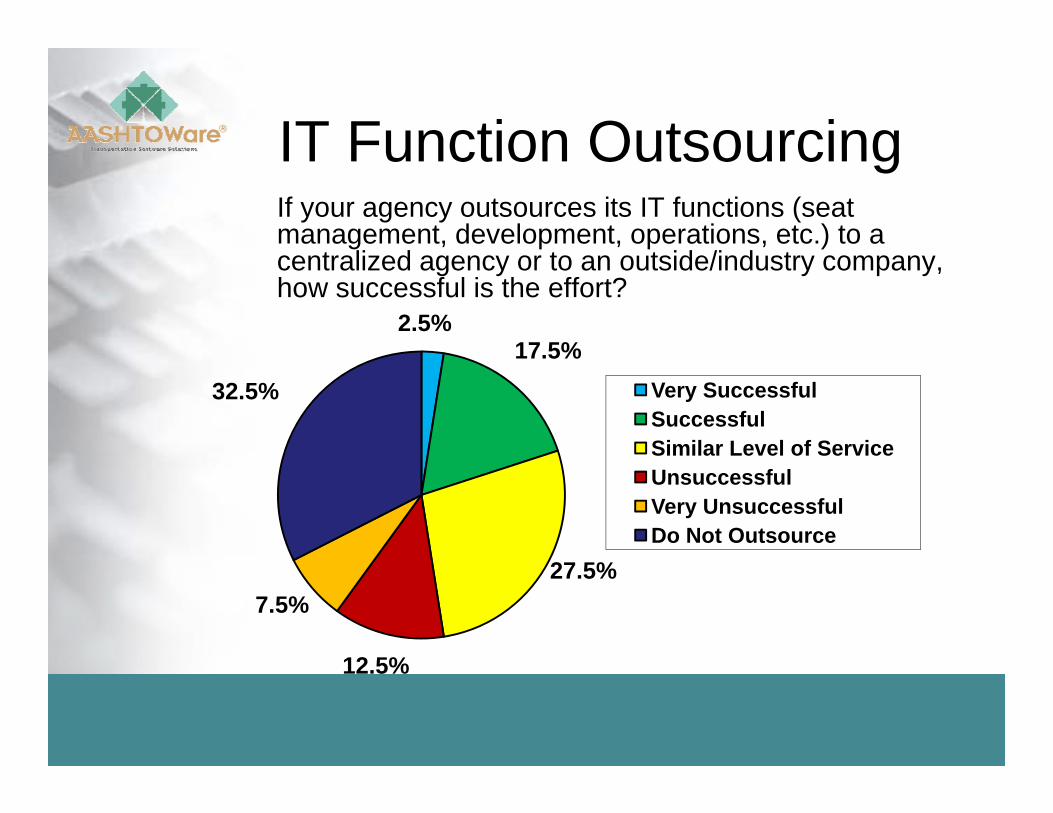
IT Function OutsourcingIT Function OutsourcingIf your agency outsources its IT functions (seat management, development, operations, etc.) to a
t li d t t id /i d tcentralized agency or to an outside/industry company, how successful is the effort?
2.5%17.5%17.5%
32.5% Very SuccessfulSuccessfulSimilar Level of ServiceUnsuccessfulVery UnsuccessfulDo Not Outsource
27.5%
12 5%
7.5%
12.5%
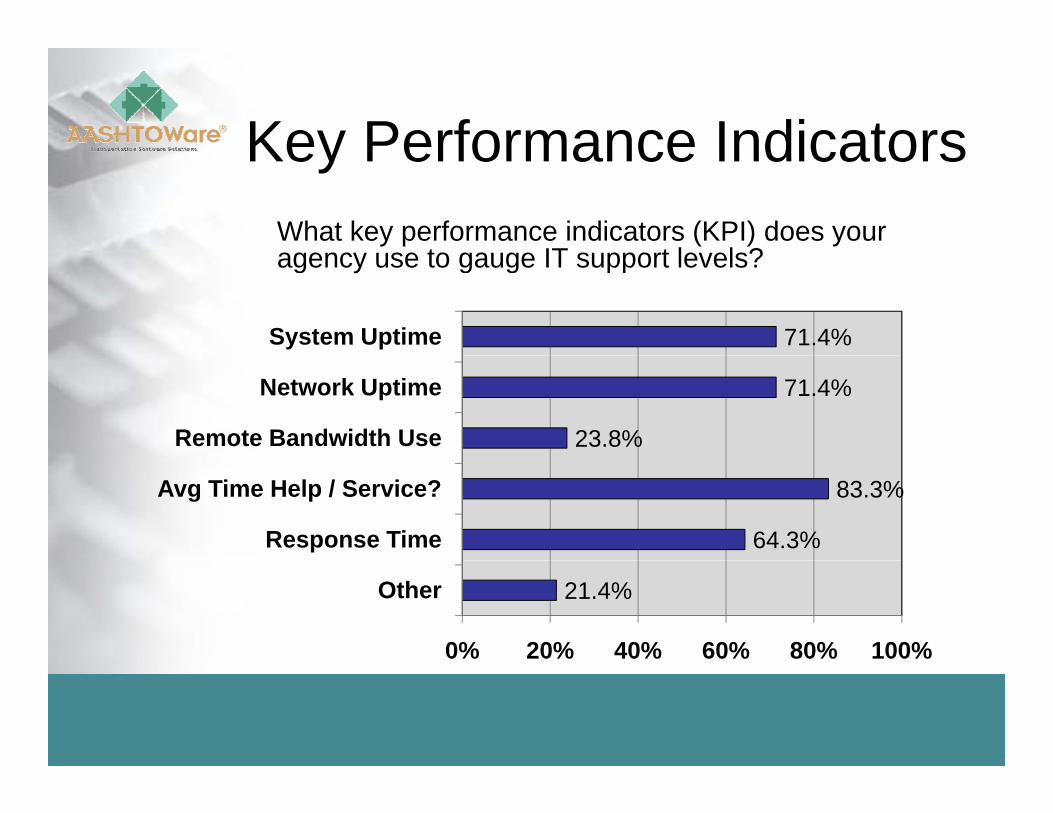
Key Performance IndicatorsKey Performance IndicatorsWhat key performance indicators (KPI) does your agenc se to ga ge IT s pport le els?agency use to gauge IT support levels?
71.4%System Uptime
23.8%
71.4%
Remote Bandwidth Use
Network Uptime
64.3%
83.3%
Response Time
Avg Time Help / Service?
21.4%
0% 20% 40% 60% 80% 100%
Other
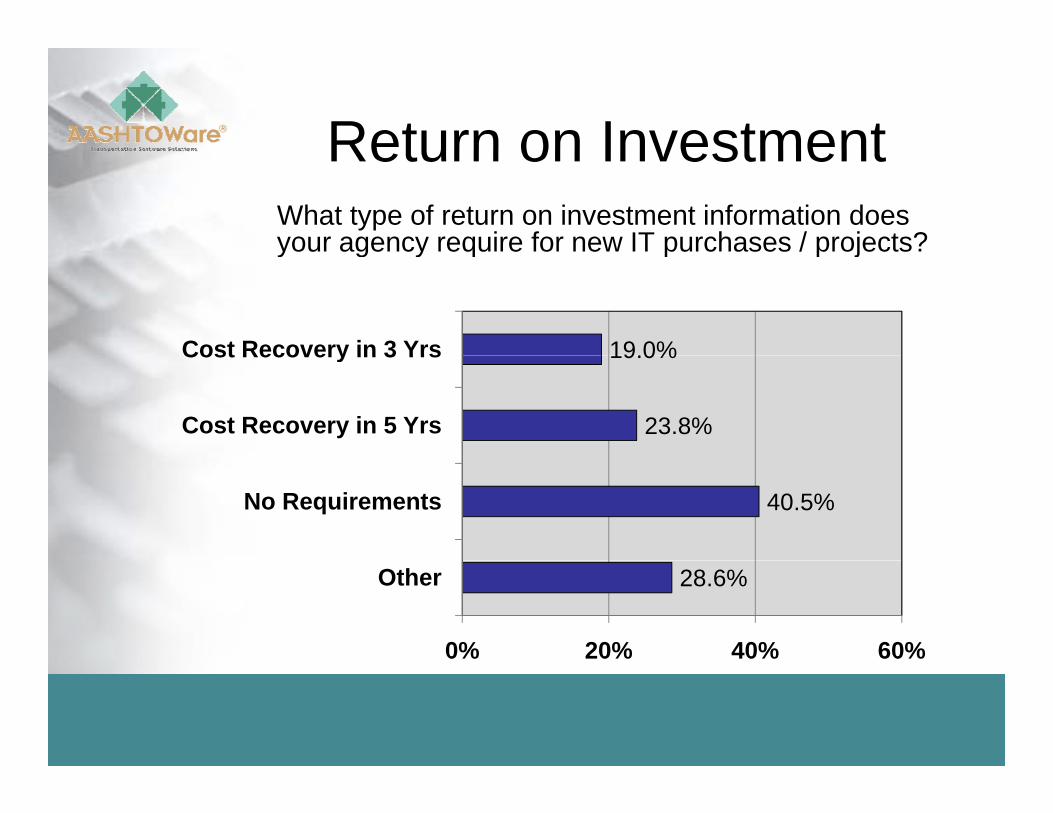
Return on InvestmentReturn on InvestmentWhat type of return on investment information does your agency require for new IT purchases / projects?y g y q p p j
19 0%Cost Recovery in 3 Yrs
23.8%
19.0%
Cost Recovery in 5 Yrs
Cost Recovery in 3 Yrs
40.5%No Requirements
28.6%
0% 20% 40% 60%
Other
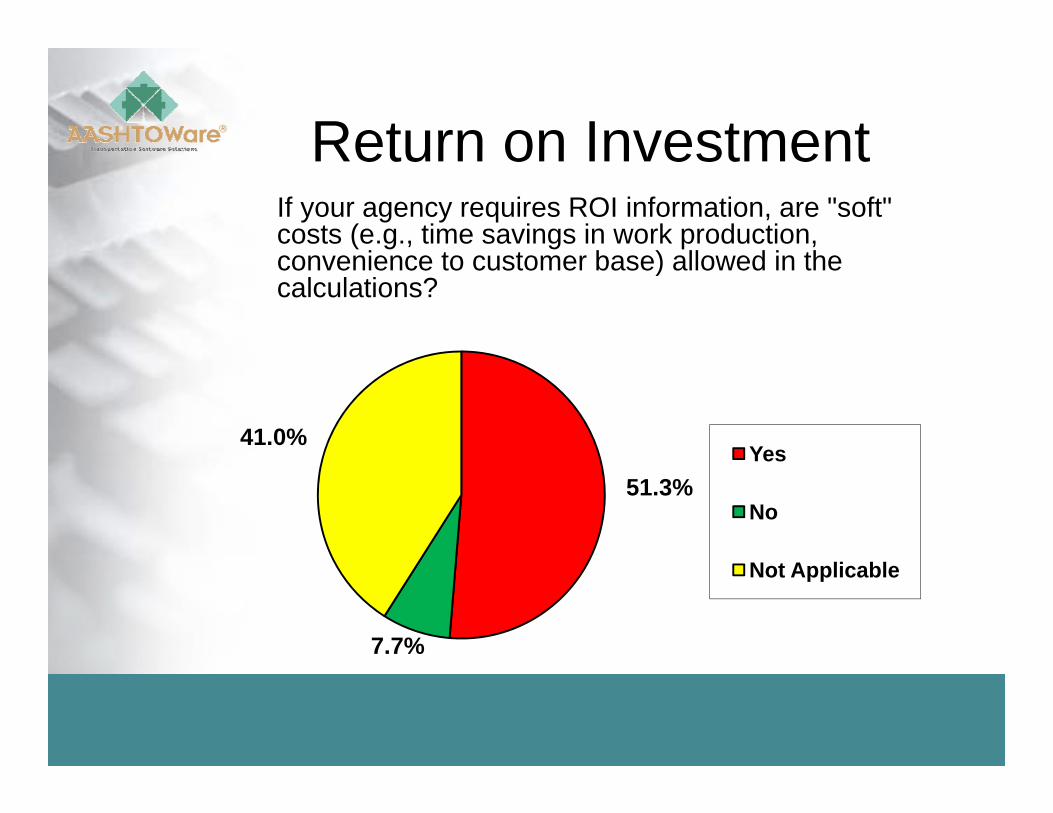
Return on InvestmentReturn on InvestmentIf your agency requires ROI information, are "soft" costs (e.g., time savings in work production,
i t t b ) ll d i thconvenience to customer base) allowed in the calculations?
41.0%Yes
51.3%Yes
No
7.7%
Not Applicable
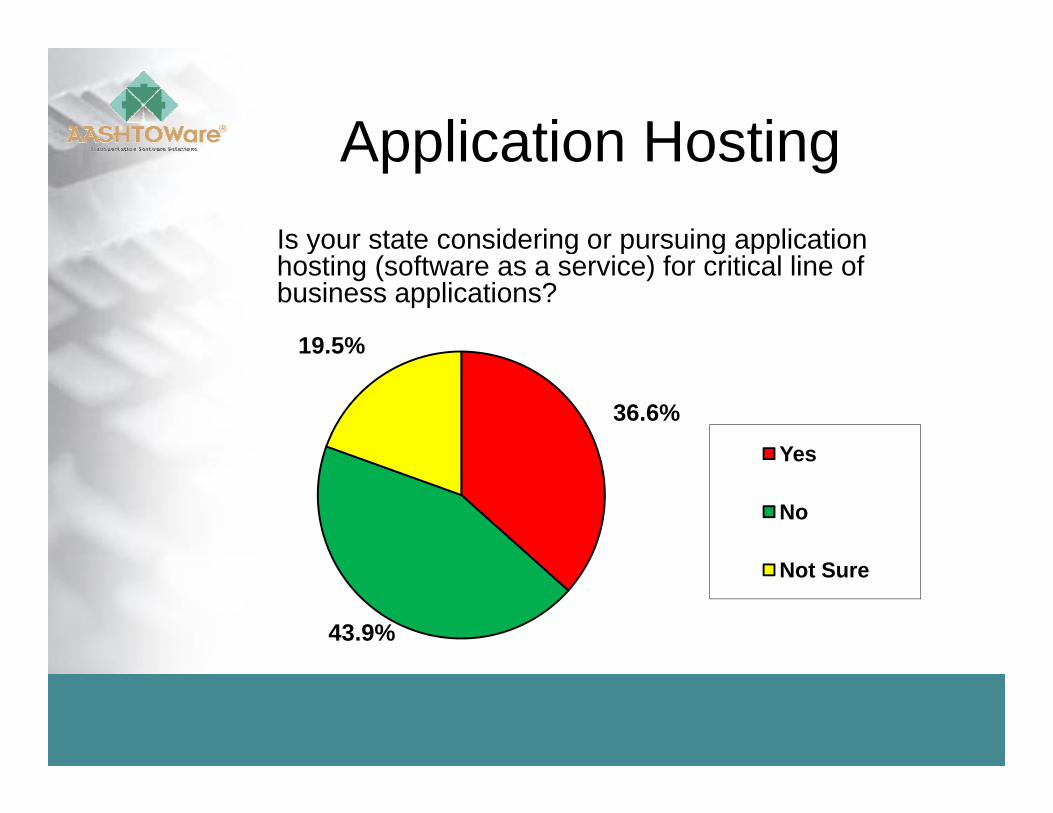
Application HostingApplication HostingIs your state considering or pursuing application y g p g pphosting (software as a service) for critical line of business applications?
19.5%
36.6%YesYes
No
43.9%
Not Sure
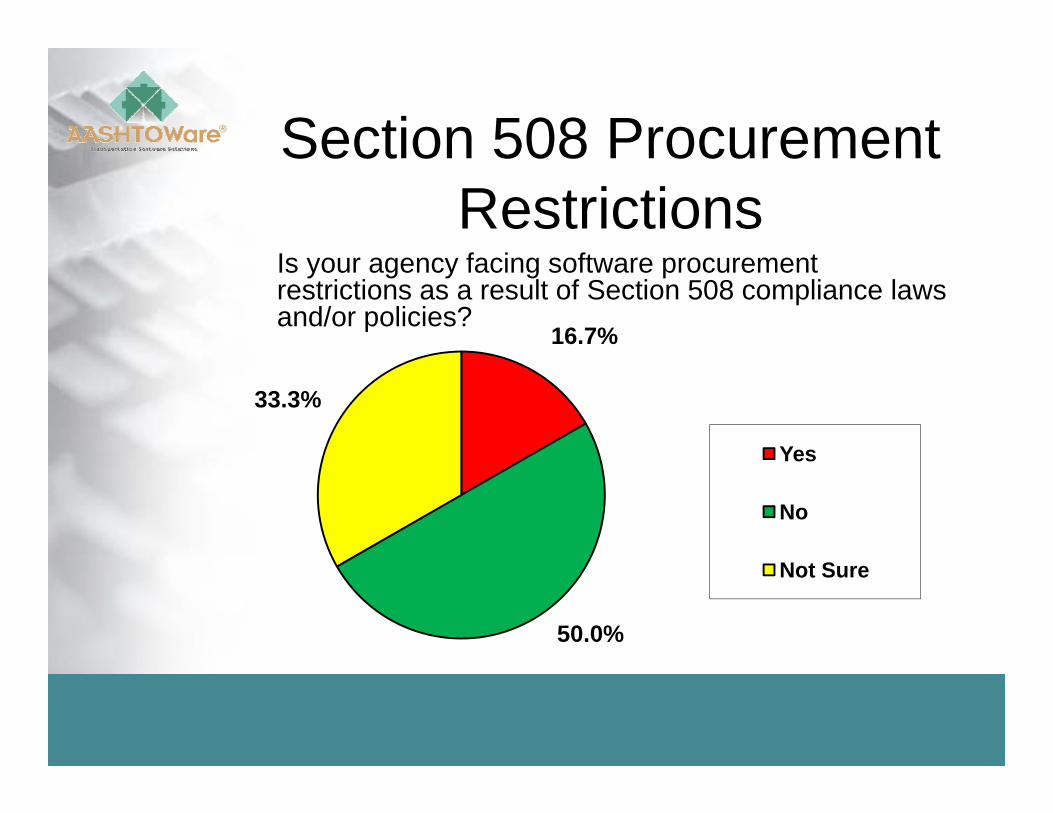
Section 508 ProcurementSection 508 Procurement Restrictions
I f i fIs your agency facing software procurement restrictions as a result of Section 508 compliance laws and/or policies?
16.7%
33.3%
YesYes
No
50.0%
Not Sure
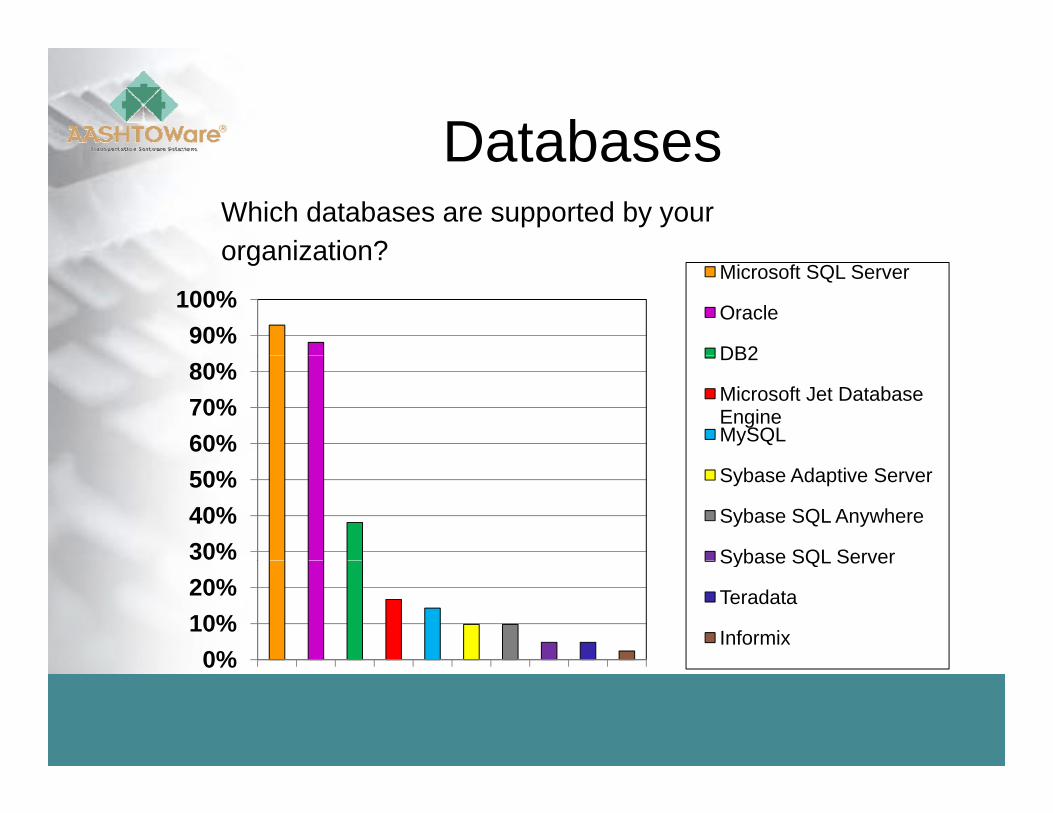
DatabasesDatabasesWhich databases are supported by your organization?organization?
90%100%
Microsoft SQL Server
Oracle
DB2
60%70%80%
DB2
Microsoft Jet Database EngineMySQL
30%40%50% Sybase Adaptive Server
Sybase SQL Anywhere
Sybase SQL Server
0%10%20%
Sybase SQL Server
Teradata
Informix0%

DatabasesDatabasesWhich databases are preferred by your
i ti ?organization?
80%90% Oracle
50%60%70%80%
Microsoft SQL Server
DB2
20%30%40%50%
MySQL
Teradata
0%10%20%
Microsoft Jet Database
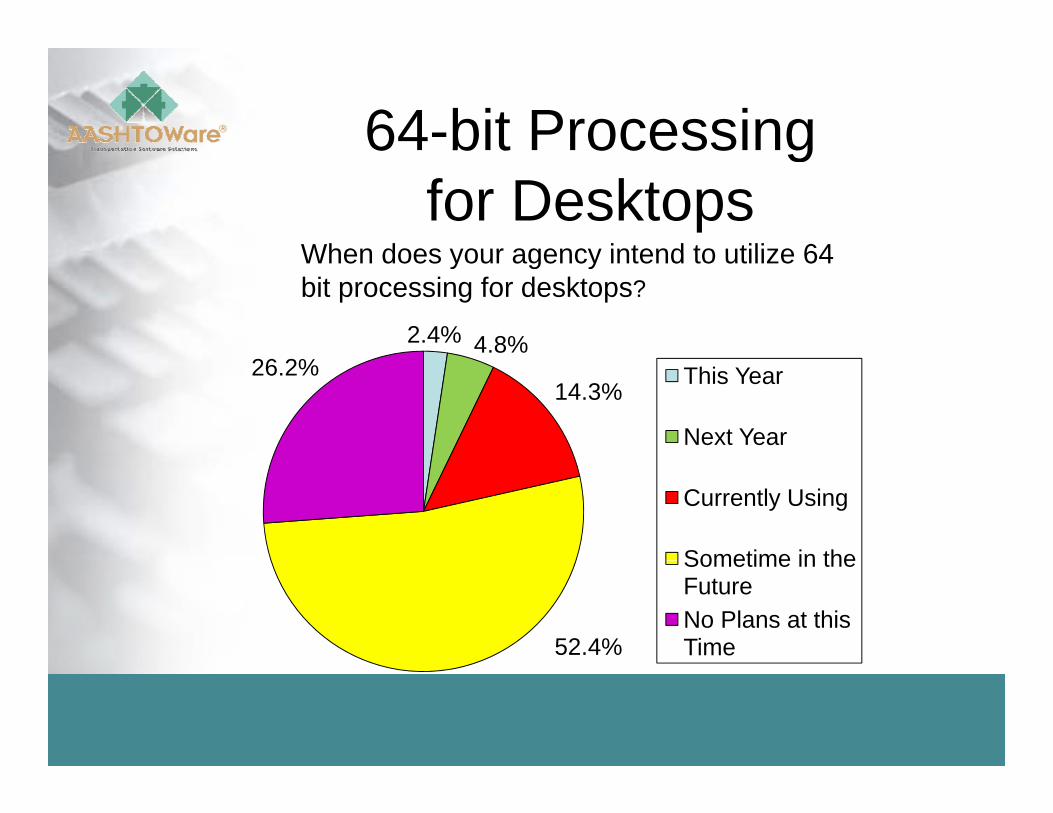
64-bit Processing6 b t ocess gfor Desktops
When does your agency intend to utilize 64When does your agency intend to utilize 64 bit processing for desktops?
2.4% 4.8%
14.3%26.2% This Year
Next Year
Currently Using
Sometime in the
52.4%
Sometime in the FutureNo Plans at this Time
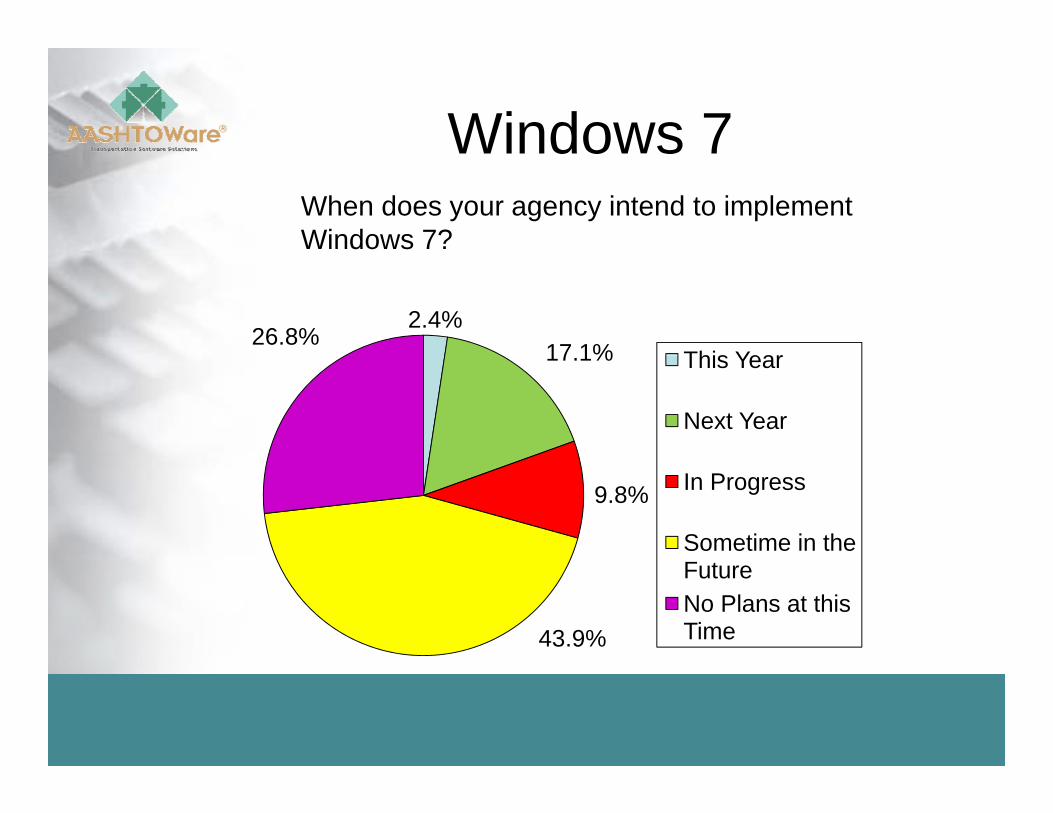
Windows 7Windows 7When does your agency intend to implement Windows 7?
2.4%17 1%
26.8%This Year17.1% This Year
Next Year
9.8% In Progress
Sometime in the
43.9%
FutureNo Plans at this Time
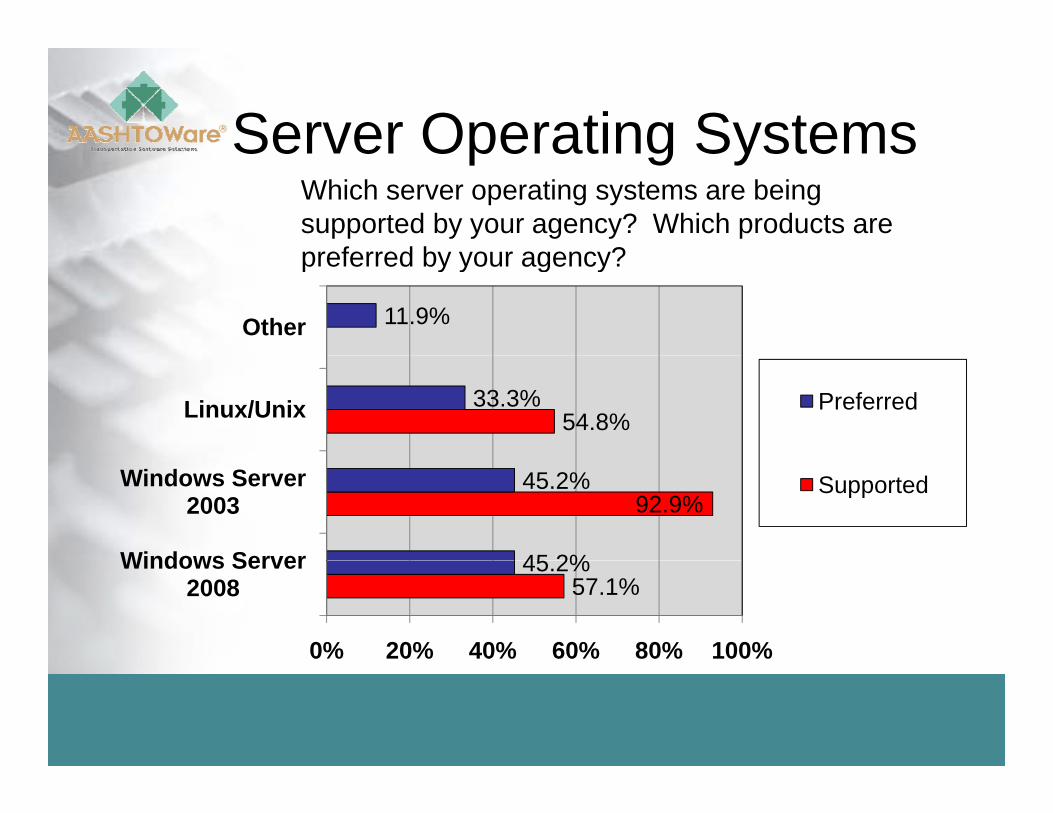
Server Operating SystemsServer Operating SystemsWhich server operating systems are being supported by your agency? Which products are preferred by your agency?preferred by your agency?
11.9%Other
54.8%33.3%Linux/Unix Preferred
92.9%
45 2%
45.2%
Windows Server
Windows Server 2003
Supported
57.1%45.2%
0% 20% 40% 60% 80% 100%
Windows Server 2008
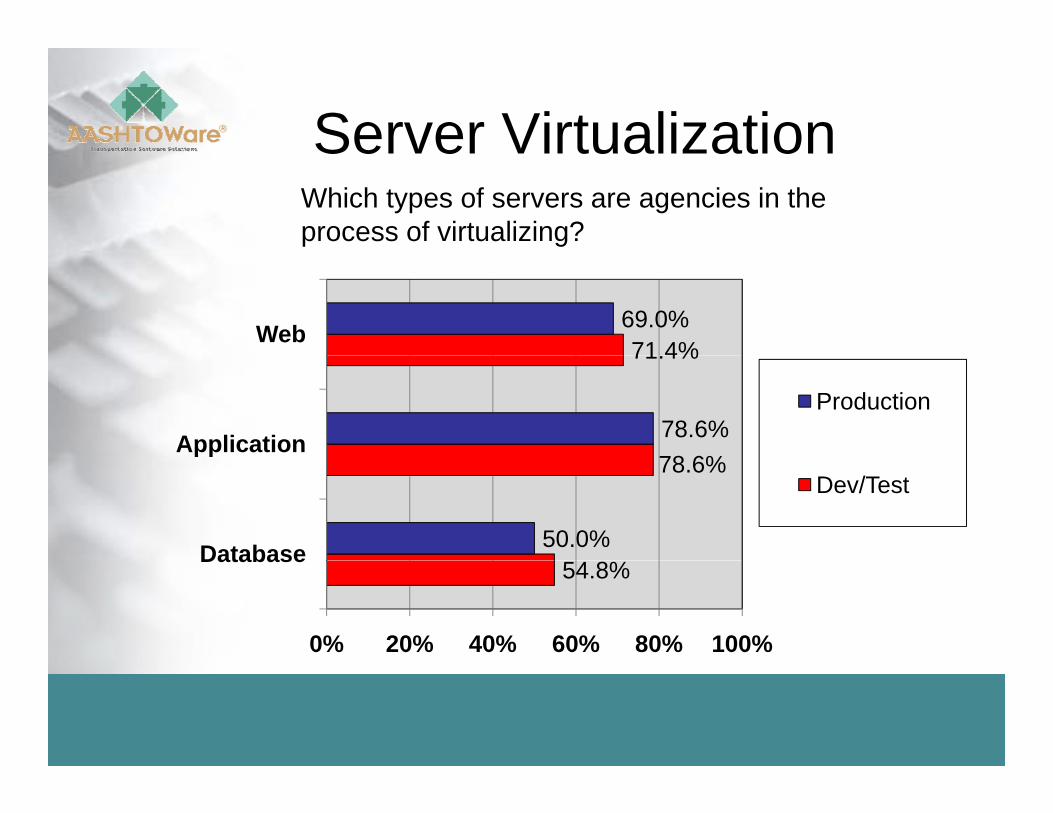
Server VirtualizationServer VirtualizationWhich types of servers are agencies in the process of virtualizing?
71 4%69.0%Web
78 6%
71.4%
78.6%Application
Production
78.6%
50.0%Database
Dev/Test
54.8%
0% 20% 40% 60% 80% 100%
Database
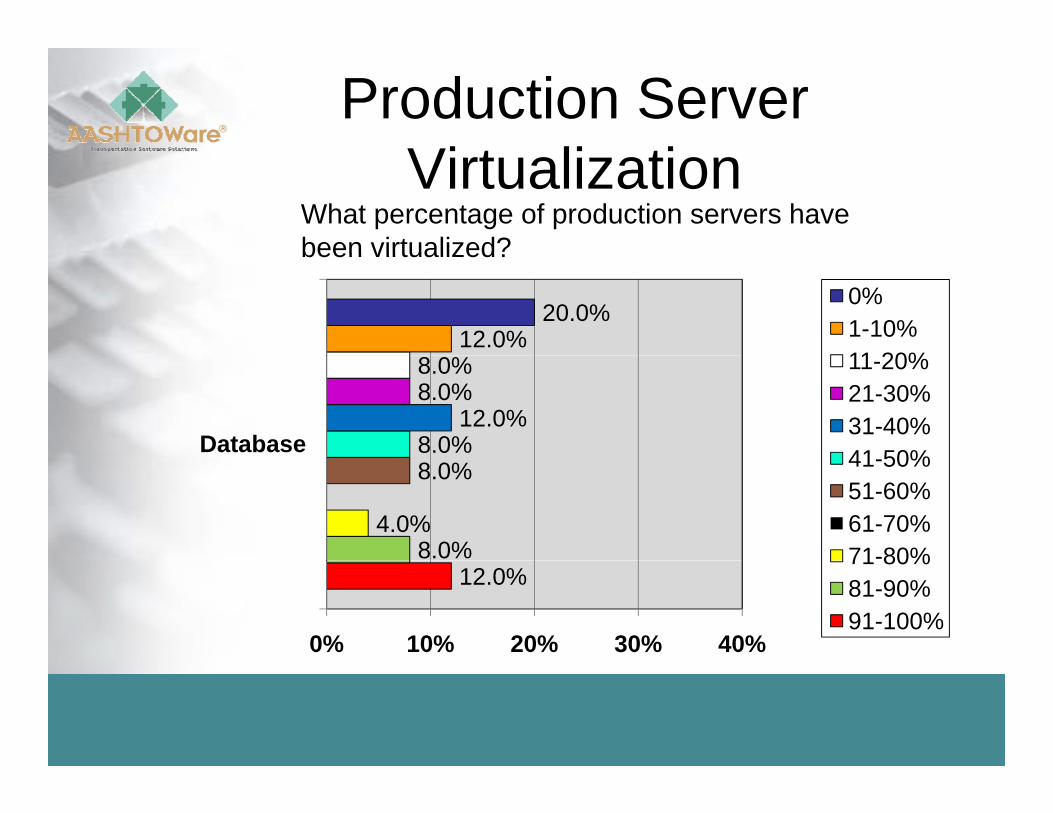
Production Server Vi t li tiVirtualization
What percentage of production servers have been virtualized?been virtualized?
12.0%20.0%
0%1-10%11 20%
8.0%12.0%
8.0%8.0%
Database
11-20%21-30%31-40%41 50%
8.0%4.0%
8.0% 41-50%51-60%61-70%71-80%
12.0%
0% 10% 20% 30% 40%
71 80%81-90%91-100%
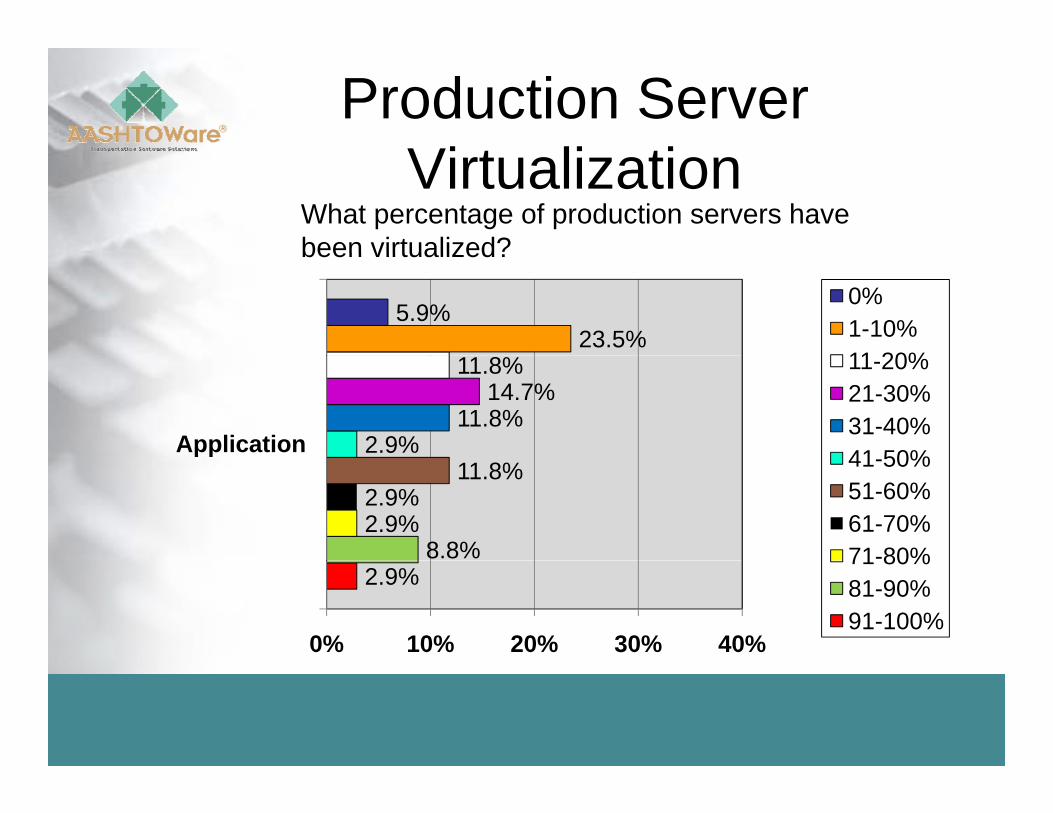
Production Server Vi t li tiVirtualization
What percentage of production servers have been virtualized?been virtualized?
23.5%5.9%
0%1-10%11 20%
2.9%11.8%
14.7%11.8%
Application
11-20%21-30%31-40%41 50%
8.8%2.9%2.9%
11.8% 41-50%51-60%61-70%71-80%
2.9%
0% 10% 20% 30% 40%
71 80%81-90%91-100%
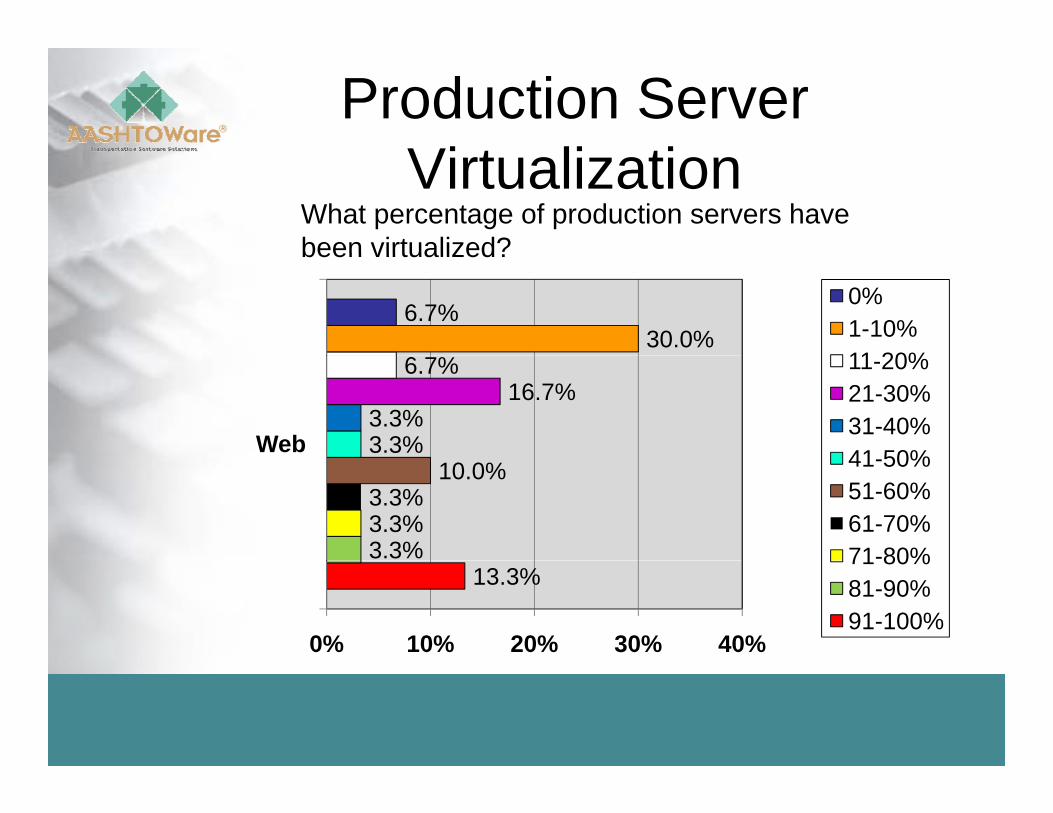
Production Server Vi t li tiVirtualization
What percentage of production servers have been virtualized?been virtualized?
30.0%6.7%
0%1-10%11 20%
3.3%3.3%
16.7%6.7%
Web
11-20%21-30%31-40%41 50%
3.3%3.3%3.3%
10.0% 41-50%51-60%61-70%71-80%
13.3%
0% 10% 20% 30% 40%
71 80%81-90%91-100%
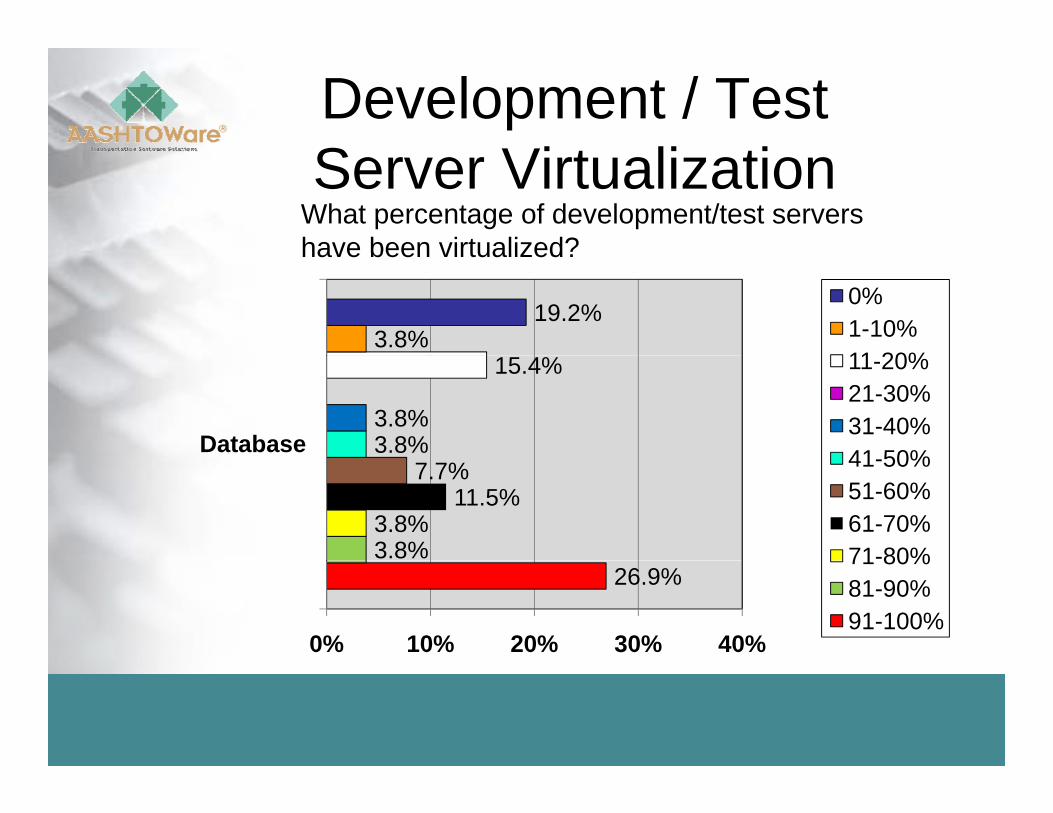
Development / TestS Vi t li tiServer Virtualization
What percentage of development/test servers have been virtualized?have been virtualized?
3.8%19.2%
0%1-10%11 20%
3.8%3.8%
15.4%
Database
11-20%21-30%31-40%41 50%
3.8%3.8%
11.5%7.7% 41-50%
51-60%61-70%71-80%
26.9%
0% 10% 20% 30% 40%
71 80%81-90%91-100%
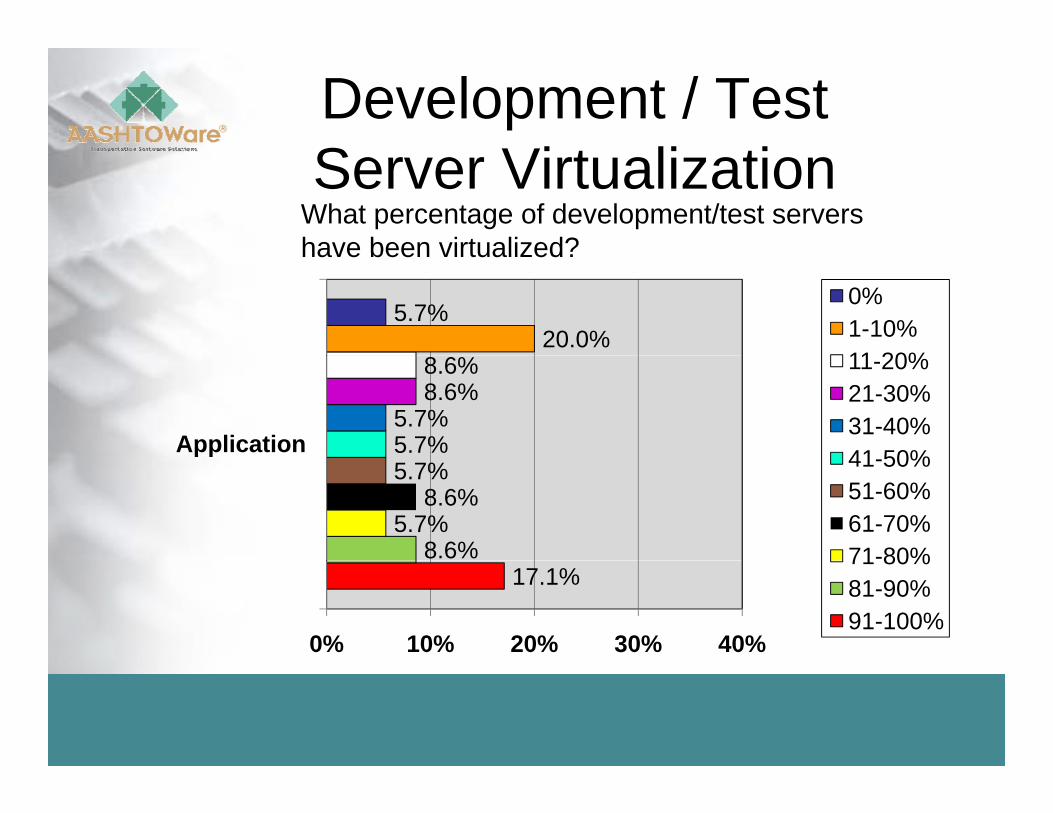
Development / TestS Vi t li tiServer Virtualization
What percentage of development/test servers have been virtualized?have been virtualized?
20.0%5.7%
0%1-10%11 20%
5.7%5.7%
8.6%8.6%
Application
11-20%21-30%31-40%41 50%
8.6%5.7%
8.6%5.7% 41-50%
51-60%61-70%71-80%
17.1%
0% 10% 20% 30% 40%
71 80%81-90%91-100%
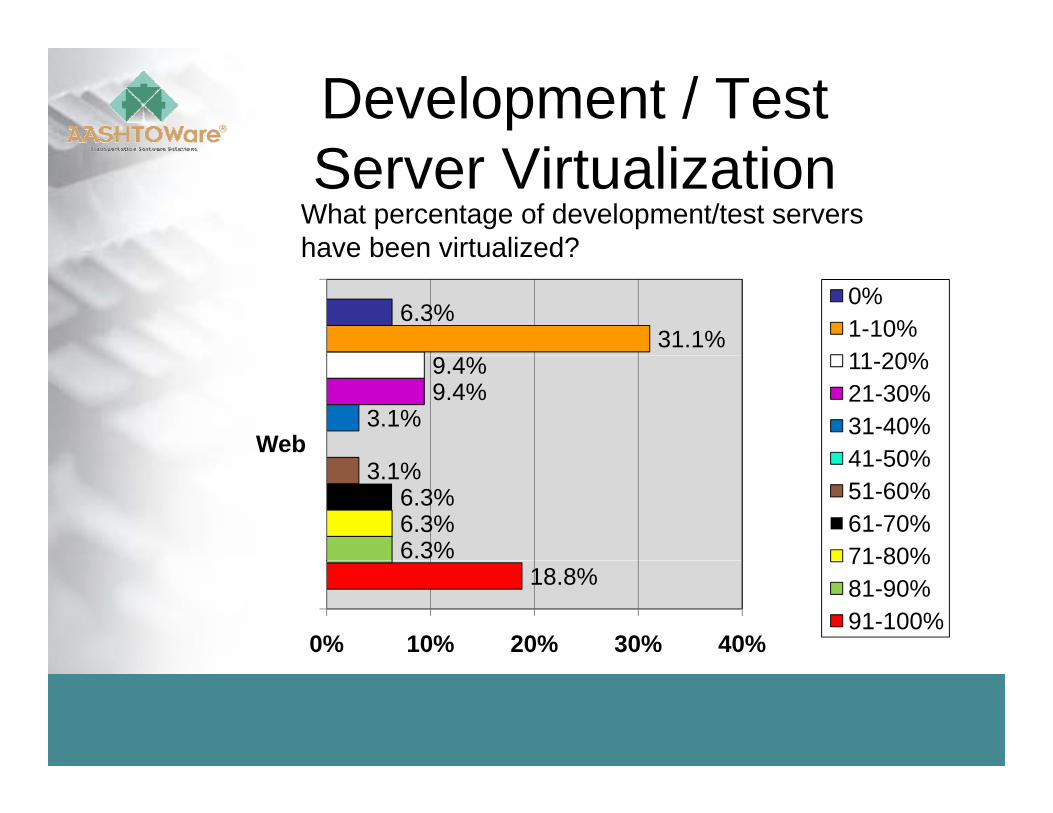
Development / TestS Vi t li tiServer Virtualization
What percentage of development/test servers have been virtualized?have been virtualized?
31.1%6.3%
0%1-10%11 20%
3.1%9.4%9.4%
Web
11-20%21-30%31-40%41 50%
6.3%6.3%6.3%
3.1% 41-50%51-60%61-70%71-80%
18.8%
0% 10% 20% 30% 40%
71 80%81-90%91-100%
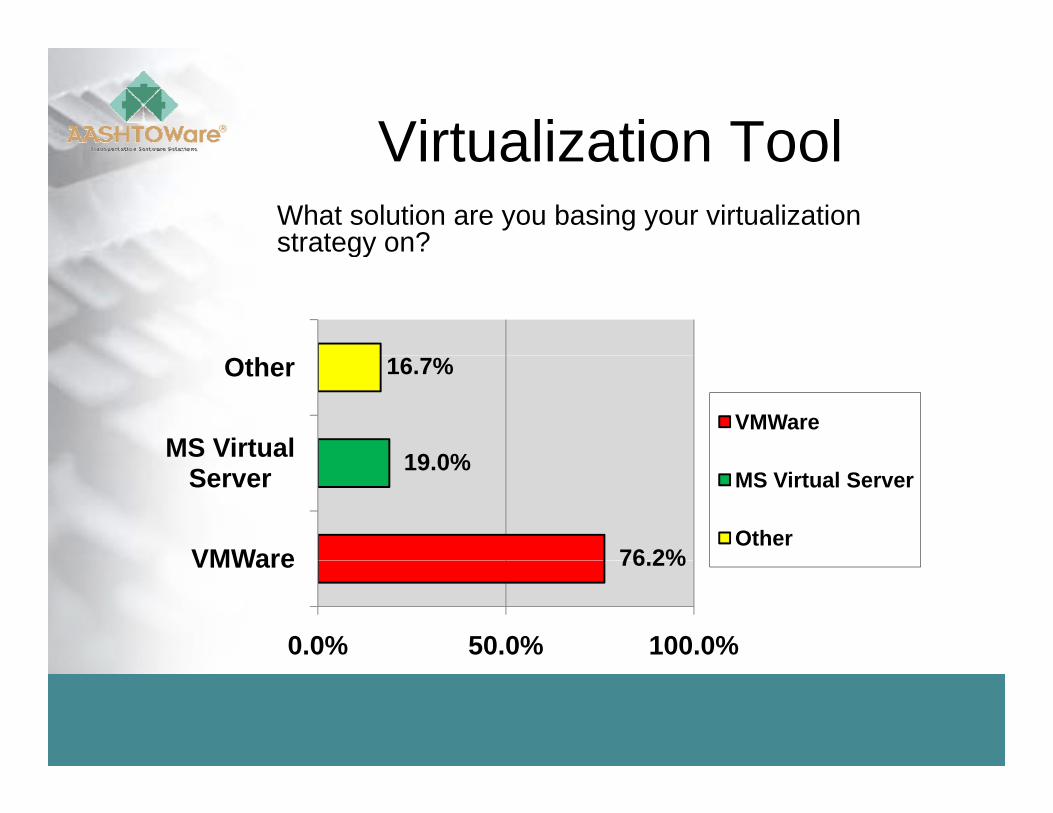
Virtualization ToolVirtualization ToolWhat solution are you basing your virtualization strategy on?gy
19 0%
16.7%
MS Virtual
Other
VMWare
76 2%
19.0%
VMWare
Server MS Virtual Server
Other76.2%VMWare
0.0% 50.0% 100.0%
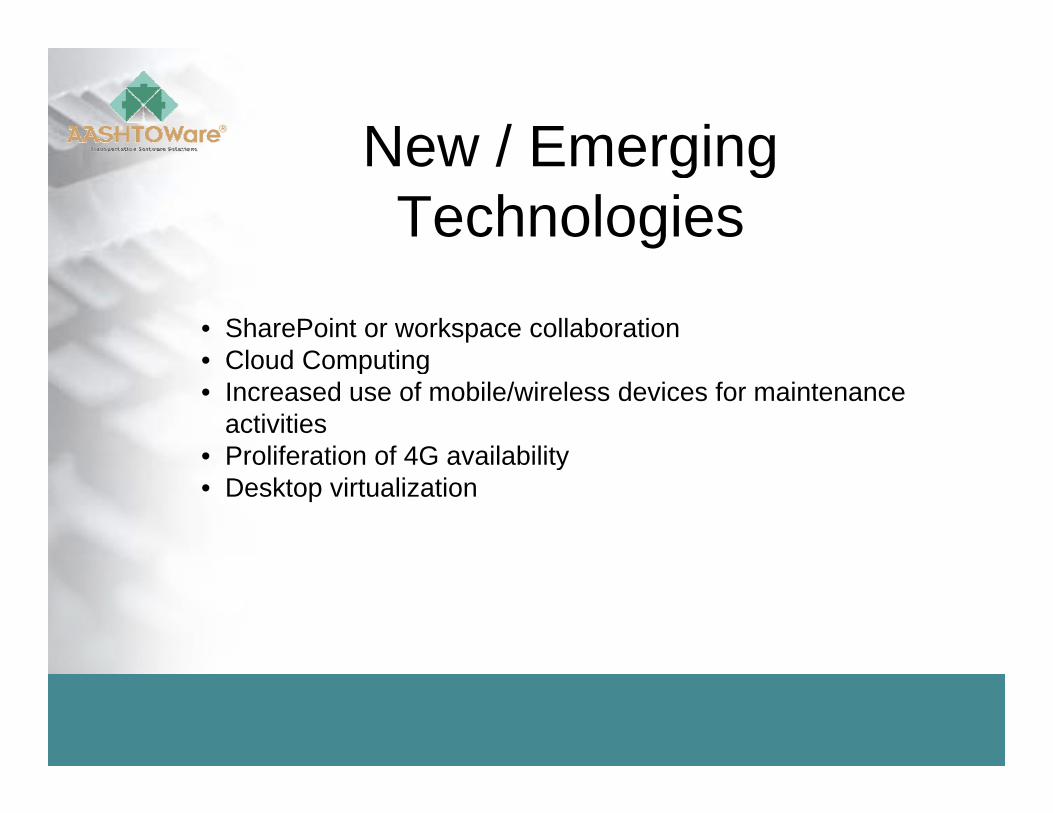
New / EmergingNew / EmergingTechnologies
• SharePoint or workspace collaborationCloud Computing• Cloud Computing
• Increased use of mobile/wireless devices for maintenance activities
• Proliferation of 4G availability• Proliferation of 4G availability• Desktop virtualization
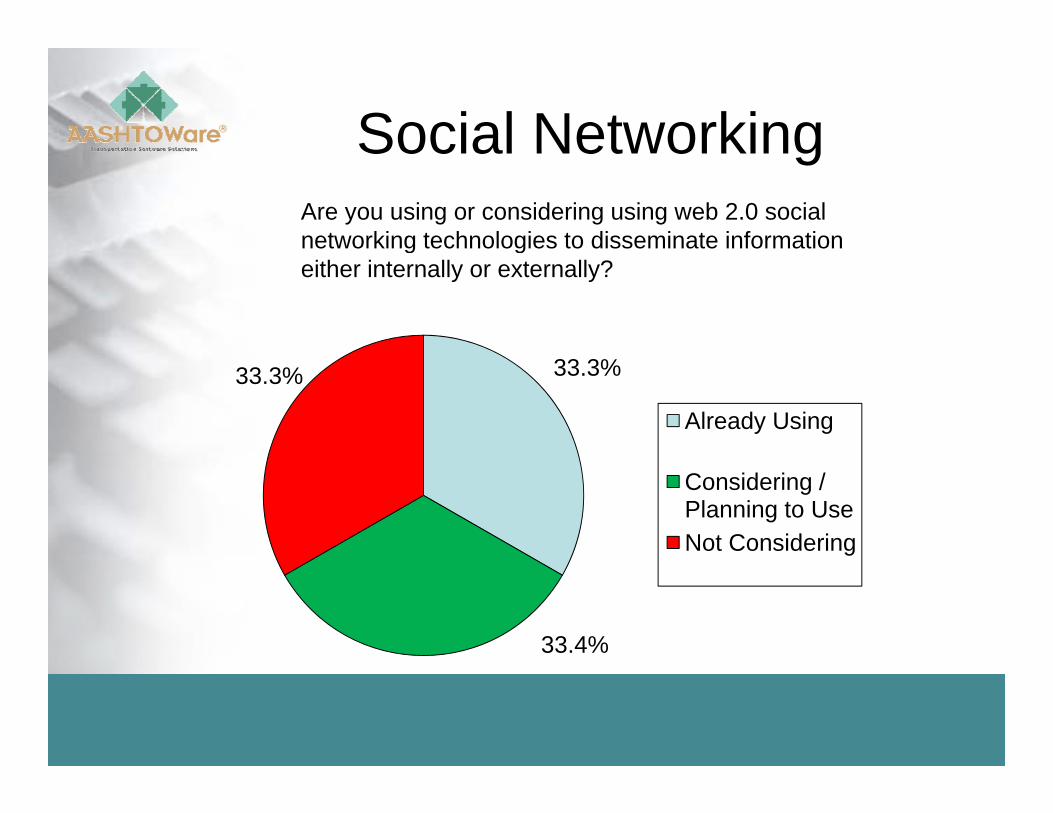
Social NetworkingSocial NetworkingAre you using or considering using web 2.0 social networking technologies to disseminate information g geither internally or externally?
33.3%33.3%
Already Using
Considering / Planning to UseNot Considering
33.4%
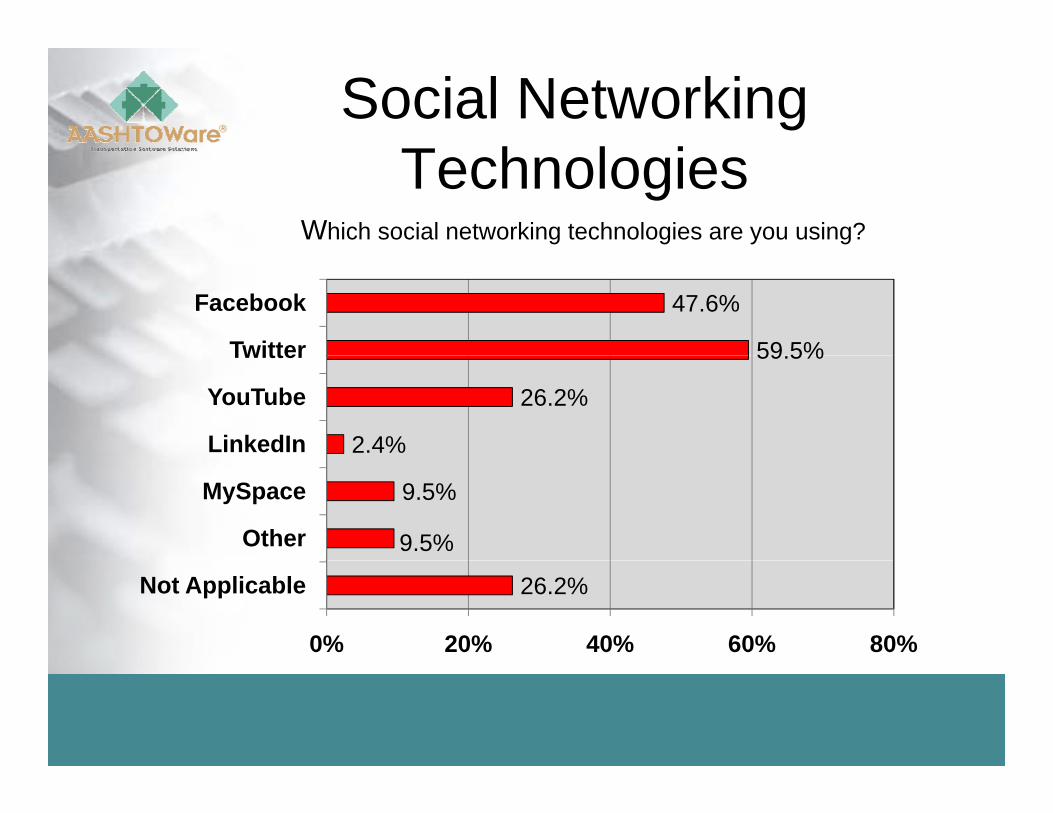
Social Networking T h l iTechnologies
Which social networking technologies are you using?
59 5%
47.6%
2.4%
26.2%
59.5%
YouTube
9.5%
9.5%
Other
MySpace
26.2%
0% 20% 40% 60% 80%
Not Applicable
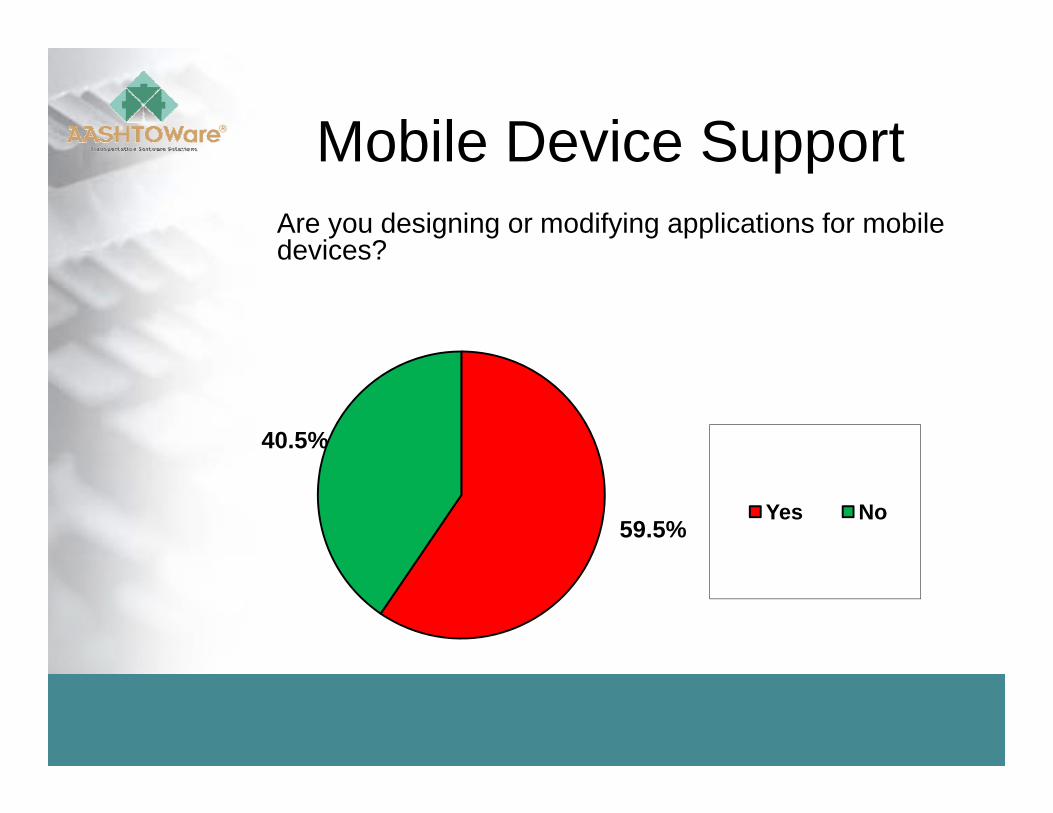
Mobile Device SupportMobile Device SupportAre you designing or modifying applications for mobile devices?devices?
40.5%
59.5%Yes No
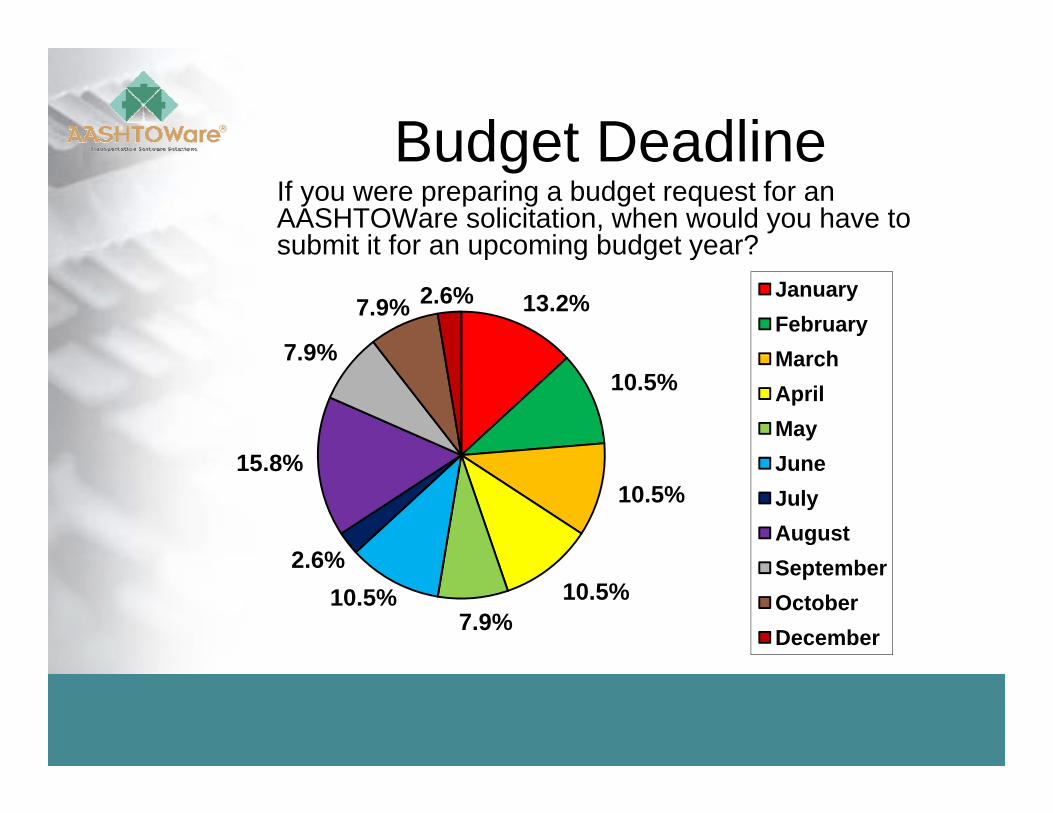
Budget DeadlineBudget DeadlineIf you were preparing a budget request for an AASHTOWare solicitation, when would you have to submit it for an upcoming budget year?submit it for an upcoming budget year?
13.2%
7 9%
7.9% 2.6% JanuaryFebruaryMarch
10.5%
15 8%
7.9% MarchAprilMayJ
10.5%
2 6%
15.8% JuneJulyAugustS t b
10.5%7.9%
10.5%2.6% September
OctoberDecember
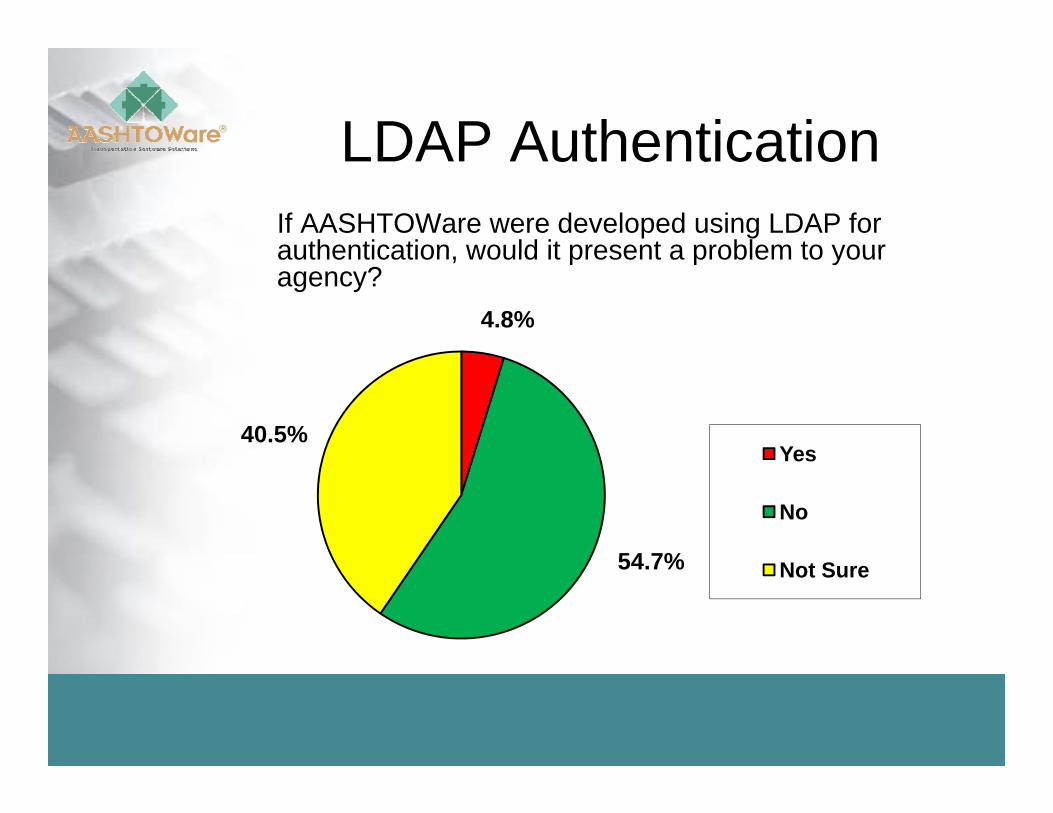
LDAP AuthenticationLDAP AuthenticationIf AASHTOWare were developed using LDAP for authentication would it present a problem to yourauthentication, would it present a problem to your agency?
4.8%
40.5%Yes
54 7%
Yes
No
54.7% Not Sure
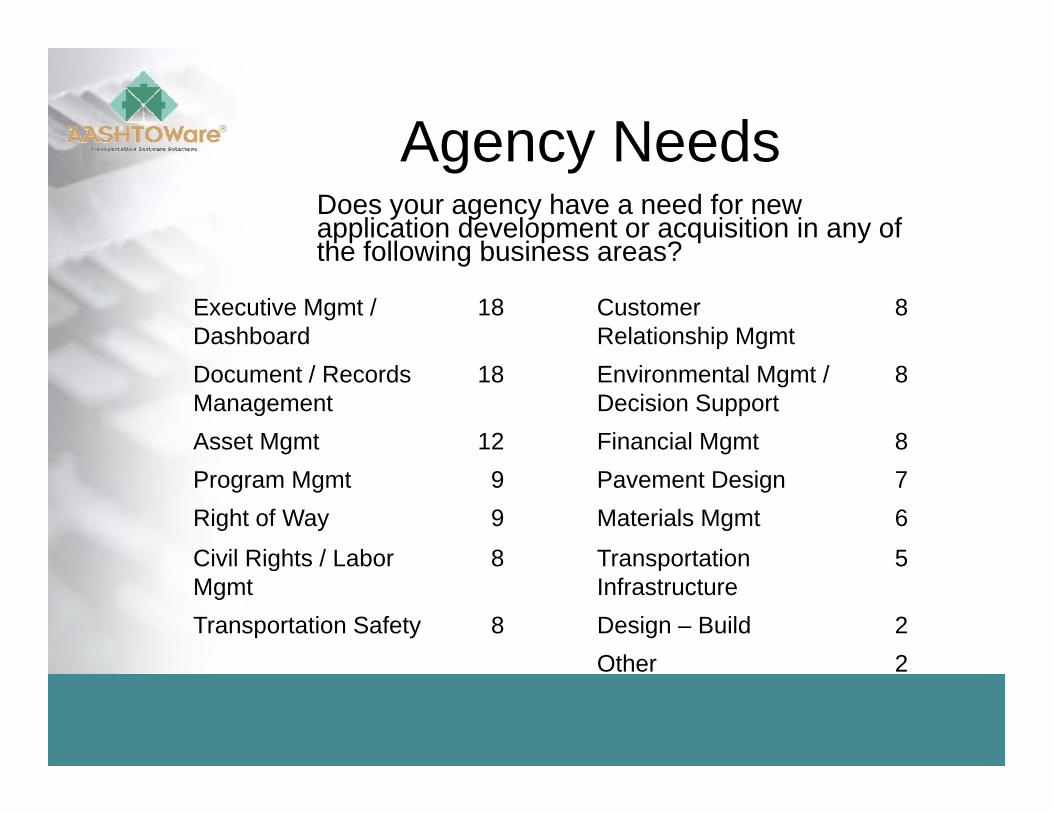
Agency NeedsAgency NeedsDoes your agency have a need for new application development or acquisition in any of the following business areas?the following business areas?
Executive Mgmt / Dashboard
18 Customer Relationship Mgmt
8
Document / Records Management
18 Environmental Mgmt / Decision Support
8
Asset Mgmt 12 Financial Mgmt 8Program Mgmt 9 Pavement Design 7Right of Way 9 Materials Mgmt 6
Civil Rights / Labor 8 Transportation 5Civil Rights / Labor Mgmt
8 Transportation Infrastructure
5
Transportation Safety 8 Design – Build 2Other 2Other 2
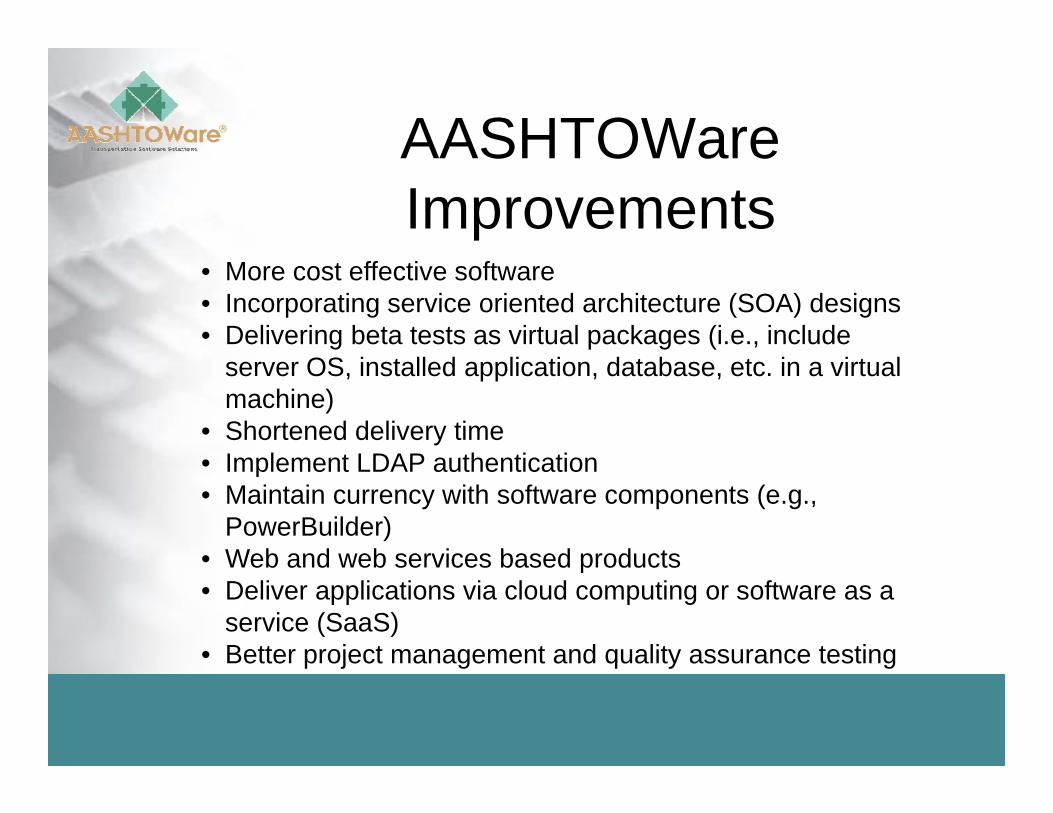
AASHTOWareAASHTOWareImprovements
• More cost effective software• Incorporating service oriented architecture (SOA) designs• Delivering beta tests as virtual packages (i.e., include
server OS, installed application, database, etc. in a virtual machine)
• Shortened delivery timeImplement LDAP authentication• Implement LDAP authentication
• Maintain currency with software components (e.g., PowerBuilder)
• Web and web services based products• Web and web services based products• Deliver applications via cloud computing or software as a
service (SaaS)• Better project management and quality assurance testingBetter project management and quality assurance testing
Recommendations /Recommendations / Comments
• LDAP authentication will be required for all Iowa applications that users log into from outside the agency and is the preferred method for users inside the agency
• AASHTOWare products should be awarded through an RFP process to ensure competitive pricing and eliminate vendor complacencyNext year’s survey needs to ask about the number of non• Next year’s survey needs to ask about the number of non-state staff (contractors or outsourced) used to augment state IT staff to get a true picture of IT staffing resources. Also more and more IT costs are embedded in aAlso, more and more IT costs are embedded in a centralized rate so direct capital costs are very limited and hard to identify.
Questions