Embed Size (px)
Citation preview
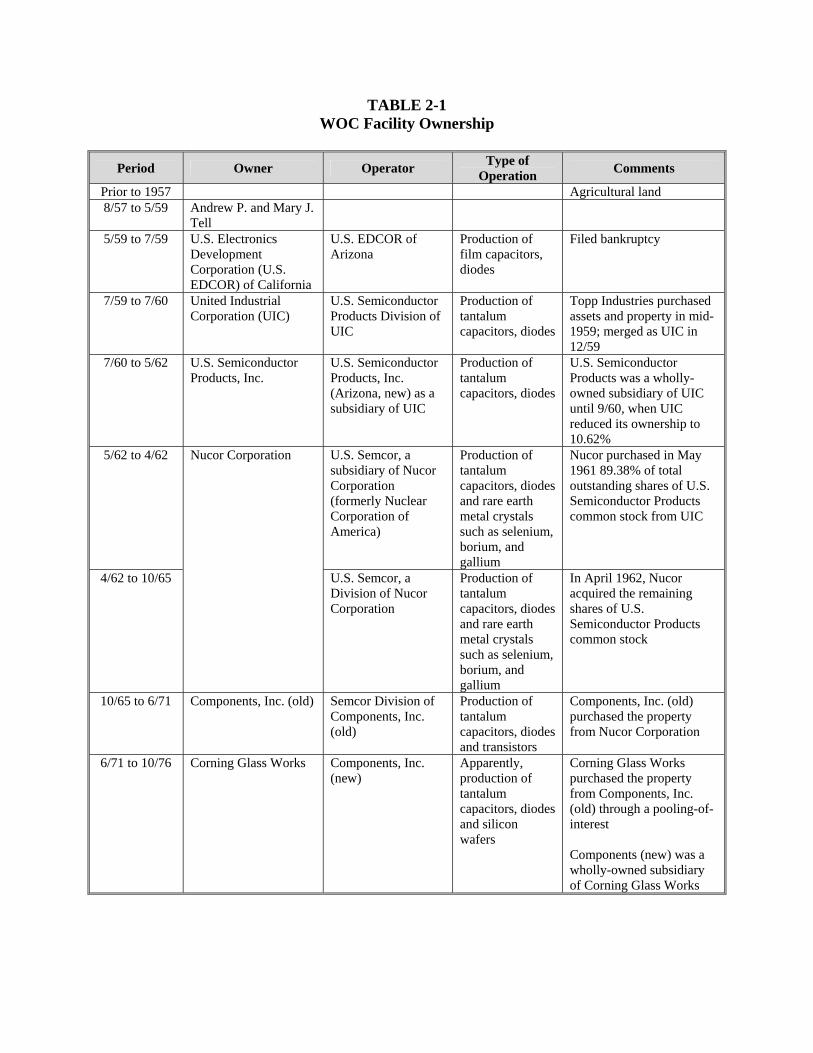
TABLE 2-1 WOC Facility Ownership
Period Owner Operator Type of
Operation Comments
Prior to 1957 Agricultural land 8/57 to 5/59 Andrew P. and Mary J.
Tell
5/59 to 7/59 U.S. Electronics Development Corporation (U.S. EDCOR) of California
U.S. EDCOR of Arizona
Production of film capacitors, diodes
Filed bankruptcy
7/59 to 7/60 United Industrial Corporation (UIC)
U.S. Semiconductor Products Division of UIC
Production of tantalum capacitors, diodes
Topp Industries purchased assets and property in mid-1959; merged as UIC in 12/59
7/60 to 5/62 U.S. Semiconductor Products, Inc.
U.S. Semiconductor Products, Inc. (Arizona, new) as a subsidiary of UIC
Production of tantalum capacitors, diodes
U.S. Semiconductor Products was a wholly-owned subsidiary of UIC until 9/60, when UIC reduced its ownership to 10.62%
5/62 to 4/62 Nucor Corporation
U.S. Semcor, a subsidiary of Nucor Corporation (formerly Nuclear Corporation of America)
Production of tantalum capacitors, diodes and rare earth metal crystals such as selenium, borium, and gallium
Nucor purchased in May 1961 89.38% of total outstanding shares of U.S. Semiconductor Products common stock from UIC
4/62 to 10/65 U.S. Semcor, a Division of Nucor Corporation
Production of tantalum capacitors, diodes and rare earth metal crystals such as selenium, borium, and gallium
In April 1962, Nucor acquired the remaining shares of U.S. Semiconductor Products common stock
10/65 to 6/71 Components, Inc. (old) Semcor Division of Components, Inc. (old)
Production of tantalum capacitors, diodes and transistors
Components, Inc. (old) purchased the property from Nucor Corporation
6/71 to 10/76 Corning Glass Works Components, Inc. (new)
Apparently, production of tantalum capacitors, diodes and silicon wafers
Corning Glass Works purchased the property from Components, Inc. (old) through a pooling-of-interest Components (new) was a wholly-owned subsidiary of Corning Glass Works
Period Owner Operator Type of
Operation Comments
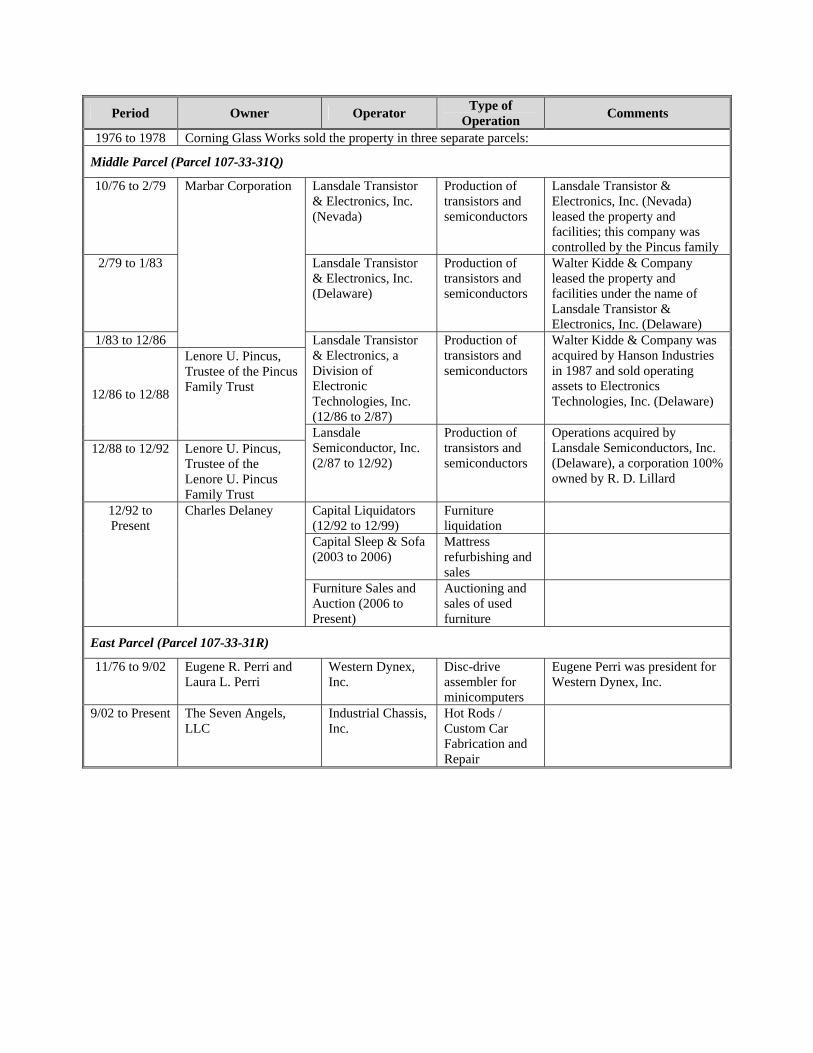
1976 to 1978 Corning Glass Works sold the property in three separate parcels:
Middle Parcel (Parcel 107-33-31Q)
10/76 to 2/79 Marbar Corporation Lansdale Transistor & Electronics, Inc. (Nevada)
Production of transistors and semiconductors
Lansdale Transistor & Electronics, Inc. (Nevada) leased the property and facilities; this company was controlled by the Pincus family
2/79 to 1/83 Lansdale Transistor & Electronics, Inc. (Delaware)
Production of transistors and semiconductors
Walter Kidde & Company leased the property and facilities under the name of Lansdale Transistor & Electronics, Inc. (Delaware)
1/83 to 12/86 Lansdale Transistor & Electronics, a Division of Electronic Technologies, Inc. (12/86 to 2/87)
Production of transistors and semiconductors
Walter Kidde & Company was acquired by Hanson Industries in 1987 and sold operating assets to Electronics Technologies, Inc. (Delaware) 12/86 to 12/88
Lenore U. Pincus, Trustee of the Pincus Family Trust
Lansdale Semiconductor, Inc. (2/87 to 12/92)
Production of transistors and semiconductors
Operations acquired by Lansdale Semiconductors, Inc. (Delaware), a corporation 100% owned by R. D. Lillard
12/88 to 12/92 Lenore U. Pincus, Trustee of the Lenore U. Pincus Family Trust
12/92 to Present
Charles Delaney Capital Liquidators (12/92 to 12/99)
Furniture liquidation
Capital Sleep & Sofa (2003 to 2006)
Mattress refurbishing and sales
Furniture Sales and Auction (2006 to Present)
Auctioning and sales of used furniture
East Parcel (Parcel 107-33-31R)
11/76 to 9/02 Eugene R. Perri and Laura L. Perri
Western Dynex, Inc.
Disc-drive assembler for minicomputers
Eugene Perri was president for Western Dynex, Inc.
9/02 to Present The Seven Angels, LLC
Industrial Chassis, Inc.
Hot Rods / Custom Car Fabrication and Repair
Period Owner Operator Type of
Operation Comments
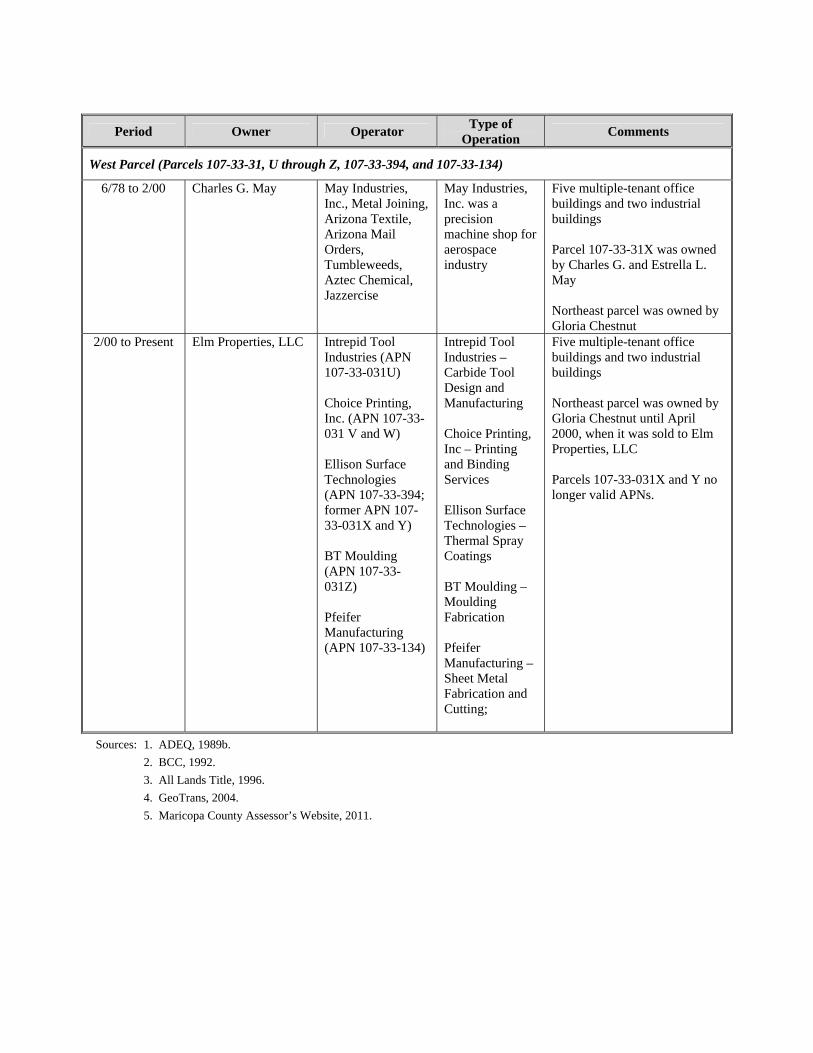
West Parcel (Parcels 107-33-31, U through Z, 107-33-394, and 107-33-134)
6/78 to 2/00 Charles G. May May Industries, Inc., Metal Joining, Arizona Textile, Arizona Mail Orders, Tumbleweeds, Aztec Chemical, Jazzercise
May Industries, Inc. was a precision machine shop for aerospace industry
Five multiple-tenant office buildings and two industrial buildings Parcel 107-33-31X was owned by Charles G. and Estrella L. May Northeast parcel was owned by Gloria Chestnut
2/00 to Present Elm Properties, LLC Intrepid Tool Industries (APN 107-33-031U) Choice Printing, Inc. (APN 107-33-031 V and W) Ellison Surface Technologies (APN 107-33-394; former APN 107-33-031X and Y) BT Moulding (APN 107-33-031Z) Pfeifer Manufacturing (APN 107-33-134)
Intrepid Tool Industries – Carbide Tool Design and Manufacturing Choice Printing, Inc – Printing and Binding Services Ellison Surface Technologies – Thermal Spray Coatings BT Moulding – Moulding Fabrication Pfeifer Manufacturing – Sheet Metal Fabrication and Cutting;
Five multiple-tenant office buildings and two industrial buildings Northeast parcel was owned by Gloria Chestnut until April 2000, when it was sold to Elm Properties, LLC Parcels 107-33-031X and Y no longer valid APNs.
Sources: 1. ADEQ, 1989b.
2. BCC, 1992.
3. All Lands Title, 1996.
4. GeoTrans, 2004.
5. Maricopa County Assessor’s Website, 2011.
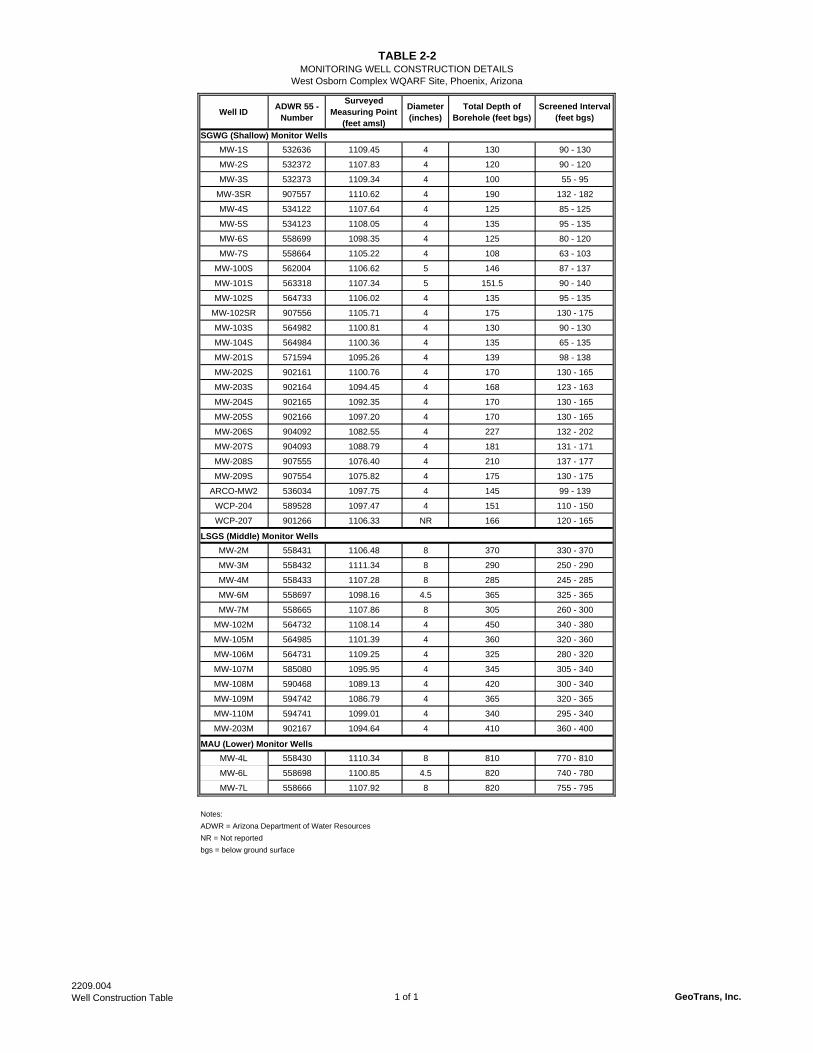
TABLE 2-2MONITORING WELL CONSTRUCTION DETAILS
West Osborn Complex WQARF Site, Phoenix, Arizona
Well IDADWR 55 -
Number
Surveyed Measuring Point
(feet amsl)
Diameter (inches)
Total Depth of Borehole (feet bgs)
Screened Interval (feet bgs)
MW-1S 532636 1109.45 4 130 90 - 130
MW-2S 532372 1107.83 4 120 90 - 120
MW-3S 532373 1109.34 4 100 55 - 95
MW-3SR 907557 1110.62 4 190 132 - 182
MW-4S 534122 1107.64 4 125 85 - 125
MW-5S 534123 1108.05 4 135 95 - 135
MW-6S 558699 1098.35 4 125 80 - 120
MW-7S 558664 1105.22 4 108 63 - 103
MW-100S 562004 1106.62 5 146 87 - 137
MW-101S 563318 1107.34 5 151.5 90 - 140
MW-102S 564733 1106.02 4 135 95 - 135
MW-102SR 907556 1105.71 4 175 130 - 175
MW-103S 564982 1100.81 4 130 90 - 130
MW-104S 564984 1100.36 4 135 65 - 135
MW-201S 571594 1095.26 4 139 98 - 138
MW-202S 902161 1100.76 4 170 130 - 165
MW-203S 902164 1094.45 4 168 123 - 163
MW-204S 902165 1092.35 4 170 130 - 165
MW-205S 902166 1097.20 4 170 130 - 165
MW-206S 904092 1082.55 4 227 132 - 202
MW-207S 904093 1088.79 4 181 131 - 171
MW-208S 907555 1076.40 4 210 137 - 177
MW-209S 907554 1075.82 4 175 130 - 175
ARCO-MW2 536034 1097.75 4 145 99 - 139
WCP-204 589528 1097.47 4 151 110 - 150
WCP-207 901266 1106.33 NR 166 120 - 165
MW-2M 558431 1106.48 8 370 330 - 370
MW-3M 558432 1111.34 8 290 250 - 290
MW-4M 558433 1107.28 8 285 245 - 285
MW-6M 558697 1098.16 4.5 365 325 - 365
MW-7M 558665 1107.86 8 305 260 - 300
MW-102M 564732 1108.14 4 450 340 - 380
MW-105M 564985 1101.39 4 360 320 - 360
MW-106M 564731 1109.25 4 325 280 - 320
MW-107M 585080 1095.95 4 345 305 - 340
MW-108M 590468 1089.13 4 420 300 - 340
MW-109M 594742 1086.79 4 365 320 - 365
MW-110M 594741 1099.01 4 340 295 - 340
MW-203M 902167 1094.64 4 410 360 - 400
MW-4L 558430 1110.34 8 810 770 - 810
MW-6L 558698 1100.85 4.5 820 740 - 780
MW-7L 558666 1107.92 8 820 755 - 795
Notes:
ADWR = Arizona Department of Water Resources
NR = Not reported
bgs = below ground surface
MAU (Lower) Monitor Wells
LSGS (Middle) Monitor Wells
SGWG (Shallow) Monitor Wells
2209.004Well Construction Table 1 of 1 GeoTrans, Inc.
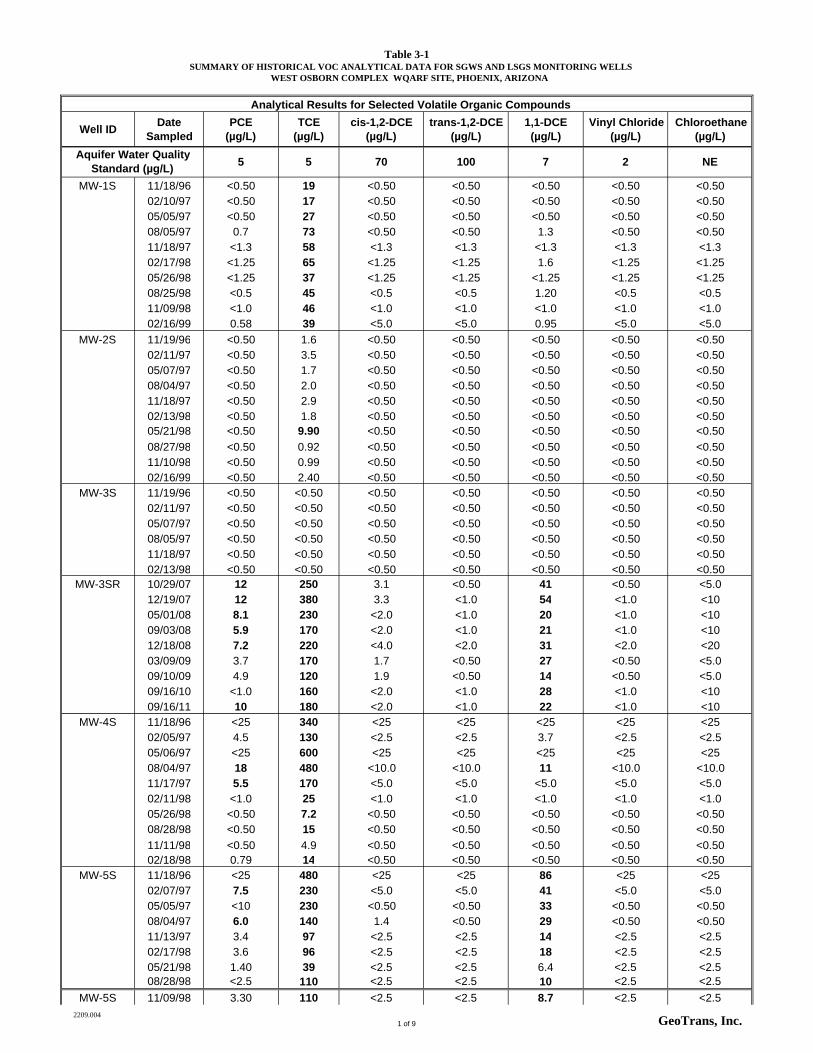
Table 3-1SUMMARY OF HISTORICAL VOC ANALYTICAL DATA FOR SGWS AND LSGS MONITORING WELLS
WEST OSBORN COMPLEX WQARF SITE, PHOENIX, ARIZONA
Well IDDate
SampledPCE
(µg/L)TCE
(µg/L)cis-1,2-DCE
(µg/L)trans-1,2-DCE
(µg/L)1,1-DCE (µg/L)
Vinyl Chloride (µg/L)
Chloroethane (µg/L)
5 5 70 100 7 2 NE
MW-1S 11/18/96 <0.50 19 <0.50 <0.50 <0.50 <0.50 <0.5002/10/97 <0.50 17 <0.50 <0.50 <0.50 <0.50 <0.5005/05/97 <0.50 27 <0.50 <0.50 <0.50 <0.50 <0.5008/05/97 0.7 73 <0.50 <0.50 1.3 <0.50 <0.5011/18/97 <1.3 58 <1.3 <1.3 <1.3 <1.3 <1.302/17/98 <1.25 65 <1.25 <1.25 1.6 <1.25 <1.2505/26/98 <1.25 37 <1.25 <1.25 <1.25 <1.25 <1.2508/25/98 <0.5 45 <0.5 <0.5 1.20 <0.5 <0.511/09/98 <1.0 46 <1.0 <1.0 <1.0 <1.0 <1.002/16/99 0.58 39 <5.0 <5.0 0.95 <5.0 <5.0
MW-2S 11/19/96 <0.50 1.6 <0.50 <0.50 <0.50 <0.50 <0.5002/11/97 <0.50 3.5 <0.50 <0.50 <0.50 <0.50 <0.5005/07/97 <0.50 1.7 <0.50 <0.50 <0.50 <0.50 <0.5008/04/97 <0.50 2.0 <0.50 <0.50 <0.50 <0.50 <0.5011/18/97 <0.50 2.9 <0.50 <0.50 <0.50 <0.50 <0.5002/13/98 <0.50 1.8 <0.50 <0.50 <0.50 <0.50 <0.5005/21/98 <0.50 9.90 <0.50 <0.50 <0.50 <0.50 <0.50
08/27/98 <0.50 0.92 <0.50 <0.50 <0.50 <0.50 <0.5011/10/98 <0.50 0.99 <0.50 <0.50 <0.50 <0.50 <0.5002/16/99 <0.50 2.40 <0.50 <0.50 <0.50 <0.50 <0.50
MW-3S 11/19/96 <0.50 <0.50 <0.50 <0.50 <0.50 <0.50 <0.5002/11/97 <0.50 <0.50 <0.50 <0.50 <0.50 <0.50 <0.5005/07/97 <0.50 <0.50 <0.50 <0.50 <0.50 <0.50 <0.5008/05/97 <0.50 <0.50 <0.50 <0.50 <0.50 <0.50 <0.5011/18/97 <0.50 <0.50 <0.50 <0.50 <0.50 <0.50 <0.5002/13/98 <0.50 <0.50 <0.50 <0.50 <0.50 <0.50 <0.50
MW-3SR 10/29/07 12 250 3.1 <0.50 41 <0.50 <5.012/19/07 12 380 3.3 <1.0 54 <1.0 <1005/01/08 8.1 230 <2.0 <1.0 20 <1.0 <1009/03/08 5.9 170 <2.0 <1.0 21 <1.0 <1012/18/08 7.2 220 <4.0 <2.0 31 <2.0 <2003/09/09 3.7 170 1.7 <0.50 27 <0.50 <5.009/10/09 4.9 120 1.9 <0.50 14 <0.50 <5.009/16/10 <1.0 160 <2.0 <1.0 28 <1.0 <1009/16/11 10 180 <2.0 <1.0 22 <1.0 <10
MW-4S 11/18/96 <25 340 <25 <25 <25 <25 <2502/05/97 4.5 130 <2.5 <2.5 3.7 <2.5 <2.505/06/97 <25 600 <25 <25 <25 <25 <2508/04/97 18 480 <10.0 <10.0 11 <10.0 <10.011/17/97 5.5 170 <5.0 <5.0 <5.0 <5.0 <5.002/11/98 <1.0 25 <1.0 <1.0 <1.0 <1.0 <1.005/26/98 <0.50 7.2 <0.50 <0.50 <0.50 <0.50 <0.5008/28/98 <0.50 15 <0.50 <0.50 <0.50 <0.50 <0.50
11/11/98 <0.50 4.9 <0.50 <0.50 <0.50 <0.50 <0.5002/18/98 0.79 14 <0.50 <0.50 <0.50 <0.50 <0.50
MW-5S 11/18/96 <25 480 <25 <25 86 <25 <2502/07/97 7.5 230 <5.0 <5.0 41 <5.0 <5.005/05/97 <10 230 <0.50 <0.50 33 <0.50 <0.5008/04/97 6.0 140 1.4 <0.50 29 <0.50 <0.5011/13/97 3.4 97 <2.5 <2.5 14 <2.5 <2.502/17/98 3.6 96 <2.5 <2.5 18 <2.5 <2.505/21/98 1.40 39 <2.5 <2.5 6.4 <2.5 <2.508/28/98 <2.5 110 <2.5 <2.5 10 <2.5 <2.5
MW-5S 11/09/98 3.30 110 <2.5 <2.5 8.7 <2.5 <2.5
Aquifer Water Quality Standard (µg/L)
Analytical Results for Selected Volatile Organic Compounds
2209.0041 of 9 GeoTrans, Inc.
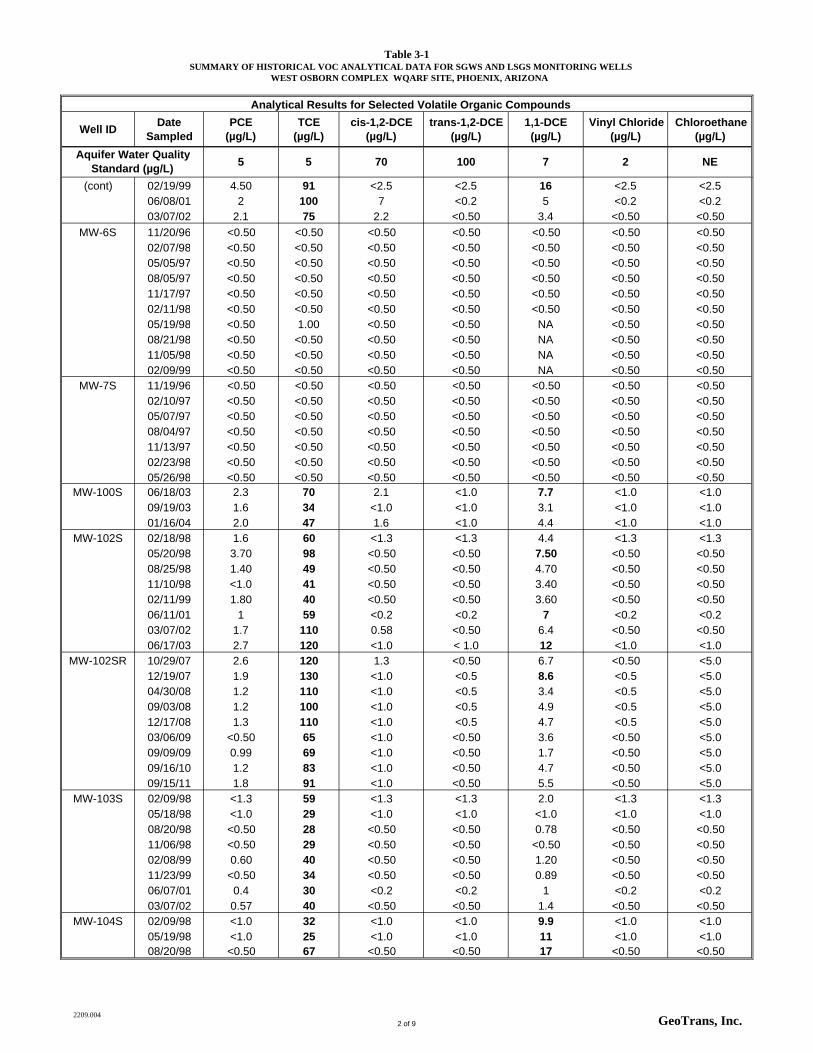
Table 3-1SUMMARY OF HISTORICAL VOC ANALYTICAL DATA FOR SGWS AND LSGS MONITORING WELLS
WEST OSBORN COMPLEX WQARF SITE, PHOENIX, ARIZONA
Well IDDate
SampledPCE
(µg/L)TCE
(µg/L)cis-1,2-DCE
(µg/L)trans-1,2-DCE
(µg/L)1,1-DCE (µg/L)
Vinyl Chloride (µg/L)
Chloroethane (µg/L)
5 5 70 100 7 2 NEAquifer Water Quality
Standard (µg/L)
Analytical Results for Selected Volatile Organic Compounds
(cont) 02/19/99 4.50 91 <2.5 <2.5 16 <2.5 <2.506/08/01 2 100 7 <0.2 5 <0.2 <0.203/07/02 2.1 75 2.2 <0.50 3.4 <0.50 <0.50
MW-6S 11/20/96 <0.50 <0.50 <0.50 <0.50 <0.50 <0.50 <0.5002/07/98 <0.50 <0.50 <0.50 <0.50 <0.50 <0.50 <0.5005/05/97 <0.50 <0.50 <0.50 <0.50 <0.50 <0.50 <0.5008/05/97 <0.50 <0.50 <0.50 <0.50 <0.50 <0.50 <0.5011/17/97 <0.50 <0.50 <0.50 <0.50 <0.50 <0.50 <0.5002/11/98 <0.50 <0.50 <0.50 <0.50 <0.50 <0.50 <0.5005/19/98 <0.50 1.00 <0.50 <0.50 NA <0.50 <0.5008/21/98 <0.50 <0.50 <0.50 <0.50 NA <0.50 <0.5011/05/98 <0.50 <0.50 <0.50 <0.50 NA <0.50 <0.5002/09/99 <0.50 <0.50 <0.50 <0.50 NA <0.50 <0.50
MW-7S 11/19/96 <0.50 <0.50 <0.50 <0.50 <0.50 <0.50 <0.5002/10/97 <0.50 <0.50 <0.50 <0.50 <0.50 <0.50 <0.5005/07/97 <0.50 <0.50 <0.50 <0.50 <0.50 <0.50 <0.5008/04/97 <0.50 <0.50 <0.50 <0.50 <0.50 <0.50 <0.5011/13/97 <0.50 <0.50 <0.50 <0.50 <0.50 <0.50 <0.5002/23/98 <0.50 <0.50 <0.50 <0.50 <0.50 <0.50 <0.5005/26/98 <0.50 <0.50 <0.50 <0.50 <0.50 <0.50 <0.50
MW-100S 06/18/03 2.3 70 2.1 <1.0 7.7 <1.0 <1.009/19/03 1.6 34 <1.0 <1.0 3.1 <1.0 <1.001/16/04 2.0 47 1.6 <1.0 4.4 <1.0 <1.0
MW-102S 02/18/98 1.6 60 <1.3 <1.3 4.4 <1.3 <1.305/20/98 3.70 98 <0.50 <0.50 7.50 <0.50 <0.5008/25/98 1.40 49 <0.50 <0.50 4.70 <0.50 <0.5011/10/98 <1.0 41 <0.50 <0.50 3.40 <0.50 <0.5002/11/99 1.80 40 <0.50 <0.50 3.60 <0.50 <0.5006/11/01 1 59 <0.2 <0.2 7 <0.2 <0.203/07/02 1.7 110 0.58 <0.50 6.4 <0.50 <0.5006/17/03 2.7 120 <1.0 < 1.0 12 <1.0 <1.0
MW-102SR 10/29/07 2.6 120 1.3 <0.50 6.7 <0.50 <5.012/19/07 1.9 130 <1.0 <0.5 8.6 <0.5 <5.004/30/08 1.2 110 <1.0 <0.5 3.4 <0.5 <5.009/03/08 1.2 100 <1.0 <0.5 4.9 <0.5 <5.012/17/08 1.3 110 <1.0 <0.5 4.7 <0.5 <5.003/06/09 <0.50 65 <1.0 <0.50 3.6 <0.50 <5.009/09/09 0.99 69 <1.0 <0.50 1.7 <0.50 <5.009/16/10 1.2 83 <1.0 <0.50 4.7 <0.50 <5.009/15/11 1.8 91 <1.0 <0.50 5.5 <0.50 <5.0
MW-103S 02/09/98 <1.3 59 <1.3 <1.3 2.0 <1.3 <1.305/18/98 <1.0 29 <1.0 <1.0 <1.0 <1.0 <1.008/20/98 <0.50 28 <0.50 <0.50 0.78 <0.50 <0.5011/06/98 <0.50 29 <0.50 <0.50 <0.50 <0.50 <0.5002/08/99 0.60 40 <0.50 <0.50 1.20 <0.50 <0.5011/23/99 <0.50 34 <0.50 <0.50 0.89 <0.50 <0.5006/07/01 0.4 30 <0.2 <0.2 1 <0.2 <0.203/07/02 0.57 40 <0.50 <0.50 1.4 <0.50 <0.50
MW-104S 02/09/98 <1.0 32 <1.0 <1.0 9.9 <1.0 <1.005/19/98 <1.0 25 <1.0 <1.0 11 <1.0 <1.008/20/98 <0.50 67 <0.50 <0.50 17 <0.50 <0.50
2209.0042 of 9 GeoTrans, Inc.
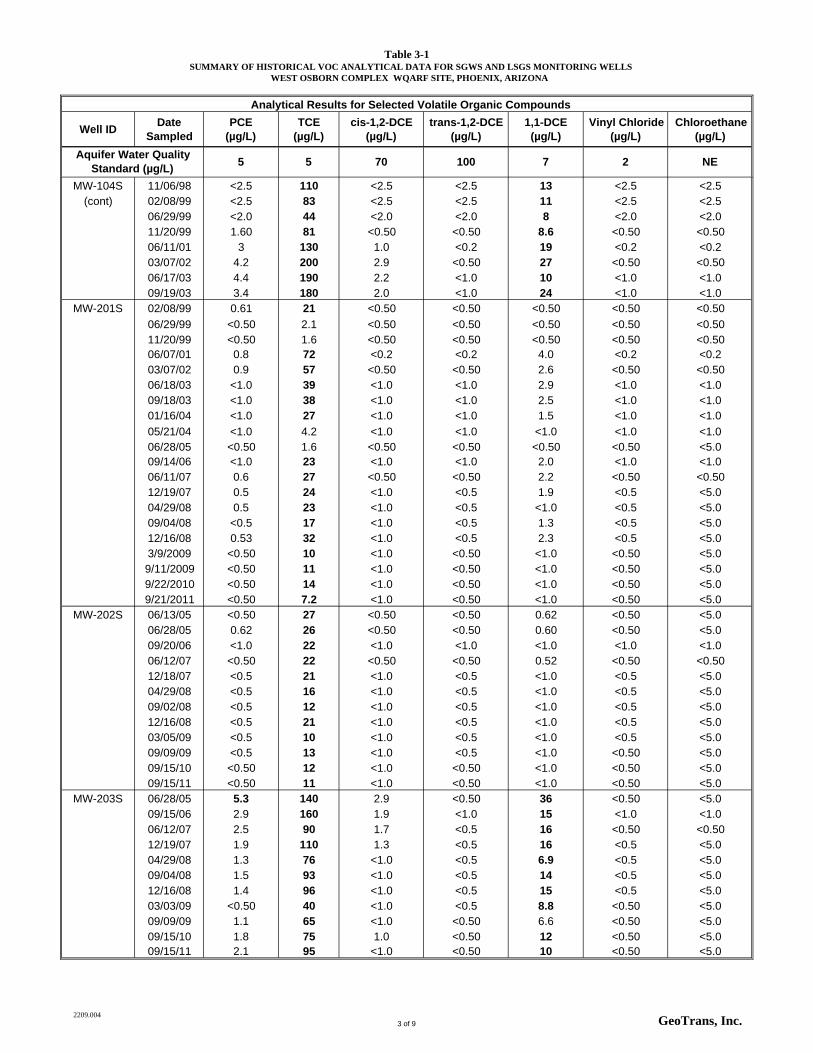
Table 3-1SUMMARY OF HISTORICAL VOC ANALYTICAL DATA FOR SGWS AND LSGS MONITORING WELLS
WEST OSBORN COMPLEX WQARF SITE, PHOENIX, ARIZONA
Well IDDate
SampledPCE
(µg/L)TCE
(µg/L)cis-1,2-DCE
(µg/L)trans-1,2-DCE
(µg/L)1,1-DCE (µg/L)
Vinyl Chloride (µg/L)
Chloroethane (µg/L)
5 5 70 100 7 2 NEAquifer Water Quality
Standard (µg/L)
Analytical Results for Selected Volatile Organic Compounds
MW-104S 11/06/98 <2.5 110 <2.5 <2.5 13 <2.5 <2.5(cont) 02/08/99 <2.5 83 <2.5 <2.5 11 <2.5 <2.5
06/29/99 <2.0 44 <2.0 <2.0 8 <2.0 <2.011/20/99 1.60 81 <0.50 <0.50 8.6 <0.50 <0.5006/11/01 3 130 1.0 <0.2 19 <0.2 <0.203/07/02 4.2 200 2.9 <0.50 27 <0.50 <0.5006/17/03 4.4 190 2.2 <1.0 10 <1.0 <1.009/19/03 3.4 180 2.0 <1.0 24 <1.0 <1.0
MW-201S 02/08/99 0.61 21 <0.50 <0.50 <0.50 <0.50 <0.50
06/29/99 <0.50 2.1 <0.50 <0.50 <0.50 <0.50 <0.5011/20/99 <0.50 1.6 <0.50 <0.50 <0.50 <0.50 <0.5006/07/01 0.8 72 <0.2 <0.2 4.0 <0.2 <0.203/07/02 0.9 57 <0.50 <0.50 2.6 <0.50 <0.5006/18/03 <1.0 39 <1.0 <1.0 2.9 <1.0 <1.009/18/03 <1.0 38 <1.0 <1.0 2.5 <1.0 <1.001/16/04 <1.0 27 <1.0 <1.0 1.5 <1.0 <1.0
05/21/04 <1.0 4.2 <1.0 <1.0 <1.0 <1.0 <1.006/28/05 <0.50 1.6 <0.50 <0.50 <0.50 <0.50 <5.009/14/06 <1.0 23 <1.0 <1.0 2.0 <1.0 <1.006/11/07 0.6 27 <0.50 <0.50 2.2 <0.50 <0.5012/19/07 0.5 24 <1.0 <0.5 1.9 <0.5 <5.004/29/08 0.5 23 <1.0 <0.5 <1.0 <0.5 <5.009/04/08 <0.5 17 <1.0 <0.5 1.3 <0.5 <5.012/16/08 0.53 32 <1.0 <0.5 2.3 <0.5 <5.03/9/2009 <0.50 10 <1.0 <0.50 <1.0 <0.50 <5.09/11/2009 <0.50 11 <1.0 <0.50 <1.0 <0.50 <5.09/22/2010 <0.50 14 <1.0 <0.50 <1.0 <0.50 <5.09/21/2011 <0.50 7.2 <1.0 <0.50 <1.0 <0.50 <5.0
MW-202S 06/13/05 <0.50 27 <0.50 <0.50 0.62 <0.50 <5.006/28/05 0.62 26 <0.50 <0.50 0.60 <0.50 <5.009/20/06 <1.0 22 <1.0 <1.0 <1.0 <1.0 <1.006/12/07 <0.50 22 <0.50 <0.50 0.52 <0.50 <0.5012/18/07 <0.5 21 <1.0 <0.5 <1.0 <0.5 <5.004/29/08 <0.5 16 <1.0 <0.5 <1.0 <0.5 <5.009/02/08 <0.5 12 <1.0 <0.5 <1.0 <0.5 <5.012/16/08 <0.5 21 <1.0 <0.5 <1.0 <0.5 <5.003/05/09 <0.5 10 <1.0 <0.5 <1.0 <0.5 <5.009/09/09 <0.5 13 <1.0 <0.5 <1.0 <0.50 <5.009/15/10 <0.50 12 <1.0 <0.50 <1.0 <0.50 <5.009/15/11 <0.50 11 <1.0 <0.50 <1.0 <0.50 <5.0
MW-203S 06/28/05 5.3 140 2.9 <0.50 36 <0.50 <5.009/15/06 2.9 160 1.9 <1.0 15 <1.0 <1.006/12/07 2.5 90 1.7 <0.5 16 <0.50 <0.5012/19/07 1.9 110 1.3 <0.5 16 <0.5 <5.004/29/08 1.3 76 <1.0 <0.5 6.9 <0.5 <5.009/04/08 1.5 93 <1.0 <0.5 14 <0.5 <5.012/16/08 1.4 96 <1.0 <0.5 15 <0.5 <5.003/03/09 <0.50 40 <1.0 <0.5 8.8 <0.50 <5.009/09/09 1.1 65 <1.0 <0.50 6.6 <0.50 <5.009/15/10 1.8 75 1.0 <0.50 12 <0.50 <5.009/15/11 2.1 95 <1.0 <0.50 10 <0.50 <5.0
2209.0043 of 9 GeoTrans, Inc.
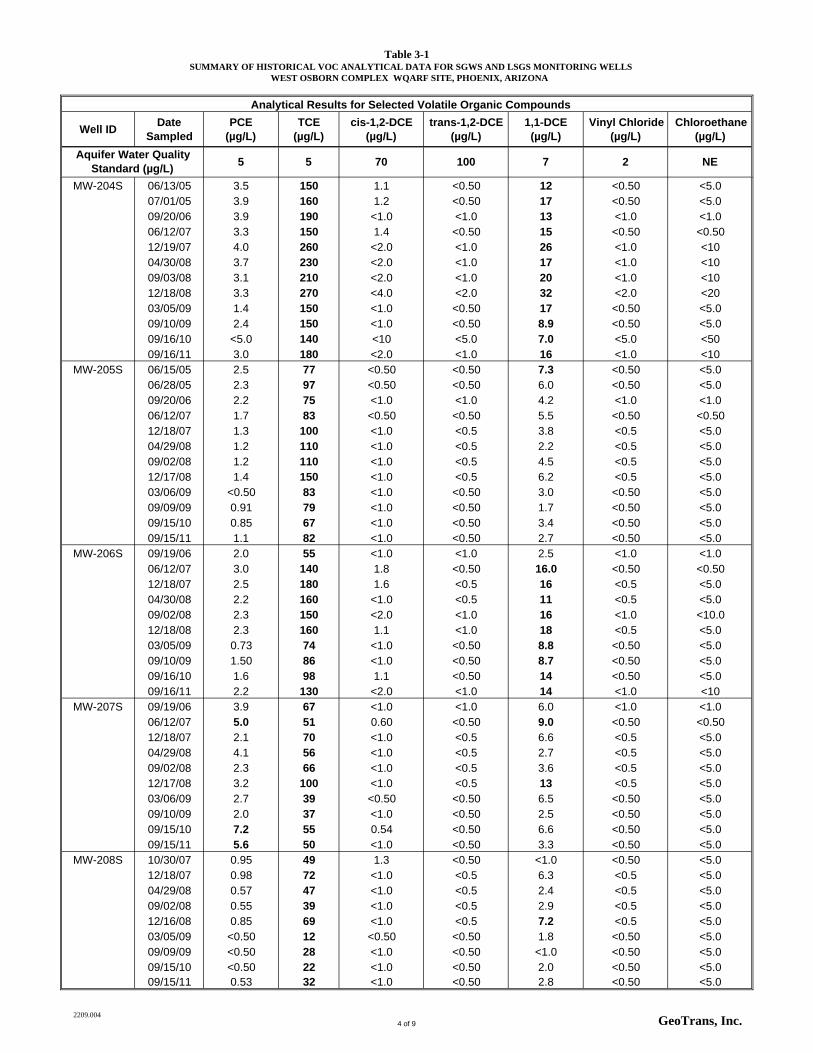
Table 3-1SUMMARY OF HISTORICAL VOC ANALYTICAL DATA FOR SGWS AND LSGS MONITORING WELLS
WEST OSBORN COMPLEX WQARF SITE, PHOENIX, ARIZONA
Well IDDate
SampledPCE
(µg/L)TCE
(µg/L)cis-1,2-DCE
(µg/L)trans-1,2-DCE
(µg/L)1,1-DCE (µg/L)
Vinyl Chloride (µg/L)
Chloroethane (µg/L)
5 5 70 100 7 2 NEAquifer Water Quality
Standard (µg/L)
Analytical Results for Selected Volatile Organic Compounds
MW-204S 06/13/05 3.5 150 1.1 <0.50 12 <0.50 <5.007/01/05 3.9 160 1.2 <0.50 17 <0.50 <5.009/20/06 3.9 190 <1.0 <1.0 13 <1.0 <1.006/12/07 3.3 150 1.4 <0.50 15 <0.50 <0.5012/19/07 4.0 260 <2.0 <1.0 26 <1.0 <1004/30/08 3.7 230 <2.0 <1.0 17 <1.0 <1009/03/08 3.1 210 <2.0 <1.0 20 <1.0 <1012/18/08 3.3 270 <4.0 <2.0 32 <2.0 <2003/05/09 1.4 150 <1.0 <0.50 17 <0.50 <5.009/10/09 2.4 150 <1.0 <0.50 8.9 <0.50 <5.009/16/10 <5.0 140 <10 <5.0 7.0 <5.0 <5009/16/11 3.0 180 <2.0 <1.0 16 <1.0 <10
MW-205S 06/15/05 2.5 77 <0.50 <0.50 7.3 <0.50 <5.006/28/05 2.3 97 <0.50 <0.50 6.0 <0.50 <5.009/20/06 2.2 75 <1.0 <1.0 4.2 <1.0 <1.006/12/07 1.7 83 <0.50 <0.50 5.5 <0.50 <0.5012/18/07 1.3 100 <1.0 <0.5 3.8 <0.5 <5.004/29/08 1.2 110 <1.0 <0.5 2.2 <0.5 <5.009/02/08 1.2 110 <1.0 <0.5 4.5 <0.5 <5.012/17/08 1.4 150 <1.0 <0.5 6.2 <0.5 <5.003/06/09 <0.50 83 <1.0 <0.50 3.0 <0.50 <5.009/09/09 0.91 79 <1.0 <0.50 1.7 <0.50 <5.009/15/10 0.85 67 <1.0 <0.50 3.4 <0.50 <5.009/15/11 1.1 82 <1.0 <0.50 2.7 <0.50 <5.0
MW-206S 09/19/06 2.0 55 <1.0 <1.0 2.5 <1.0 <1.006/12/07 3.0 140 1.8 <0.50 16.0 <0.50 <0.5012/18/07 2.5 180 1.6 <0.5 16 <0.5 <5.004/30/08 2.2 160 <1.0 <0.5 11 <0.5 <5.009/02/08 2.3 150 <2.0 <1.0 16 <1.0 <10.012/18/08 2.3 160 1.1 <1.0 18 <0.5 <5.003/05/09 0.73 74 <1.0 <0.50 8.8 <0.50 <5.009/10/09 1.50 86 <1.0 <0.50 8.7 <0.50 <5.009/16/10 1.6 98 1.1 <0.50 14 <0.50 <5.009/16/11 2.2 130 <2.0 <1.0 14 <1.0 <10
MW-207S 09/19/06 3.9 67 <1.0 <1.0 6.0 <1.0 <1.006/12/07 5.0 51 0.60 <0.50 9.0 <0.50 <0.5012/18/07 2.1 70 <1.0 <0.5 6.6 <0.5 <5.004/29/08 4.1 56 <1.0 <0.5 2.7 <0.5 <5.009/02/08 2.3 66 <1.0 <0.5 3.6 <0.5 <5.012/17/08 3.2 100 <1.0 <0.5 13 <0.5 <5.003/06/09 2.7 39 <0.50 <0.50 6.5 <0.50 <5.009/10/09 2.0 37 <1.0 <0.50 2.5 <0.50 <5.009/15/10 7.2 55 0.54 <0.50 6.6 <0.50 <5.009/15/11 5.6 50 <1.0 <0.50 3.3 <0.50 <5.0
MW-208S 10/30/07 0.95 49 1.3 <0.50 <1.0 <0.50 <5.012/18/07 0.98 72 <1.0 <0.5 6.3 <0.5 <5.004/29/08 0.57 47 <1.0 <0.5 2.4 <0.5 <5.009/02/08 0.55 39 <1.0 <0.5 2.9 <0.5 <5.012/16/08 0.85 69 <1.0 <0.5 7.2 <0.5 <5.003/05/09 <0.50 12 <0.50 <0.50 1.8 <0.50 <5.009/09/09 <0.50 28 <1.0 <0.50 <1.0 <0.50 <5.009/15/10 <0.50 22 <1.0 <0.50 2.0 <0.50 <5.009/15/11 0.53 32 <1.0 <0.50 2.8 <0.50 <5.0
2209.0044 of 9 GeoTrans, Inc.
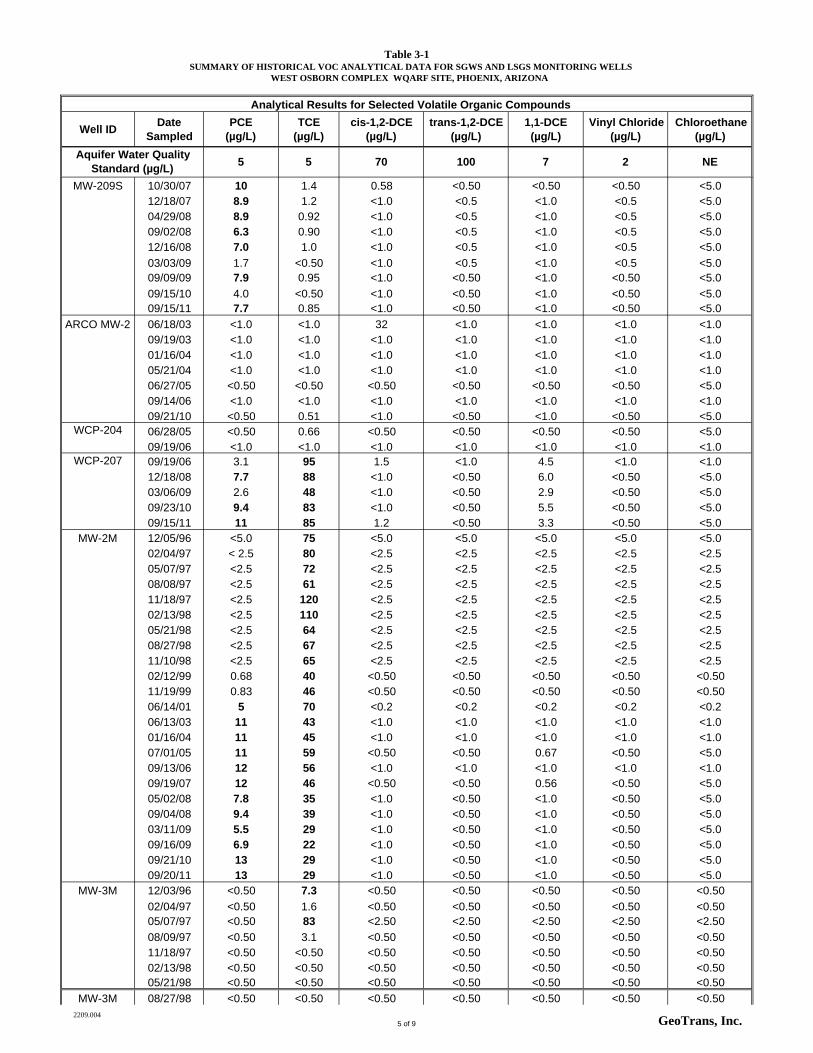
Table 3-1SUMMARY OF HISTORICAL VOC ANALYTICAL DATA FOR SGWS AND LSGS MONITORING WELLS
WEST OSBORN COMPLEX WQARF SITE, PHOENIX, ARIZONA
Well IDDate
SampledPCE
(µg/L)TCE
(µg/L)cis-1,2-DCE
(µg/L)trans-1,2-DCE
(µg/L)1,1-DCE (µg/L)
Vinyl Chloride (µg/L)
Chloroethane (µg/L)
5 5 70 100 7 2 NEAquifer Water Quality
Standard (µg/L)
Analytical Results for Selected Volatile Organic Compounds
MW-209S 10/30/07 10 1.4 0.58 <0.50 <0.50 <0.50 <5.012/18/07 8.9 1.2 <1.0 <0.5 <1.0 <0.5 <5.004/29/08 8.9 0.92 <1.0 <0.5 <1.0 <0.5 <5.009/02/08 6.3 0.90 <1.0 <0.5 <1.0 <0.5 <5.012/16/08 7.0 1.0 <1.0 <0.5 <1.0 <0.5 <5.0
03/03/09 1.7 <0.50 <1.0 <0.5 <1.0 <0.5 <5.009/09/09 7.9 0.95 <1.0 <0.50 <1.0 <0.50 <5.0
09/15/10 4.0 <0.50 <1.0 <0.50 <1.0 <0.50 <5.009/15/11 7.7 0.85 <1.0 <0.50 <1.0 <0.50 <5.0
ARCO MW-2 06/18/03 <1.0 <1.0 32 <1.0 <1.0 <1.0 <1.009/19/03 <1.0 <1.0 <1.0 <1.0 <1.0 <1.0 <1.001/16/04 <1.0 <1.0 <1.0 <1.0 <1.0 <1.0 <1.005/21/04 <1.0 <1.0 <1.0 <1.0 <1.0 <1.0 <1.006/27/05 <0.50 <0.50 <0.50 <0.50 <0.50 <0.50 <5.009/14/06 <1.0 <1.0 <1.0 <1.0 <1.0 <1.0 <1.009/21/10 <0.50 0.51 <1.0 <0.50 <1.0 <0.50 <5.0
WCP-204 06/28/05 <0.50 0.66 <0.50 <0.50 <0.50 <0.50 <5.009/19/06 <1.0 <1.0 <1.0 <1.0 <1.0 <1.0 <1.0
WCP-207 09/19/06 3.1 95 1.5 <1.0 4.5 <1.0 <1.012/18/08 7.7 88 <1.0 <0.50 6.0 <0.50 <5.003/06/09 2.6 48 <1.0 <0.50 2.9 <0.50 <5.009/23/10 9.4 83 <1.0 <0.50 5.5 <0.50 <5.009/15/11 11 85 1.2 <0.50 3.3 <0.50 <5.0
MW-2M 12/05/96 <5.0 75 <5.0 <5.0 <5.0 <5.0 <5.002/04/97 < 2.5 80 <2.5 <2.5 <2.5 <2.5 <2.505/07/97 <2.5 72 <2.5 <2.5 <2.5 <2.5 <2.508/08/97 <2.5 61 <2.5 <2.5 <2.5 <2.5 <2.511/18/97 <2.5 120 <2.5 <2.5 <2.5 <2.5 <2.502/13/98 <2.5 110 <2.5 <2.5 <2.5 <2.5 <2.505/21/98 <2.5 64 <2.5 <2.5 <2.5 <2.5 <2.508/27/98 <2.5 67 <2.5 <2.5 <2.5 <2.5 <2.511/10/98 <2.5 65 <2.5 <2.5 <2.5 <2.5 <2.502/12/99 0.68 40 <0.50 <0.50 <0.50 <0.50 <0.5011/19/99 0.83 46 <0.50 <0.50 <0.50 <0.50 <0.5006/14/01 5 70 <0.2 <0.2 <0.2 <0.2 <0.206/13/03 11 43 <1.0 <1.0 <1.0 <1.0 <1.001/16/04 11 45 <1.0 <1.0 <1.0 <1.0 <1.007/01/05 11 59 <0.50 <0.50 0.67 <0.50 <5.009/13/06 12 56 <1.0 <1.0 <1.0 <1.0 <1.009/19/07 12 46 <0.50 <0.50 0.56 <0.50 <5.005/02/08 7.8 35 <1.0 <0.50 <1.0 <0.50 <5.009/04/08 9.4 39 <1.0 <0.50 <1.0 <0.50 <5.003/11/09 5.5 29 <1.0 <0.50 <1.0 <0.50 <5.009/16/09 6.9 22 <1.0 <0.50 <1.0 <0.50 <5.009/21/10 13 29 <1.0 <0.50 <1.0 <0.50 <5.009/20/11 13 29 <1.0 <0.50 <1.0 <0.50 <5.0
MW-3M 12/03/96 <0.50 7.3 <0.50 <0.50 <0.50 <0.50 <0.50
02/04/97 <0.50 1.6 <0.50 <0.50 <0.50 <0.50 <0.5005/07/97 <0.50 83 <2.50 <2.50 <2.50 <2.50 <2.50
08/09/97 <0.50 3.1 <0.50 <0.50 <0.50 <0.50 <0.5011/18/97 <0.50 <0.50 <0.50 <0.50 <0.50 <0.50 <0.5002/13/98 <0.50 <0.50 <0.50 <0.50 <0.50 <0.50 <0.5005/21/98 <0.50 <0.50 <0.50 <0.50 <0.50 <0.50 <0.50
MW-3M 08/27/98 <0.50 <0.50 <0.50 <0.50 <0.50 <0.50 <0.50 2209.004
5 of 9 GeoTrans, Inc.
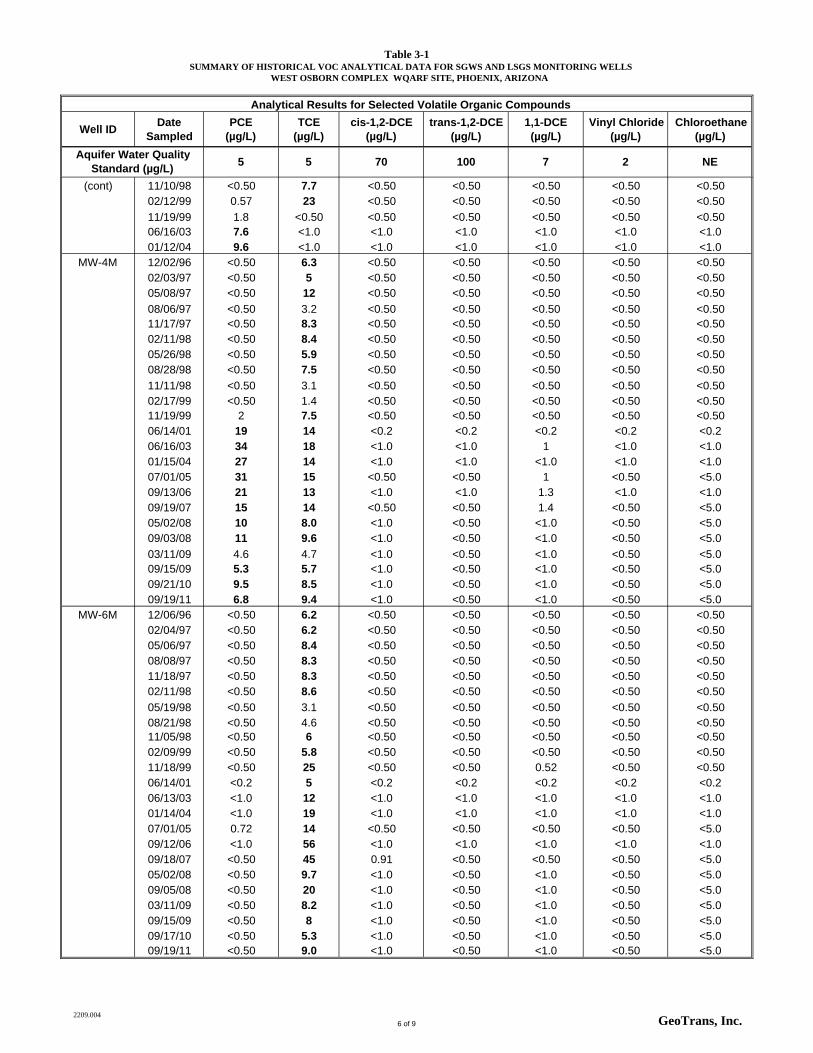
Table 3-1SUMMARY OF HISTORICAL VOC ANALYTICAL DATA FOR SGWS AND LSGS MONITORING WELLS
WEST OSBORN COMPLEX WQARF SITE, PHOENIX, ARIZONA
Well IDDate
SampledPCE
(µg/L)TCE
(µg/L)cis-1,2-DCE
(µg/L)trans-1,2-DCE
(µg/L)1,1-DCE (µg/L)
Vinyl Chloride (µg/L)
Chloroethane (µg/L)
5 5 70 100 7 2 NEAquifer Water Quality
Standard (µg/L)
Analytical Results for Selected Volatile Organic Compounds
(cont) 11/10/98 <0.50 7.7 <0.50 <0.50 <0.50 <0.50 <0.5002/12/99 0.57 23 <0.50 <0.50 <0.50 <0.50 <0.50
11/19/99 1.8 <0.50 <0.50 <0.50 <0.50 <0.50 <0.5006/16/03 7.6 <1.0 <1.0 <1.0 <1.0 <1.0 <1.001/12/04 9.6 <1.0 <1.0 <1.0 <1.0 <1.0 <1.0
MW-4M 12/02/96 <0.50 6.3 <0.50 <0.50 <0.50 <0.50 <0.5002/03/97 <0.50 5 <0.50 <0.50 <0.50 <0.50 <0.5005/08/97 <0.50 12 <0.50 <0.50 <0.50 <0.50 <0.50
08/06/97 <0.50 3.2 <0.50 <0.50 <0.50 <0.50 <0.5011/17/97 <0.50 8.3 <0.50 <0.50 <0.50 <0.50 <0.5002/11/98 <0.50 8.4 <0.50 <0.50 <0.50 <0.50 <0.5005/26/98 <0.50 5.9 <0.50 <0.50 <0.50 <0.50 <0.5008/28/98 <0.50 7.5 <0.50 <0.50 <0.50 <0.50 <0.50
11/11/98 <0.50 3.1 <0.50 <0.50 <0.50 <0.50 <0.5002/17/99 <0.50 1.4 <0.50 <0.50 <0.50 <0.50 <0.5011/19/99 2 7.5 <0.50 <0.50 <0.50 <0.50 <0.5006/14/01 19 14 <0.2 <0.2 <0.2 <0.2 <0.206/16/03 34 18 <1.0 <1.0 1 <1.0 <1.001/15/04 27 14 <1.0 <1.0 <1.0 <1.0 <1.007/01/05 31 15 <0.50 <0.50 1 <0.50 <5.009/13/06 21 13 <1.0 <1.0 1.3 <1.0 <1.009/19/07 15 14 <0.50 <0.50 1.4 <0.50 <5.005/02/08 10 8.0 <1.0 <0.50 <1.0 <0.50 <5.009/03/08 11 9.6 <1.0 <0.50 <1.0 <0.50 <5.0
03/11/09 4.6 4.7 <1.0 <0.50 <1.0 <0.50 <5.009/15/09 5.3 5.7 <1.0 <0.50 <1.0 <0.50 <5.009/21/10 9.5 8.5 <1.0 <0.50 <1.0 <0.50 <5.009/19/11 6.8 9.4 <1.0 <0.50 <1.0 <0.50 <5.0
MW-6M 12/06/96 <0.50 6.2 <0.50 <0.50 <0.50 <0.50 <0.5002/04/97 <0.50 6.2 <0.50 <0.50 <0.50 <0.50 <0.5005/06/97 <0.50 8.4 <0.50 <0.50 <0.50 <0.50 <0.5008/08/97 <0.50 8.3 <0.50 <0.50 <0.50 <0.50 <0.5011/18/97 <0.50 8.3 <0.50 <0.50 <0.50 <0.50 <0.5002/11/98 <0.50 8.6 <0.50 <0.50 <0.50 <0.50 <0.50
05/19/98 <0.50 3.1 <0.50 <0.50 <0.50 <0.50 <0.5008/21/98 <0.50 4.6 <0.50 <0.50 <0.50 <0.50 <0.5011/05/98 <0.50 6 <0.50 <0.50 <0.50 <0.50 <0.5002/09/99 <0.50 5.8 <0.50 <0.50 <0.50 <0.50 <0.5011/18/99 <0.50 25 <0.50 <0.50 0.52 <0.50 <0.5006/14/01 <0.2 5 <0.2 <0.2 <0.2 <0.2 <0.206/13/03 <1.0 12 <1.0 <1.0 <1.0 <1.0 <1.001/14/04 <1.0 19 <1.0 <1.0 <1.0 <1.0 <1.007/01/05 0.72 14 <0.50 <0.50 <0.50 <0.50 <5.009/12/06 <1.0 56 <1.0 <1.0 <1.0 <1.0 <1.009/18/07 <0.50 45 0.91 <0.50 <0.50 <0.50 <5.005/02/08 <0.50 9.7 <1.0 <0.50 <1.0 <0.50 <5.009/05/08 <0.50 20 <1.0 <0.50 <1.0 <0.50 <5.003/11/09 <0.50 8.2 <1.0 <0.50 <1.0 <0.50 <5.009/15/09 <0.50 8 <1.0 <0.50 <1.0 <0.50 <5.009/17/10 <0.50 5.3 <1.0 <0.50 <1.0 <0.50 <5.009/19/11 <0.50 9.0 <1.0 <0.50 <1.0 <0.50 <5.0
2209.0046 of 9 GeoTrans, Inc.
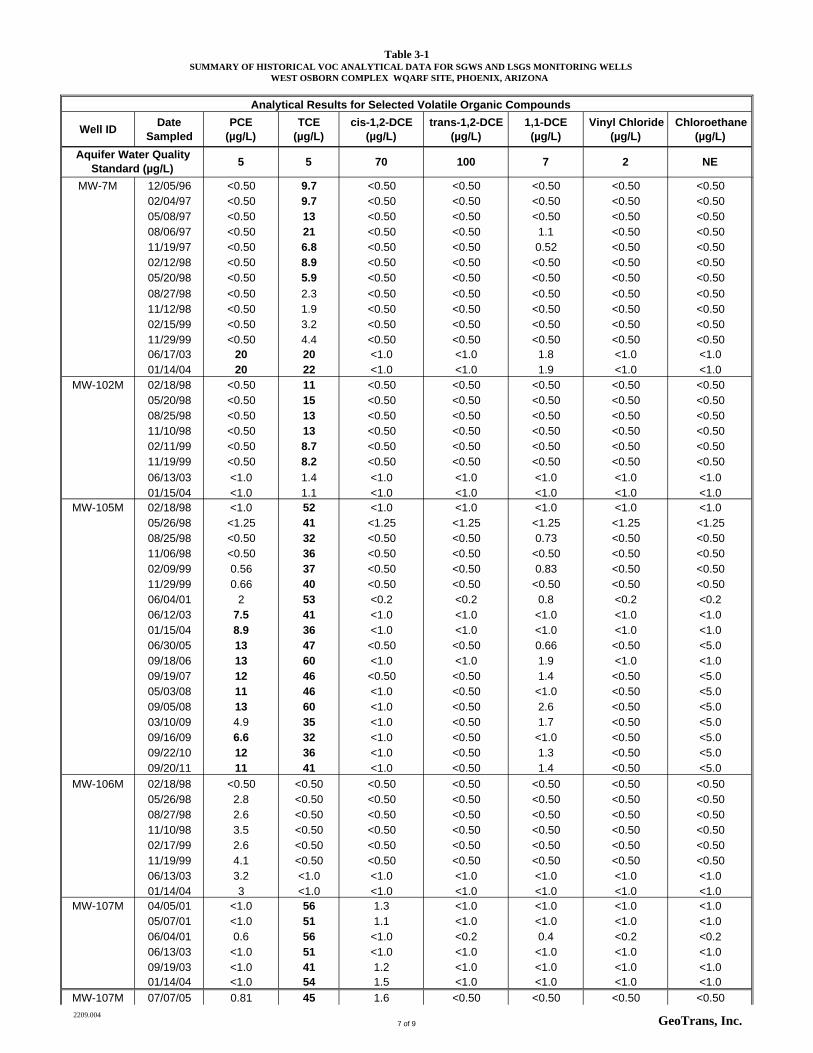
Table 3-1SUMMARY OF HISTORICAL VOC ANALYTICAL DATA FOR SGWS AND LSGS MONITORING WELLS
WEST OSBORN COMPLEX WQARF SITE, PHOENIX, ARIZONA
Well IDDate
SampledPCE
(µg/L)TCE
(µg/L)cis-1,2-DCE
(µg/L)trans-1,2-DCE
(µg/L)1,1-DCE (µg/L)
Vinyl Chloride (µg/L)
Chloroethane (µg/L)
5 5 70 100 7 2 NEAquifer Water Quality
Standard (µg/L)
Analytical Results for Selected Volatile Organic Compounds
MW-7M 12/05/96 <0.50 9.7 <0.50 <0.50 <0.50 <0.50 <0.5002/04/97 <0.50 9.7 <0.50 <0.50 <0.50 <0.50 <0.5005/08/97 <0.50 13 <0.50 <0.50 <0.50 <0.50 <0.5008/06/97 <0.50 21 <0.50 <0.50 1.1 <0.50 <0.5011/19/97 <0.50 6.8 <0.50 <0.50 0.52 <0.50 <0.5002/12/98 <0.50 8.9 <0.50 <0.50 <0.50 <0.50 <0.5005/20/98 <0.50 5.9 <0.50 <0.50 <0.50 <0.50 <0.50
08/27/98 <0.50 2.3 <0.50 <0.50 <0.50 <0.50 <0.5011/12/98 <0.50 1.9 <0.50 <0.50 <0.50 <0.50 <0.5002/15/99 <0.50 3.2 <0.50 <0.50 <0.50 <0.50 <0.5011/29/99 <0.50 4.4 <0.50 <0.50 <0.50 <0.50 <0.5006/17/03 20 20 <1.0 <1.0 1.8 <1.0 <1.001/14/04 20 22 <1.0 <1.0 1.9 <1.0 <1.0
MW-102M 02/18/98 <0.50 11 <0.50 <0.50 <0.50 <0.50 <0.5005/20/98 <0.50 15 <0.50 <0.50 <0.50 <0.50 <0.5008/25/98 <0.50 13 <0.50 <0.50 <0.50 <0.50 <0.5011/10/98 <0.50 13 <0.50 <0.50 <0.50 <0.50 <0.5002/11/99 <0.50 8.7 <0.50 <0.50 <0.50 <0.50 <0.5011/19/99 <0.50 8.2 <0.50 <0.50 <0.50 <0.50 <0.50
06/13/03 <1.0 1.4 <1.0 <1.0 <1.0 <1.0 <1.001/15/04 <1.0 1.1 <1.0 <1.0 <1.0 <1.0 <1.0
MW-105M 02/18/98 <1.0 52 <1.0 <1.0 <1.0 <1.0 <1.005/26/98 <1.25 41 <1.25 <1.25 <1.25 <1.25 <1.2508/25/98 <0.50 32 <0.50 <0.50 0.73 <0.50 <0.5011/06/98 <0.50 36 <0.50 <0.50 <0.50 <0.50 <0.5002/09/99 0.56 37 <0.50 <0.50 0.83 <0.50 <0.5011/29/99 0.66 40 <0.50 <0.50 <0.50 <0.50 <0.5006/04/01 2 53 <0.2 <0.2 0.8 <0.2 <0.206/12/03 7.5 41 <1.0 <1.0 <1.0 <1.0 <1.001/15/04 8.9 36 <1.0 <1.0 <1.0 <1.0 <1.006/30/05 13 47 <0.50 <0.50 0.66 <0.50 <5.009/18/06 13 60 <1.0 <1.0 1.9 <1.0 <1.009/19/07 12 46 <0.50 <0.50 1.4 <0.50 <5.005/03/08 11 46 <1.0 <0.50 <1.0 <0.50 <5.009/05/08 13 60 <1.0 <0.50 2.6 <0.50 <5.003/10/09 4.9 35 <1.0 <0.50 1.7 <0.50 <5.009/16/09 6.6 32 <1.0 <0.50 <1.0 <0.50 <5.009/22/10 12 36 <1.0 <0.50 1.3 <0.50 <5.009/20/11 11 41 <1.0 <0.50 1.4 <0.50 <5.0
MW-106M 02/18/98 <0.50 <0.50 <0.50 <0.50 <0.50 <0.50 <0.5005/26/98 2.8 <0.50 <0.50 <0.50 <0.50 <0.50 <0.5008/27/98 2.6 <0.50 <0.50 <0.50 <0.50 <0.50 <0.5011/10/98 3.5 <0.50 <0.50 <0.50 <0.50 <0.50 <0.5002/17/99 2.6 <0.50 <0.50 <0.50 <0.50 <0.50 <0.5011/19/99 4.1 <0.50 <0.50 <0.50 <0.50 <0.50 <0.5006/13/03 3.2 <1.0 <1.0 <1.0 <1.0 <1.0 <1.001/14/04 3 <1.0 <1.0 <1.0 <1.0 <1.0 <1.0
MW-107M 04/05/01 <1.0 56 1.3 <1.0 <1.0 <1.0 <1.005/07/01 <1.0 51 1.1 <1.0 <1.0 <1.0 <1.006/04/01 0.6 56 <1.0 <0.2 0.4 <0.2 <0.206/13/03 <1.0 51 <1.0 <1.0 <1.0 <1.0 <1.009/19/03 <1.0 41 1.2 <1.0 <1.0 <1.0 <1.001/14/04 <1.0 54 1.5 <1.0 <1.0 <1.0 <1.0
MW-107M 07/07/05 0.81 45 1.6 <0.50 <0.50 <0.50 <0.50
2209.0047 of 9 GeoTrans, Inc.
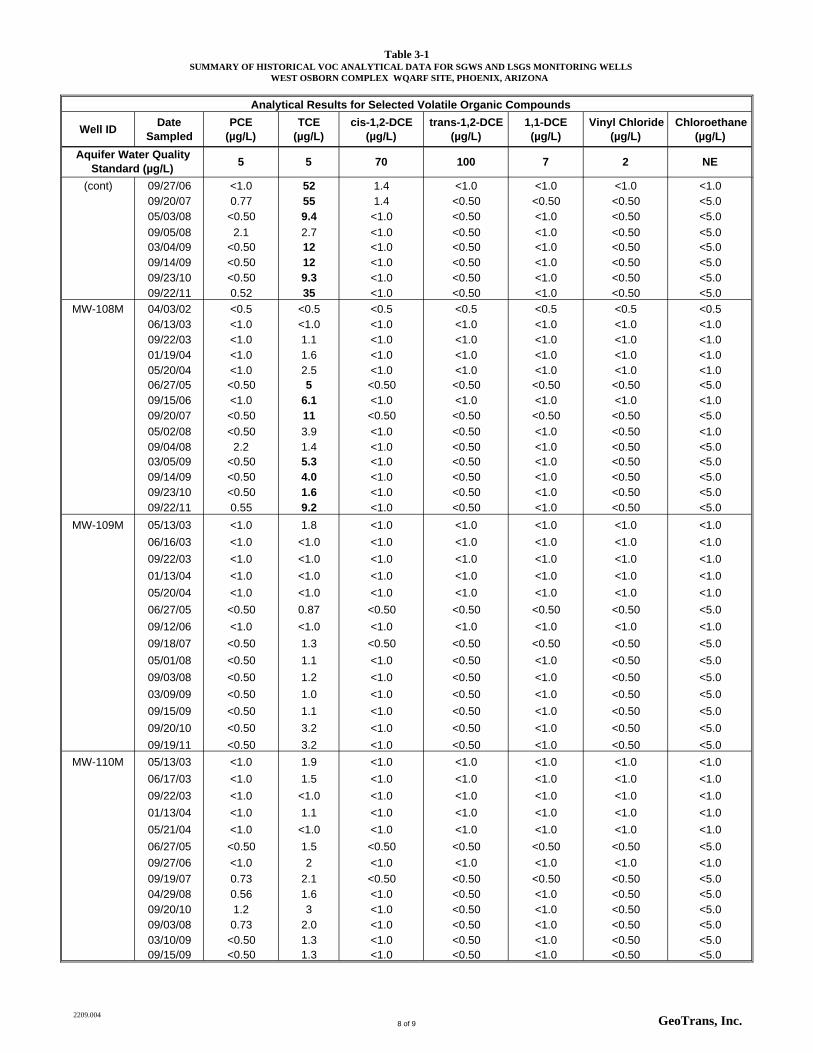
Table 3-1SUMMARY OF HISTORICAL VOC ANALYTICAL DATA FOR SGWS AND LSGS MONITORING WELLS
WEST OSBORN COMPLEX WQARF SITE, PHOENIX, ARIZONA
Well IDDate
SampledPCE
(µg/L)TCE
(µg/L)cis-1,2-DCE
(µg/L)trans-1,2-DCE
(µg/L)1,1-DCE (µg/L)
Vinyl Chloride (µg/L)
Chloroethane (µg/L)
5 5 70 100 7 2 NEAquifer Water Quality
Standard (µg/L)
Analytical Results for Selected Volatile Organic Compounds
(cont) 09/27/06 <1.0 52 1.4 <1.0 <1.0 <1.0 <1.009/20/07 0.77 55 1.4 <0.50 <0.50 <0.50 <5.005/03/08 <0.50 9.4 <1.0 <0.50 <1.0 <0.50 <5.0
09/05/08 2.1 2.7 <1.0 <0.50 <1.0 <0.50 <5.003/04/09 <0.50 12 <1.0 <0.50 <1.0 <0.50 <5.009/14/09 <0.50 12 <1.0 <0.50 <1.0 <0.50 <5.009/23/10 <0.50 9.3 <1.0 <0.50 <1.0 <0.50 <5.009/22/11 0.52 35 <1.0 <0.50 <1.0 <0.50 <5.0
MW-108M 04/03/02 <0.5 <0.5 <0.5 <0.5 <0.5 <0.5 <0.506/13/03 <1.0 <1.0 <1.0 <1.0 <1.0 <1.0 <1.009/22/03 <1.0 1.1 <1.0 <1.0 <1.0 <1.0 <1.001/19/04 <1.0 1.6 <1.0 <1.0 <1.0 <1.0 <1.005/20/04 <1.0 2.5 <1.0 <1.0 <1.0 <1.0 <1.006/27/05 <0.50 5 <0.50 <0.50 <0.50 <0.50 <5.009/15/06 <1.0 6.1 <1.0 <1.0 <1.0 <1.0 <1.009/20/07 <0.50 11 <0.50 <0.50 <0.50 <0.50 <5.0
05/02/08 <0.50 3.9 <1.0 <0.50 <1.0 <0.50 <1.009/04/08 2.2 1.4 <1.0 <0.50 <1.0 <0.50 <5.003/05/09 <0.50 5.3 <1.0 <0.50 <1.0 <0.50 <5.009/14/09 <0.50 4.0 <1.0 <0.50 <1.0 <0.50 <5.009/23/10 <0.50 1.6 <1.0 <0.50 <1.0 <0.50 <5.009/22/11 0.55 9.2 <1.0 <0.50 <1.0 <0.50 <5.0
MW-109M 05/13/03 <1.0 1.8 <1.0 <1.0 <1.0 <1.0 <1.0
06/16/03 <1.0 <1.0 <1.0 <1.0 <1.0 <1.0 <1.0
09/22/03 <1.0 <1.0 <1.0 <1.0 <1.0 <1.0 <1.0
01/13/04 <1.0 <1.0 <1.0 <1.0 <1.0 <1.0 <1.0
05/20/04 <1.0 <1.0 <1.0 <1.0 <1.0 <1.0 <1.0
06/27/05 <0.50 0.87 <0.50 <0.50 <0.50 <0.50 <5.0
09/12/06 <1.0 <1.0 <1.0 <1.0 <1.0 <1.0 <1.0
09/18/07 <0.50 1.3 <0.50 <0.50 <0.50 <0.50 <5.0
05/01/08 <0.50 1.1 <1.0 <0.50 <1.0 <0.50 <5.0
09/03/08 <0.50 1.2 <1.0 <0.50 <1.0 <0.50 <5.0
03/09/09 <0.50 1.0 <1.0 <0.50 <1.0 <0.50 <5.0
09/15/09 <0.50 1.1 <1.0 <0.50 <1.0 <0.50 <5.0
09/20/10 <0.50 3.2 <1.0 <0.50 <1.0 <0.50 <5.0
09/19/11 <0.50 3.2 <1.0 <0.50 <1.0 <0.50 <5.0
MW-110M 05/13/03 <1.0 1.9 <1.0 <1.0 <1.0 <1.0 <1.0
06/17/03 <1.0 1.5 <1.0 <1.0 <1.0 <1.0 <1.0
09/22/03 <1.0 <1.0 <1.0 <1.0 <1.0 <1.0 <1.0
01/13/04 <1.0 1.1 <1.0 <1.0 <1.0 <1.0 <1.0
05/21/04 <1.0 <1.0 <1.0 <1.0 <1.0 <1.0 <1.0
06/27/05 <0.50 1.5 <0.50 <0.50 <0.50 <0.50 <5.0
09/27/06 <1.0 2 <1.0 <1.0 <1.0 <1.0 <1.0
09/19/07 0.73 2.1 <0.50 <0.50 <0.50 <0.50 <5.004/29/08 0.56 1.6 <1.0 <0.50 <1.0 <0.50 <5.009/20/10 1.2 3 <1.0 <0.50 <1.0 <0.50 <5.009/03/08 0.73 2.0 <1.0 <0.50 <1.0 <0.50 <5.003/10/09 <0.50 1.3 <1.0 <0.50 <1.0 <0.50 <5.009/15/09 <0.50 1.3 <1.0 <0.50 <1.0 <0.50 <5.0
2209.0048 of 9 GeoTrans, Inc.
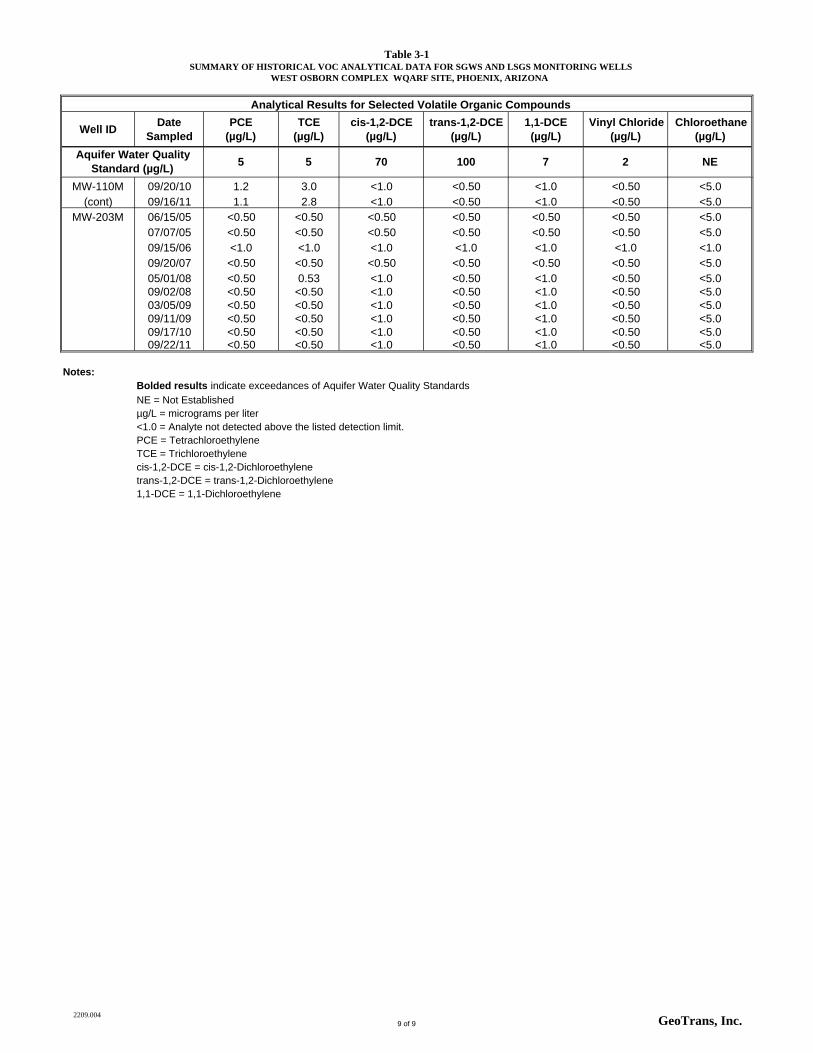
Table 3-1SUMMARY OF HISTORICAL VOC ANALYTICAL DATA FOR SGWS AND LSGS MONITORING WELLS
WEST OSBORN COMPLEX WQARF SITE, PHOENIX, ARIZONA
Well IDDate
SampledPCE
(µg/L)TCE
(µg/L)cis-1,2-DCE
(µg/L)trans-1,2-DCE
(µg/L)1,1-DCE (µg/L)
Vinyl Chloride (µg/L)
Chloroethane (µg/L)
5 5 70 100 7 2 NEAquifer Water Quality
Standard (µg/L)
Analytical Results for Selected Volatile Organic Compounds
MW-110M 09/20/10 1.2 3.0 <1.0 <0.50 <1.0 <0.50 <5.0(cont) 09/16/11 1.1 2.8 <1.0 <0.50 <1.0 <0.50 <5.0
MW-203M 06/15/05 <0.50 <0.50 <0.50 <0.50 <0.50 <0.50 <5.007/07/05 <0.50 <0.50 <0.50 <0.50 <0.50 <0.50 <5.009/15/06 <1.0 <1.0 <1.0 <1.0 <1.0 <1.0 <1.009/20/07 <0.50 <0.50 <0.50 <0.50 <0.50 <0.50 <5.005/01/08 <0.50 0.53 <1.0 <0.50 <1.0 <0.50 <5.009/02/08 <0.50 <0.50 <1.0 <0.50 <1.0 <0.50 <5.003/05/09 <0.50 <0.50 <1.0 <0.50 <1.0 <0.50 <5.009/11/09 <0.50 <0.50 <1.0 <0.50 <1.0 <0.50 <5.009/17/10 <0.50 <0.50 <1.0 <0.50 <1.0 <0.50 <5.009/22/11 <0.50 <0.50 <1.0 <0.50 <1.0 <0.50 <5.0
Notes:Bolded results indicate exceedances of Aquifer Water Quality Standards
NE = Not Establishedµg/L = micrograms per liter<1.0 = Analyte not detected above the listed detection limit.PCE = TetrachloroethyleneTCE = Trichloroethylenecis-1,2-DCE = cis-1,2-Dichloroethylenetrans-1,2-DCE = trans-1,2-Dichloroethylene1,1-DCE = 1,1-Dichloroethylene
2209.0049 of 9 GeoTrans, Inc.
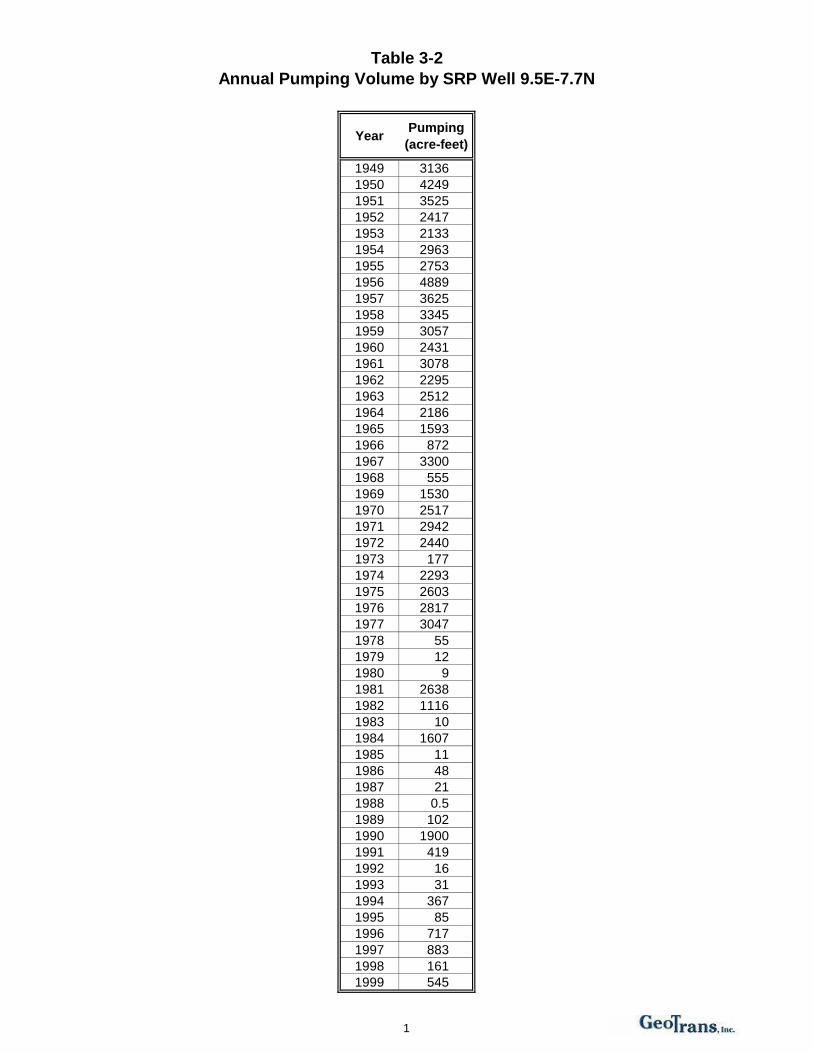
Table 3-2
Annual Pumping Volume by SRP Well 9.5E-7.7N
YearPumping
(acre-feet)
1949 3136
1950 4249
1951 3525
1952 2417
1953 2133
1954 2963
1955 2753
1956 4889
1957 3625
1958 3345
1959 3057
1960 2431
1961 3078
1962 2295
1963 2512
1964 2186
1965 1593
1966 872
1967 3300
1968 555
1969 1530
1970 2517
1971 2942
1972 2440
1973 177
1974 2293
1975 2603
1976 2817
1977 3047
1978 55
1979 12
1980 9
1981 2638
1982 1116
1983 10
1984 1607
1985 11
1986 48
1987 21
1988 0.5
1989 102
1990 1900
1991 419
1992 16
1993 31
1994 367
1995 85
1996 717
1997 883
1998 161
1999 545
1
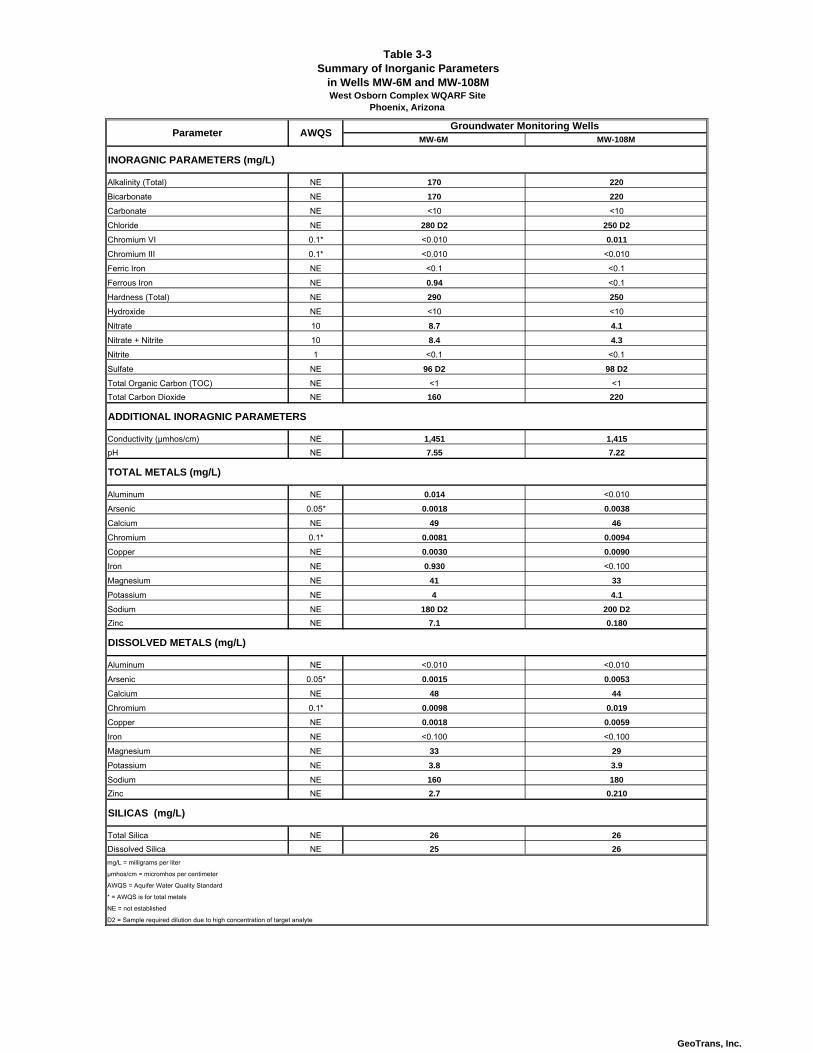
Table 3-3Summary of Inorganic Parameters
in Wells MW-6M and MW-108MWest Osborn Complex WQARF Site
Phoenix, Arizona
MW-6M MW-108M
INORAGNIC PARAMETERS (mg/L)
Alkalinity (Total) NE 170 220
Bicarbonate NE 170 220
Carbonate NE <10 <10
Chloride NE 280 D2 250 D2
Chromium VI 0.1* <0.010 0.011
Chromium III 0.1* <0.010 <0.010
Ferric Iron NE <0.1 <0.1
Ferrous Iron NE 0.94 <0.1
Hardness (Total) NE 290 250
Hydroxide NE <10 <10
Nitrate 10 8.7 4.1
Nitrate + Nitrite 10 8.4 4.3
Nitrite 1 <0.1 <0.1
Sulfate NE 96 D2 98 D2
Total Organic Carbon (TOC) NE <1 <1
Total Carbon Dioxide NE 160 220
ADDITIONAL INORAGNIC PARAMETERS
Conductivity (μmhos/cm) NE 1,451 1,415
pH NE 7.55 7.22
TOTAL METALS (mg/L)
Aluminum NE 0.014 <0.010
Arsenic 0.05* 0.0018 0.0038
Calcium NE 49 46
Chromium 0.1* 0.0081 0.0094
Copper NE 0.0030 0.0090
Iron NE 0.930 <0.100
Magnesium NE 41 33
Potassium NE 4 4.1
Sodium NE 180 D2 200 D2
Zinc NE 7.1 0.180
DISSOLVED METALS (mg/L)
Aluminum NE <0.010 <0.010
Arsenic 0.05* 0.0015 0.0053
Calcium NE 48 44
Chromium 0.1* 0.0098 0.019
Copper NE 0.0018 0.0059
Iron NE <0.100 <0.100
Magnesium NE 33 29
Potassium NE 3.8 3.9
Sodium NE 160 180
Zinc NE 2.7 0.210
SILICAS (mg/L)
Total Silica NE 26 26
Dissolved Silica NE 25 26
mg/L = milligrams per liter
μmhos/cm = micromhos per centimeter
AWQS = Aquifer Water Quality Standard
* = AWQS is for total metals
NE = not established
D2 = Sample required dilution due to high concentration of target analyte
AWQSParameterGroundwater Monitoring Wells
GeoTrans, Inc.
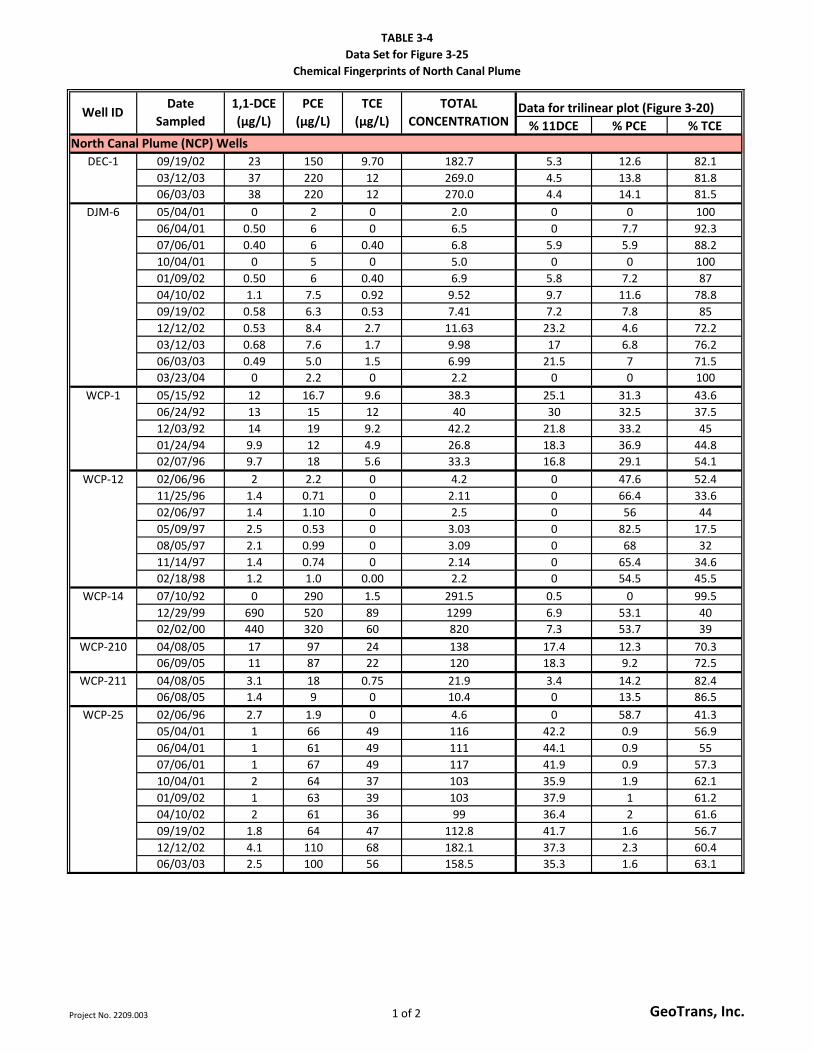
TABLE 3-4
Data Set for Figure 3-25
Chemical Fingerprints of North Canal Plume
% 11DCE % PCE % TCE
09/19/02 23 150 9.70 182.7 5.3 12.6 82.1
03/12/03 37 220 12 269.0 4.5 13.8 81.8
06/03/03 38 220 12 270.0 4.4 14.1 81.5
05/04/01 0 2 0 2.0 0 0 100
06/04/01 0.50 6 0 6.5 0 7.7 92.3
07/06/01 0.40 6 0.40 6.8 5.9 5.9 88.2
10/04/01 0 5 0 5.0 0 0 100
01/09/02 0.50 6 0.40 6.9 5.8 7.2 87
04/10/02 1.1 7.5 0.92 9.52 9.7 11.6 78.8
09/19/02 0.58 6.3 0.53 7.41 7.2 7.8 85
12/12/02 0.53 8.4 2.7 11.63 23.2 4.6 72.2
03/12/03 0.68 7.6 1.7 9.98 17 6.8 76.2
06/03/03 0.49 5.0 1.5 6.99 21.5 7 71.5
03/23/04 0 2.2 0 2.2 0 0 100
05/15/92 12 16.7 9.6 38.3 25.1 31.3 43.6
06/24/92 13 15 12 40 30 32.5 37.5
12/03/92 14 19 9.2 42.2 21.8 33.2 45
01/24/94 9.9 12 4.9 26.8 18.3 36.9 44.8
02/07/96 9.7 18 5.6 33.3 16.8 29.1 54.1
02/06/96 2 2.2 0 4.2 0 47.6 52.4
11/25/96 1.4 0.71 0 2.11 0 66.4 33.6
02/06/97 1.4 1.10 0 2.5 0 56 44
05/09/97 2.5 0.53 0 3.03 0 82.5 17.5
08/05/97 2.1 0.99 0 3.09 0 68 32
11/14/97 1.4 0.74 0 2.14 0 65.4 34.6
02/18/98 1.2 1.0 0.00 2.2 0 54.5 45.5
07/10/92 0 290 1.5 291.5 0.5 0 99.5
12/29/99 690 520 89 1299 6.9 53.1 40
02/02/00 440 320 60 820 7.3 53.7 39
04/08/05 17 97 24 138 17.4 12.3 70.3
06/09/05 11 87 22 120 18.3 9.2 72.5
04/08/05 3.1 18 0.75 21.9 3.4 14.2 82.4
06/08/05 1.4 9 0 10.4 0 13.5 86.5
02/06/96 2.7 1.9 0 4.6 0 58.7 41.3
05/04/01 1 66 49 116 42.2 0.9 56.9
06/04/01 1 61 49 111 44.1 0.9 55
07/06/01 1 67 49 117 41.9 0.9 57.3
10/04/01 2 64 37 103 35.9 1.9 62.1
01/09/02 1 63 39 103 37.9 1 61.2
04/10/02 2 61 36 99 36.4 2 61.6
09/19/02 1.8 64 47 112.8 41.7 1.6 56.7
12/12/02 4.1 110 68 182.1 37.3 2.3 60.4
06/03/03 2.5 100 56 158.5 35.3 1.6 63.1
Well IDDate
Sampled
1,1-DCE
(µg/L)
PCE
(µg/L)
TCE
(µg/L)
WCP-12
TOTAL
CONCENTRATION
WCP-25
North Canal Plume (NCP) Wells
WCP-14
DEC-1
DJM-6
Data for trilinear plot (Figure 3-20)
WCP-211
WCP-210
WCP-1
Project No. 2209.003 1 of 2 GeoTrans, Inc.
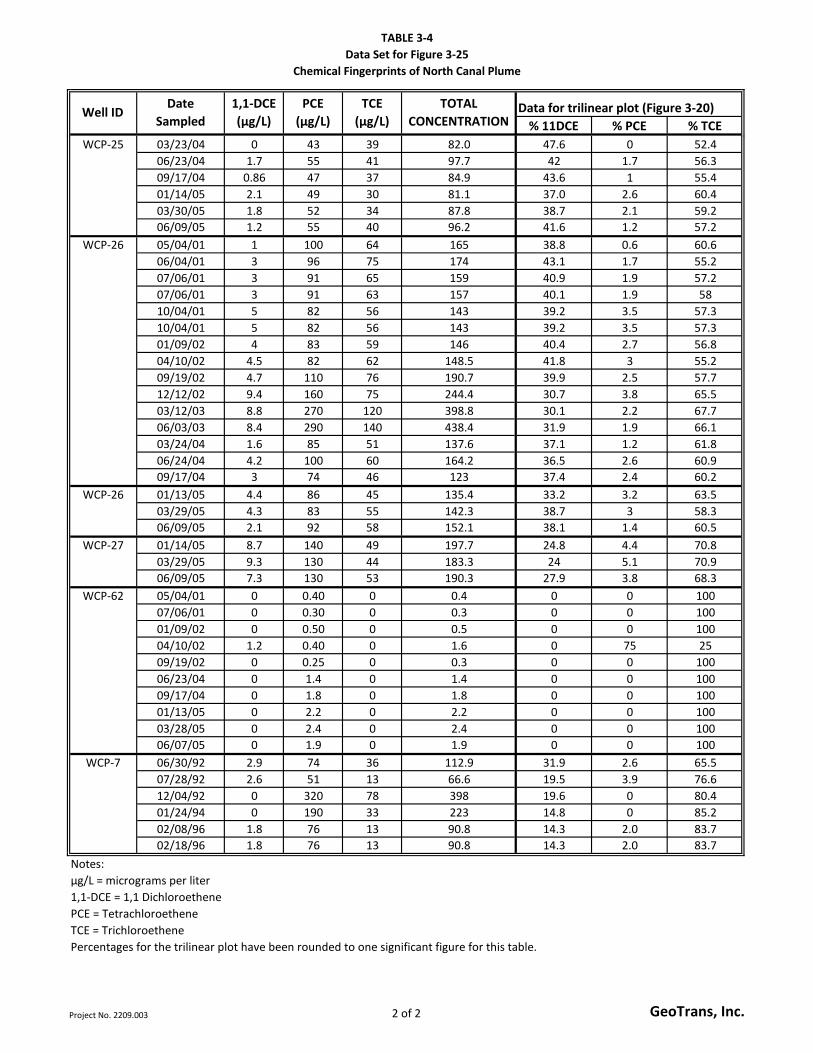
TABLE 3-4
Data Set for Figure 3-25
Chemical Fingerprints of North Canal Plume
% 11DCE % PCE % TCEWell ID
Date
Sampled
1,1-DCE
(µg/L)
PCE
(µg/L)
TCE
(µg/L)
TOTAL
CONCENTRATION
North Canal Plume (NCP) Wells
Data for trilinear plot (Figure 3-20)
03/23/04 0 43 39 82.0 47.6 0 52.4
06/23/04 1.7 55 41 97.7 42 1.7 56.3
09/17/04 0.86 47 37 84.9 43.6 1 55.4
01/14/05 2.1 49 30 81.1 37.0 2.6 60.4
03/30/05 1.8 52 34 87.8 38.7 2.1 59.2
06/09/05 1.2 55 40 96.2 41.6 1.2 57.2
05/04/01 1 100 64 165 38.8 0.6 60.6
06/04/01 3 96 75 174 43.1 1.7 55.2
07/06/01 3 91 65 159 40.9 1.9 57.2
07/06/01 3 91 63 157 40.1 1.9 58
10/04/01 5 82 56 143 39.2 3.5 57.3
10/04/01 5 82 56 143 39.2 3.5 57.3
01/09/02 4 83 59 146 40.4 2.7 56.8
04/10/02 4.5 82 62 148.5 41.8 3 55.2
09/19/02 4.7 110 76 190.7 39.9 2.5 57.7
12/12/02 9.4 160 75 244.4 30.7 3.8 65.5
03/12/03 8.8 270 120 398.8 30.1 2.2 67.7
06/03/03 8.4 290 140 438.4 31.9 1.9 66.1
03/24/04 1.6 85 51 137.6 37.1 1.2 61.8
06/24/04 4.2 100 60 164.2 36.5 2.6 60.9
09/17/04 3 74 46 123 37.4 2.4 60.2
01/13/05 4.4 86 45 135.4 33.2 3.2 63.5
03/29/05 4.3 83 55 142.3 38.7 3 58.3
06/09/05 2.1 92 58 152.1 38.1 1.4 60.5
01/14/05 8.7 140 49 197.7 24.8 4.4 70.8
03/29/05 9.3 130 44 183.3 24 5.1 70.9
06/09/05 7.3 130 53 190.3 27.9 3.8 68.3
05/04/01 0 0.40 0 0.4 0 0 100
07/06/01 0 0.30 0 0.3 0 0 100
01/09/02 0 0.50 0 0.5 0 0 100
04/10/02 1.2 0.40 0 1.6 0 75 25
09/19/02 0 0.25 0 0.3 0 0 100
06/23/04 0 1.4 0 1.4 0 0 100
09/17/04 0 1.8 0 1.8 0 0 100
01/13/05 0 2.2 0 2.2 0 0 100
03/28/05 0 2.4 0 2.4 0 0 100
06/07/05 0 1.9 0 1.9 0 0 100
06/30/92 2.9 74 36 112.9 31.9 2.6 65.5
07/28/92 2.6 51 13 66.6 19.5 3.9 76.6
12/04/92 0 320 78 398 19.6 0 80.4
01/24/94 0 190 33 223 14.8 0 85.2
02/08/96 1.8 76 13 90.8 14.3 2.0 83.7
02/18/96 1.8 76 13 90.8 14.3 2.0 83.7
Notes:
µg/L = micrograms per liter
1,1-DCE = 1,1 Dichloroethene
PCE = Tetrachloroethene
TCE = Trichloroethene
Percentages for the trilinear plot have been rounded to one significant figure for this table.
WCP-26
WCP-25
WCP-26
WCP-7
WCP-62
WCP-27
Project No. 2209.003 2 of 2 GeoTrans, Inc.
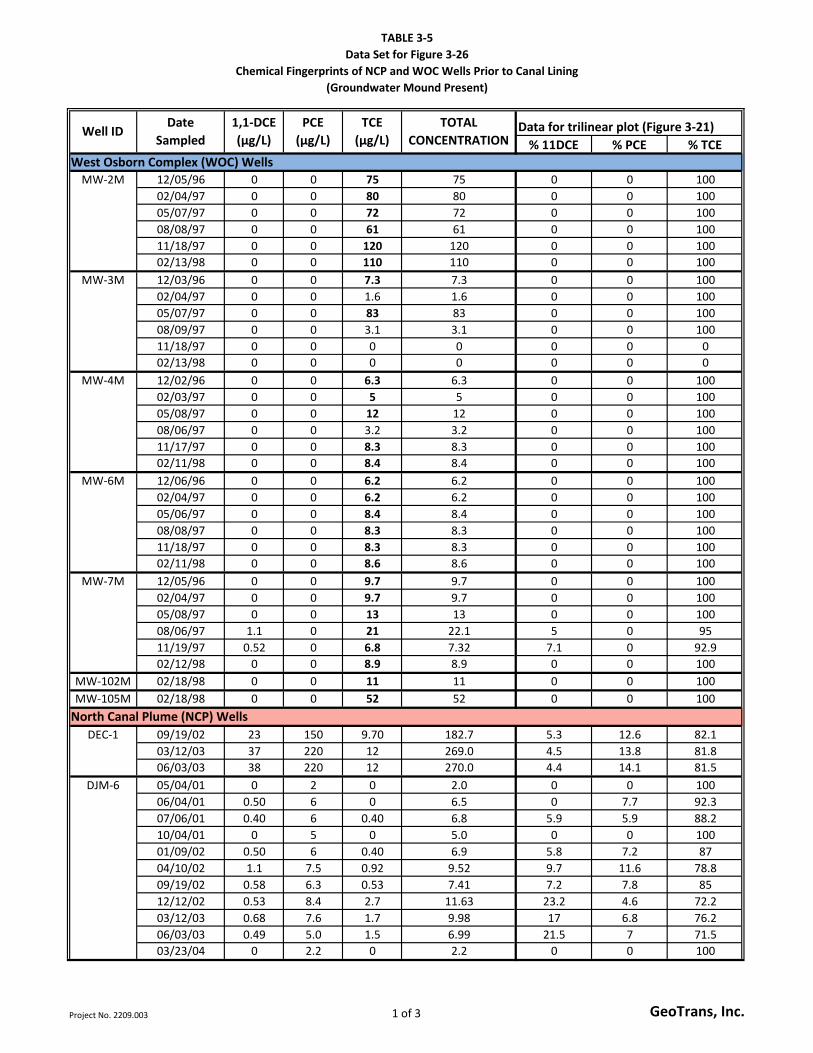
TABLE 3-5
Data Set for Figure 3-26
Chemical Fingerprints of NCP and WOC Wells Prior to Canal Lining
(Groundwater Mound Present)
% 11DCE % PCE % TCE
12/05/96 0 0 75 75 0 0 100
02/04/97 0 0 80 80 0 0 100
05/07/97 0 0 72 72 0 0 100
08/08/97 0 0 61 61 0 0 100
11/18/97 0 0 120 120 0 0 100
02/13/98 0 0 110 110 0 0 100
12/03/96 0 0 7.3 7.3 0 0 100
02/04/97 0 0 1.6 1.6 0 0 100
05/07/97 0 0 83 83 0 0 100
08/09/97 0 0 3.1 3.1 0 0 100
11/18/97 0 0 0 0 0 0 0
02/13/98 0 0 0 0 0 0 0
12/02/96 0 0 6.3 6.3 0 0 100
02/03/97 0 0 5 5 0 0 100
05/08/97 0 0 12 12 0 0 100
08/06/97 0 0 3.2 3.2 0 0 100
11/17/97 0 0 8.3 8.3 0 0 100
02/11/98 0 0 8.4 8.4 0 0 100
12/06/96 0 0 6.2 6.2 0 0 100
02/04/97 0 0 6.2 6.2 0 0 100
05/06/97 0 0 8.4 8.4 0 0 100
08/08/97 0 0 8.3 8.3 0 0 100
11/18/97 0 0 8.3 8.3 0 0 100
02/11/98 0 0 8.6 8.6 0 0 100
12/05/96 0 0 9.7 9.7 0 0 100
02/04/97 0 0 9.7 9.7 0 0 100
05/08/97 0 0 13 13 0 0 100
08/06/97 1.1 0 21 22.1 5 0 95
11/19/97 0.52 0 6.8 7.32 7.1 0 92.9
02/12/98 0 0 8.9 8.9 0 0 100
MW-102M 02/18/98 0 0 11 11 0 0 100
MW-105M 02/18/98 0 0 52 52 0 0 100
09/19/02 23 150 9.70 182.7 5.3 12.6 82.1
03/12/03 37 220 12 269.0 4.5 13.8 81.8
06/03/03 38 220 12 270.0 4.4 14.1 81.5
05/04/01 0 2 0 2.0 0 0 100
06/04/01 0.50 6 0 6.5 0 7.7 92.3
07/06/01 0.40 6 0.40 6.8 5.9 5.9 88.2
10/04/01 0 5 0 5.0 0 0 100
01/09/02 0.50 6 0.40 6.9 5.8 7.2 87
04/10/02 1.1 7.5 0.92 9.52 9.7 11.6 78.8
09/19/02 0.58 6.3 0.53 7.41 7.2 7.8 85
12/12/02 0.53 8.4 2.7 11.63 23.2 4.6 72.2
03/12/03 0.68 7.6 1.7 9.98 17 6.8 76.2
06/03/03 0.49 5.0 1.5 6.99 21.5 7 71.5
03/23/04 0 2.2 0 2.2 0 0 100
MW-7M
MW-2M
MW-3M
MW-4M
MW-6M
DEC-1
Data for trilinear plot (Figure 3-21)Well IDDate
Sampled
1,1-DCE
(µg/L)
PCE
(µg/L)
TOTAL
CONCENTRATION
West Osborn Complex (WOC) Wells
North Canal Plume (NCP) Wells
TCE
(µg/L)
DJM-6
Project No. 2209.003 1 of 3 GeoTrans, Inc.
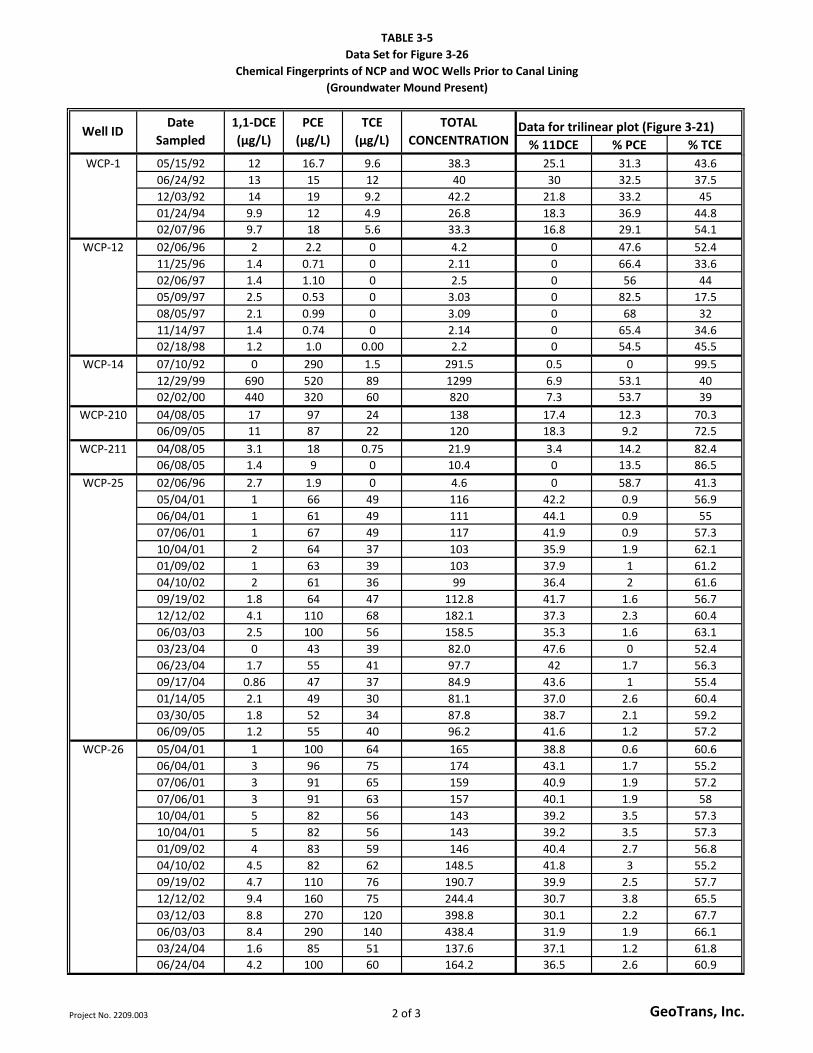
TABLE 3-5
Data Set for Figure 3-26
Chemical Fingerprints of NCP and WOC Wells Prior to Canal Lining
(Groundwater Mound Present)
% 11DCE % PCE % TCE
Data for trilinear plot (Figure 3-21)Well IDDate
Sampled
1,1-DCE
(µg/L)
PCE
(µg/L)
TOTAL
CONCENTRATION
West Osborn Complex (WOC) Wells
TCE
(µg/L)
05/15/92 12 16.7 9.6 38.3 25.1 31.3 43.6
06/24/92 13 15 12 40 30 32.5 37.5
12/03/92 14 19 9.2 42.2 21.8 33.2 45
01/24/94 9.9 12 4.9 26.8 18.3 36.9 44.8
02/07/96 9.7 18 5.6 33.3 16.8 29.1 54.1
02/06/96 2 2.2 0 4.2 0 47.6 52.4
11/25/96 1.4 0.71 0 2.11 0 66.4 33.6
02/06/97 1.4 1.10 0 2.5 0 56 44
05/09/97 2.5 0.53 0 3.03 0 82.5 17.5
08/05/97 2.1 0.99 0 3.09 0 68 32
11/14/97 1.4 0.74 0 2.14 0 65.4 34.6
02/18/98 1.2 1.0 0.00 2.2 0 54.5 45.5
07/10/92 0 290 1.5 291.5 0.5 0 99.5
12/29/99 690 520 89 1299 6.9 53.1 40
02/02/00 440 320 60 820 7.3 53.7 39
04/08/05 17 97 24 138 17.4 12.3 70.3
06/09/05 11 87 22 120 18.3 9.2 72.5
04/08/05 3.1 18 0.75 21.9 3.4 14.2 82.4
06/08/05 1.4 9 0 10.4 0 13.5 86.5
02/06/96 2.7 1.9 0 4.6 0 58.7 41.3
05/04/01 1 66 49 116 42.2 0.9 56.9
06/04/01 1 61 49 111 44.1 0.9 55
07/06/01 1 67 49 117 41.9 0.9 57.3
10/04/01 2 64 37 103 35.9 1.9 62.1
01/09/02 1 63 39 103 37.9 1 61.2
04/10/02 2 61 36 99 36.4 2 61.6
09/19/02 1.8 64 47 112.8 41.7 1.6 56.7
12/12/02 4.1 110 68 182.1 37.3 2.3 60.4
06/03/03 2.5 100 56 158.5 35.3 1.6 63.1
03/23/04 0 43 39 82.0 47.6 0 52.4
06/23/04 1.7 55 41 97.7 42 1.7 56.3
09/17/04 0.86 47 37 84.9 43.6 1 55.4
01/14/05 2.1 49 30 81.1 37.0 2.6 60.4
03/30/05 1.8 52 34 87.8 38.7 2.1 59.2
06/09/05 1.2 55 40 96.2 41.6 1.2 57.2
05/04/01 1 100 64 165 38.8 0.6 60.6
06/04/01 3 96 75 174 43.1 1.7 55.2
07/06/01 3 91 65 159 40.9 1.9 57.2
07/06/01 3 91 63 157 40.1 1.9 58
10/04/01 5 82 56 143 39.2 3.5 57.3
10/04/01 5 82 56 143 39.2 3.5 57.3
01/09/02 4 83 59 146 40.4 2.7 56.8
04/10/02 4.5 82 62 148.5 41.8 3 55.2
09/19/02 4.7 110 76 190.7 39.9 2.5 57.7
12/12/02 9.4 160 75 244.4 30.7 3.8 65.5
03/12/03 8.8 270 120 398.8 30.1 2.2 67.7
06/03/03 8.4 290 140 438.4 31.9 1.9 66.1
03/24/04 1.6 85 51 137.6 37.1 1.2 61.8
06/24/04 4.2 100 60 164.2 36.5 2.6 60.9
WCP-26
WCP-12
WCP-210
WCP-25
WCP-211
WCP-1
WCP-14
Project No. 2209.003 2 of 3 GeoTrans, Inc.
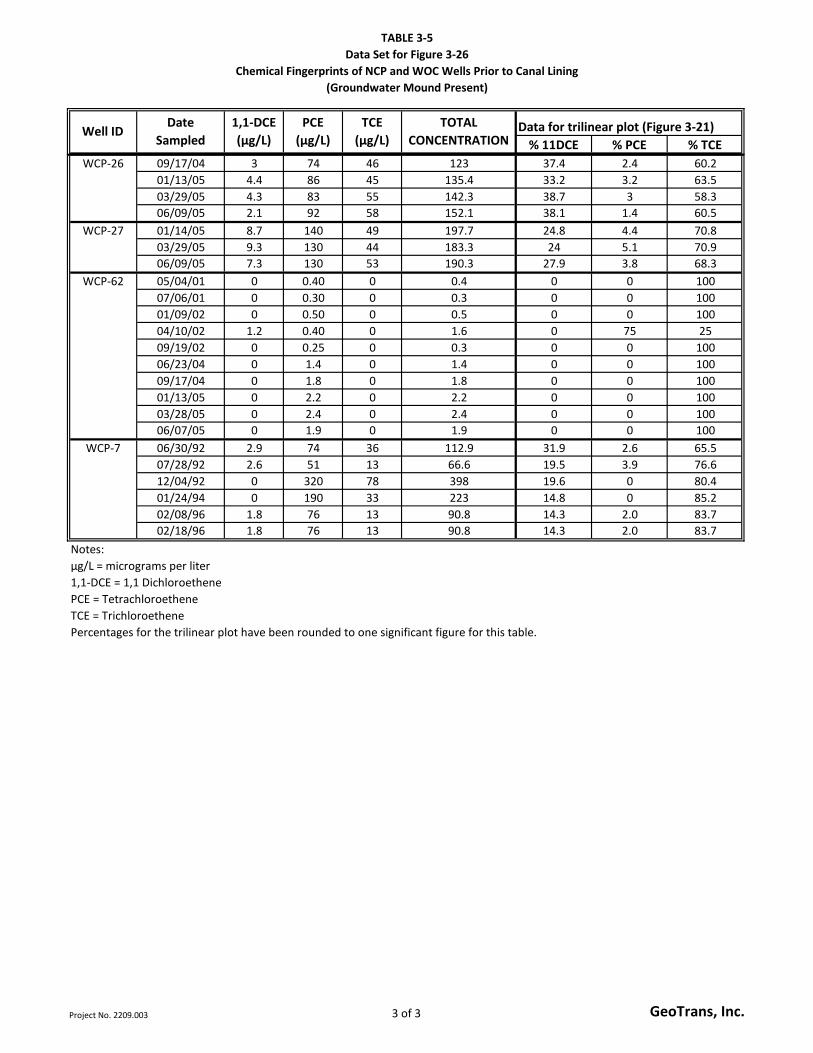
TABLE 3-5
Data Set for Figure 3-26
Chemical Fingerprints of NCP and WOC Wells Prior to Canal Lining
(Groundwater Mound Present)
% 11DCE % PCE % TCE
Data for trilinear plot (Figure 3-21)Well IDDate
Sampled
1,1-DCE
(µg/L)
PCE
(µg/L)
TOTAL
CONCENTRATION
West Osborn Complex (WOC) Wells
TCE
(µg/L)
09/17/04 3 74 46 123 37.4 2.4 60.2
01/13/05 4.4 86 45 135.4 33.2 3.2 63.5
03/29/05 4.3 83 55 142.3 38.7 3 58.3
06/09/05 2.1 92 58 152.1 38.1 1.4 60.5
01/14/05 8.7 140 49 197.7 24.8 4.4 70.8
03/29/05 9.3 130 44 183.3 24 5.1 70.9
06/09/05 7.3 130 53 190.3 27.9 3.8 68.3
05/04/01 0 0.40 0 0.4 0 0 100
07/06/01 0 0.30 0 0.3 0 0 100
01/09/02 0 0.50 0 0.5 0 0 100
04/10/02 1.2 0.40 0 1.6 0 75 25
09/19/02 0 0.25 0 0.3 0 0 100
06/23/04 0 1.4 0 1.4 0 0 100
09/17/04 0 1.8 0 1.8 0 0 100
01/13/05 0 2.2 0 2.2 0 0 100
03/28/05 0 2.4 0 2.4 0 0 100
06/07/05 0 1.9 0 1.9 0 0 100
06/30/92 2.9 74 36 112.9 31.9 2.6 65.5
07/28/92 2.6 51 13 66.6 19.5 3.9 76.6
12/04/92 0 320 78 398 19.6 0 80.4
01/24/94 0 190 33 223 14.8 0 85.2
02/08/96 1.8 76 13 90.8 14.3 2.0 83.7
02/18/96 1.8 76 13 90.8 14.3 2.0 83.7
Notes:
µg/L = micrograms per liter
1,1-DCE = 1,1 Dichloroethene
PCE = Tetrachloroethene
TCE = Trichloroethene
Percentages for the trilinear plot have been rounded to one significant figure for this table.
WCP-26
WCP-7
WCP-62
WCP-27
Project No. 2209.003 3 of 3 GeoTrans, Inc.
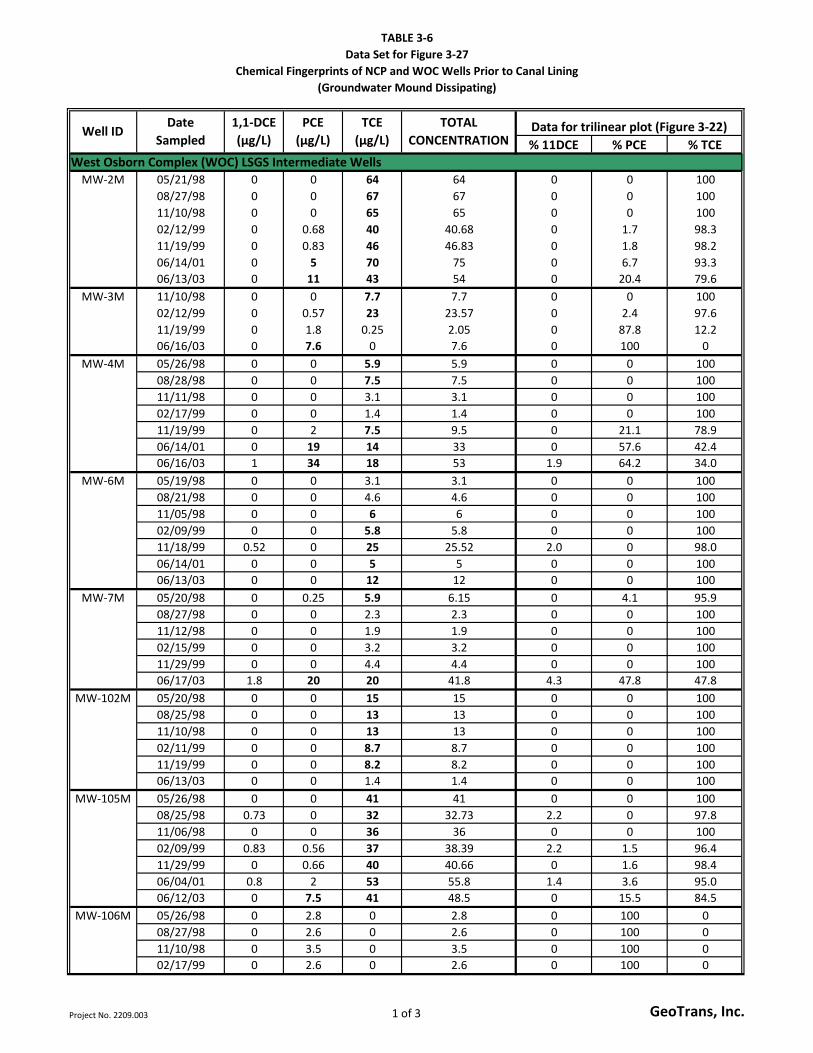
TABLE 3-6
Data Set for Figure 3-27
Chemical Fingerprints of NCP and WOC Wells Prior to Canal Lining
(Groundwater Mound Dissipating)
% 11DCE % PCE % TCE
05/21/98 0 0 64 64 0 0 100
08/27/98 0 0 67 67 0 0 100
11/10/98 0 0 65 65 0 0 100
02/12/99 0 0.68 40 40.68 0 1.7 98.3
11/19/99 0 0.83 46 46.83 0 1.8 98.2
06/14/01 0 5 70 75 0 6.7 93.3
06/13/03 0 11 43 54 0 20.4 79.6
11/10/98 0 0 7.7 7.7 0 0 100
02/12/99 0 0.57 23 23.57 0 2.4 97.6
11/19/99 0 1.8 0.25 2.05 0 87.8 12.2
06/16/03 0 7.6 0 7.6 0 100 0
05/26/98 0 0 5.9 5.9 0 0 100
08/28/98 0 0 7.5 7.5 0 0 100
11/11/98 0 0 3.1 3.1 0 0 100
02/17/99 0 0 1.4 1.4 0 0 100
11/19/99 0 2 7.5 9.5 0 21.1 78.9
06/14/01 0 19 14 33 0 57.6 42.4
06/16/03 1 34 18 53 1.9 64.2 34.0
05/19/98 0 0 3.1 3.1 0 0 100
08/21/98 0 0 4.6 4.6 0 0 100
11/05/98 0 0 6 6 0 0 100
02/09/99 0 0 5.8 5.8 0 0 100
11/18/99 0.52 0 25 25.52 2.0 0 98.0
06/14/01 0 0 5 5 0 0 100
06/13/03 0 0 12 12 0 0 100
05/20/98 0 0.25 5.9 6.15 0 4.1 95.9
08/27/98 0 0 2.3 2.3 0 0 100
11/12/98 0 0 1.9 1.9 0 0 100
02/15/99 0 0 3.2 3.2 0 0 100
11/29/99 0 0 4.4 4.4 0 0 100
06/17/03 1.8 20 20 41.8 4.3 47.8 47.8
05/20/98 0 0 15 15 0 0 100
08/25/98 0 0 13 13 0 0 100
11/10/98 0 0 13 13 0 0 100
02/11/99 0 0 8.7 8.7 0 0 100
11/19/99 0 0 8.2 8.2 0 0 100
06/13/03 0 0 1.4 1.4 0 0 100
05/26/98 0 0 41 41 0 0 100
08/25/98 0.73 0 32 32.73 2.2 0 97.8
11/06/98 0 0 36 36 0 0 100
02/09/99 0.83 0.56 37 38.39 2.2 1.5 96.4
11/29/99 0 0.66 40 40.66 0 1.6 98.4
06/04/01 0.8 2 53 55.8 1.4 3.6 95.0
06/12/03 0 7.5 41 48.5 0 15.5 84.5
05/26/98 0 2.8 0 2.8 0 100 0
08/27/98 0 2.6 0 2.6 0 100 0
11/10/98 0 3.5 0 3.5 0 100 0
02/17/99 0 2.6 0 2.6 0 100 0
Data for trilinear plot (Figure 3-22)Well IDDate
Sampled
1,1-DCE
(µg/L)
PCE
(µg/L)
TCE
(µg/L)
TOTAL
CONCENTRATION
MW-3M
MW-2M
MW-106M
West Osborn Complex (WOC) LSGS Intermediate Wells
MW-105M
MW-7M
MW-4M
MW-6M
MW-102M
Project No. 2209.003 1 of 3 GeoTrans, Inc.
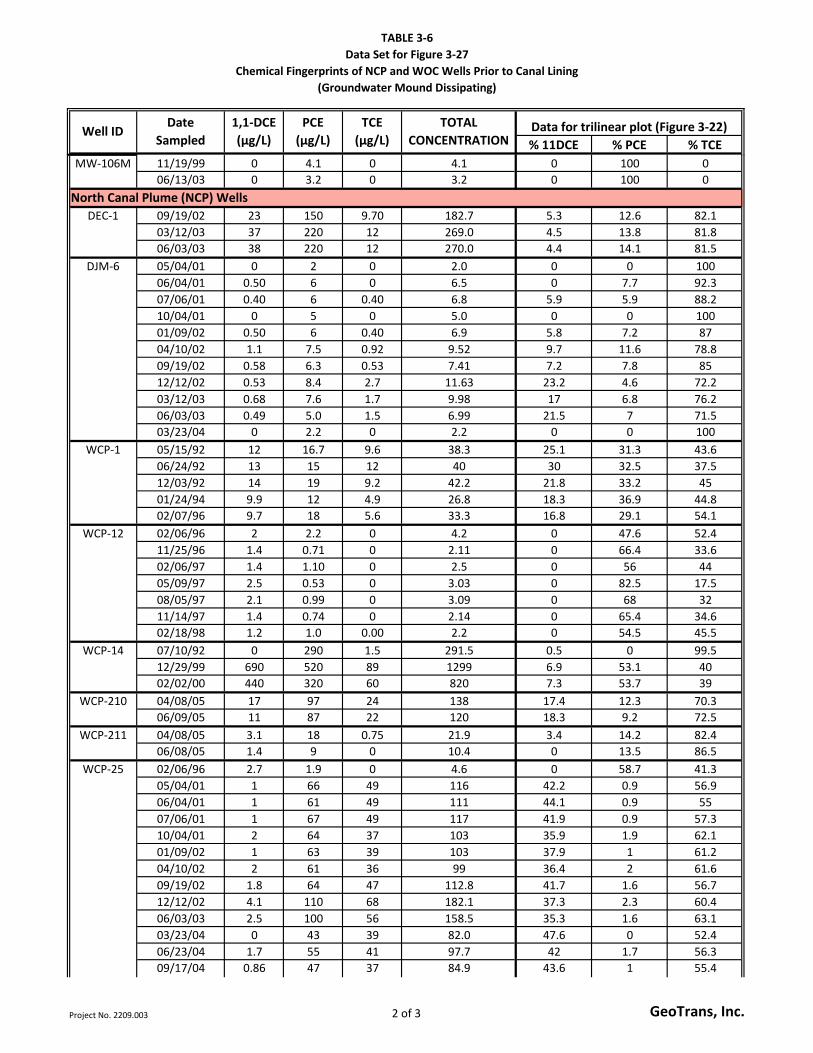
TABLE 3-6
Data Set for Figure 3-27
Chemical Fingerprints of NCP and WOC Wells Prior to Canal Lining
(Groundwater Mound Dissipating)
% 11DCE % PCE % TCE
Data for trilinear plot (Figure 3-22)Well IDDate
Sampled
1,1-DCE
(µg/L)
PCE
(µg/L)
TCE
(µg/L)
TOTAL
CONCENTRATION
West Osborn Complex (WOC) LSGS Intermediate Wells11/19/99 0 4.1 0 4.1 0 100 0
06/13/03 0 3.2 0 3.2 0 100 0
09/19/02 23 150 9.70 182.7 5.3 12.6 82.1
03/12/03 37 220 12 269.0 4.5 13.8 81.8
06/03/03 38 220 12 270.0 4.4 14.1 81.5
05/04/01 0 2 0 2.0 0 0 100
06/04/01 0.50 6 0 6.5 0 7.7 92.3
07/06/01 0.40 6 0.40 6.8 5.9 5.9 88.2
10/04/01 0 5 0 5.0 0 0 100
01/09/02 0.50 6 0.40 6.9 5.8 7.2 87
04/10/02 1.1 7.5 0.92 9.52 9.7 11.6 78.8
09/19/02 0.58 6.3 0.53 7.41 7.2 7.8 85
12/12/02 0.53 8.4 2.7 11.63 23.2 4.6 72.2
03/12/03 0.68 7.6 1.7 9.98 17 6.8 76.2
06/03/03 0.49 5.0 1.5 6.99 21.5 7 71.5
03/23/04 0 2.2 0 2.2 0 0 100
05/15/92 12 16.7 9.6 38.3 25.1 31.3 43.6
06/24/92 13 15 12 40 30 32.5 37.5
12/03/92 14 19 9.2 42.2 21.8 33.2 45
01/24/94 9.9 12 4.9 26.8 18.3 36.9 44.8
02/07/96 9.7 18 5.6 33.3 16.8 29.1 54.1
02/06/96 2 2.2 0 4.2 0 47.6 52.4
11/25/96 1.4 0.71 0 2.11 0 66.4 33.6
02/06/97 1.4 1.10 0 2.5 0 56 44
05/09/97 2.5 0.53 0 3.03 0 82.5 17.5
08/05/97 2.1 0.99 0 3.09 0 68 32
11/14/97 1.4 0.74 0 2.14 0 65.4 34.6
02/18/98 1.2 1.0 0.00 2.2 0 54.5 45.5
07/10/92 0 290 1.5 291.5 0.5 0 99.5
12/29/99 690 520 89 1299 6.9 53.1 40
02/02/00 440 320 60 820 7.3 53.7 39
04/08/05 17 97 24 138 17.4 12.3 70.3
06/09/05 11 87 22 120 18.3 9.2 72.5
04/08/05 3.1 18 0.75 21.9 3.4 14.2 82.4
06/08/05 1.4 9 0 10.4 0 13.5 86.5
02/06/96 2.7 1.9 0 4.6 0 58.7 41.3
05/04/01 1 66 49 116 42.2 0.9 56.9
06/04/01 1 61 49 111 44.1 0.9 55
07/06/01 1 67 49 117 41.9 0.9 57.3
10/04/01 2 64 37 103 35.9 1.9 62.1
01/09/02 1 63 39 103 37.9 1 61.2
04/10/02 2 61 36 99 36.4 2 61.6
09/19/02 1.8 64 47 112.8 41.7 1.6 56.7
12/12/02 4.1 110 68 182.1 37.3 2.3 60.4
06/03/03 2.5 100 56 158.5 35.3 1.6 63.1
03/23/04 0 43 39 82.0 47.6 0 52.4
06/23/04 1.7 55 41 97.7 42 1.7 56.3
09/17/04 0.86 47 37 84.9 43.6 1 55.4
WCP-211
WCP-210
WCP-25
WCP-12
WCP-1
DEC-1
DJM-6
MW-106M
WCP-14
North Canal Plume (NCP) Wells
Project No. 2209.003 2 of 3 GeoTrans, Inc.
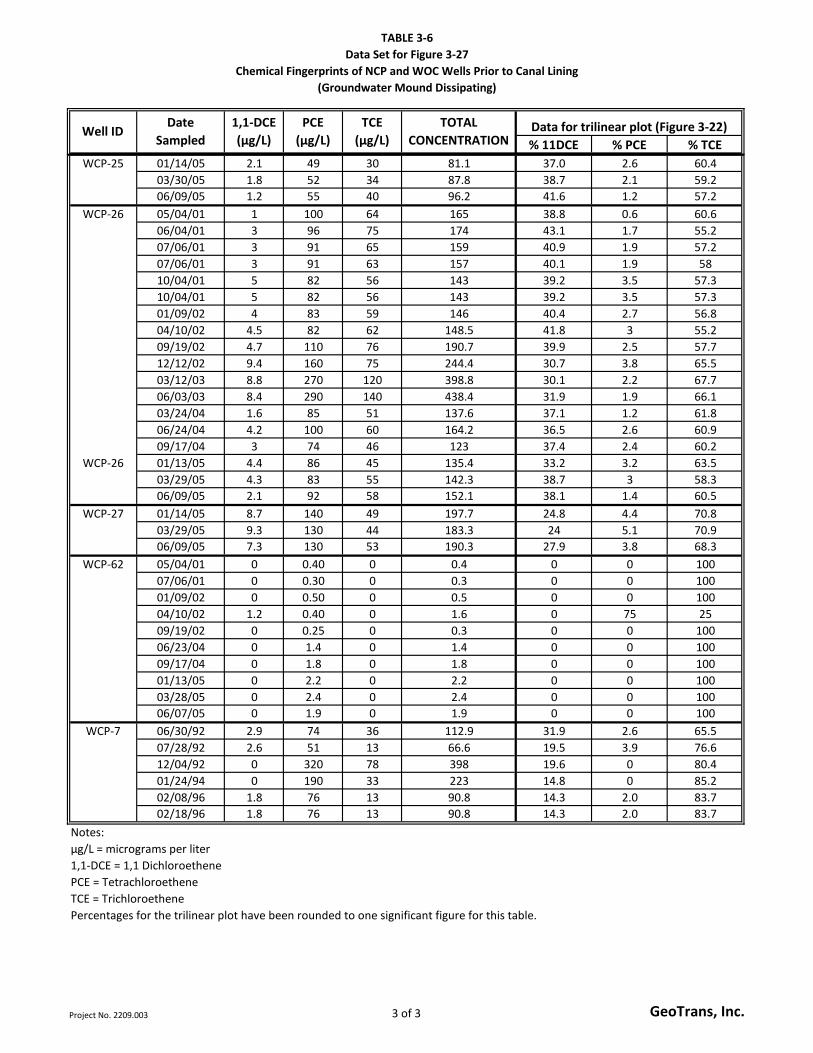
TABLE 3-6
Data Set for Figure 3-27
Chemical Fingerprints of NCP and WOC Wells Prior to Canal Lining
(Groundwater Mound Dissipating)
% 11DCE % PCE % TCE
Data for trilinear plot (Figure 3-22)Well IDDate
Sampled
1,1-DCE
(µg/L)
PCE
(µg/L)
TCE
(µg/L)
TOTAL
CONCENTRATION
West Osborn Complex (WOC) LSGS Intermediate Wells01/14/05 2.1 49 30 81.1 37.0 2.6 60.4
03/30/05 1.8 52 34 87.8 38.7 2.1 59.2
06/09/05 1.2 55 40 96.2 41.6 1.2 57.2
05/04/01 1 100 64 165 38.8 0.6 60.6
06/04/01 3 96 75 174 43.1 1.7 55.2
07/06/01 3 91 65 159 40.9 1.9 57.2
07/06/01 3 91 63 157 40.1 1.9 58
10/04/01 5 82 56 143 39.2 3.5 57.3
10/04/01 5 82 56 143 39.2 3.5 57.3
01/09/02 4 83 59 146 40.4 2.7 56.8
04/10/02 4.5 82 62 148.5 41.8 3 55.2
09/19/02 4.7 110 76 190.7 39.9 2.5 57.7
12/12/02 9.4 160 75 244.4 30.7 3.8 65.5
03/12/03 8.8 270 120 398.8 30.1 2.2 67.7
06/03/03 8.4 290 140 438.4 31.9 1.9 66.1
03/24/04 1.6 85 51 137.6 37.1 1.2 61.8
06/24/04 4.2 100 60 164.2 36.5 2.6 60.9
09/17/04 3 74 46 123 37.4 2.4 60.2
01/13/05 4.4 86 45 135.4 33.2 3.2 63.5
03/29/05 4.3 83 55 142.3 38.7 3 58.3
06/09/05 2.1 92 58 152.1 38.1 1.4 60.5
01/14/05 8.7 140 49 197.7 24.8 4.4 70.8
03/29/05 9.3 130 44 183.3 24 5.1 70.9
06/09/05 7.3 130 53 190.3 27.9 3.8 68.3
05/04/01 0 0.40 0 0.4 0 0 100
07/06/01 0 0.30 0 0.3 0 0 100
01/09/02 0 0.50 0 0.5 0 0 100
04/10/02 1.2 0.40 0 1.6 0 75 25
09/19/02 0 0.25 0 0.3 0 0 100
06/23/04 0 1.4 0 1.4 0 0 100
09/17/04 0 1.8 0 1.8 0 0 100
01/13/05 0 2.2 0 2.2 0 0 100
03/28/05 0 2.4 0 2.4 0 0 100
06/07/05 0 1.9 0 1.9 0 0 100
06/30/92 2.9 74 36 112.9 31.9 2.6 65.5
07/28/92 2.6 51 13 66.6 19.5 3.9 76.6
12/04/92 0 320 78 398 19.6 0 80.4
01/24/94 0 190 33 223 14.8 0 85.2
02/08/96 1.8 76 13 90.8 14.3 2.0 83.7
02/18/96 1.8 76 13 90.8 14.3 2.0 83.7
Notes:
µg/L = micrograms per liter
1,1-DCE = 1,1 Dichloroethene
PCE = Tetrachloroethene
TCE = Trichloroethene
Percentages for the trilinear plot have been rounded to one significant figure for this table.
WCP-7
WCP-62
WCP-27
WCP-25
WCP-26
WCP-26
Project No. 2209.003 3 of 3 GeoTrans, Inc.
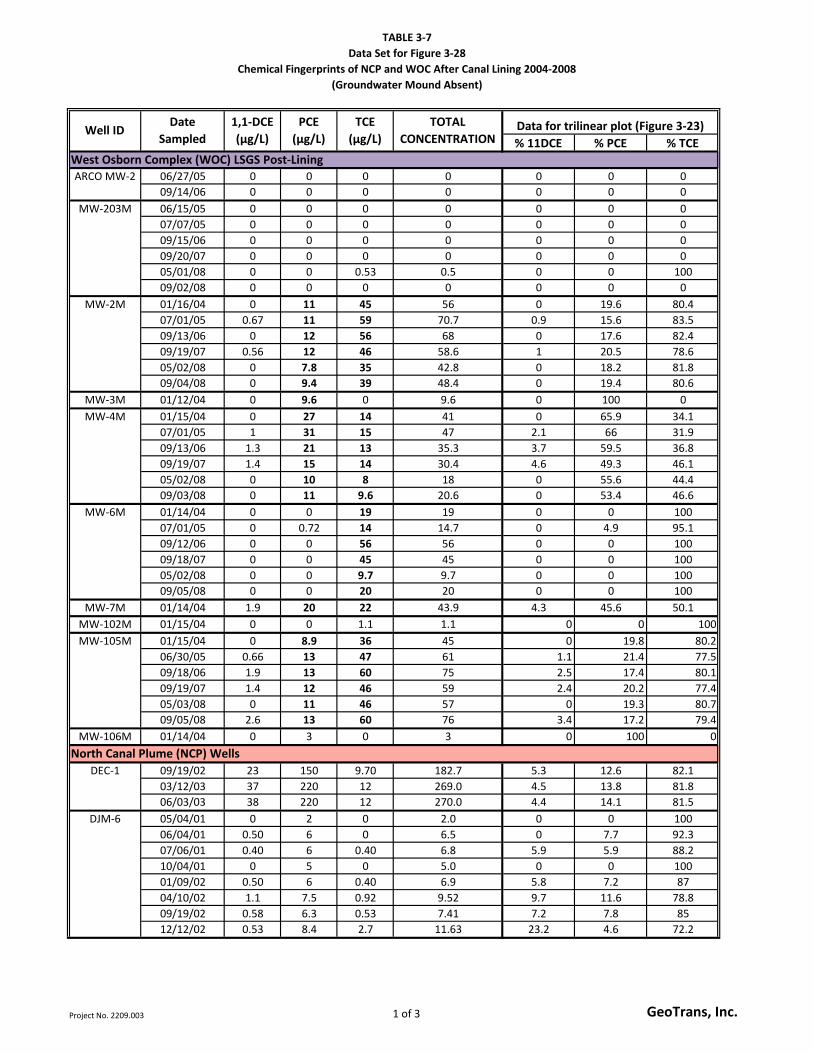
TABLE 3-7
Data Set for Figure 3-28
Chemical Fingerprints of NCP and WOC After Canal Lining 2004-2008
(Groundwater Mound Absent)
% 11DCE % PCE % TCE
06/27/05 0 0 0 0 0 0 0
09/14/06 0 0 0 0 0 0 0
06/15/05 0 0 0 0 0 0 0
07/07/05 0 0 0 0 0 0 0
09/15/06 0 0 0 0 0 0 0
09/20/07 0 0 0 0 0 0 0
05/01/08 0 0 0.53 0.5 0 0 100
09/02/08 0 0 0 0 0 0 0
01/16/04 0 11 45 56 0 19.6 80.4
07/01/05 0.67 11 59 70.7 0.9 15.6 83.5
09/13/06 0 12 56 68 0 17.6 82.4
09/19/07 0.56 12 46 58.6 1 20.5 78.6
05/02/08 0 7.8 35 42.8 0 18.2 81.8
09/04/08 0 9.4 39 48.4 0 19.4 80.6
MW-3M 01/12/04 0 9.6 0 9.6 0 100 0
01/15/04 0 27 14 41 0 65.9 34.1
07/01/05 1 31 15 47 2.1 66 31.9
09/13/06 1.3 21 13 35.3 3.7 59.5 36.8
09/19/07 1.4 15 14 30.4 4.6 49.3 46.1
05/02/08 0 10 8 18 0 55.6 44.4
09/03/08 0 11 9.6 20.6 0 53.4 46.6
01/14/04 0 0 19 19 0 0 100
07/01/05 0 0.72 14 14.7 0 4.9 95.1
09/12/06 0 0 56 56 0 0 100
09/18/07 0 0 45 45 0 0 100
05/02/08 0 0 9.7 9.7 0 0 100
09/05/08 0 0 20 20 0 0 100
MW-7M 01/14/04 1.9 20 22 43.9 4.3 45.6 50.1
MW-102M 01/15/04 0 0 1.1 1.1 0 0 100
01/15/04 0 8.9 36 45 0 19.8 80.2
06/30/05 0.66 13 47 61 1.1 21.4 77.5
09/18/06 1.9 13 60 75 2.5 17.4 80.1
09/19/07 1.4 12 46 59 2.4 20.2 77.4
05/03/08 0 11 46 57 0 19.3 80.7
09/05/08 2.6 13 60 76 3.4 17.2 79.4
MW-106M 01/14/04 0 3 0 3 0 100 0
09/19/02 23 150 9.70 182.7 5.3 12.6 82.1
03/12/03 37 220 12 269.0 4.5 13.8 81.8
06/03/03 38 220 12 270.0 4.4 14.1 81.5
05/04/01 0 2 0 2.0 0 0 100
06/04/01 0.50 6 0 6.5 0 7.7 92.3
07/06/01 0.40 6 0.40 6.8 5.9 5.9 88.2
10/04/01 0 5 0 5.0 0 0 100
01/09/02 0.50 6 0.40 6.9 5.8 7.2 87
04/10/02 1.1 7.5 0.92 9.52 9.7 11.6 78.8
09/19/02 0.58 6.3 0.53 7.41 7.2 7.8 85
12/12/02 0.53 8.4 2.7 11.63 23.2 4.6 72.2
West Osborn Complex (WOC) LSGS Post-Lining
North Canal Plume (NCP) Wells
TOTAL
CONCENTRATION
MW-6M
MW-4M
MW-2M
MW-203M
ARCO MW-2
Data for trilinear plot (Figure 3-23)Well IDDate
Sampled
1,1-DCE
(µg/L)
PCE
(µg/L)
TCE
(µg/L)
MW-105M
DJM-6
DEC-1
Project No. 2209.003 1 of 3 GeoTrans, Inc.
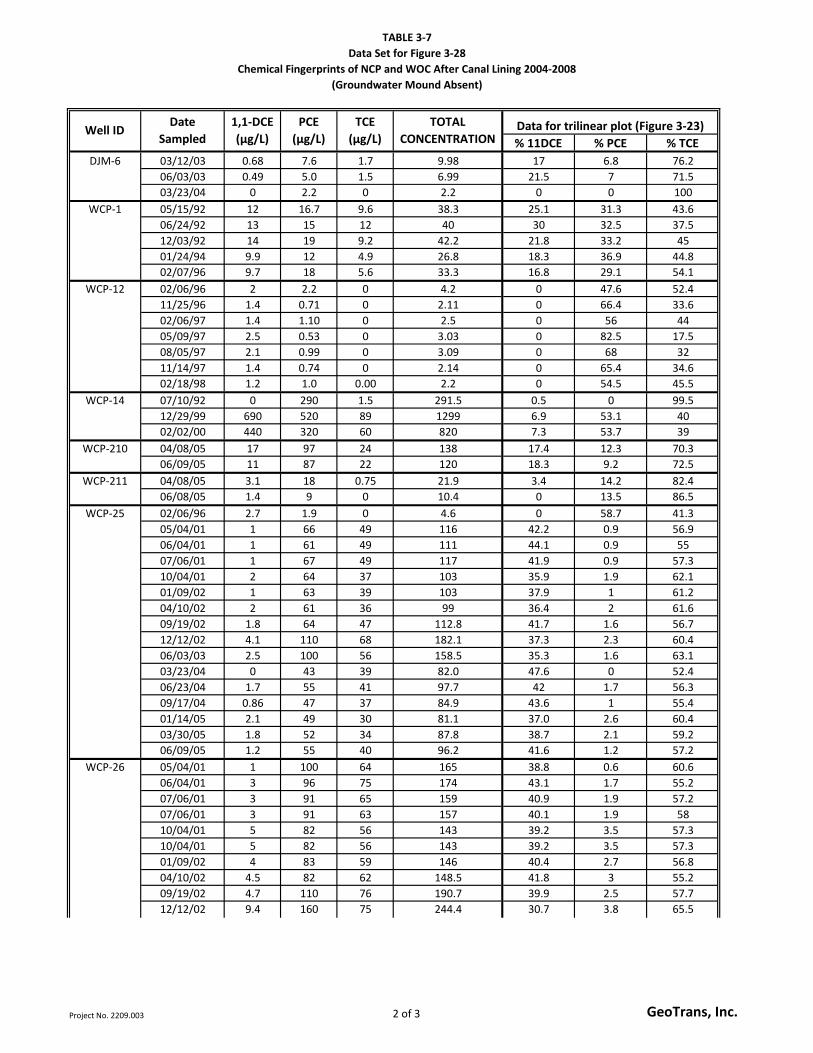
TABLE 3-7
Data Set for Figure 3-28
Chemical Fingerprints of NCP and WOC After Canal Lining 2004-2008
(Groundwater Mound Absent)
% 11DCE % PCE % TCE
West Osborn Complex (WOC) LSGS Post-Lining
TOTAL
CONCENTRATIONData for trilinear plot (Figure 3-23)Well ID
Date
Sampled
1,1-DCE
(µg/L)
PCE
(µg/L)
TCE
(µg/L)
03/12/03 0.68 7.6 1.7 9.98 17 6.8 76.2
06/03/03 0.49 5.0 1.5 6.99 21.5 7 71.5
03/23/04 0 2.2 0 2.2 0 0 100
05/15/92 12 16.7 9.6 38.3 25.1 31.3 43.6
06/24/92 13 15 12 40 30 32.5 37.5
12/03/92 14 19 9.2 42.2 21.8 33.2 45
01/24/94 9.9 12 4.9 26.8 18.3 36.9 44.8
02/07/96 9.7 18 5.6 33.3 16.8 29.1 54.1
02/06/96 2 2.2 0 4.2 0 47.6 52.4
11/25/96 1.4 0.71 0 2.11 0 66.4 33.6
02/06/97 1.4 1.10 0 2.5 0 56 44
05/09/97 2.5 0.53 0 3.03 0 82.5 17.5
08/05/97 2.1 0.99 0 3.09 0 68 32
11/14/97 1.4 0.74 0 2.14 0 65.4 34.6
02/18/98 1.2 1.0 0.00 2.2 0 54.5 45.5
07/10/92 0 290 1.5 291.5 0.5 0 99.5
12/29/99 690 520 89 1299 6.9 53.1 40
02/02/00 440 320 60 820 7.3 53.7 39
04/08/05 17 97 24 138 17.4 12.3 70.3
06/09/05 11 87 22 120 18.3 9.2 72.5
04/08/05 3.1 18 0.75 21.9 3.4 14.2 82.4
06/08/05 1.4 9 0 10.4 0 13.5 86.5
02/06/96 2.7 1.9 0 4.6 0 58.7 41.3
05/04/01 1 66 49 116 42.2 0.9 56.9
06/04/01 1 61 49 111 44.1 0.9 55
07/06/01 1 67 49 117 41.9 0.9 57.3
10/04/01 2 64 37 103 35.9 1.9 62.1
01/09/02 1 63 39 103 37.9 1 61.2
04/10/02 2 61 36 99 36.4 2 61.6
09/19/02 1.8 64 47 112.8 41.7 1.6 56.7
12/12/02 4.1 110 68 182.1 37.3 2.3 60.4
06/03/03 2.5 100 56 158.5 35.3 1.6 63.1
03/23/04 0 43 39 82.0 47.6 0 52.4
06/23/04 1.7 55 41 97.7 42 1.7 56.3
09/17/04 0.86 47 37 84.9 43.6 1 55.4
01/14/05 2.1 49 30 81.1 37.0 2.6 60.4
03/30/05 1.8 52 34 87.8 38.7 2.1 59.2
06/09/05 1.2 55 40 96.2 41.6 1.2 57.2
05/04/01 1 100 64 165 38.8 0.6 60.6
06/04/01 3 96 75 174 43.1 1.7 55.2
07/06/01 3 91 65 159 40.9 1.9 57.2
07/06/01 3 91 63 157 40.1 1.9 58
10/04/01 5 82 56 143 39.2 3.5 57.3
10/04/01 5 82 56 143 39.2 3.5 57.3
01/09/02 4 83 59 146 40.4 2.7 56.8
04/10/02 4.5 82 62 148.5 41.8 3 55.2
09/19/02 4.7 110 76 190.7 39.9 2.5 57.7
12/12/02 9.4 160 75 244.4 30.7 3.8 65.5
WCP-25
WCP-211
WCP-210
WCP-14
DJM-6
WCP-26
WCP-12
WCP-1
Project No. 2209.003 2 of 3 GeoTrans, Inc.
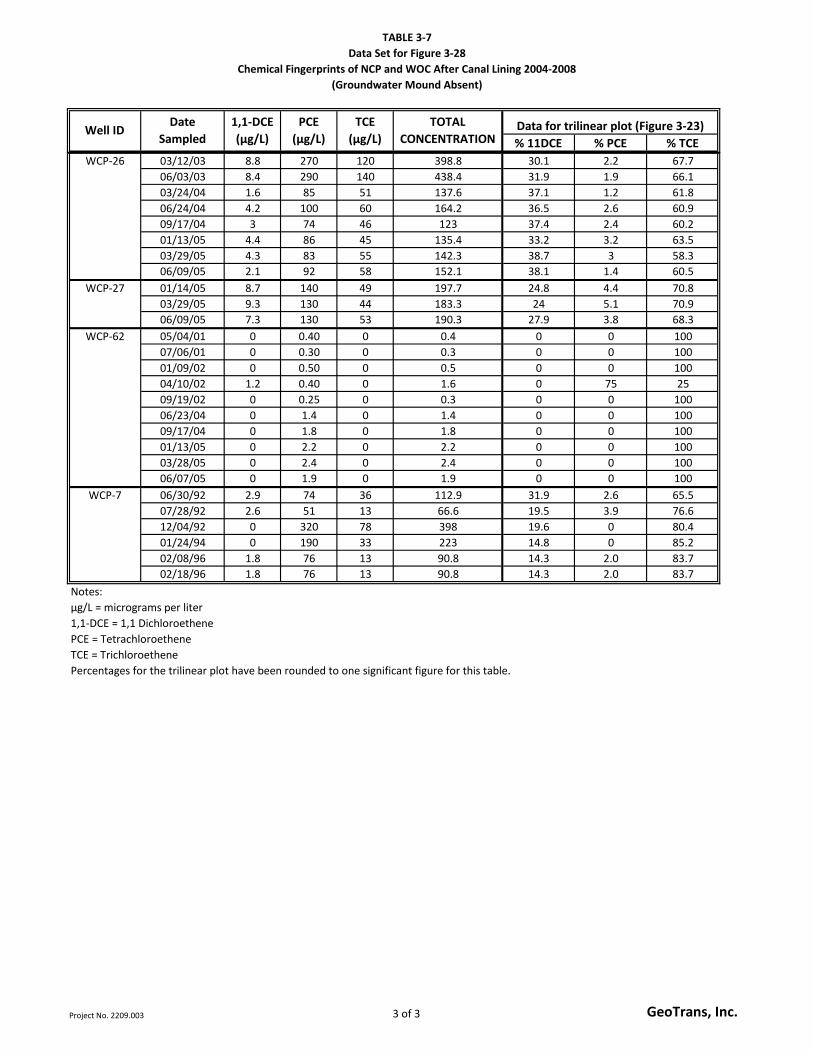
TABLE 3-7
Data Set for Figure 3-28
Chemical Fingerprints of NCP and WOC After Canal Lining 2004-2008
(Groundwater Mound Absent)
% 11DCE % PCE % TCE
West Osborn Complex (WOC) LSGS Post-Lining
TOTAL
CONCENTRATIONData for trilinear plot (Figure 3-23)Well ID
Date
Sampled
1,1-DCE
(µg/L)
PCE
(µg/L)
TCE
(µg/L)
03/12/03 8.8 270 120 398.8 30.1 2.2 67.7
06/03/03 8.4 290 140 438.4 31.9 1.9 66.1
03/24/04 1.6 85 51 137.6 37.1 1.2 61.8
06/24/04 4.2 100 60 164.2 36.5 2.6 60.9
09/17/04 3 74 46 123 37.4 2.4 60.2
01/13/05 4.4 86 45 135.4 33.2 3.2 63.5
03/29/05 4.3 83 55 142.3 38.7 3 58.3
06/09/05 2.1 92 58 152.1 38.1 1.4 60.5
01/14/05 8.7 140 49 197.7 24.8 4.4 70.8
03/29/05 9.3 130 44 183.3 24 5.1 70.9
06/09/05 7.3 130 53 190.3 27.9 3.8 68.3
05/04/01 0 0.40 0 0.4 0 0 100
07/06/01 0 0.30 0 0.3 0 0 100
01/09/02 0 0.50 0 0.5 0 0 100
04/10/02 1.2 0.40 0 1.6 0 75 25
09/19/02 0 0.25 0 0.3 0 0 100
06/23/04 0 1.4 0 1.4 0 0 100
09/17/04 0 1.8 0 1.8 0 0 100
01/13/05 0 2.2 0 2.2 0 0 100
03/28/05 0 2.4 0 2.4 0 0 100
06/07/05 0 1.9 0 1.9 0 0 100
06/30/92 2.9 74 36 112.9 31.9 2.6 65.5
07/28/92 2.6 51 13 66.6 19.5 3.9 76.6
12/04/92 0 320 78 398 19.6 0 80.4
01/24/94 0 190 33 223 14.8 0 85.2
02/08/96 1.8 76 13 90.8 14.3 2.0 83.7
02/18/96 1.8 76 13 90.8 14.3 2.0 83.7
Notes:
µg/L = micrograms per liter
1,1-DCE = 1,1 Dichloroethene
PCE = Tetrachloroethene
TCE = Trichloroethene
Percentages for the trilinear plot have been rounded to one significant figure for this table.
WCP-7
WCP-62
WCP-27
WCP-26
Project No. 2209.003 3 of 3 GeoTrans, Inc.
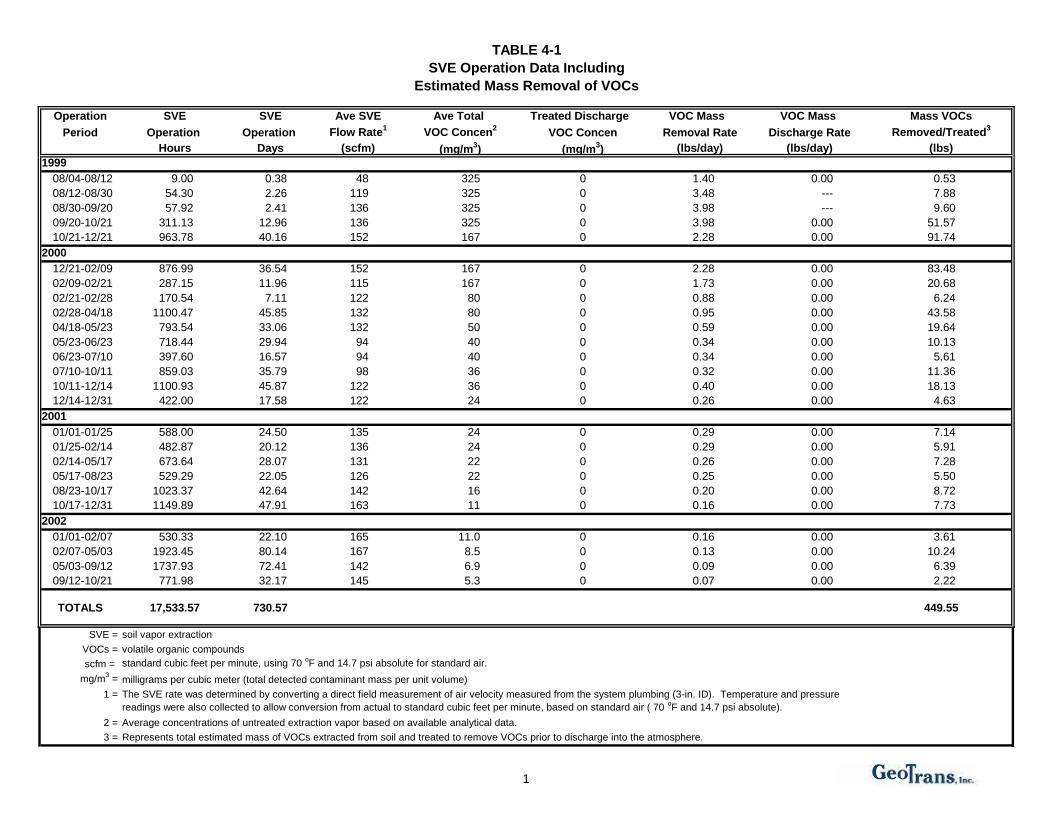
TABLE 4-1
SVE Operation Data Including
Estimated Mass Removal of VOCs
Operation SVE SVE Ave SVE Ave Total Treated Discharge VOC Mass VOC Mass Mass VOCs
Period Operation Operation Flow Rate1
VOC Concen2
VOC Concen Removal Rate Discharge Rate Removed/Treated3
Hours Days (scfm) (mg/m3) (mg/m
3) (lbs/day) (lbs/day) (lbs)
1999
08/04-08/12 9.00 0.38 48 325 0 1.40 0.00 0.53
08/12-08/30 54.30 2.26 119 325 0 3.48 --- 7.88
08/30-09/20 57.92 2.41 136 325 0 3.98 --- 9.60
09/20-10/21 311.13 12.96 136 325 0 3.98 0.00 51.57
10/21-12/21 963.78 40.16 152 167 0 2.28 0.00 91.74
2000
12/21-02/09 876.99 36.54 152 167 0 2.28 0.00 83.48
02/09-02/21 287.15 11.96 115 167 0 1.73 0.00 20.68
02/21-02/28 170.54 7.11 122 80 0 0.88 0.00 6.24
02/28-04/18 1100.47 45.85 132 80 0 0.95 0.00 43.58
04/18-05/23 793.54 33.06 132 50 0 0.59 0.00 19.64
05/23-06/23 718.44 29.94 94 40 0 0.34 0.00 10.13
06/23-07/10 397.60 16.57 94 40 0 0.34 0.00 5.61
07/10-10/11 859.03 35.79 98 36 0 0.32 0.00 11.36
10/11-12/14 1100.93 45.87 122 36 0 0.40 0.00 18.13
12/14-12/31 422.00 17.58 122 24 0 0.26 0.00 4.63
2001
01/01-01/25 588.00 24.50 135 24 0 0.29 0.00 7.14
01/25-02/14 482.87 20.12 136 24 0 0.29 0.00 5.91
02/14-05/17 673.64 28.07 131 22 0 0.26 0.00 7.28
05/17-08/23 529.29 22.05 126 22 0 0.25 0.00 5.50
08/23-10/17 1023.37 42.64 142 16 0 0.20 0.00 8.72
10/17-12/31 1149.89 47.91 163 11 0 0.16 0.00 7.73
2002
01/01-02/07 530.33 22.10 165 11.0 0 0.16 0.00 3.61
02/07-05/03 1923.45 80.14 167 8.5 0 0.13 0.00 10.24
05/03-09/12 1737.93 72.41 142 6.9 0 0.09 0.00 6.39
09/12-10/21 771.98 32.17 145 5.3 0 0.07 0.00 2.22
TOTALS 17,533.57 730.57 449.55
SVE = soil vapor extraction
VOCs = volatile organic compounds
scfm = standard cubic feet per minute, using 70 oF and 14.7 psi absolute for standard air.
mg/m3 = milligrams per cubic meter (total detected contaminant mass per unit volume)
1 = The SVE rate was determined by converting a direct field measurement of air velocity measured from the system plumbing (3-in. ID). Temperature and pressure
readings were also collected to allow conversion from actual to standard cubic feet per minute, based on standard air ( 70 oF and 14.7 psi absolute).
2 = Average concentrations of untreated extraction vapor based on available analytical data.
3 = Represents total estimated mass of VOCs extracted from soil and treated to remove VOCs prior to discharge into the atmosphere.
1
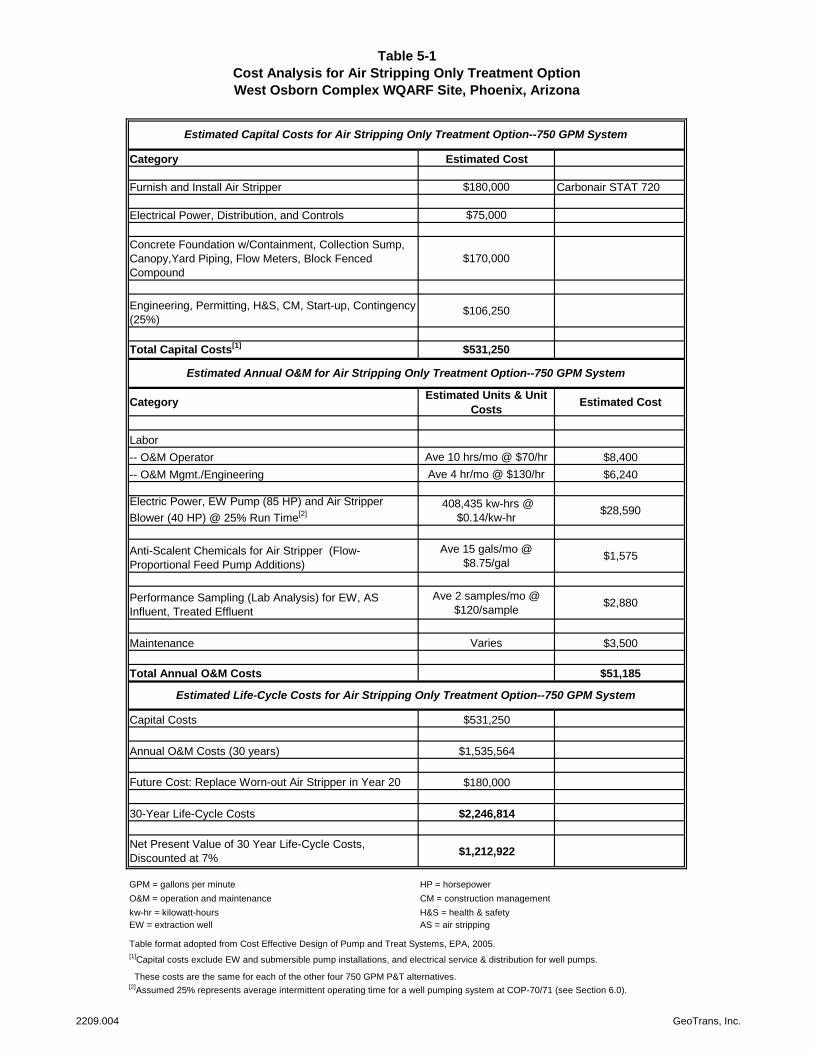
Table 5-1
Cost Analysis for Air Stripping Only Treatment Option
West Osborn Complex WQARF Site, Phoenix, Arizona
Category Estimated Cost
Furnish and Install Air Stripper $180,000 Carbonair STAT 720
Electrical Power, Distribution, and Controls $75,000
Concrete Foundation w/Containment, Collection Sump,
Canopy,Yard Piping, Flow Meters, Block Fenced
Compound
$170,000
Engineering, Permitting, H&S, CM, Start-up, Contingency
(25%)$106,250
Total Capital Costs[1]
$531,250
CategoryEstimated Units & Unit
CostsEstimated Cost
Labor
-- O&M Operator Ave 10 hrs/mo @ $70/hr $8,400
-- O&M Mgmt./Engineering Ave 4 hr/mo @ $130/hr $6,240
Electric Power, EW Pump (85 HP) and Air Stripper
Blower (40 HP) @ 25% Run Time[2]
408,435 kw-hrs @
$0.14/kw-hr$28,590
Anti-Scalent Chemicals for Air Stripper (Flow-
Proportional Feed Pump Additions)
Ave 15 gals/mo @
$8.75/gal$1,575
Performance Sampling (Lab Analysis) for EW, AS
Influent, Treated Effluent
Ave 2 samples/mo @
$120/sample$2,880
Maintenance Varies $3,500
Total Annual O&M Costs $51,185
Capital Costs $531,250
Annual O&M Costs (30 years) $1,535,564
Future Cost: Replace Worn-out Air Stripper in Year 20 $180,000
30-Year Life-Cycle Costs $2,246,814
Net Present Value of 30 Year Life-Cycle Costs,
Discounted at 7% $1,212,922
GPM = gallons per minute HP = horsepower
O&M = operation and maintenance CM = construction management
kw-hr = kilowatt-hours H&S = health & safety
EW = extraction well AS = air stripping
Table format adopted from Cost Effective Design of Pump and Treat Systems, EPA, 2005.
[1]Capital costs exclude EW and submersible pump installations, and electrical service & distribution for well pumps.
These costs are the same for each of the other four 750 GPM P&T alternatives. [2]
Assumed 25% represents average intermittent operating time for a well pumping system at COP-70/71 (see Section 6.0).
Estimated Capital Costs for Air Stripping Only Treatment Option--750 GPM System
Estimated Annual O&M for Air Stripping Only Treatment Option--750 GPM System
Estimated Life-Cycle Costs for Air Stripping Only Treatment Option--750 GPM System
2209.004 GeoTrans, Inc.
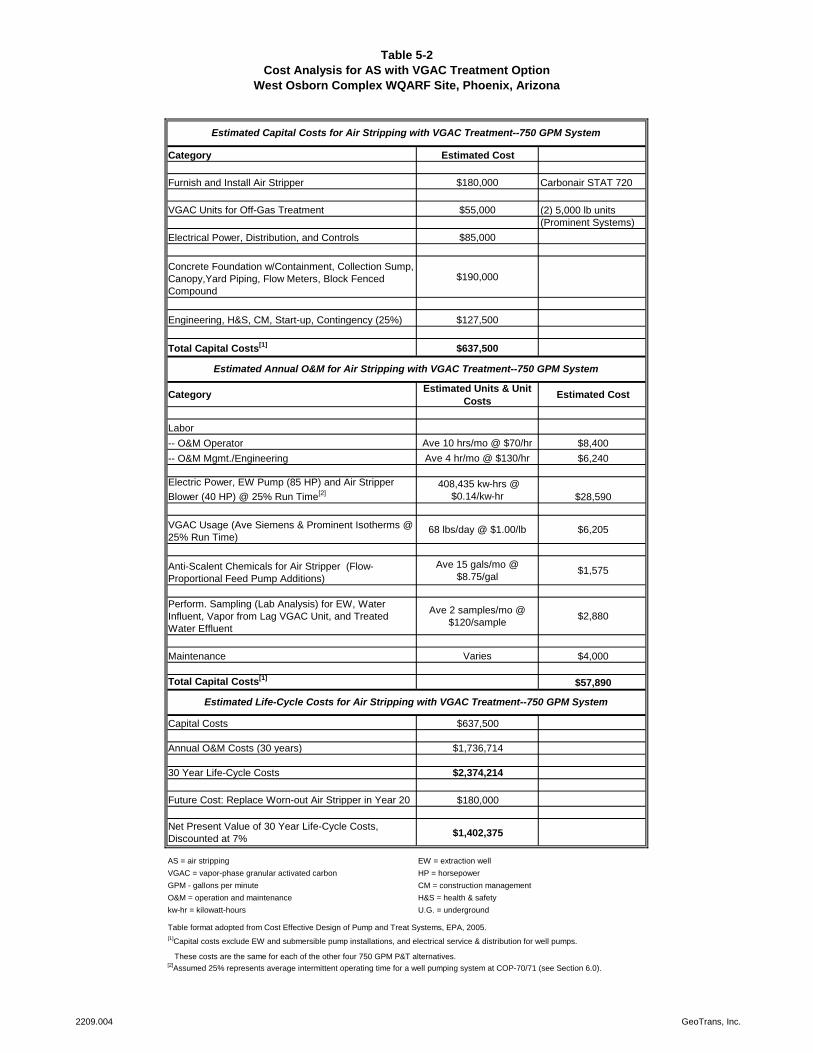
Table 5-2
Cost Analysis for AS with VGAC Treatment Option
West Osborn Complex WQARF Site, Phoenix, Arizona
Category Estimated Cost
Furnish and Install Air Stripper $180,000 Carbonair STAT 720
VGAC Units for Off-Gas Treatment $55,000 (2) 5,000 lb units
(Prominent Systems)
Electrical Power, Distribution, and Controls $85,000
Concrete Foundation w/Containment, Collection Sump,
Canopy,Yard Piping, Flow Meters, Block Fenced
Compound
$190,000
Engineering, H&S, CM, Start-up, Contingency (25%) $127,500
Total Capital Costs[1]
$637,500
CategoryEstimated Units & Unit
CostsEstimated Cost
Labor
-- O&M Operator Ave 10 hrs/mo @ $70/hr $8,400
-- O&M Mgmt./Engineering Ave 4 hr/mo @ $130/hr $6,240
Electric Power, EW Pump (85 HP) and Air Stripper
Blower (40 HP) @ 25% Run Time[2]
408,435 kw-hrs @
$0.14/kw-hr $28,590
VGAC Usage (Ave Siemens & Prominent Isotherms @
25% Run Time)68 lbs/day @ $1.00/lb $6,205
Anti-Scalent Chemicals for Air Stripper (Flow-
Proportional Feed Pump Additions)
Ave 15 gals/mo @
$8.75/gal$1,575
Perform. Sampling (Lab Analysis) for EW, Water
Influent, Vapor from Lag VGAC Unit, and Treated
Water Effluent
Ave 2 samples/mo @
$120/sample$2,880
Maintenance Varies $4,000
Total Capital Costs[1]
$57,890
Capital Costs $637,500
Annual O&M Costs (30 years) $1,736,714
30 Year Life-Cycle Costs $2,374,214
Future Cost: Replace Worn-out Air Stripper in Year 20 $180,000
Net Present Value of 30 Year Life-Cycle Costs,
Discounted at 7% $1,402,375
AS = air stripping EW = extraction well
VGAC = vapor-phase granular activated carbon HP = horsepower
GPM - gallons per minute CM = construction management
O&M = operation and maintenance H&S = health & safety
kw-hr = kilowatt-hours U.G. = underground
Table format adopted from Cost Effective Design of Pump and Treat Systems, EPA, 2005.
[1]Capital costs exclude EW and submersible pump installations, and electrical service & distribution for well pumps.
These costs are the same for each of the other four 750 GPM P&T alternatives. [2]
Assumed 25% represents average intermittent operating time for a well pumping system at COP-70/71 (see Section 6.0).
Estimated Capital Costs for Air Stripping with VGAC Treatment--750 GPM System
Estimated Annual O&M for Air Stripping with VGAC Treatment--750 GPM System
Estimated Life-Cycle Costs for Air Stripping with VGAC Treatment--750 GPM System
2209.004 GeoTrans, Inc.
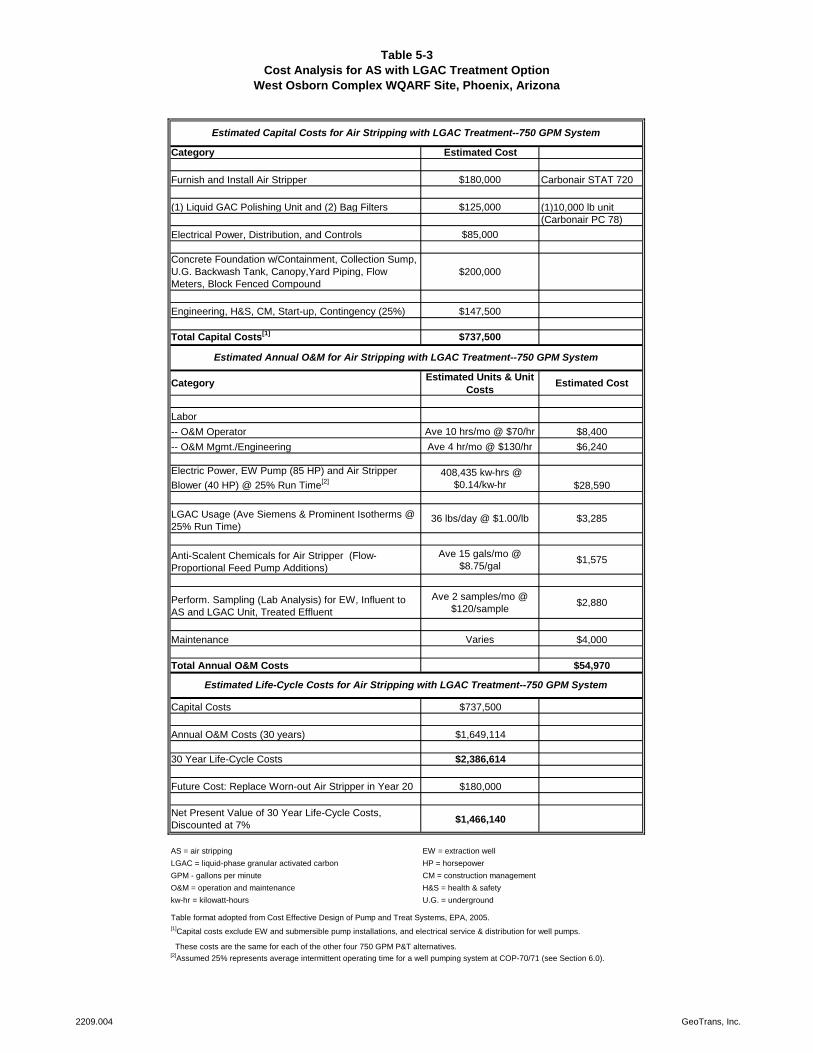
Table 5-3
Cost Analysis for AS with LGAC Treatment Option
West Osborn Complex WQARF Site, Phoenix, Arizona
Category Estimated Cost
Furnish and Install Air Stripper $180,000 Carbonair STAT 720
(1) Liquid GAC Polishing Unit and (2) Bag Filters $125,000 (1)10,000 lb unit
(Carbonair PC 78)
Electrical Power, Distribution, and Controls $85,000
Concrete Foundation w/Containment, Collection Sump,
U.G. Backwash Tank, Canopy,Yard Piping, Flow
Meters, Block Fenced Compound
$200,000
Engineering, H&S, CM, Start-up, Contingency (25%) $147,500
Total Capital Costs[1]
$737,500
CategoryEstimated Units & Unit
CostsEstimated Cost
Labor
-- O&M Operator Ave 10 hrs/mo @ $70/hr $8,400
-- O&M Mgmt./Engineering Ave 4 hr/mo @ $130/hr $6,240
Electric Power, EW Pump (85 HP) and Air Stripper
Blower (40 HP) @ 25% Run Time[2]
408,435 kw-hrs @
$0.14/kw-hr $28,590
LGAC Usage (Ave Siemens & Prominent Isotherms @
25% Run Time)36 lbs/day @ $1.00/lb $3,285
Anti-Scalent Chemicals for Air Stripper (Flow-
Proportional Feed Pump Additions)
Ave 15 gals/mo @
$8.75/gal$1,575
Perform. Sampling (Lab Analysis) for EW, Influent to
AS and LGAC Unit, Treated Effluent
Ave 2 samples/mo @
$120/sample$2,880
Maintenance Varies $4,000
Total Annual O&M Costs $54,970
Capital Costs $737,500
Annual O&M Costs (30 years) $1,649,114
30 Year Life-Cycle Costs $2,386,614
Future Cost: Replace Worn-out Air Stripper in Year 20 $180,000
Net Present Value of 30 Year Life-Cycle Costs,
Discounted at 7% $1,466,140
AS = air stripping EW = extraction well
LGAC = liquid-phase granular activated carbon HP = horsepower
GPM - gallons per minute CM = construction management
O&M = operation and maintenance H&S = health & safety
kw-hr = kilowatt-hours U.G. = underground
Table format adopted from Cost Effective Design of Pump and Treat Systems, EPA, 2005.
[1]Capital costs exclude EW and submersible pump installations, and electrical service & distribution for well pumps.
These costs are the same for each of the other four 750 GPM P&T alternatives. [2]
Assumed 25% represents average intermittent operating time for a well pumping system at COP-70/71 (see Section 6.0).
Estimated Capital Costs for Air Stripping with LGAC Treatment--750 GPM System
Estimated Annual O&M for Air Stripping with LGAC Treatment--750 GPM System
Estimated Life-Cycle Costs for Air Stripping with LGAC Treatment--750 GPM System
2209.004 GeoTrans, Inc.
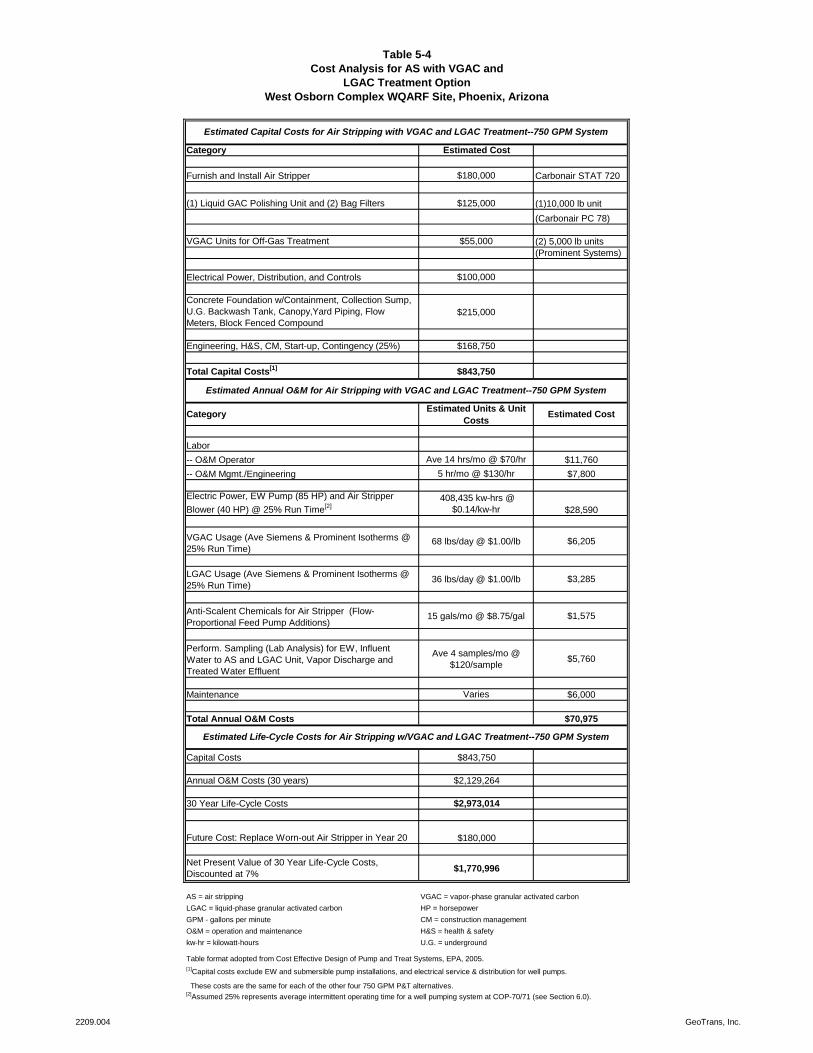
Table 5-4
Cost Analysis for AS with VGAC and
LGAC Treatment Option
West Osborn Complex WQARF Site, Phoenix, Arizona
Category Estimated Cost
Furnish and Install Air Stripper $180,000 Carbonair STAT 720
(1) Liquid GAC Polishing Unit and (2) Bag Filters $125,000 (1)10,000 lb unit
(Carbonair PC 78)
VGAC Units for Off-Gas Treatment $55,000 (2) 5,000 lb units
(Prominent Systems)
Electrical Power, Distribution, and Controls $100,000
Concrete Foundation w/Containment, Collection Sump,
U.G. Backwash Tank, Canopy,Yard Piping, Flow
Meters, Block Fenced Compound$215,000
Engineering, H&S, CM, Start-up, Contingency (25%) $168,750
Total Capital Costs[1]
$843,750
CategoryEstimated Units & Unit
CostsEstimated Cost
Labor
-- O&M Operator Ave 14 hrs/mo @ $70/hr $11,760
-- O&M Mgmt./Engineering 5 hr/mo @ $130/hr $7,800
Electric Power, EW Pump (85 HP) and Air Stripper
Blower (40 HP) @ 25% Run Time[2]
408,435 kw-hrs @
$0.14/kw-hr $28,590
VGAC Usage (Ave Siemens & Prominent Isotherms @
25% Run Time)68 lbs/day @ $1.00/lb $6,205
LGAC Usage (Ave Siemens & Prominent Isotherms @
25% Run Time)36 lbs/day @ $1.00/lb $3,285
Anti-Scalent Chemicals for Air Stripper (Flow-
Proportional Feed Pump Additions)15 gals/mo @ $8.75/gal $1,575
Perform. Sampling (Lab Analysis) for EW, Influent
Water to AS and LGAC Unit, Vapor Discharge and
Treated Water Effluent
Ave 4 samples/mo @
$120/sample$5,760
Maintenance Varies $6,000
Total Annual O&M Costs $70,975
Capital Costs $843,750
Annual O&M Costs (30 years) $2,129,264
30 Year Life-Cycle Costs $2,973,014
Future Cost: Replace Worn-out Air Stripper in Year 20 $180,000
Net Present Value of 30 Year Life-Cycle Costs,
Discounted at 7% $1,770,996
AS = air stripping VGAC = vapor-phase granular activated carbon
LGAC = liquid-phase granular activated carbon HP = horsepower
GPM - gallons per minute CM = construction management
O&M = operation and maintenance H&S = health & safety
kw-hr = kilowatt-hours U.G. = underground
Table format adopted from Cost Effective Design of Pump and Treat Systems, EPA, 2005.
[1]Capital costs exclude EW and submersible pump installations, and electrical service & distribution for well pumps.
These costs are the same for each of the other four 750 GPM P&T alternatives. [2]
Assumed 25% represents average intermittent operating time for a well pumping system at COP-70/71 (see Section 6.0).
Estimated Capital Costs for Air Stripping with VGAC and LGAC Treatment--750 GPM System
Estimated Annual O&M for Air Stripping with VGAC and LGAC Treatment--750 GPM System
Estimated Life-Cycle Costs for Air Stripping w/VGAC and LGAC Treatment--750 GPM System
2209.004 GeoTrans, Inc.
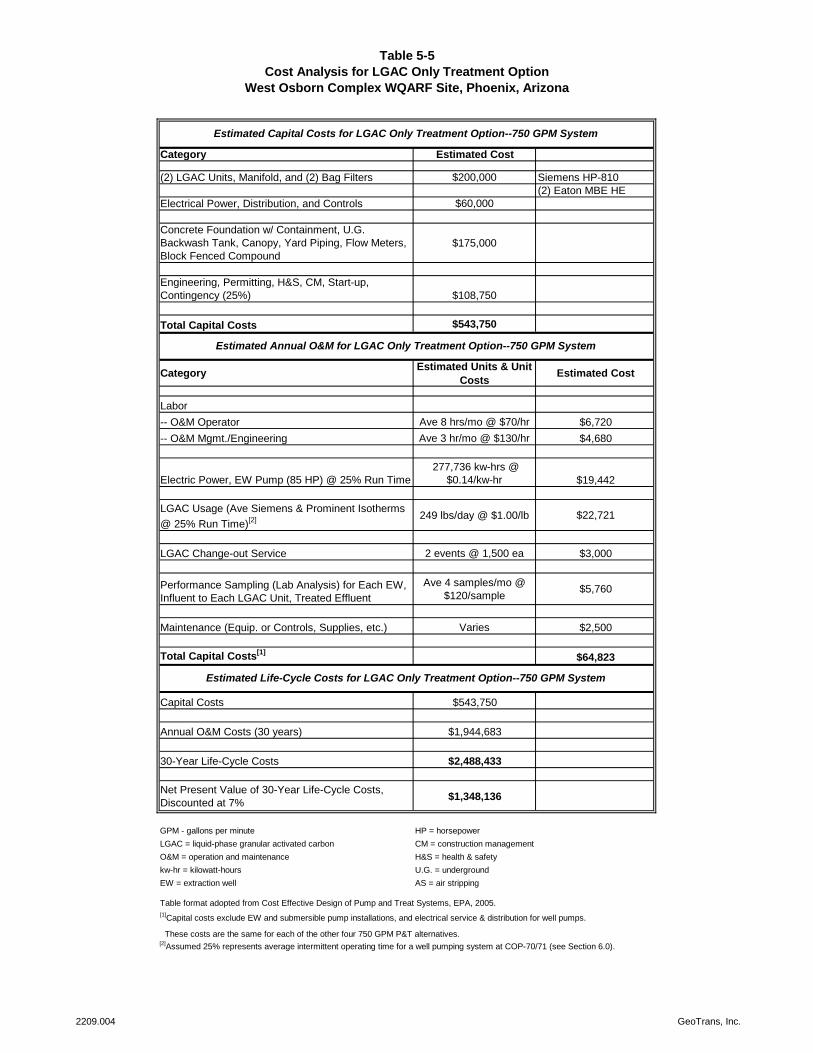
Table 5-5
Cost Analysis for LGAC Only Treatment Option
West Osborn Complex WQARF Site, Phoenix, Arizona
Category Estimated Cost
(2) LGAC Units, Manifold, and (2) Bag Filters $200,000 Siemens HP-810
(2) Eaton MBE HE
Electrical Power, Distribution, and Controls $60,000
Concrete Foundation w/ Containment, U.G.
Backwash Tank, Canopy, Yard Piping, Flow Meters,
Block Fenced Compound
$175,000
Engineering, Permitting, H&S, CM, Start-up,
Contingency (25%) $108,750
Total Capital Costs $543,750
CategoryEstimated Units & Unit
CostsEstimated Cost
Labor
-- O&M Operator Ave 8 hrs/mo @ $70/hr $6,720
-- O&M Mgmt./Engineering Ave 3 hr/mo @ $130/hr $4,680
Electric Power, EW Pump (85 HP) @ 25% Run Time
277,736 kw-hrs @
$0.14/kw-hr $19,442
LGAC Usage (Ave Siemens & Prominent Isotherms
@ 25% Run Time)[2] 249 lbs/day @ $1.00/lb $22,721
LGAC Change-out Service 2 events @ 1,500 ea $3,000
Performance Sampling (Lab Analysis) for Each EW,
Influent to Each LGAC Unit, Treated Effluent
Ave 4 samples/mo @
$120/sample$5,760
Maintenance (Equip. or Controls, Supplies, etc.) Varies $2,500
Total Capital Costs[1]
$64,823
Capital Costs $543,750
Annual O&M Costs (30 years) $1,944,683
30-Year Life-Cycle Costs $2,488,433
Net Present Value of 30-Year Life-Cycle Costs,
Discounted at 7% $1,348,136
GPM - gallons per minute HP = horsepower
LGAC = liquid-phase granular activated carbon CM = construction management
O&M = operation and maintenance H&S = health & safety
kw-hr = kilowatt-hours U.G. = underground
EW = extraction well AS = air stripping
Table format adopted from Cost Effective Design of Pump and Treat Systems, EPA, 2005.
[1]Capital costs exclude EW and submersible pump installations, and electrical service & distribution for well pumps.
These costs are the same for each of the other four 750 GPM P&T alternatives. [2]
Assumed 25% represents average intermittent operating time for a well pumping system at COP-70/71 (see Section 6.0).
Estimated Capital Costs for LGAC Only Treatment Option--750 GPM System
Estimated Annual O&M for LGAC Only Treatment Option--750 GPM System
Estimated Life-Cycle Costs for LGAC Only Treatment Option--750 GPM System
2209.004 GeoTrans, Inc.
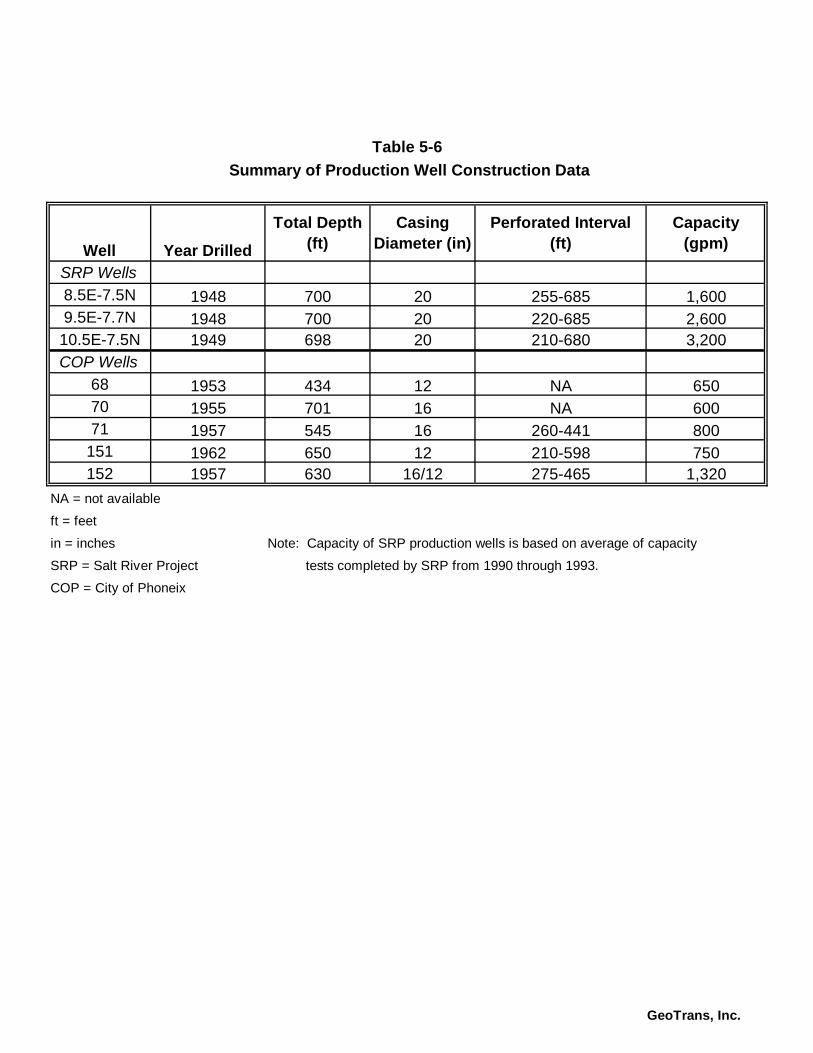
Well Year Drilled
Total Depth (ft)
Casing Diameter (in)
Perforated Interval (ft)
Capacity (gpm)
SRP Wells
8.5E-7.5N 1948 700 20 255-685 1,6009.5E-7.7N 1948 700 20 220-685 2,600
10.5E-7.5N 1949 698 20 210-680 3,200COP Wells
68 1953 434 12 NA 65070 1955 701 16 NA 60071 1957 545 16 260-441 800
151 1962 650 12 210-598 750152 1957 630 16/12 275-465 1,320
NA = not available
ft = feet
in = inches Note: Capacity of SRP production wells is based on average of capacity
SRP = Salt River Project tests completed by SRP from 1990 through 1993.
COP = City of Phoneix
Table 5-6
Summary of Production Well Construction Data
GeoTrans, Inc.
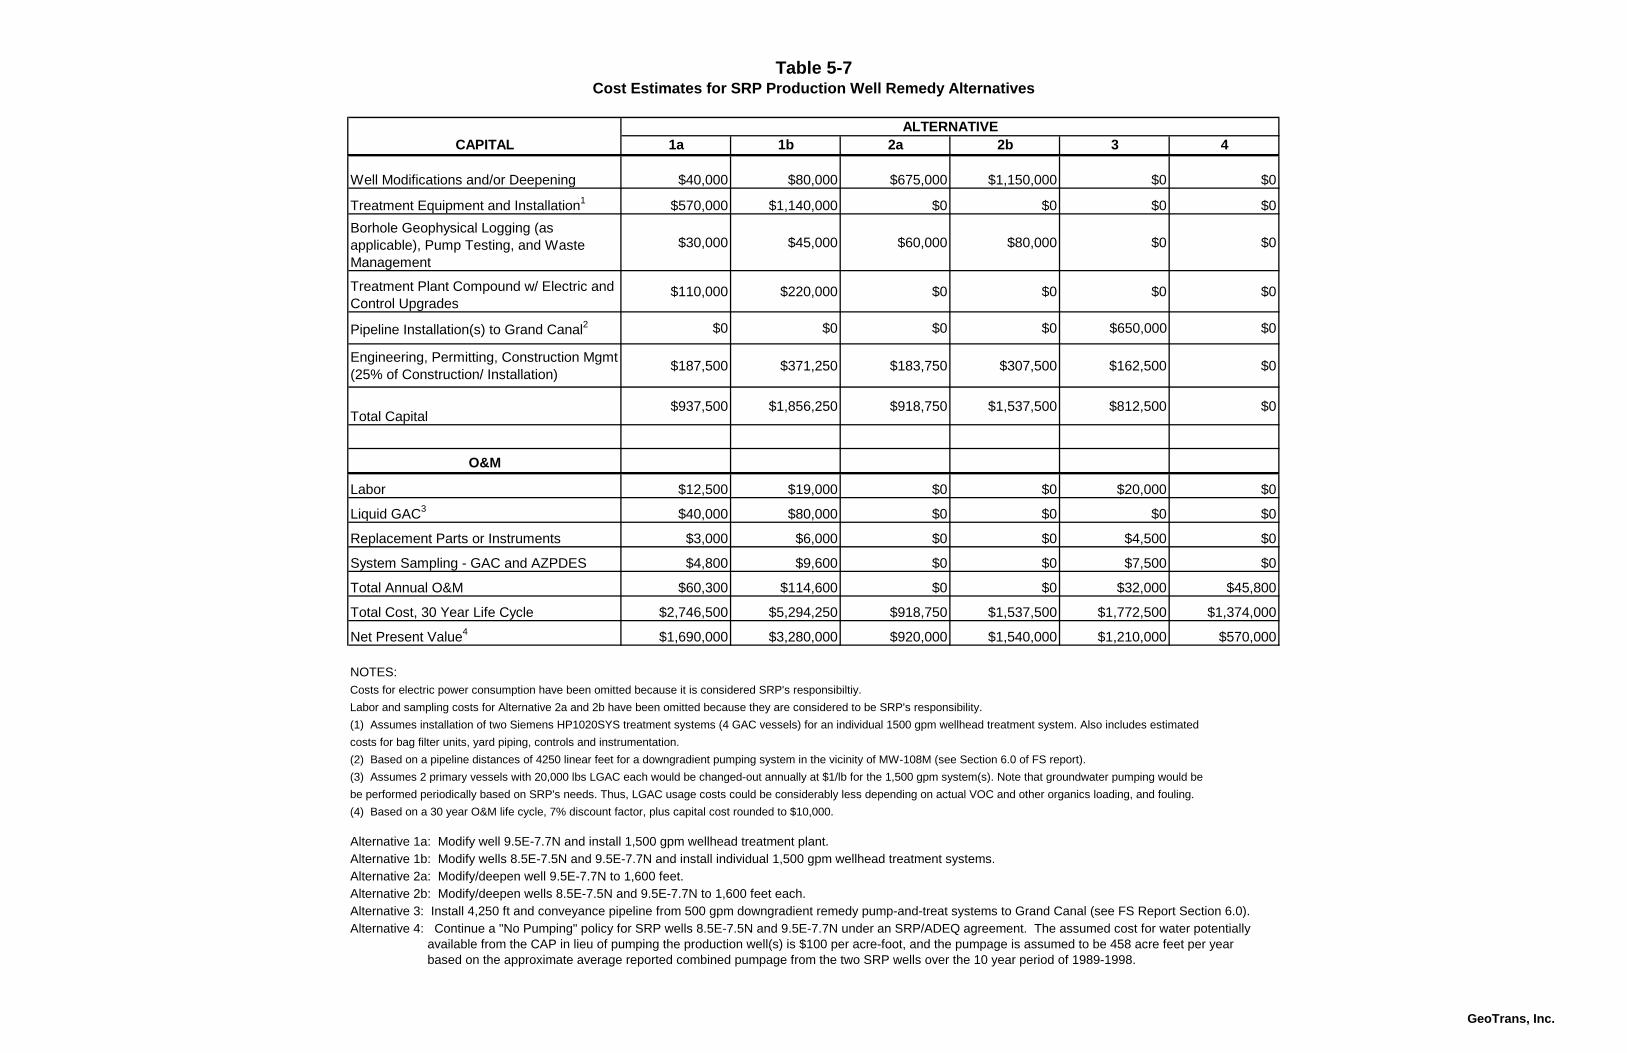
CAPITAL 1a 1b 2a 2b 3 4
Well Modifications and/or Deepening $40,000 $80,000 $675,000 $1,150,000 $0 $0
Treatment Equipment and Installation1
$570,000 $1,140,000 $0 $0 $0 $0
Borhole Geophysical Logging (as
applicable), Pump Testing, and Waste
Management
$30,000 $45,000 $60,000 $80,000 $0 $0
Treatment Plant Compound w/ Electric and
Control Upgrades$110,000 $220,000 $0 $0 $0 $0
Pipeline Installation(s) to Grand Canal2 $0 $0 $0 $0 $650,000 $0
Engineering, Permitting, Construction Mgmt
(25% of Construction/ Installation) $187,500 $371,250 $183,750 $307,500 $162,500 $0
Total Capital$937,500 $1,856,250 $918,750 $1,537,500 $812,500 $0
O&M
Labor $12,500 $19,000 $0 $0 $20,000 $0
Liquid GAC3
$40,000 $80,000 $0 $0 $0 $0
Replacement Parts or Instruments $3,000 $6,000 $0 $0 $4,500 $0
System Sampling - GAC and AZPDES $4,800 $9,600 $0 $0 $7,500 $0
Total Annual O&M $60,300 $114,600 $0 $0 $32,000 $45,800
Total Cost, 30 Year Life Cycle $2,746,500 $5,294,250 $918,750 $1,537,500 $1,772,500 $1,374,000
Net Present Value4
$1,690,000 $3,280,000 $920,000 $1,540,000 $1,210,000 $570,000
NOTES:
Costs for electric power consumption have been omitted because it is considered SRP's responsibiltiy.
Labor and sampling costs for Alternative 2a and 2b have been omitted because they are considered to be SRP's responsibility.
(1) Assumes installation of two Siemens HP1020SYS treatment systems (4 GAC vessels) for an individual 1500 gpm wellhead treatment system. Also includes estimated
costs for bag filter units, yard piping, controls and instrumentation.
(2) Based on a pipeline distances of 4250 linear feet for a downgradient pumping system in the vicinity of MW-108M (see Section 6.0 of FS report).
(3) Assumes 2 primary vessels with 20,000 lbs LGAC each would be changed-out annually at $1/lb for the 1,500 gpm system(s). Note that groundwater pumping would be
be performed periodically based on SRP's needs. Thus, LGAC usage costs could be considerably less depending on actual VOC and other organics loading, and fouling.
(4) Based on a 30 year O&M life cycle, 7% discount factor, plus capital cost rounded to $10,000.
Alternative 1a: Modify well 9.5E-7.7N and install 1,500 gpm wellhead treatment plant.
Alternative 1b: Modify wells 8.5E-7.5N and 9.5E-7.7N and install individual 1,500 gpm wellhead treatment systems.
Alternative 2a: Modify/deepen well 9.5E-7.7N to 1,600 feet.
Alternative 2b: Modify/deepen wells 8.5E-7.5N and 9.5E-7.7N to 1,600 feet each.
Alternative 3: Install 4,250 ft and conveyance pipeline from 500 gpm downgradient remedy pump-and-treat systems to Grand Canal (see FS Report Section 6.0).
Alternative 4: Continue a "No Pumping" policy for SRP wells 8.5E-7.5N and 9.5E-7.7N under an SRP/ADEQ agreement. The assumed cost for water potentially
available from the CAP in lieu of pumping the production well(s) is $100 per acre-foot, and the pumpage is assumed to be 458 acre feet per year
based on the approximate average reported combined pumpage from the two SRP wells over the 10 year period of 1989-1998.
ALTERNATIVE
Table 5-7Cost Estimates for SRP Production Well Remedy Alternatives
GeoTrans, Inc.
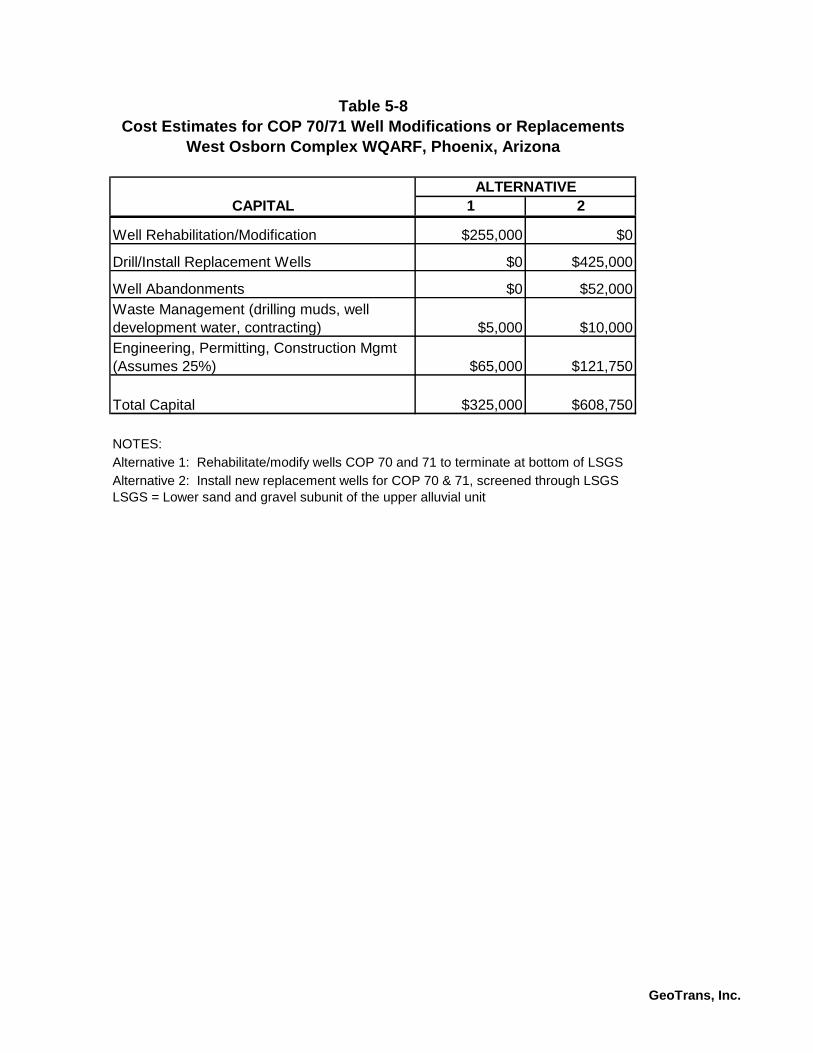
CAPITAL 1 2
Well Rehabilitation/Modification $255,000 $0
Drill/Install Replacement Wells $0 $425,000
Well Abandonments $0 $52,000
Waste Management (drilling muds, well
development water, contracting) $5,000 $10,000
Engineering, Permitting, Construction Mgmt
(Assumes 25%) $65,000 $121,750
Total Capital $325,000 $608,750
NOTES:
Alternative 1: Rehabilitate/modify wells COP 70 and 71 to terminate at bottom of LSGS
Alternative 2: Install new replacement wells for COP 70 & 71, screened through LSGS
LSGS = Lower sand and gravel subunit of the upper alluvial unit
ALTERNATIVE
West Osborn Complex WQARF, Phoenix, Arizona
Cost Estimates for COP 70/71 Well Modifications or Replacements
Table 5-8
GeoTrans, Inc.
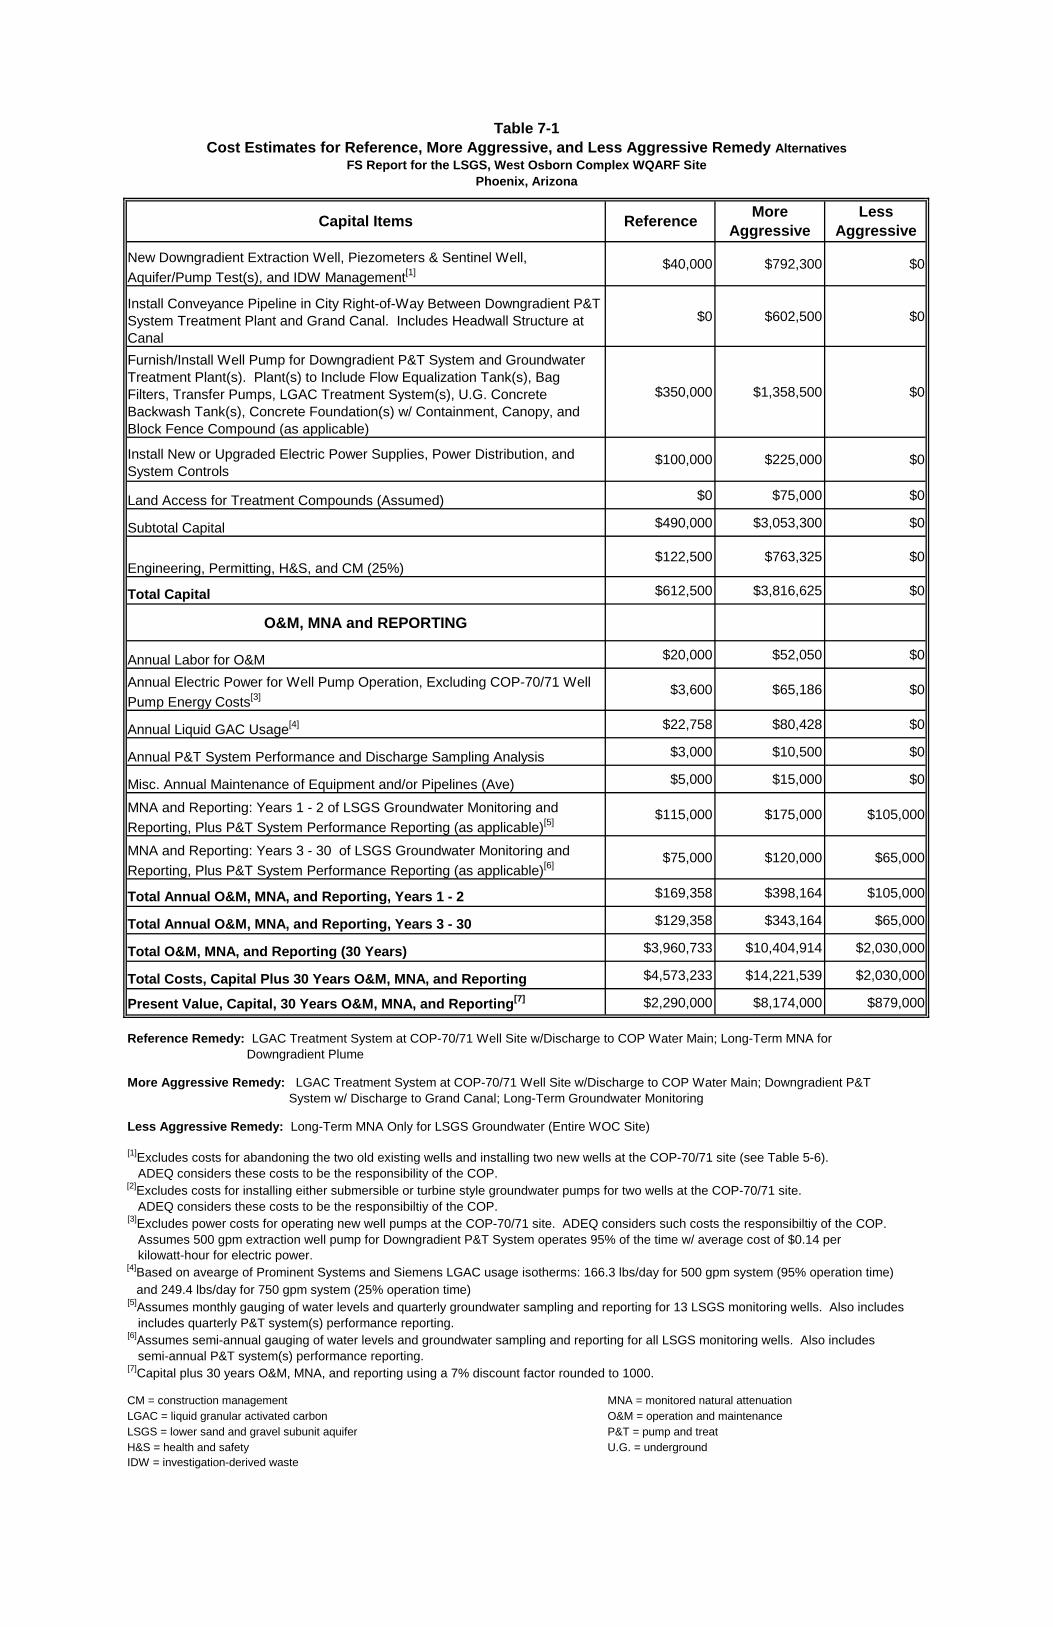
Table 7-1
Cost Estimates for Reference, More Aggressive, and Less Aggressive Remedy Alternatives
FS Report for the LSGS, West Osborn Complex WQARF Site
Phoenix, Arizona
Capital Items ReferenceMore
Aggressive
Less
Aggressive
New Downgradient Extraction Well, Piezometers & Sentinel Well,
Aquifer/Pump Test(s), and IDW Management[1]
$40,000 $792,300 $0
Install Conveyance Pipeline in City Right-of-Way Between Downgradient P&T
System Treatment Plant and Grand Canal. Includes Headwall Structure at
Canal
$0 $602,500 $0
Furnish/Install Well Pump for Downgradient P&T System and Groundwater
Treatment Plant(s). Plant(s) to Include Flow Equalization Tank(s), Bag
Filters, Transfer Pumps, LGAC Treatment System(s), U.G. Concrete
Backwash Tank(s), Concrete Foundation(s) w/ Containment, Canopy, and
Block Fence Compound (as applicable)
$350,000 $1,358,500 $0
Install New or Upgraded Electric Power Supplies, Power Distribution, and
System Controls$100,000 $225,000 $0
Land Access for Treatment Compounds (Assumed) $0 $75,000 $0
Subtotal Capital $490,000 $3,053,300 $0
Engineering, Permitting, H&S, and CM (25%)$122,500 $763,325 $0
Total Capital $612,500 $3,816,625 $0
O&M, MNA and REPORTING
Annual Labor for O&M $20,000 $52,050 $0
Annual Electric Power for Well Pump Operation, Excluding COP-70/71 Well
Pump Energy Costs[3]
$3,600 $65,186 $0
Annual Liquid GAC Usage[4] $22,758 $80,428 $0
Annual P&T System Performance and Discharge Sampling Analysis $3,000 $10,500 $0
Misc. Annual Maintenance of Equipment and/or Pipelines (Ave) $5,000 $15,000 $0
MNA and Reporting: Years 1 - 2 of LSGS Groundwater Monitoring and
Reporting, Plus P&T System Performance Reporting (as applicable)[5]
$115,000 $175,000 $105,000
MNA and Reporting: Years 3 - 30 of LSGS Groundwater Monitoring and
Reporting, Plus P&T System Performance Reporting (as applicable)[6]
$75,000 $120,000 $65,000
Total Annual O&M, MNA, and Reporting, Years 1 - 2 $169,358 $398,164 $105,000
Total Annual O&M, MNA, and Reporting, Years 3 - 30 $129,358 $343,164 $65,000
Total O&M, MNA, and Reporting (30 Years) $3,960,733 $10,404,914 $2,030,000
Total Costs, Capital Plus 30 Years O&M, MNA, and Reporting $4,573,233 $14,221,539 $2,030,000
Present Value, Capital, 30 Years O&M, MNA, and Reporting[7] $2,290,000 $8,174,000 $879,000
Reference Remedy: LGAC Treatment System at COP-70/71 Well Site w/Discharge to COP Water Main; Long-Term MNA for
Downgradient Plume
More Aggressive Remedy: LGAC Treatment System at COP-70/71 Well Site w/Discharge to COP Water Main; Downgradient P&T
System w/ Discharge to Grand Canal; Long-Term Groundwater Monitoring
Less Aggressive Remedy: Long-Term MNA Only for LSGS Groundwater (Entire WOC Site)
[1]Excludes costs for abandoning the two old existing wells and installing two new wells at the COP-70/71 site (see Table 5-6).
ADEQ considers these costs to be the responsibility of the COP.[2]
Excludes costs for installing either submersible or turbine style groundwater pumps for two wells at the COP-70/71 site.
ADEQ considers these costs to be the responsibiltiy of the COP. [3]
Excludes power costs for operating new well pumps at the COP-70/71 site. ADEQ considers such costs the responsibiltiy of the COP.
Assumes 500 gpm extraction well pump for Downgradient P&T System operates 95% of the time w/ average cost of $0.14 per
kilowatt-hour for electric power.[4]
Based on avearge of Prominent Systems and Siemens LGAC usage isotherms: 166.3 lbs/day for 500 gpm system (95% operation time)
and 249.4 lbs/day for 750 gpm system (25% operation time) [5]
Assumes monthly gauging of water levels and quarterly groundwater sampling and reporting for 13 LSGS monitoring wells. Also includes
includes quarterly P&T system(s) performance reporting.[6]
Assumes semi-annual gauging of water levels and groundwater sampling and reporting for all LSGS monitoring wells. Also includes
semi-annual P&T system(s) performance reporting.[7]
Capital plus 30 years O&M, MNA, and reporting using a 7% discount factor rounded to 1000.
CM = construction management MNA = monitored natural attenuation
LGAC = liquid granular activated carbon O&M = operation and maintenance
LSGS = lower sand and gravel subunit aquifer P&T = pump and treat
H&S = health and safety U.G. = underground
IDW = investigation-derived waste
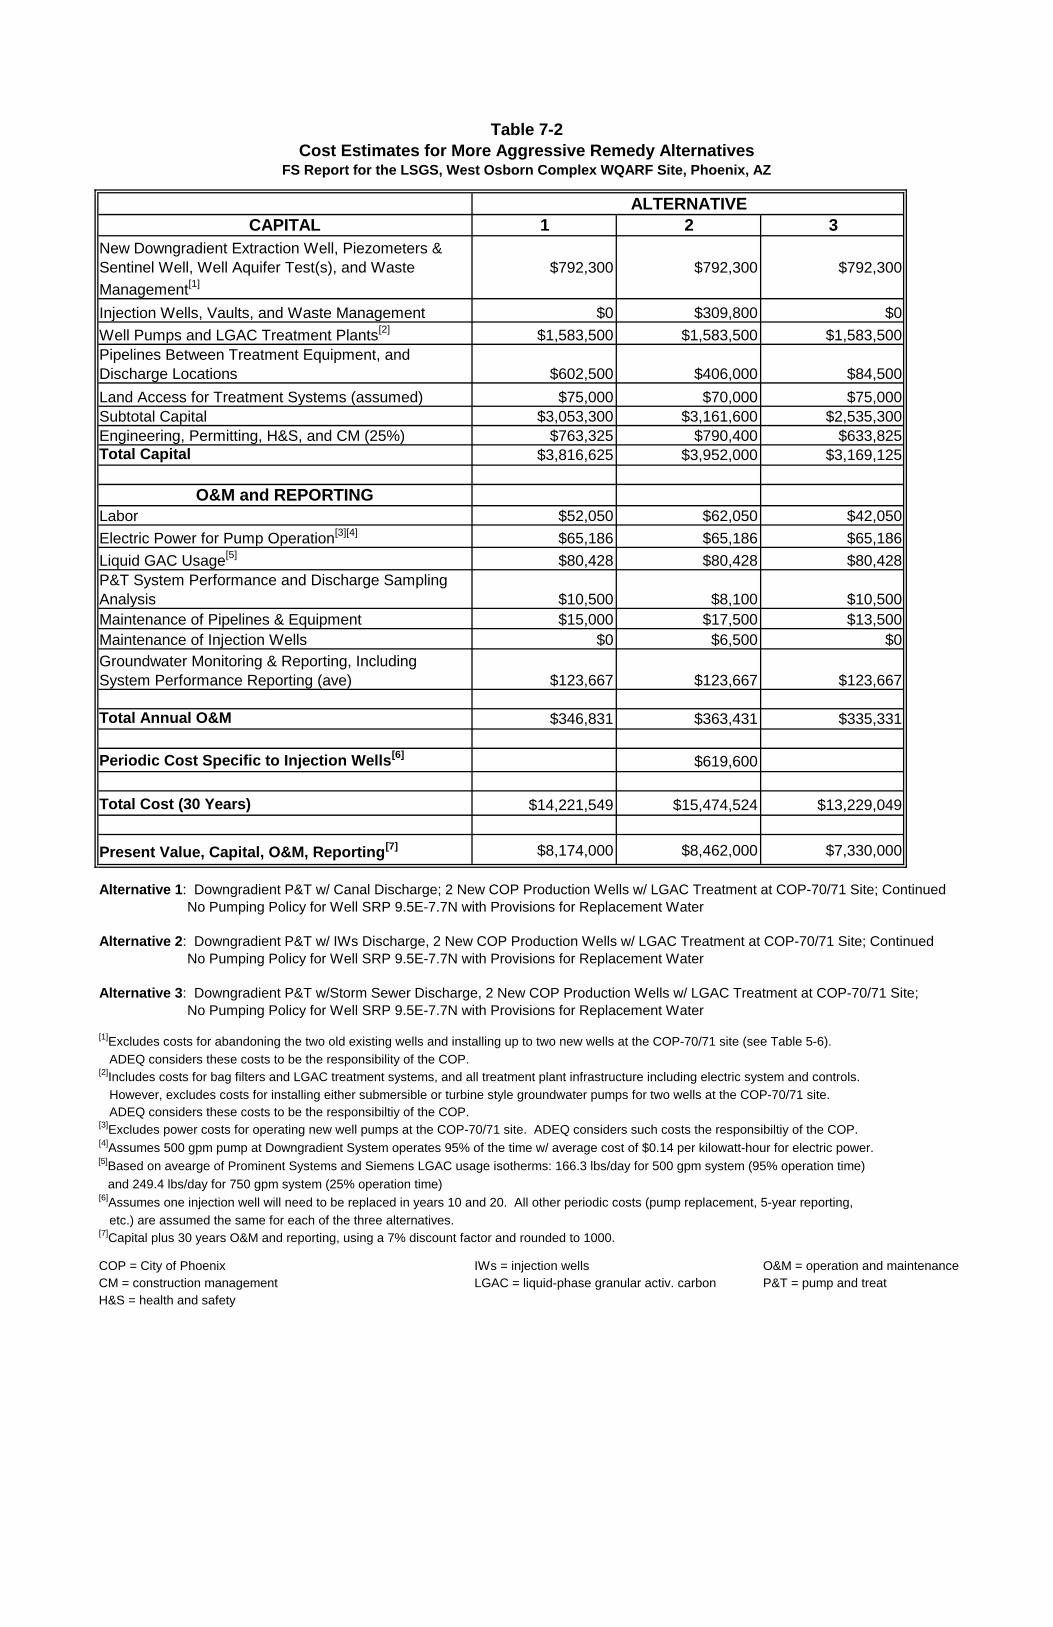
Table 7-2
Cost Estimates for More Aggressive Remedy Alternatives FS Report for the LSGS, West Osborn Complex WQARF Site, Phoenix, AZ
CAPITAL 1 2 3
New Downgradient Extraction Well, Piezometers &
Sentinel Well, Well Aquifer Test(s), and Waste
Management[1]
$792,300 $792,300 $792,300
Injection Wells, Vaults, and Waste Management $0 $309,800 $0
Well Pumps and LGAC Treatment Plants[2]
$1,583,500 $1,583,500 $1,583,500
Pipelines Between Treatment Equipment, and
Discharge Locations $602,500 $406,000 $84,500
Land Access for Treatment Systems (assumed) $75,000 $70,000 $75,000
Subtotal Capital $3,053,300 $3,161,600 $2,535,300
Engineering, Permitting, H&S, and CM (25%) $763,325 $790,400 $633,825
Total Capital $3,816,625 $3,952,000 $3,169,125
O&M and REPORTING
Labor $52,050 $62,050 $42,050
Electric Power for Pump Operation[3][4]
$65,186 $65,186 $65,186
Liquid GAC Usage[5]
$80,428 $80,428 $80,428
P&T System Performance and Discharge Sampling
Analysis $10,500 $8,100 $10,500
Maintenance of Pipelines & Equipment $15,000 $17,500 $13,500
Maintenance of Injection Wells $0 $6,500 $0
Groundwater Monitoring & Reporting, Including
System Performance Reporting (ave) $123,667 $123,667 $123,667
Total Annual O&M $346,831 $363,431 $335,331
Periodic Cost Specific to Injection Wells[6]
$619,600
Total Cost (30 Years) $14,221,549 $15,474,524 $13,229,049
Present Value, Capital, O&M, Reporting[7] $8,174,000 $8,462,000 $7,330,000
Alternative 1: Downgradient P&T w/ Canal Discharge; 2 New COP Production Wells w/ LGAC Treatment at COP-70/71 Site; Continued
No Pumping Policy for Well SRP 9.5E-7.7N with Provisions for Replacement Water
Alternative 2: Downgradient P&T w/ IWs Discharge, 2 New COP Production Wells w/ LGAC Treatment at COP-70/71 Site; Continued
No Pumping Policy for Well SRP 9.5E-7.7N with Provisions for Replacement Water
Alternative 3: Downgradient P&T w/Storm Sewer Discharge, 2 New COP Production Wells w/ LGAC Treatment at COP-70/71 Site;
No Pumping Policy for Well SRP 9.5E-7.7N with Provisions for Replacement Water
[1]Excludes costs for abandoning the two old existing wells and installing up to two new wells at the COP-70/71 site (see Table 5-6).
ADEQ considers these costs to be the responsibility of the COP.[2]
Includes costs for bag filters and LGAC treatment systems, and all treatment plant infrastructure including electric system and controls.
However, excludes costs for installing either submersible or turbine style groundwater pumps for two wells at the COP-70/71 site.
ADEQ considers these costs to be the responsibiltiy of the COP. [3]
Excludes power costs for operating new well pumps at the COP-70/71 site. ADEQ considers such costs the responsibiltiy of the COP.[4]
Assumes 500 gpm pump at Downgradient System operates 95% of the time w/ average cost of $0.14 per kilowatt-hour for electric power.[5]
Based on avearge of Prominent Systems and Siemens LGAC usage isotherms: 166.3 lbs/day for 500 gpm system (95% operation time)
and 249.4 lbs/day for 750 gpm system (25% operation time) [6]
Assumes one injection well will need to be replaced in years 10 and 20. All other periodic costs (pump replacement, 5-year reporting,
etc.) are assumed the same for each of the three alternatives.[7]
Capital plus 30 years O&M and reporting, using a 7% discount factor and rounded to 1000.
COP = City of Phoenix IWs = injection wells O&M = operation and maintenance
CM = construction management LGAC = liquid-phase granular activ. carbon P&T = pump and treat
H&S = health and safety
ALTERNATIVE