Embed Size (px)
Citation preview
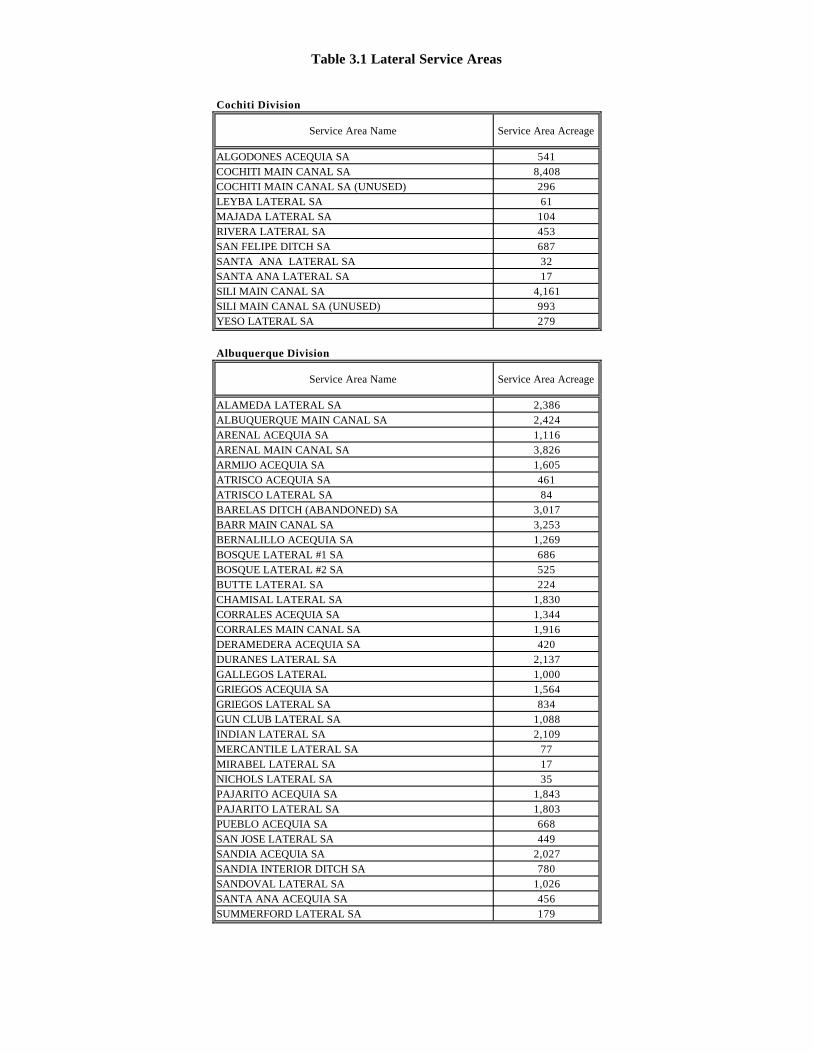
Table 3.1 Lateral Service Areas
Cochiti Division
Service Area Name Service Area Acreage
ALGODONES ACEQUIA SA 541COCHITI MAIN CANAL SA 8,408COCHITI MAIN CANAL SA (UNUSED) 296LEYBA LATERAL SA 61MAJADA LATERAL SA 104RIVERA LATERAL SA 453SAN FELIPE DITCH SA 687SANTA ANA LATERAL SA 32SANTA ANA LATERAL SA 17SILI MAIN CANAL SA 4,161SILI MAIN CANAL SA (UNUSED) 993YESO LATERAL SA 279
Albuquerque Division
Service Area Name Service Area Acreage
ALAMEDA LATERAL SA 2,386ALBUQUERQUE MAIN CANAL SA 2,424ARENAL ACEQUIA SA 1,116ARENAL MAIN CANAL SA 3,826ARMIJO ACEQUIA SA 1,605ATRISCO ACEQUIA SA 461ATRISCO LATERAL SA 84BARELAS DITCH (ABANDONED) SA 3,017BARR MAIN CANAL SA 3,253BERNALILLO ACEQUIA SA 1,269BOSQUE LATERAL #1 SA 686BOSQUE LATERAL #2 SA 525BUTTE LATERAL SA 224CHAMISAL LATERAL SA 1,830CORRALES ACEQUIA SA 1,344CORRALES MAIN CANAL SA 1,916DERAMEDERA ACEQUIA SA 420DURANES LATERAL SA 2,137GALLEGOS LATERAL 1,000GRIEGOS ACEQUIA SA 1,564GRIEGOS LATERAL SA 834GUN CLUB LATERAL SA 1,088INDIAN LATERAL SA 2,109MERCANTILE LATERAL SA 77MIRABEL LATERAL SA 17NICHOLS LATERAL SA 35PAJARITO ACEQUIA SA 1,843PAJARITO LATERAL SA 1,803PUEBLO ACEQUIA SA 668SAN JOSE LATERAL SA 449SANDIA ACEQUIA SA 2,027SANDIA INTERIOR DITCH SA 780SANDOVAL LATERAL SA 1,026SANTA ANA ACEQUIA SA 456SUMMERFORD LATERAL SA 179
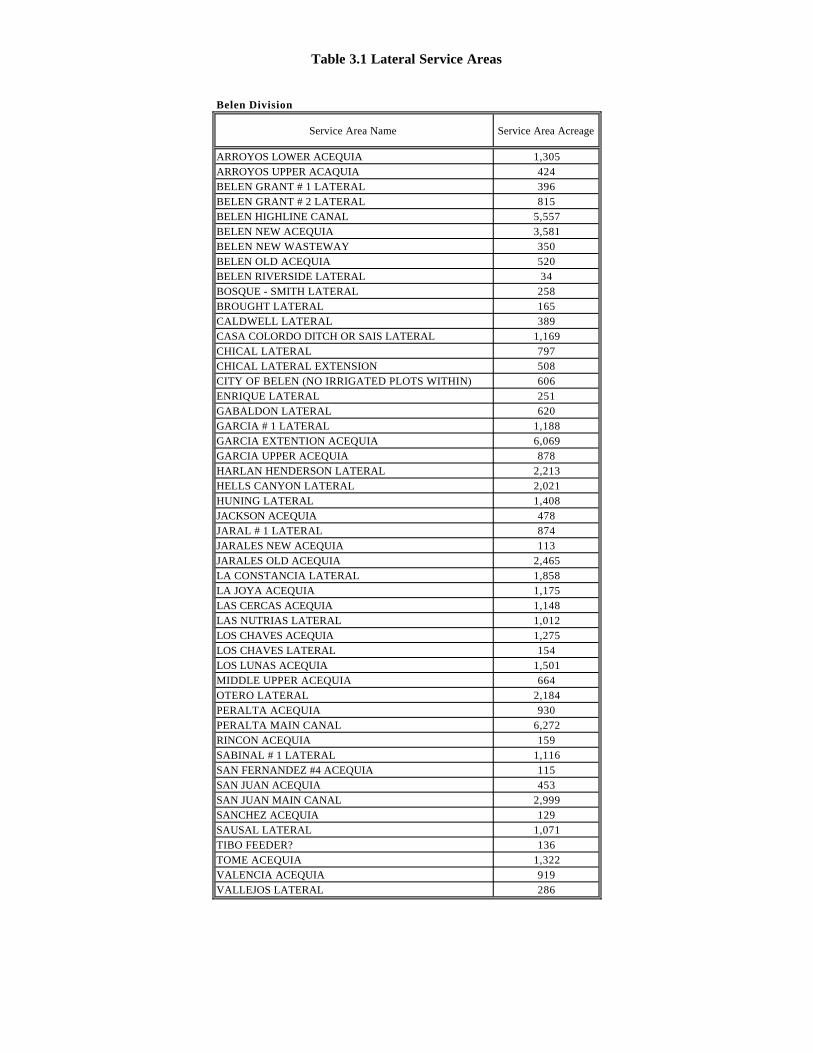
Table 3.1 Lateral Service Areas
Belen Division
Service Area Name Service Area Acreage
ARROYOS LOWER ACEQUIA 1,305ARROYOS UPPER ACAQUIA 424BELEN GRANT # 1 LATERAL 396BELEN GRANT # 2 LATERAL 815BELEN HIGHLINE CANAL 5,557BELEN NEW ACEQUIA 3,581BELEN NEW WASTEWAY 350BELEN OLD ACEQUIA 520BELEN RIVERSIDE LATERAL 34BOSQUE - SMITH LATERAL 258BROUGHT LATERAL 165CALDWELL LATERAL 389CASA COLORDO DITCH OR SAIS LATERAL 1,169CHICAL LATERAL 797CHICAL LATERAL EXTENSION 508CITY OF BELEN (NO IRRIGATED PLOTS WITHIN) 606ENRIQUE LATERAL 251GABALDON LATERAL 620GARCIA # 1 LATERAL 1,188GARCIA EXTENTION ACEQUIA 6,069GARCIA UPPER ACEQUIA 878HARLAN HENDERSON LATERAL 2,213HELLS CANYON LATERAL 2,021HUNING LATERAL 1,408JACKSON ACEQUIA 478JARAL # 1 LATERAL 874JARALES NEW ACEQUIA 113JARALES OLD ACEQUIA 2,465LA CONSTANCIA LATERAL 1,858LA JOYA ACEQUIA 1,175LAS CERCAS ACEQUIA 1,148LAS NUTRIAS LATERAL 1,012LOS CHAVES ACEQUIA 1,275LOS CHAVES LATERAL 154LOS LUNAS ACEQUIA 1,501MIDDLE UPPER ACEQUIA 664OTERO LATERAL 2,184PERALTA ACEQUIA 930PERALTA MAIN CANAL 6,272RINCON ACEQUIA 159SABINAL # 1 LATERAL 1,116SAN FERNANDEZ #4 ACEQUIA 115SAN JUAN ACEQUIA 453SAN JUAN MAIN CANAL 2,999SANCHEZ ACEQUIA 129SAUSAL LATERAL 1,071TIBO FEEDER? 136TOME ACEQUIA 1,322VALENCIA ACEQUIA 919VALLEJOS LATERAL 286
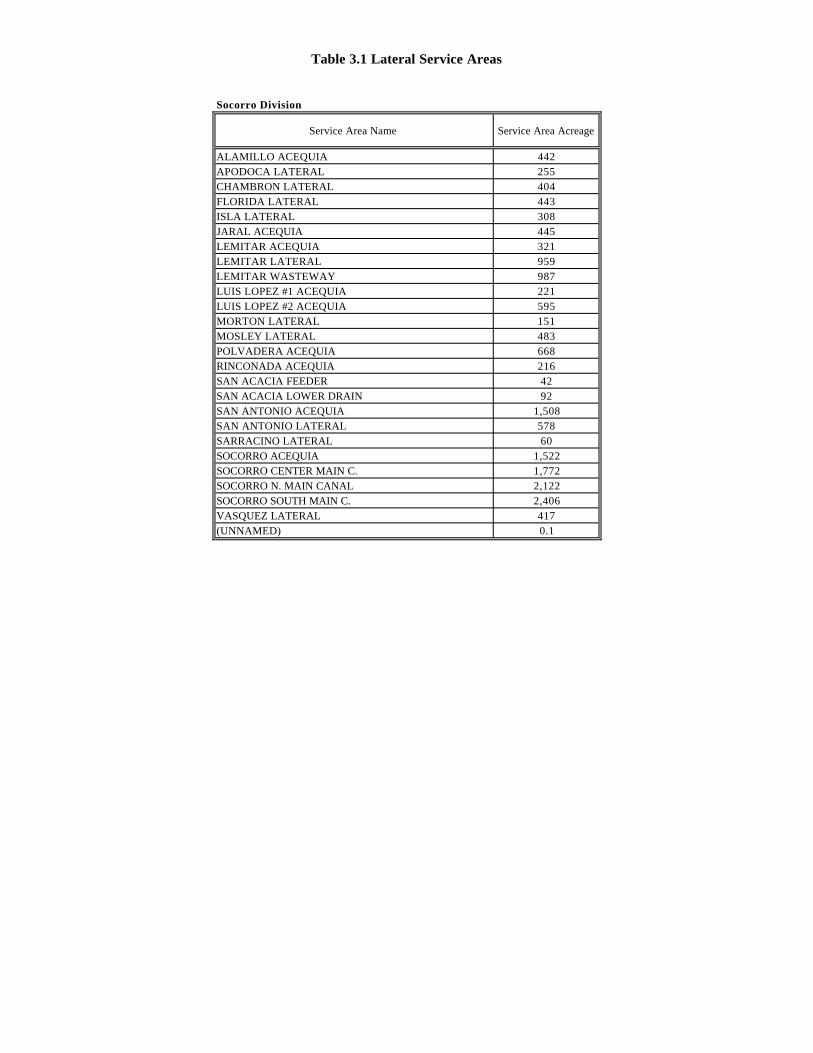
Table 3.1 Lateral Service Areas
Socorro Division
Service Area Name Service Area Acreage
ALAMILLO ACEQUIA 442APODOCA LATERAL 255CHAMBRON LATERAL 404FLORIDA LATERAL 443ISLA LATERAL 308JARAL ACEQUIA 445LEMITAR ACEQUIA 321LEMITAR LATERAL 959LEMITAR WASTEWAY 987LUIS LOPEZ #1 ACEQUIA 221LUIS LOPEZ #2 ACEQUIA 595MORTON LATERAL 151MOSLEY LATERAL 483POLVADERA ACEQUIA 668RINCONADA ACEQUIA 216SAN ACACIA FEEDER 42SAN ACACIA LOWER DRAIN 92SAN ANTONIO ACEQUIA 1,508SAN ANTONIO LATERAL 578SARRACINO LATERAL 60SOCORRO ACEQUIA 1,522SOCORRO CENTER MAIN C. 1,772SOCORRO N. MAIN CANAL 2,122SOCORRO SOUTH MAIN C. 2,406VASQUEZ LATERAL 417(UNNAMED) 0.1
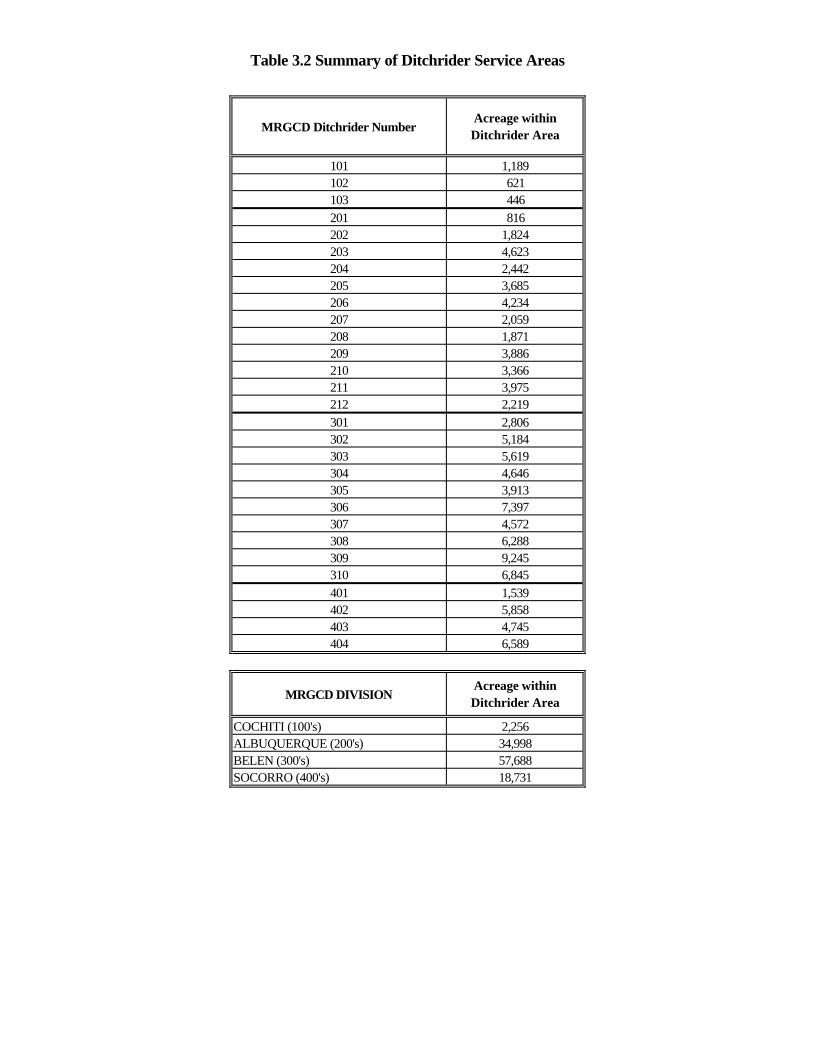
Table 3.2 Summary of Ditchrider Service Areas
MRGCD Ditchrider NumberAcreage within Ditchrider Area
101 1,189102 621103 446201 816202 1,824203 4,623204 2,442205 3,685206 4,234207 2,059208 1,871209 3,886210 3,366211 3,975212 2,219301 2,806302 5,184303 5,619304 4,646305 3,913306 7,397307 4,572308 6,288309 9,245310 6,845401 1,539402 5,858403 4,745404 6,589
MRGCD DIVISIONAcreage within Ditchrider Area
COCHITI (100's) 2,256ALBUQUERQUE (200's) 34,998BELEN (300's) 57,688SOCORRO (400's) 18,731
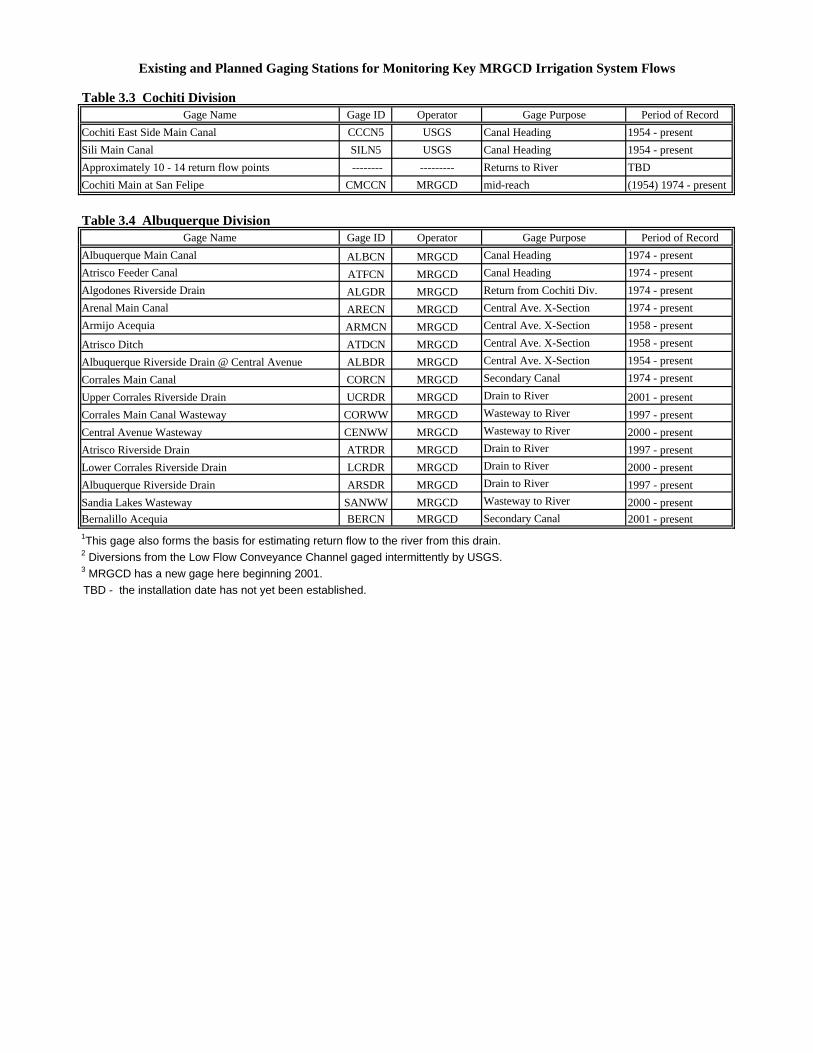
Table 3.3 Cochiti DivisionGage Name Gage ID Operator Gage Purpose Period of Record
Cochiti East Side Main Canal CCCN5 USGS Canal Heading 1954 - present
Sili Main Canal SILN5 USGS Canal Heading 1954 - present
Approximately 10 - 14 return flow points -------- --------- Returns to River TBD
Cochiti Main at San Felipe CMCCN MRGCD mid-reach (1954) 1974 - present
Table 3.4 Albuquerque DivisionGage Name Gage ID Operator Gage Purpose Period of Record
Albuquerque Main Canal ALBCN MRGCD Canal Heading 1974 - present
Atrisco Feeder Canal ATFCN MRGCD Canal Heading 1974 - present
Algodones Riverside Drain ALGDR MRGCD Return from Cochiti Div. 1974 - present
Arenal Main Canal ARECN MRGCD Central Ave. X-Section 1974 - present
Armijo Acequia ARMCN MRGCD Central Ave. X-Section 1958 - present
Atrisco Ditch ATDCN MRGCD Central Ave. X-Section 1958 - present
Albuquerque Riverside Drain @ Central Avenue ALBDR MRGCD Central Ave. X-Section 1954 - present
Corrales Main Canal CORCN MRGCD Secondary Canal 1974 - present
Upper Corrales Riverside Drain UCRDR MRGCD Drain to River 2001 - present
Corrales Main Canal Wasteway CORWW MRGCD Wasteway to River 1997 - present
Central Avenue Wasteway CENWW MRGCD Wasteway to River 2000 - present
Atrisco Riverside Drain ATRDR MRGCD Drain to River 1997 - present
Lower Corrales Riverside Drain LCRDR MRGCD Drain to River 2000 - present
Albuquerque Riverside Drain ARSDR MRGCD Drain to River 1997 - present
Sandia Lakes Wasteway SANWW MRGCD Wasteway to River 2000 - presentBernalillo Acequia BERCN MRGCD Secondary Canal 2001 - present
Existing and Planned Gaging Stations for Monitoring Key MRGCD Irrigation System Flows
1This gage also forms the basis for estimating return flow to the river from this drain.2 Diversions from the Low Flow Conveyance Channel gaged intermittently by USGS.3 MRGCD has a new gage here beginning 2001. TBD - the installation date has not yet been established.
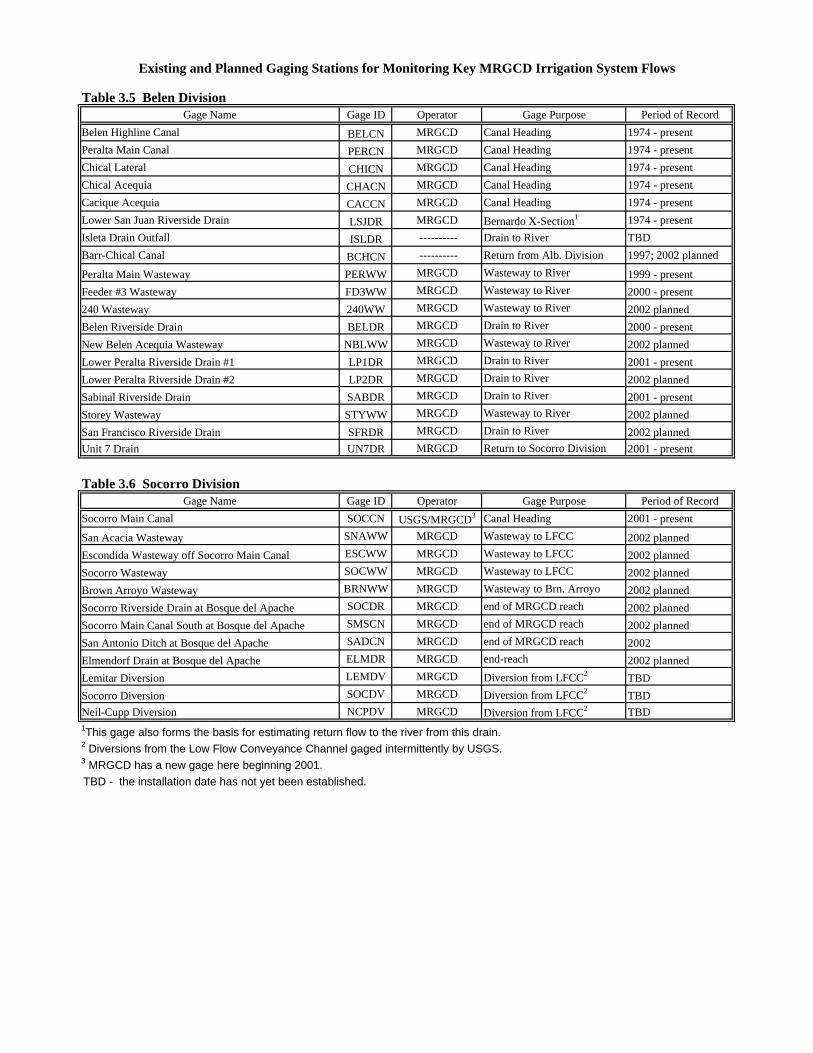
Existing and Planned Gaging Stations for Monitoring Key MRGCD Irrigation System Flows
Table 3.5 Belen DivisionGage Name Gage ID Operator Gage Purpose Period of Record
Belen Highline Canal BELCN MRGCD Canal Heading 1974 - present
Peralta Main Canal PERCN MRGCD Canal Heading 1974 - present
Chical Lateral CHICN MRGCD Canal Heading 1974 - present
Chical Acequia CHACN MRGCD Canal Heading 1974 - present
Cacique Acequia CACCN MRGCD Canal Heading 1974 - present
Lower San Juan Riverside Drain LSJDR MRGCD Bernardo X-Section1 1974 - present
Isleta Drain Outfall ISLDR ---------- Drain to River TBD
Barr-Chical Canal BCHCN ---------- Return from Alb. Division 1997; 2002 planned
Peralta Main Wasteway PERWW MRGCD Wasteway to River 1999 - present
Feeder #3 Wasteway FD3WW MRGCD Wasteway to River 2000 - present
240 Wasteway 240WW MRGCD Wasteway to River 2002 planned
Belen Riverside Drain BELDR MRGCD Drain to River 2000 - present
New Belen Acequia Wasteway NBLWW MRGCD Wasteway to River 2002 planned
Lower Peralta Riverside Drain #1 LP1DR MRGCD Drain to River 2001 - present
Lower Peralta Riverside Drain #2 LP2DR MRGCD Drain to River 2002 planned
Sabinal Riverside Drain SABDR MRGCD Drain to River 2001 - present
Storey Wasteway STYWW MRGCD Wasteway to River 2002 planned
San Francisco Riverside Drain SFRDR MRGCD Drain to River 2002 planned Unit 7 Drain UN7DR MRGCD Return to Socorro Division 2001 - present
Table 3.6 Socorro DivisionGage Name Gage ID Operator Gage Purpose Period of Record
Socorro Main Canal SOCCN USGS/MRGCD3 Canal Heading 2001 - present
San Acacia Wasteway SNAWW MRGCD Wasteway to LFCC 2002 planned
Escondida Wasteway off Socorro Main Canal ESCWW MRGCD Wasteway to LFCC 2002 planned
Socorro Wasteway SOCWW MRGCD Wasteway to LFCC 2002 planned
Brown Arroyo Wasteway BRNWW MRGCD Wasteway to Brn. Arroyo 2002 planned
Socorro Riverside Drain at Bosque del Apache SOCDR MRGCD end of MRGCD reach 2002 planned
Socorro Main Canal South at Bosque del Apache SMSCN MRGCD end of MRGCD reach 2002 planned
San Antonio Ditch at Bosque del Apache SADCN MRGCD end of MRGCD reach 2002
Elmendorf Drain at Bosque del Apache ELMDR MRGCD end-reach 2002 planned
Lemitar Diversion LEMDV MRGCD Diversion from LFCC2 TBD
Socorro Diversion SOCDV MRGCD Diversion from LFCC2 TBDNeil-Cupp Diversion NCPDV MRGCD Diversion from LFCC2 TBD1This gage also forms the basis for estimating return flow to the river from this drain.2 Diversions from the Low Flow Conveyance Channel gaged intermittently by USGS.3 MRGCD has a new gage here beginning 2001. TBD - the installation date has not yet been established.
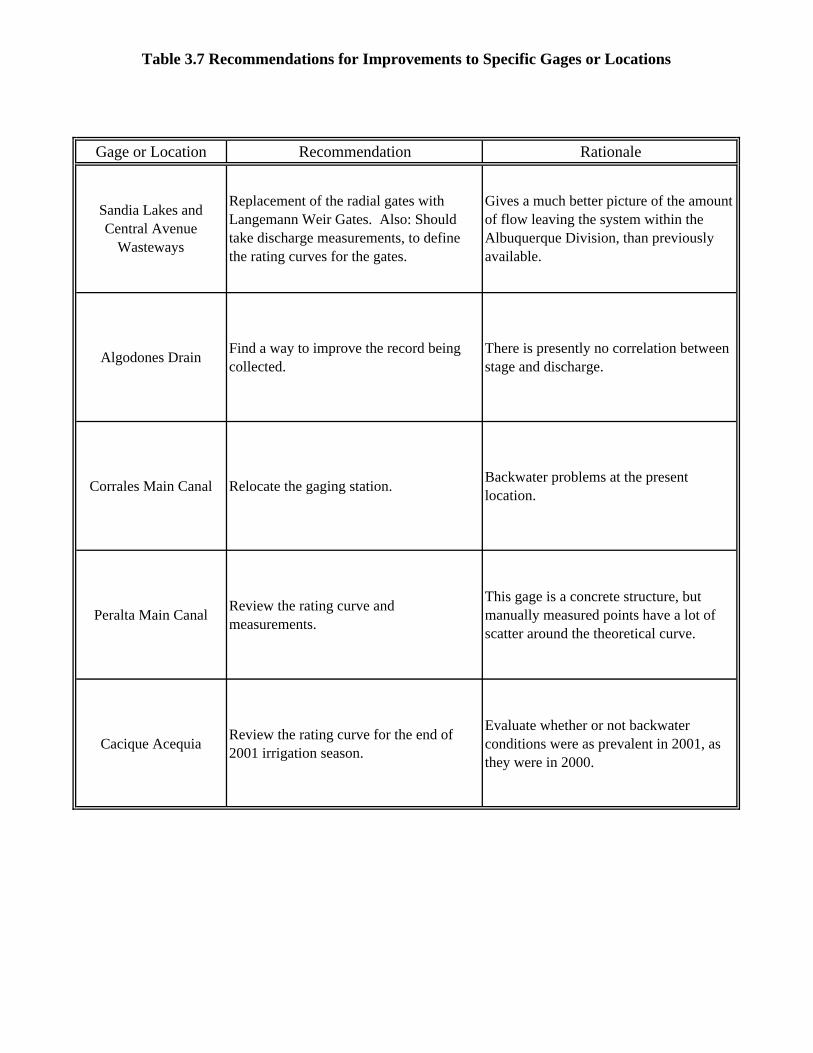
Table 3.7 Recommendations for Improvements to Specific Gages or Locations
Gage or Location Recommendation Rationale
Sandia Lakes and Central Avenue
Wasteways
Replacement of the radial gates with Langemann Weir Gates. Also: Should take discharge measurements, to define the rating curves for the gates.
Gives a much better picture of the amount of flow leaving the system within the Albuquerque Division, than previously available.
Algodones DrainFind a way to improve the record being collected.
There is presently no correlation between stage and discharge.
Corrales Main Canal Relocate the gaging station.Backwater problems at the present location.
Peralta Main CanalReview the rating curve and measurements.
This gage is a concrete structure, but manually measured points have a lot of scatter around the theoretical curve.
Cacique AcequiaReview the rating curve for the end of 2001 irrigation season.
Evaluate whether or not backwater conditions were as prevalent in 2001, as they were in 2000.
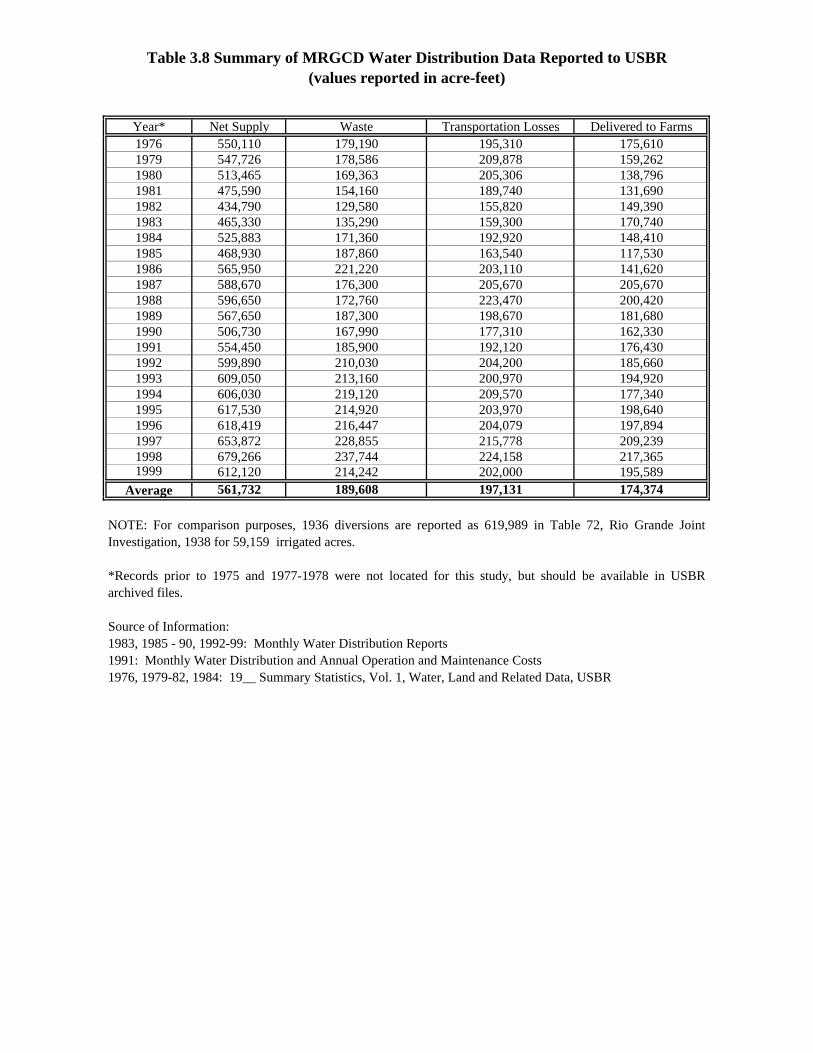
Table 3.8 Summary of MRGCD Water Distribution Data Reported to USBR(values reported in acre-feet)
Year* Net Supply Waste Transportation Losses Delivered to Farms1976 550,110 179,190 195,310 175,6101979 547,726 178,586 209,878 159,2621980 513,465 169,363 205,306 138,7961981 475,590 154,160 189,740 131,6901982 434,790 129,580 155,820 149,3901983 465,330 135,290 159,300 170,7401984 525,883 171,360 192,920 148,4101985 468,930 187,860 163,540 117,5301986 565,950 221,220 203,110 141,6201987 588,670 176,300 205,670 205,6701988 596,650 172,760 223,470 200,4201989 567,650 187,300 198,670 181,6801990 506,730 167,990 177,310 162,3301991 554,450 185,900 192,120 176,4301992 599,890 210,030 204,200 185,6601993 609,050 213,160 200,970 194,9201994 606,030 219,120 209,570 177,3401995 617,530 214,920 203,970 198,6401996 618,419 216,447 204,079 197,8941997 653,872 228,855 215,778 209,2391998 679,266 237,744 224,158 217,3651999 612,120 214,242 202,000 195,589
Average 561,732 189,608 197,131 174,374
NOTE: For comparison purposes, 1936 diversions are reported as 619,989 in Table 72, Rio Grande JointInvestigation, 1938 for 59,159 irrigated acres.
*Records prior to 1975 and 1977-1978 were not located for this study, but should be available in USBRarchived files.
Source of Information:1983, 1985 - 90, 1992-99: Monthly Water Distribution Reports1991: Monthly Water Distribution and Annual Operation and Maintenance Costs1976, 1979-82, 1984: 19__ Summary Statistics, Vol. 1, Water, Land and Related Data, USBR
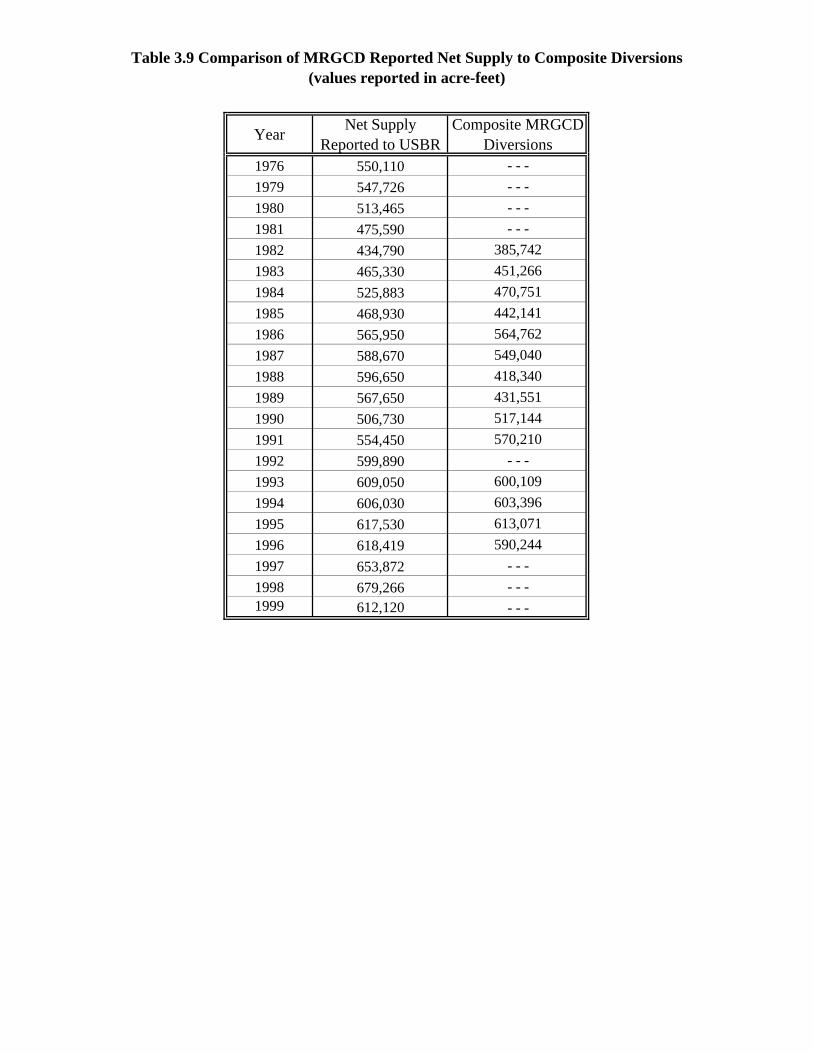
Table 3.9 Comparison of MRGCD Reported Net Supply to Composite Diversions(values reported in acre-feet)
YearNet Supply
Reported to USBRComposite MRGCD
Diversions1976 550,110 - - -1979 547,726 - - -1980 513,465 - - -1981 475,590 - - -1982 434,790 385,7421983 465,330 451,2661984 525,883 470,7511985 468,930 442,1411986 565,950 564,7621987 588,670 549,0401988 596,650 418,3401989 567,650 431,5511990 506,730 517,1441991 554,450 570,2101992 599,890 - - -1993 609,050 600,1091994 606,030 603,3961995 617,530 613,0711996 618,419 590,2441997 653,872 - - -1998 679,266 - - -1999 612,120 - - -
Tab
le 3
.10
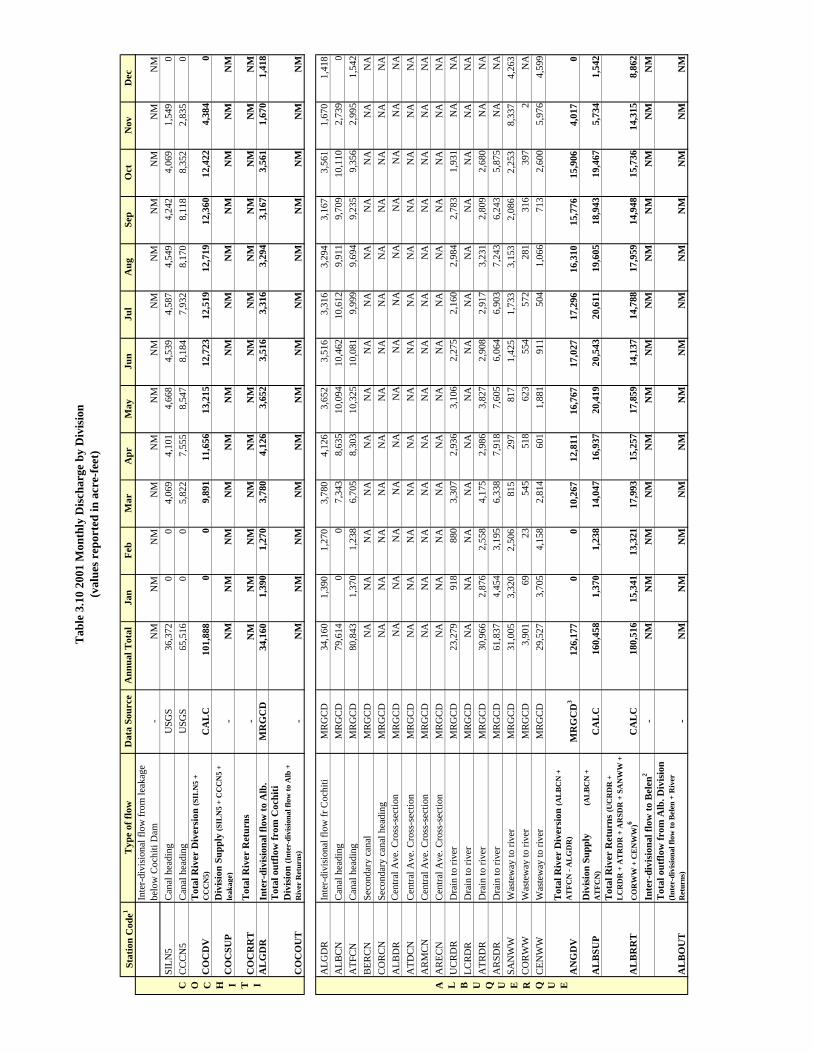
2001
Mon
thly
Dis
char
ge b
y D
ivis
ion
(val
ues
repo
rted
in a
cre-
feet
)
Stat
ion
Cod
e1T
ype
of fl
owD
ata
Sour
ceA
nnua
l Tot
alJa
nF
ebM
arA
prM
ayJu
nJu
lA
ugSe
pO
ctN
ovD
ecIn
ter-
divi
sion
al fl
ow fr
om le
akag
e be
low
Coc
hiti
Dam
-N
MN
MN
MN
MN
MN
MN
MN
MN
MN
MN
MN
MN
MSI
LN5
Can
al h
eadi
ngU
SGS
36,3
720
04,
069
4,10
14,
668
4,53
94,
587
4,54
94,
242
4,06
91,
549
0C
CC
N5
Can
al h
eadi
ngU
SGS
65,5
160
05,
822
7,55
58,
547
8,18
47,
932
8,17
08,
118
8,35
22,
835
0
CO
CD
VT
otal
Riv
er D
iver
sion
(SIL
N5
+ C
CC
N5)
CA
LC
101,
888
00
9,89
111
,656
13,2
1512
,723
12,5
1912
,719
12,3
6012
,422
4,38
40
CO
CSU
PD
ivis
ion
Supp
ly (S
ILN
5 +
CC
CN
5 +
leak
age)
-N
MN
MN
MN
MN
MN
MN
MN
MN
MN
MN
MN
MN
M
CO
CR
RT
Tot
al R
iver
Ret
urns
-N
MN
MN
MN
MN
MN
MN
MN
MN
MN
MN
MN
MN
MA
LG
DR
Inte
r-di
visi
onal
flow
to A
lb.
MR
GC
D34
,160
1,39
01,
270
3,78
04,
126
3,65
23,
516
3,31
63,
294
3,16
73,
561
1,67
01,
418
CO
CO
UT
Tot
al o
utfl
ow fr
om C
ochi
ti
Div
isio
n (I
nter
-div
isio
nal f
low
to A
lb +
R
iver
Ret
urns
)-
NM
NM
NM
NM
NM
NM
NM
NM
NM
NM
NM
NM
NM
ALG
DR
Inte
r-di
visi
onal
flow
fr C
ochi
tiM
RG
CD
34,1
601,
390
1,27
03,
780
4,12
63,
652
3,51
63,
316
3,29
43,
167
3,56
11,
670
1,41
8A
LBC
NC
anal
hea
ding
MR
GC
D79
,614
00
7,34
38,
635
10,0
9410
,462
10,6
129,
911
9,70
910
,110
2,73
90
ATF
CN
Can
al h
eadi
ngM
RG
CD
80,8
431,
370
1,23
86,
705
8,30
310
,325
10,0
819,
999
9,69
49,
235
9,35
62,
995
1,54
2B
ERC
NSe
cond
ary
cana
lM
RG
CD
NA
NA
NA
NA
NA
NA
NA
NA
NA
NA
NA
NA
NA
CO
RC
NSe
cond
ary
cana
l hea
ding
MR
GC
DN
AN
AN
AN
AN
AN
AN
AN
AN
AN
AN
AN
AN
AA
LBD
RC
entra
l Ave
. Cro
ss-s
ectio
nM
RG
CD
NA
NA
NA
NA
NA
NA
NA
NA
NA
NA
NA
NA
NA
ATD
CN
Cen
tral A
ve. C
ross
-sec
tion
MR
GC
DN
AN
AN
AN
AN
AN
AN
AN
AN
AN
AN
AN
AN
AA
RM
CN
Cen
tral A
ve. C
ross
-sec
tion
MR
GC
DN
AN
AN
AN
AN
AN
AN
AN
AN
AN
AN
AN
AN
AA
REC
NC
entra
l Ave
. Cro
ss-s
ectio
nM
RG
CD
NA
NA
NA
NA
NA
NA
NA
NA
NA
NA
NA
NA
NA
UC
RD
RD
rain
to ri
ver
MR
GC
D23
,279
918
880
3,30
72,
936
3,10
62,
275
2,16
02,
984
2,78
31,
931
NA
NA
LCR
DR
Dra
in to
rive
rM
RG
CD
NA
NA
NA
NA
NA
NA
NA
NA
NA
NA
NA
NA
NA
ATR
DR
Dra
in to
rive
rM
RG
CD
30,9
662,
876
2,55
84,
175
2,98
63,
827
2,90
82,
917
3,23
12,
809
2,68
0N
AN
AA
RSD
RD
rain
to ri
ver
MR
GC
D61
,837
4,45
43,
195
6,33
87,
918
7,60
56,
064
6,90
37,
243
6,24
35,
875
NA
NA
SAN
WW
Was
tew
ay to
rive
rM
RG
CD
31,0
053,
320
2,50
681
529
781
71,
425
1,73
33,
153
2,08
62,
253
8,33
74,
263
CO
RW
WW
aste
way
to ri
ver
MR
GC
D3,
901
6923
545
518
623
554
572
281
316
397
2N
AC
ENW
WW
aste
way
to ri
ver
MR
GC
D29
,527
3,70
54,
158
2,81
460
11,
881
911
504
1,06
671
32,
600
5,97
64,
599
AN
GD
V
Tot
al R
iver
Div
ersi
on (A
LB
CN
+
AT
FCN
- A
LG
DR
)M
RG
CD
312
6,17
70
010
,267
12,8
1116
,767
17,0
2717
,296
16,3
1015
,776
15,9
064,
017
0
AL
BSU
PD
ivis
ion
Supp
ly
(A
LB
CN
+
AT
FCN
)C
AL
C16
0,45
81,
370
1,23
814
,047
16,9
3720
,419
20,5
4320
,611
19,6
0518
,943
19,4
675,
734
1,54
2
AL
BR
RT
Tot
al R
iver
Ret
urns
(UC
RD
R +
L
CR
DR
+ A
TR
DR
+ A
RSD
R +
SA
NW
W +
CO
RW
W +
CE
NW
W)6
CA
LC
180,
516
15,3
4113
,321
17,9
9315
,257
17,8
5914
,137
14,7
8817
,959
14,9
4815
,736
14,3
158,
862
Inte
r-di
visi
onal
flow
to B
elen
2-
NM
NM
NM
NM
NM
NM
NM
NM
NM
NM
NM
NM
NM
AL
BO
UT
Tot
al o
utfl
ow fr
om A
lb. D
ivis
ion
(Int
er-d
ivis
iona
l flo
w to
Bel
en +
Riv
er
Ret
urns
)-
NM
NM
NM
NM
NM
NM
NM
NM
NM
NM
NM
NM
NM
C O C H I T I A L B U Q U E R Q U E
Tab
le 3
.10
2001
Mon
thly
Dis
char
ge b
y D
ivis
ion
(val
ues
repo
rted
in a
cre-
feet
)
Stat
ion
Cod
e1T
ype
of fl
owD
ata
Sour
ceA
nnua
l Tot
alJa
nF
ebM
arA
prM
ayJu
nJu
lA
ugSe
pO
ctN
ovD
ec
Inte
r-di
visi
onal
flow
fr A
lb.2
MR
GC
DN
MN
MN
MN
MN
MN
MN
MN
MN
MN
MN
MN
MN
MC
HA
CN
Can
al h
eadi
ngM
RG
CD
3,47
90
017
542
754
961
445
252
842
728
920
0C
AC
CN
Can
al h
eadi
ngM
RG
CD
9,27
50
021
61,
164
1,27
21,
308
1,20
61,
253
1,16
41,
515
177
0B
ELC
NC
anal
hea
ding
MR
GC
D10
5,83
90
010
,781
13,4
3215
,138
16,5
5115
,708
12,9
3111
,080
9,87
334
50
CH
ICN
Can
al h
eadi
ngM
RG
CD
18,1
020
010
52,
238
2,84
03,
061
2,98
92,
309
2,76
21,
766
310
PER
CN
Can
al h
eadi
ngM
RG
CD
104,
398
00
4,64
414
,424
15,6
8117
,462
16,0
8913
,501
13,2
789,
013
306
0L
SJD
RB
erna
rdo
Cro
ss-s
ectio
nM
RG
CD
71,7
892,
877
2,61
55,
630
8,56
08,
920
7,91
37,
510
8,15
08,
118
9,87
11,
623
0L
P1D
RD
rain
to ri
ver
MR
GC
D26
,496
1,22
975
41,
110
2,38
02,
459
3,90
93,
900
3,80
34,
251
2,32
637
50
LP2
DR
Dra
in to
rive
rM
RG
CD
11,8
882,
459
2,57
885
329
730
729
730
730
729
759
52,
717
873
BEL
DR
Dra
in to
rive
rM
RG
CD
15,0
832,
459
2,11
01,
528
743
585
569
477
615
595
1,12
33,
333
946
SAB
DR
Dra
in to
rive
rM
RG
CD
9,03
31,
249
2,61
81,
507
297
307
297
307
307
297
615
1,22
90
PER
WW
Was
tew
ay to
rive
rM
RG
CD
26,3
320
03,
003
3,46
04,
246
4,29
74,
398
3,67
53,
253
00
0FD
3WW
Was
tew
ay to
rive
rM
RG
CD
7,62
10
02,
464
1,17
398
41,
188
613
369
436
316
790
ISL
DV
Tot
al R
iver
Div
ersi
on (C
HA
CN
+
CA
CC
N +
BE
LC
N +
CH
ICN
+ P
ER
CN
- B
arr
Chi
cal L
ater
al)
MR
GC
D3
233,
406
00
15,9
2131
,686
35,4
8038
,817
34,6
0028
,678
26,9
2620
,612
687
0
BE
LSU
PD
ivis
ion
Supp
ly (C
HA
CN
+ C
AC
CN
+
BE
LC
N +
CH
ICN
+ P
ER
CN
)C
AL
C24
1,09
30
015
,921
31,6
8635
,480
38,9
9536
,444
30,5
2228
,711
22,4
5687
80
ISL
RR
T
Tot
al R
iver
Ret
urns
(LP
1DR
+
LP
2DR
+ B
EL
DR
+ S
AB
DR
+ P
ER
WW
+
FD
3WW
)C
AL
C96
,453
7,39
78,
059
10,4
658,
350
8,88
910
,558
10,0
039,
076
9,13
04,
976
7,73
21,
818
UN
7DR
Inte
r-di
visi
onal
flow
to S
ocor
roM
RG
CD
87,9
562,
314
1,44
77,
081
10,1
1110
,335
9,45
010
,357
11,2
2111
,528
11,1
482,
044
919
BE
LO
UT
Tot
al o
utfl
ow fr
om B
elen
Div
isio
n (I
nter
-div
isio
nal f
low
to S
ocor
ro +
Riv
er
Ret
urns
)C
AL
C18
4,40
89,
711
9,50
617
,546
18,4
6219
,224
20,0
0820
,360
20,2
9820
,658
16,1
249,
776
2,73
7
UN
7DR
Inte
r-di
visi
onal
flow
fr B
elen
MR
GC
D87
,956
2,31
41,
447
7,08
110
,111
10,3
359,
450
10,3
5711
,221
11,5
2811
,148
2,04
491
9SO
CC
N4
Can
al h
eadi
ngU
SGS
111,
948
00
10,5
5912
,878
14,7
0214
,991
15,2
7514
,155
14,6
8814
,700
00
SNA
DV
Tot
al R
iver
Div
ersi
on (S
OC
CN
- U
N7D
R)
MR
GC
D3
30,7
170
03,
478
2,76
64,
367
5,54
24,
918
2,93
33,
160
3,55
20
0
SOC
SUP
Div
isio
n Su
pply
(SO
CC
N +
L
EM
DV
+ 1
2HD
V +
NC
PD
V)5
-N
MN
MN
MN
MN
MN
MN
MN
MN
MN
MN
MN
MN
M
SNA
RR
TT
otal
Riv
er R
etur
ns-
NM
NM
NM
NM
NM
NM
NM
NM
NM
NM
NM
NM
NM
Out
flow
to B
osqu
e de
l Apa
che
NW
R-
NM
NM
NM
NM
NM
NM
NM
NM
NM
NM
NM
NM
NM
SOC
OU
T
Tot
al o
utfl
ow fr
Soc
orro
Div
isio
n (O
utflo
w to
Bos
que
del A
pach
e N
WR
+
Riv
er R
etur
ns)
-N
MN
MN
MN
MN
MN
MN
MN
MN
MN
MN
MN
MN
M
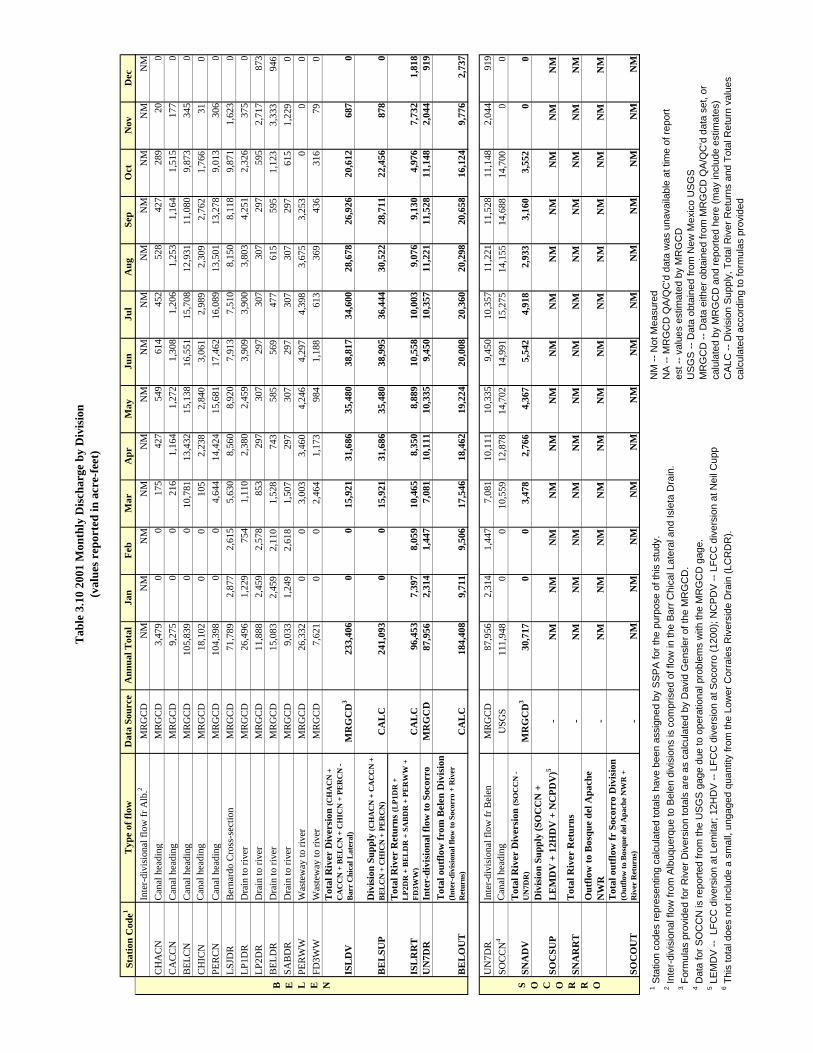
S O C O R R OB E L E N 1 Sta
tion
code
s re
pres
entin
g ca
lcul
ated
tota
ls h
ave
been
ass
igne
d by
SS
PA
for t
he p
urpo
se o
f thi
s st
udy.
2 Inte
r-di
visi
onal
flow
from
Alb
uque
rque
to B
elen
div
isio
ns is
com
pris
ed o
f flo
w in
the
Bar
r Chi
cal L
ater
al a
nd Is
leta
Dra
in.
3 For
mul
as p
rovi
ded
for R
iver
Div
ersi
on to
tals
are
as
calc
ulat
ed b
y D
avid
Gen
sler
of t
he M
RG
CD
.4 D
ata
for S
OC
CN
is re
porte
d fro
m th
e U
SG
S g
age
due
to o
pera
tiona
l pro
blem
s w
ith th
e M
RG
CD
gag
e.5 L
EM
DV
-- L
FC
C d
iver
sion
at L
emita
r; 1
2HD
V --
LF
CC
div
ersi
on a
t Soc
orro
(120
0); N
CP
DV
-- L
FC
C d
iver
sion
at N
eil C
upp
6 Thi
s to
tal d
oes
not i
nclu
de a
sm
all,
unga
ged
quan
tity
from
the
Low
er C
orra
les
Riv
ersi
de D
rain
(LC
RD
R).
NM
-- N
ot M
easu
red
NA
-- M
RG
CD
QA
/QC
'd d
ata
was
una
vaila
ble
at ti
me
of re
port
est -
- val
ues
estim
ated
by
MR
GC
DU
SG
S --
Dat
a ob
tain
ed fr
om N
ew M
exic
o U
SG
SM
RG
CD
--
Dat
a ei
ther
obt
aine
d fr
om M
RG
CD
QA
/QC
'd d
ata
set,
or
calu
late
d by
MR
GC
D a
nd re
porte
d he
re (m
ay in
clud
e es
timat
es)
CA
LC --
Div
isio
n S
uppl
y, T
otal
Riv
er R
etur
ns a
nd T
otal
Ret
urn
valu
es
calc
ulat
ed a
ccor
ding
to fo
rmul
as p
rovi
ded
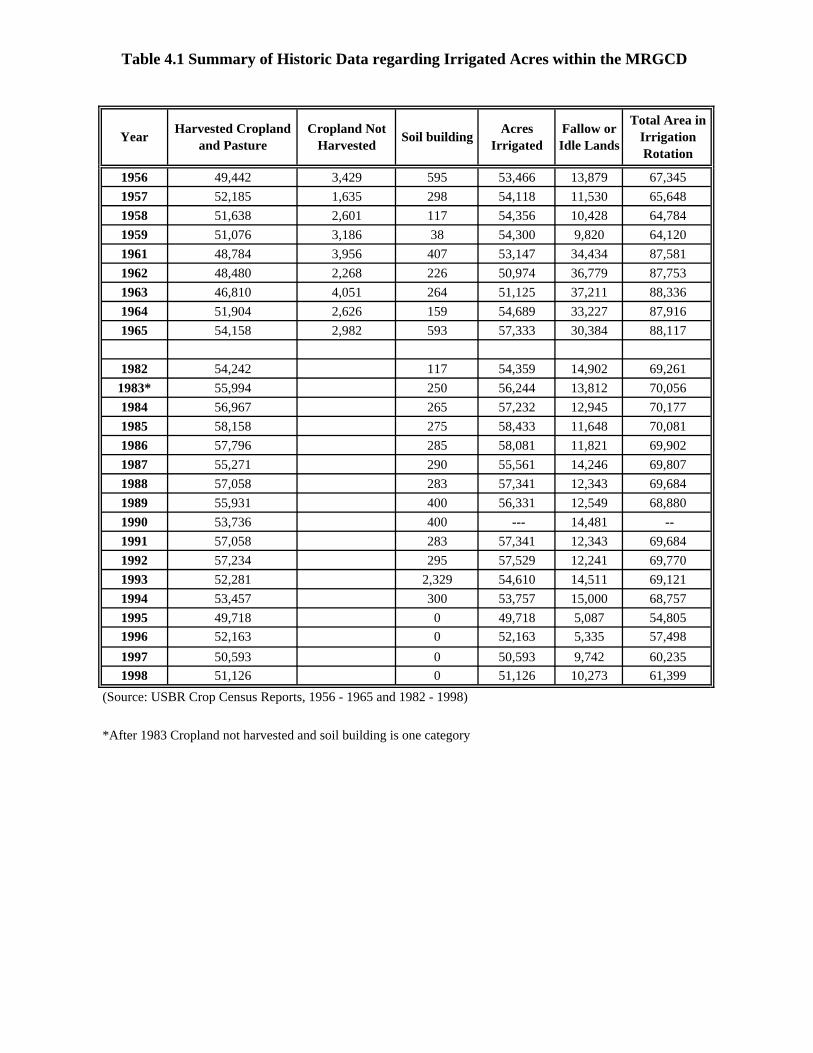
Table 4.1 Summary of Historic Data regarding Irrigated Acres within the MRGCD
1956 49,442 3,429 595 53,466 13,879 67,3451957 52,185 1,635 298 54,118 11,530 65,6481958 51,638 2,601 117 54,356 10,428 64,7841959 51,076 3,186 38 54,300 9,820 64,1201961 48,784 3,956 407 53,147 34,434 87,5811962 48,480 2,268 226 50,974 36,779 87,7531963 46,810 4,051 264 51,125 37,211 88,3361964 51,904 2,626 159 54,689 33,227 87,9161965 54,158 2,982 593 57,333 30,384 88,117
1982 54,242 117 54,359 14,902 69,2611983* 55,994 250 56,244 13,812 70,0561984 56,967 265 57,232 12,945 70,1771985 58,158 275 58,433 11,648 70,0811986 57,796 285 58,081 11,821 69,9021987 55,271 290 55,561 14,246 69,8071988 57,058 283 57,341 12,343 69,6841989 55,931 400 56,331 12,549 68,8801990 53,736 400 --- 14,481 --1991 57,058 283 57,341 12,343 69,6841992 57,234 295 57,529 12,241 69,7701993 52,281 2,329 54,610 14,511 69,1211994 53,457 300 53,757 15,000 68,7571995 49,718 0 49,718 5,087 54,8051996 52,163 0 52,163 5,335 57,498
1997 50,593 0 50,593 9,742 60,2351998 51,126 0 51,126 10,273 61,399
(Source: USBR Crop Census Reports, 1956 - 1965 and 1982 - 1998)
*After 1983 Cropland not harvested and soil building is one category
Cropland Not Harvested
Harvested Cropland and Pasture
YearTotal Area in
Irrigation Rotation
Fallow or Idle Lands
Acres Irrigated
Soil building
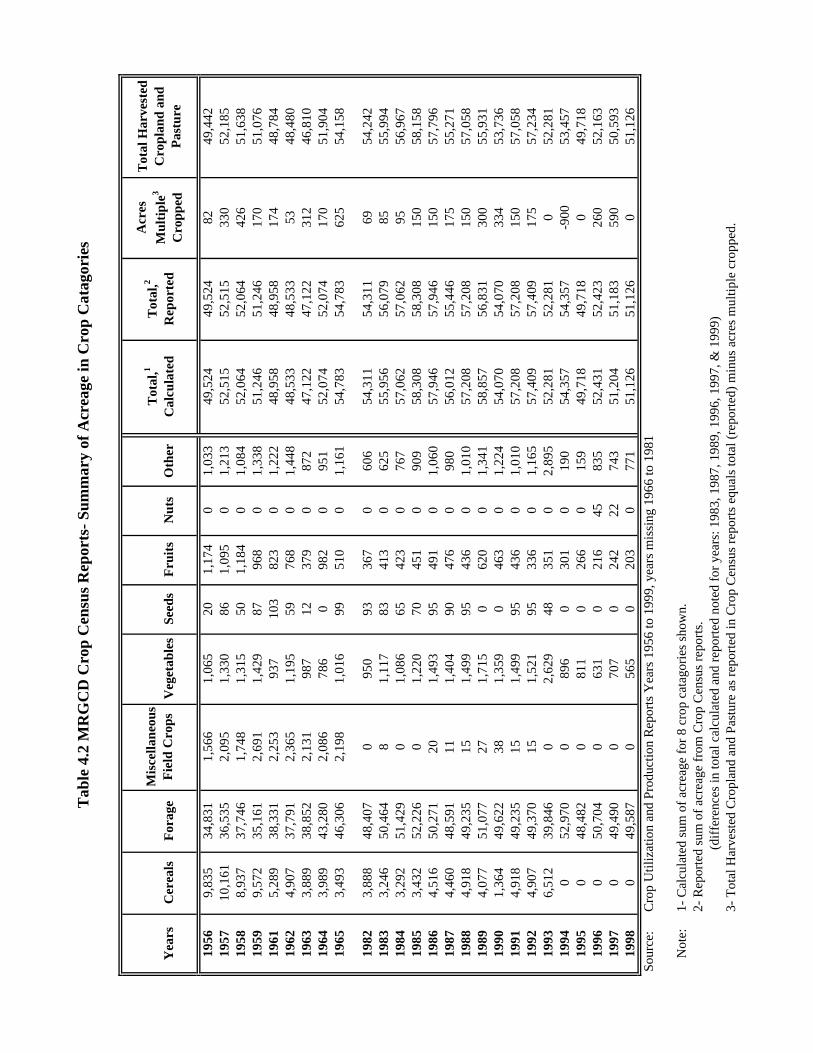
Tab
le 4
.2 M
RG
CD
Cro
p C
ensu
s R
epor
ts- S
umm
ary
of A
crea
ge in
Cro
p C
atag
orie
s
Yea
rsC
erea
lsF
orag
eV
eget
able
sSe
eds
Fru
its
Nut
sO
ther
1956
9,83
534
,831
1,56
61,
065
201,
174
01,
033
49,5
2449
,524
8249
,442
1957
10,1
6136
,535
2,09
51,
330
861,
095
01,
213
52,5
1552
,515
330
52,1
8519
588,
937
37,7
461,
748
1,31
550
1,18
40
1,08
452
,064
52,0
6442
651
,638
1959
9,57
235
,161
2,69
11,
429
8796
80
1,33
851
,246
51,2
4617
051
,076
1961
5,28
938
,331
2,25
393
710
382
30
1,22
248
,958
48,9
5817
448
,784
1962
4,90
737
,791
2,36
51,
195
5976
80
1,44
848
,533
48,5
3353
48,4
8019
633,
889
38,8
522,
131
987
1237
90
872
47,1
2247
,122
312
46,8
1019
643,
989
43,2
802,
086
786
098
20
951
52,0
7452
,074
170
51,9
0419
653,
493
46,3
062,
198
1,01
699
510
01,
161
54,7
8354
,783
625
54,1
58
1982
3,88
848
,407
095
093
367
060
654
,311
54,3
1169
54,2
4219
833,
246
50,4
648
1,11
783
413
062
555
,956
56,0
7985
55,9
9419
843,
292
51,4
290
1,08
665
423
076
757
,062
57,0
6295
56,9
6719
853,
432
52,2
260
1,22
070
451
090
958
,308
58,3
0815
058
,158
1986
4,51
650
,271
201,
493
9549
10
1,06
057
,946
57,9
4615
057
,796
1987
4,46
048
,591
111,
404
9047
60
980
56,0
1255
,446
175
55,2
7119
884,
918
49,2
3515
1,49
995
436
01,
010
57,2
0857
,208
150
57,0
5819
894,
077
51,0
7727
1,71
50
620
01,
341
58,8
5756
,831
300
55,9
3119
901,
364
49,6
2238
1,35
90
463
01,
224
54,0
7054
,070
334
53,7
3619
914,
918
49,2
3515
1,49
995
436
01,
010
57,2
0857
,208
150
57,0
5819
924,
907
49,3
7015
1,52
195
336
01,
165
57,4
0957
,409
175
57,2
3419
936,
512
39,8
460
2,62
948
351
02,
895
52,2
8152
,281
052
,281
1994
052
,970
089
60
301
019
054
,357
54,3
57-9
0053
,457
1995
048
,482
081
10
266
015
949
,718
49,7
180
49,7
1819
960
50,7
040
631
021
645
835
52,4
3152
,423
260
52,1
6319
970
49,4
900
707
024
222
743
51,2
0451
,183
590
50,5
9319
980
49,5
870
565
020
30
771
51,1
2651
,126
051
,126
Sour
ce:
Cro
p U
tiliz
atio
n an
d Pr
oduc
tion
Rep
orts
Yea
rs 1
956
to 1
999,
yea
rs m
issi
ng 1
966
to 1
981
Not
e:1-
Cal
cula
ted
sum
of a
crea
ge fo
r 8 c
rop
cata
gori
es s
how
n.2-
Rep
orte
d su
m o
f acr
eage
from
Cro
p C
ensu
s re
port
s.(d
iffe
renc
es in
tota
l cal
cula
ted
and
repo
rted
not
ed fo
r yea
rs: 1
983,
198
7, 1
989,
199
6, 1
997,
& 1
999)
3- T
otal
Har
vest
ed C
ropl
and
and
Past
ure
as re
port
ed in
Cro
p C
ensu
s re
port
s eq
uals
tota
l (re
port
ed) m
inus
acr
es m
ultip
le c
ropp
ed.
Mis
cella
neou
s F
ield
Cro
ps
Tot
al H
arve
sted
C
ropl
and
and
Pas
ture
Acr
es
Mul
tipl
e3
Cro
pped
Tot
al,1
Cal
cula
ted
Tot
al,2
Rep
orte
d
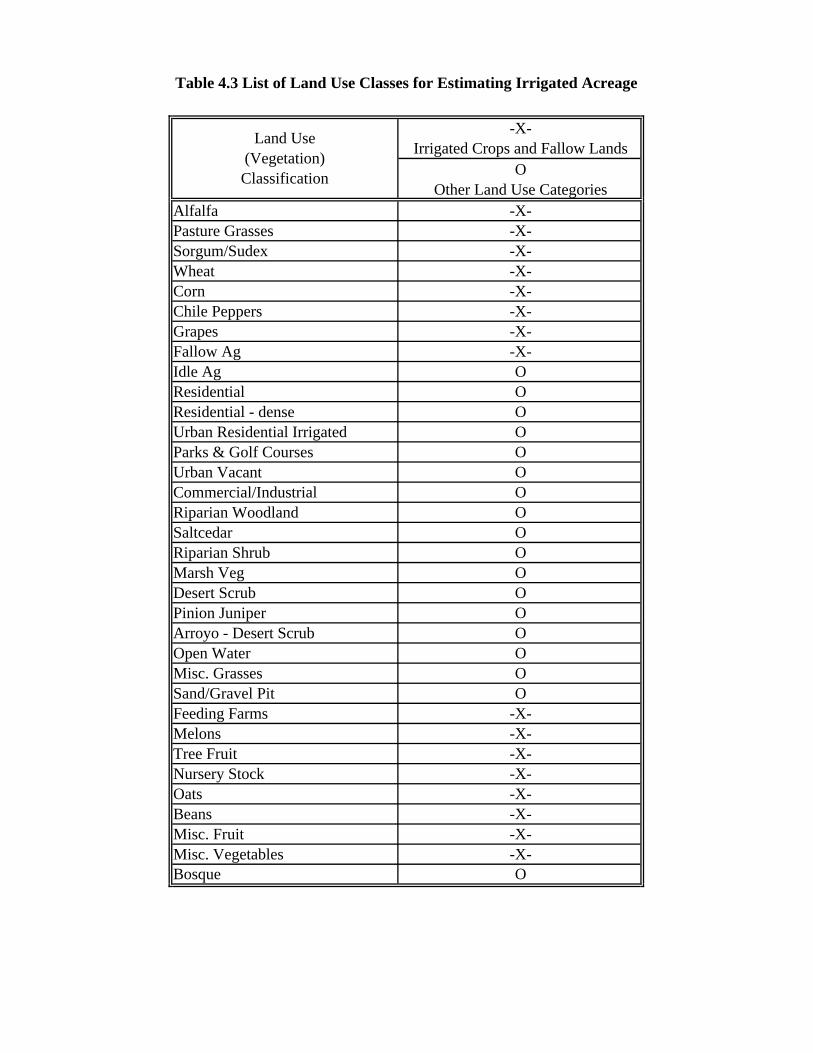
Table 4.3 List of Land Use Classes for Estimating Irrigated Acreage
-X- Irrigated Crops and Fallow Lands
O Other Land Use Categories
Alfalfa -X-Pasture Grasses -X-Sorgum/Sudex -X-Wheat -X-Corn -X-Chile Peppers -X-Grapes -X-Fallow Ag -X-Idle Ag OResidential OResidential - dense OUrban Residential Irrigated OParks & Golf Courses OUrban Vacant OCommercial/Industrial ORiparian Woodland OSaltcedar ORiparian Shrub OMarsh Veg ODesert Scrub OPinion Juniper OArroyo - Desert Scrub OOpen Water OMisc. Grasses OSand/Gravel Pit OFeeding Farms -X-Melons -X-Tree Fruit -X-Nursery Stock -X-Oats -X-Beans -X-Misc. Fruit -X-Misc. Vegetables -X-Bosque O
Land Use (Vegetation) Classification
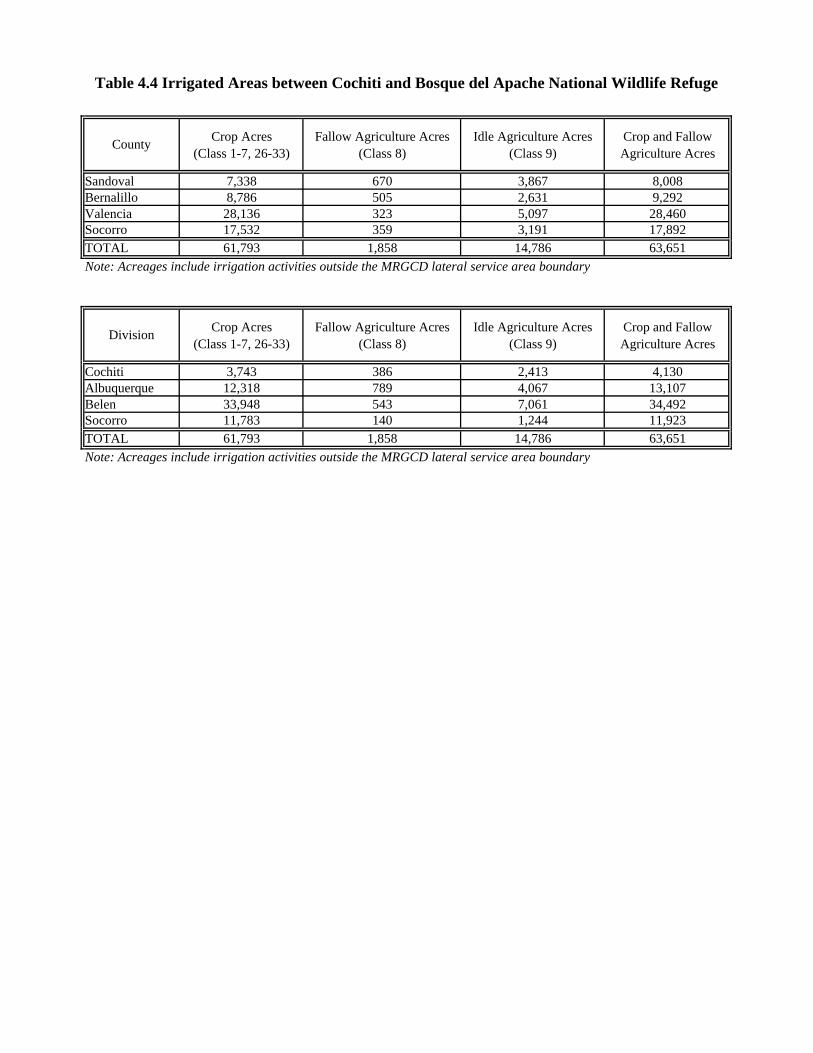
Table 4.4 Irrigated Areas between Cochiti and Bosque del Apache National Wildlife Refuge
Crop Acres (Class 1-7, 26-33)
Fallow Agriculture Acres (Class 8)
Idle Agriculture Acres (Class 9)
Crop and Fallow Agriculture Acres
Sandoval 7,338 670 3,867 8,008Bernalillo 8,786 505 2,631 9,292Valencia 28,136 323 5,097 28,460Socorro 17,532 359 3,191 17,892
61,793 1,858 14,786 63,651Note: Acreages include irrigation activities outside the MRGCD lateral service area boundary
Crop Acres (Class 1-7, 26-33)
Fallow Agriculture Acres (Class 8)
Idle Agriculture Acres (Class 9)
Crop and Fallow Agriculture Acres
Cochiti 3,743 386 2,413 4,130Albuquerque 12,318 789 4,067 13,107Belen 33,948 543 7,061 34,492Socorro 11,783 140 1,244 11,923
61,793 1,858 14,786 63,651Note: Acreages include irrigation activities outside the MRGCD lateral service area boundaryTOTAL
County
TOTAL
Division
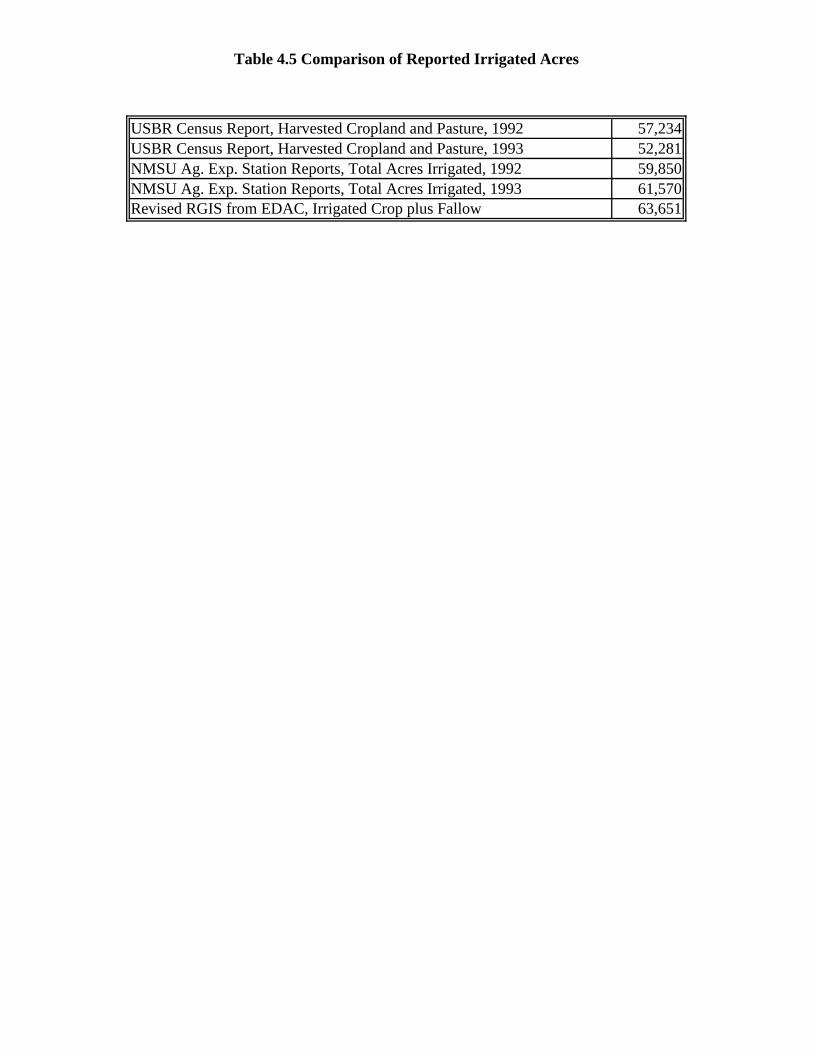
Table 4.5 Comparison of Reported Irrigated Acres
USBR Census Report, Harvested Cropland and Pasture, 1992 57,234USBR Census Report, Harvested Cropland and Pasture, 1993 52,281NMSU Ag. Exp. Station Reports, Total Acres Irrigated, 1992 59,850NMSU Ag. Exp. Station Reports, Total Acres Irrigated, 1993 61,570Revised RGIS from EDAC, Irrigated Crop plus Fallow 63,651
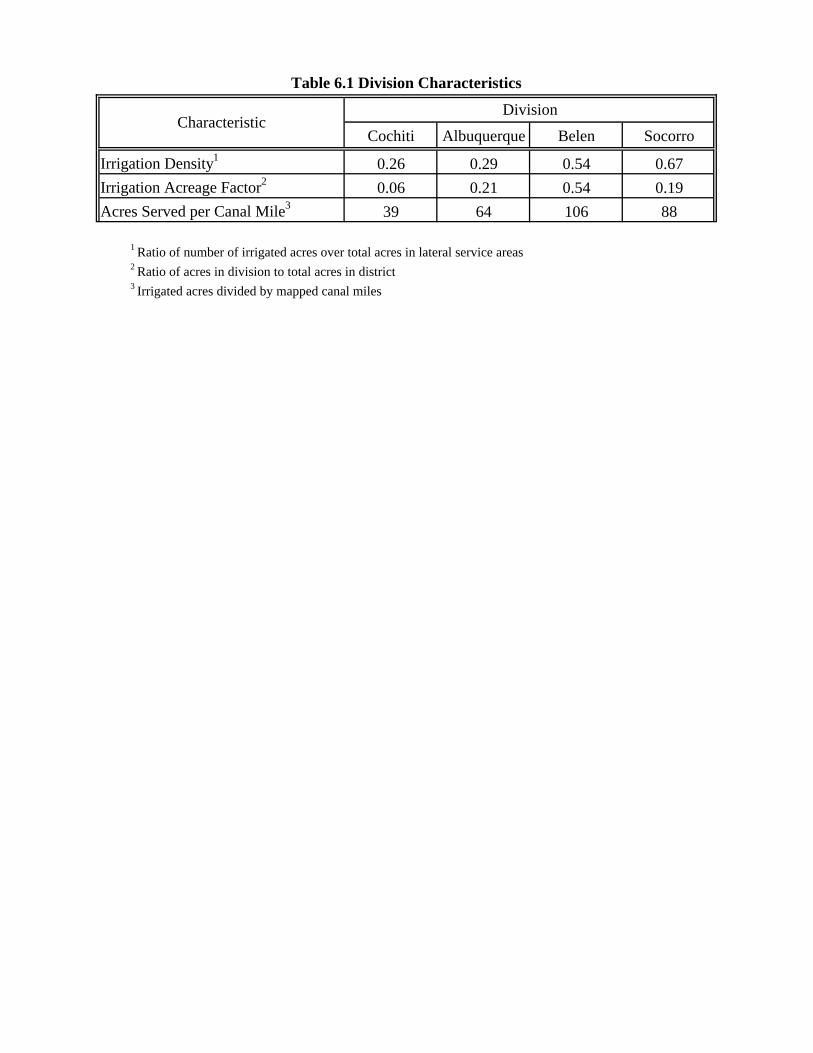
Table 6.1 Division Characteristics
Cochiti Albuquerque Belen Socorro
Irrigation Density1 0.26 0.29 0.54 0.67Irrigation Acreage Factor2 0.06 0.21 0.54 0.19Acres Served per Canal Mile3 39 64 106 88
DivisionCharacteristic
1 Ratio of number of irrigated acres over total acres in lateral service areas2 Ratio of acres in division to total acres in district3 Irrigated acres divided by mapped canal miles
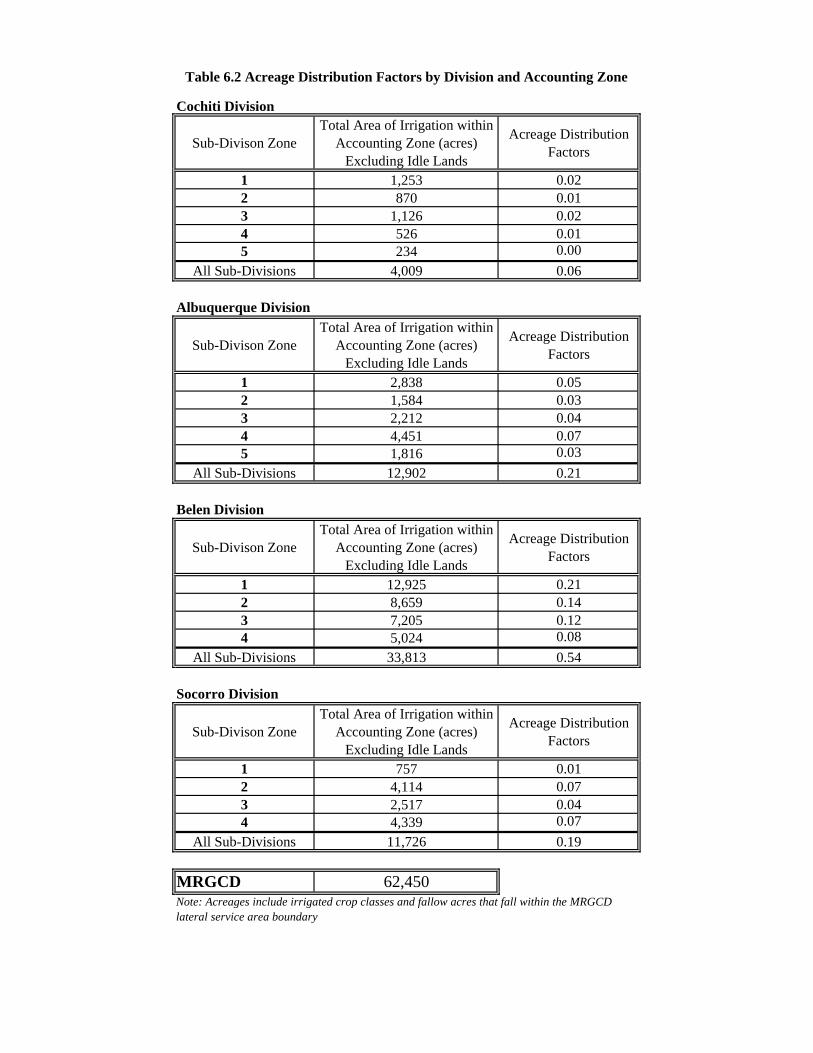
Table 6.2 Acreage Distribution Factors by Division and Accounting Zone
Cochiti Division
Sub-Divison ZoneTotal Area of Irrigation within
Accounting Zone (acres) Excluding Idle Lands
Acreage Distribution Factors
1 1,253 0.022 870 0.013 1,126 0.024 526 0.015 234 0.00
All Sub-Divisions 4,009 0.06
Albuquerque Division
Sub-Divison ZoneTotal Area of Irrigation within
Accounting Zone (acres) Excluding Idle Lands
Acreage Distribution Factors
1 2,838 0.052 1,584 0.033 2,212 0.044 4,451 0.075 1,816 0.03
All Sub-Divisions 12,902 0.21
Belen Division
Sub-Divison ZoneTotal Area of Irrigation within
Accounting Zone (acres) Excluding Idle Lands
Acreage Distribution Factors
1 12,925 0.212 8,659 0.143 7,205 0.124 5,024 0.08
All Sub-Divisions 33,813 0.54
Socorro Division
Sub-Divison ZoneTotal Area of Irrigation within
Accounting Zone (acres) Excluding Idle Lands
Acreage Distribution Factors
1 757 0.012 4,114 0.073 2,517 0.044 4,339 0.07
All Sub-Divisions 11,726 0.19
MRGCD 62,450Note: Acreages include irrigated crop classes and fallow acres that fall within the MRGCD lateral service area boundary
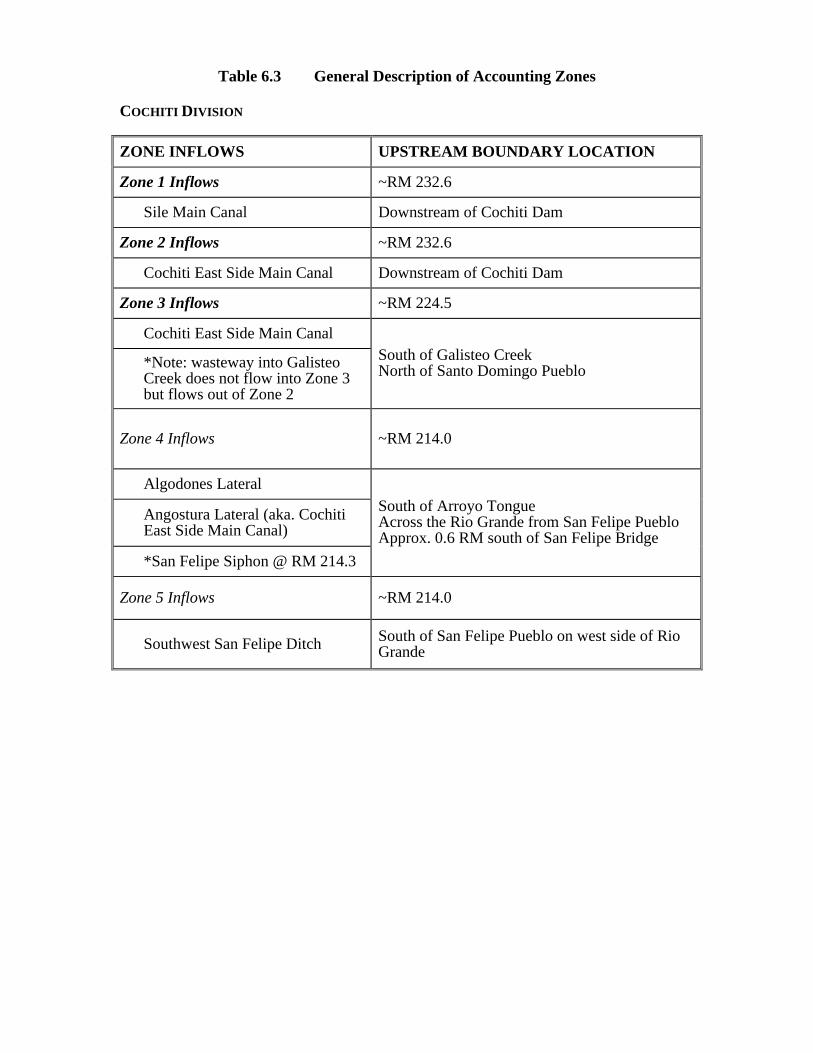
Table 6.3 General Description of Accounting Zones COCHITI DIVISION
ZONE INFLOWS UPSTREAM BOUNDARY LOCATION
Zone 1 Inflows ~RM 232.6
Sile Main Canal Downstream of Cochiti Dam
Zone 2 Inflows ~RM 232.6
Cochiti East Side Main Canal Downstream of Cochiti Dam
Zone 3 Inflows ~RM 224.5
Cochiti East Side Main Canal
*Note: wasteway into Galisteo Creek does not flow into Zone 3 but flows out of Zone 2
South of Galisteo Creek North of Santo Domingo Pueblo
Zone 4 Inflows ~RM 214.0
Algodones Lateral
Angostura Lateral (aka. Cochiti East Side Main Canal)
*San Felipe Siphon @ RM 214.3
South of Arroyo Tongue Across the Rio Grande from San Felipe Pueblo Approx. 0.6 RM south of San Felipe Bridge
Zone 5 Inflows ~RM 214.0
Southwest San Felipe Ditch South of San Felipe Pueblo on west side of Rio Grande
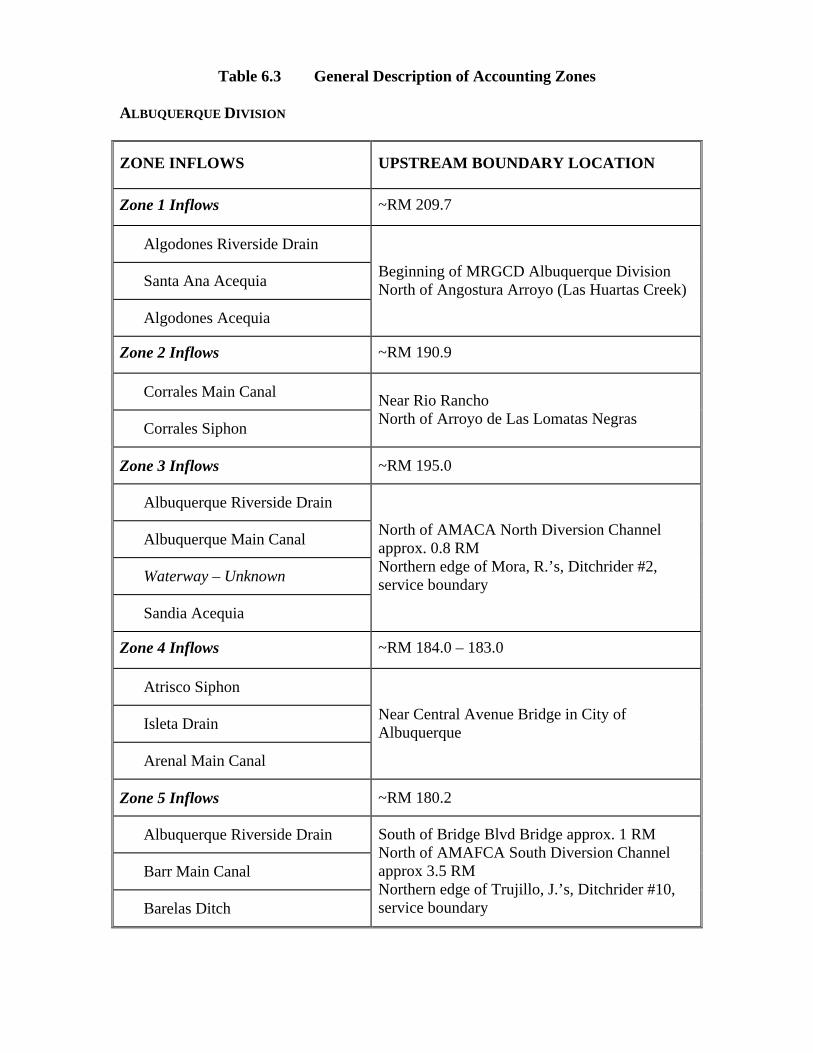
Table 6.3 General Description of Accounting Zones ALBUQUERQUE DIVISION
ZONE INFLOWS UPSTREAM BOUNDARY LOCATION
Zone 1 Inflows ~RM 209.7
Algodones Riverside Drain
Santa Ana Acequia
Algodones Acequia
Beginning of MRGCD Albuquerque Division North of Angostura Arroyo (Las Huartas Creek)
Zone 2 Inflows ~RM 190.9
Corrales Main Canal
Corrales Siphon
Near Rio Rancho North of Arroyo de Las Lomatas Negras
Zone 3 Inflows ~RM 195.0
Albuquerque Riverside Drain
Albuquerque Main Canal
Waterway – Unknown
Sandia Acequia
North of AMACA North Diversion Channel approx. 0.8 RM Northern edge of Mora, R.’s, Ditchrider #2, service boundary
Zone 4 Inflows ~RM 184.0 – 183.0
Atrisco Siphon
Isleta Drain
Arenal Main Canal
Near Central Avenue Bridge in City of Albuquerque
Zone 5 Inflows ~RM 180.2
Albuquerque Riverside Drain
Barr Main Canal
Barelas Ditch
South of Bridge Blvd Bridge approx. 1 RM North of AMAFCA South Diversion Channel approx 3.5 RM Northern edge of Trujillo, J.’s, Ditchrider #10, service boundary
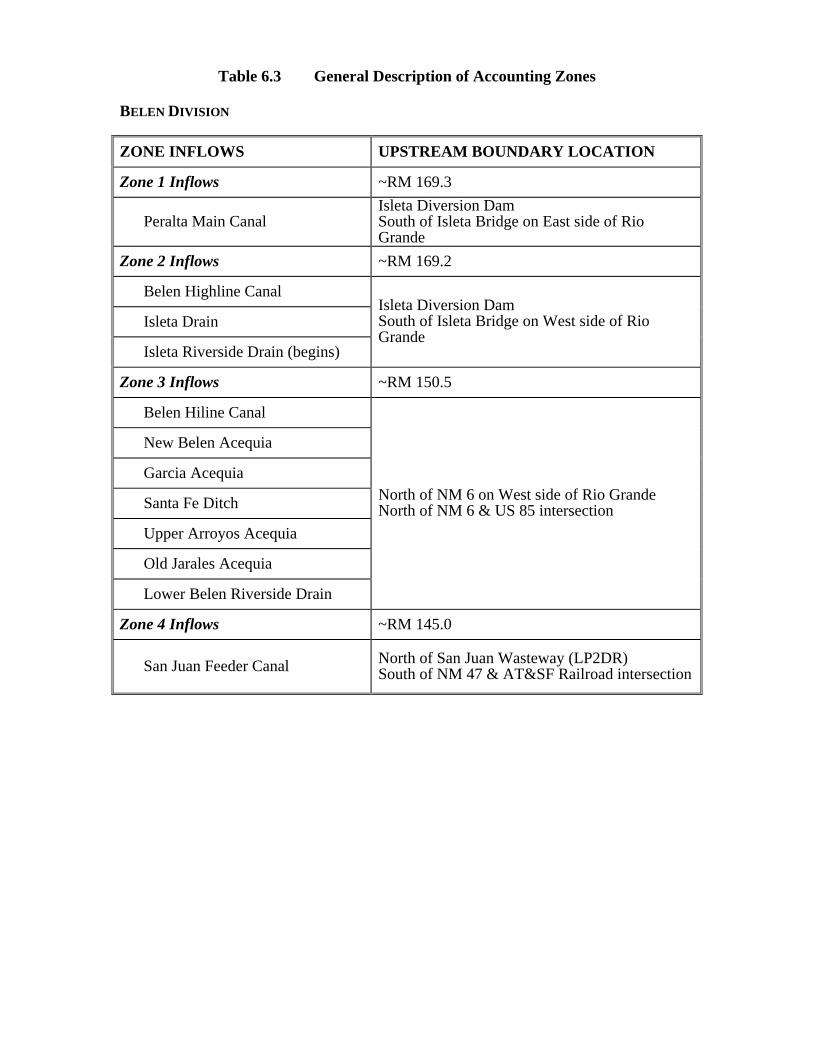
Table 6.3 General Description of Accounting Zones BELEN DIVISION
ZONE INFLOWS UPSTREAM BOUNDARY LOCATION
Zone 1 Inflows ~RM 169.3
Peralta Main Canal Isleta Diversion Dam South of Isleta Bridge on East side of Rio Grande
Zone 2 Inflows ~RM 169.2
Belen Highline Canal
Isleta Drain
Isleta Riverside Drain (begins)
Isleta Diversion Dam South of Isleta Bridge on West side of Rio Grande
Zone 3 Inflows ~RM 150.5
Belen Hiline Canal
New Belen Acequia
Garcia Acequia
Santa Fe Ditch
Upper Arroyos Acequia
Old Jarales Acequia
Lower Belen Riverside Drain
North of NM 6 on West side of Rio Grande North of NM 6 & US 85 intersection
Zone 4 Inflows ~RM 145.0
San Juan Feeder Canal North of San Juan Wasteway (LP2DR) South of NM 47 & AT&SF Railroad intersection
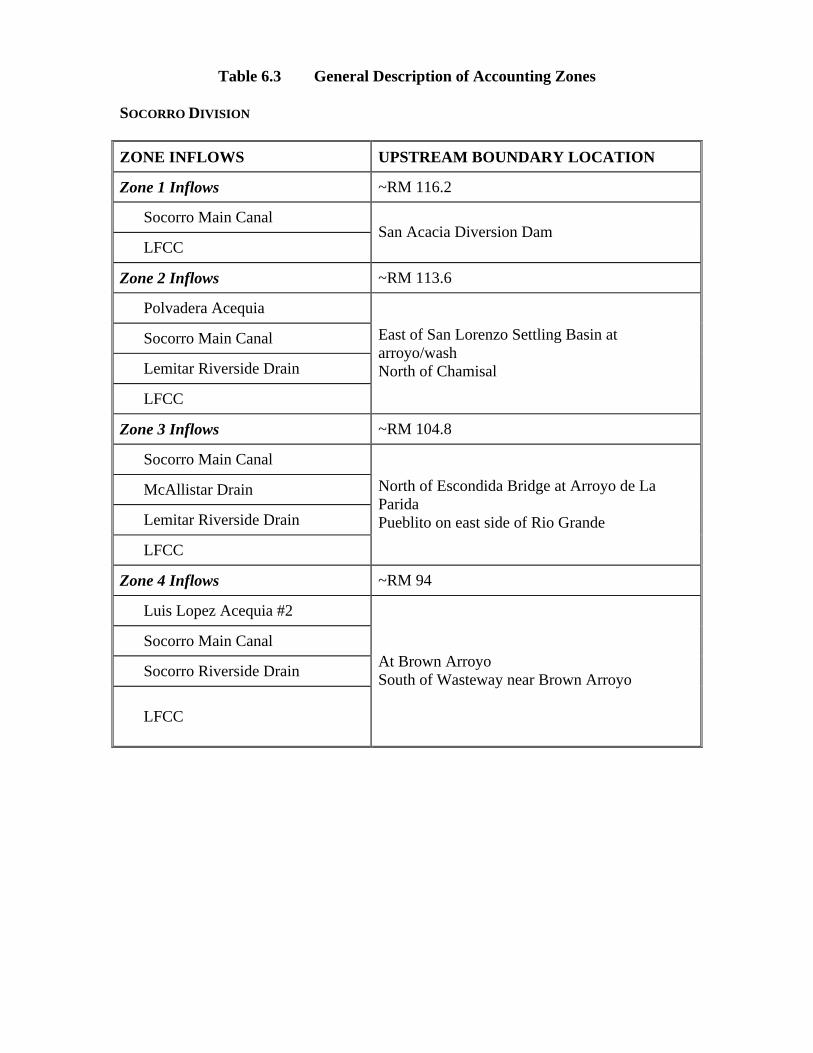
Table 6.3 General Description of Accounting Zones SOCORRO DIVISION
ZONE INFLOWS UPSTREAM BOUNDARY LOCATION
Zone 1 Inflows ~RM 116.2
Socorro Main Canal
LFCC San Acacia Diversion Dam
Zone 2 Inflows ~RM 113.6
Polvadera Acequia
Socorro Main Canal
Lemitar Riverside Drain
LFCC
East of San Lorenzo Settling Basin at arroyo/wash North of Chamisal
Zone 3 Inflows ~RM 104.8
Socorro Main Canal
McAllistar Drain
Lemitar Riverside Drain
LFCC
North of Escondida Bridge at Arroyo de La Parida Pueblito on east side of Rio Grande
Zone 4 Inflows ~RM 94
Luis Lopez Acequia #2
Socorro Main Canal
Socorro Riverside Drain
LFCC
At Brown Arroyo South of Wasteway near Brown Arroyo
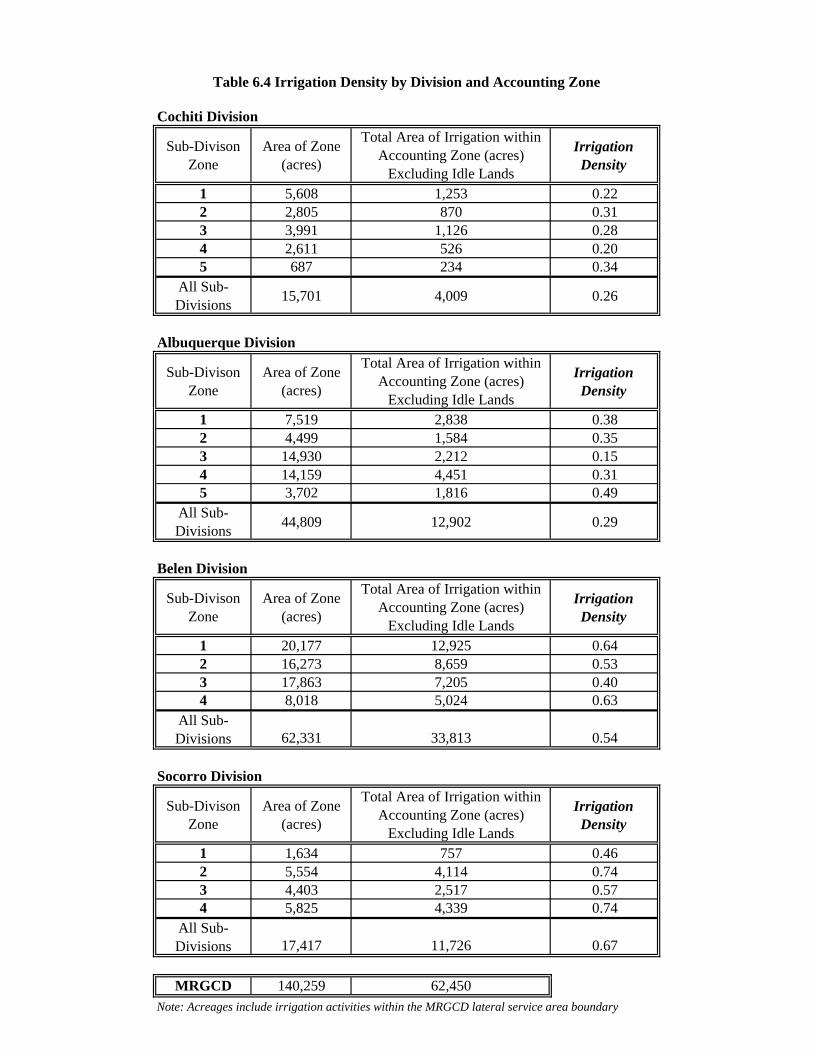
Table 6.4 Irrigation Density by Division and Accounting Zone
Cochiti Division
Sub-Divison Zone
Area of Zone (acres)
Total Area of Irrigation within Accounting Zone (acres)
Excluding Idle Lands
Irrigation Density
1 5,608 1,253 0.222 2,805 870 0.313 3,991 1,126 0.284 2,611 526 0.205 687 234 0.34
All Sub-Divisions
15,701 4,009 0.26
Albuquerque Division
Sub-Divison Zone
Area of Zone (acres)
Total Area of Irrigation within Accounting Zone (acres)
Excluding Idle Lands
Irrigation Density
1 7,519 2,838 0.382 4,499 1,584 0.353 14,930 2,212 0.154 14,159 4,451 0.315 3,702 1,816 0.49
All Sub-Divisions
44,809 12,902 0.29
Belen Division
Sub-Divison Zone
Area of Zone (acres)
Total Area of Irrigation within Accounting Zone (acres)
Excluding Idle Lands
Irrigation Density
1 20,177 12,925 0.642 16,273 8,659 0.533 17,863 7,205 0.404 8,018 5,024 0.63
All Sub-Divisions 62,331 33,813 0.54
Socorro Division
Sub-Divison Zone
Area of Zone (acres)
Total Area of Irrigation within Accounting Zone (acres)
Excluding Idle Lands
Irrigation Density
1 1,634 757 0.462 5,554 4,114 0.743 4,403 2,517 0.574 5,825 4,339 0.74
All Sub-Divisions 17,417 11,726 0.67
MRGCD 140,259 62,450Note: Acreages include irrigation activities within the MRGCD lateral service area boundary
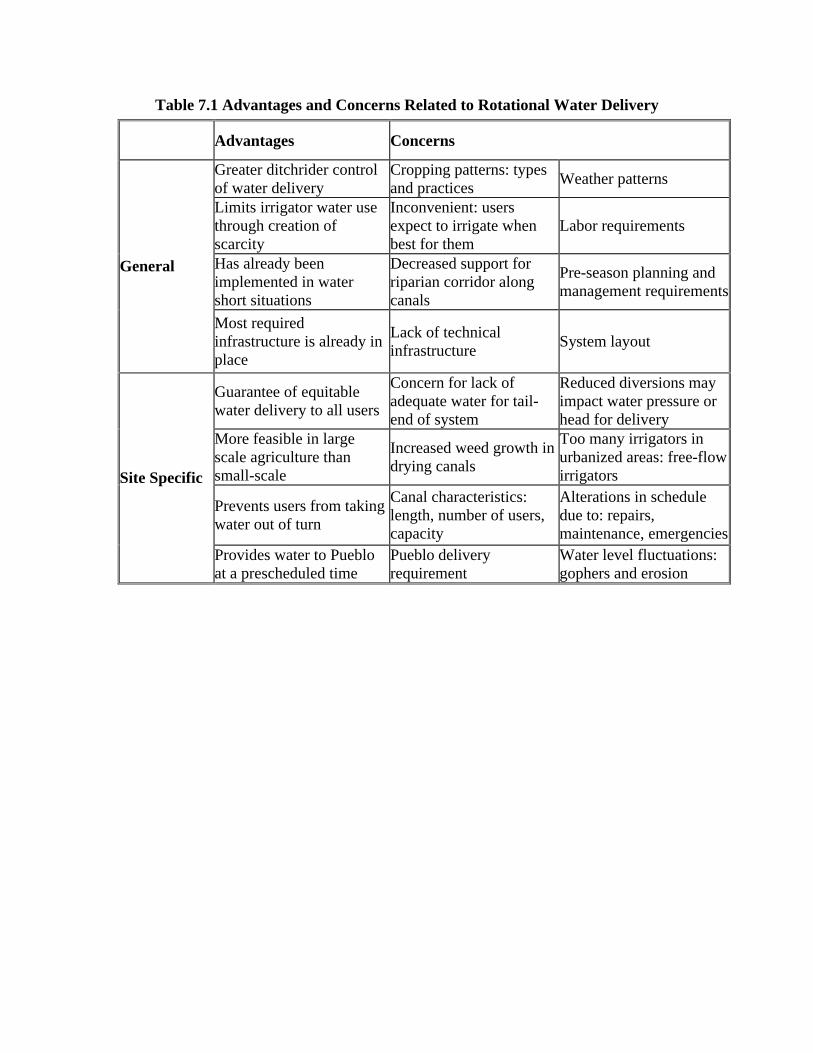
Table 7.1 Advantages and Concerns Related to Rotational Water Delivery
Advantages Concerns
Greater ditchrider control of water delivery
Cropping patterns: types and practices Weather patterns
Limits irrigator water use through creation of scarcity
Inconvenient: users expect to irrigate when best for them
Labor requirements
Has already been implemented in water short situations
Decreased support for riparian corridor along canals
Pre-season planning and management requirements
General
Most required infrastructure is already in place
Lack of technical infrastructure System layout
Guarantee of equitable water delivery to all users
Concern for lack of adequate water for tail-end of system
Reduced diversions may impact water pressure or head for delivery
More feasible in large scale agriculture than small-scale
Increased weed growth in drying canals
Too many irrigators in urbanized areas: free-flow irrigators
Prevents users from taking water out of turn
Canal characteristics: length, number of users, capacity
Alterations in schedule due to: repairs, maintenance, emergencies
Site Specific
Provides water to Pueblo at a prescheduled time
Pueblo delivery requirement
Water level fluctuations: gophers and erosion
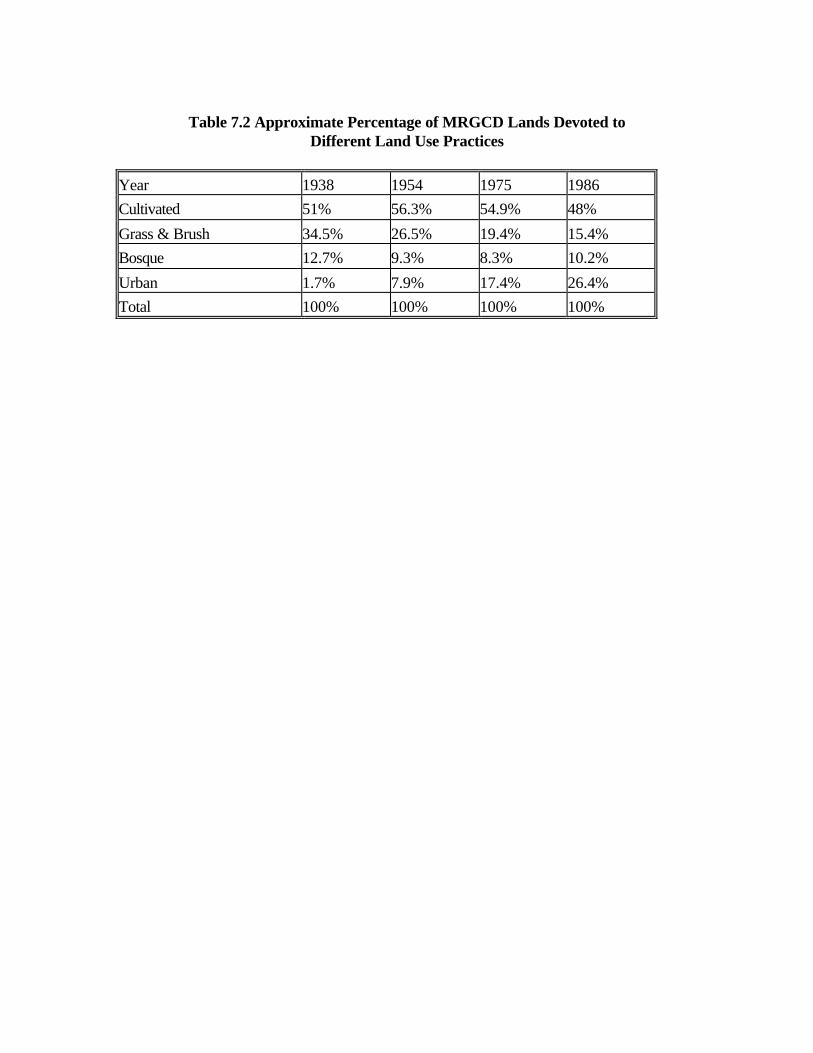
Table 7.2 Approximate Percentage of MRGCD Lands Devoted to
Different Land Use Practices
Year 1938 1954 1975 1986 Cultivated 51% 56.3% 54.9% 48%
Grass & Brush 34.5% 26.5% 19.4% 15.4% Bosque 12.7% 9.3% 8.3% 10.2%
Urban 1.7% 7.9% 17.4% 26.4% Total 100% 100% 100% 100%