Embed Size (px)
Citation preview
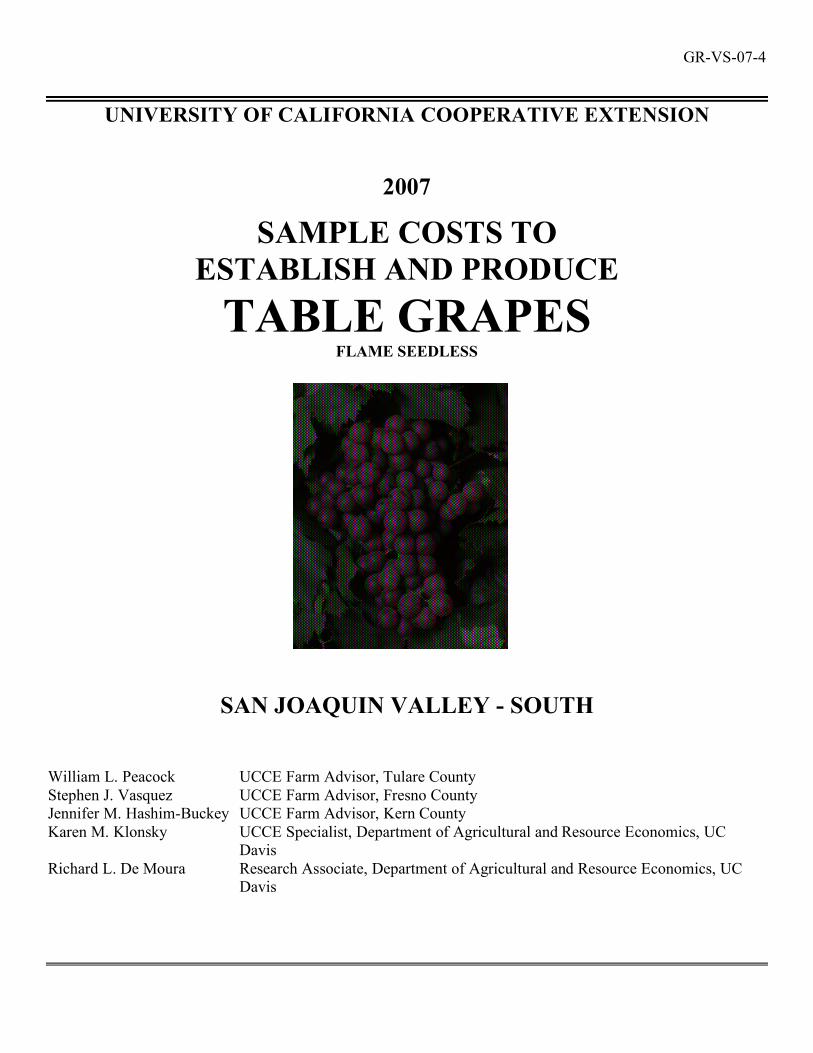
GR-VS-07-4
UNIVERSITY OF CALIFORNIA COOPERATIVE EXTENSION
2007
SAMPLE COSTS TO ESTABLISH AND PRODUCE
TABLE GRAPES FLAME SEEDLESS
SAN JOAQUIN VALLEY - SOUTH
William L. Peacock UCCE Farm Advisor, Tulare County Stephen J. Vasquez UCCE Farm Advisor, Fresno County Jennifer M. Hashim-Buckey UCCE Farm Advisor, Kern County Karen M. Klonsky UCCE Specialist, Department of Agricultural and Resource Economics, UC
Davis Richard L. De Moura Research Associate, Department of Agricultural and Resource Economics, UC
Davis
2007 Table Grapes Costs and Returns Study (Flame Seedless) San Joaquin Valley South UC Cooperative Extension 2
UC COOPERATIVE EXTENSION
SAMPLE COSTS TO ESTABLISH AND PRODUCE TABLE GRAPES Flame Seedless
San Joaquin Valley – South 2007
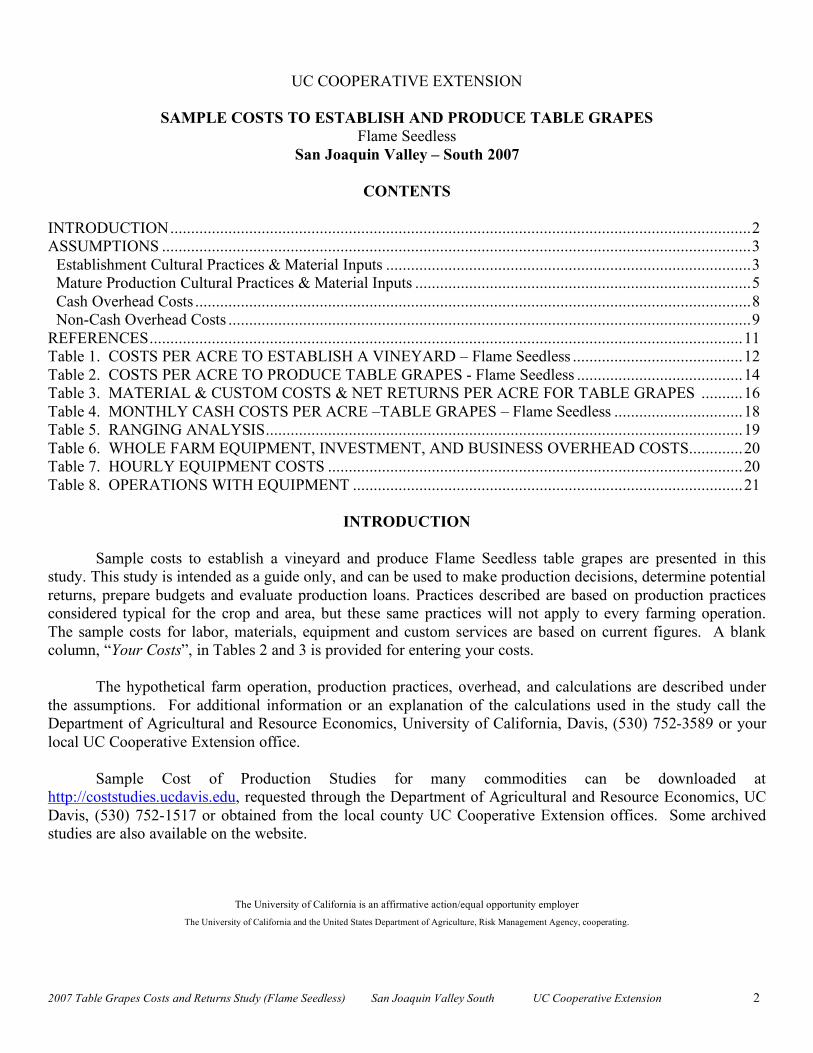
CONTENTS INTRODUCTION............................................................................................................................................2 ASSUMPTIONS ..............................................................................................................................................3 Establishment Cultural Practices & Material Inputs ........................................................................................3 Mature Production Cultural Practices & Material Inputs .................................................................................5 Cash Overhead Costs ......................................................................................................................................8 Non-Cash Overhead Costs ..............................................................................................................................9 REFERENCES...............................................................................................................................................11 Table 1. COSTS PER ACRE TO ESTABLISH A VINEYARD – Flame Seedless .........................................12 Table 2. COSTS PER ACRE TO PRODUCE TABLE GRAPES - Flame Seedless ........................................14 Table 3. MATERIAL & CUSTOM COSTS & NET RETURNS PER ACRE FOR TABLE GRAPES ..........16 Table 4. MONTHLY CASH COSTS PER ACRE –TABLE GRAPES – Flame Seedless ...............................18 Table 5. RANGING ANALYSIS...................................................................................................................19 Table 6. WHOLE FARM EQUIPMENT, INVESTMENT, AND BUSINESS OVERHEAD COSTS.............20 Table 7. HOURLY EQUIPMENT COSTS ....................................................................................................20 Table 8. OPERATIONS WITH EQUIPMENT ..............................................................................................21
INTRODUCTION
Sample costs to establish a vineyard and produce Flame Seedless table grapes are presented in this
study. This study is intended as a guide only, and can be used to make production decisions, determine potential returns, prepare budgets and evaluate production loans. Practices described are based on production practices considered typical for the crop and area, but these same practices will not apply to every farming operation. The sample costs for labor, materials, equipment and custom services are based on current figures. A blank column, “Your Costs”, in Tables 2 and 3 is provided for entering your costs.
The hypothetical farm operation, production practices, overhead, and calculations are described under
the assumptions. For additional information or an explanation of the calculations used in the study call the Department of Agricultural and Resource Economics, University of California, Davis, (530) 752-3589 or your local UC Cooperative Extension office.
Sample Cost of Production Studies for many commodities can be downloaded at
http://coststudies.ucdavis.edu, requested through the Department of Agricultural and Resource Economics, UC Davis, (530) 752-1517 or obtained from the local county UC Cooperative Extension offices. Some archived studies are also available on the website.
The University of California is an affirmative action/equal opportunity employer
The University of California and the United States Department of Agriculture, Risk Management Agency, cooperating.
2007 Table Grapes Costs and Returns Study (Flame Seedless) San Joaquin Valley South UC Cooperative Extension 3
ASSUMPTIONS
The assumptions refer to Tables 1 to 8 and pertain to sample costs to establish a vineyard and produce Flame Seedless table grapes in the San Joaquin Valley. The cultural practices shown represent production operations and materials considered typical of a well-managed vineyard in the region. Costs, materials, and practices in this study will not apply to all farms. Timing of and types of establishment and cultural practices will vary among growers within the region and from season to season due to variables such as weather, soil, and insect and disease pressure. The use of trade names and cultural practices in this report does not constitute an endorsement or recommendation by the University of California nor is any criticism implied by omission of other similar products or cultural practices.
Farm. The hypothetical farm consists of 120 contiguous acres. Vineyard establishment and Flame
Seedless table grape production is on 40 acres. Other vineyards are on 75 acres and roads, irrigation systems, and farmstead occupy five acres. The farm is owned and managed by the grower.
Establishment Cultural Practices & Material Inputs (Table 1)
Site Preparation. This vineyard is established on ground previously planted to vineyards or orchards.
Land coming from vines or trees should be fallowed for two years except for a possible grain crop. The land is assumed to be fairly level. A custom operator chisels the ground (subsoils) twice to a depth of 4-5 feet. The grower floats the land to smooth and level the surface. Afterwards the ground is disced twice to apply and incorporate preplant herbicide. Nematode samples should be taken from land formerly in vines or trees and fumigated if necessary. Most operations that prepare the vineyard for planting are done in the year prior to planting, but costs are shown in the first year.
Plant. Planting the vineyard starts by laying out and marking vine sites in early spring. Holes are dug
and vines planted and a two-inch by two-inch cardboard carton placed around the vine. In the second year, 2% or 10 vines per acre are replaced.
Vines. The Flame Seedless plants are dormant, bench-grafted rootstock vines purchased from a
commercial nursery. The grapevines are planted during the first spring on a 7-foot x 12-foot spacing (vine x row) with 518 vines per acre. Vines are trained during the first and second years to quadrilateral cordons. The grapevines will begin yielding fruit in the third year and then be productive for an additional 22 years.
Trellis System. A commercial company installs the trellis system in the second year. The trellis system
will be removed when the vineyard is removed; therefore it is considered part of the vineyard and included in the establishment costs. Materials for the open gable trellis are as follows: (1) Stakes with V structure are placed every 24-feet down the row. Metal stakes (2 lbs/ft strength) are 8.5-feet long and placed in the ground 3-feet. The open gable is 72-inches wide from tip to tip. (2) End assemblies consist of 9.5-foot metal post (4 lb/ft) with a V that matches those within the row and with 10-inch helix anchor. (3) Eight wires, 12.5 gauge high tensile, are used for canopy and cordon support; three wires, 14 gauge high tensile, are used for movable catch wires and drip hose support. For growers planting and training vines in the first year for harvest in the second year, trellis installation should be completed in the first year and the cost shown accordingly.
Train/Prune. Vines are pruned to one two bud spur in the first dormant season (December to February,
January in this study).
2007 Table Grapes Costs and Returns Study (Flame Seedless) San Joaquin Valley South UC Cooperative Extension 4
Train. The following spring (second year), a single shoot is selected and trained up the stake to form the permanent structure of the vine. Training consists of tying the shoot; removing lateral shoots from the base and tipping the shoot when it reaches desired cordon height. Most of the training costs occur during the second summer. The third summer is devoted to training missing vines or vines delayed in growth.
Prune. In the third year (January), vines are pruned much like an established vine. The exception is that
in the third year the cordons are essentially canes; therefore, short spurs or no spurs are left at node positions. With mature vines 6 two bud spurs are retained on each of the four cordons. Prunings are placed in the row middles and shredded. Selecting and tying canes to fruiting wires is required each year for the life of the vineyard. Suckers from vine trunks are removed in April, a practice that continues each year but diminishes as the vineyard matures.
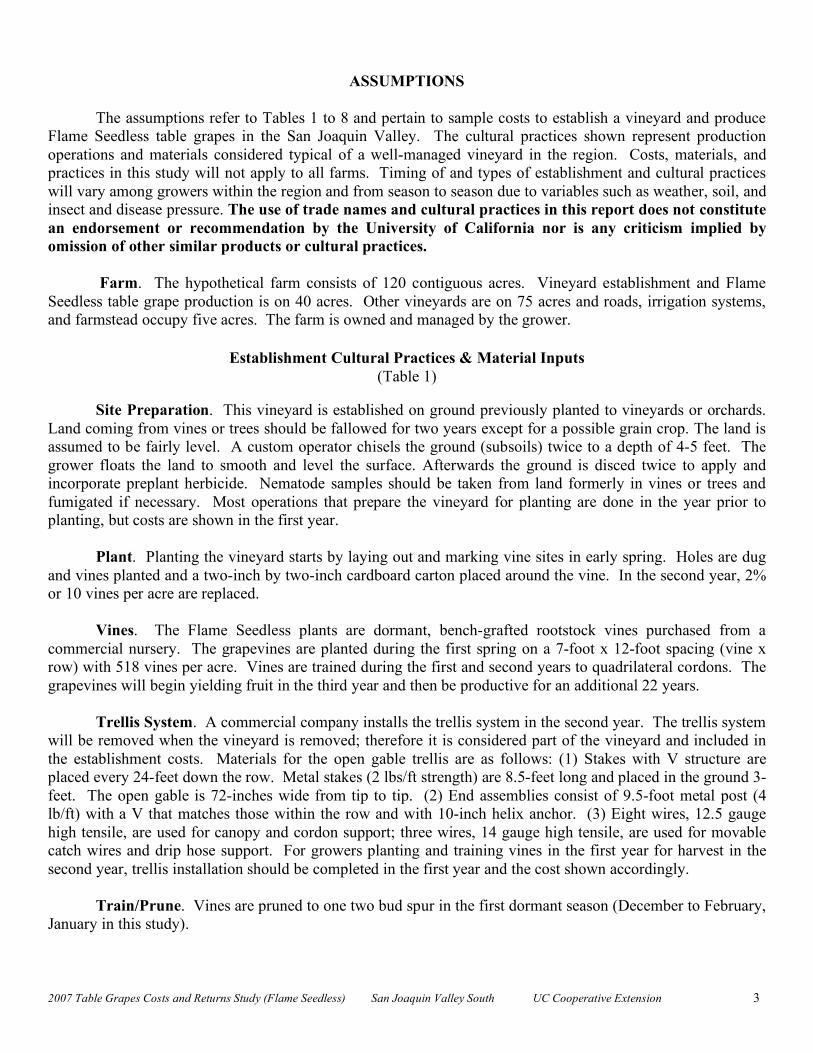
Irrigate. Water pumping costs plus labor constitute the irrigation cost. In this
study, water is calculated to cost $4.59 per acre-inch or $55.08 per acre-foot. The pumping cost is based on a 40 horsepower (HP) motor to pump from 130 feet deep. The vineyard is irrigated during the growing season from April through October during the establishment years. Price per acre-foot of water will vary by grower in this region depending on quantity used, water district, power cost, various well characteristics, and other irrigation factors. The amount of water applied to the vineyard varies through the establishment years and is shown in Table A.
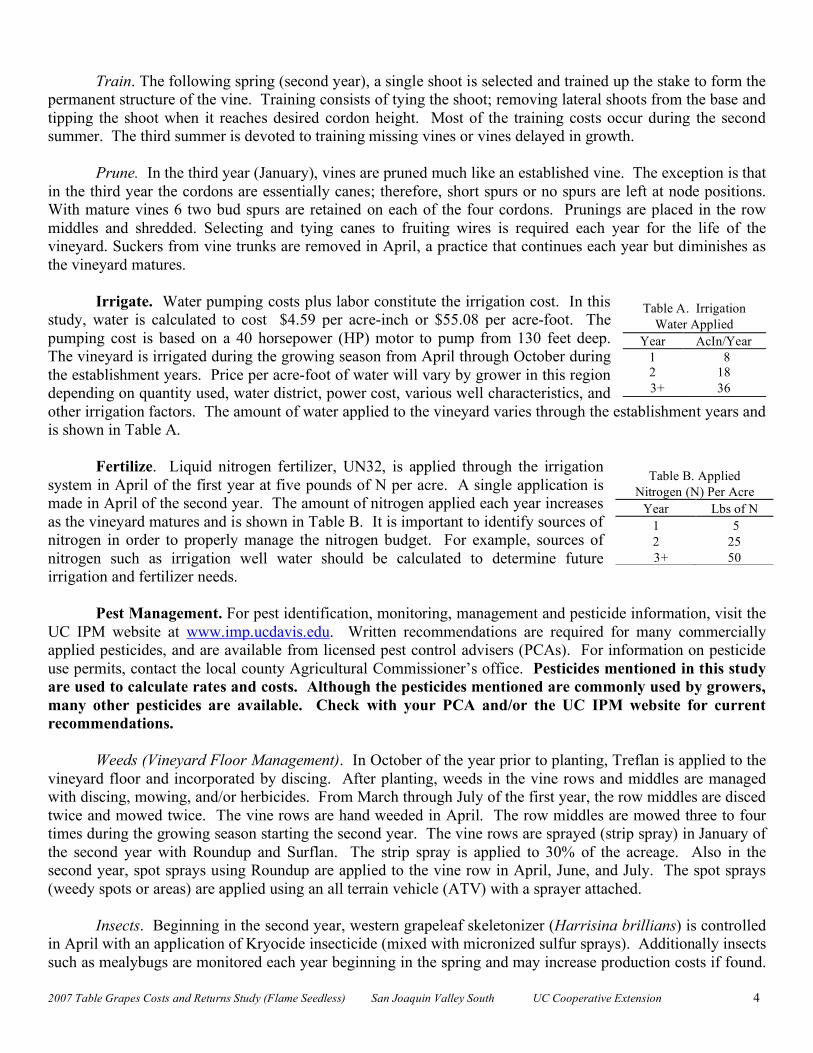
Fertilize. Liquid nitrogen fertilizer, UN32, is applied through the irrigation
system in April of the first year at five pounds of N per acre. A single application is made in April of the second year. The amount of nitrogen applied each year increases as the vineyard matures and is shown in Table B. It is important to identify sources of nitrogen in order to properly manage the nitrogen budget. For example, sources of nitrogen such as irrigation well water should be calculated to determine future irrigation and fertilizer needs.
Pest Management. For pest identification, monitoring, management and pesticide information, visit the
UC IPM website at www.imp.ucdavis.edu. Written recommendations are required for many commercially applied pesticides, and are available from licensed pest control advisers (PCAs). For information on pesticide use permits, contact the local county Agricultural Commissioner’s office. Pesticides mentioned in this study are used to calculate rates and costs. Although the pesticides mentioned are commonly used by growers, many other pesticides are available. Check with your PCA and/or the UC IPM website for current recommendations.
Weeds (Vineyard Floor Management). In October of the year prior to planting, Treflan is applied to the
vineyard floor and incorporated by discing. After planting, weeds in the vine rows and middles are managed with discing, mowing, and/or herbicides. From March through July of the first year, the row middles are disced twice and mowed twice. The vine rows are hand weeded in April. The row middles are mowed three to four times during the growing season starting the second year. The vine rows are sprayed (strip spray) in January of the second year with Roundup and Surflan. The strip spray is applied to 30% of the acreage. Also in the second year, spot sprays using Roundup are applied to the vine row in April, June, and July. The spot sprays (weedy spots or areas) are applied using an all terrain vehicle (ATV) with a sprayer attached.
Insects. Beginning in the second year, western grapeleaf skeletonizer (Harrisina brillians) is controlled
in April with an application of Kryocide insecticide (mixed with micronized sulfur sprays). Additionally insects such as mealybugs are monitored each year beginning in the spring and may increase production costs if found.
Table A. Irrigation Water Applied
Year AcIn/Year 1 8 2 18
3+ 36
Table B. Applied Nitrogen (N) Per Acre
Year Lbs of N 1 5 2 25
3+ 50

2007 Table Grapes Costs and Returns Study (Flame Seedless) San Joaquin Valley South UC Cooperative Extension 5
If mealybugs (Pseudococcus sp.) are found during vineyard establishment, the grower should consult with a PCA, farm advisor, and/or ag commissioner to develop management strategies.
Diseases. Although many pathogens attack grapevines, phomopsis cane and leafspot (Phomopsis
viticola) and powdery mildew (Erisphe necator) are the two diseases managed in this study. In April of the second and third years, Microthiol plus Abound (strobilurin) are applied for phomopsis and mildew control. Mildew is controlled with various fungicide applications at 7 to 21 day intervals in the third year, depending on the fungicide used. For this study, the grower applies Kocide (copper), Rubigan (SI) mixture, and two Microthiol applications (one with Kryocide) in April; one Rubigan (SI) application and two dusting sulfur applications in May; one Rubigan (SI) application and two dusting sulfur applications in June. Growers have the option of using sulfur (dust, wettable, flowable or micronized), sterol inhibitors (SIs), or strobilurins, as well as other fungicides to control powdery mildew. Sterol inhibitors and strobilurins are two classes of fungicides with different modes of action than sulfur against powdery mildew. It is recommended that fungicides with different modes of action be used to avoid powdery mildew populations from developing fungicide resistance. Vertebrate. Rabbits, gophers, squirrels and coyotes are pests that can cause damage to the vines and irrigation lines. Various forms of control such as baiting, trapping and/or building a rabbit fence are utilized as necessary throughout the year. For this study no specific control is used, but an estimated cost for one or two management practices are shown in March. Endangered Species: It is important to know if your vineyard is located in an area where endangered species reside (i.e. San Joaquin Kit Fox). Trapping and killing endangered species can result in fines. Contact your County Agricultural Commissioner for additional information.
Harvest/Yield/Returns. Growers sometimes plant and train vines in the same year, which produces a
harvestable Flame Seedless table grape crop in the second year. Yields in the third year are approximately 50 to 75% of mature production. For this study, 400 boxes (19 pounds per box) of table grapes are assumed in the third year. If the crop in the third year is harvested for wine, a labor contractor may be needed.
Mature Production Cultural Practices and Material Inputs
(Tables 2-8)
Prune/Sucker/Canopy Management (CM). The quad-cordon trained vines are spur-pruned during the winter months (January) and the prunings are placed in the row middles and shredded. Suckers and sterile shoots are removed from the vine trunks and crowns in early April. Shoot thinning, shoot positioning and basil leaf removal are done by hand in April. Mechanical cane cutting (canopy skirting) is done in June with the grower’s equipment.
Fruit Management (FM). Gibberellic acid (GA), a growth regulator, is applied at 6 grams per acre
during bloom in May for blossom thinning (combined with mildew spray). GA is applied two times at 48 grams per acre for each application to increase berry size. The first application is applied at completion of shatter, about two weeks after full bloom (June) (combined with mildew spray) and the second spray is applied a week later (combined with mildew and insect spray). Gibberellic acid rates should be reduced for berry sizing when color development has been a historical problem. Vines are girdled to increase berry size 2 to 3 weeks after full bloom (June). Cluster tipping and hand thinning are done in late May to early June to loosen clusters and adjust cluster length and crop load. The growth regulator, Ethrel, is applied in late June to color the fruit.
2007 Table Grapes Costs and Returns Study (Flame Seedless) San Joaquin Valley South UC Cooperative Extension 6
Trellis/Vines. Trellis repairs are done annually (January in this study) and the cost is not taken from any specific data. Weak or missing vines are replaced by layering which is usually not an issue until the vineyard is over 10 years old. One year-old canes from neighboring vines are buried (layered) in the soil next to the stake. These vines are trained the following spring. The layer is severed after 3 to 4 years when the new vine is fully established. Trellis repair and vine replacement increases with vineyard age.
Irrigate. The vineyard is irrigated during the growing season from April through October. Deficit
irrigation (80% ET) may be applied post harvest to promote vine growth and vine maturity. Deficit irrigation may also be applied three to four weeks before harvest to advance maturity and decrease decay. Deficit irrigation may not work well on weak or low vigor vineyards. Water pumping costs plus labor constitute the irrigation cost. In this study, water is calculated to cost $4.59 per acre-inch or $55.08 per acre-foot. The pumping cost is based on a 40 horsepower (HP) motor to pump from 130 feet depth and pressurized to 20 psi. A total of 36 acre-inches is applied to the vineyard. Price per acre-foot of water will vary by grower in this region depending on quantity used, water district, power cost, various well characteristics, and other irrigation factors.
Fertilize. Nitrogen (N) at 50 pounds per acre as UN32 is applied through the irrigation drip system in
April or post harvest. Neutral zinc is applied to prevent zinc deficiencies and is combined with the late April mildew (Microthiol, Rally) application.
Pest Management. The pesticides and rates mentioned in this cost study are listed in UC Integrated
Pest Management Guidelines, Grapes. For information on other pesticides available, pest identification, monitoring, and management visit the UC IPM website at www.ipm.ucdavis.edu. For information and pesticide use permits, contact the local county agricultural commissioner's office. Pesticides mentioned in this study are used to calculate rates and costs. Although the pesticides mentioned are commonly used by growers, many other pesticides are available. Check with your PCA and/or the UC IPM website for current recommendations. Adjuvants are recommended for use with many pesticides for effective control, but the adjuvants and their costs are not included in this study. Pesticide costs may vary by location, brand, and grower volume. Pesticide costs in this study are taken from a single dealer and shown as full retail.
Pest Control Adviser (PCA). Written recommendations are required for many commercially applied
pesticides and are written by licensed pest control advisers. In addition the PCA will monitor the field for agronomic problems including pests, diseases, and nutritional status. Growers may hire private PCA’s or receive the service as part of a service agreement with an agricultural chemical and fertilizer company. Costs for a PCA are not included in this study.
Weeds (Vineyard Floor Management). Vineyard middles are mowed three times each season: March,
May, July. Surflan and Roundup herbicides are applied to the vine row/berm in February. Roundup, a contact herbicide, is applied as a spot spray to the vine row in June.
Insects. Mealybugs (Pseudococcus sp.) are treated with Lorsban insecticide in March (dormant vines).
Western grapeleaf skeletonizer (Harrisina brillians) is treated with Kryocide (mixed with Microthiol, Flint) during the first bloom spray in May. Grape leafhoppers (Erythroneura elegantula) are controlled with Provado insecticide (mixed with GA, Microthiol, Rally) during the second berry sizing spray in June. An effective alternative material for mealybugs is to apply Admire insecticide through the drip system, but at a higher cost than a Lorsban application. If mealybugs are found, they should be identified in order to determine if additional management strategies will be needed.
2007 Table Grapes Costs and Returns Study (Flame Seedless) San Joaquin Valley South UC Cooperative Extension 7
Diseases. Diseases treated in this study are phomopsis cane and leafspot (Phomopsis viticola) and powdery mildew (Ersiphe necator). Phomopsis and powdery mildew are both treated in late March (shoot length averages 2-inches) with Abound and Microthiol (micronized sulfur). Mildew is controlled during the season with various fungicide applications at 7 to 21 day intervals, depending on the fungicide used. In this study, sulfur dust is applied three times - April, June, July. Microthiol and Rally, an SI, (with zinc) are applied in late April. Microthiol and Flint (with Kryocide) are applied with the first bloom spray in May. Microthiol (with GA) is applied at the second bloom spray in May. Rally and Microthiol (with GA) are applied during the first berry sizing in June and Microthiol and Rally (with GA, Provado) during the second berry size spray in June. Growers have the option of using sterol inhibitors (SI), quinolins, strobilurins, or sulfur (micronized, wettable, dust, flowable), as well as other fungicides to control powdery mildew. These materials are classes of fungicides with different modes of action. Check the IPM website under grapes for management options to control powdery mildew. It is recommended that applicators use fungicides with different modes of action in order to avoid fungicide resistance in powdery mildew populations. Vertebrate. Gophers, squirrels coyotes and birds are pests that can cause damage to the vines and irrigation lines. Various forms of control such as baiting, trapping and/or shooting are utilized as necessary throughout the year. For this study no specific control is used, but per acre costs are shown from March through October and are an estimate not based on any specific data. Endangered Species: It is important to know if your vineyard is located in an area where endangered species reside (i.e. San Joaquin Kit Fox). Trapping and killing endangered species can result in fines. Contact your County Agricultural Commissioner for additional information.
Harvest. The crop is picked beginning in July or August and
packed in the field. Harvest crews work in teams of three or four. Depending on crop quality, the team can pick and pack an average of 3 to 6 boxes per hour per individual. For this study, we use four packed boxes per hour per individual. Two or three pickers field pick and trim the grapes, and put them in reusable field boxes. Approximately four field boxes are loaded on a wheelbarrow type cart and delivered to the packing person who trims, puts them in bags that are then placed in shipping boxes. The box holds 9 bags and weighs 19 pounds when filled. The packed boxes are loaded on a truck and hauled to storage. The swamp and haul cost includes the boxes, plastic bags, hauling and related labor. Pre cooling and palletization (P&P) costs may in some cases be a grower cost but are generally charged to the buyer. After 30 days of cold storage, the grower is charged approximately $0.35 per box per month ($0.25-0.45) until the fruit is sold. Brokerage fees are paid by the grower and range from 7 to 10% of the selling price. A figure of 9% of the selling price is used in this study.
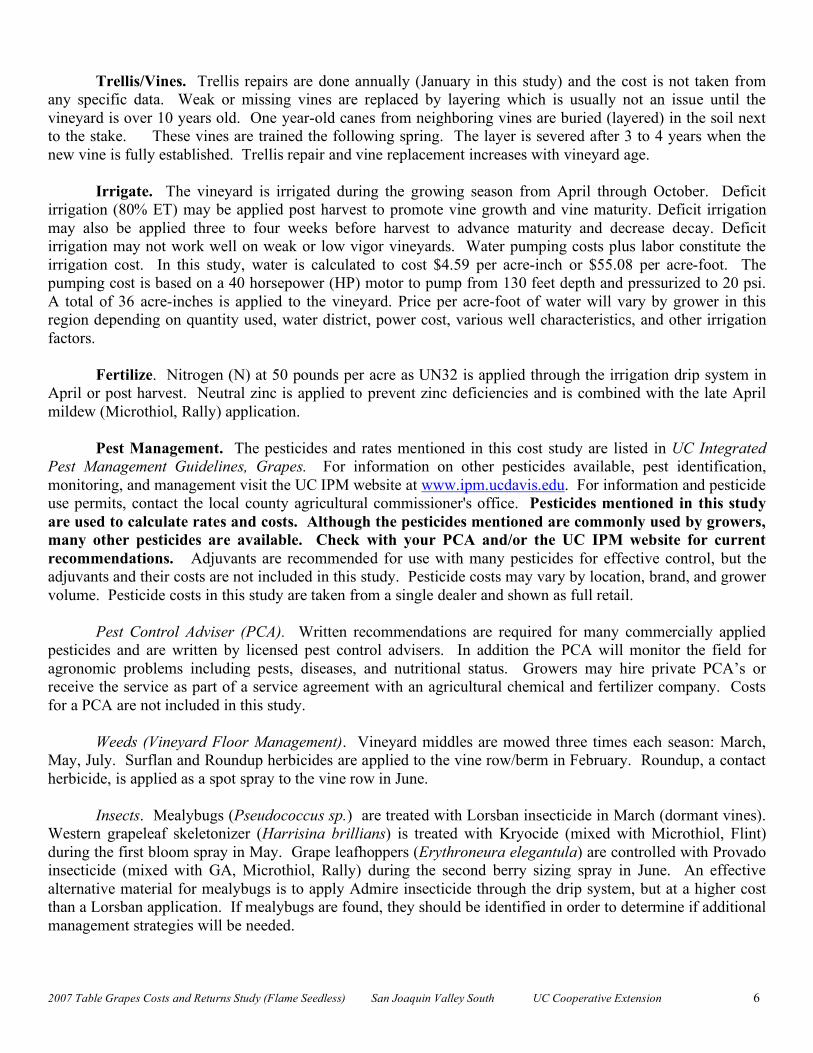
Yields. This study uses an average yield of 700, 19-pound boxes over the productive life of the vineyard
to calculate returns. Average county yields for all table grape varieties are shown in Table C. The averages include all vineyards in production regardless of maturity and varieties.
Returns. Return prices for grapes at different yields and prices are shown in Table 5. Based on grower
information, an estimated price of $12 per box for Flame grapes is used in this study. Assessments/Inspection. The California Table Grape Commission (CTGC) assesses $0.1156 per 19-
pound box or $0.006087 per pound. Early in the season, growers often have the county Agricultural Commissioner inspect their fruit for maturity at a cost of $0.035 per box. Approximately one-third of the entire crop is inspected to determine that maturity requirements are met, which includes soluble solids:acid ratios (20:1) and color.
Table C: Table Grapes (all varieties) Average Yields
Year Tons/Acre (boxes) 2002 8.13 (856) 2003 7.60 (800) 2004 7.76 (815) 2005 11.34 (1,194) 2006 9.66 (1,016)
Source: Fresno County Crop Reports, 2002-2006. Boxes = 19 lbs.
2007 Table Grapes Costs and Returns Study (Flame Seedless) San Joaquin Valley South UC Cooperative Extension 8
Pickup/ATV. It is assumed that the grower uses the pickup for business and personal use. Estimated
business mileage for the ranch is 5,250 miles. The all terrain vehicle (ATV) is used for spot spraying weeds and is included in that cost. It is assumed that the ATV will be used two hours per acre for checking the vineyards including the irrigation system.
Labor. Hourly wages for workers are $11.00 for machine operators and $8.50 per hour non-machine
labor. Adding 33% for the employer’s share of federal and state payroll taxes, workers compensation insurance for vine crops (0040) and other possible benefits gives the labor rates shown of $14.63 and $11.31 per hour for machine labor and non-machine labor, respectively. Workers’ compensation costs will vary among growers, but for this study the cost is based upon the average industry final rate as of January 1, 2007 (personal email from California Department of Insurance, May 18, 2007, unreferenced). Labor for operations involving machinery are 20% higher than the operation time given in Table 2 to account for the extra labor involved in equipment set up, moving, maintenance, work breaks, and field repair.
Equipment Operating Costs. Repair costs are based on purchase price, annual hours of use, total
hours of life, and repair coefficients formulated by the American Society of Agriculture Engineers (ASAE). Fuel and lubrication costs are also determined by ASAE equations based on maximum PTO horsepower, and fuel type. . Prices for on-farm delivery of diesel and gasoline are $2.30 and $2.80 per gallon, respectively. Fuel costs are derived from American Automobile Association (AAA) and Energy Information Administration 2006 monthly data. The cost includes a 2.25% sales tax (effective September 2001) on diesel fuel and 7.25% sales tax on gasoline. Gasoline also includes federal and state excise tax, which can be refunded for on-farm use when filing your income tax. The fuel, lube, and repair cost per acre for each operation in Table 2 is determined by multiplying the total hourly operating cost in Table 7 for each piece of equipment used for the selected operation by the hours per acre. Tractor time is 10% higher than implement time for a given operation to account for setup, travel and down time.
Interest on Operating Capital. Interest on operating capital is based on cash operating costs and is calculated monthly until harvest at a nominal rate of 10.00% per year. A nominal interest rate is the typical market cost of borrowed funds. The interest cost of post harvest operations is discounted back to the last harvest month using a negative interest charge. The rate will vary depending upon various factors, but the rate in this study is considered a typical lending rate by a farm lending agency as of January 2007.
Risk. The risks associated with crop production should not be minimized. While this study makes
every effort to model a production system based on typical, real world practices, it cannot fully represent financial, agronomic and market risks, which affect profitability and economic viability. Growers may purchase Federal crop insurance to reduce the production risk associated with specific natural hazards. Insurance policies vary and range from a basic catastrophic loss policy to one that insures losses for up to 75% of a crop. Insurance costs will depend on the type and level of coverage.
Cash Overhead
Cash overhead consists of various cash expenses paid out during the year that are assigned to the whole
farm and not to a particular operation. Property Taxes. Counties charge a base property tax rate of 1% on the assessed value of the property.
In some counties special assessment districts exist and charge additional taxes on property including equipment, buildings, and improvements. For this study, county taxes are calculated as 1% of the average value of the property. Average value equals new cost plus salvage value divided by 2 on a per acre basis.
2007 Table Grapes Costs and Returns Study (Flame Seedless) San Joaquin Valley South UC Cooperative Extension 9
Insurance. Insurance for farm investments varies depending on the assets included and the amount of
coverage. Property insurance provides coverage for property loss and is charged at 0.714% of the average value of the assets over their useful life. Liability insurance covers accidents on the farm and costs $674 for the entire farm.
Office Expense. Office and business expenses are estimated at $80 per producing acre or $9,200
annually for the ranch. These expenses include office supplies, telephones, bookkeeping, accounting, legal fees, road maintenance, etc.
Sanitation Services. Sanitation services provide double portable toilets with washbasins for 10 months.
The cost includes delivery and weekly cleaning service. The number of sanitation facilities will vary depending upon local regulations and size of labor force. In many cases labor contractors furnish the sanitation facilities for their crews and the costs are included in the contractor’s labor overhead.
Management/Supervisor Wages. Salary is not included. Returns above costs are considered a return
to management Investment Repairs. Annual maintenance is calculated as 2% of the purchase price.
Non-Cash Overhead Costs
Non-cash overhead is calculated as the capital recovery cost for equipment and other farm investments. Capital Recovery Costs. Capital recovery cost is the annual depreciation and interest costs for a capital
investment. It is the amount of money required each year to recover the difference between the purchase price and salvage value (unrecovered capital). It is equivalent to the annual payment on a loan for the investment with the down payment equal to the discounted salvage value. This is a more complex method of calculating ownership costs than straight-line depreciation and opportunity costs, but more accurately represents the annual costs of ownership because it takes the time value of money into account (Boehlje and Eidman). The formula for the calculation of the annual capital recovery costs is ((Purchase Price – Salvage Value) x Capital Recovery Factor) + (Salvage Value x Interest Rate).
Salvage Value. Salvage value is an estimate of the remaining value of an investment at the end of its
useful life. For farm machinery (tractors and implements) the remaining value is a percentage of the new cost of the investment (Boehlje and Eidman). The percent remaining value is calculated from equations developed by the American Society of Agricultural Engineers (ASAE) based on equipment type and years of life. The life in years is estimated by dividing the wear out life, as given by ASAE by the annual hours of use in this operation. For other investments including irrigation systems, buildings, and miscellaneous equipment, the value at the end of its useful life is zero. The salvage value for land is the purchase price because land does not depreciate. The purchase price and salvage value for equipment and investments are shown in Table 6.
Capital Recovery Factor. Capital recovery factor is the amortization factor or annual payment whose
present value at compound interest is 1. The amortization factor is a table value that corresponds to the interest rate used and the life of the machine.
Interest Rate. An interest rate of 7.25% is used to calculate capital recovery. The rate will vary
depending upon loan amount and other lending agency conditions, but is the basic suggested rate by a farm lending agency as of January 2007.
2007 Table Grapes Costs and Returns Study (Flame Seedless) San Joaquin Valley South UC Cooperative Extension 10
Land. The land was formerly a vineyard, but has been out of production for two years. The open land
was planted to grain crops. Land in the San Joaquin Valley with table grape production ranges from $6,000 to $13,400 per acre (depending on vineyard age, variety and location). Cropland with district or well water in the area ranges from $2,500 to $12,000. For this study, the land value was established based on 2007 real estate values (2007 Trends & Leases); therefore a cost of $7,000 per acre or $7,304 per producing acre is used.
Tools. This is an assumed value for shop, hand, and miscellaneous field tools and not based on any
grower’s tool inventory. Fuel Tanks. Two 300-gallon fuel tanks using gravity feed are on metal stands. The tanks are setup in a
cement containment pad that meets federal, state, and county regulations. Drip Irrigation System. The drip lines, filters, booster pump and the labor to install the components
are included in the irrigation system cost. The previous vineyard is assumed to have a pumping system that had been refurbished and therefore is not included as a cost. Water is delivered from a 130-foot depth using a 40-horsepower pump. The drip irrigation lines are laid directly on the ground prior to planting and the labor cost is included in the drip irrigation system cost.
Establishment Cost. The establishment cost is the sum of the costs for land preparation, trellis system,
planting, vines, cash overhead and production expenses for growing the vines through the third year, the first year that grapes are harvested. It is used to determine the non-cash overhead expense, capital recovery cost, during the production years. In this study, no crop was produced in the second year; therefore, the Total Accumulated Net Cash Cost on Table 1, in the third year represents the establishment cost. For this study the cost is $7,207 per acre or $288,280 for the 40 producing acres. The establishment cost is spread over the remaining 22 years of the 25 years the vineyard is in production.
Equipment. Farm equipment is purchased new or used, but the study shows the current purchase price
for new equipment. The new purchase price is adjusted to 60% to indicate a mix of new and used equipment. Annual ownership costs for equipment and other investments are shown in Table 6. Equipment costs are composed of three parts: non-cash overhead, cash overhead, and operating costs. Both of the overhead factors have been discussed in previous sections. The operating costs consist of repairs, fuel, and lubrication and are discussed under operating costs.
Table Values. Due to rounding, the totals may be slightly different from the sum of the
components.
2007 Table Grapes Costs and Returns Study (Flame Seedless) San Joaquin Valley South UC Cooperative Extension 11
REFERENCES
Agriculture Commissioner. 2002 – 2006. Crop Reports. Fresno County Ag Commissioner, Fresno, CA. American Society of Agricultural Engineers. (ASAE). 1994. American Society of Agricultural Engineers
Standards Yearbook. St. Joseph, Missouri. Boehlje, Michael D., and Vernon R. Eidman. 1984. Farm Management. John Wiley and Sons. New York, New
York California Chapter of the American Society of Farm Managers and Rural Appraisers. 2007. Trends in
Agricultural Land and Lease Values. California Chapter of the American Society of Farm Managers and Rural Appraisers, Inc. Woodbridge, CA.
California State Automobile Association. 2007. Gas Price Survey 2006. AAA Public Affairs, San Francisco,
CA. California State Board of equalization. Fuel Tax Division Tax Rates. Internet accessed January 2007.
http://www.boe.ca.gov/sptaxprog/spftdrates.htm Christensen, Pete. Training Table Grape Vineyards. 1998. University of California Cooperative Extension,
Tulare, CA. Pub. #TB 11-98. Doanes. 1984. Facts and Figures for Farmers. 1984. Doane Publishing, St. Louis, MO. Energy Information Administration. 2006. Weekly Retail on Highway Diesel Prices. Internet accessed January
2007. http://tonto.eix.doe.gov/oog/info/wohdp Jensen, Frederick L., William L. Peacock. Thompson Seedless. 1998. University of California Cooperative
Extension, Tulare, CA. Pub # TB7-97. Leavitt, George M., William L. Peacock, Stephen J. Vasquez, Jennifer M. Hashim, , Nick K. Dokoozlian, Karen
L. Klonsky, Donald G. Katayama, and Richard L. De Moura. 2004. Sample Costs to Establish and Produce Table Grapes, Flame Seedless, San Joaquin Valley. University of California Cooperative Extension and the Department of Agricultural and Resource Economics. Davis, CA.
University of California Statewide Integrated Pest Management Program. UC Pest Management Guidelines,
Grapes. 2006. University of California, Davis, CA. http://www.ipm.ucdavis.edu For information concerning the above or other University of California publications, contact your local county UC Cooperative Extension office or UC DANR Communications Services online at http://ucanr.org .
2007 Table Grapes Costs and Returns Study (Flame Seedless) San Joaquin Valley South UC Cooperative Extension 12
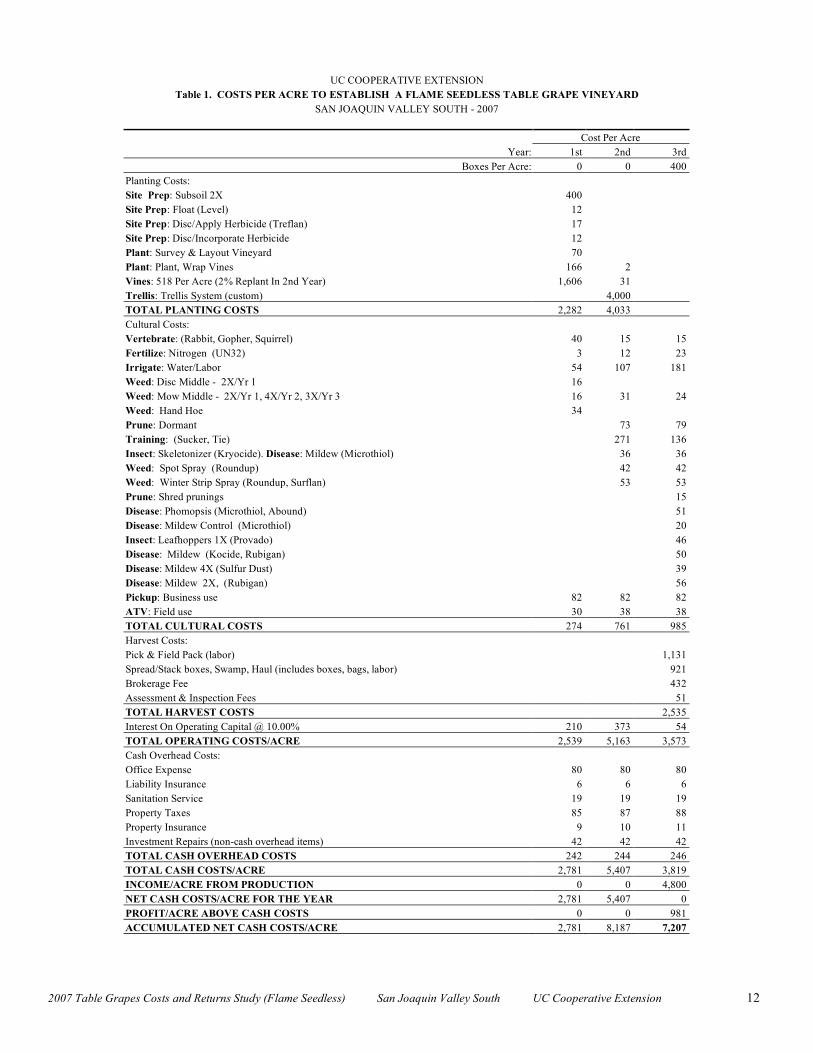
UC COOPERATIVE EXTENSION Table 1. COSTS PER ACRE TO ESTABLISH A FLAME SEEDLESS TABLE GRAPE VINEYARD
SAN JOAQUIN VALLEY SOUTH - 2007 Cost Per Acre
Year: 1st 2nd 3rd Boxes Per Acre: 0 0 400
Planting Costs: Site Prep: Subsoil 2X 400 Site Prep: Float (Level) 12 Site Prep: Disc/Apply Herbicide (Treflan) 17 Site Prep: Disc/Incorporate Herbicide 12 Plant: Survey & Layout Vineyard 70 Plant: Plant, Wrap Vines 166 2 Vines: 518 Per Acre (2% Replant In 2nd Year) 1,606 31 Trellis: Trellis System (custom) 4,000 TOTAL PLANTING COSTS 2,282 4,033 Cultural Costs: Vertebrate: (Rabbit, Gopher, Squirrel) 40 15 15 Fertilize: Nitrogen (UN32) 3 12 23 Irrigate: Water/Labor 54 107 181 Weed: Disc Middle - 2X/Yr 1 16 Weed: Mow Middle - 2X/Yr 1, 4X/Yr 2, 3X/Yr 3 16 31 24 Weed: Hand Hoe 34 Prune: Dormant 73 79 Training: (Sucker, Tie) 271 136 Insect: Skeletonizer (Kryocide). Disease: Mildew (Microthiol) 36 36 Weed: Spot Spray (Roundup) 42 42 Weed: Winter Strip Spray (Roundup, Surflan) 53 53 Prune: Shred prunings 15 Disease: Phomopsis (Microthiol, Abound) 51 Disease: Mildew Control (Microthiol) 20 Insect: Leafhoppers 1X (Provado) 46 Disease: Mildew (Kocide, Rubigan) 50 Disease: Mildew 4X (Sulfur Dust) 39 Disease: Mildew 2X, (Rubigan) 56 Pickup: Business use 82 82 82 ATV: Field use 30 38 38 TOTAL CULTURAL COSTS 274 761 985 Harvest Costs: Pick & Field Pack (labor) 1,131 Spread/Stack boxes, Swamp, Haul (includes boxes, bags, labor) 921 Brokerage Fee 432 Assessment & Inspection Fees 51 TOTAL HARVEST COSTS 2,535 Interest On Operating Capital @ 10.00% 210 373 54 TOTAL OPERATING COSTS/ACRE 2,539 5,163 3,573 Cash Overhead Costs: Office Expense 80 80 80 Liability Insurance 6 6 6 Sanitation Service 19 19 19 Property Taxes 85 87 88 Property Insurance 9 10 11 Investment Repairs (non-cash overhead items) 42 42 42 TOTAL CASH OVERHEAD COSTS 242 244 246 TOTAL CASH COSTS/ACRE 2,781 5,407 3,819 INCOME/ACRE FROM PRODUCTION 0 0 4,800 NET CASH COSTS/ACRE FOR THE YEAR 2,781 5,407 0 PROFIT/ACRE ABOVE CASH COSTS 0 0 981 ACCUMULATED NET CASH COSTS/ACRE 2,781 8,187 7,207
2007 Table Grapes Costs and Returns Study (Flame Seedless) San Joaquin Valley South UC Cooperative Extension 13
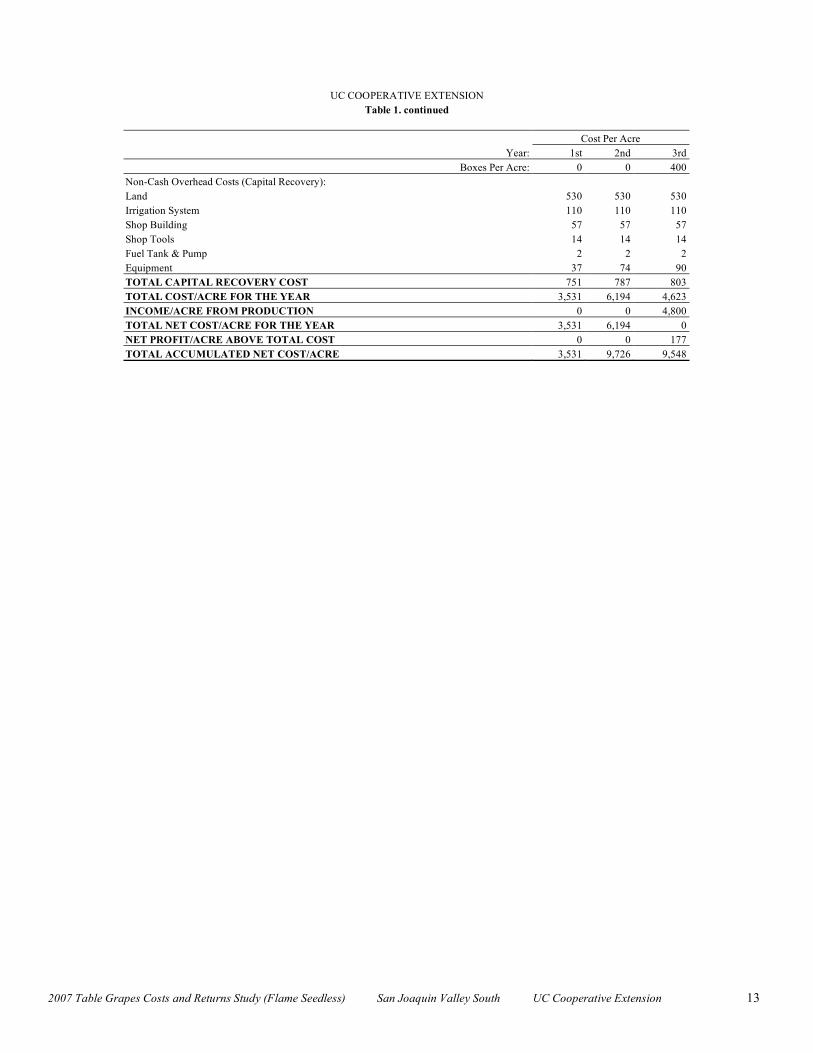
UC COOPERATIVE EXTENSION
Table 1. continued Cost Per Acre
Year: 1st 2nd 3rd Boxes Per Acre: 0 0 400
Non-Cash Overhead Costs (Capital Recovery): Land 530 530 530 Irrigation System 110 110 110 Shop Building 57 57 57 Shop Tools 14 14 14 Fuel Tank & Pump 2 2 2 Equipment 37 74 90 TOTAL CAPITAL RECOVERY COST 751 787 803 TOTAL COST/ACRE FOR THE YEAR 3,531 6,194 4,623 INCOME/ACRE FROM PRODUCTION 0 0 4,800 TOTAL NET COST/ACRE FOR THE YEAR 3,531 6,194 0 NET PROFIT/ACRE ABOVE TOTAL COST 0 0 177 TOTAL ACCUMULATED NET COST/ACRE 3,531 9,726 9,548
2007 Table Grapes Costs and Returns Study (Flame Seedless) San Joaquin Valley South UC Cooperative Extension 14
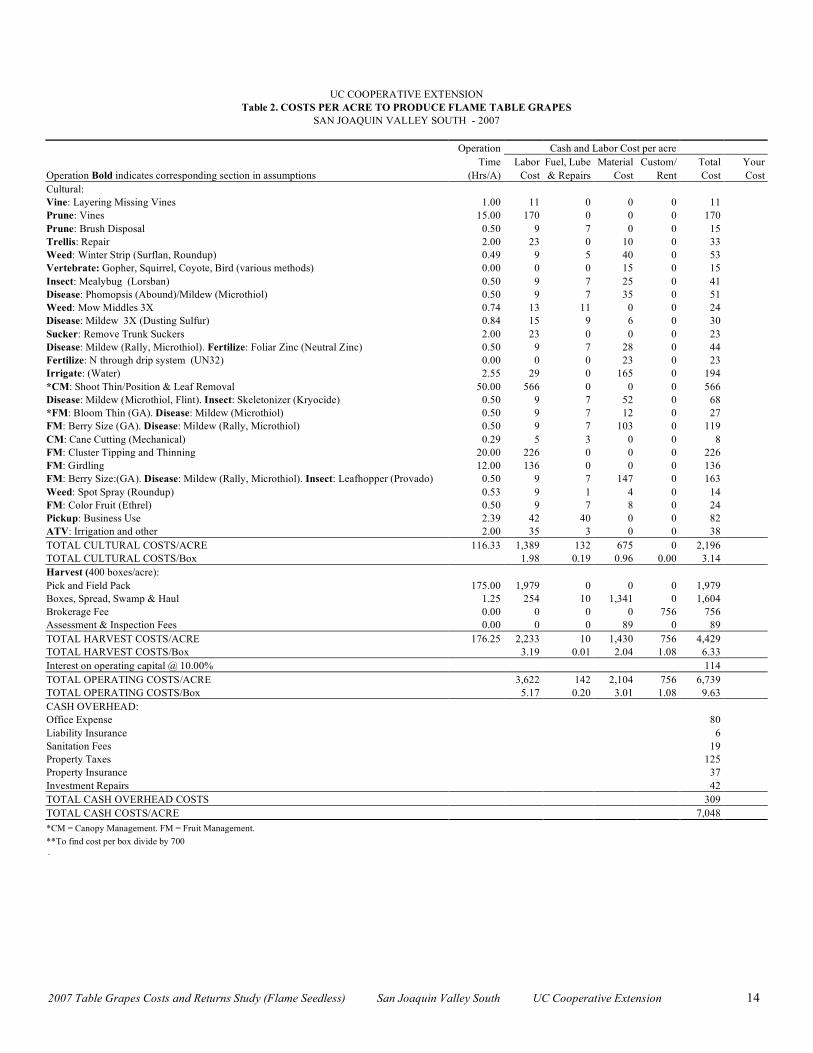
UC COOPERATIVE EXTENSION
Table 2. COSTS PER ACRE TO PRODUCE FLAME TABLE GRAPES SAN JOAQUIN VALLEY SOUTH - 2007
Operation Cash and Labor Cost per acre Time Labor Fuel, Lube Material Custom/ Total Your Operation Bold indicates corresponding section in assumptions (Hrs/A) Cost & Repairs Cost Rent Cost Cost Cultural: Vine: Layering Missing Vines 1.00 11 0 0 0 11 Prune: Vines 15.00 170 0 0 0 170 Prune: Brush Disposal 0.50 9 7 0 0 15 Trellis: Repair 2.00 23 0 10 0 33 Weed: Winter Strip (Surflan, Roundup) 0.49 9 5 40 0 53 Vertebrate: Gopher, Squirrel, Coyote, Bird (various methods) 0.00 0 0 15 0 15 Insect: Mealybug (Lorsban) 0.50 9 7 25 0 41 Disease: Phomopsis (Abound)/Mildew (Microthiol) 0.50 9 7 35 0 51 Weed: Mow Middles 3X 0.74 13 11 0 0 24 Disease: Mildew 3X (Dusting Sulfur) 0.84 15 9 6 0 30 Sucker: Remove Trunk Suckers 2.00 23 0 0 0 23 Disease: Mildew (Rally, Microthiol). Fertilize: Foliar Zinc (Neutral Zinc) 0.50 9 7 28 0 44 Fertilize: N through drip system (UN32) 0.00 0 0 23 0 23 Irrigate: (Water) 2.55 29 0 165 0 194 *CM: Shoot Thin/Position & Leaf Removal 50.00 566 0 0 0 566 Disease: Mildew (Microthiol, Flint). Insect: Skeletonizer (Kryocide) 0.50 9 7 52 0 68 *FM: Bloom Thin (GA). Disease: Mildew (Microthiol) 0.50 9 7 12 0 27 FM: Berry Size (GA). Disease: Mildew (Rally, Microthiol) 0.50 9 7 103 0 119 CM: Cane Cutting (Mechanical) 0.29 5 3 0 0 8 FM: Cluster Tipping and Thinning 20.00 226 0 0 0 226 FM: Girdling 12.00 136 0 0 0 136 FM: Berry Size:(GA). Disease: Mildew (Rally, Microthiol). Insect: Leafhopper (Provado) 0.50 9 7 147 0 163 Weed: Spot Spray (Roundup) 0.53 9 1 4 0 14 FM: Color Fruit (Ethrel) 0.50 9 7 8 0 24 Pickup: Business Use 2.39 42 40 0 0 82 ATV: Irrigation and other 2.00 35 3 0 0 38 TOTAL CULTURAL COSTS/ACRE 116.33 1,389 132 675 0 2,196 TOTAL CULTURAL COSTS/Box 1.98 0.19 0.96 0.00 3.14 Harvest (400 boxes/acre): Pick and Field Pack 175.00 1,979 0 0 0 1,979 Boxes, Spread, Swamp & Haul 1.25 254 10 1,341 0 1,604 Brokerage Fee 0.00 0 0 0 756 756 Assessment & Inspection Fees 0.00 0 0 89 0 89 TOTAL HARVEST COSTS/ACRE 176.25 2,233 10 1,430 756 4,429 TOTAL HARVEST COSTS/Box 3.19 0.01 2.04 1.08 6.33 Interest on operating capital @ 10.00% 114 TOTAL OPERATING COSTS/ACRE 3,622 142 2,104 756 6,739 TOTAL OPERATING COSTS/Box 5.17 0.20 3.01 1.08 9.63 CASH OVERHEAD: Office Expense 80 Liability Insurance 6 Sanitation Fees 19 Property Taxes 125 Property Insurance 37 Investment Repairs 42 TOTAL CASH OVERHEAD COSTS 309 TOTAL CASH COSTS/ACRE 7,048 *CM = Canopy Management. FM = Fruit Management. **To find cost per box divide by 700 .
2007 Table Grapes Costs and Returns Study (Flame Seedless) San Joaquin Valley South UC Cooperative Extension 15
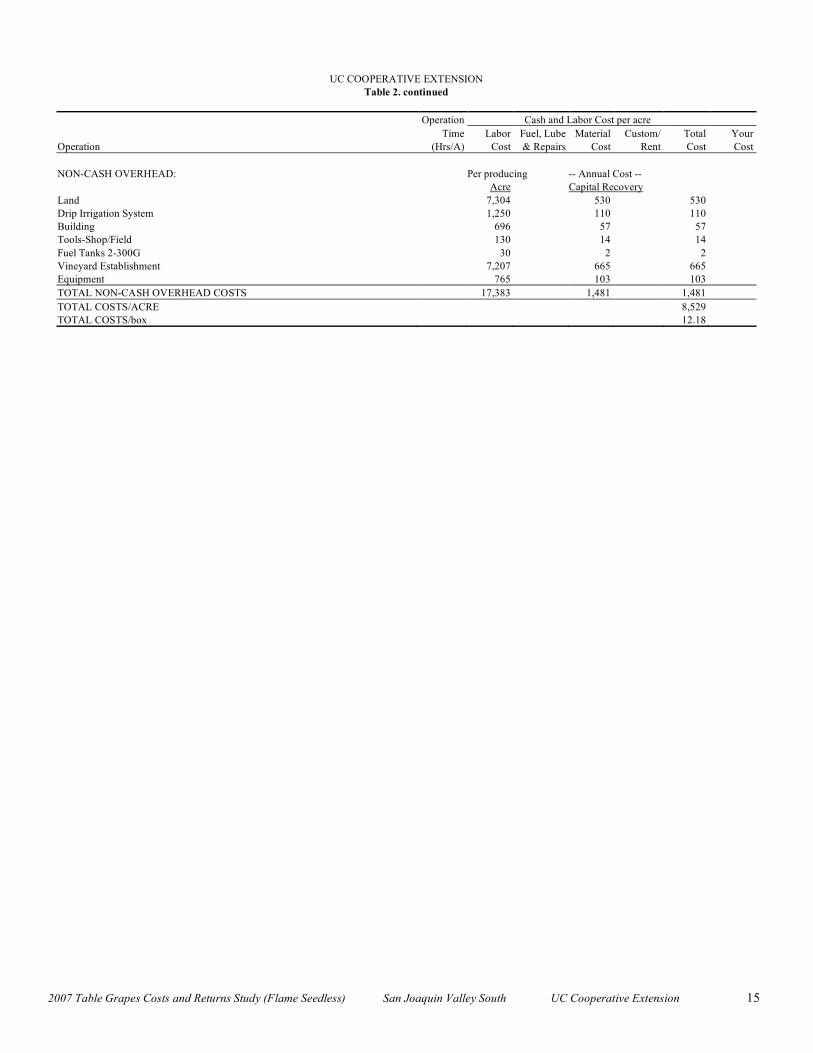
UC COOPERATIVE EXTENSION Table 2. continued
Operation Cash and Labor Cost per acre Time Labor Fuel, Lube Material Custom/ Total Your Operation (Hrs/A) Cost & Repairs Cost Rent Cost Cost NON-CASH OVERHEAD: Per producing -- Annual Cost -- Acre Capital Recovery Land 7,304 530 530 Drip Irrigation System 1,250 110 110 Building 696 57 57 Tools-Shop/Field 130 14 14 Fuel Tanks 2-300G 30 2 2 Vineyard Establishment 7,207 665 665 Equipment 765 103 103 TOTAL NON-CASH OVERHEAD COSTS 17,383 1,481 1,481 TOTAL COSTS/ACRE 8,529 TOTAL COSTS/box 12.18
2007 Table Grapes Costs and Returns Study (Flame Seedless) San Joaquin Valley South UC Cooperative Extension 16
UC COOPERATIVE EXTENSION
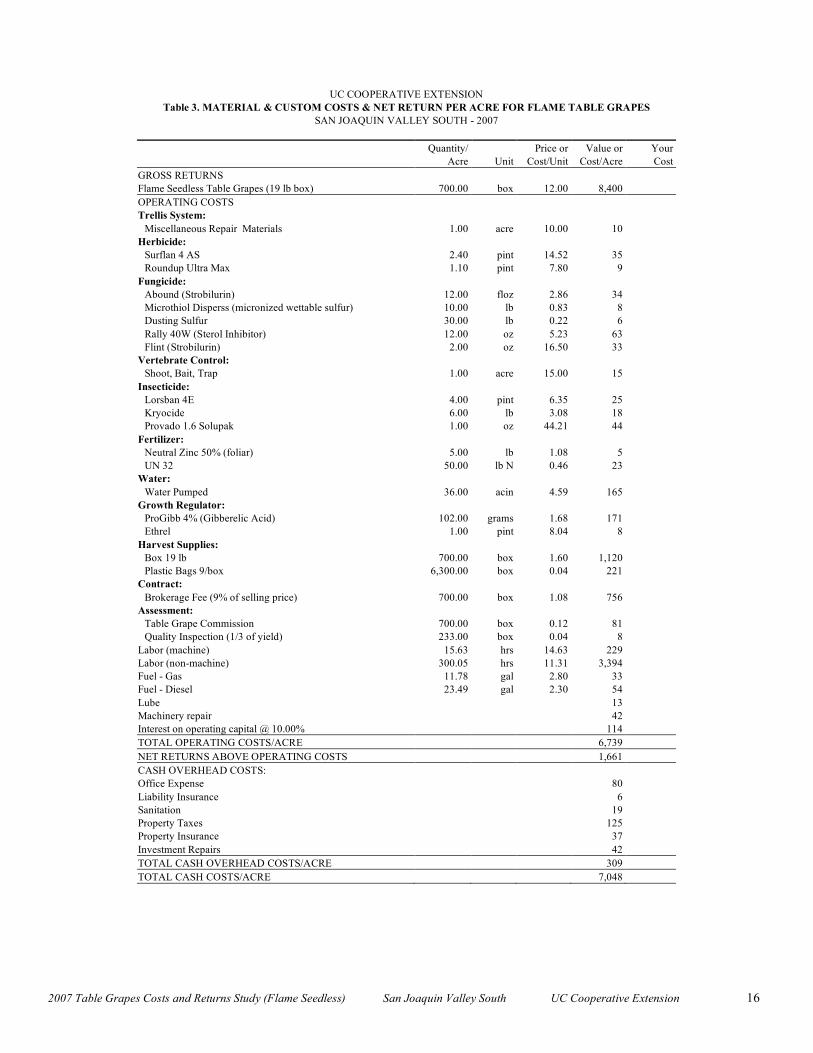
Table 3. MATERIAL & CUSTOM COSTS & NET RETURN PER ACRE FOR FLAME TABLE GRAPES SAN JOAQUIN VALLEY SOUTH - 2007
Quantity/ Price or Value or Your Acre Unit Cost/Unit Cost/Acre Cost GROSS RETURNS Flame Seedless Table Grapes (19 lb box) 700.00 box 12.00 8,400 OPERATING COSTS Trellis System:
Miscellaneous Repair Materials 1.00 acre 10.00 10 Herbicide:
Surflan 4 AS 2.40 pint 14.52 35 Roundup Ultra Max 1.10 pint 7.80 9
Fungicide: Abound (Strobilurin) 12.00 floz 2.86 34 Microthiol Disperss (micronized wettable sulfur) 10.00 lb 0.83 8 Dusting Sulfur 30.00 lb 0.22 6 Rally 40W (Sterol Inhibitor) 12.00 oz 5.23 63 Flint (Strobilurin) 2.00 oz 16.50 33
Vertebrate Control: Shoot, Bait, Trap 1.00 acre 15.00 15
Insecticide: Lorsban 4E 4.00 pint 6.35 25 Kryocide 6.00 lb 3.08 18 Provado 1.6 Solupak 1.00 oz 44.21 44
Fertilizer: Neutral Zinc 50% (foliar) 5.00 lb 1.08 5 UN 32 50.00 lb N 0.46 23
Water: Water Pumped 36.00 acin 4.59 165
Growth Regulator: ProGibb 4% (Gibberelic Acid) 102.00 grams 1.68 171 Ethrel 1.00 pint 8.04 8
Harvest Supplies: Box 19 lb 700.00 box 1.60 1,120 Plastic Bags 9/box 6,300.00 box 0.04 221
Contract: Brokerage Fee (9% of selling price) 700.00 box 1.08 756
Assessment: Table Grape Commission 700.00 box 0.12 81 Quality Inspection (1/3 of yield) 233.00 box 0.04 8
Labor (machine) 15.63 hrs 14.63 229 Labor (non-machine) 300.05 hrs 11.31 3,394 Fuel - Gas 11.78 gal 2.80 33 Fuel - Diesel 23.49 gal 2.30 54 Lube 13 Machinery repair 42 Interest on operating capital @ 10.00% 114 TOTAL OPERATING COSTS/ACRE 6,739 NET RETURNS ABOVE OPERATING COSTS 1,661 CASH OVERHEAD COSTS: Office Expense 80 Liability Insurance 6 Sanitation 19 Property Taxes 125 Property Insurance 37 Investment Repairs 42 TOTAL CASH OVERHEAD COSTS/ACRE 309 TOTAL CASH COSTS/ACRE 7,048
2007 Table Grapes Costs and Returns Study (Flame Seedless) San Joaquin Valley South UC Cooperative Extension 17
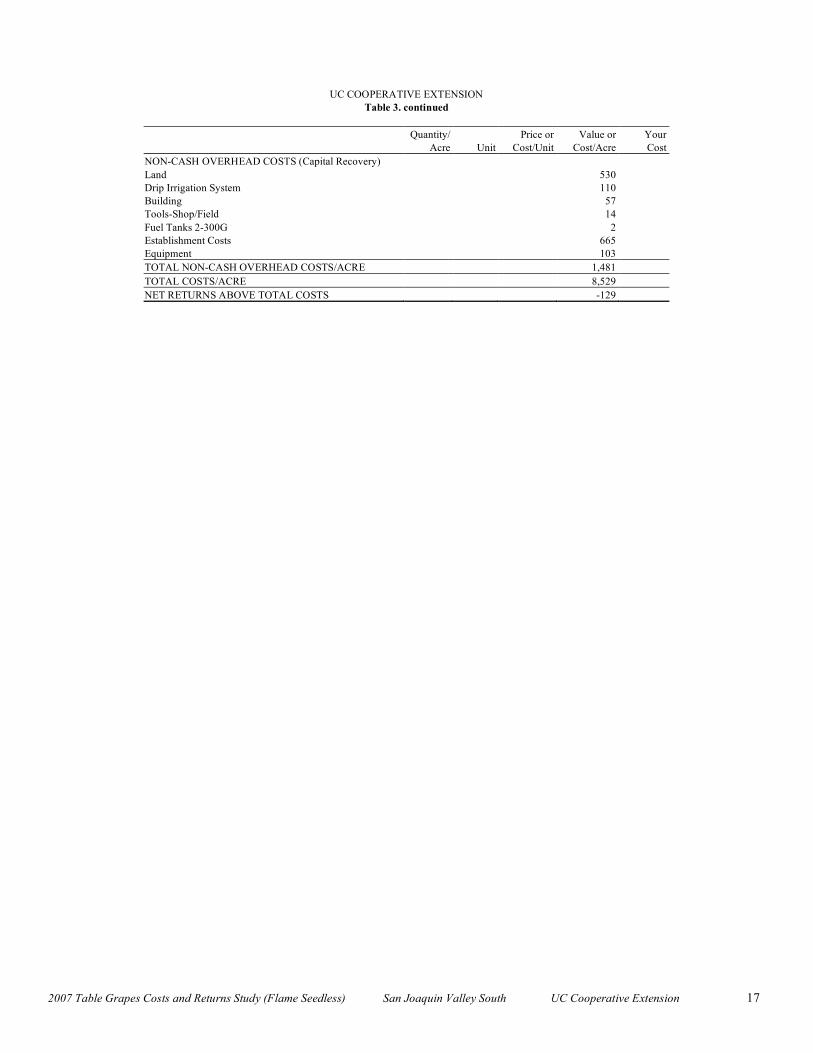
UC COOPERATIVE EXTENSION
Table 3. continued Quantity/ Price or Value or Your Acre Unit Cost/Unit Cost/Acre Cost NON-CASH OVERHEAD COSTS (Capital Recovery) Land 530 Drip Irrigation System 110 Building 57 Tools-Shop/Field 14 Fuel Tanks 2-300G 2 Establishment Costs 665 Equipment 103 TOTAL NON-CASH OVERHEAD COSTS/ACRE 1,481 TOTAL COSTS/ACRE 8,529 NET RETURNS ABOVE TOTAL COSTS -129
2007 Table Grapes Costs and Returns Study (Flame Seedless) San Joaquin Valley South UC Cooperative Extension 18
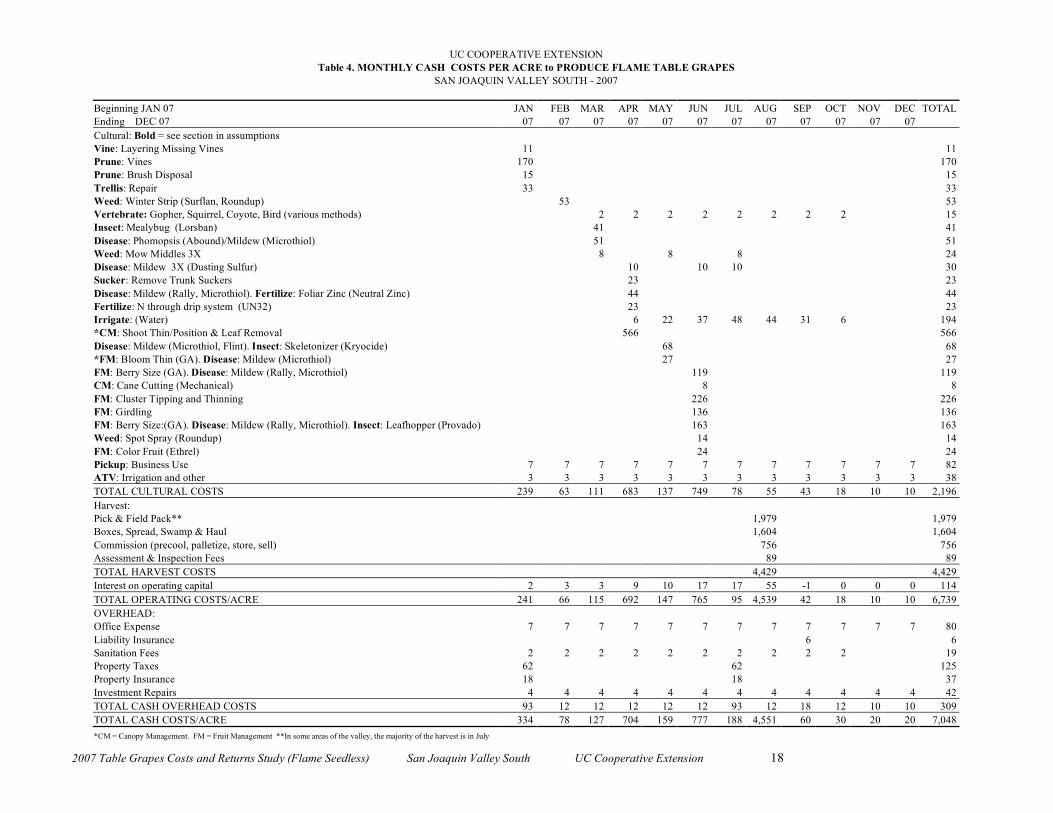
UC COOPERATIVE EXTENSION Table 4. MONTHLY CASH COSTS PER ACRE to PRODUCE FLAME TABLE GRAPES
SAN JOAQUIN VALLEY SOUTH - 2007 Beginning JAN 07 JAN FEB MAR APR MAY JUN JUL AUG SEP OCT NOV DEC TOTAL Ending DEC 07 07 07 07 07 07 07 07 07 07 07 07 07 Cultural: Bold = see section in assumptions Vine: Layering Missing Vines 11 11 Prune: Vines 170 170 Prune: Brush Disposal 15 15 Trellis: Repair 33 33 Weed: Winter Strip (Surflan, Roundup) 53 53 Vertebrate: Gopher, Squirrel, Coyote, Bird (various methods) 2 2 2 2 2 2 2 2 15 Insect: Mealybug (Lorsban) 41 41 Disease: Phomopsis (Abound)/Mildew (Microthiol) 51 51 Weed: Mow Middles 3X 8 8 8 24 Disease: Mildew 3X (Dusting Sulfur) 10 10 10 30 Sucker: Remove Trunk Suckers 23 23 Disease: Mildew (Rally, Microthiol). Fertilize: Foliar Zinc (Neutral Zinc) 44 44 Fertilize: N through drip system (UN32) 23 23 Irrigate: (Water) 6 22 37 48 44 31 6 194 *CM: Shoot Thin/Position & Leaf Removal 566 566 Disease: Mildew (Microthiol, Flint). Insect: Skeletonizer (Kryocide) 68 68 *FM: Bloom Thin (GA). Disease: Mildew (Microthiol) 27 27 FM: Berry Size (GA). Disease: Mildew (Rally, Microthiol) 119 119 CM: Cane Cutting (Mechanical) 8 8 FM: Cluster Tipping and Thinning 226 226 FM: Girdling 136 136 FM: Berry Size:(GA). Disease: Mildew (Rally, Microthiol). Insect: Leafhopper (Provado) 163 163 Weed: Spot Spray (Roundup) 14 14 FM: Color Fruit (Ethrel) 24 24 Pickup: Business Use 7 7 7 7 7 7 7 7 7 7 7 7 82 ATV: Irrigation and other 3 3 3 3 3 3 3 3 3 3 3 3 38 TOTAL CULTURAL COSTS 239 63 111 683 137 749 78 55 43 18 10 10 2,196 Harvest: Pick & Field Pack** 1,979 1,979 Boxes, Spread, Swamp & Haul 1,604 1,604 Commission (precool, palletize, store, sell) 756 756 Assessment & Inspection Fees 89 89 TOTAL HARVEST COSTS 4,429 4,429 Interest on operating capital 2 3 3 9 10 17 17 55 -1 0 0 0 114 TOTAL OPERATING COSTS/ACRE 241 66 115 692 147 765 95 4,539 42 18 10 10 6,739 OVERHEAD: Office Expense 7 7 7 7 7 7 7 7 7 7 7 7 80 Liability Insurance 6 6 Sanitation Fees 2 2 2 2 2 2 2 2 2 2 19 Property Taxes 62 62 125 Property Insurance 18 18 37 Investment Repairs 4 4 4 4 4 4 4 4 4 4 4 4 42 TOTAL CASH OVERHEAD COSTS 93 12 12 12 12 12 93 12 18 12 10 10 309 TOTAL CASH COSTS/ACRE 334 78 127 704 159 777 188 4,551 60 30 20 20 7,048 *CM = Canopy Management. FM = Fruit Management **In some areas of the valley, the majority of the harvest is in July
2007 Table Grapes Costs and Returns Study (Flame Seedless) San Joaquin Valley South UC Cooperative Extension 19
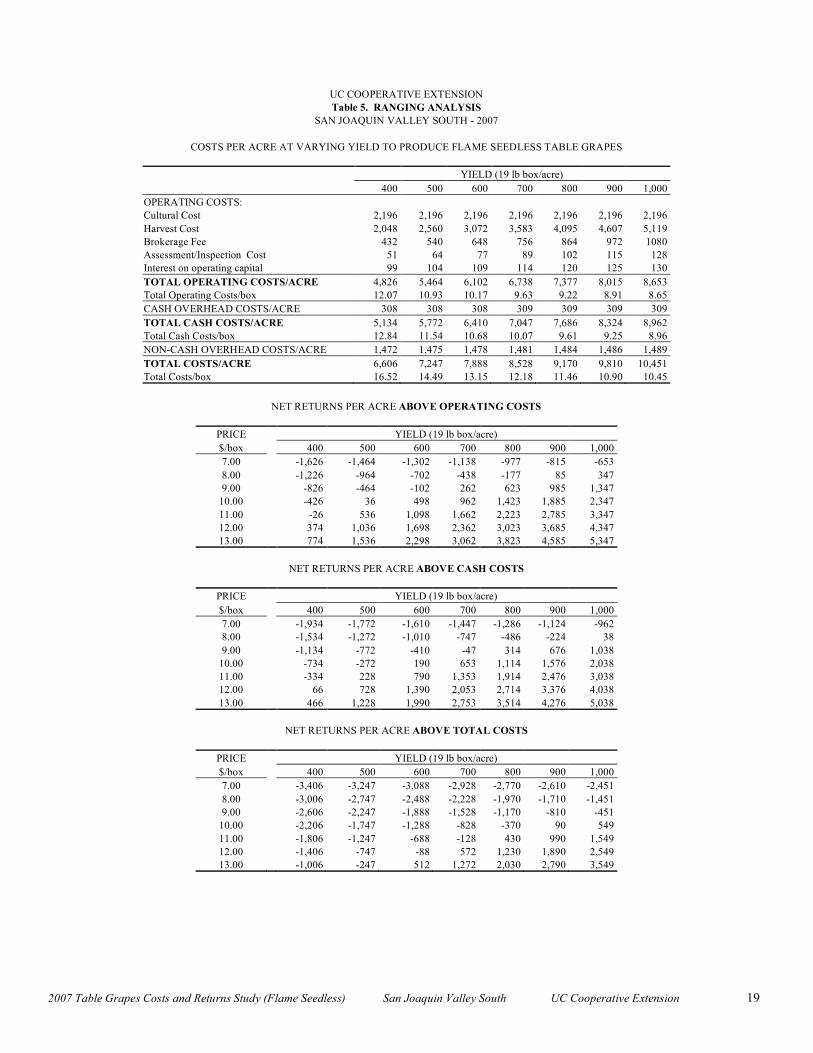
UC COOPERATIVE EXTENSION Table 5. RANGING ANALYSIS
SAN JOAQUIN VALLEY SOUTH - 2007
COSTS PER ACRE AT VARYING YIELD TO PRODUCE FLAME SEEDLESS TABLE GRAPES YIELD (19 lb box/acre) 400 500 600 700 800 900 1,000 OPERATING COSTS: Cultural Cost 2,196 2,196 2,196 2,196 2,196 2,196 2,196 Harvest Cost 2,048 2,560 3,072 3,583 4,095 4,607 5,119 Brokerage Fee 432 540 648 756 864 972 1080 Assessment/Inspection Cost 51 64 77 89 102 115 128 Interest on operating capital 99 104 109 114 120 125 130 TOTAL OPERATING COSTS/ACRE 4,826 5,464 6,102 6,738 7,377 8,015 8,653 Total Operating Costs/box 12.07 10.93 10.17 9.63 9.22 8.91 8.65 CASH OVERHEAD COSTS/ACRE 308 308 308 309 309 309 309 TOTAL CASH COSTS/ACRE 5,134 5,772 6,410 7,047 7,686 8,324 8,962 Total Cash Costs/box 12.84 11.54 10.68 10.07 9.61 9.25 8.96 NON-CASH OVERHEAD COSTS/ACRE 1,472 1,475 1,478 1,481 1,484 1,486 1,489 TOTAL COSTS/ACRE 6,606 7,247 7,888 8,528 9,170 9,810 10,451 Total Costs/box 16.52 14.49 13.15 12.18 11.46 10.90 10.45
NET RETURNS PER ACRE ABOVE OPERATING COSTS
PRICE YIELD (19 lb box/acre) $/box 400 500 600 700 800 900 1,000 7.00 -1,626 -1,464 -1,302 -1,138 -977 -815 -653 8.00 -1,226 -964 -702 -438 -177 85 347 9.00 -826 -464 -102 262 623 985 1,347
10.00 -426 36 498 962 1,423 1,885 2,347 11.00 -26 536 1,098 1,662 2,223 2,785 3,347 12.00 374 1,036 1,698 2,362 3,023 3,685 4,347 13.00 774 1,536 2,298 3,062 3,823 4,585 5,347
NET RETURNS PER ACRE ABOVE CASH COSTS
PRICE YIELD (19 lb box/acre) $/box 400 500 600 700 800 900 1,000 7.00 -1,934 -1,772 -1,610 -1,447 -1,286 -1,124 -962 8.00 -1,534 -1,272 -1,010 -747 -486 -224 38 9.00 -1,134 -772 -410 -47 314 676 1,038
10.00 -734 -272 190 653 1,114 1,576 2,038 11.00 -334 228 790 1,353 1,914 2,476 3,038 12.00 66 728 1,390 2,053 2,714 3,376 4,038 13.00 466 1,228 1,990 2,753 3,514 4,276 5,038
NET RETURNS PER ACRE ABOVE TOTAL COSTS
PRICE YIELD (19 lb box/acre) $/box 400 500 600 700 800 900 1,000 7.00 -3,406 -3,247 -3,088 -2,928 -2,770 -2,610 -2,451 8.00 -3,006 -2,747 -2,488 -2,228 -1,970 -1,710 -1,451 9.00 -2,606 -2,247 -1,888 -1,528 -1,170 -810 -451
10.00 -2,206 -1,747 -1,288 -828 -370 90 549 11.00 -1,806 -1,247 -688 -128 430 990 1,549 12.00 -1,406 -747 -88 572 1,230 1,890 2,549 13.00 -1,006 -247 512 1,272 2,030 2,790 3,549
2007 Table Grapes Costs and Returns Study (Flame Seedless) San Joaquin Valley South UC Cooperative Extension 20
UC COOPERATIVE EXTENSION
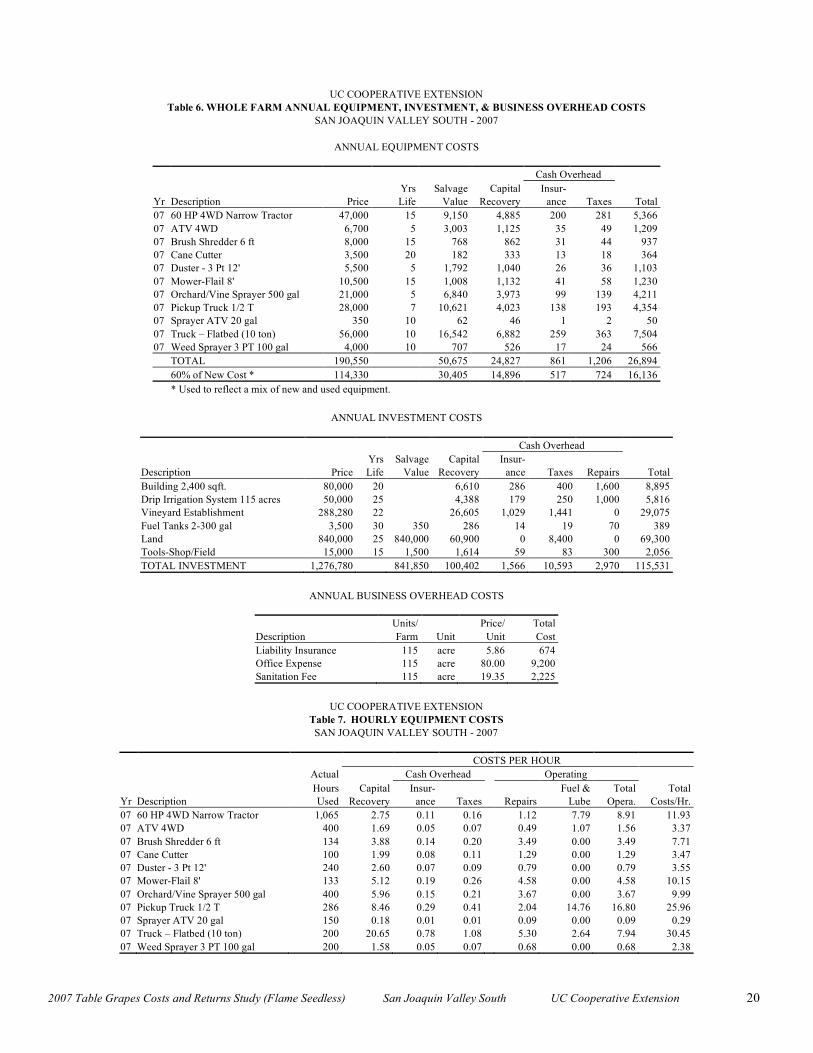
Table 6. WHOLE FARM ANNUAL EQUIPMENT, INVESTMENT, & BUSINESS OVERHEAD COSTS SAN JOAQUIN VALLEY SOUTH - 2007
ANNUAL EQUIPMENT COSTS
Cash Overhead Yrs Salvage Capital Insur- Yr Description Price Life Value Recovery ance Taxes Total 07 60 HP 4WD Narrow Tractor 47,000 15 9,150 4,885 200 281 5,366 07 ATV 4WD 6,700 5 3,003 1,125 35 49 1,209 07 Brush Shredder 6 ft 8,000 15 768 862 31 44 937 07 Cane Cutter 3,500 20 182 333 13 18 364 07 Duster - 3 Pt 12' 5,500 5 1,792 1,040 26 36 1,103 07 Mower-Flail 8' 10,500 15 1,008 1,132 41 58 1,230 07 Orchard/Vine Sprayer 500 gal 21,000 5 6,840 3,973 99 139 4,211 07 Pickup Truck 1/2 T 28,000 7 10,621 4,023 138 193 4,354 07 Sprayer ATV 20 gal 350 10 62 46 1 2 50 07 Truck – Flatbed (10 ton) 56,000 10 16,542 6,882 259 363 7,504 07 Weed Sprayer 3 PT 100 gal 4,000 10 707 526 17 24 566 TOTAL 190,550 50,675 24,827 861 1,206 26,894 60% of New Cost * 114,330 30,405 14,896 517 724 16,136 * Used to reflect a mix of new and used equipment.
ANNUAL INVESTMENT COSTS
Cash Overhead Yrs Salvage Capital Insur- Description Price Life Value Recovery ance Taxes Repairs Total Building 2,400 sqft. 80,000 20 6,610 286 400 1,600 8,895 Drip Irrigation System 115 acres 50,000 25 4,388 179 250 1,000 5,816 Vineyard Establishment 288,280 22 26,605 1,029 1,441 0 29,075 Fuel Tanks 2-300 gal 3,500 30 350 286 14 19 70 389 Land 840,000 25 840,000 60,900 0 8,400 0 69,300 Tools-Shop/Field 15,000 15 1,500 1,614 59 83 300 2,056 TOTAL INVESTMENT 1,276,780 841,850 100,402 1,566 10,593 2,970 115,531
ANNUAL BUSINESS OVERHEAD COSTS
Units/ Price/ Total Description Farm Unit Unit Cost Liability Insurance 115 acre 5.86 674 Office Expense 115 acre 80.00 9,200 Sanitation Fee 115 acre 19.35 2,225
UC COOPERATIVE EXTENSION
Table 7. HOURLY EQUIPMENT COSTS SAN JOAQUIN VALLEY SOUTH - 2007
COSTS PER HOUR Actual Cash Overhead Operating Hours Capital Insur- Fuel & Total Total Yr Description Used Recovery ance Taxes Repairs Lube Opera. Costs/Hr. 07 60 HP 4WD Narrow Tractor 1,065 2.75 0.11 0.16 1.12 7.79 8.91 11.93 07 ATV 4WD 400 1.69 0.05 0.07 0.49 1.07 1.56 3.37 07 Brush Shredder 6 ft 134 3.88 0.14 0.20 3.49 0.00 3.49 7.71 07 Cane Cutter 100 1.99 0.08 0.11 1.29 0.00 1.29 3.47 07 Duster - 3 Pt 12' 240 2.60 0.07 0.09 0.79 0.00 0.79 3.55 07 Mower-Flail 8' 133 5.12 0.19 0.26 4.58 0.00 4.58 10.15 07 Orchard/Vine Sprayer 500 gal 400 5.96 0.15 0.21 3.67 0.00 3.67 9.99 07 Pickup Truck 1/2 T 286 8.46 0.29 0.41 2.04 14.76 16.80 25.96 07 Sprayer ATV 20 gal 150 0.18 0.01 0.01 0.09 0.00 0.09 0.29 07 Truck – Flatbed (10 ton) 200 20.65 0.78 1.08 5.30 2.64 7.94 30.45 07 Weed Sprayer 3 PT 100 gal 200 1.58 0.05 0.07 0.68 0.00 0.68 2.38
2007 Table Grapes Costs and Returns Study (Flame Seedless) San Joaquin Valley South UC Cooperative Extension 21
UC COOPERATIVE EXTENSION
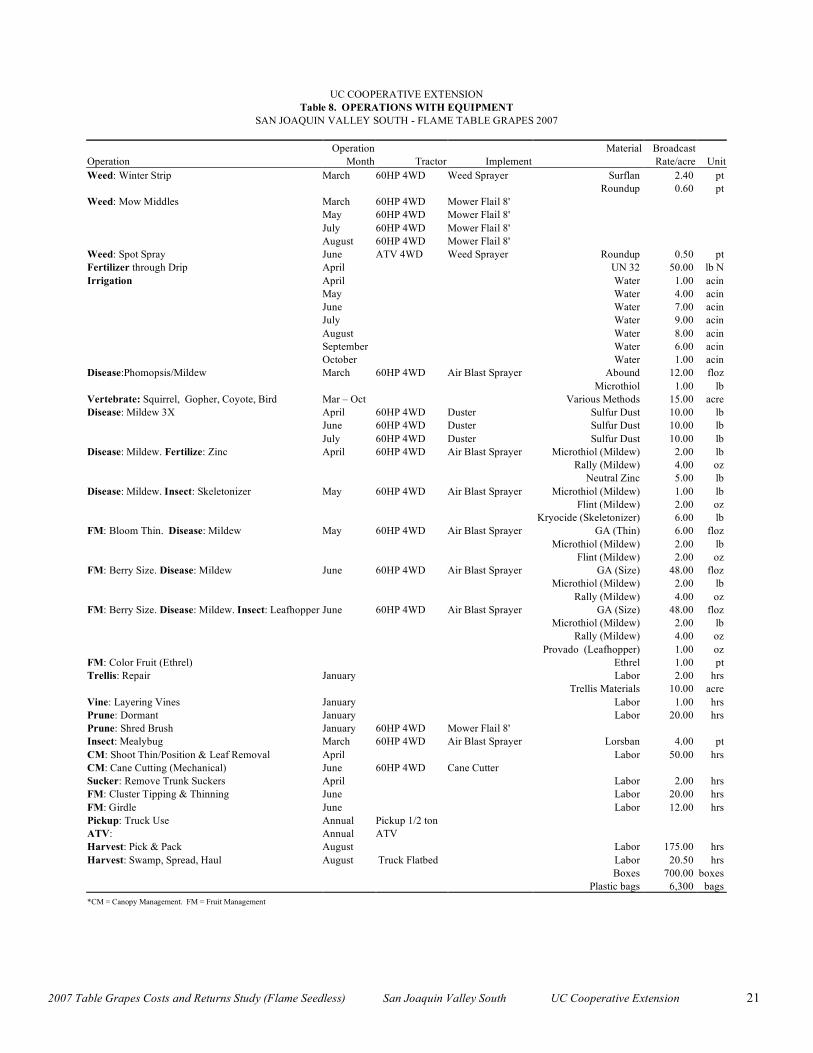
Table 8. OPERATIONS WITH EQUIPMENT SAN JOAQUIN VALLEY SOUTH - FLAME TABLE GRAPES 2007
Operation Material Broadcast Operation Month Tractor Implement Rate/acre Unit Weed: Winter Strip March 60HP 4WD Weed Sprayer Surflan 2.40 pt Roundup 0.60 pt Weed: Mow Middles March 60HP 4WD Mower Flail 8' May 60HP 4WD Mower Flail 8' July 60HP 4WD Mower Flail 8' August 60HP 4WD Mower Flail 8' Weed: Spot Spray June ATV 4WD Weed Sprayer Roundup 0.50 pt Fertilizer through Drip April UN 32 50.00 lb N Irrigation April Water 1.00 acin May Water 4.00 acin June Water 7.00 acin July Water 9.00 acin August Water 8.00 acin September Water 6.00 acin October Water 1.00 acin Disease:Phomopsis/Mildew March 60HP 4WD Air Blast Sprayer Abound 12.00 floz Microthiol 1.00 lb Vertebrate: Squirrel, Gopher, Coyote, Bird Mar – Oct Various Methods 15.00 acre Disease: Mildew 3X April 60HP 4WD Duster Sulfur Dust 10.00 lb June 60HP 4WD Duster Sulfur Dust 10.00 lb July 60HP 4WD Duster Sulfur Dust 10.00 lb Disease: Mildew. Fertilize: Zinc April 60HP 4WD Air Blast Sprayer Microthiol (Mildew) 2.00 lb Rally (Mildew) 4.00 oz Neutral Zinc 5.00 lb Disease: Mildew. Insect: Skeletonizer May 60HP 4WD Air Blast Sprayer Microthiol (Mildew) 1.00 lb Flint (Mildew) 2.00 oz Kryocide (Skeletonizer) 6.00 lb FM: Bloom Thin. Disease: Mildew May 60HP 4WD Air Blast Sprayer GA (Thin) 6.00 floz Microthiol (Mildew) 2.00 lb Flint (Mildew) 2.00 oz FM: Berry Size. Disease: Mildew June 60HP 4WD Air Blast Sprayer GA (Size) 48.00 floz Microthiol (Mildew) 2.00 lb Rally (Mildew) 4.00 oz FM: Berry Size. Disease: Mildew. Insect: Leafhopper June 60HP 4WD Air Blast Sprayer GA (Size) 48.00 floz Microthiol (Mildew) 2.00 lb Rally (Mildew) 4.00 oz Provado (Leafhopper) 1.00 oz FM: Color Fruit (Ethrel) Ethrel 1.00 pt Trellis: Repair January Labor 2.00 hrs Trellis Materials 10.00 acre Vine: Layering Vines January Labor 1.00 hrs Prune: Dormant January Labor 20.00 hrs Prune: Shred Brush January 60HP 4WD Mower Flail 8' Insect: Mealybug March 60HP 4WD Air Blast Sprayer Lorsban 4.00 pt CM: Shoot Thin/Position & Leaf Removal April Labor 50.00 hrs CM: Cane Cutting (Mechanical) June 60HP 4WD Cane Cutter Sucker: Remove Trunk Suckers April Labor 2.00 hrs FM: Cluster Tipping & Thinning June Labor 20.00 hrs FM: Girdle June Labor 12.00 hrs Pickup: Truck Use Annual Pickup 1/2 ton ATV: Annual ATV Harvest: Pick & Pack August Labor 175.00 hrs Harvest: Swamp, Spread, Haul August Truck Flatbed Labor 20.50 hrs Boxes 700.00 boxes Plastic bags 6,300 bags *CM = Canopy Management. FM = Fruit Management