Embed Size (px)
Citation preview


Page 1
TABLE OF CONTENTS
Executive Summary .............................................................................................................................................................. 2
OpenEdge Streamlines Development and Support ......................................................................................................... 2
Factors Affecting Benefits And Costs ............................................................................................................................. 3
Disclosures........................................................................................................................................................................ 3
TEI Framework And Methodology ...................................................................................................................................... 5
Analysis ................................................................................................................................................................................. 7
Interview Highlights ......................................................................................................................................................... 7
Costs ................................................................................................................................................................................. 9
Benefits ........................................................................................................................................................................... 12
Flexibility ........................................................................................................................................................................ 15
Risk ................................................................................................................................................................................. 16
Financial Summary ............................................................................................................................................................. 18
Progress Software OpenEdge Platform: Overview ............................................................................................................ 20
Appendix A: Composite Organization Description ........................................................................................................... 21
Appendix B: Total Economic Impact™ Overview ............................................................................................................ 21
Appendix C: Glossary ......................................................................................................................................................... 22
Appendix D: Endnotes ........................................................................................................................................................ 23
© 2013, Forrester Research, Inc. All rights reserved. Unauthorized reproduction is strictly prohibited. Information is based on best available resources.
Opinions reflect judgment at the time and are subject to change. Forrester®, Technographics®, Forrester Wave, RoleView, TechRadar, and Total
Economic Impact are trademarks of Forrester Research, Inc. All other trademarks are the property of their respective companies. For additional
information, go to www.forrester.com.

Page 2
In April 2013, Progress Software commissioned Forrester Consulting to examine the total economic impact and
potential return on investment (ROI) businesses may realize by building an application on the OpenEdge platform
versus using an alternative (non-Progress) platform. The organizations interviewed by Forrester were Progress
Software partners that use OpenEdge to create new applications and maintain existing applications. These
organizations have used the OpenEdge platform for between five and 15 years. During this period, they have
modernized their applications’ architectures and interfaces to support new technologies and added numerous new
features to their applications. This study illustrates the financial impact of the OpenEdge platform across the application
development life cycle for a Progress partner managing an application on the Progress OpenEdge platform versus an
alternative platform. The purpose of this study is to provide readers with a framework to evaluate the potential financial
impact of the OpenEdge Platform on their organizations.
Forrester found that the interviewed organizations were able to quantify the lower costs associated with developing,
deploying, and supporting applications created and managed on OpenEdge versus an alternative non-Progress platform.
Our interviews with four existing customers and subsequent financial analysis found that a composite organization
based on these companies experienced the risk-adjusted ROI, costs, and benefits shown in Table 1. See Appendix A for
a description of the composite organization.
Our interviewees also described a number of qualitative benefits. Quality assurance (QA) teams detected fewer initial
defects in applications developed on OpenEdge compared with alternative platforms they were testing. In addition, QA
teams found that they were able to detect and reproduce issues faster with the Progress platform than with alternative
platforms. Partners called the platform’s ease of use as contributing to the development of higher-quality applications.
Interviewees also noted that Progress Software offers a set of diagnostic tools that allow developers and QA teams to
quickly replicate and fix platform-related issues.
In addition, the partners we interviewed were able to qualitatively describe the increase in revenue they achieved by
reducing application time-to-market and monthly reporting costs for partners that produce and maintain software-as-a-
service (SaaS) applications for their end users.

Page 3
Benefits. The composite organization experienced the following benefits that represent those experienced by the
interviewed companies:
o Improved developer productivity. The interviewed organizations were able to improve developers’
productivity when writing code for a newly created application or while improving features and functionality
for their existing applications.
o Improved after sales support. The organizations also realized a reduction in support costs when their end
users deployed their applications resulting from OpenEdge’s stability.
Costs. The composite organization experienced the following costs:
o Annual software subscription fees. The interviewees paid subscription costs to Progress to support their
OpenEdge development environment.
o Distribution of revenue cost (on-premises). For the on-premises applications delivered to their end
customers, the interviewed companies paid fixed subscription fees for the OpenEdge platform.
o Distribution of revenue cost (on-demand). For applications delivered via SaaS, Progress receives a
percentage of the total monthly subscription cost of that application.
Table 1 illustrates the risk-adjusted financial results that were achieved by the composite organization. The risk-
adjusted values take into account any potential uncertainty or variance that exists in estimating the costs and benefits,
which produces more conservative estimates. The following factors may affect the financial results that an organization
may experience:
Length of deployment. New developers initially required training on OpenEdge; but the longer organizations
had the platform in place, the more it became integrated into basic processes and methods.
Delivery and pricing structure. Progress fees vary for on-premises and on-demand applications, so the amount
paid back to Progress depends on the type of applications that the organization develops and delivers.
The reader should be aware of the following:
The study is commissioned by Progress Software and delivered by the Forrester Consulting group.
Forrester makes no assumptions as to the potential return on investment that other organizations will receive.
Forrester strongly advises that readers use their own estimates within the framework provided in the report to
determine the appropriateness of an investment in the OpenEdge Platform.

Page 4
Progress Software reviewed and provided feedback to Forrester, but Forrester maintains editorial control over the
study and its findings and does not accept changes to the study that contradict Forrester’s findings or obscure the
meaning of the study.
The customer names for the interviews were provided by Progress Software.

Page 5
From the information provided in the interviews, Forrester has constructed a Total Economic Impact™ framework for
those organizations considering implementing Progress Software’s OpenEdge Platform. The objective of the
framework is to identify the cost, benefit, flexibility, and risk factors that affect the investment decision.
Forrester took a multistep approach to evaluate the impact that Progress Software/OpenEdge Platform can have on an
organization (see Figure 1). Specifically, we:
Interviewed Progress Software marketing personnel and Forrester analysts to gather data relative to the
OpenEdge Platform and the marketplace for the OpenEdge Platform.
Interviewed four organizations currently using OpenEdge to obtain data with respect to costs, benefits, and risks.
Designed a composite organization based on characteristics of the interviewed organizations (see Appendix A).
Constructed a financial model representative of the interviews using the TEI methodology. The financial model
is populated with the cost and benefit data obtained from the interviews as applied to the composite organization.
Forrester employed four fundamental elements of TEI in modeling the impact of using the OpenEdge Platform:
1. Costs.
2. Benefits to the entire organization.
3. Flexibility.
4. Risk.
Design composite
organization
Construct financial
model using TEI framework
Write case
study
Perform due
diligence
Conduct
customer interviews

Page 6
Given the increasing sophistication that enterprises have regarding ROI analyses related to IT investments, Forrester’s
TEI methodology serves the purpose of providing a complete picture of the total economic impact of purchase
decisions. Please see Appendix B for additional information on the TEI methodology.

Page 7
A total of four interviews were conducted for this study, involving representatives from the following companies
(Progress Software customers based in the US and Europe):
A Europe-based provider of enterprise resource planning (ERP) software.
A US-based provider of insurance software.
A US-based auto rental software provider.
A Europe-based provider of logistics software.
The four interviews revealed that:
The ISVs using OpenEdge for the past several years indicated that one of the main reasons why they continue
using the Progress platform is the ability to deploy a multitenant, multiplatform, multidatabase solution, meaning
that it is possible to use different databases while continuing to use Advanced Business Language (ABL) to build
end-to-end business applications including business logic, user interfaces, and complex data management.
The growth of mobile applications was a critical requirement for ISVs using the OpenEdge Platform. Many of
the organizations were actively writing mobile applications and required the flexibility and scalability to leverage
multiple platform types to suit their clients’ needs.
One of the reasons developers showed a significant productivity gain over time was that ISVs found that they
were able to write less code to execute common programming tasks with the OpenEdge framework and were
easily able to reuse the code they did write in multiple application subsystems. Some ISVs cited instances where
the total amount of code they needed to write for a new feature was reduced by 90% the second time around.
Organizations also cited the productivity of features that were unique to the combined OpenEdge framework and
integrated database management system (DBMS). For example, these organizations have been able to use Word
indexes on a Progress database, where an alternative SQL database did not allow a similar mechanism.
ISVs did note having some difficulty finding developers that are familiar with OpenEdge. The OpenEdge
community is smaller than the alternative development platforms, and OpenEdge is not usually taught in
universities in the US and Europe. Nonetheless, this issue did not present a serious challenge to the ISVs we
interviewed, because OpenEdge is moving in a direction that makes it similar to Java or .NET in terms of its
object-oriented concepts. And as the conceptual gap between ABL and other languages shrinks, the companies
we spoke with found that it doesn’t take any more time to train an OpenEdge developer than it does a .NET or
Java developer. Several interviewees created rapid learning courses for new developers, saying that their training
typically lasts about four weeks. During the first half-year, the new developers are in the training phase. Shortly
after the training phase is complete, these developers are able to create their first programs and become
productive contributors to projects.

Page 8
Clients also leveraged OpenEdge using a variety of different pricing platforms, from a traditional on-premises
model to SaaS. ISVs noted that they could also leverage a hybrid approach, allowing certain clients the flexibility
of SaaS pricing as a percentage of the overall solution cost while offering traditional on-premises pricing to
others.
Based on the interviews with the four existing customers provided by Progress Software, Forrester constructed a TEI
framework, a composite company, and an associated ROI analysis that illustrates the areas financially affected.
The composite organization created from the results of the partners interviewed represents a $60 million US-based
provider of ERP software. The composite organization’s core product, an ERP module, is written using several
application development solutions including the OpenEdge platform. For the purpose of this analysis, Forrester
considers the financial impact associated with application developers’ productivity gain and the reduction in application
post-sales support effort.
Based on the information captured in the in-depth interviews with Progress partners currently using OpenEdge,
Forrester assumes that in either scenario (develop, deploy, and manage an application on the Progress platform or an
alternative platform), the composite organization engages with the platform vendor for business, technical advice,
training, and consulting.
See Appendix A for more details on the composite organization.
Table 2 provides the model assumptions that Forrester used in this analysis.

Page 9
The discount rate used in the PV and NPV calculations is 10% and time horizon used for the financial modeling is four
years. Organizations typically use discount rates between 8% and 16% based on their current environment. Readers are
urged to consult with their respective company’s finance department to determine the most appropriate discount rate to
use within their own organizations.
This section outlines the investment made by the composite organization based on the discussions with partners using
the OpenEdge platform. The composite organization had two main costs: annual software subscription costs and
distribution of revenue costs to Progress Software (separated into on-premises and on-demand components). We have
also estimated other costs, including training as well as planning and hardware costs, but did not include them in the
ROI. These costs do not vary in a material way when partners are using alternative, non-Progress platforms to build and
support applications.
The composite organization needed three PSDN Premier Subscriptions for its 15 developers. The organization also
purchased two PSDN add-on subscriptions to support the prior two product releases (one subscription per lease). Each
PSDN Premier and PSDN add-on subscription allows five users. Partners receive a vendor discount on an annual
subscription, depending on their level of partnership. Table 3 illustrates the calculation.
The next component of cost is the distribution of revenue to Progress Software. The estimated costs are based on the
number of named users per customer. Based on the interviews with Progress partners, we estimate that the composite
organization sells its application to 170 new customers, of which approximately 90% (150) are using an on-premises

Page 10
deployment. Each customer has on average 15 named users. Progress costs a total of $805 per named user. This
includes $585 for OpenEdge Enterprise RDBMS, $110 for OpenEdge Application Server Enterprise Edition, and $110
for OpenEdge Client Deployment (client networking). In our interviews, we found that, on average, partners receive
vendor discounts that reduce these list costs by around 35%. The discount increases based on the amount of revenue
received from the partner and the level of partnership. Table 4 presents this calculation.
Page 11
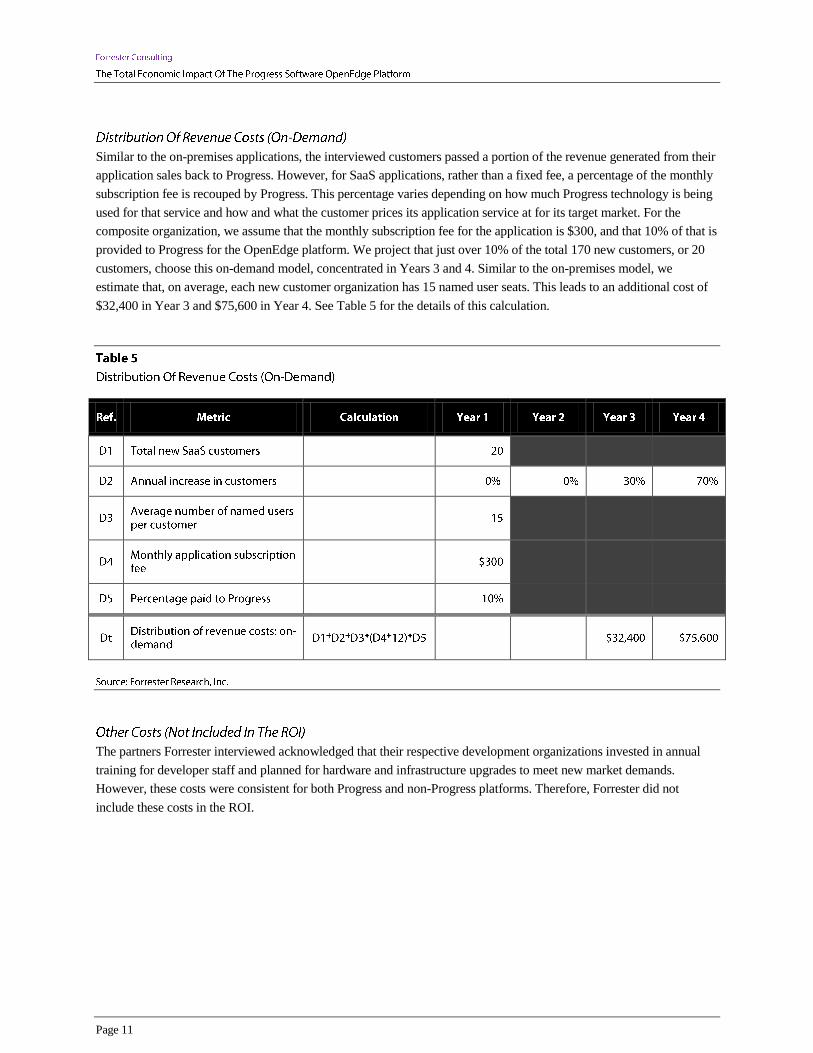
Similar to the on-premises applications, the interviewed customers passed a portion of the revenue generated from their
application sales back to Progress. However, for SaaS applications, rather than a fixed fee, a percentage of the monthly
subscription fee is recouped by Progress. This percentage varies depending on how much Progress technology is being
used for that service and how and what the customer prices its application service at for its target market. For the
composite organization, we assume that the monthly subscription fee for the application is $300, and that 10% of that is
provided to Progress for the OpenEdge platform. We project that just over 10% of the total 170 new customers, or 20
customers, choose this on-demand model, concentrated in Years 3 and 4. Similar to the on-premises model, we
estimate that, on average, each new customer organization has 15 named user seats. This leads to an additional cost of
$32,400 in Year 3 and $75,600 in Year 4. See Table 5 for the details of this calculation.
The partners Forrester interviewed acknowledged that their respective development organizations invested in annual
training for developer staff and planned for hardware and infrastructure upgrades to meet new market demands.
However, these costs were consistent for both Progress and non-Progress platforms. Therefore, Forrester did not
include these costs in the ROI.

Page 12
The total costs for the analysis are shown in Table 6.
The second component of TEI is evaluating the value gained from the usage and investment in OpenEdge for the
partners interviewed. These organizations improved their application developers’ productivity by writing less code and
eliminating programming errors, which leads to faster QA and reduced post-sales support effort. The organizations also
noted that, as a result of productivity improvements, they have been able to improve their time-to-market. We have
created a structure for organizations to measure the impact of that benefit internally.
This benefit accounts for 75% of the overall gain. The partners we interviewed explained that their application
developers using OpenEdge can produce the same application about 40% faster compared with alternative platforms.
The developers producing the application also write fewer lines of code; this results in fewer errors, reducing the effort
needed for QA and getting the applications to market faster.
The developers’ productivity gain was fully attributable to this analysis. While the interviewees expressed the
improvement in quality, they were not able to fully differentiate what percentage of QA activities had been reduced as a
part of the application and what portion was attributable to the platform and language used. One of our interviewees
cited a study that his organization completed with a local university to understand how complexity measurement of
source code and real errors are combined. The analysis indicated that the number of errors per line of code was one-
tenth of what they had seen in other projects developed on non-Progress platforms. Forrester did not include this data
point in the analysis to measure the improvement in QA activities; however, we do recommend that users measure it
within their environment. Table 7 presents the productivity gain from IT developers. To remain conservative, Forrester

Page 13
estimates that the organization was able to realize 50% of the benefits in year 2 and 100% in years 3 and 4,
respectively.
Our interviewees explained that one of the selling points of using OpenEdge within their IT development environment
was the ability to reduce the post-sales support effort. This is a cost reduction that they have been able to pass directly
to their end users. The interviewees all told us that they rarely receive support calls related to the platform. They use
this benefit as a selling point, particularly for application developers who cater to a niche market where the end users
mainly focus on features and functionality. Per our interviews, OpenEdge is fully integrated with the database and the
end user is not required to have an in-house database administrator to manage day-to-day activities.
Forrester estimates that the composite organization has three full-time support staff with an annual fully loaded salary
of $85,000 per individual. Based on our interviews, Forrester assumes that the composite organization has been able to
improve support staff productivity gain when supporting end user platform-related issues. To remain conservative,
Forrester estimates that the organization was able to realize 50% of benefits in year 2 and 100% in years 3 and 4,
respectively. Table 8 illustrates the calculation.

Page 14
The incremental revenue gain resulting from the shorter application time-to-market is the final benefit described by our
interviewees. These organizations were able to deliver their application 30% faster on average when developing on the
Progress platform versus the alternative platform. However, Forrester did not estimate this gain for the composite
organization because the production cycle varied from organization to organization.
We recommend that users estimate the monthly revenue generated per customer, the number of new customers signed
on during the initial year that the application is launched, and the average time-to-market for the alternative solution
and that they use the 30% improvement, a default value that Forrester has captured through customer interviews to
estimate the value gained for the respective organization. Table 9 demonstrates this outline.

Page 15
Table 10 presents the total quantified benefits resulting from the usage of OpenEdge by the composite organization.
Flexibility, as defined by TEI, represents an investment in additional capacity or capability that could be turned into
business benefit for some future additional investment. This provides an organization with the “right” or the ability to
engage in future initiatives but not the obligation to do so. There are multiple scenarios in which a customer might
choose to implement OpenEdge Platform and later realize additional uses and business opportunities. Flexibility would
also be quantified when evaluated as part of a specific project (described in more detail in Appendix B).
Through our interviews, the partners who were selling their application as SaaS were able to reduce time and effort
when they produced end-of-month reporting that led to reduction in administrative effort. Our interviews revealed that
the composite organization reduced the time to produce end-of-month reports from 14 to five days. It is important to
measure what costs were eliminated or reduced as a result of this reduction. Based on the Forrester flexibility
methodology, in order to recognize this benefit, the composite organization needs to either invest in an infrastructure to
host the solution or hire a third party to manage its SaaS environment. We outline the metrics to measure this benefit in
Table 11.

Page 16
Forrester defines two types of risk associated with this analysis: implementation risk and impact risk. “Implementation
risk” is the risk that a proposed investment in OpenEdge Platform may deviate from the original or expected
requirements, resulting in higher costs than anticipated. “Impact risk” refers to the risk that the business or technology
needs of the organization may not be met by the investment in OpenEdge Platform, resulting in lower overall total
benefits. The greater the uncertainty, the wider the potential range of outcomes for cost and benefit estimates.
Quantitatively capturing investment and impact risk by directly adjusting the financial estimates results in more
meaningful and accurate estimates and a more accurate projection of the ROI. In general, risks affect costs by raising
the original estimates, and they affect benefits by reducing the original estimates. The risk-adjusted numbers should be
taken as “realistic” expectations, as they represent the expected values considering risk.
For the purpose of this analysis, Forrester risk-adjusts cost and benefit estimates to better reflect the level of uncertainty
that exists for each estimate. The TEI model uses a triangular distribution method to calculate risk-adjusted values. To
construct the distribution, it is necessary to first estimate the low, most likely, and high values that could occur within
the current environment. The risk-adjusted value is the mean of the distribution of those points.
Take the case of IT productivity gain: The $1,219,384 value used in this analysis can be considered the “most likely” or
expected value. This variability represents a risk that must be captured as part of this study. Forrester uses a risk factor
of 105% on the high end, 100% as the most likely, and 90% on the low end. This has the effect of increasing the cost
estimate to take into account the fact that original cost estimates are more likely to be revised upward than downward.
Forrester then creates a triangular distribution to reflect the range of expected costs, with 98.3% as the mean (198.3% is
equal to the sum of 105%, 100%, and 90% divided by three). Forrester applies this mean to the most likely estimate,
$1,219,384, to arrive at a risk-adjusted value of $1,194,996.
The following general management and process risk was considered in this study:
Similar to any application development, partners that are planning to use OpenEdge to develop, deploy, and
manage their application may require additional OpenEdge skills or competencies.

Page 17
The following risks specific to OpenEdge were considered in this study:
Where application feature and functionality is not the primary point of discussion, selling to customers not
familiar with Progress Software could extend the sales cycle or increase the amount a partner must spend on
product marketing.
The risk that Progress Software could be acquired or decide to shift its focus away from the OpenEdge platform.
The following tables show the values used to adjust for uncertainty in cost and benefit estimates. Different cost and
benefits estimates have different levels of risk adjustments. Based on the comments from the interviewed customers,
we applied risk to the benefits to adjust for any uncertainty. Forrester used list prices for all annual software
subscriptions and revenue distribution fees. Readers are urged to apply their own risk ranges based on their own degree
of confidence in the cost and benefit estimates.

Page 18
The financial results calculated in the Costs and Benefits sections can be used to determine the return on investment,
net present value, and payback period for the organization’s investment in the OpenEdge Platform. These are shown in
Table 13 below.
Table 14 below shows the risk-adjusted ROI, NPV, and payback period values. These values are determined by
applying the risk-adjustment values from Table 12 in the Risk section to the cost and benefits numbers in Tables 6 and
10.

Page 19

Page 20
According to Progress Software, Progress OpenEdge is an integrated platform for simplifying and streamlining the
development, integration, and management of business applications for fast time-to-market. OpenEdge’s unified
environment is comprised of development tools, application servers, application management tools, a relational
database, business process management, business rules management system, mobile app builder, and the capability to
easily connect and integrate with other applications and data sources. The OpenEdge development environment has
tools that help accelerate every aspect of the development process.
The OpenEdge platform delivers flexibility to application developers so that they can leverage existing technology and
quickly adapt to new technology and changes in market and business requirements. The OpenEdge platform is
supported by the OpenEdge Reference Architecture, a high-level framework focused on best practices for building
modern competitive applications, a set of tools, and infrastructure. The OpenEdge Reference Architecture recommends
the separation of the application architecture into four distinct layers (business services, data access, presentation, and
integration), and therefore, technology platforms, operating systems, data stores, integration technologies, and user
interfaces can vary without requiring redesign at other layers. The reference architecture promotes the reuse of business
logic and components because logic is cleanly separated from other concerns.
The Progress Partner+ program pivots around a joint business planning process that offers a comprehensive set of
empowerment and enablement programs designed to align with partners’ overall business goals. The empowerment
programs help partners expand and grow their businesses while enablement programs focus on sustaining partners’
technical skills, processes, and know-how to transform their current applications and development innovative new
applications.
Progress Business Empowerment offers both one-to-one and one-to-many programs designed to help partners increase
revenue and improve marketing and sales effectiveness. Business Empowerment focuses on business planning
development, go-to-market planning, and demand generation to produce qualified leads and increase market awareness.
Progress Technical Empowerment is designed to help partners create competitive applications. Programs consist of
education, communication, consulting services, and an application transformation approach. Technical Empowerment
enables partners to build applications that have flexibility designed into them and helps partners to build and transform
applications in logical steps and in modules that match resources and business plans.
Progress SaaS Enablement is a program that assists ISVs as they look to make the transition from traditional on-
premises application deployment toward a service-based delivery model. SaaS Enablement offers help in the area of
SaaS Business Empowerment, SaaS Marketing & Sales Empowerment, and SaaS Technical Empowerment, including
white papers and best practices around architecting for SaaS.

Page 21
In this TEI study, Forrester has created a composite organization to illustrate the quantifiable costs and benefits of
developing, deploying, and managing an application on the Progress Software platform OpenEdge versus an alternative
(non-Progress) platform. The composite organization is intended to represent:
A $60 million US-based firm.
An ERP software provider.
The composite organization’s core product, an ERP module, is written on several application development platforms,
including the Progress Platform.
The composite organization develops, deploys, and manages its core product in order to modernize the architecture and
interfaces to support new technologies and add new features to the application. The composite organization sells its
new solution to 200 customers within a four-year financial horizon. On average, the composite organization sells 15
seats per customer. Of these, 10% of the new customers are deployed on a SaaS model (or 20 customers over the four
years).
For the on-premises deployments, the organization receives 35% discounts on the fees that are expected to be paid to
Progress Software. Those fees include $585 for OpenEdge Enterprise RDBMS, $110 for OpenEdge Application Server
Enterprise Edition, and $110 for OpenEdge Client Deployment. The composite organization is using the latest version
of the OpenEdge. The organization has purchased three PSDN Premier Subscriptions for the latest version of the
application and two PSDN add-on subscriptions to manage the prior two versions of the solution.
For the on-demand deployments, the end users are charged a monthly subscription fee, of which Progress receives
10%. The percentage varies depending on how much Progress technology is being used for that service and how the
application is priced. The organization interviewed received discounts from both subscriptions of PSDN Premier and
PSDN add-on, as well as the distribution of revenue for OpenEdge Enterprise RDBMS, OpenEdge Application Server
Enterprise Edition, and OpenEdge Client Deployment. The discount varies depending on the level of partnership and
the annual revenue generated.
Total Economic Impact is a methodology developed by Forrester Research that enhances a company’s technology
decision-making processes and assists vendors in communicating the value proposition of their products and services to
clients. The TEI methodology helps companies demonstrate, justify, and realize the tangible value of IT initiatives to
both senior management and other key business stakeholders.
The TEI methodology consists of four components to evaluate investment value: benefits, costs, risks, and flexibility.

Page 22
Benefits represent the value delivered to the user organization — IT and/or business units — by the proposed product
or project. Often product or project justification exercises focus just on IT cost and cost reduction, leaving little room to
analyze the effect of the technology on the entire organization. The TEI methodology and the resulting financial model
place equal weight on the measure of benefits and the measure of costs, allowing for a full examination of the effect of
the technology on the entire organization. Calculation of benefit estimates involves a clear dialogue with the user
organization to understand the specific value that is created. In addition, Forrester also requires that there be a clear line
of accountability established between the measurement and justification of benefit estimates after the project has been
completed. This ensures that benefit estimates tie back directly to the bottom line.
Costs represent the investment necessary to capture the value, or benefits, of the proposed project. IT or the business
units may incur costs in the form of fully burdened labor, subcontractors, or materials. Costs consider all the
investments and expenses necessary to deliver the proposed value. In addition, the cost category within TEI captures
any incremental costs over the existing environment for ongoing costs associated with the solution. All costs must be
tied to the benefits that are created.
Risk measures the uncertainty of benefit and cost estimates contained within the investment. Uncertainty is measured in
two ways: 1) the likelihood that the cost and benefit estimates will meet the original projections, and 2) the likelihood
that the estimates will be measured and tracked over time. TEI applies a probability density function known as
“triangular distribution” to the values entered. At minimum, three values are calculated to estimate the underlying range
around each cost and benefit.
Within the TEI methodology, direct benefits represent one part of the investment value. While direct benefits can
typically be the primary way to justify a project, Forrester believes that organizations should be able to measure the
strategic value of an investment. Flexibility represents the value that can be obtained for some future additional
investment building on top of the initial investment already made. For instance, an investment in an enterprisewide
upgrade of an office productivity suite can potentially increase standardization (to increase efficiency) and reduce
licensing costs. However, an embedded collaboration feature may translate to greater worker productivity if activated.
The collaboration can only be used with additional investment in training at some future point in time. However,
having the ability to capture that benefit has a present value that can be estimated. The flexibility component of TEI
captures that value.
Discount rate: The interest rate used in cash flow analysis to take into account the time value of money. Although the
Federal Reserve Bank sets a discount rate, companies often set a discount rate based on their business and investment
environment. Forrester assumes a yearly discount rate of 10% for this analysis. Organizations typically use discount

Page 23
rates between 8% and 16% based on their current environment. Readers are urged to consult their respective
organization to determine the most appropriate discount rate to use in their own environment.
Net present value (NPV): The present or current value of (discounted) future net cash flows given an interest rate (the
discount rate). A positive project NPV normally indicates that the investment should be made, unless other projects
have higher NPVs.
Present value (PV): The present or current value of (discounted) cost and benefit estimates given at an interest rate
(the discount rate). The PV of costs and benefits feed into the total net present value of cash flows.
Payback period: The breakeven point for an investment. The point in time at which net benefits (benefits minus costs)
equal initial investment or cost.
Return on investment (ROI): A measure of a project’s expected return in percentage terms. ROI is calculated by
dividing net benefits (benefits minus costs) by costs.
The following is a note on the cash flow tables used in this study (see the example table below). The initial investment
column contains costs incurred at “time 0” or at the beginning of Year 1. Those costs are not discounted. All other cash
flows in Years 1 through 3 are discounted using the discount rate (shown in Framework Assumptions section) at the
end of the year. Present value (PV) calculations are calculated for each total cost and benefit estimate. Net present value
(NPV) calculations are not calculated until the summary tables and are the sum of the initial investment and the
discounted cash flows in each year.
1 Forrester risk-adjusts the summary financial metrics to take into account the potential uncertainty of the cost and
benefit estimates. For more information on Risk, please see page 16.