Embed Size (px)
Citation preview

1

Table of ContentsEXECUTIVE SUMMARY 3
AT&T 5
AUSTAL SHIPBUILDING 13
VODACOM 23
SKODA AUTO 29
INTERNATIONAL & DOMESTIC: 34IT USAGE COMPARISON
DISCUSSION 38
WORKS CITED 41
3
EXECUTIVE SUMMARYBiztel analyzed the business intelligence systems of four companies, two domestic and two foreign. Domestically, we examined AT&T, a major telecommunications firm, and Austal USA, a defense contractor responsible for building ships for the United States military. The foreign companies we examined were Skoda, a subsidiary of Volkswagen in the Czech Republic that is expanding east-ward into new markets, and Vodacom, a South African telecommunications company.
AT&T is an industry leader in business intelligence usage, and even provides BI applications to its customers. The company not only utilizes data mining to determine where poor service areas exist, but also to develop a controversial application called Hancock, a data mining system that extracts detailed information on who calls who and where they are.
Austal utilizes BI to manage the arduous task of building military grade vessels. Austal uses a system called IFS to track piece-by-piece construction of ships, manage procurement and billing and generate reports. Use of IFS is pervasive at the company, but data is input centrally, creating a bottleneck for information flow.
Skoda operates a company portal through which its subsidiaries can access information; develop reports and process managerial applications. The portal makes use of IFS, which is its work horse. As Skoda moves into the new markets of Russia, China and India, it will depend on data mining to assess marketing strategies and manage production and inventories.
Vodacom’s business intelligence is used to analyze and manage the 54.7 petabytes of data it carries a day. The company uses Roambi to provide BI services to its customers. The information produced by Roambi can be accessed from a number of mobile devices. The company is also expanding into a new market for services called M-PESA, which allows cell phone users to transfer money through their cell phones to others on the same network without the use of banks or money couri-ers. Vodacom’s BI systems will be crucial to capturing as much of the M-PESA market as possible by determining what areas are seeing the greatest increase in use and what amounts of money are being transferred where.
Business intelligence is crucial to the operation and continued existence of all four companies.

5
INDUSTRYTELECOMMUNICATIONS
INDUSTRY RANKING 121
MARKET SHARE 31.2%
NUMBER OF EMPLOYEES 266,590
GLOBAL REACH 220 COUNTRIES

AT&T is a telecommunications giant that operates all over the world. The company provides a variety of services which include wireless communications and network operation, data services and network operation, fixed line voice services, and computer/IT services. They are currently the industry leader in fixed line voice communications and the second-largest wireless carrier by sales with about 85 million subscribers. In this fiercely competitive industry with rival companies such as Verizon, QWEST Communications, and Sprint Nextel, AT&T boasts over $120 billion in sales. A 5 year deal with Apple containing the exclusive rights to the iPhone was a key component in AT&T’s wireless market share of 31.2%. Acquisitions of various companies have strengthened the company’s position both in the states and abroad.
In 2009, AT&T purchased the wi-fi service providers Wayport and Centennial Communications to help its position in the Caribbean. A few years later in 2011, AT&T announced a plan to pur-chase T-Mobile in order to improve its mobile network in the United States. These acquisitions demonstrate AT&T’s strategy to focus on the potential growth of the wireless segment rather than their dominant market of wired line services in which they hold 30.5% market share and a 7% lead over their next competitor. The successes and growth opportunities present for AT&T have lead to an increasingly expanded global footprint and employee network. There are currently 265,590 employees worldwide and according to the American Business Award, AT&T’s IT organization is one of the largest in the world, with excess of 30,000 resources. These employees monitor opera-tions in more than 220 countries and even 135 cruise ships. The sheer amount of data generated from this enormous footprint necessitates the use of business intelligence.
WHY DOES AT&T NEED BUSINESS INTELLIGENCE?Enormous amounts of data are transferred via AT&T each day. According to their
website they carry 23.7 petabytes (23 million gigabytes) of data traffic on an average business day. This traffic spans multiple continents and countries and has 99.999% reliability. AT&T must sift through all of that data to find information containing patterns, relationships, and trends. Somewhere in all of this data are trends on which phones are the most popular on their network, where dropped signals are occurring, contract prices that could produce greater revenues, and more. AT&T must use business systems to
process all of the data it has access to in order to deliver the information to the departments where it can best be used.
WHAT BUSINESS INTELLIGENCE SYSTEMS ARE AVAILABLE?There are three types of business intelligence tools. Reporting tools are programs that read data from
a variety of sources, process that data, format it into structured reports, and deliver those re-
AT&T CEORandall Stephenson

7
ports to the users who need them. These tools are used primarily for sorting, grouping and as-sessing data. Data-mining tools process data using sophisticated statistical technique and search for patterns and relationships among data. A third major BI tool is based on knowledge manage-ment. Knowledge-management tools are used to store employee knowledge and make it available to those who need it, wheter it be employees, customers, auditors, etc. This tool gets data from human knowledge rather than facts and figures.
WHAT ARE TYPICAL REPORTING APPLICATIONS? As mentioned earlier, reporting applications sort group filter and format information. AT&T uses a variety of reporting tools in daily operations. In fact, they have recruited their customers to help in reporting data. The company created a mobile application known as “Mark the Spot” that allows users to provide feedback about their network experiences linked to their geographical location. As seen in the following picture, problems are clustered together into categories such as dropped call, no coverage, can’t connect to data, etc. This tool allows data in the form of customer com-plaints to be sorted into predetermined clusters, processed, and delivered to AT&T in order for the company to make necessary changes. It also allows AT&T to filter data by location and know the exact location of problem areas. Another reporting tool used by AT&T is SharePoint services. Among other things such as provid-ing workflow and collaboration tools, Microsoft SharePoint allows the company to manage and sort data in addition to filtering data via searches so that employees can find the information they need. By grouping data and improving how the information is stored, this reporting tool allows faster company response time to data retrieval and various questions. This ease of access to in-formation and data collection allows employees to quickly analyze data and then produce reports. Overall, these reporting tools allow for intelligent and strategic decision making.
WHAT ARE TYPICAL DATA-MINING APPLICATIONS?AT&T operates a number of applications in order to find patterns and relationships using data mining. In broad terms, the company must use data mining technology to process the large amounts of data collected in telecommunications. AT&T has some of the largest databases in the world, so much so that they actually win awards for it like the one given by Winter Corpora-tion. Specifically, AT&T developed a controversial tool called Hancock a few years ago that mined gigabytes of telephone and internet records. The company then went through millions of records to find patterns they called “communities of interest.” We may be more familiar with these today as calling circles, or your “five,” but it is basically a record of who is talking to whom. The tool was also developed to see if certain “new: customers called the same numbers as old customers who had been cut-off or fraudulent. Hancock could mine various forms of data from calling records, IP addresses, and even physical movement due to cell tower use. This data tool would eventually come under serious fire and debate once the NSA demanded access to these records in order to spot suspected terrorists.
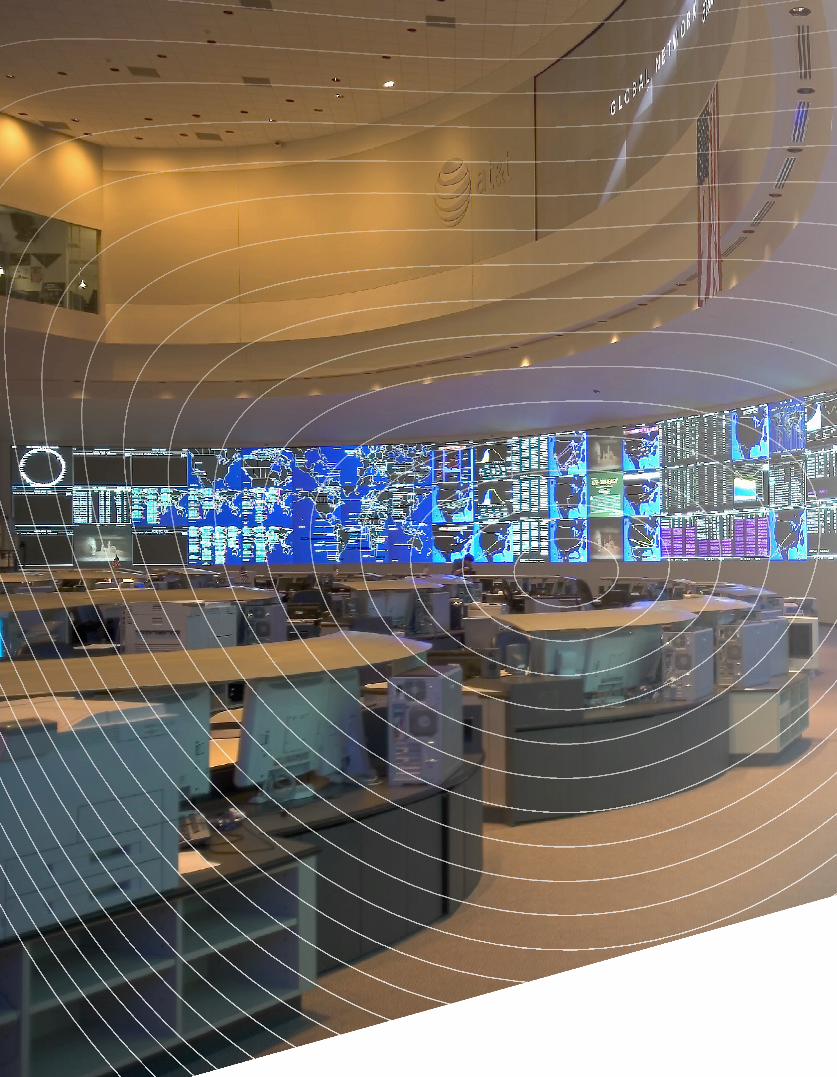
In recent years, AT&T labs have even moved data mining into the field of biometrics. Biometrics are qualities/data used to identify a person or a person’s identity. This ranges from fingerprints, to retina scans, and face recognition software. AT&T is developing identity authenti-cation applications for online customers with forward facing cameras on their devices. When you
look into the camera, not only will it process data to recognize your face, but it will also monitor your facial mannerisms and lip activity for increased accuracy. The company is also marketing this project development as an indexing tool. The program is able to discover scenes in the movie “Pretty Woman” in which Julia Roberts wears varying clothing via data mining. This is just one example in which AT&T is actively working on that requires data mining.
Finally, AT&T uses data mining for security purposes. The company’s award winning business intelligence technology Aurora monitors the entire global network. It predicts cyber attacks and alerts users and AT&T employees. Aurora processes over 1.6 petabytes of information a day and allows AT&T to be proactive rather than reactive when it comes to online security. It is able to mine data and translate it into meaningful information for network administrators and security monitors. WHAT IS THE PURPOSE OF DATA WAREHOUSES AND DATA MARTS?AT&T’s data warehouse holds years of phone records over their network. In some instances, this data has to be collected to detect fraudulent uses of calling cards or track kidnapping calls. Other times, AT&T employees use this data to look at call volumes and plan network expansions, check for billing errors, and calculate new prices for customers. Data enters the warehouse in real time to allow for accurate answers to questions in-stantly. Before the introduction of the data warehouse, AT&T had to wait weeks for billing reports to see if certain ads affected sales.
Now, the company can watch growth on the fly. In 2004, AT&T had a data warehouse named Daytona that held 96 terabytes and was one of the largest data warehouses in the world. Now, the
9
company uses DataDepot to generate warehouses from streaming data. The depot extracts data from various sources, puts it in a common format, and loads the data into database tables. This allows any data stream to be recorded since they are all reformatted. It also allows each database table to be tracked and kept in order. Not only does it take in hundreds of millions of records a day, it also keeps track of data in two year tables. Having an organized and large data warehouse allows AT&T to capture and record tons of data and then access it easily.
WHAT ARE TYPICAL KNOWLEDGE-MANAGEMENT APPLICATIONS? Knowledge management is the process of creating value from data and sharing that knowledge with others. One of the most important functions in KM applications is indexing, or attaching keywords to data in order to provide quick answers to queries. AT&T is currently in the process of creating a KM application known as MIRACLE. This project uses a content analysis engine to index all kinds of media content, from YouTube, TV shows, and movies. By assigning metadata to multimedia and then indexing it, AT&T can determine how long the average commercial is in cer-tain shows and at what intervals they occur. These innovative projects in KM are only some of the ways AT&T is using research and development to change how we look and where we look for data.
Another example of a KM application is AT&T’s ACE expert system. An expert system uses if…then decision making created by experts to solve problems. ACE is designed to track signals from telephone cables and provide reports on downed lines. AT&T can then use these reports to send maintenance to the right places in record timing. They also use ACE to predict potential trouble spots in the network from cable signals. The data for each cable is run constantly and automati-cally by a computer system and a data management and report generation system. Overall, AT&T uses their expert system ACE to systematically solve problems and assign tasks to employees from if…then analysis based on current data and governing rules. When certain conditions are present, ACE knows just how to respond.

HOW ARE BI APPLICATIONS DELIVERED?AT&T delivers business intelligence applications in a few ways. First, AT&T can place BI apps in the app store for various phones, like the itunes app store, if the company intends end users to contribute to their data. A great example of this would be the previously mentioned “Mark the Spot” app that users can download and then participate in data contribution and report generation. Another option for AT&T when transferring BI applications is a portal. AT&T has created portals with automated disaster recovery and the encryption security so employees and businesses that license their product can upload and download applications safely at all times. These portals allow for increased visibility for applications and allow efficient operations in real time.

11

13
INDUSTRY VESSEL MANUFACTURING
NUMBER OF EMPLOYEES 2,452
GLOBAL REACH 36 COUNTRIES

THE AUSTRAILIAN-BASED AUSTAL CORPORATION was strictly a high speed commercial vessel manufacturer before it extended its international reach to the United States. Austal USA was built in Mobile, AL in 1999, and immediately began to market its altered vessel as a new class of war-ship, able to maneuver in shallow waters at high speeds. This type of marketing proved successful as the defense spending focus shifted from larger vessels to smaller, less expensive ships. From 2009 to 2010, during a period where economic unrest had decimated the commercial vessel industry, Austal’s operating profit rose from $9.166 to $37.132 million. Austal USA revenues increased 17.9%, and basic earnings per share jumped from 5.0 to 20.3 (Annual). Just this past January, Austal USA was awarded a $432.1 million contract for the possible future production of nine additional Litto-ral Combat Ships (LCS). Austal USA already holds a contract for the production of ten Joint High Speed Vessels (JHSV) (Browne). With the new contract in hand, Austal USA announced plans for a $116 million expansion of its current facilities, allowing for the hiring of 2,000 additional employees (Scheurich). Austal USA currently has around 1,500 employees. The US Department of Defense is rumored to order as many as 55 LCSs over the next twenty years. Austal USA plans to win as many of those contracts as possible, and is pushing its facility to eventually meet a production goal of de-livering one LCS and one JHSV every six months.
WHY DOES AUSTAL NEED BUSINESS INTELLIGENCE?Austal USA is a National Defense contractor who builds ships for the armed services. As with any organization working directly for the government, tracking all associated records is essential. The government requires detailed updates on cost and schedule, and audits are routinely conducted in order to ensure that reports are accurate. All inventory purchased for building the ship is considered government property, so Austal has responsibility not only to the company but to the taxpayers to properly document and store it. Security is a major concern. No document is to ever be released outside of the property or into the wrong hands. This is especially complicated at Austal USA by the fact that Austal Corporation is a foreign-based company. Their headquarters is located in Perth, Australia. There are certain documents and procedures that Austal USA cannot share with the rest of Austal Corporation as they contain interests of the United States Military. So as one can imagine, business intelligence systems are utilized all over the place at Austal.
Shipbuilding is a long process and is very capital-intensive at the early stages. Certain items, includ-ing engines and computer systems, can require a year’s advance notice to supply in order to be ready for installation in the ship at the proper time in the build sequence. Austal could not afford to build the entire ship and then ask the government to purchase the finished product. On the other hand, the government is not willing to pay everything in advance and just hope that Austal comes through on their end of the deal. Instead, Austal’s pay structure is governed by the Earned Value Manage-ment System (EVMS). Every week the foreman turn in their “status”, or progress of percent complete for a given section of the ship. They also turn in the amount of man hours used to complete that percentage. The percentage is used to determine how many hours of the original budget they should
15
have “earned”. The amount used is matched against the amount earned to create their cost performance index, or CPI. Austal is paid based on percentage complete, or amount earned, but they are judged by that CPI. Defense contracts are won and lost based on performance. CPI is tracked and logged very closely for what is required and for Austal’s own interests. The last and final reason Austal USA requires business intelligence systems is simple: shipbuilding is a big process requiring massive amounts of capital, manpower, time, and other resources. In order to ensure all those resources are working together, and in the end the ship actually floats, intelligence systems are integral.
WHAT BUSINESS INTELLIGENCE SYSTEMS ARE AVAILABLE?Austal USA’s largest business intelligence system is called IFS. A quote from the company’s website reads, “IFS Applications – a sin-gle product that combines best-of-breed solutions with a complete suite of component-based ERP software (http://www.ifsworld.com/en-us/).” Austal USA is still a fairly young company; estab-lished in 1999, and was awarded its first military contract in 2005. They have yet to fully take advantage of everything IFS can do for the company. However, IFS is being utilized in the supply chain (purchasing and material), and those attributes will be discussed later in the paper. IFS incorporates all three business tools: report-ing, data-mining, and knowledge-management. Microsoft’s Office Suite is utilized as a reporting tool, among other things. Microsoft Sharepoint is a main knowledge management resource, and Ship Constructor could loosely be viewed as a business intelligence ap-plication.
WHAT ARE TYPICAL REPORTING APPLICATIONS?Austal has initialized the practice of hiring “Technical Support” operators for each production department: aluminum, pipe, elec-trical, HVAC, fitout, and joiner. This position is not like an Infor-mation Technologist, but they instead are in charge of tracking and analyzing all the metrics for their given department. They are the EVMS experts. They utilize Access/Excel as a way to store
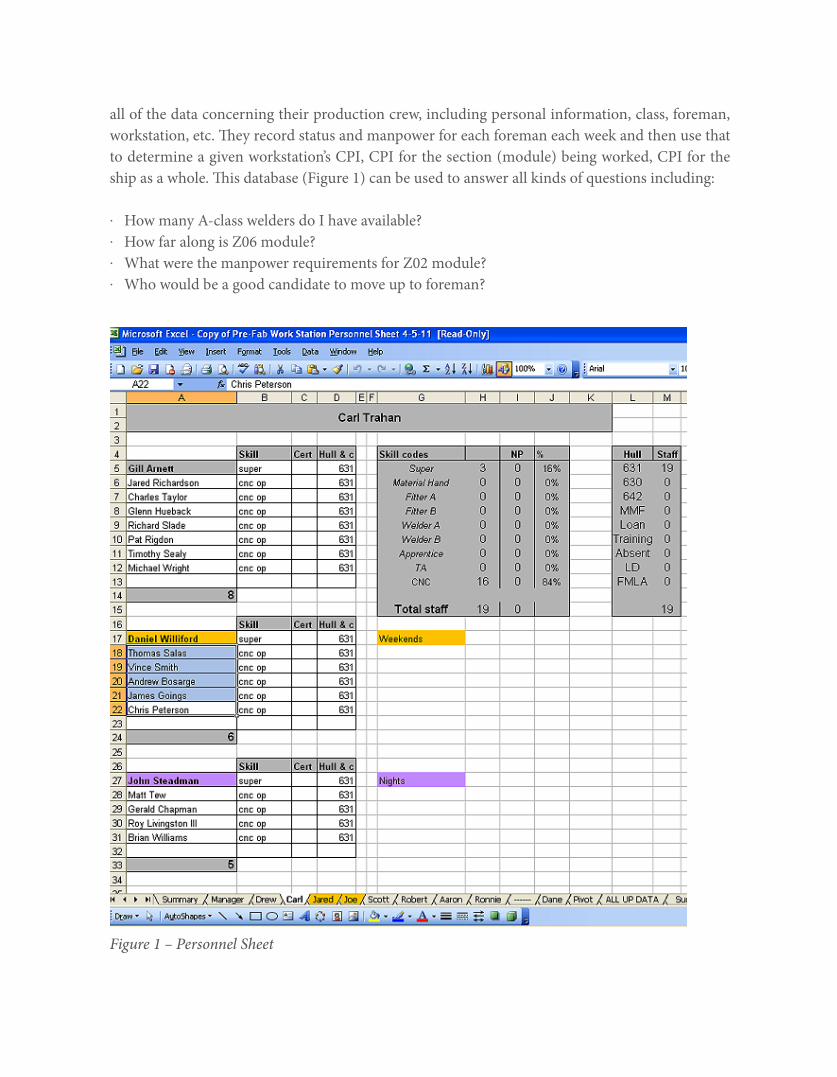
all of the data concerning their production crew, including personal information, class, foreman, workstation, etc. They record status and manpower for each foreman each week and then use that to determine a given workstation’s CPI, CPI for the section (module) being worked, CPI for the ship as a whole. This database (Figure 1) can be used to answer all kinds of questions including:
. How many A-class welders do I have available?
. How far along is Z06 module?
. What were the manpower requirements for Z02 module?
. Who would be a good candidate to move up to foreman?
Figure 1 – Personnel Sheet
17
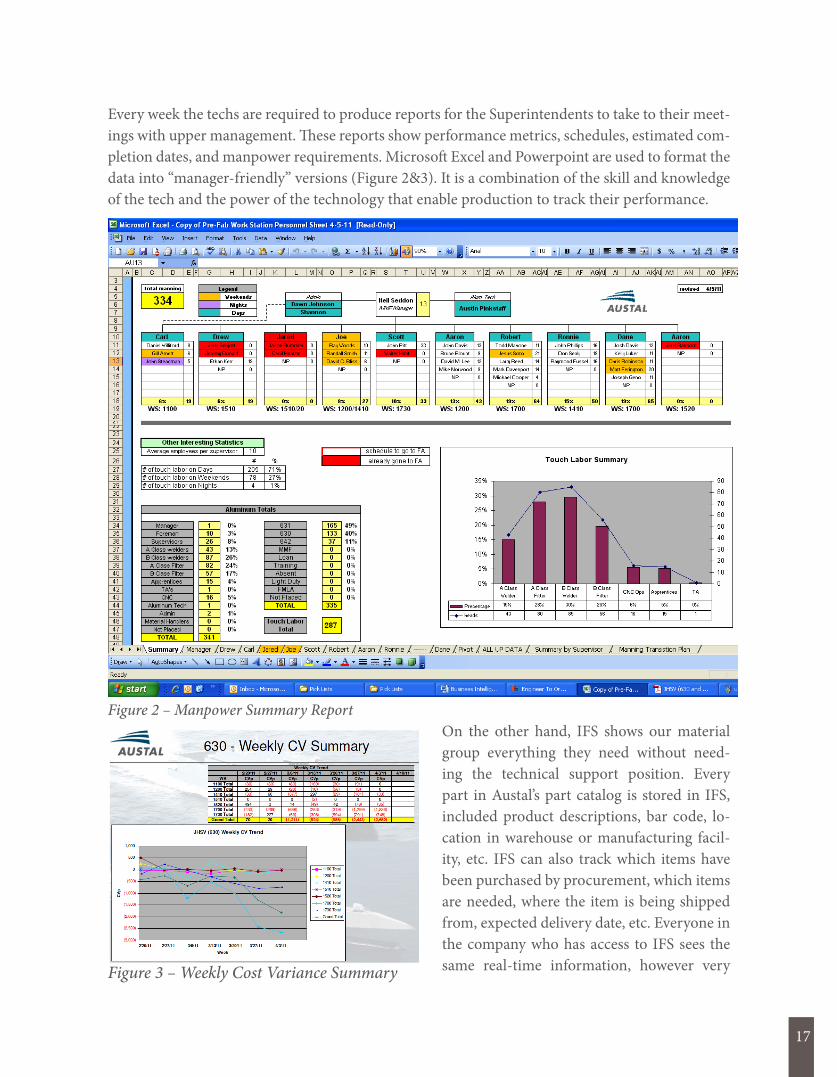
Every week the techs are required to produce reports for the Superintendents to take to their meet-ings with upper management. These reports show performance metrics, schedules, estimated com-pletion dates, and manpower requirements. Microsoft Excel and Powerpoint are used to format the data into “manager-friendly” versions (Figure 2&3). It is a combination of the skill and knowledge of the tech and the power of the technology that enable production to track their performance.
Figure 2 – Manpower Summary ReportOn the other hand, IFS shows our material group everything they need without need-ing the technical support position. Every part in Austal’s part catalog is stored in IFS, included product descriptions, bar code, lo-cation in warehouse or manufacturing facil-ity, etc. IFS can also track which items have been purchased by procurement, which items are needed, where the item is being shipped from, expected delivery date, etc. Everyone in the company who has access to IFS sees the same real-time information, however very
Figure 3 – Weekly Cost Variance Summary

few have access to all areas of IFS. Most departments only have access to their own functional areas. Therefore, IFS is similar to an Online Analytical Processing tool. Groups across the company can access the same data, and filter it to show just want they need, and IFS has the capability to make any and all calculations based on the filter. When engineering determines what material is needed for a given module, they send the material list to Business Integration. BI is the master controller of IFS for the company. BI inputs the material list into IFS. Production Control can then go in and place an order for the items needed by clicking boxes in IFS. IFS generates a notice for material to get the order ready. Material “picks” the order and marks the status change in IFS. From the time that material item is “clicked” and the e-mail sent, that means a demand has been created for that item, so no one else can go in and create a demand for that same item.
Figure 4 – IFS Inventory Listing Production Control also uses IFS to track ship schedules. Planners break the ship down into sec-tions, or modules. Each module is then broken down into a series of work packages. Work packages are organized by steps. Each step has a calculated budget to complete. The planners give the steps to the schedulers. They plug the steps into IFS which generates a unique charge code for each step. When a worker finishes the step they charge their time to that charge code. The schedulers plug all the steps into a master schedule for the shipyard. This schedule tells the production crew which steps to work and in what order to build the ship correctly. It sounds like a much simpler concept than it is. In reality, there are production areas working around the clock all over the yard. The mas-ter schedule has to coordinate all activities so the ship can come together without too much wasted waiting time. IFS allows everyone to see that same schedule so everyone can stay on the same page.
19
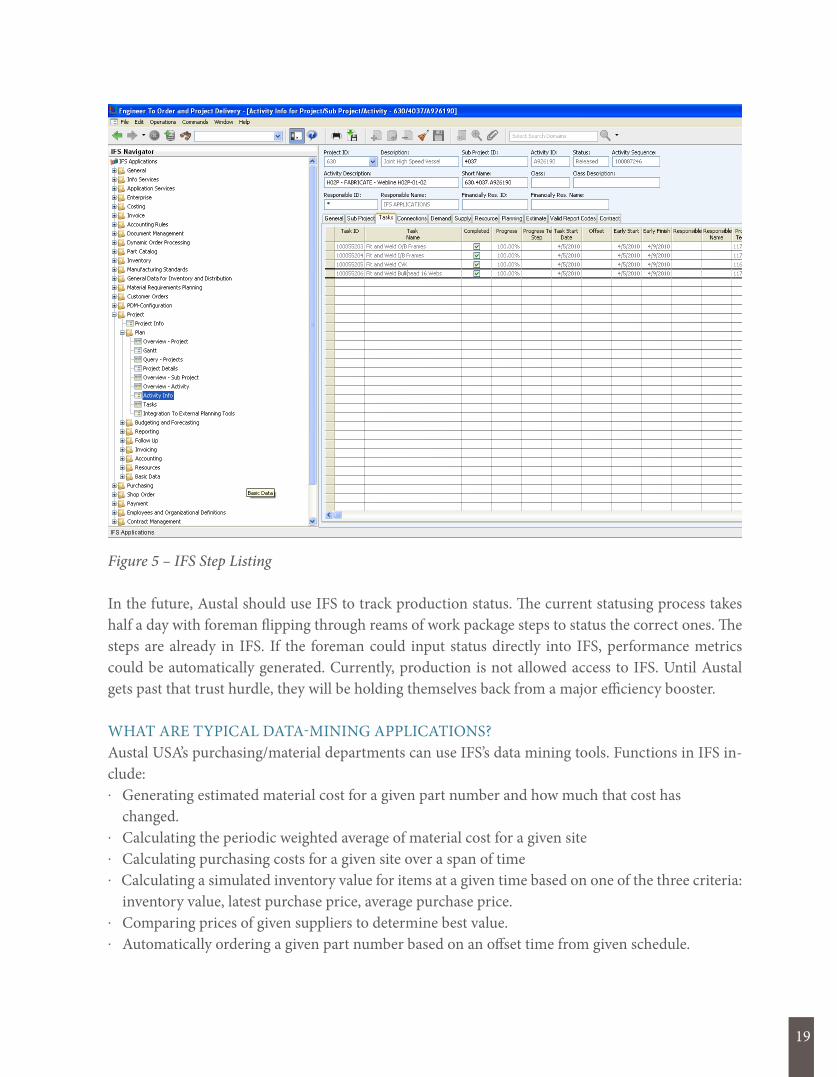
Figure 5 – IFS Step Listing
In the future, Austal should use IFS to track production status. The current statusing process takes half a day with foreman flipping through reams of work package steps to status the correct ones. The steps are already in IFS. If the foreman could input status directly into IFS, performance metrics could be automatically generated. Currently, production is not allowed access to IFS. Until Austal gets past that trust hurdle, they will be holding themselves back from a major efficiency booster. WHAT ARE TYPICAL DATA-MINING APPLICATIONS?Austal USA’s purchasing/material departments can use IFS’s data mining tools. Functions in IFS in-clude:. Generating estimated material cost for a given part number and how much that cost has changed.. Calculating the periodic weighted average of material cost for a given site. Calculating purchasing costs for a given site over a span of time. Calculating a simulated inventory value for items at a given time based on one of the three criteria: inventory value, latest purchase price, average purchase price.. Comparing prices of given suppliers to determine best value.. Automatically ordering a given part number based on an offset time from given schedule.

IFS also allows for future creation of business application tools for a specific business process.
WHAT IS THE PURPOSE OF DATA WAREHOUSES AND DATA MARTS?IFS acts as a data warehouse that produces a set of data marts. The data behind IFS is actually a series of Access tables. Not many of the workers at Austal ever see these tables. Business Integration is in charge of inputting, updating, and cleaning the data that goes into IFS so there are limited data integration problems. BI acts as the DBMS for IFS. IFS is then able to give its users clean data that is organized into data marts for each department. Each department has a tab in IFS with a drop down list of associated functions. When each department goes into IFS, they can access their specific data mart and have all the applicable information they need without having to comb through items that pertain solely to other departments. Narrowing down to only applicable data allows IFS to run ef-ficiently, even with many users accessing the database at the same time. It would be quite a bit more cumbersome to query the Access tables themselves that back up IFS.
WHAT ARE TYPICAL KNOWLEDGE-MANAGEMENT APPLICATIONS?The Engineering Department at Austal USA uses Sharepoint as a knowledge-management tool. Engineering can house all their drawings, instructions, list of materials, and 3D models in this one place where everyone who has access can see them. Sharepoint allows indexing by subject type (drawings, models, etc.), then further categorizes by discipline (structure, pipe, electrical, etc.), and breaks that down even further to the section of the ship (module). Certain areas allow users to see what engineering is working on before it is released. The model section, for example, is very much an unfinished product. It is a 3D model, produced by Ship Constructor software, that allows Pro-duction Control to go and view so they can plan future work. Engineering will add to the model periodically as new specifications become available, or say, for example, the Navy wants to add a new piece. Some drawings are labeled “pending” so everyone will know that Engineering has fin-ished their part on them, but they have not been through all of the sign-off processes yet. In order to signal that a document is ready and has been verified, Sharepoint adds a bright green “NEW” label. There are also in between “readiness” labels, such as “Ready to Issue”, “Ready to Process”, “Issued.” Many of the military ship designs are modeled from previous Austal commercial vessels, created and designed over in Australia. Sharepoint allows those modelers an ocean away to add their docu-ments to the file for those over at Austal USA to access. It is an incredibly versatile tool.
Sharepoint is not solely used by Engineering. There is also a section for Vendors, indexed by com-pany, that allows everyone to see detailed sketches and specifications about their products. Gov-ernment auditing group, ABS, has their own section where they house all their procedures and requested drawing modifications. Production Control is responsible for creating Build Strategies and Build Diagrams that show Engineering how the ship is to be broken out into modules and what order to build in. Those documents are mixed in with Engineering’s drawings, but are labeled as Production Control property. Sharepoint adds a level of data integrity, in that files cannot be altered except by their creator. Sharepoint access is only granted to those who prove they need it for their functional areas. There is too much information available to let everyone see it.
21
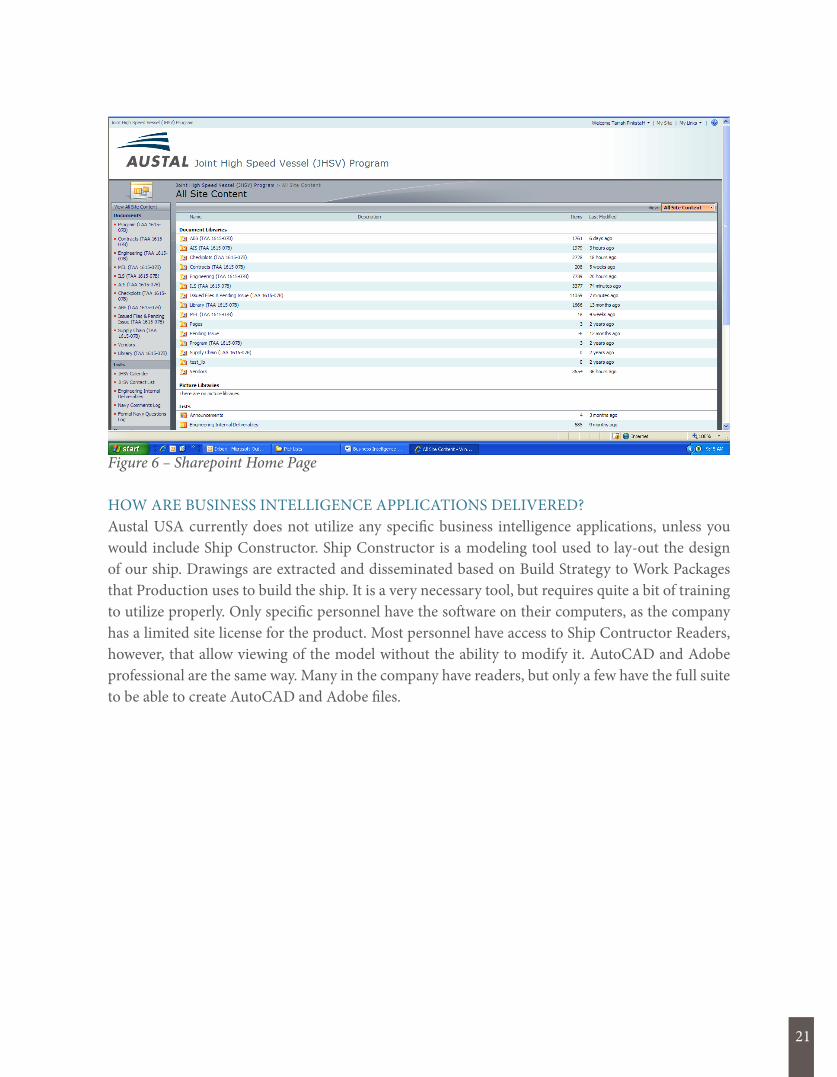
Figure 6 – Sharepoint Home Page
HOW ARE BUSINESS INTELLIGENCE APPLICATIONS DELIVERED?Austal USA currently does not utilize any specific business intelligence applications, unless you would include Ship Constructor. Ship Constructor is a modeling tool used to lay-out the design of our ship. Drawings are extracted and disseminated based on Build Strategy to Work Packages that Production uses to build the ship. It is a very necessary tool, but requires quite a bit of training to utilize properly. Only specific personnel have the software on their computers, as the company has a limited site license for the product. Most personnel have access to Ship Contructor Readers, however, that allow viewing of the model without the ability to modify it. AutoCAD and Adobe professional are the same way. Many in the company have readers, but only a few have the full suite to be able to create AutoCAD and Adobe files.


23
INDUSTRYTELECOMMUNICATIONS
INDUSTRY RANKING LEVEL 3 BEE CONTRIBUTION
MARKET SHARE 58%
NUMBER OF EMPLOYEES 7,300
GLOBAL REACH 67 COUNTRIES
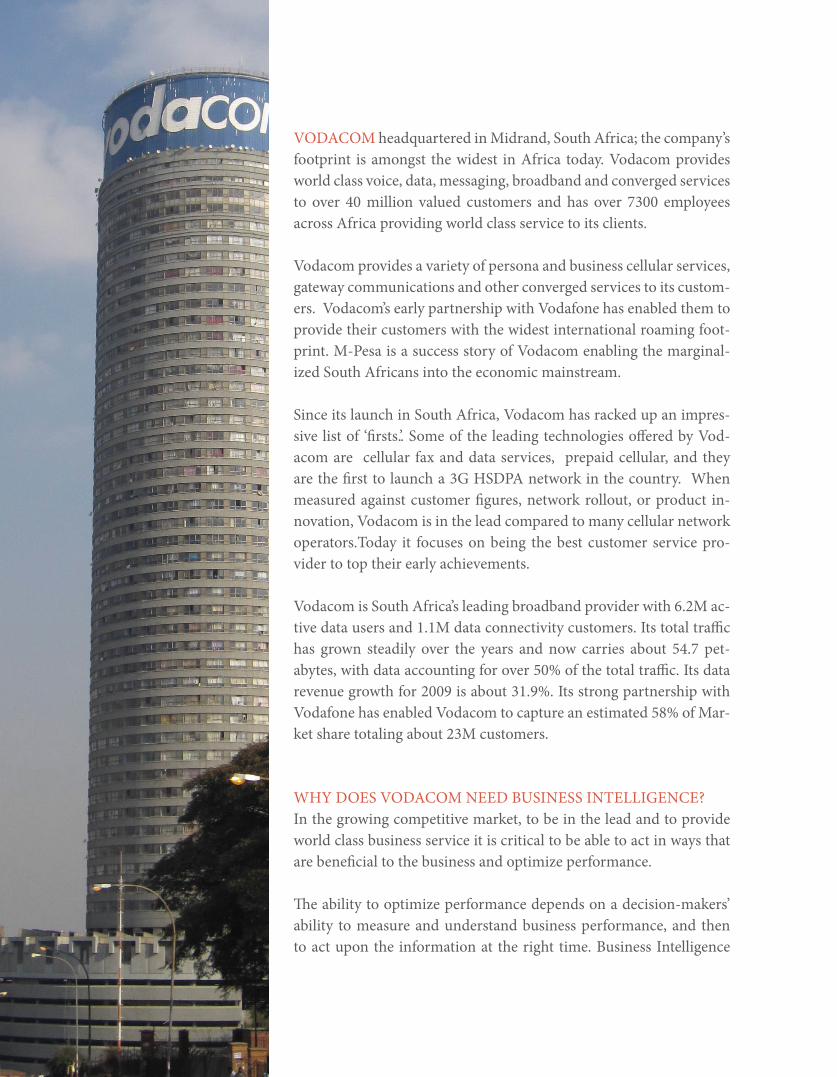
VODACOM headquartered in Midrand, South Africa; the company’s footprint is amongst the widest in Africa today. Vodacom provides world class voice, data, messaging, broadband and converged services to over 40 million valued customers and has over 7300 employees across Africa providing world class service to its clients.
Vodacom provides a variety of persona and business cellular services, gateway communications and other converged services to its custom-ers. Vodacom’s early partnership with Vodafone has enabled them to provide their customers with the widest international roaming foot-print. M-Pesa is a success story of Vodacom enabling the marginal-ized South Africans into the economic mainstream.
Since its launch in South Africa, Vodacom has racked up an impres-sive list of ‘firsts.’. Some of the leading technologies offered by Vod-acom are cellular fax and data services, prepaid cellular, and they are the first to launch a 3G HSDPA network in the country. When measured against customer figures, network rollout, or product in-novation, Vodacom is in the lead compared to many cellular network operators.Today it focuses on being the best customer service pro-vider to top their early achievements.
Vodacom is South Africa’s leading broadband provider with 6.2M ac-tive data users and 1.1M data connectivity customers. Its total traffic has grown steadily over the years and now carries about 54.7 pet-abytes, with data accounting for over 50% of the total traffic. Its data revenue growth for 2009 is about 31.9%. Its strong partnership with Vodafone has enabled Vodacom to capture an estimated 58% of Mar-ket share totaling about 23M customers.
WHY DOES VODACOM NEED BUSINESS INTELLIGENCE?In the growing competitive market, to be in the lead and to provide world class business service it is critical to be able to act in ways that are beneficial to the business and optimize performance.
The ability to optimize performance depends on a decision-makers’ ability to measure and understand business performance, and then to act upon the information at the right time. Business Intelligence

25
(BI) plays a major role to predict, track, analyze, and present information as it relates to business performance. Mainly it provides the tools the company needs to translate data into actionable in-formation.
In such given environment the Business intelligence within a company has become key strategic enabler and crucial factor many companies success. With ever changing technology and customer trends Vodacom has been successful in achieving high growth in mobile broad brand, stronger customer and usage growth , and also has kept their cost program on track with their given busi-ness intelligence system.
WHAT ARE TYPICAL REPORTING APPLICATIONS SharePoint is a reporting tool used by Vodacom to give their business a single, shared workspace in which the organization can collaborate, create, share and update information and documentation in a robust environment.
Within Vodacom they have team-oriented online platforms that help increase productivity and information sharing, this was mainly seen in the product development department where most workers were contracted. Vodacom has been successful in using share point to simplify their infor-mation management as well as increase the collaborative functionality among each other.
WHAT ARE TYPICAL DATA-MINING APPLICATION Vodacom selected Roambi to provide real time access of company data via their iPhones. By inte-grating with Roambi they have been able to provide customers with BI solutions in a high technol-ogy mobile reporting system. It quickly transforms your business reports and data from SAP, IBM, Microsoft and Oracle BI systems - as well as Excel, Sales force CRM and more - into interactive and intuitive mobile analytics, instantly delivered to any iPhone or iPad.
The company also integrated Roambi with Vodacom financial systems to display valuable business reports, network probing systems to provide real-time views of the cellular network, as well as sta-tistical Element Management systems to provide trending of cellular network performance.
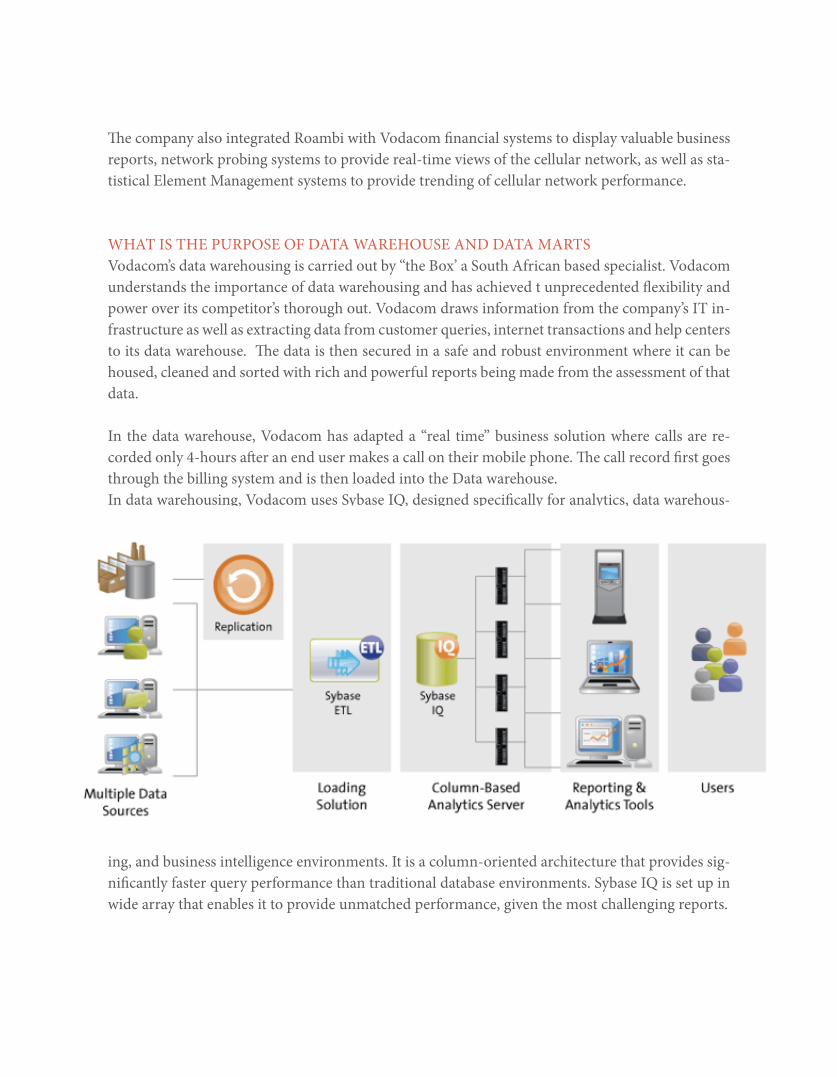
WHAT IS THE PURPOSE OF DATA WAREHOUSE AND DATA MARTS Vodacom’s data warehousing is carried out by “the Box’ a South African based specialist. Vodacom understands the importance of data warehousing and has achieved t unprecedented flexibility and power over its competitor’s thorough out. Vodacom draws information from the company’s IT in-frastructure as well as extracting data from customer queries, internet transactions and help centers to its data warehouse. The data is then secured in a safe and robust environment where it can be housed, cleaned and sorted with rich and powerful reports being made from the assessment of that data. In the data warehouse, Vodacom has adapted a “real time” business solution where calls are re-corded only 4-hours after an end user makes a call on their mobile phone. The call record first goes through the billing system and is then loaded into the Data warehouse. In data warehousing, Vodacom uses Sybase IQ, designed specifically for analytics, data warehous-
ing, and business intelligence environments. It is a column-oriented architecture that provides sig-nificantly faster query performance than traditional database environments. Sybase IQ is set up in wide array that enables it to provide unmatched performance, given the most challenging reports.

27
WHAT ARE TYPICAL KNOWLEDGE MANAGEMENT APPLICATIONS?Vodacom uses myLivelink as a knowledge management tool to create the best collaborative solu-tion. It has accessed the user friendly intranet to provide relevant and useful information online directly from Livelink Enterprise Server. Vodacom also makes use of Livelink Enterprise Server’s functionality (version control, audit trail, discussions, etc.) to support the overall optimization of its quality management system.


29
INDUSTRY AUTOMOTIVE MANUFACTURING
MARKET SHARE 5%
NUMBER OF EMPLOYEES24,714
GLOBAL REACH CZECH REPUBLIC, UKRAINE, INDIA, BOSNIA, HERZEGOVINA, KAZAKHSTAN, CHINA & RUSSIA
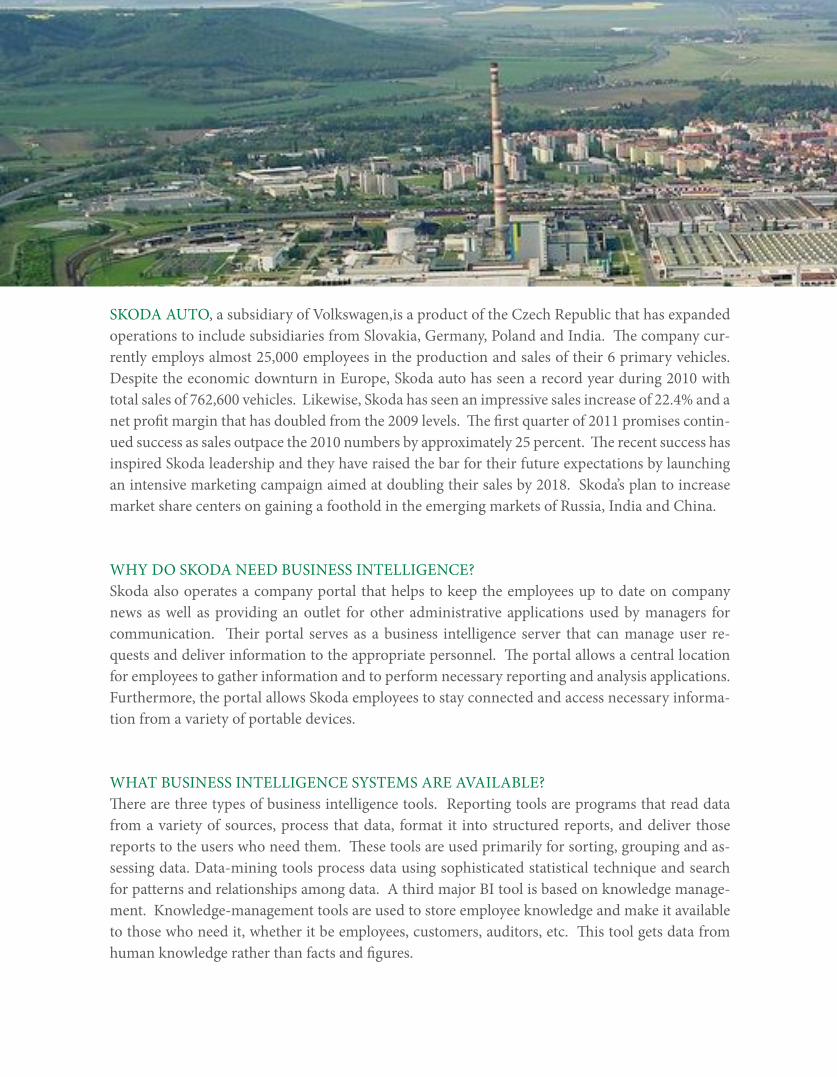
SKODA AUTO, a subsidiary of Volkswagen,is a product of the Czech Republic that has expanded operations to include subsidiaries from Slovakia, Germany, Poland and India. The company cur-rently employs almost 25,000 employees in the production and sales of their 6 primary vehicles. Despite the economic downturn in Europe, Skoda auto has seen a record year during 2010 with total sales of 762,600 vehicles. Likewise, Skoda has seen an impressive sales increase of 22.4% and a net profit margin that has doubled from the 2009 levels. The first quarter of 2011 promises contin-ued success as sales outpace the 2010 numbers by approximately 25 percent. The recent success has inspired Skoda leadership and they have raised the bar for their future expectations by launching an intensive marketing campaign aimed at doubling their sales by 2018. Skoda’s plan to increase market share centers on gaining a foothold in the emerging markets of Russia, India and China.
WHY DO SKODA NEED BUSINESS INTELLIGENCE?Skoda also operates a company portal that helps to keep the employees up to date on company news as well as providing an outlet for other administrative applications used by managers for communication. Their portal serves as a business intelligence server that can manage user re-quests and deliver information to the appropriate personnel. The portal allows a central location for employees to gather information and to perform necessary reporting and analysis applications. Furthermore, the portal allows Skoda employees to stay connected and access necessary informa-tion from a variety of portable devices.
WHAT BUSINESS INTELLIGENCE SYSTEMS ARE AVAILABLE?There are three types of business intelligence tools. Reporting tools are programs that read data from a variety of sources, process that data, format it into structured reports, and deliver those reports to the users who need them. These tools are used primarily for sorting, grouping and as-sessing data. Data-mining tools process data using sophisticated statistical technique and search for patterns and relationships among data. A third major BI tool is based on knowledge manage-ment. Knowledge-management tools are used to store employee knowledge and make it available to those who need it, whether it be employees, customers, auditors, etc. This tool gets data from human knowledge rather than facts and figures.

31
WHAT ARE TYPICAL REPORTING APPLICATIONS?The company portal serves as a reporting application because it allows a central location for em-ployees to gather information and to perform necessary reporting and analysis applications. Other typical reporting applications used by Skoda include: sorting, grouping, calculating, filtering & formatting (basic operations), OLAP, and RFM analysis.
WHAT ARE TYPICAL DATA-MINING APPLICATIONS?Skoda has already used a variety of information technology tools to help integrate their company’s processes. They are continuing this tradition as they prepare to use information technology to help integrate their advanced research and development systems. For example, Skoda purchased a high

performance computing (HPC) cluster that they are using to develop prototypes of new vehicle designs. Their objective is to take advantage of the system’s capabilities by ensuring that every-one is able to access the information they need in a format they need. The marketing department specifically uses cluster analysis in their work. They are currently advertising available positions in information technology for analyzing and determining the requirements to interface with their HPC computer. In addition, they are also looking for personnel to develop tools to launch, monitor and control their information technology applications. Overall, Skoda demonstrates a clear under-standing of IT and their objectives are clearly aimed at the development of an integrated business model that focuses on IT support.
WHAT IS THE PURPOSE OF DATA WAREHOUSES AND DATA MARTS?Data warehouses are facilities that prepare, store, and manage data specifically for reporting and data mining. Data marts are facilities that prepare, store, and manage data for reporting and data mining for specific business functions. The portal created by Skoda is a data warehouse and data mart for their employees.
WHAT ARE TYPICAL KNOWLEDGE-MANAGEMENT APPLICATIONS?Knowledge management is the process of creating value from data and sharing that knowledge with others. One of the most important functions in KM applications is indexing, or attaching keywords to data in order to provide quick answers to queries. In order to keep employees informed, Skoda has established computer “information islands” that allow personnel that do not have routine ac-cess to a personal computer to stay informed of company news and other important information. Furthermore, the portal allows Skoda employees to stay connected and access necessary informa-tion from a variety of portable devices. These capabilities will foster continued communication and information sharing despite the increasing distances between facilities as Skoda enters the new markets. Another advantage created by the portal is that it will allow personnel to pull key reports from the business intelligence systems from any place they can get to the portal which includes many cell phones and many other PDA applications. Likewise, the portal is capable of pushing information to the appropriate personnel in the form of exception alerts.
HOW ARE BI APPLICATIONS DELIVERED?Business intelligence tools process data to get application results. Business intelligence applications are delivered through a BI application server, pull or push, alerts, report servers and portal servers. Business intelligence servers use metadata to decide which users get results on which schedule. Skoda Auto utilizes a portal server to process and store information.

33
international and domestic it usage comparison AT&T versus VODACOMTelecom is a highly competitive industry and companies are utilizing datawarehousing and data min-ing applications to gain competitive advantage in the market. Data warehouses collect call detail records and network performance data, and from there the data can be used for a variety of purposes, the most important of which are fraud detection, network fault isolation and prediction, marketing, and customer service. Hundreds of millions of records pour into these data warehouses, and some applications, such as fraud detection and network management, require it to be analyzed in real time. This presents a daunting challenge to telecom companies. Both AT&T and our international compa-ny Vodacom site SharePoint as a tool to manage and sort data and reports. However, each company has their own program to create reports from data and network performance. When data is collected and put into storage, both companies use large data warehouses. AT&T has created a gigantic data depot to house data for various projects. Vodacom takes a different approach by outsourcing their data warehouse to “the Box.” Both companies realize the necessity for a data warehouse, but each takes a different approach on the management of such warehouses. AT&T prefers the control and responsibility of managing their own data warehouses while Vodacom feels it is more cost efficient and effective to outsource their data warehousing. Marketing applications are centered on attracting new customers and retaining existing customers. Because attracting a new customer is many times more expensive than retaining an existing custom-er, effectively mining customer data to determine the most profitable customers, and their specific product needs, is crucially important. Data mining applications are used to determine whether a particular customer is primarily a personal or business user, how profitable that customer is, and how likely that customer is to churn, or leave their existing provider for the competition. Armed with this information, telecom marketers can target their efforts to those demographics they can least afford to lose, or stand to gain the most from attracting as new customers. Data warehouses also give mar-keting types important data on the impacts of new promotional pricing plans. Certain calling plans may have detrimental effects such as cannibalizing existing customers or attracting customers more prone to non-payment, though data mining efforts can identify customer profiles that would prove profitable and allow for targeted promotional efforts. Effective fraud detection can result in considerable cost savings to telecoms. The types of fraud typi-cally experienced by telecoms are subscription fraud and superimposition fraud. Subscription fraud is the opening of an account by an individual with no intention of paying, whereas superimposition fraud is the illicit use of an existing customers account by an unauthorized user. This latter type of fraud is a much greater concern to telecom companies, and a variety of methods are employed to

35
combat it. Call detail records are mined to create a customer profile, which allows for automated deviance and anomoly detection. Speciallized visualization tools enable users to more easily iden-tify patterns of fraud. Detection of network faults is an important aspect of providing superior service to customers, since network outages and service disruptions cause a great deal of dissatisfaction. While in the past expert systems were used to help diagnose network problems, these have increasingly been replaced with data mining applications. Ever more complex telecommunication networks have become increasingly more difficult to maintain, as a single fault may lead to a cascade of fault alarms. Data mining applications can automatically analyze these faults and quickly narrow down the underlying cause. For Voip providers, this type of analysis is used to assess the performance of the underlying data networks carrying the providers traffic. Ensuring high quality of service is crucial to these providers as they must compete with many free services, and thus must compete by differentiating their service quality. Therefore, both companies use knowledge management tools to aid in problem solving to provide high levels of satisfaction during the customer service process.Marketing, fraud detection, and network performance all directly effect the level of customer ser-vice telecom companies provide, as the usefulness, trustworthiness, and reliability of a provider are all important considerations to telecom customers. Data warehouses give executives the tools they need to segment their customer base and provide proactive, rather than reactive, customer service. Going forward, expert systems will likely continue to be replaced with data mining applications, as data mining is both more effective and less expensive than these systems. Business intelligence in the telecom industry will continue to evolve as technology changes, though these changes must be tempered by increasing public apprehension over the use of customer data. Effective BI solutions in the telecom realm will be those that are tailored to the unique characteristics of the industry rather than those systems based on generic BI packages. As new mobile apps are created, both companies can continue to use app stores to aid in data mining and business intelligence projects. It appears both companies we analyzed understand the importance of using business intelligence in the telecommunications industry. AT&T has begun to use their research and development in BI applications and systems to create additional BI products to sell to other companies. Vodacom is growing rapidly and beginning to see the importance of business intelligence. While providing their own BI systems is currently not Vodacom’s strength, they outsource and purchase the neces-sary business intelligence tools to be competitive in the telecom industry. Therefore, both foreign and domestic companies place similar importance in business intelligence, but differ in the ways they obtain and use various tools.

SKODA versus AUSTALA subsidiary of Volkswagen, Skoda auto is a product of the Czech Republic that has expanded op-erations to include subsidiaries from Slovakia, Germany, Poland and India. Although Austal USA is domestic, Austal as the overall entity is foreign-based just like Skoda. Both companies are using international outreach as a major source of revenue growth. In fact, Austal’s USA division is actu-ally its most lucrative, even though the majority of the company’s holdings are based in Australia. International outreach requires the company to close many communication gaps and the easiest way to do that is to offer knowledge management tools such as web portals. The KM tool Austal uses is Sharepoint. Through Sharepoint, Austal workers can pass information back and forth be-tween Austraila and the United States, and use real time document sharing, as long as they have a connection to the internet. Sharepoint is also used to coordinate activties with vendors and help make decisions about which suppliers to use, which materials are appropriate and so-on. Skoda operates a company portal that helps to keep the employees up to date on company news as well as providing an outlet for other administrative applications used by managers for communication. Their portal serves as a business intelligence server that can manage user requests and deliver in-formation to the appropriate personnel.
Big auto manufacturing requires immense amounts of supply chain management. Skoda uses IFS, an ERP system . IFS allows for inventory management, correlation between procurement, logistics, and production areas, data warehousing with the ability to data-mine, supplier information and statistics, cost accounting, and much more. Both the defense industry and automotive industry are extremely competitive. There is a lot of money at stake, and performance is key. Both companies would require performance metrics tools and analysis and hopefully entire departments focused on simply watching the numbers and seeing if the business is growing or standing still.
One large difference to note between these two industries is the fact that defense is contract-based, while automotive sales are measured per car. Once a shipyard is awarded a contract, they have a little bit of breathing room to focus on building a quality product instead of continuous marketing. The automotive industry is never stable. Skoda company use data-mining tools like cluster analysis and neural networks, which allows Skoda to analyze current trends and decide which direction to move for future model design. Skoda purchased a high performance computing (HPC) cluster that they are using to develop prototypes of new vehicle designs. Their objective is to take advantage of the system’s capabilities by ensuring that everyone is able to access the information they need in a format they need.
The marketing department specifically uses cluster analysis in their work. They are currently ad-vertising available positions in information technology for analyzing and determining the require-ments to interface with their HPC computer. In addition, they are also looking for personnel to de-velop tools to launch, monitor and control their information technology applications. Austal is not nearly as short-term focused. Their company milestones are stretched out with years in between,

37
while Skoda’s probably change every few months. Also, because one ship takes two years to com-plete, inventory management is not quite as critical. It is okay for Austal to keep large inventories in reserve because they know what the customer has ordered. Automotive manufacturers should run as close to just-in-time as possible. It is preferable to have the least amount of inventory because it is costly to house and depreciates almost immediately. There is not enough room to store excess material on the lines, and on the flip side, it is not wise to over-produce and have cars sitting out in the parking lots aging. Another reason for Skoda to look into an ERP system is that it is about the only way to ensure just-in-time production.
discussionBusiness intelligence systems are a main driver of competitive advantage for businesses in just about every industry. The need for BI grows with the scale of business done by the firm. With size-able quantities of data being generated by a company, business intelligence systems allow a user to generate reports out of organized data, detect trends and patterns, quickly access expert knowledge, and manage workflow. The information generated by BI can inform decisions on purchasing, mar-keting, production, inventory management, and company infrastructure. Smart companies use this information to eliminate inefficiencies, isolate opportunities and plan for the future. The more a BI system is integrated throughout departments within a company, the more efficient a company can become. This is easier said than done, especially for businesses that have existing, albeit out-dated, information systems and processes that would have to be seamlessly taken over.
The manner in which BI systems are controlled is an important factor in the success of the system. If a company exerts too much control over the system, bottlenecks can develop that detract from the system’s effectiveness and efficiency. BI systems that allow at least a limited amount of input from lower level managers can generate data faster than systems that rely on a single point of data entry.
The four companies analyzed by BizzIntel utilize business intelligence to varying degrees. BizzIntel has developed the following commentaries and suggestions for the companies below.
AT&T:AT&T’s business intelligence systems rank among the best in the world. Their decision to intro-duce MarkTheSpot to provide information on poor service areas has allowed them to mine richer data to be used in the extension of their wireless network and minimization of network failures. The company’s use of data-mining of customer call records will likely remain a topic of criticism, and the company will have to be careful with what it does with the information it derives in order to prevent future blow-back in the form of customers angry about privacy violations. This may become more and more difficult as data mining continues to develop as a tool for driving competi-tive advantage.
AUSTAL:Austal USA’s use of IFS to manage inventory, procurement and project completion tracking has allowed it to become the most profitable division of Austal. The company has done a good job of utilizing the software to minimize cost and build time, while maximizing efficiency. One area that Austal USA could improve on is eliminating the bottleneck that occurs at the point of input-ting production status into IFS. Currently, Foremen cannot input the status directly into IFS, and

39
instead must send information first to techs to input into the system. This wastes a lot of time that could otherwise be used supervising the build of the ship. Austal should allow its foremen to update IFS directly, which would both save time on the floor and remove a bottleneck that delays updates to the system. Austal should also increase access to its knowledge management system, SharePoint. Right now, only the engineering department has access to SharePoint, while the rest of the organization goes without. Allowing knowledge management tools such as SharePoint to be utilized throughout the organization would increase efficiency by improving problem solving and allowing best practices to be utilized.
VODACOM:Vodacom’s decision to outsource its data warehousing to “the Box” for data warehousing may be a source of weakness for the company in the future. The company should invest in internalizing the data warehousing function to ensure continuity of operations and greater flexibility and control of their information. Vodacom’s data mining capabilities are extensive. One area in which Vodacom should implement data mining is in the growing use of M-pesa to transfer funds without the use of a bank account. The M-pesa represents what may be the tip of the ice-burg for alternative bank-ing. Vodacom should carefully mine data concerning the growth of M-pesa, including what areas are seeing increased usage of the system, who the users are, and what amounts of money are being transferred. Information gleaned from the data could be used to inform decisions about where to expand retail locations, how much money to set aside a day to process the transactions, what deliv-ery systems should be created, and who to market to.
SKODA:Skoda is growing its IT department by hiring staff to integrate systems and improve response time. As the company develops to make greater use of business intelligence, it will need to allow greater input from its regional offices. Skoda’s use of company portals, powered by IFS, to share informa-tion and process managerial applications creates a very controlled information system, with mini-mal input from staff. Skoda’s use of data mining in the new markets of Russia, China and India will be crucial to the success of the brand. As the company develops and integrates its business intelligence functions, it should give special focus to integrating its HPC clusters so that trends in inventory and sales can be closely monitored.


41
WORKS CITED
AT&T“AT&T BusinessDirect Portal.” 2008. AT&T Business Direct. 23 April 2011. < http://docs. google.com/viewer?a=v&q=cache:uUO1YyDEwIsJ:www.business.att.com/binary/content/ productbrochures/bdportal.pdf+AT%26T+portal+use&hl=en&gl=us&pid=bl&srcid=AD GEEShjsHCiuxt9xTM2tfPBBCpGyFOU1z4wwlEsYCNykJ96GrkramAJph6Hfm2jWzs9D 4LC3DJ7xAzBLuP6xR3K-TPlI9Liq9Je0cES8RpOzRxKcGb1O1QaSR4qk1MvkdHbtvr0zSs &sig=AHIEtbRi19BZQRUnhjuhuExF139PhedXiQ>.
“AT&T Receives Computerworld’s Business Intelligence Perspectives ‘Best Practices in Business Intelligence’ Award. “ 2011. Corporate AT&T. 23 April 2011. <http://www.corp.att.com/ emea/insights/awards/computerworld_best_practice.html>.
“Bigger & Better.” March 2004. Information Week. 23 April 2011. <http://www.information week.com/news/storage/showArticle.jhtml?articleID=18400975>.
Cella, Jason. “AT&T Inc.” 2011. Hoovers. 23 April 2011. <http://subscriber.hoovers.com.spot. lib.auburn.edu/H/company360/overview.html?companyId=11379000000000>.
“DataDepot.” 2010. AT&T Labs. 23 April 2011. <http://www.research.att.com/projects/DataDe pot/index.html>.
“Enhanced Indexing and Representation with Vision Based Biometrics.” 2010. AT&T Labs. 23 April 2011. <http://www.research.att.com/projects/Video/VisualBiometrics/index.html>. Halevy, Ronen. “AT&T Updates Their Coverate Reporting Tool and QR Code Scanner.” Febru ary 2011. Berry Review. 23 April 2011. < http://www.berryreview.com/2011/02/04/att- updates-their-coverage-reporting-tool-and-qr-code-scanner/>.
“Large Scale Data Mining.” 2011. AT&T Labs. 23 April 2011. <http://www2.research.att. com/~stat/research/mining.php>.
“SharePoint Services.” 2008. AT&T. 23 April 2011. <http://docs.google.com/ viewer?a=v&q=cache:nTCuIV-HW1YJ:www.business.att.com/content/productbrochures/ Sharepoint_Services.pdf+how+many+AT%26T+employees+work+in+business+intelligen ce&hl=en&gl=us&pid=bl&srcid=ADGEESj9PrRK65NsIqfOAqhxOlG6f6X06Et0J9 UzDt5KuM6QZigN2MyHpS818ptqgNVhuKZwmvle1HeLz57Xux4WbesAGKKZvx7b 3sAVFSawK81VyHeRg6SBFOtx5_0BpjfHCu9YePJI&sig=AHIEtbSAv0e4gWzXQZHcS5j6 4vH4ljI9iQ&pli=1>.

43
Singel, Ryan. “AT&T Invents Programming Language for Mass Surveillance.” October 2007. Wired.com. 23 April 2011. < http://www.wired.com/threatlevel/2007/10/att-invents- pro/>.
Thormahlen, Casey. “Telecommunications in the US.” April 2011. Ibis World. 23 April 2011. <http://www.ibisworld.com.spot.lib.auburn.edu/industryus/default.aspx?indid=1267>.
Vesonder, Gregg T. “ACE: An Expert System for Telephone Cable Maintenance.” 23 April 2011. <http://docs.google.com/viewer?a=v&q=cache:e_tpR8WTCC4J:citeseerx.ist.psu.edu/ viewdoc/download%3Fdoi%3D10.1.1.80.5161%26rep%3Drep1%26type%3Dpdf+automat ed+cable+expertise&hl=en&gl=us&pid=bl&srcid=ADGEESgOQL1lH67ewnWpWJIc9 T7q5tHSd7HFU_sI3cQ8eO5q5-vWOWV5PMB519DgIp1fvGriiEEK0mQK5D6r0hO6N4 1XPnwx9Yv5jR0eZvbH0nu2Anegd91UF6ZrITJgFOkU2cHVn5b&sig=AHIEtbQU1oOgm x795d205SwPc4CdZspElw>.
AUSTAL“Annual Report 2010.” Austal.com. Web. 21 April 2011. <http://www.austal.com/go/investors/ annual-reports-and-investor-briefings>
Browne, Sarah. “US Navy Awards Austal Multi-Vessel LCS Contract.” Austal.com. 30 Dec 2010. Web. 21 April 2011. <http://www.austal.com/index.cfm?objectid=0C93BB78-65BF-EBC1- 240822B8E39FE2DC>
Scheurich, Hal. “Austal Announces $116M Expansion.” Fox10tv.com. 05 April 2001. Web. 21 April 011. <http://www.fox10tv.com/dpp/news/local_news/mobile_county/austal- announces-huge-expansion>
VODACOM“BI in the Box: Case Studies”. 2007. <http://biitb.com/Vodacom.aspx>
“BI in the Box: Products”. 2007. <http://biitb.com/SybaseIQ.aspx>
“BI in the Box: Products”. 2007. <http://biitb.com/SybasePowerDesigner.aspx>
Coetzer, Jennigay. “Cloud applications cut IT costs for companies”. 12 April 2011. <http://www6. lexisnexis.com/publisher/EndUser?Action=UserDisplayFullDocument&orgId=574&topic Id=100019547&docId=l:1399456608&isRss=true>

Mawson, Nicola. “Electricity hikes drive data centre innovation.” 6 April 2011. <http://www. itweb.co.za/index.php?option=com_content&view=article&id=42672:electrici ty-hikes-drive-data-centre-innovation&catid=69>
SKODAHoover’s. Retrieved April 14-17, 2011, <www.hoover.com>
Skoda Auto. Retrieved April 14-17, 2011, <from http://new.skoda-auto.com/COM/Pages/homep age.aspx>
![Shostak Unit 4 Picture Associations. Arduous[Arduous] Lifting the heavy boxes during the move was arduous work. Definition: (adj.) hard to do](https://img.pdfslide.net/doc/110x75/551446c05503462d4e8b4c11/shostak-unit-4-picture-associations-arduousarduous-lifting-the-heavy-boxes-during-the-move-was-arduous-work-definition-adj-hard-to-do.jpg)