Embed Size (px)
Citation preview
Indiana Media Usage Study 2
Table Of Contents
August 2014
PAGE
I. Executive Summary 3
II. Specific Findings
1. Newspaper Readership In Indiana 8
2. Public Notice Advertising 14
3. Internet Use In Indiana 21
4. Voting Patterns and Election Information 24
Appendix A: Methodology 29
Indiana Media Usage Study 3
Executive Summary
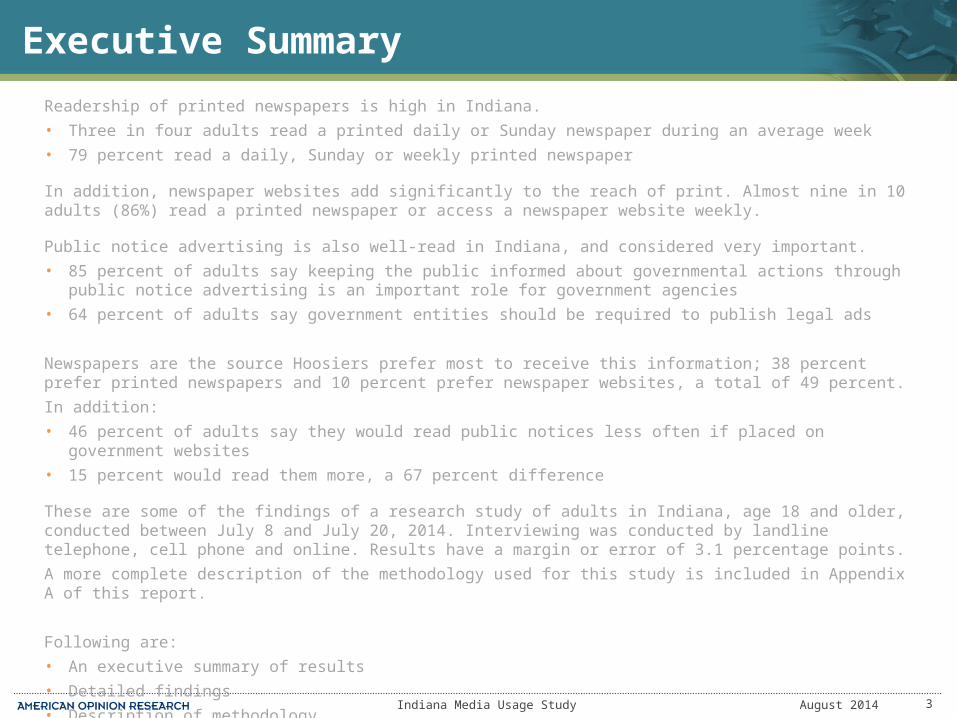
Readership of printed newspapers is high in Indiana.
• Three in four adults read a printed daily or Sunday newspaper during an average week
• 79 percent read a daily, Sunday or weekly printed newspaper
In addition, newspaper websites add significantly to the reach of print. Almost nine in 10 adults (86%) read a printed newspaper or access a newspaper website weekly.
Public notice advertising is also well-read in Indiana, and considered very important.
• 85 percent of adults say keeping the public informed about governmental actions through public notice advertising is an important role for government agencies
• 64 percent of adults say government entities should be required to publish legal ads
Newspapers are the source Hoosiers prefer most to receive this information; 38 percent prefer printed newspapers and 10 percent prefer newspaper websites, a total of 49 percent.
In addition:
• 46 percent of adults say they would read public notices less often if placed on government websites
• 15 percent would read them more, a 67 percent difference
These are some of the findings of a research study of adults in Indiana, age 18 and older, conducted between July 8 and July 20, 2014. Interviewing was conducted by landline telephone, cell phone and online. Results have a margin or error of 3.1 percentage points.
A more complete description of the methodology used for this study is included in Appendix A of this report.
Following are:
• An executive summary of results
• Detailed findings
• Description of methodology
August 2014
Indiana Media Usage Study 4
Executive Summary
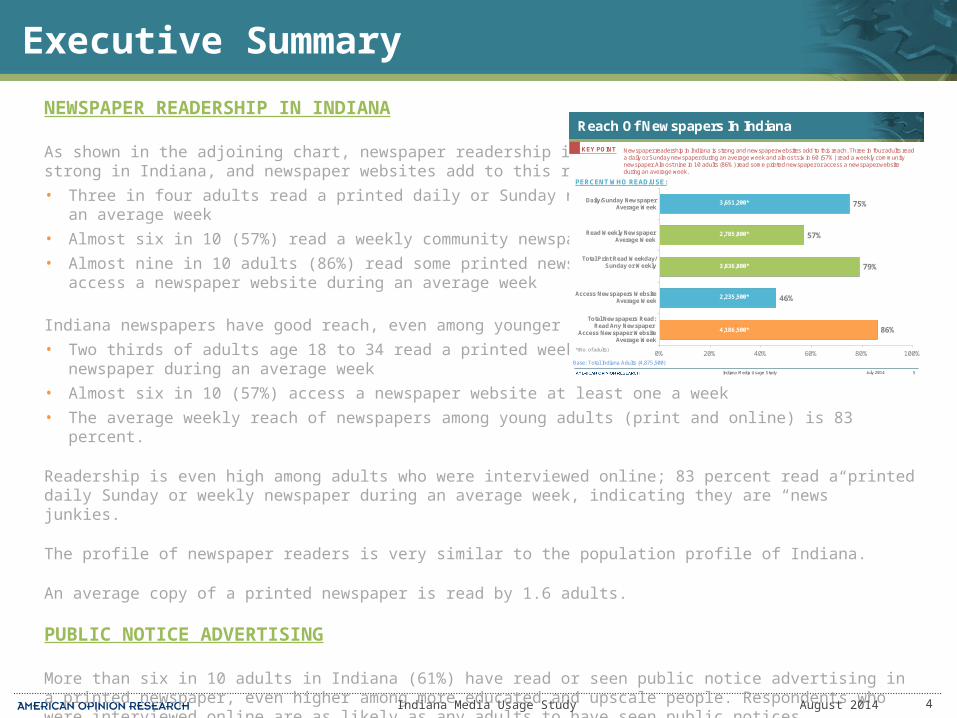
NEWSPAPER READERSHIP IN INDIANA
As shown in the adjoining chart, newspaper readership is strong in Indiana, and newspaper websites add to this reach.
• Three in four adults read a printed daily or Sunday newspaper during an average week
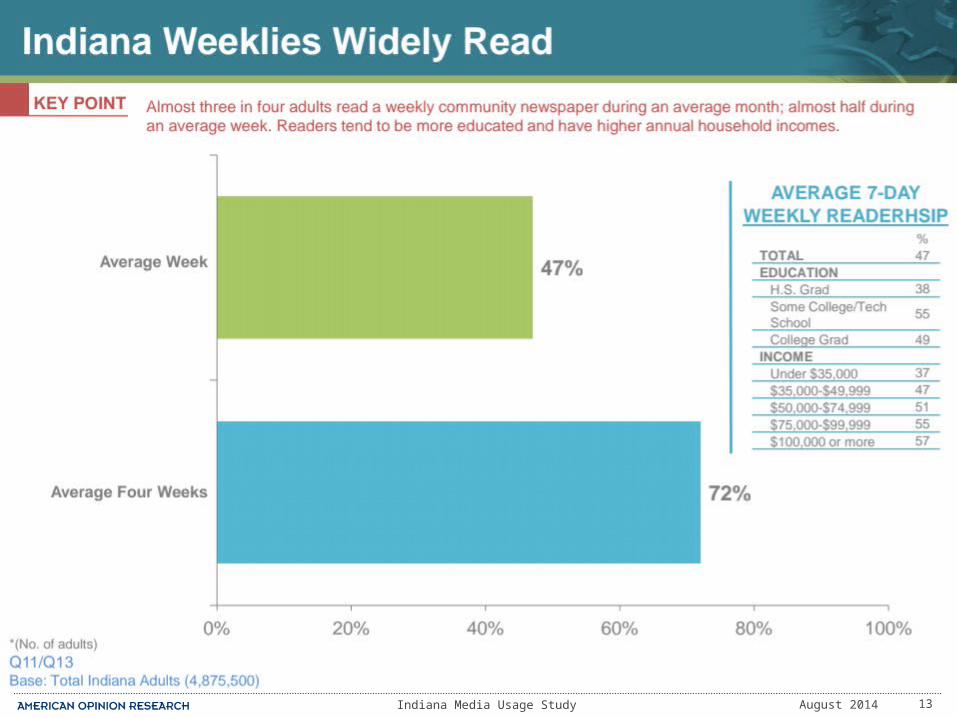
• Almost six in 10 (57%) read a weekly community newspaper
• Almost nine in 10 adults (86%) read some printed newspaper or access a newspaper website during an average week
Indiana newspapers have good reach, even among younger adults:
• Two thirds of adults age 18 to 34 read a printed weekly or Sunday newspaper during an average week
• Almost six in 10 (57%) access a newspaper website at least one a week
• The average weekly reach of newspapers among young adults (print and online) is 83 percent.
Readership is even high among adults who were interviewed online; 83 percent read a printed daily Sunday or weekly newspaper during an average week, indicating they are “news” junkies.
The profile of newspaper readers is very similar to the population profile of Indiana.
An average copy of a printed newspaper is read by 1.6 adults.
PUBLIC NOTICE ADVERTISING
More than six in 10 adults in Indiana (61%) have read or seen public notice advertising in a printed newspaper, even higher among more educated and upscale people. Respondents who were interviewed online are as likely as any adults to have seen public notices.
August 2014
KEY POINT
Reach Of Newspapers In Indiana
5
Newspaper readership in Indiana is strong and newspaper websites add to this reach. Three in four adults read a daily or Sunday newspaper during an average week and almost six in 60 (57%) read a weekly community newspaper. Almost nine in 10 adults (86%) read some printed newspaper or access a newspaper website during an average week.
Base: Total Indiana Adults (4,875,500)
86%
46%
79%
57%
75%
0% 20% 40% 60% 80% 100%
PERCENT WHO READ/USE:
Daily/Sunday NewspaperAverage Week
Total Print Read Weekday/Sunday or Weekly
*(No. of adults)
3,651,200*
3,836,800*
2,785,800*
Total Newspapers Read:Read Any Newspaper
Access Newspaper WebsiteAverage Week
July 2014Indiana Media Usage Study
2,235,500*
4,186,500*
Read Weekly NewspaperAverage Week
Access Newspapers WebsiteAverage Week
Indiana Media Usage Study 5
Executive Summary
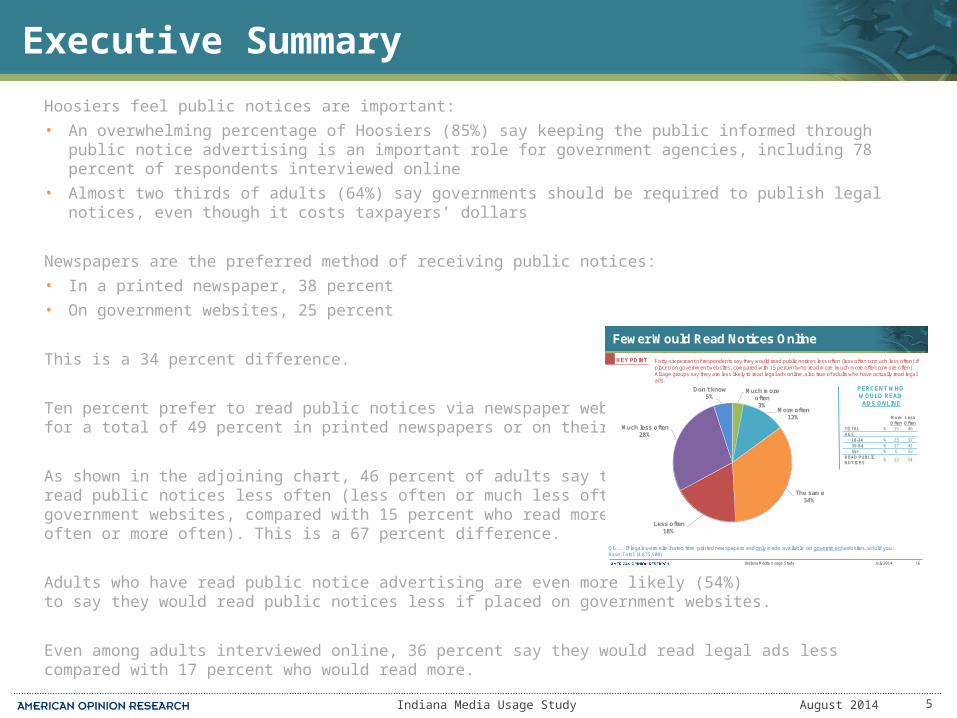
Hoosiers feel public notices are important:
• An overwhelming percentage of Hoosiers (85%) say keeping the public informed through public notice advertising is an important role for government agencies, including 78 percent of respondents interviewed online
• Almost two thirds of adults (64%) say governments should be required to publish legal notices, even though it costs taxpayers’ dollars
Newspapers are the preferred method of receiving public notices:
• In a printed newspaper, 38 percent
• On government websites, 25 percent
This is a 34 percent difference.
Ten percent prefer to read public notices via newspaper websites for a total of 49 percent in printed newspapers or on their websites.
As shown in the adjoining chart, 46 percent of adults say they would read public notices less often (less often or much less often) if placed on government websites, compared with 15 percent who read more (much more often or more often). This is a 67 percent difference.
Adults who have read public notice advertising are even more likely (54%) to say they would read public notices less if placed on government websites.
Even among adults interviewed online, 36 percent say they would read legal ads less compared with 17 percent who would read more.
August 2014
KEY POINT
Fewer Would Read Notices Online
Indiana Media Usage Study 16July 2014
Forty-six percent of respondents say they would read public notices less often (less often or much less often) if placed on government websites, compared with 15 percent who read more (much more often or more often). All age groups say they are less likely to read legal ads online, also true of adults who have actually read legal ads.
Q6. … If legals were eliminated from printed newspapers and only made available on government websites, would you:Base: Total (4,875,500)
Much more often3%
More often12%
The same34%
Less often18%
Much less often28%
Don't know5%
PERCENT WHO WOULD READ ADS ONLINE
More Often
LessOften
TOTAL % 15 46AGE
18-34 % 23 3735-54 % 17 4155+ % 6 59
READ PUBLIC NOTICES
% 12 54
Indiana Media Usage Study 6
Executive Summary
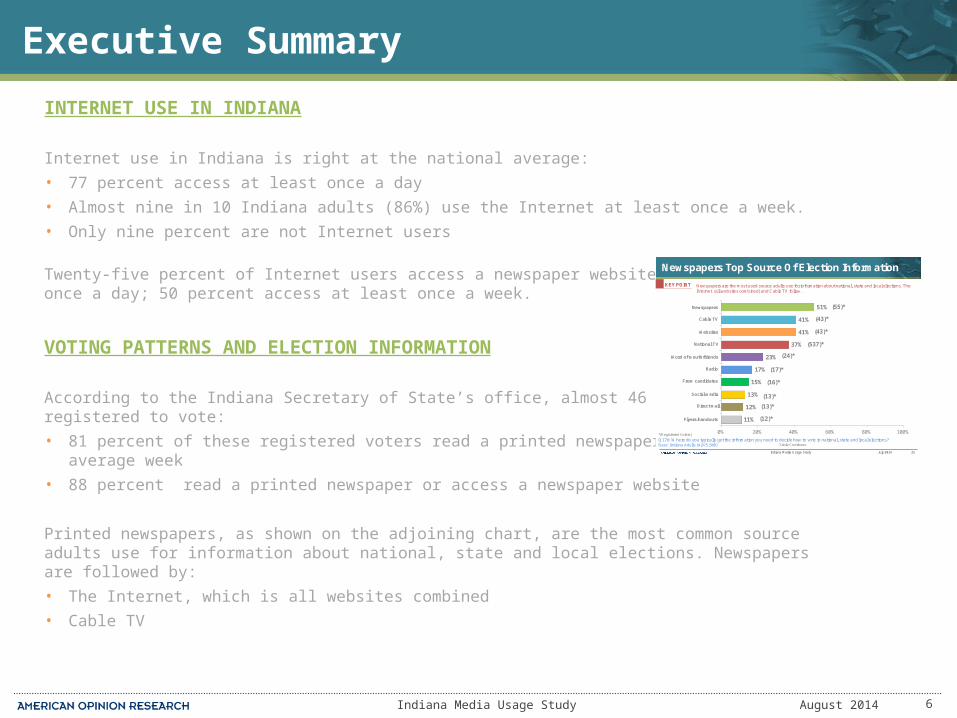
INTERNET USE IN INDIANA
Internet use in Indiana is right at the national average:
• 77 percent access at least once a day
• Almost nine in 10 Indiana adults (86%) use the Internet at least once a week.
• Only nine percent are not Internet users
Twenty-five percent of Internet users access a newspaper website at least once a day; 50 percent access at least once a week.
VOTING PATTERNS AND ELECTION INFORMATION
According to the Indiana Secretary of State’s office, almost 46 million adults are registered to vote:
• 81 percent of these registered voters read a printed newspaper during an average week
• 88 percent read a printed newspaper or access a newspaper website
Printed newspapers, as shown on the adjoining chart, are the most common source adults use for information about national, state and local elections. Newspapers are followed by:
• The Internet, which is all websites combined
• Cable TV
August 2014
KEY POINT
Newspapers Top Source Of Election Information
Indiana Media Usage Study 25July 2014
Newspapers are the most used source adults use for information about national, state and local elections. The Internet (all websites combined) and Cable TV follow.
Q17d. Where do you typically get the information you need to decide how to vote in national, state and local elections? Base: Indiana Adults (4,875,500)
11%
12%
13%
15%
17%
23%
37%
41%
41%
51%
0% 20% 40% 60% 80% 100%
Newspapers
Cable TV
National TV
Radio
Word of mouth/friends
Websites
Social media
From candidates
Direct mail
Flyers/handouts
*(Registered Voters)
-Table Continues-
(55)*
(43)*
(43)*
(537)*
(24)*
(17)*
(16)*
(13)*
(13)*
(12)*
Indiana Media Usage Study 7
Executive Summary
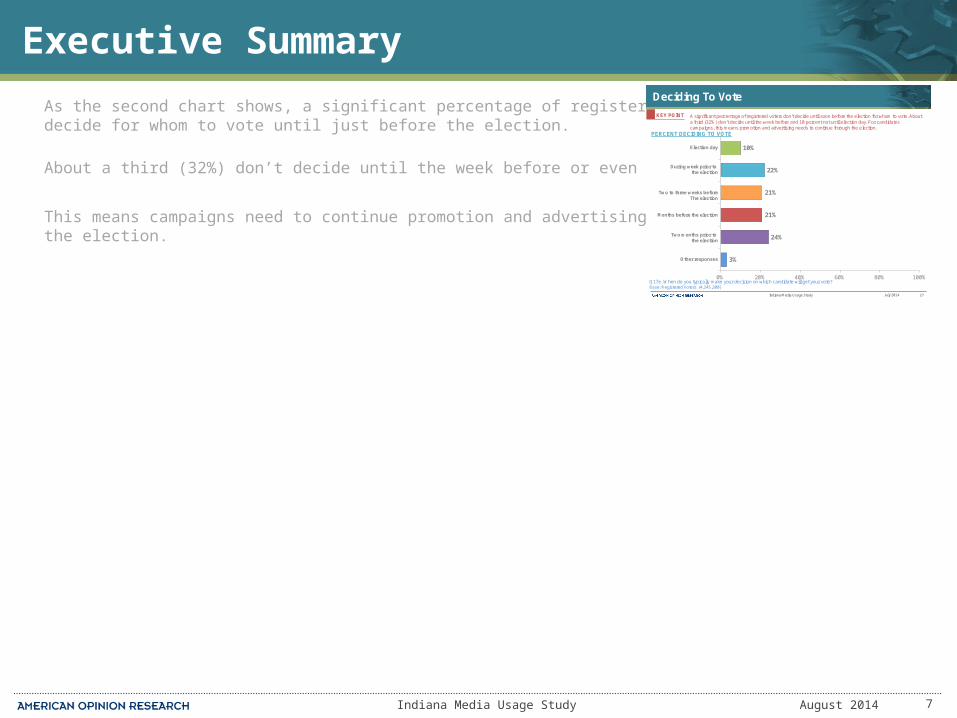
As the second chart shows, a significant percentage of registered voters don’t decide for whom to vote until just before the election.
About a third (32%) don’t decide until the week before or even election day.
This means campaigns need to continue promotion and advertising throughout the election.
August 2014
KEY POINT
Deciding To Vote
Indiana Media Usage Study 27July 2014
A significant percentage of registered voters don’t decide until soon before the election for whom to vote. About a third (32%) don’t decide until the week before and 10 percent not until election day. For candidates campaigns, this means promotion and advertising needs to continue through the election.
Q17e. When do you typically make your decision on which candidate will get your vote?Base: Registered Voters (4,245,200)
3%
24%
21%
21%
22%
10%
0% 20% 40% 60% 80% 100%
Election day
During week prior to the election
Two to three weeks beforeThe election
Months before the election
Two months prior to the election
Other responses
PERCENT DECIDING TO VOTE

8
Newspaper Readership In Indiana
Indiana Media Usage Study 9
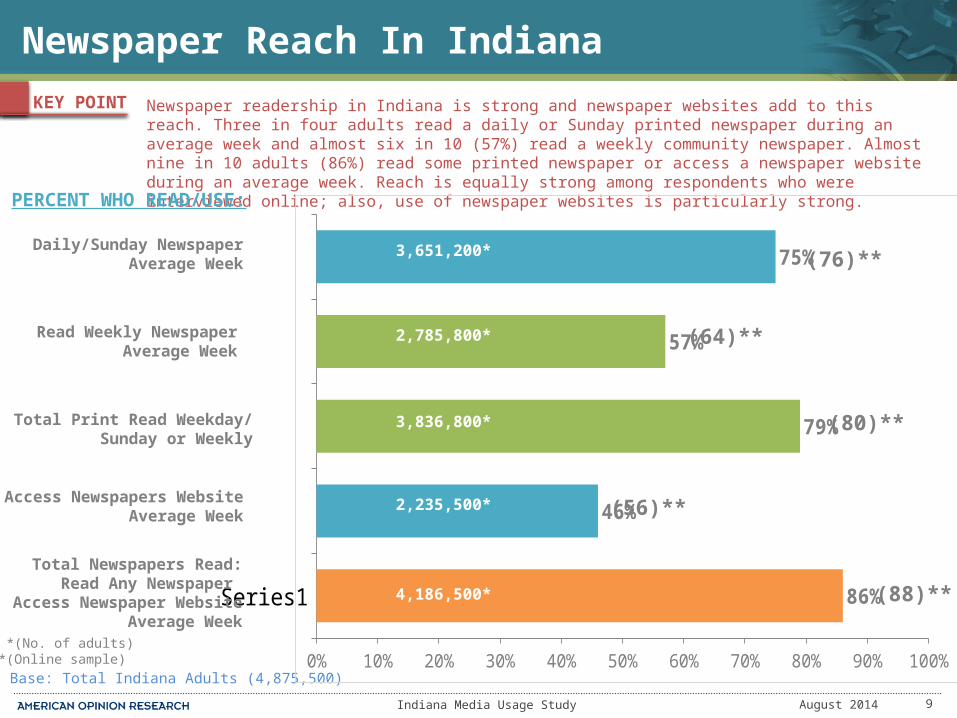
KEY POINT
Newspaper Reach In Indiana
Newspaper readership in Indiana is strong and newspaper websites add to this reach. Three in four adults read a daily or Sunday printed newspaper during an average week and almost six in 10 (57%) read a weekly community newspaper. Almost nine in 10 adults (86%) read some printed newspaper or access a newspaper website during an average week. Reach is equally strong among respondents who were interviewed online; also, use of newspaper websites is particularly strong.
Base: Total Indiana Adults (4,875,500)
Series10% 10% 20% 30% 40% 50% 60% 70% 80% 90% 100%
86%
46%
79%
57%
75%
PERCENT WHO READ/USE:
Daily/Sunday NewspaperAverage Week
Total Print Read Weekday/Sunday or Weekly
*(No. of adults)**(Online sample)
3,651,200*
3,836,800*
2,785,800*
Total Newspapers Read:Read Any Newspaper
Access Newspaper WebsiteAverage Week
August 2014
2,235,500*
4,186,500*
Read Weekly NewspaperAverage Week
Access Newspapers WebsiteAverage Week
(76)**
(64)**
(80)**
(56)**
(88)**
Indiana Media Usage Study 10
KEY POINT
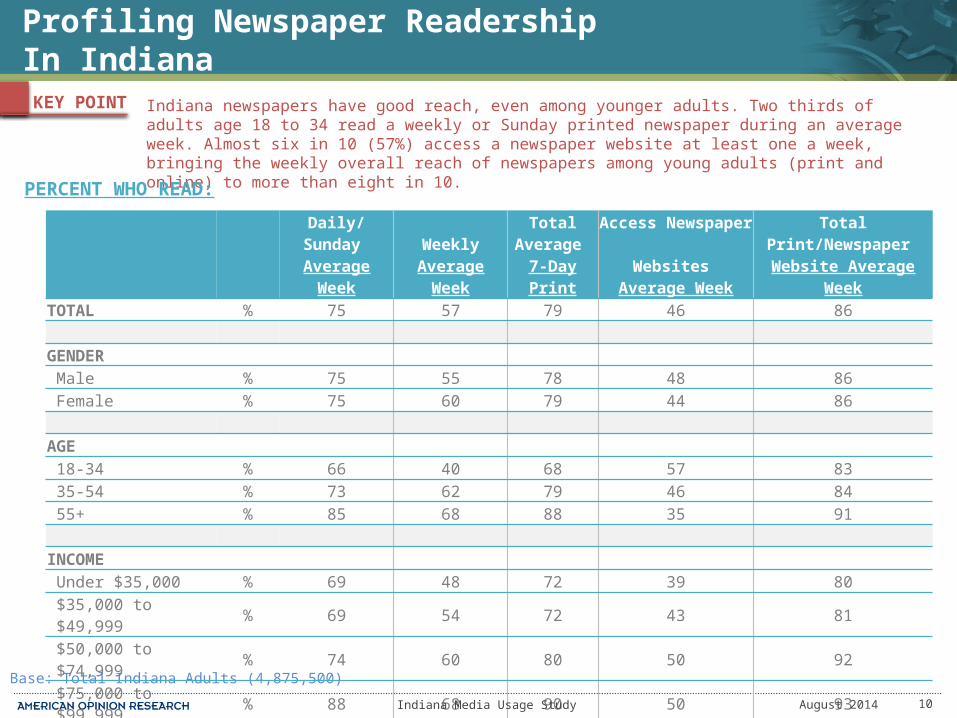
Profiling Newspaper Readership In Indiana
Indiana newspapers have good reach, even among younger adults. Two thirds of adults age 18 to 34 read a weekly or Sunday printed newspaper during an average week. Almost six in 10 (57%) access a newspaper website at least one a week, bringing the weekly overall reach of newspapers among young adults (print and online) to more than eight in 10.
Base: Total Indiana Adults (4,875,500)
Daily/Sunday Average Week
WeeklyAverage Week
TotalAverage
7-Day Print
Access Newspaper Websites
Average WeekTotal Print/Newspaper Website Average Week
TOTAL % 75 57 79 46 86
GENDERMale % 75 55 78 48 86Female % 75 60 79 44 86
AGE18-34 % 66 40 68 57 8335-54 % 73 62 79 46 8455+ % 85 68 88 35 91
INCOMEUnder $35,000 % 69 48 72 39 80$35,000 to $49,999 % 69 54 72 43 81$50,000 to $74,999 % 74 60 80 50 92$75,000 to $99,999 % 88 68 90 50 93$100,000 to $149,000 % 85 71 91 54 93$150,000 or more % 76 59 76 62 86
August 2014
PERCENT WHO READ:
Indiana Media Usage Study 11
KEY POINT
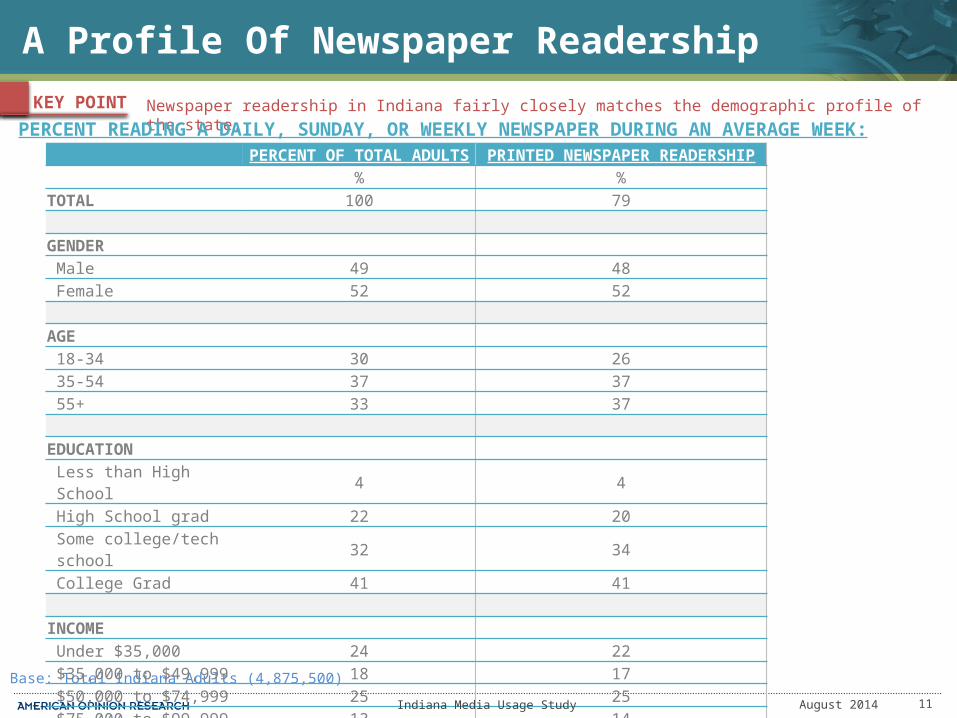
A Profile Of Newspaper Readership
Newspaper readership in Indiana fairly closely matches the demographic profile of the state.
Base: Total Indiana Adults (4,875,500)
PERCENT OF TOTAL ADULTS PRINTED NEWSPAPER READERSHIP% %
TOTAL 100 79
GENDERMale 49 48Female 52 52
AGE18-34 30 2635-54 37 3755+ 33 37
EDUCATIONLess than High School 4 4High School grad 22 20Some college/tech school 32 34College Grad 41 41
INCOMEUnder $35,000 24 22$35,000 to $49,999 18 17$50,000 to $74,999 25 25$75,000 to $99,999 13 14$100,000 or more 20 22
August 2014
PERCENT READING A DAILY, SUNDAY, OR WEEKLY NEWSPAPER DURING AN AVERAGE WEEK:
Indiana Media Usage Study 12
KEY POINT
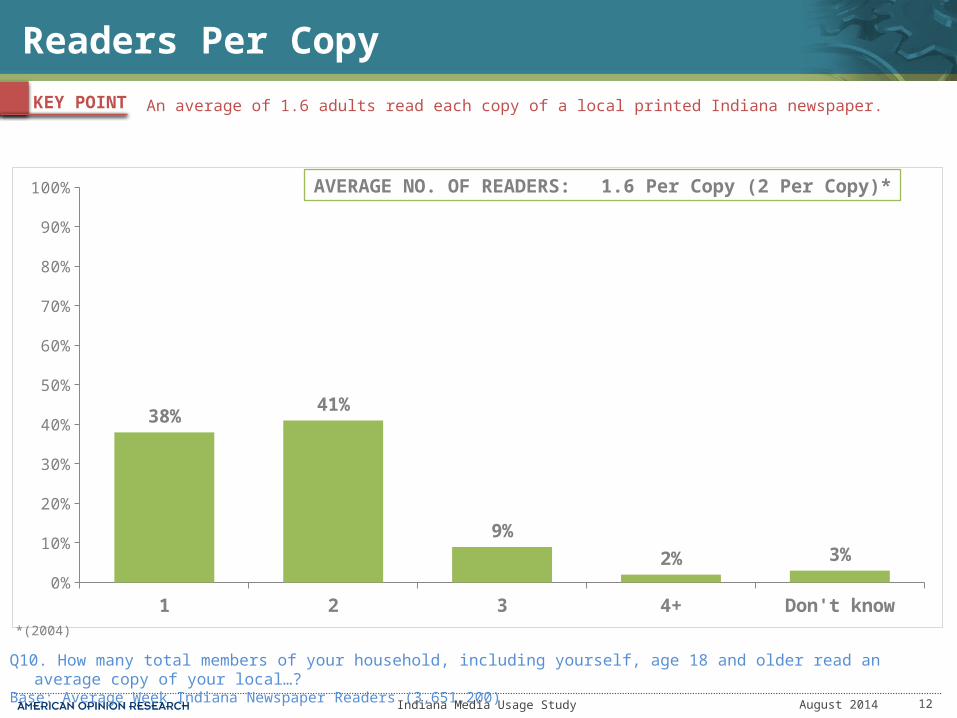
Readers Per Copy
An average of 1.6 adults read each copy of a local printed Indiana newspaper.
Q10. How many total members of your household, including yourself, age 18 and older read an average copy of your local…?Base: Average Week Indiana Newspaper Readers (3,651,200)
1 2 3 4+ Don't know0%
10%
20%
30%
40%
50%
60%
70%
80%
90%
100%
38%41%
9%
2% 3%
AVERAGE NO. OF READERS: 1.6 Per Copy (2 Per Copy)*
August 2014
*(2004)
Indiana Media Usage Study 13
KEY POINT
August 2014

14
Public Notice Advertising
Indiana Media Usage Study 15
KEY POINT
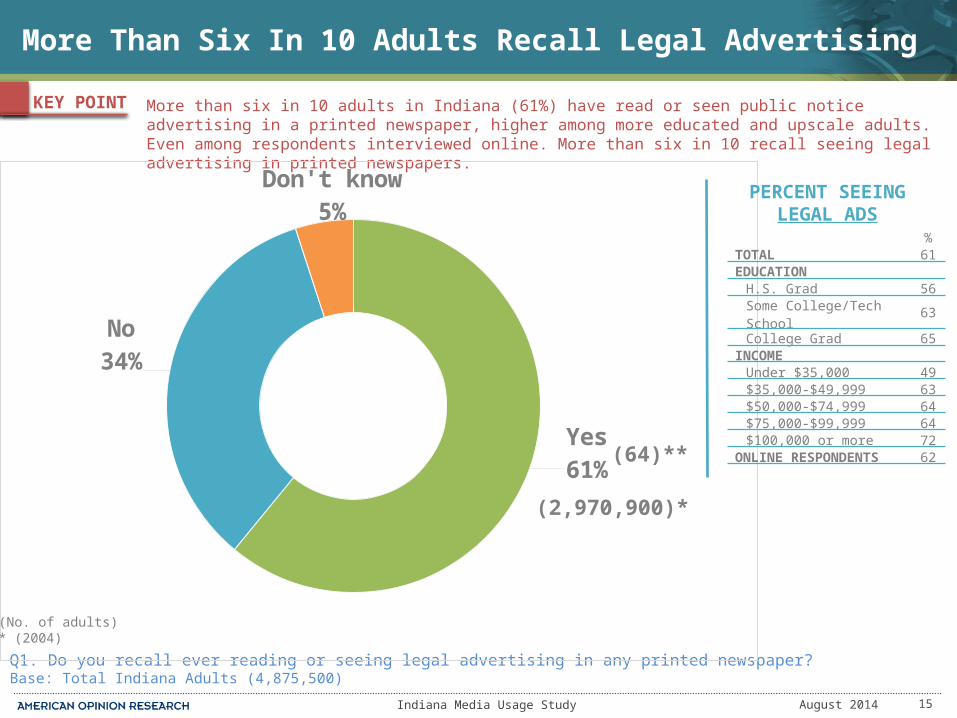
More Than Six In 10 Adults Recall Legal Advertising
August 2014
More than six in 10 adults in Indiana (61%) have read or seen public notice advertising in a printed newspaper, higher among more educated and upscale adults. Even among respondents interviewed online. More than six in 10 recall seeing legal advertising in printed newspapers.
Q1. Do you recall ever reading or seeing legal advertising in any printed newspaper?Base: Total Indiana Adults (4,875,500)
Yes61%
No34%
Don't know5% PERCENT SEEING
LEGAL ADS%
TOTAL 61EDUCATION
H.S. Grad 56 Some College/Tech School 63 College Grad 65INCOME
Under $35,000 49$35,000-$49,999 63$50,000-$74,999 64$75,000-$99,999 64$100,000 or more 72
ONLINE RESPONDENTS 62
*(No. of adults)** (2004)
(64)**
(2,970,900)*
Indiana Media Usage Study 16
KEY POINT
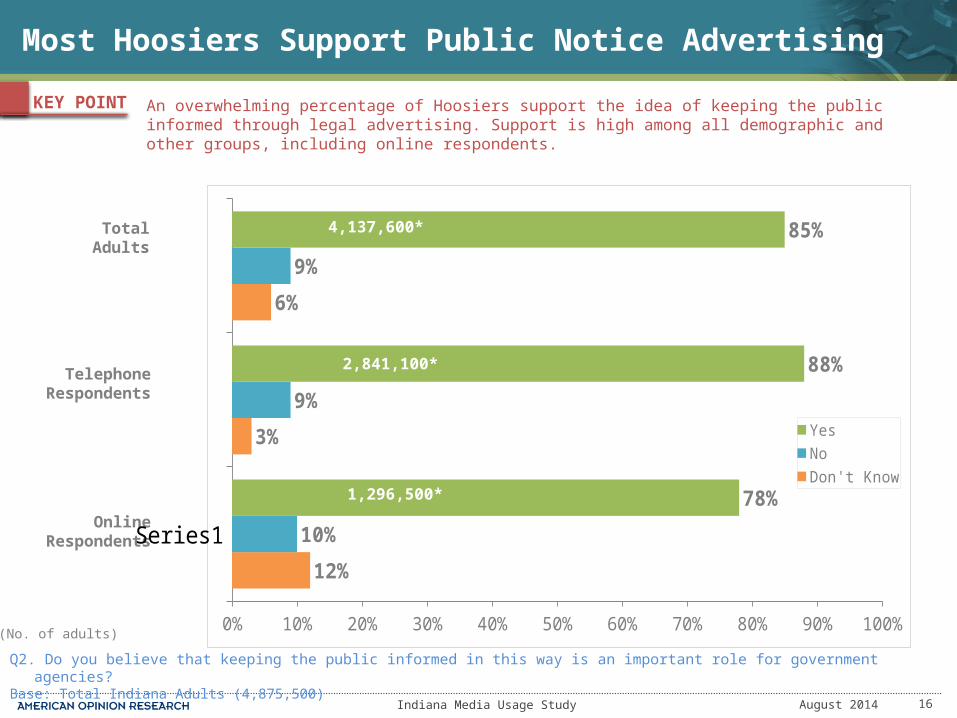
Most Hoosiers Support Public Notice Advertising
August 2014
An overwhelming percentage of Hoosiers support the idea of keeping the public informed through legal advertising. Support is high among all demographic and other groups, including online respondents.
Q2. Do you believe that keeping the public informed in this way is an important role for government agencies?Base: Total Indiana Adults (4,875,500)
*(No. of adults)
TotalAdults
TelephoneRespondents
OnlineRespondents
Series1
0% 10% 20% 30% 40% 50% 60% 70% 80% 90% 100%
12%
3%
6%
10%
9%
9%
78%
88%
85%
YesNoDon't Know
4,137,600*
2,841,100*
1,296,500*
Indiana Media Usage Study 17
KEY POINT
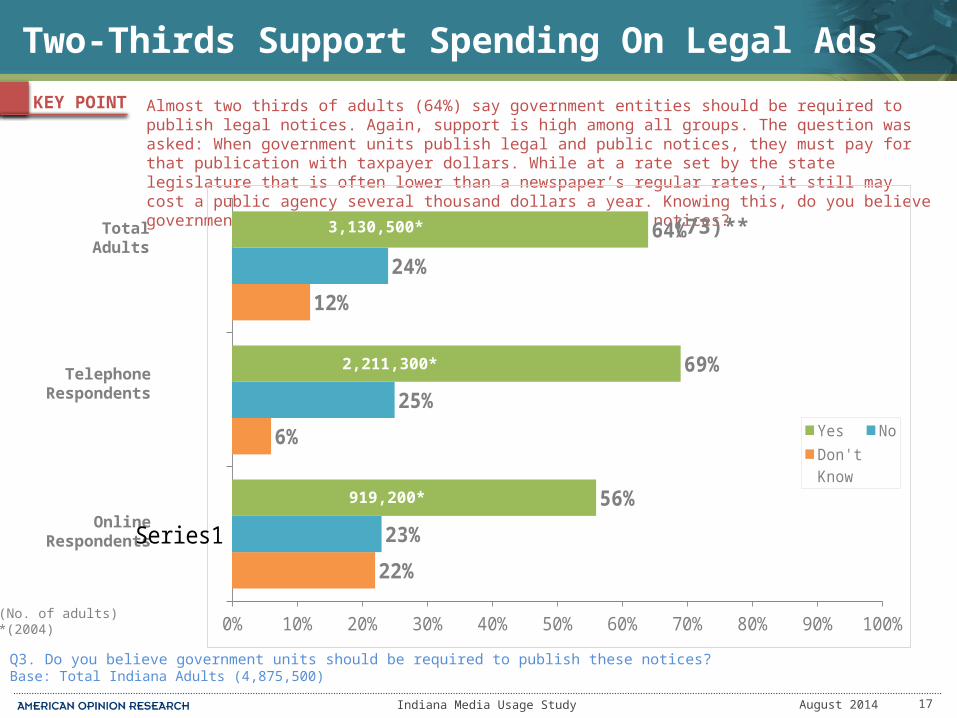
Two-Thirds Support Spending On Legal Ads
August 2014
Almost two thirds of adults (64%) say government entities should be required to publish legal notices. Again, support is high among all groups. The question was asked: When government units publish legal and public notices, they must pay for that publication with taxpayer dollars. While at a rate set by the state legislature that is often lower than a newspaper’s regular rates, it still may cost a public agency several thousand dollars a year. Knowing this, do you believe government units should be required to publish these notices?
Q3. Do you believe government units should be required to publish these notices? Base: Total Indiana Adults (4,875,500)
*(No. of adults)**(2004)
TotalAdults
TelephoneRespondents
OnlineRespondents
Series1
0% 10% 20% 30% 40% 50% 60% 70% 80% 90% 100%
22%
6%
12%
23%
25%
24%
56%
69%
64%
YesNoDon't Know
(73)**3,130,500*
2,211,300*
919,200*
Indiana Media Usage Study 18
KEY POINT
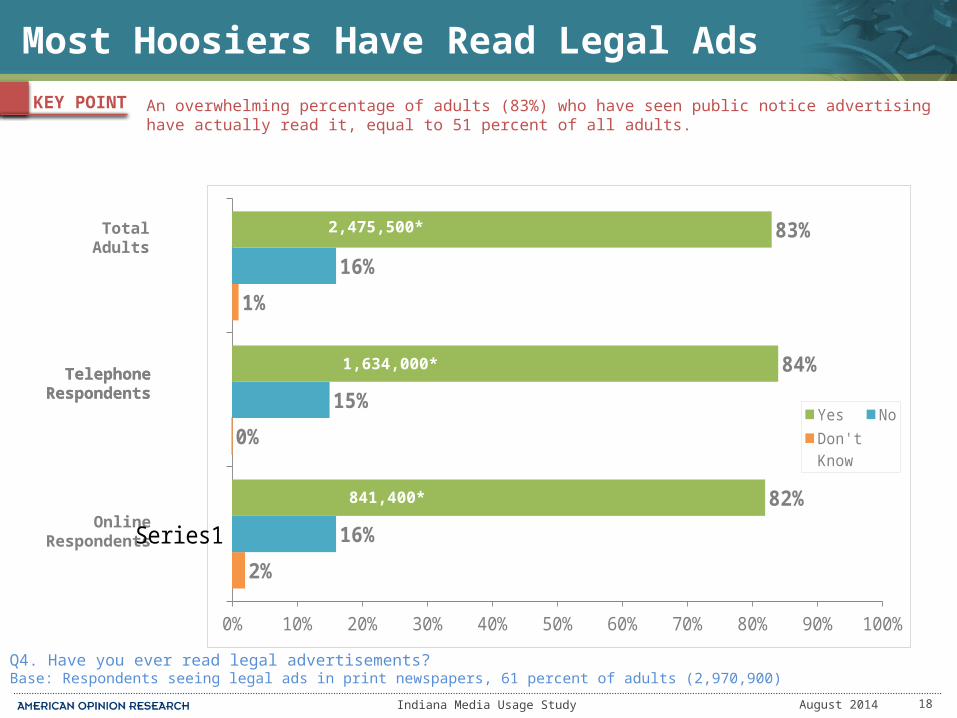
Most Hoosiers Have Read Legal Ads
August 2014
An overwhelming percentage of adults (83%) who have seen public notice advertising have actually read it, equal to 51 percent of all adults.
Q4. Have you ever read legal advertisements?Base: Respondents seeing legal ads in print newspapers, 61 percent of adults (2,970,900)
TelephoneRespondents
TotalAdults
TelephoneRespondents
OnlineRespondents
Series1
0% 10% 20% 30% 40% 50% 60% 70% 80% 90% 100%
2%
0%
1%
16%
15%
16%
82%
84%
83%
YesNoDon't Know
2,475,500*
1,634,000*
841,400*
Indiana Media Usage Study 19
KEY POINT
Newspapers Preferred Source For Public Notices
August 2014
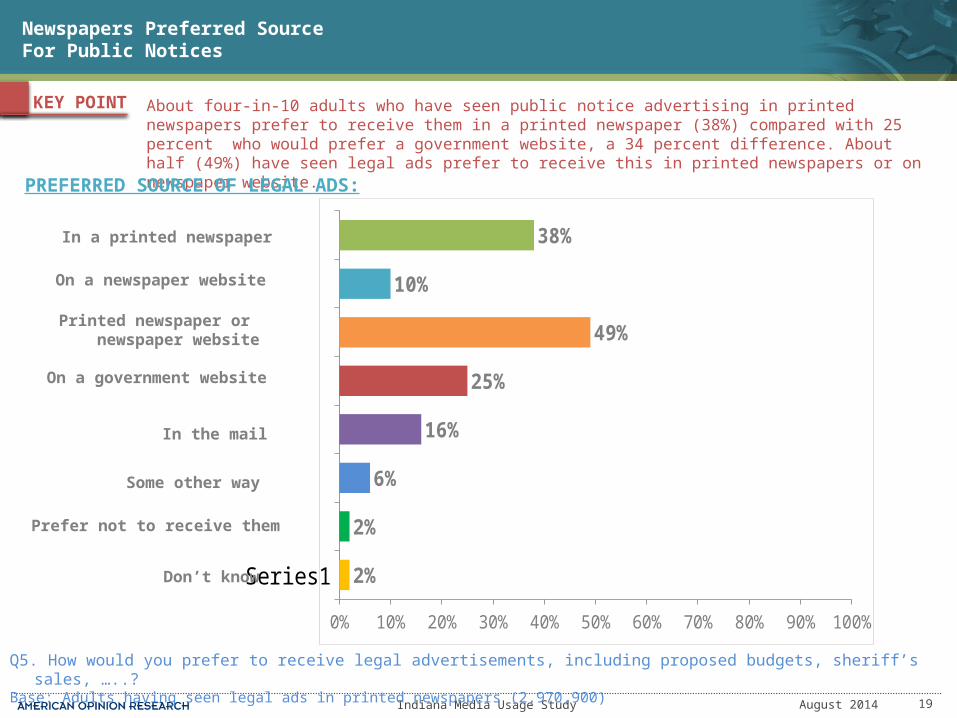
About four-in-10 adults who have seen public notice advertising in printed newspapers prefer to receive them in a printed newspaper (38%) compared with 25 percent who would prefer a government website, a 34 percent difference. About half (49%) have seen legal ads prefer to receive this in printed newspapers or on newspaper website.
Q5. How would you prefer to receive legal advertisements, including proposed budgets, sheriff’s sales, …..?Base: Adults having seen legal ads in printed newspapers (2,970,900)
Series10% 10% 20% 30% 40% 50% 60% 70% 80% 90% 100%
2%
2%
6%
16%
25%
49%
10%
38%In a printed newspaper
In the mail
Printed newspaper or newspaper website
On a government website
Prefer not to receive them
Don’t know
Some other way
PREFERRED SOURCE OF LEGAL ADS:
On a newspaper website
Indiana Media Usage Study 20
KEY POINT
Fewer Would Read Notices Online
August 2014
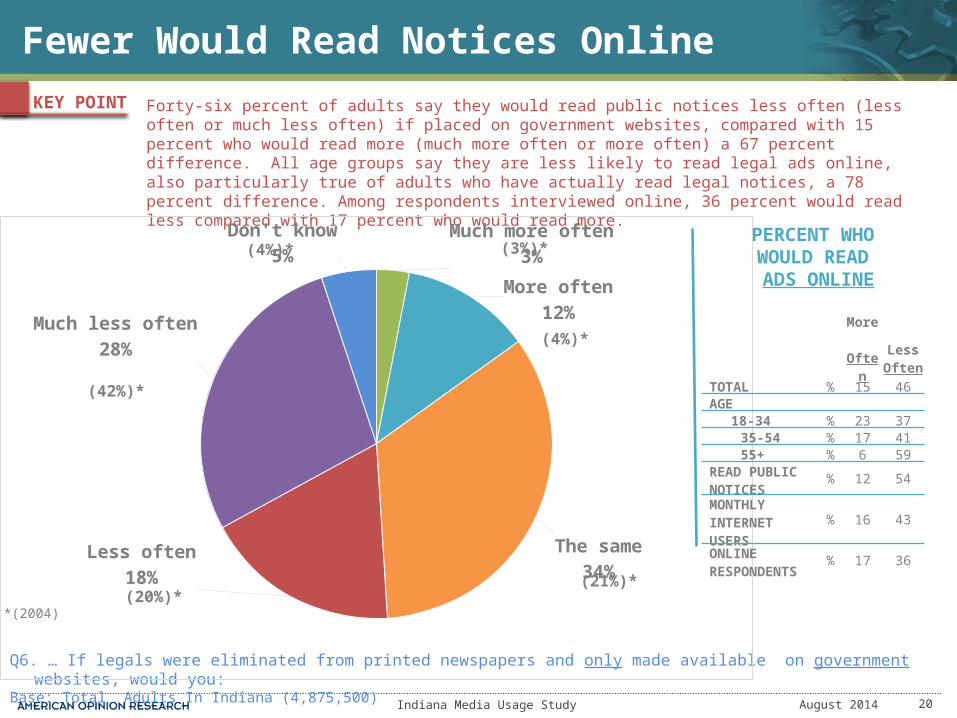
Forty-six percent of adults say they would read public notices less often (less often or much less often) if placed on government websites, compared with 15 percent who would read more (much more often or more often) a 67 percent difference. All age groups say they are less likely to read legal ads online, also particularly true of adults who have actually read legal notices, a 78 percent difference. Among respondents interviewed online, 36 percent would read less compared with 17 percent who would read more.
Q6. … If legals were eliminated from printed newspapers and only made available on government websites, would you:Base: Total Adults In Indiana (4,875,500)
Much more often3%
More often12%
The same34%
Less often18%
Much less often28%
Don't know5% PERCENT WHO
WOULD READ ADS ONLINE
More Often
LessOften
TOTAL % 15 46AGE
18-34 % 23 37 35-54 % 17 41 55+ % 6 59
READ PUBLIC NOTICES
% 12 54
MONTHLY INTERNET USERS
% 16 43
ONLINE RESPONDENTS
% 17 36
*(2004)
(4%)*
(21%)*
(3%)*(4%)*
(42%)*
(20%)*
21
Internet Use In Indiana
Indiana Media Usage Study 22
KEY POINT
Internet Use In Indiana
August 2014
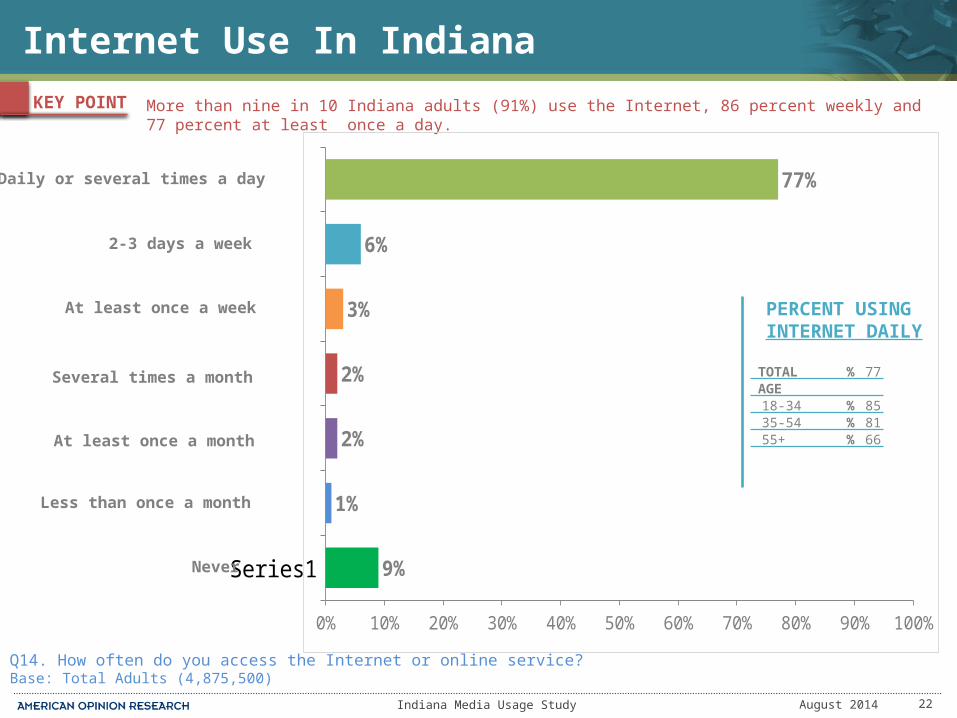
More than nine in 10 Indiana adults (91%) use the Internet, 86 percent weekly and 77 percent at least once a day.
Q14. How often do you access the Internet or online service?Base: Total Adults (4,875,500)
PERCENT USING INTERNET DAILY
TOTAL % 77AGE
18-34 % 85 35-54 % 81 55+ % 66
Series10% 10% 20% 30% 40% 50% 60% 70% 80% 90% 100%
9%
1%
2%
2%
3%
6%
77%Daily or several times a day
At least once a week
Several times a month
At least once a month
Less than once a month
Never
2-3 days a week
Indiana Media Usage Study 23
KEY POINT
Accessing Newspaper Websites
August 2014
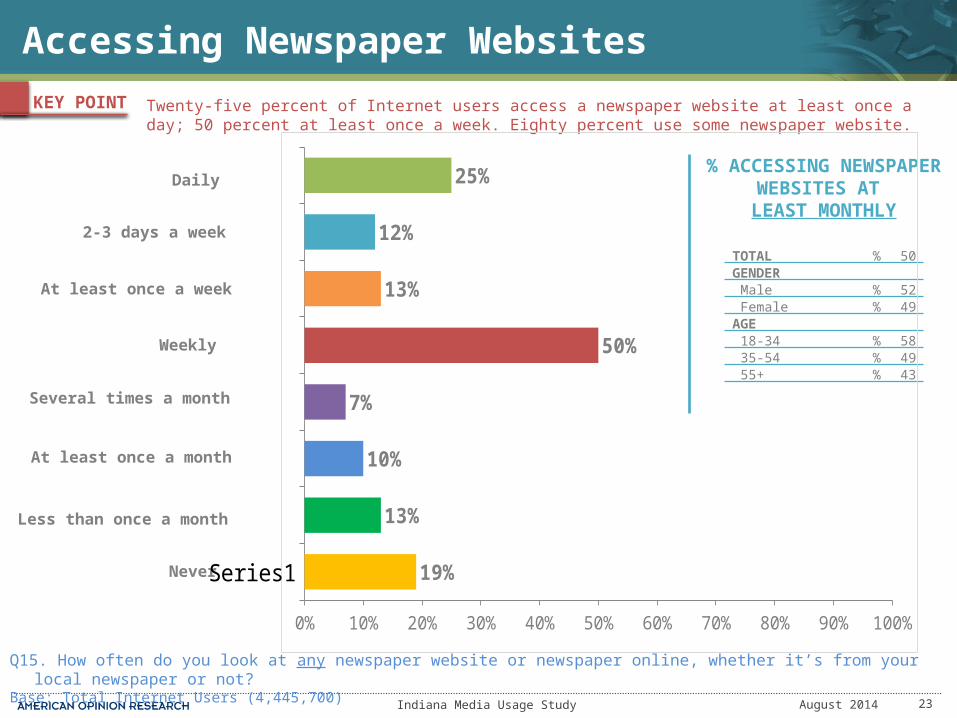
Twenty-five percent of Internet users access a newspaper website at least once a day; 50 percent at least once a week. Eighty percent use some newspaper website.
Q15. How often do you look at any newspaper website or newspaper online, whether it’s from your local newspaper or not?Base: Total Internet Users (4,445,700)
% ACCESSING NEWSPAPERWEBSITES AT
LEAST MONTHLY
TOTAL % 50GENDER
Male % 52Female % 49
AGE 18-34 % 58 35-54 % 49 55+ % 43
Daily
2-3 days a week
At least once a week
Several times a month
At least once a month
Less than once a month
Never
Series10% 10% 20% 30% 40% 50% 60% 70% 80% 90% 100%
19%
13%
10%
7%
50%
13%
12%
25%
Weekly
24
Voting Patterns & Election Information
Indiana Media Usage Study 25
KEY POINT
Registered Voters Read Newspaper
August 2014
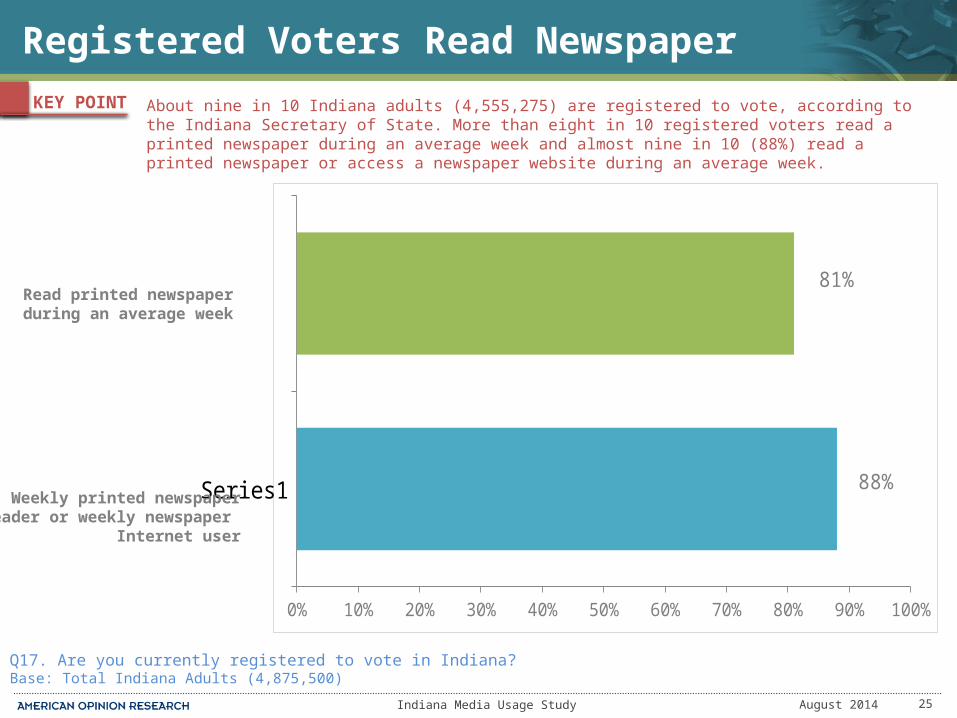
About nine in 10 Indiana adults (4,555,275) are registered to vote, according to the Indiana Secretary of State. More than eight in 10 registered voters read a printed newspaper during an average week and almost nine in 10 (88%) read a printed newspaper or access a newspaper website during an average week.
Q17. Are you currently registered to vote in Indiana? Base: Total Indiana Adults (4,875,500)
Series1
0% 10% 20% 30% 40% 50% 60% 70% 80% 90% 100%
88%
81%Read printed newspaperduring an average week
Weekly printed newspaperreader or weekly newspaper
Internet user
Indiana Media Usage Study 26
KEY POINT
Newspapers Top Source Of Election Information
August 2014
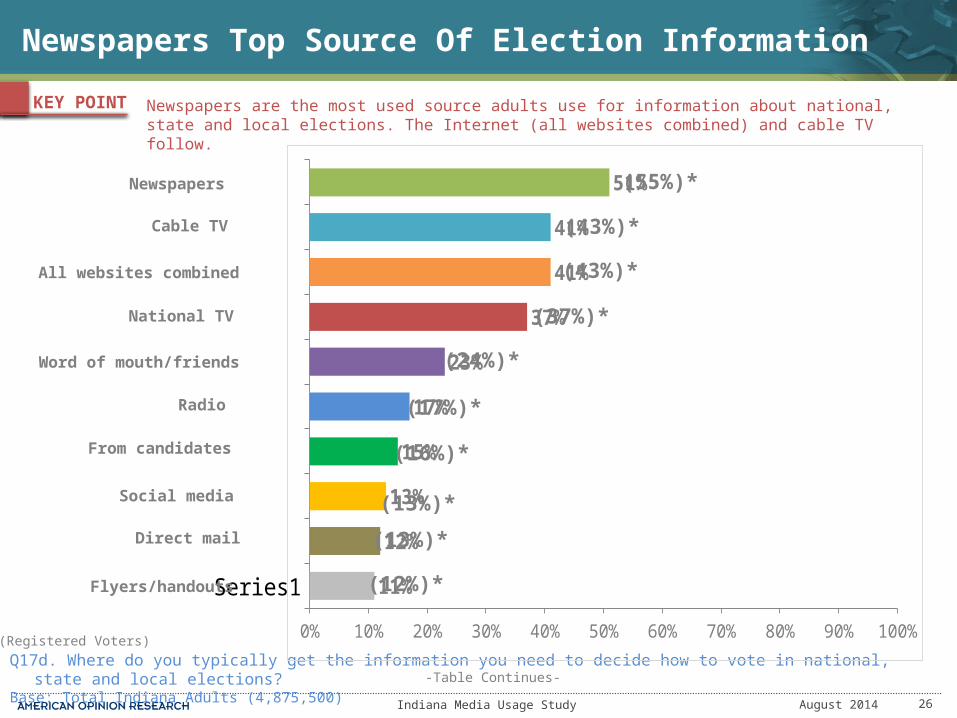
Newspapers are the most used source adults use for information about national, state and local elections. The Internet (all websites combined) and cable TV follow.
Q17d. Where do you typically get the information you need to decide how to vote in national, state and local elections? Base: Total Indiana Adults (4,875,500)
Series10% 10% 20% 30% 40% 50% 60% 70% 80% 90% 100%
11%
12%
13%
15%
17%
23%
37%
41%
41%
51%Newspapers
Cable TV
National TV
Radio
Word of mouth/friends
All websites combined
Social media
From candidates
Direct mail
Flyers/handouts
*(Registered Voters)
-Table Continues-
(55%)*
(43%)*
(43%)*
(37%)*
(24%)*
(17%)*
(16%)*
(13%)*
(13%)*
(12%)*
Indiana Media Usage Study 27
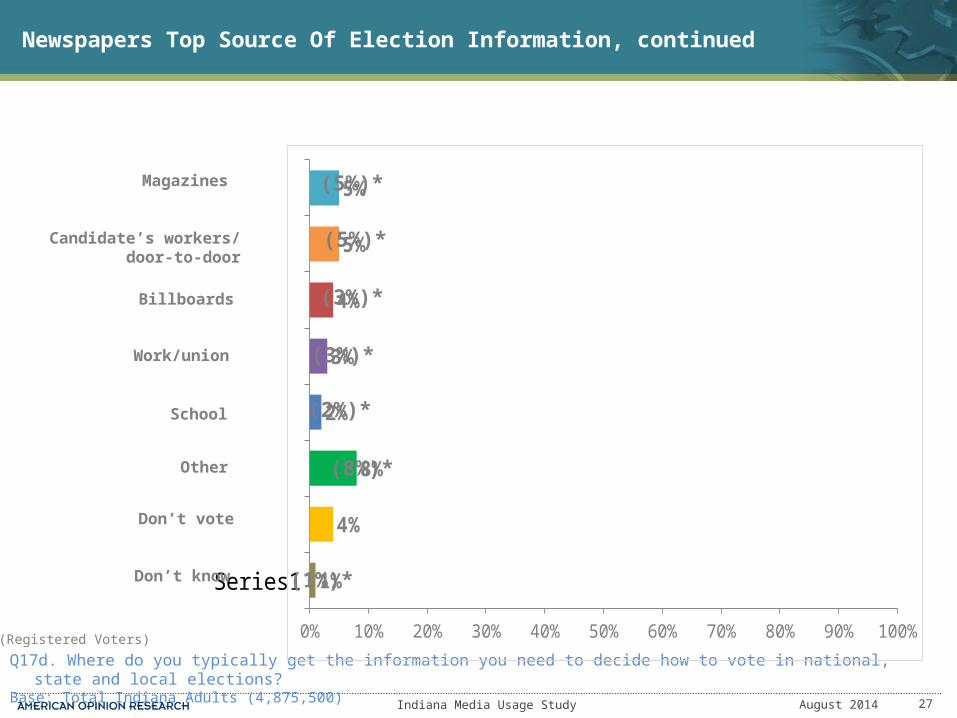
Newspapers Top Source Of Election Information, continued
August 2014
Q17d. Where do you typically get the information you need to decide how to vote in national, state and local elections? Base: Total Indiana Adults (4,875,500)
Series10% 10% 20% 30% 40% 50% 60% 70% 80% 90% 100%
1%
4%
8%
2%
3%
4%
5%
5%
Candidate’s workers/door-to-door
Magazines
Work/union
School
Other
Don’t vote
Don’t know
Billboards
(5%)*
(5%)*
(3%)*
(3%)*
(2%)*
(1%)*
(8%)*
*(Registered Voters)
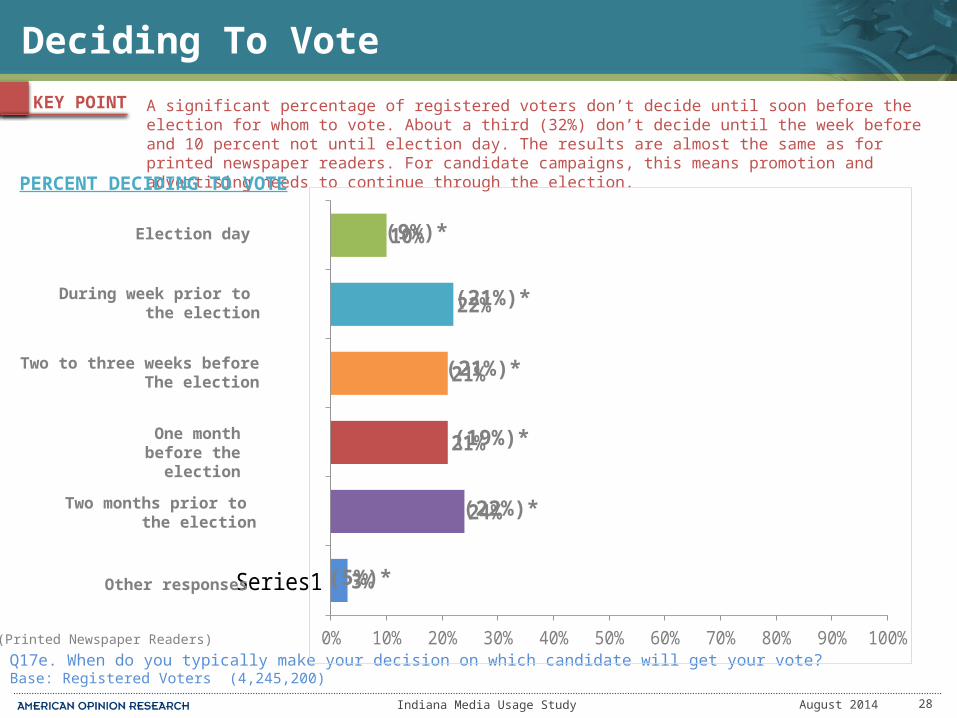
Indiana Media Usage Study 28
KEY POINT
Deciding To Vote
August 2014
A significant percentage of registered voters don’t decide until soon before the election for whom to vote. About a third (32%) don’t decide until the week before and 10 percent not until election day. The results are almost the same as for printed newspaper readers. For candidate campaigns, this means promotion and advertising needs to continue through the election.
Q17e. When do you typically make your decision on which candidate will get your vote?Base: Registered Voters (4,245,200)
Series10% 10% 20% 30% 40% 50% 60% 70% 80% 90% 100%
3%
24%
21%
21%
22%
10%Election day
During week prior to the election
Two to three weeks beforeThe election
One month before the election
Two months prior to the election
Other responses
PERCENT DECIDING TO VOTE
*(Printed Newspaper Readers)
(9%)*
(21%)*
(21%)*
(19%)*
(22%)*
(5%)*
Indiana Media Usage Study 29
Appendix A: Methodology
Results of this research are based on interviews with 1,000 Indiana adults, age 18 and older, between July 8 and July 20, 2014 conducted by American Opinion Research of Princeton, N.J.
Interviews were conducted using cell phones, landlines and online. Results were then weighted and projected to the total adult population in Indiana.
The questionnaire was designed to ask about public notice advertising before questions were asked about newspaper readership, so as not to bias responses.
American Opinion Research (AOR) is a nationally-recognized, full-service market research firm. AOR has conducted research for some of the nation’s largest media companies, including The New York Times Company, McClatchy Newspapers, the Los Angeles Times, Newsday, Buffalo News, Chicago Tribune, Seattle Times, Advance Communications, and many others.
AOR also conducts research for some of the nation’s largest companies and organizations, including General Electric, Siemens, Johnson & Johnson, AARP, General Motors, Ford, Procter and Gamble, S.C. Johnson, Mattel, Apple, Agfa, Kohl’s and others.
August 2014