Embed Size (px)
Citation preview

1 Team PA| Pennsylvania Agriculture: A Look at the Economic Impacts and Future Trends
TABLE OF CONTENTS
Executive Summary ........................................................................................................................ 3
1.0 Introduction ......................................................................................................................... 17
1.1 Study Overview .......................................................................................................... 18
1.2 Report .......................................................................................................................... 22
2.0 Agriculture in Pennsylvania ............................................................................................... 23
2.1 The State of Pennsylvania Agriculture .................................................................... 24
2.2 The Spillover Impacts of Agriculture in Pennsylvania ............................................ 31
2.3 Agricultural Cluster Analysis ...................................................................................... 36
3.0 Drivers and Trends Impacting Agriculture in Pennsylvania ........................................... 48
3.1 PA Agriculture’s Strengths, Weaknesses, Opportunities, and Threats ................ 49
3.2 The Macro Factors ..................................................................................................... 51
4.0 Industry and Policy Recommendations ........................................................................... 64
4.1 Increase Branding and Market Development ...................................................... 64
4.2 Invest in Agricultural Infrastructure .......................................................................... 70
4.3 Improve in Business and Regulatory Environment ................................................ 75
4.4 Invest in Workforce and Education ......................................................................... 76
4.5 Invest in Physical Infrastructure ................................................................................ 79
4.6 Support Product Diversification ............................................................................... 81
Appendix – A: Input/Output Methodlogy ............................................................................... A-1
Appendix – B: Agricultural Sectors – IMPLAN / NAICS Comparison ..................................... A-3
Appendix – C: Economic Impact by Agricultural Sector ...................................................... A-8
Appendix – D: Deep-Dive Methodology ............................................................................... A-10
Appendix – E: Sub-Sector Analyses ........................................................................................ A-11
Appendix – F: Interviews Conducted ..................................................................................... A-13
Appendix – G: About Econsult Solutions................................................................................ A-17
Appendix – H: About Fox Management Consulting ............................................................ A-18

Agriculture has played an important role in our culture and our economy since the earliest days of our commonwealth. At one point over half our residents lived on farms, but today, fewer than two percent of our state’s population are engaged in production agriculture. Those two percent are incredibly productive thanks to hard work, science and innovation, and increasingly advanced technology. Indeed, Pennsylvania in many respects is a national leader in food and agriculture, and it is in the commonwealth’s interests to ensure the industry remains a vibrant part of the state’s economy. It is with this goal in mind that we began a process over a year ago to take a fresh look at how we can best build on our collective strengths and plan for a strong future for Pennsylvania agriculture. The following report is the result of a public-private partnership that has brought together agricultural business leaders from throughout the commonwealth. Following the collaborative philosophy of Team Pennsylvania, we believe Pennsylvania can maximize its world-class resources by injecting private sector thought and vision into the valuable public-sector work of the Pennsylvania Department of Agriculture. To launch this partnership, leaders of the state’s agriculture and food industries—from crop and animal production to food and beverage manufacturers, foresters, landscapers and horticulturalists--from throughout the Commonwealth came together to form an Agricultural Advisory Board. Over the past year, members have worked to develop a shared vision and strategic priorities for Pennsylvania’s agriculture sector. As a first step, we commissioned the following in-depth analysis and study of Pennsylvania’s agricultural economic impact, as well as recent trends influencing the industry’s direction. The pages that follow take that information to further define recommendations that will inform our future economic development efforts. We are excited to unveil our hard work and fully recognize that this is just the beginning. We have the data. We have sound recommendations. Now, we need your engagement. By working together, we will advance Pennsylvania’s agriculture sector and increase the commonwealth’s competitiveness in regional, national and global marketplaces—ensuring this industry remains a vibrant part of our state for generations to come. Thank you. Sincerely,
Russell C. Redding Ryan C. Unger Secretary President and CEO Pennsylvania Department of Agriculture Team Pennsylvania
3 Team PA| Pennsylvania Agriculture: A Look at the Economic Impacts and Future Trends
EXECUTIVE SUMMARY
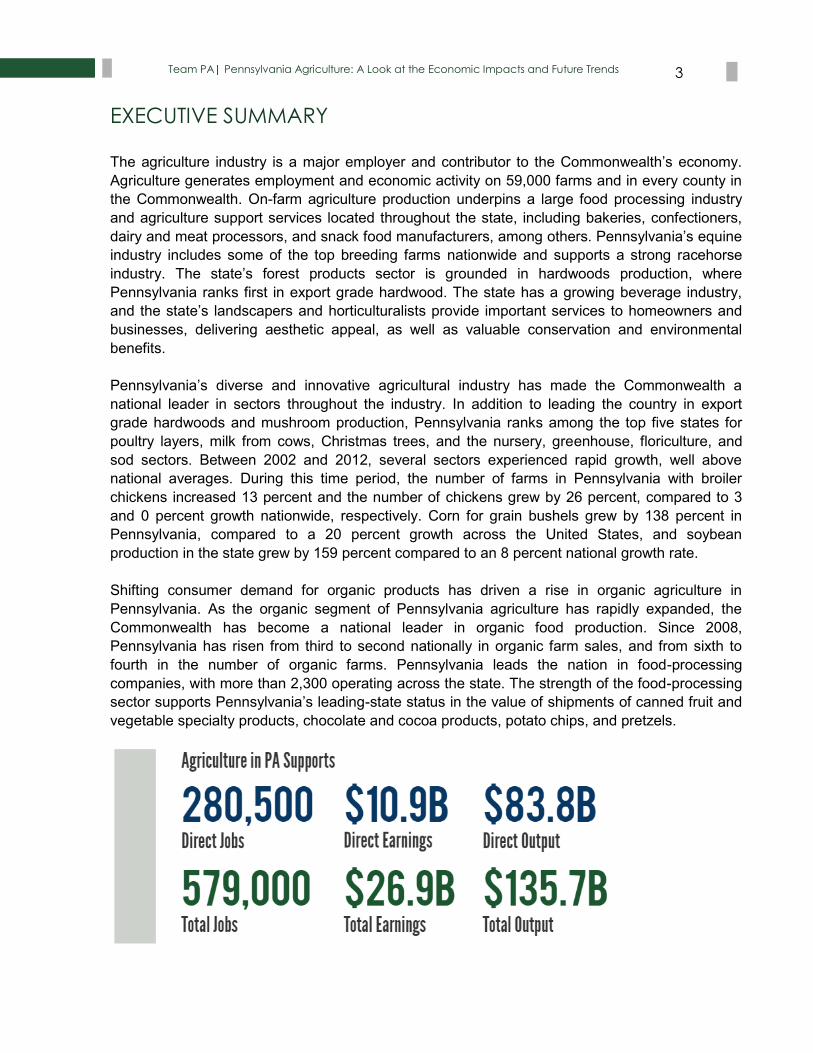
The agriculture industry is a major employer and contributor to the Commonwealth’s economy.
Agriculture generates employment and economic activity on 59,000 farms and in every county in
the Commonwealth. On-farm agriculture production underpins a large food processing industry
and agriculture support services located throughout the state, including bakeries, confectioners,
dairy and meat processors, and snack food manufacturers, among others. Pennsylvania’s equine
industry includes some of the top breeding farms nationwide and supports a strong racehorse
industry. The state’s forest products sector is grounded in hardwoods production, where
Pennsylvania ranks first in export grade hardwood. The state has a growing beverage industry,
and the state’s landscapers and horticulturalists provide important services to homeowners and
businesses, delivering aesthetic appeal, as well as valuable conservation and environmental
benefits.
Pennsylvania’s diverse and innovative agricultural industry has made the Commonwealth a
national leader in sectors throughout the industry. In addition to leading the country in export
grade hardwoods and mushroom production, Pennsylvania ranks among the top five states for
poultry layers, milk from cows, Christmas trees, and the nursery, greenhouse, floriculture, and
sod sectors. Between 2002 and 2012, several sectors experienced rapid growth, well above
national averages. During this time period, the number of farms in Pennsylvania with broiler
chickens increased 13 percent and the number of chickens grew by 26 percent, compared to 3
and 0 percent growth nationwide, respectively. Corn for grain bushels grew by 138 percent in
Pennsylvania, compared to a 20 percent growth across the United States, and soybean
production in the state grew by 159 percent compared to an 8 percent national growth rate.
Shifting consumer demand for organic products has driven a rise in organic agriculture in
Pennsylvania. As the organic segment of Pennsylvania agriculture has rapidly expanded, the
Commonwealth has become a national leader in organic food production. Since 2008,
Pennsylvania has risen from third to second nationally in organic farm sales, and from sixth to
fourth in the number of organic farms. Pennsylvania leads the nation in food-processing
companies, with more than 2,300 operating across the state. The strength of the food-processing
sector supports Pennsylvania’s leading-state status in the value of shipments of canned fruit and
vegetable specialty products, chocolate and cocoa products, potato chips, and pretzels.

4 Team PA| Pennsylvania Agriculture: A Look at the Economic Impacts and Future Trends
ECONOMIC IMPACT
Pennsylvania agriculture is a major driver of the state’s economy. In addition to crops and
animals raised on farms, the industry includes forestry and forest products, as well as agricultural
support services and agricultural product processing and food manufacturing. As with any
industry, the scale of the sector goes beyond the market value of its products. Beyond the sectors
Defining Agriculture The definition of agriculture used in this report was determined through conversations with PDA and agricultural industry leaders. The report’s definition and analysis represent the first comprehensive look at the state’s agriculture industry, with the landscaping, forestry and hardwoods, equine, and food manufacturing sectors included. 1. Crop and Animal Production: includes grain, vegetable, fruit, mushroom, nut, tobacco,
custom crop harvesting, and all other crop production industries in addition to beef, poultry, dairy, egg, and all other animal production industries. All other animal production includes the production of farm, pleasure, work, and race horse production. Crop production includes nursery and tree production, including Christmas tree production. Also included are all support activities for agriculture and forestry, based on NAICS code classifications that include forestry support services as agriculture support services. Agricultural support services include farm management, machine crop harvesting, milk testing, stud and breeding services, pedigree record services, and support services for the equine industry: breeding, board, training, and horseshoeing. Forestry support services include forest thinning, forest pest control services, and forest management plans preparation.
2. Food and Beverage Processing and Manufacturing: includes all industries related to
the processing of crops and animals, including pork, poultry, beef slaughtering and processing, dairy product manufacturing, fruit and vegetable preserving, oils, chocolate, cereals, and juices, and food manufacturing, such as bread, nut butter, pasta, syrup, and other snack food manufacturing in additional to coffee, tea, beer, soft drink, and wine manufacturing.
3. Forestry: includes all industries related to the production and processing of forest
products and commercial logging, including timber tract production sawmills, veneer and plywood manufacturing, pulp and paper mills, and wood furniture and cabinet manufacturing.
4. Landscaping: includes the landscape and horticultural services industry, which
includes businesses that provide landscape care and maintenance services and that install trees, shrubs, plants, lawns or gardens. Businesses in this industry also design plans and construct walkways, retaining walls, decks, fences, ponds and similar structures.

5 Team PA| Pennsylvania Agriculture: A Look at the Economic Impacts and Future Trends
that comprise the industry, direct spending in agriculture ripples out through the economy,
creating indirect and induced economic impacts and supporting jobs throughout the state.
Agriculture accounts for approximately $83.8 billion in direct economic output, including $22.8
billion in value-add. It supports over 280,500 jobs and $10.9 billion in earnings. Within the
agriculture sector, food processing and manufacturing is the largest sub-sector, accounting for
nearly 60 percent of the economic output and 32 percent of the total direct employment. The
production of crops and animals accounts for approximately 10 percent of the total direct output
($9.2 billion), but generates 29 percent of the total direct employment.
Looking at the direct impacts of the industry alone does not tell the full story of agriculture’s
importance to the Commonwealth’s economy. There are inter-industry linkages between the
agricultural sectors and other sectors of the economy that generate spillover impacts. These
multiplier impacts, combined with the direct impacts,
provide the complete picture of the agricultural sectors
contribution to the state’s economy. We used standard
input-output modeling techniques to estimate the full range
of economic, employment, and employee compensation
impact associated with the direct activity attributable to the
agriculture industry in the Commonwealth of Pennsylvania.
The agricultural industry generates approximately $135.7 billion in total economic impact each
year and supports 579,000 jobs with $26.9 billion in earnings. For each job directly supported by
Pennsylvania agriculture, another 1.06 jobs are supported across the Commonwealth. For each
dollar of direct output, another $0.62 is generated in economic impact.
Agriculture supports 1 out of every 10 jobs
in Pennsylvania.

6 Team PA| Pennsylvania Agriculture: A Look at the Economic Impacts and Future Trends
Study Overview
The purpose of this report is three-fold. First is to provide an updated accounting of the
economic impact of the agriculture industry in the Commonwealth. The second is to inform
the roadmap for the agricultural industry by identifying where it can build on its existing
strengths and capitalize on new opportunities. The third purpose is to provide industry and
policy recommendations to help the industry adapt to the macro trends it is facing.
Together, these analyses will support the Pennsylvania Department of Agricultural (PDA)
and Team Pennsylvania (Team PA) in developing a proactive, shared vision and strategic
plan for Pennsylvania’s agricultural sector.
Agriculture has a long history as a strong, successful industry and major contributor to
Pennsylvania’s economy. In order to ensure the continued strength and success of the
industry, PDA partnered with Team PA and the Agricultural Advisory Board to develop a
10-year strategic plan for the industry. The goal of this process is to develop a blueprint
that will bring stability and guidance to every sector of the industry.
The strategic plan process was structured to prevent the influence of predetermined
biases and to build a collective vision for the future of the industry by bringing together
agricultural leaders from across sectors and across the state. The process formally began
with a series of seven agricultural industry listening sessions held between November
2015 and January 2016. The sessions brought together 140 industry leaders from across
the state and were led by facilitators from Telos, an independent business consulting firm,
to ensure industry was driving the discussions. The major themes identified and questions
posed in the listening sessions form the foundation to support PDA and Team PA in the
development of the 10-year strategic plan for the industry. The strategic plan will help both
industry and policy makers build a better future for agriculture in Pennsylvania.
As part of the broader strategic planning process, this report integrates two
methodological approaches – modeling the economic impact of the state’s agricultural
industry and micro sub-sector analyses – to provide a greater level of detail about critical
sectors. The economic model utilizes 2015 data, the most recent year for which
comprehensive data is available. The sub-sector analysis was undertaken for ten sectors
chosen through consultation with Team PA and PDA. The analysis mapped the supply
and value chain for each sub-sector, explored the nature and size of demand, examined
competitor dynamics, and analyzed how changes in social, political, economic and
technological context might change demand, competitive dynamics or supply chains. The
insights from the economic impact and sector analyses were then integrated to identify
common trends, note general and sector-specific business opportunities, and develop
industry and policy recommendations.

7 Team PA| Pennsylvania Agriculture: A Look at the Economic Impacts and Future Trends
Dir
ect
Ou
tpu
t D
irect
Ea
rnin
gs
D
irect
Jo
bs
280,500 Total Direct Jobs
$10.9 Billion Annual Wages & Salaries Supported
$83.8 Billion Total Direct Economic Output
$22.7 Billion Total Direct Value Added

8 Team PA| Pennsylvania Agriculture: A Look at the Economic Impacts and Future Trends
Source: IMPLAN (2015), Piktochart (2017)

9 Team PA| Pennsylvania Agriculture: A Look at the Economic Impacts and Future Trends
SWOT ANALYSIS
Pennsylvania’s agricultural sector is competing in a constantly evolving and increasingly
competitive global market. In order to understand how national and regional trends will impact
Pennsylvania, it is important to first understand the strengths, weaknesses, opportunities, and
threats (SWOT) facing agriculture in Pennsylvania.
Pennsylvania’s agricultural industry is rooted in a number of strengths that it can build from in
responding to threats and opportunities resulting from the macro-factors (Figure ES.1). The
diversity and quality of crops and producers, smaller farms, a mix of conventional and natural
farming practices, rich soil, a strong farming tradition and good foundation of agricultural
infrastructure will enable producers and manufacturers to respond proactively.
FIGURE ES.1: PENNSYLVANIA AGRICULTURE SWOT ANALYSIS

10 Team PA| Pennsylvania Agriculture: A Look at the Economic Impacts and Future Trends
ECONOMIC CLUSTER ANALYSIS
Beyond measuring the economic impact, a micro analysis was undertaken to explore fully the
breadth, depth, and importance of the many subsectors that compose the Commonwealth’s
agriculture industry. A cluster analysis was utilized to identify which agriculture subsectors are
growing and which are declining, the subsectors in which Pennsylvania has a competitive
advantage, and which subsectors should be the focus of economic development efforts.
The cluster analysis evaluated each subsector’s concentration in the Commonwealth, current
number of jobs, and percent change in employment between 2007 and 2016. Of the 35
agriculture subsectors, five are strong and growing, indicating potential clusters: poultry and egg
production; horses and other equine production; animal food manufacturing; fruit and vegetable
preserving and specialty; and other food manufacturing. The concentration of firms in these
subsectors, and the employment growth they are experiencing, indicate a competitive advantage
for Pennsylvania that may result in their further growth.
Over half of the agriculture subsectors represent a potential opportunity for the Commonwealth.
These subsectors have low concentration of firms, but have experienced recent job growth. Since
there are so many subsectors that would benefit from economic development efforts in this
category, stakeholders will need to focus efforts in select areas. Sectors that represent the best
opportunities include dairy cattle and milk production, support activities for animal production, and
vegetable farming. With support, these subsectors could transition into potential clusters with a
competitive advantage for the Commonwealth.
There are also a number of subsectors that, despite their high concentration within Pennsylvania,
are at risk due to recent job loss. These sectors, concentrated in food processing and wood
product manufacturing, likely need special attention to maintain their competitive advantage.
The cluster analysis illuminates several trends useful for developing a strategic plan for
agriculture in Pennsylvania. For example, while beef processing is able to meet the demand for
processing generated in some areas of the state, a significant portion of poultry raised in the
Commonwealth needs to leave Pennsylvania to be processed. When coupled with the
competitive advantage enjoyed by the poultry and egg production sector, this suggests that there
is significant opportunity for the poultry processing sector to expand. The potential of the
beverage manufacturing sector is mainly being driven by the significant recent growth in the
number of micro-breweries within the state. Given the Commonwealth’s favorable climate for
growing hops, farmers may be able capitalize on the growth of the micro-brewing sector by
diversifying into growing hops to support Pennsylvania breweries and to export to other states.
Between 1997 and 2012, employment growth in the crop and animal production sector outpaced
the growth in the sector of the neighboring states, as well as nationally. Employment in the
forestry sector has been declining in the Commonwealth, in neighboring states, and nationally.
However, the decline in the sector in Pennsylvania has not been as severe as the decline in the
sector nationally and in neighboring states. In the food processing and manufacturing sector

11 Team PA| Pennsylvania Agriculture: A Look at the Economic Impacts and Future Trends
between 1997 and 2009, employment in Pennsylvania, neighboring states, and nationally has
been declining; however, beginning in 2010, the sector started to recover. The decline in
Pennsylvania was more severe and recovery slower compared to the nation and neighboring
states. Except for a slight decline due to the Great Recession, employment in the landscaping
sector has been steadily increasing across each of the geographies, with the largest increase
being in Pennsylvania.
Compared to overall employment growth in the Commonwealth, since 1997, growth in the crop
and animal production sector has outpaced total employment growth – 11 percent compared to
22 percent for the crop and animal production sector. Employment growth in the food
manufacturing and processing sector and forestry sector has lagged total employment growth in
the Commonwealth.

12 Team PA| Pennsylvania Agriculture: A Look at the Economic Impacts and Future Trends
DRIVERS AND TRENDS
This report builds on the major drivers
identified in the agriculture industry sessions
organized by PDA, Team PA, and the
Pennsylvania Agricultural Advisory Board by
undertaking a scan of the macro-level factors
and regional trends affecting supply and
demand for agricultural products. Through our
review of existing research studies, analyses,
data, and market reports, we identified several
key trends impacting Pennsylvania agriculture:
Changing Consumer Tastes: Changing consumer tastes, particularly the growing
demand for local food and transparency in food production, create both challenges
and opportunities for Pennsylvania farmers and food and beverage processors and
manufacturers.
Regulation and Business Environment: The business environment and regulations
must be reviewed in the context of whether they are encouraging or stemming
entrepreneurship and innovation in the agricultural sector.
Innovation: Technology and science are one of the core drivers shaping the future of
agriculture in Pennsylvania.
Trade Agreements and Exports: The changing political climate around trade has
created uncertainty for the future of Pennsylvania’s agricultural exports.
Workforce Shortage: The agricultural workforce shortage in Pennsylvania is driven
by the aging of sector employees, tightening immigration laws, and a growing skills
gap. It is estimated that there will be more than 75,000 new and replacement job
openings in Pennsylvania agriculture over the next decade.
Automation and Efficiency: Agriculture ranks fourth in the industry for potential
automation. It is estimated that 57 percent of agricultural work in the United States
can be automated.
Physical Infrastructure: Aging infrastructure is a problem nationwide, and one that
restricts the production and transportation of agricultural products throughout the
supply chain. Environmental Pressures: The agricultural industry in Pennsylvania, particularly crop production, is vulnerable to environmental changes and pressures.
Major Drivers Identified in Agricultural Industry Listening Sessions:
Business Development & Environment of the Industry
Human Capital / Workforce / Education
Communication
Technology & Science
Land & Stewardship

13 Team PA| Pennsylvania Agriculture: A Look at the Economic Impacts and Future Trends
INDUSTRY AND POLICY RECOMMENDATIONS
The agricultural sector can best position itself to
build on its strengths and capitalize on
opportunities by positioning itself to address and
adapt to changing consumer tastes, increased
automation, workforce shortages, and uncertain
trade and guest worker conditions. These
recommendations are intended to guide Team PA,
PDA, and the Agricultural Advisory Board in the
development of a strategic plan, the next step in
the proactive, collaborative work to best position
the industry for the opportunities and challenges it
will face over the next decade and beyond.
Areas of Recent PDA Focus
Investment in farmland preservation and farm transitions
Updates to Pennsylvania Tax Code
Support for workforce development and apprenticeships
Investment in Pennsylvania’s physical infrastructure
Funding for product diversification
Expanded branding and marketing outreach

14 Team PA| Pennsylvania Agriculture: A Look at the Economic Impacts and Future Trends
Increase Branding and Market Development
Challenge: Low visibility of the connection between the PA Preferred™ brand and
consumer demand for local, natural products and transparent supply chains.
Goal: Develop the PA Preferred™ program as synonymous with local, healthy, and
traceable, and expand producer enrollment in the program, targeting sectors that are well
positioned to capitalize on changing consumer trends.
Strategies:
Focus on branding PA Preferred™ as local and traceable
Increase outreach for enrollment in the PA Preferred™ Program
Strategically market sectors that are well positioned to capitalize on demand for
natural products
Boost domestic markets and value-added manufacturing opportunities for
Pennsylvania hardwoods
Expand farm to school programs to build awareness of agriculture and agricultural
products in Pennsylvania
Invest in Agricultural Infrastructure
Challenge: Gaps in production, processing, and manufacturing of agricultural products
limits the productivity and growth of Pennsylvania agriculture.
Goal: Reduce supply/demand gaps throughout the supply chain by strategically
increasing processing and manufacturing capacity, while continuing to preserve
agricultural land through the Farmland Preservation Program.
Strategies:
Maintain the strength of Pennsylvania’s nation-leading Farmland Preservation
Program
Improve volume, quality and price realization to address existing gaps in the
processing and manufacturing infrastructure
Invest in sectors with projected growth to minimize future processing bottlenecks
Support processing automation to increase productivity and efficiency
Increase byproduct processing capacity to reduce food waste and increase
product diversification

15 Team PA| Pennsylvania Agriculture: A Look at the Economic Impacts and Future Trends
Improve Business and Regulatory Environment
Challenge: Constraints to productivity, efficiency, and development of agriculture in
Pennsylvania due to the regulatory and business environment, which limit investments in
production, processing, and manufacturing in the state.
Goal: Develop streamlined state permitting and regulatory processes for the agricultural
industry and reconsider policies that deter agricultural investments in Pennsylvania.
Strategies:
Establish an industry-government working group to review regulatory and business
statutes impacting the agriculture industry, and provide recommendations to
improve existing policies
Establish a point of contact within PDA to help producers and processors navigate
state and federal regulations
Invest in Workforce and Education
Challenge: A workforce shortage due to the aging of agricultural workers, changing guest
worker regulations, and a shift in the skills needed to support an increasingly automated
industry may hinder the productivity and long-term growth of Pennsylvania agriculture.
Goals: Reduce the current and projected workforce shortages through education and
training that will meet the changing needs of the agriculture industry in Pennsylvania.
Strategies:
Support apprenticeship and work-based learning programs to close the skills gap
for an increasingly technology-driven sector
Explore the potential of an ex-offender to work program to help alleviate workforce
shortage issues
Support loan forgiveness programs for large animal veterinarians and other high-
shortage careers
Increase agricultural education in STEM-related courses to prepare the state’s
workforce for increased automation
Diversify business of farming education to address changing consumer tastes and
evolving business models

16 Team PA| Pennsylvania Agriculture: A Look at the Economic Impacts and Future Trends
Invest in Physical Infrastructure
Challenge: The agricultural industry needs greater investments in the physical
infrastructure that facilitates movement of products throughout supply chains.
Goal: Invest in Pennsylvania’s transportation, broadband, and distribution systems’
infrastructure to ensure that the state’s producers and processors can meet consumer
demands through wholesale, retail, and direct-to-consumer channels.
Strategies:
Invest in transportation infrastructure to strengthen movements in supply chains
Support programs to ensure the expansion and adoption of broadband internet in
rural areas
Work with producers and processors to ensure they have the infrastructure
needed to access alternative distribution systems
Support Product Diversification
Challenge: The degree that Pennsylvania agriculture is concentrated in a small number
of products leaves the industry vulnerable to the effects of changing consumer demands.
Goal: Intra- and inter-farm, processor, and manufacturer diversification that strengthens
the resiliency of Pennsylvania agriculture against market changes.
Strategy:
Encourage and support producers, processers, and manufacturers in product
diversification
Fund research and development to support product diversification
While the Pennsylvania food and agriculture sector benefits from its strong roots and culture of
innovation, it needs a strategic plan to remain competitive in the current domestic and global
environment. States with strong food and agriculture sectors stand to benefit significantly if they
can more readily adapt to and capitalize on this new era in agriculture. This will require a shared
vision and roadmap. This report contributes to PDA and Team PA’s ongoing work to develop a
shared vision and roadmap for Pennsylvania’s agricultural industry.

17 Team PA| Pennsylvania Agriculture: A Look at the Economic Impacts and Future Trends
1.0 INTRODUCTION
Agriculture has a long rich history in Pennsylvania and has been a driving force of the state’s
economy for centuries. The first farmers in what is now Pennsylvania were Native Americans.
The Delaware or Lenape Indians of the Delaware Valley region planted corn while the
Monongahela Indians of the Upper Ohio Valley region in western Pennsylvania grew corn, beans,
and squash. Waves of immigration brought German, Swiss, Irish, Scottish and other settlers who
further cultivated farmland across the state. At one point over half of all Pennsylvanians lived on
farms.1
While the number of Pennsylvanians farming has decreased, the importance of agriculture to the
Commonwealth’s economy has not. Pennsylvania’s diverse food and agriculture sector accounts
for a significant portion of the state’s economy, with a $135.7 billion annual economic impact.
Agriculture generates employment and economic activity on 59,000 farms and in every county in
the Commonwealth. The on-farm agriculture production, largely concentrated in rural counties
and those becoming more suburban and urban, underpins a large food processing industry and
agriculture support services located throughout the state, including bakeries, confectioners, dairy
and meat processors, and snack food manufacturers, among others. Pennsylvania’s equine
industry includes some of the top breeding farms nationwide and supports a strong racehorse
industry. The state’s forest products sector is grounded in hardwoods production, where
Pennsylvania ranks first in export grade hardwood. The state has a growing beverage industry,
and the state’s landscapers and horticulturalists provide important services to homeowners and
businesses, delivering aesthetic appeal, as well as valuable conservation and environmental
benefits.
Pennsylvania’s agricultural sector is competing in a constantly evolving and increasingly
competitive global market. As a result, the industry and its sub-sectors face a number of
challenges: including shifts in consumer tastes, an uncertain trade environment that may limit
future exports, falling commodity prices, the adoption of automation and technology, workforce
shortages, and evolving environmental pressures. In order to best position itself to adapt to and
capitalize on these changes, the Pennsylvania agricultural industry needs to identify how these
macro-changes will impact the production, processing and manufacturing, forestry, and
landscaping sectors within the state.
While the Pennsylvania food and agriculture sector benefits from its strong roots and culture of
innovation, it needs a strategic plan to remain competitive in the current domestic and global
environment. States with strong food and agriculture sectors stand to benefit significantly if they
can more readily adapt to and capitalize on this new era in agriculture. This will require a shared
vision and roadmap. This document represents a first step in developing that shared vision and
roadmap.
1 Pennsylvania Historical & Museum Commission, “Agriculture in Pennsylvania,” www.portal.state.pa.us/

18 Team PA| Pennsylvania Agriculture: A Look at the Economic Impacts and Future Trends
1.1 STUDY OVERVIEW
The purpose of this report is three-fold. First is to provide an updated accounting of the economic
impact of Pennsylvania agriculture in the Commonwealth. The second is to provide industry and
policy recommendations to help agricultural firms and policymakers adapt to macro global,
national, and regional market trends based on the changing business and market realities of
specific agricultural sectors. The third purpose is to inform the roadmap for the agricultural
industry by identifying where it can build on its existing strengths and capitalize on new
opportunities. Together, these analyses will support the Pennsylvania Department of Agricultural
(PDA) in its strategic planning efforts and Team Pennsylvania’s (Team PA) work to advance the
industry’s economic development efforts.
Defining Agriculture
For the purposes of the analysis, we defined agriculture as follows:
1. Crop and Animal Production: includes grain, vegetable, fruit, mushroom, nut, tobacco, custom crop harvesting, and all other crop production industries in addition to beef, poultry, dairy, egg, and all other animal production industries. All other animal production includes the production of farm, pleasure, work, and race horse production. Crop production includes nursery and tree production, including Christmas tree production. Also included are all support activities for agriculture and forestry, based on NAICS code classifications that include forestry support services as agriculture support services. Agricultural support services include farm management, machine crop harvesting, milk testing, stud and breeding services, pedigree record services, and support services for the equine industry: breeding, board, training, and horseshoeing. Forestry support services include forest thinning, forest pest control services, and forest management plans preparation.
2. Food and Beverage Processing and Manufacturing: includes all industries related to the
processing of crops and animals, including pork, poultry, beef slaughtering and processing, dairy product manufacturing, fruit and vegetable preserving, oils, chocolate, cereals, and juices, and food manufacturing, such as bread, nut butter, pasta, syrup, and other snack food manufacturing in additional to coffee, tea, beer, soft drink, and wine manufacturing.
3. Forestry: includes all industries related to the production and processing of forest products and
commercial logging, including timber tract production sawmills, veneer and plywood manufacturing, pulp and paper mills, and wood furniture and cabinet manufacturing.
4. Landscaping: includes the landscape and horticultural services industry, which includes businesses that provide landscape care and maintenance services and that install trees, shrubs, plants, lawns or gardens. Businesses in this industry also design plans and construct walkways, retaining walls, decks, fences, ponds and similar structures.

19 Team PA| Pennsylvania Agriculture: A Look at the Economic Impacts and Future Trends
The report is part of a larger process by the PDA, Team PA, and the Pennsylvania Agricultural
Advisory Board to develop a proactive, shared vision and strategic plan for Pennsylvania’s
agricultural sector. Agriculture has a long history as a strong, successful industry and major
contributor to Pennsylvania’s economy. In order to ensure the continued strength and success of
the industry, PDA partnered with Team PA and the Agricultural Advisory Board to develop a 10-
year strategic plan for the industry. The goal of this process is to develop a blueprint that will bring
stability and guidance to every sector of the industry.
The strategic plan process was structured to prevent the influence of predetermined biases and
to build a collective vision for the future of the industry by bringing together agricultural leaders
from across sectors and across the state. The process formally began with a series of seven
agricultural industry listening sessions held between November 2015 and January 2016. The
sessions brought together more than 140 industry leaders to discuss where agriculture is headed
over the next 10 years and how PDA can best facilitate industry growth. These sessions were the
foundation for building a statewide plan that accounts for the varied issues impacting the different
regions, commodities, and sectors in Pennsylvania.
In the industry listening sessions, participants identified major drivers, both positive and negative,
impacting the agricultural industry in Pennsylvania. Over the seven sessions, five common
themes emerged around the support for developments in the industry over the next 10 years. The
common themes emerged as questions that both industry and policymakers must ask of
themselves in order to best position Pennsylvania agriculture for the future:
Business Development & Environment of the Industry: Is the environment of the
industry positive for entering or staying in agriculture? What can be done to create a
positive environment for those who work in agriculture, and between the industry,
consumers, future employees, those who live near agricultural production and
processing? What is Pennsylvania doing, and what should it be doing, to build a climate
for business development, including entrepreneurship and innovation? What can be done
to create a climate that encourages future generations to pursue careers in agriculture?
Human Capital / Workforce / Education: What can be done to address current
workforce shortages and skills and education gaps to better meet the needs of the
agricultural industry? What is being done to meet the human capital needs of employers
in agriculture? How can Pennsylvania grow the strengths and address the weaknesses of
its educational infrastructure to meet current and future needs for skilled labor in the
industry?
Communication: How can the industry better communicate within itself, with consumers,
and with policymakers and elected officials? Is there disconnect between how industry
members view themselves and consumers view them? What single message can the
industry use to educate consumers on production practices and the benefits of
Pennsylvania agricultural products to make the industry more competitive?

20 Team PA| Pennsylvania Agriculture: A Look at the Economic Impacts and Future Trends
Technology & Science: How can the industry better educate consumers about the
benefits of science and technology in the industry? How can industry members adopt
technological and scientific innovations without negative externalities from consumer
wariness around technology in food?
Land & Stewardship: How can agriculture better communicate its leadership on land
stewardship, water management, and air quality? How can the industry continue to
embrace environmental responsibility and sustainability?
The major themes identified and questions posed in the industry listening sessions guided the
analysis of the industry’s economic impact. This report quantifies major questions that will guide
the development of the strategic plan: What macro- and micro- trends are drivers of success or
failure for agriculture as a whole and within specific industries, commodities, and sectors? What
industries can be influenced through public policies and what industries require industry
leadership? What constitutes agriculture in Pennsylvania and what are the drivers impacting all
segments of the industry? What is the overall economic impact of agriculture in the state and
within sectors, including crop and animal production, food processing and manufacturing,
forestry, and nursery and landscaping? The analysis in this report forms the foundation to
support PDA and Team PA in the development of the 10-year strategic plan for the industry. The
strategic plan will help both industry and policy makers build a better future for agriculture in
Pennsylvania.
This report integrates two methodological approaches – modeling the economic impact of the
state’s agricultural industry and micro sub-sector analyses – to provide a greater level of detail
about critical sectors. To analyze the economic impact of Pennsylvania agriculture, we developed
a customized economic impact model using the IMPLAN input/output modeling system. This
model is used to estimate a full range of economic, employment, and labor income impacts
associated with the direct activity attributable to the agriculture industry in the Commonwealth of
Pennsylvania. See Appendices A, B and C for more detail about the economic impact
methodology, the sector definitions used, and the results.

21 Team PA| Pennsylvania Agriculture: A Look at the Economic Impacts and Future Trends
A more granular analysis was undertaken for 10 sectors. The focal sectors were chosen through
consultation with Team Pennsylvania and PDA. The selection was determined by industry
priorities and the depth of existing data and reports within sectors. The 10 sectors were broken
into three sections: the livestock cluster, recognizing the importance of Pennsylvania as an
animal protein state, the specialty cluster, and the green cluster. The livestock cluster includes:
poultry, beef, pork, dairy, equine, sheep, lamb, and goat. The specialty cluster includes: fruits and
vegetables and food and beverage processing and manufacturing. The green cluster includes
hardwoods and nursery and landscaping.
Each focal sector was analyzed by a team of Temple University Fox School of Business Masters
of Business Administration (MBA) students, supervised by an executive with both business and
agriculture experience. The teams combined primary interview data and secondary data to map
the supply and value chain for each sub-sector, explore the nature and size of demand, examine
competitor dynamics, and analyze how changes in social, political, economic and technological
context might change demand, competitive dynamics or supply chains. The sector insight teams
traced the supply chain from producer to consumer, assessed consumer demand and industry
response, evaluated historical trends and future trajectories in process and technology, and
identified opportunities for growth. See Appendices D, E and F for further detail about the
methodology, interviews and findings organized by theme.
The insights from the economic impact and sector analyses were then integrated to refine each
analysis, identify common trends, note general and sector-specific business opportunities, and
develop industry policy recommendations. Integrated with the economic impact model, these
findings can be utilized to identify opportunities in each sector, to develop industry policy
recommendations, and to identify areas of expected change for updating the economic impact
model.

22 Team PA| Pennsylvania Agriculture: A Look at the Economic Impacts and Future Trends
1.2 REPORT
This report contains four sections:
Section 1 – Introduction: This section provides background on the purpose of this report,
details the methodological approach used to evaluate the economic impact of
Pennsylvania agriculture and expected future trends, and introduces the statewide
economic impact.
Section 2 – Agriculture in Pennsylvania: In this section, we review the current state of
Pennsylvania agriculture, detail the strengths of the sector, provide context of historic
economic trends, and detail the economic impact of Pennsylvania agriculture, including
the methodology, the identification of different sectors within the model, and the direct,
indirect, and induced impacts across crop and animal production, food and beverage
processing and manufacturing, hardwoods, and landscaping.
.
Section 3 – Drivers and Trends Impacting Agriculture in Pennsylvania: We detail macro
trends impacting agriculture, including economic, technical, political, and environmental
changes. The section details how national and regional trends have impacted the industry
in the state and how changes are projected to influence Pennsylvania agriculture over the
next 10 years.
Section 4 – Industry and Policy Recommendations: Building off of the economic impact
analysis, identification of trends impacting Pennsylvania agriculture, and micro sub-sector
analysis, we detail recommendations for industry and policymakers to capitalize on areas
of growth and mitigate areas of challenge.
Together, the four sections provide the first comprehensive study of the economic impact of
Pennsylvania agriculture and the trends that are expected to shape the industry over the next
decade. The agricultural industry is undergoing transformational changes, and it is imperative for
the sector to adapt to these changes to maintain its prominent position in Pennsylvania’s
economy and the global marketplace.

23 Team PA| Pennsylvania Agriculture: A Look at the Economic Impacts and Future Trends
2.0 AGRICULTURE IN PENNSYLVANIA
Pennsylvania has a diverse agriculture sector, but is dominated by several core drivers of the
industry. Pennsylvania is an animal protein state, with strong pork, poultry, and beef production,
and growing sheep, lamb, and goat production. Livestock production is also driven by the dairy,
egg production, and equine sectors. The high-quality of Pennsylvania hardwoods positions the
industry well for domestic and international exports. The investment of the fruit and vegetable
producers in alternative distribution systems, including farmers’ markets, direct-to-consumer
sales, and community support agriculture (CSAs) has enabled them to capitalize on the proximity
to major urban centers throughout the east coast.
The strong farming tradition of Pennsylvania agriculture and the Commonwealth’s commitment to
protecting prime agricultural land through the Farm Preservation Program further strengthen
agriculture’s place in the current and future state economy. Recognition of the PA Preferred
brand helps producers and processors connect with consumers throughout the state. The
location of Pennsylvania in the Northeast and in close proximity of 35 percent of the U.S.
population provides opportunities to grow regional distribution of the state’s agricultural output,
connecting consumers to diverse, high-quality products from across the state.
The agricultural industry plays a key role in the state’s economy and workforce. At the time of the
last USDA Census of Agriculture in 2012, there were 59,309 farms in Pennsylvania, a number
that is estimated to have dropped to 57,900 by 2015.2 Penn State’s Center for Economic and
Community Development groups Pennsylvania farms into four categories by farm product sales:
TABLE 2.1 FARM SIZE BY PRODUCT SALES
Farm Size Farm Product Sales ($) Number of Farms in PA
Mega 500,000 & over 2,901 Large 100,000 – 499,999 8,913 Medium 10,000 – 99,999 16,728 Small Less than 10,000 30,767
Source: Penn State University (2017)
2 USDA, “2015 - 2016 Agricultural Statistics Annual Bulletin Pennsylvania.” https://www.nass.usda.gov/
Hold for Infographic summarizing PA Agriculture
24 Team PA| Pennsylvania Agriculture: A Look at the Economic Impacts and Future Trends
Small farms account for over half of all farms in the Commonwealth, but mega farms account for
$4.6 billion of the $7.9 billion of farm product sales in Pennsylvania – nearly 60 percent of total
sales, statewide. In 2012, 52,390 farms in Pennsylvania, 88.3 percent, were family or individually
owned. In total, there are more than 7.7 million acres of farmland, nearly 25 percent of the total
land in the state. In addition, there are more than 15.6 million acres of forested land in the state,
or 53 percent of total land.
Pennsylvania has a diverse agricultural industry, and is a leader in numerous sectors. In addition
to leading the country in mushroom production, it ranks among the top five states for poultry
layers, milk from cows, Christmas trees, and the nursery, greenhouse, floriculture, and sod
sectors. Between 2002 and 2012, several sectors experienced rapid growth including broiler
chickens (26 percent growth), farms with chickens producing eggs (85 percent), corn for grain
(138 percent), and soybeans (159 percent). The organic segment of Pennsylvania agriculture has
been rapidly expanding. Pennsylvania is now a leader in organic food production, ranking second
in organic farm sales and fourth in the number of organic farms.3 Pennsylvania leads the nation in
food-processing companies, with more than 2,300 operating across the state. The strength of the
food-processing sector supports Pennsylvania’s leading-state status in the value of shipments of
canned fruit and vegetable specialty products, chocolate and cocoa products, potato chips, and
pretzels.
Pennsylvania agriculture is a strong, successful industry and major contributor to the state’s
economy. In order to build on the state’s strengths and opportunities, it is essential to understand
the size of the overall agricultural sector, how the size of the sector has changed overtime, and its
importance in the state economy. This report represents the first comprehensive look at the
state’s agriculture industry, with the landscaping, forestry and hardwoods, equine, and food
manufacturing sectors intentionally included for the first time.
2.1 THE STATE OF PENNSYLVANIA AGRICULTURE
The size of the agriculture sector in Pennsylvania goes beyond the market value of the products
sold from production on the farm. It also includes the forestry and forest products sector, as well
as agricultural support services and agricultural product processing and food manufacturing. For
the purposes of the analysis, we defined the agricultural sector as follows4:
1. Crop and Animal Production: includes grain, vegetable, fruit, mushroom, nut, tobacco,
custom crop harvesting, and all other crop production industries in addition to beef, poultry,
dairy, egg, and all other animal production industries. All other animal production includes the
production of farm, pleasure, work, and race horses. Crop production includes nursery and
3 USDA, “Certified Organic Survey: 2016 Summary,” www.usda.mannlib.cornell.edu. Organic Trade Association, “Percentage of U.S. Households Purchasing Organic Products,” www.ota.com 4 Please see Appendix B for the complete list of NAICS code industries included in each sector..

25 Team PA| Pennsylvania Agriculture: A Look at the Economic Impacts and Future Trends
tree production, including Christmas tree production. Also included are all support activities
for agriculture and forestry, based on NAICS code classifications that include forestry support
services as agriculture support services. Agricultural support services include farm
management, machine crop harvesting, milk testing, stud and breeding services, pedigree
record services, and support services for the equine industry: breeding, board, training, and
horseshoeing. Forestry support services include forest thinning, forest pest control services,
and forest management plans preparation.
2. Food and Beverage Processing and Manufacturing: includes all industries related to the
processing of crops and animals, including pork, poultry, beef slaughtering and processing,
dairy product manufacturing, fruit and vegetable preserving, oils, chocolate, cereals, and
juices, and food manufacturing, such as bread, nut butter, pasta, syrup, and other snack food
manufacturing in additional to coffee, tea, beer, soft drink, and wine manufacturing.
3. Forestry: includes all industries related to the production and processing of forest products
and commercial logging, including timber tract production sawmills, veneer and plywood
manufacturing, pulp and paper mills, and wood furniture and cabinet manufacturing.
4. Landscaping: includes the landscape and horticultural services industry, which includes
businesses that provide landscape care and maintenance services and that install trees,
shrubs, plants, lawns or gardens. Businesses in this industry also design plans and construct
walkways, retaining walls, decks, fences, ponds and similar structures.
Agriculture directly accounts for approximately $83.8 billion in economic output, over $22.7 billion
in value add, and over 280,500 jobs and $10.9 billion in earnings. Table 2.2 disaggregates the
direct impacts into the different sub-sectors. Within the agriculture sector, food processing and
manufacturing is the largest sub-sector, accounting for nearly 60 percent of the economic output
and 32 percent of the total direct employment. Production agriculture, which includes crops and
animals, accounts for approximately 10 percent of the total direct output ($9.2 billion), but
generates 29 percent of the total direct employment.

26 Team PA| Pennsylvania Agriculture: A Look at the Economic Impacts and Future Trends
TABLE 2.2 – DIRECT IMPACT OF THE AGRICULTURE INDUSTRIES IN PENNSYLVANIA
Industry Employment Earnings
($M) Value Added
($M) Output
($M)
Agriculture 170,862 $6,206 $14,627 $59,328
Production 80,645 946 4,267 9,168
Crops5 51,731 $667 $2,081 $3,483
Animal 28,914 $278 $2,186 $5,684
Food and Beverage Processing and Manufacturing 90,217 $5,260 $10,360 $50,160
Forestry 64,078 $3,461 $6,135 $21,538
Production 5,269 $46 $206 $387
Processing 58,809 $3,415 $5,929 $21,151
Landscaping 45,569 $1,254 $1,941 $2,885
Total 280,508 $10,921 $22,704 $83,751
Source: IMPLAN (2015)
While Table 2.2 provides a snapshot of agriculture in Pennsylvania, it is important to understand
the general historical trends. As illustrated in Table 2.2, there are numerous ways in which to
measure the size of the agricultural economy. A few examples include employment, wages and
salaries, and output or GDP. Output and wages and salaries tend to be highly sensitive to
commodity prices (e.g. the price of milk) and growing conditions (such as drought), which can
make these measures fairly unstable and subject to wide swings. Employment tends to be
somewhat insulated from these external factors.
Given the importance of job creation, we focus on the change in employment over the 1997 to
2016 time period. We compare each of the main sub-sectors (Production, Food and Beverage
Processing and Manufacturing, Forestry, and Landscaping) to the sub-sectors nationally, as well
as in the surrounding states.6
5 Crop production includes Agriculture-related Support Services, which includes support services related to the animal production and forestry sectors. 6 The surrounding states include: Delaware, Maryland, New Jersey, New York, Ohio, and West Virginia.

27 Team PA| Pennsylvania Agriculture: A Look at the Economic Impacts and Future Trends
FIGURE 2.1: AGRICULTURE EMPLOYMENT GROWTH INDEX
Source: BLS QCEW (2017)
Between 1997 and 2012, employment growth in the agriculture sector outpaced the growth in the
sector of the neighboring states, as well as nationally. In 2012, the growth of the sector began to
lag the growth of sector in the surrounding states. Across all three geographies, employment
growth was relatively flat over the 2000-2010 period and then began to increase in around 2011.
It is not clear if the significant growth in the agricultural sector that occurred since 2012 is a short-
term phenomenon or the beginning of a longer term trend.

28 Team PA| Pennsylvania Agriculture: A Look at the Economic Impacts and Future Trends
FIGURE 2.2: FOOD MANUFACTURING AND PROCESSING EMPLOYMENT GROWTH INDEX
Source: BLS QCEW (2017)
Across each of the geographies, employment in the food manufacturing and processing sector
steadily declined over the 1997 to 2010 period, at which time the sector began to recover. By
2016, the sector in neighboring states, as well as nationally, had returned to 1997 employment
levels, while in Pennsylvania, employment in the sector in 2016 was equal to 92 percent of the
1997 employment levels.

29 Team PA| Pennsylvania Agriculture: A Look at the Economic Impacts and Future Trends
FIGURE 2.3: FORESTRY EMPLOYMENT GROWTH INDEX
Source: BLS QCEW (2017)
Since 1997, employment in the forestry sector has been declining in the Commonwealth, in the
neighboring states, and nationally. However the decline in Pennsylvania has not been as severe
as the decline in the sector nationally and in the neighboring states. In Pennsylvania, forestry
employment was equal to 73 percent of 1997 employment levels, while nationally employment
was equivalent to 62 percent of the 1997 levels and in neighboring states, employment in the
sector was 57 percent of the 1997 levels. Across each of the geographies, employment in
forestry has appeared to stabilize over the last several years. It is too early to tell if this is a short
term phenomenon or the beginning of a longer term trend.

30 Team PA| Pennsylvania Agriculture: A Look at the Economic Impacts and Future Trends
FIGURE 2.4: LANDSCAPING EMPLOYMENT GROWTH INDEX
Source: BLS QCEW (2017)
Except for a slight decline due to the Great Recession, employment in landscaping has been
steadily increasing across each of the geographies. The largest increase has been in
Pennsylvania, where employment has increased by 83 percent from the 1997 level.

31 Team PA| Pennsylvania Agriculture: A Look at the Economic Impacts and Future Trends
FIGURE 2.5: PENNSYLVANIA EMPLOYMENT GROWTH INDEX
Source: BLS QCEW (2017)
Figure 2.5 compares the employment growth of the agricultural sectors to the employment growth
of the Commonwealth. Since 1997, growth in the crop and animal production sector has
outpaced total employment growth in the Commonwealth. Total employment in the
Commonwealth has increased by 11 percent since 1997, while employment in the crop and
animal production sector increased by 22 percent over the same time period. Employment
growth in the food manufacturing and processing sector and forestry sector lagged total
employment growth in the Commonwealth.
2.2 THE SPILLOVER IMPACTS OF AGRICULTURE IN PENNSYLVANIA
Looking at the direct impacts of agriculture (Table 2.1) does not tell the full story of what
agriculture means to the Commonwealth’s economy. There are inter-industry linkages between
the agricultural sectors and other sectors of the economy that generate spillover impacts. These
multiplier impacts, combined with the direct impacts, provide the complete picture of the
agricultural sectors contribution to the state’s economy. There are two types of spillover impacts:
First, some proportion of the amount of the expenditure that goes to the purchase of
goods and services gets circulated back into an economy when those goods and services

32 Team PA| Pennsylvania Agriculture: A Look at the Economic Impacts and Future Trends
are purchased from local vendors, defined as any vendors in Pennsylvania. This
represents what is called the “indirect effect” and reflects the fact that local purchases of
goods and services support local vendors, who in turn create business-to-business
transactions when they purchase from their own set of vendors.7
Second, some amount of the proportion of that expenditure that goes to labor income gets
circulated back into an economy when agricultural employees spend some of their
earnings on various goods and services. This represents what is called the “induced
effect” and reflects the fact that some of those goods and services will be purchased from
local vendors, further stimulating Pennsylvania’s economy.
We used standard input-output modeling techniques to estimate the full range of economic,
employment, and labor income impact associated with the direct activity attributable to the
agriculture industry in the Commonwealth of Pennsylvania. The role of input-output models is to
determine the linkages across industries in order to model the magnitude and composition of the
spillover impacts. The total economic impact of Pennsylvania agriculture is the sum of its own
direct economic footprint (Table 2.2), plus the indirect and induced effects generated by that
direct footprint (see Figure 2.6).
7 Wholesale distributions of agricultural products, which can be counted in some definitions of agriculture, are captured in the total economic impact of the industry as an indirect impact.

33 Team PA| Pennsylvania Agriculture: A Look at the Economic Impacts and Future Trends
FIGURE 2.6 – ECONOMIC IMPACT
METHODOLOGY
Source: IMPLAN (2015), Piktochart (2017)

34 Team PA| Pennsylvania Agriculture: A Look at the Economic Impacts and Future Trends
To model the impacts resulting from the direct expenditures generated by the agriculture industry,
we developed a customized economic impact model using the IMPLAN input/output modeling
system. IMPLAN represents an industry standard approach to assess the economic and job
creation impacts of economic development projects, the creation of new businesses, and public
policy changes.89
8 IMPLAN is one of several popular choices for regional input-output modeling. Each system has its own nuances in establishing proper location coefficients. IMPLAN uses a location quotient to determine its regional purchase coefficient (RPC). This represents the proportion of demand for a good that is filled locally; this assessment helps determine the multiplier for the localized region. Additionally, IMPLAN also accounts for inter-institutional transfers (e.g. firms to households, households to the government) through its Social Account Matrix (SAM) multipliers. IMPLAN takes the multipliers and divides them into 440 industry categories in accordance to the North American Industrial Classification System (NAICS) codes.
9 Different data and input-output modeling sources can produce different numbers by sector, based on differences in sector definition and year of analysis. We have done our best to reconcile different definitions of agriculture, and through discussions with industry experts, have arrived at an inclusive definition of agriculture and the sectors included in our analysis.
Data Sources and Issues
The data for the economic impact analysis was drawn from two main sources. The primary source of
information on agricultural output and employment is the United States Department of Agriculture – National
Agricultural Statistics Service (USDA-NASS) Census of Agriculture. The most recent data comes from the
Census of Agriculture conducted in 2012. The second source was data obtained from the IMPLAN input/output
modeling system.
We used the total direct outputs for the selected agriculture industries (available through IMPLAN and specific
to Pennsylvania) as inputs to estimate the spillover effects in industries not related to agriculture. Because
many of the agriculture industry sectors overlap, impacts to one could create indirect and induced impacts
within other agriculture-related industries, we zeroed-out the spillover into these industries to avoid double
counting.
For example, the poultry processing industry clearly has indirect impacts in the poultry production industry
through the purchase of chickens. Similarly, a mechanic who was hired to repair farm equipment would be
accounted for in the direct economic impact of agricultural support services, and zeroed-out from the induced
impact of crop and animal production, in order to eliminate the double-counting of his or her work in the total
economic impact.

35 Team PA| Pennsylvania Agriculture: A Look at the Economic Impacts and Future Trends
Agriculture directly accounts for approximately $84
billion in economic output and over $22.7 billion in value
add and supports over 280,500 jobs and $10.9 billion in
earnings (Table 2.2). This direct output generates
approximately $135.7 billion in total economic impact
each year and supports 579,000 jobs with $26.9 billion
in earnings, defined as employment income, or wages
paid to employees (see Table 2.3). This means that for
each job directly supported by Pennsylvania agriculture, another 1.06 jobs are supported across
the Commonwealth. For each dollar of direct output, another $0.62 is generated in economic
impact.
TABLE 2.3 – ECONOMIC IMPACT OF THE ALL AGRICULTURE INDUSTRIES IN PENNSYLVANIA
Impact Type Employment Earnings ($M) Value Added ($M) Output ($M)
Direct 280,508 $10,921 $22,704 $83,751
Indirect 130,410 $8,672 $15,420 $27,794
Induced 168,144 $7,351 $14,274 $24,137
Total 579,063 $26,944 $52,399 $135,681
Source: IMPLAN (2015)
Agriculture supports 1 out of every 10 jobs in
Pennsylvania
Hold for infographic that compares economic impact of Ag to other sectors

36 Team PA| Pennsylvania Agriculture: A Look at the Economic Impacts and Future Trends
2.3 AGRICULTURAL CLUSTER ANALYSIS
Economic cluster analysis can help identify which sub-sectors within agriculture are growing,
which are declining, which sub-sectors Pennsylvania has a competitive advantage in, and which
sub-sectors should be the focus of economic development efforts. There are two quantitative
methods that are typically used to identify potential clusters: location quotient analysis and shift-
share analysis.
A location quotient is an indicator of industry concentration within a region, expressed as the ratio
of the proportion of the industry locally within the total local economy to the proportion of the
industry nationally within the total national economy. It can help reveal what makes a particular
region “unique” in comparison to the national average. Therefore, an LQ greater than one

37 Team PA| Pennsylvania Agriculture: A Look at the Economic Impacts and Future Trends
indicates that the industry is a bigger piece of the local economy than it is of the national
economy, with the implication being that the industry is producing more goods and services than
are being consumed locally, and must therefore be exporting them outside of the region.
Conversely, an LQ less than one indicates that the industry is a smaller piece of the local
economy than it is of the national economy, and therefore the region must be importing those
goods and services from outside.
Figure 2.7 illustrates the overall trends in the location quotient for the sectors identified in Table
2.2.
FIGURE 2.7 - AGRICULTURE LOCATION QUOTIENTS
Source: BLS QCEW (2017)
The location quotient for on-farm activity is significantly below 1, which indicates that agricultural
sector in the Commonwealth is underperforming, however, the LQ has increased from 0.39 to
0.47, which suggests that the on-farm sector has the potential to increase in importance. The
same holds for the landscaping sector. The LQ in the forestry sector is greater than 1 and has
been steadily increasing, which suggests that the Commonwealth has a competitive advantage in
this sector over other regions that is increasing and it may have further growth potential. The LQ
of the food manufacturing and processing sector, while still above 1, has decreased slightly over
time. The decline of the LQ of the sector, combined the large size of the sector could be
endangering the Commonwealth’s economy.

38 Team PA| Pennsylvania Agriculture: A Look at the Economic Impacts and Future Trends
The LQ analysis is augmented by two additional pieces of information: the size of industry in
terms of the current number of jobs, and percent change in employment over a given time period.
A high-LQ industry with a small number of jobs may be an export-oriented industry, but is not vital
to the region’s economy, while a large, high-LQ industry with declining LQ over time is
endangering the regional economy.
To better understand what is driving the impacts in the farm production and food processing and
manufacturing sectors, we used detailed employment data to calculate the LQs at the detailed
sector levels for 19 sub-sectors (3 and 4 digit NAICS) in the farm production sector and 16 sub-
sectors in the food processing and wood product manufacturing sectors.
In Figures 2.9 and 2.10 the X-axis (horizontal axis) indicates the percentage change in
employment from 2000-2016, the y-axis (vertical axis) represents how concentrated the industry
is in the region relative to the US (the location quotient) in 2016, and the size of the bubble
indicates the number of employees in the respective industries in 2016. Figure 2.9 and Table 2.4
present the results for the agricultural production sub-sectors and Figure 2.10 and Table 2.5
presents the results for the sub-sectors that comprise the food processing and wood product
manufacturing sector.
The LQ analysis allows for the classification of sub-sectors into one of four mutually exclusive
categories, each corresponding to specific quadrants in Figures 2.9 and 2.10.

39 Team PA| Pennsylvania Agriculture: A Look at the Economic Impacts and Future Trends
FIGURE 2.8: LQ CLASSIFICATIONS
Neg
ati
ve
Gro
wth
Strong and Declining (Potential Threat)
These are industries that are more concentrated
in the region, but are experiencing job losses.
Industries in this quadrant typically move into
lower left quadrant (Weak and Declining) as job
loses eventually lead to a reduction in the LQ.
These industries are at risk and are likely
deserving of special attention.
Strong and Growing (Potential Cluster)
These are industries that are more clustered
in the region and are growing. These
industries help to strengthen the local
economy and provide the region with a
competitive advantage. The competitive
advantage may result in further growth
potential.
Hig
h G
row
th
Weak and Declining
These are industries that have a low
concentration in region and are also losing jobs.
Weak and Growing (Potential Opportunity)
These are industries that currently have a low
concentration in the region, but are growing. If
the growth continues industries in this
quadrant will move into the top right quadrant
(Strong and Growing). Industries in this
quadrant should be the focus of economic
development efforts.
High Concentration
Low Concentration

40 Team PA| Pennsylvania Agriculture: A Look at the Economic Impacts and Future Trends
FIGURE 2.9 - FARM PRODUCTION CLUSTER ANALYSIS
Source: BLS QCEW (2017)

41 Team PA| Pennsylvania Agriculture: A Look at the Economic Impacts and Future Trends
TABLE 2.4 – POTENTIAL FARM PRODUCTION CLUSTER ANALYSIS
LQ 2016
Change in Employment 2007-2016
2016 Employment
Strong and Growing (Potential Cluster)
Poultry and egg production 1.28 58% 2,314
Horses and other equine production 1.17 19% 289
Strong and Declining (Potential Threat)
Food crops grown under cover 5.49 -16% 6,012
All other animal production 1.05 -15% 387
Weak and Growing (Potential Opportunity)
Corn farming 0.47 54% 355
Vegetable and melon farming 0.34 66% 1,404
Fruit and tree nut farming 0.21 1% 1,662
Hay farming 0.20 52% 82
All other crop farming 0.13 269% 177
Dairy cattle and milk production 0.72 42% 3,142
Hog and pig farming 0.32 35% 431
Timber tract operations 0.51 15% 70
Logging 0.34 11% 744
Support activities for crop production 0.14 34% 1,935
Support activities for animal production 0.91 8% 1,133
Support activities for forestry 0.34 41% 219
Weak and Declining Nursery and floriculture production 0.60 -14% 3,139
Beef cattle ranching, farming, and feedlots 0.10 -17% 221
Forest nursery and gathering forest products 0.34 -63% 30 Source: BLS QCEW (2017)
There are two sectors that fall into the strong and growing sector – poultry and egg production
and horses and other equine production. Neither of these is surprising – there have been recent
significant investments in the poultry sub-sector in Pennsylvania and as illustrated in the box
above, the equine sector is very important to the Commonwealth. Two sectors represent
potential threats to the Commonwealth’s economy – food crops grown under cover sub-sector,
which includes mushrooms, and the all other animal production sub-sector. These sub-sectors
pose a threat because, while the Commonwealth current has a LQ above 1, the sectors have
experienced job losses and if the job loss continues, it will erode the Commonwealth’s
competitive advantage.

42 Team PA| Pennsylvania Agriculture: A Look at the Economic Impacts and Future Trends
There are twelve sub-sectors that fall into the weak and growing quadrant and are thus
candidates for potential cluster development. Given the large number of sub-sectors that fall into
this category, PDA and Team PA will likely be unable to effectively focus on all of these sectors.
Sectors that represent the best opportunities for PDA and Team Pa include dairy cattle and milk
production, support activities for animal production, and vegetable farming,
FIGURE 2.10 – FOOD PROCESSING AND WOOD PRODUCT MANUFACTURING CLUSTER ANALYSIS
Source: BLS QCEW (2017)
Within the food processing and wood products manufacturing sector, Pennsylvania has a
competitive advantage in the animal food manufacturing, other food manufacturing sectors and to
a lesser extent the fruit and vegetable preserving sub-sectors. There are number of sub-sectors
that represent potential threats due to the fact that the Commonwealth currently has a competitive
advantage (LQ greater than 1), but the advantage is potentially being eroded due to job losses.
This includes several wood product manufacturing sectors such as sawmills, other wood product
manufacturing, and converted paper product manufacturing.

43 Team PA| Pennsylvania Agriculture: A Look at the Economic Impacts and Future Trends
Two sub-sectors represent potential opportunities for the Commonwealth – animal slaughtering
and processing and beverage manufacturing. Within in the animal processing sub-sector, the
Commonwealth has a competitive advantage in the meat processed from carcasses sector (LQ of
1.22), however the poultry processing sub-sector has a LQ of only 0.47. This suggests that a
beef processing sector is able to meet local demand, but significant portion of the poultry raised
within the Commonwealth needs to leave the Commonwealth to be processed. When coupled
with the competitive advantage enjoyed by the poultry and egg production sector (LQ of 1.28),
this suggests that there is significant opportunity for the poultry processing sector to expand. The
potential of the beverage manufacturing sector is mainly being driven by the significant recent
growth in the number of micro-breweries within the state. Given the fact that Commonwealth’s
climate is favorable for growing hops, farmers may be able capitalize on the growth of micro-
brewing sector by diversifying into growing hops to support Pennsylvania breweries and to export
to other states.

44 Team PA| Pennsylvania Agriculture: A Look at the Economic Impacts and Future Trends
TABLE 2.5 – POTENTIAL FOOD PROCESSING AND WOOD PRODUCT MANUFACTURING CLUSTER ANALYSIS
LQ 2016
Change in Employment
2007-2016 2016
Employment
Strong and Growing (Potential Cluster)
Animal food manufacturing 1.58 7% 3,869
Fruit and vegetable preserving and specialty 1.01 2% 7,222
Other food manufacturing 1.37 19% 11,914
Strong and Declining (Potential Threat)
Sugar and confectionery product manufacturing 3.12 -8% 9,619
Dairy product manufacturing 1.08 -1% 6,380
Bakeries and tortilla manufacturing 1.08 -5% 13,866
Tobacco manufacturing 1.13 -38% 606
Sawmills and wood preservation 1.11 -23% 4,269
Other wood product manufacturing 1.60 -20% 14,963
Converted paper product manufacturing 1.73 -14% 19,535
Weak and Growing (Potential Opportunity)
Animal slaughtering and processing 0.78 12% 16,203
Beverage manufacturing 0.90 50% 8,834
Weak and Declining Grain and oilseed milling 0.38 -48% 957
Seafood product preparation and packaging 0.05 -20% 83
Plywood and engineered wood product mfg. 0.92 -26% 2,959
Pulp, paper, and paperboard mills 0.78 -17% 3,269 Source: BLS QCEW (2017)
Shift Share is another standard regional analysis method that attempts to determine how much of
regional job growth can be attributed to national trends and how much may be due to unique
regional factors. It shows the industries in which the region is outcompeting or under-competing
the nation. While LQs focus on the total number of jobs in an industry, shift-share focuses on job
growth over a specific period.
Shift-share is typically used to identifying industries for investment. This can be to either help
high-performing regional industries either continue to outperform national trends or else catch up
with national trends.

45 Team PA| Pennsylvania Agriculture: A Look at the Economic Impacts and Future Trends
Shift-share disaggregates regional job growth into three components: (1) national growth effect,
(2) industrial mix effect, and (3) regional competitive effect.
1). National Growth Effect: the change in employment associated with the overall health
of the national economy.
2). Industrial Mix Effect: the change employment associated with the health of the
industry nationally.
3). Regional Competitive Effect: the change in employment associated with the health of
the industry locally.
The three components can move in different directions, but their sum is equal to the total change
in jobs observed in the region’s economy. The most important indicator is the regional shift; a
positive value indicates that the local industry is outperforming the national industry, which can be
true even if there is a net decrease of jobs. A negative value indicates that the local industry is
lagging the national industry, which can be true even when there is a net-increase in employment.
Table 2.6 summarizes the Shift Share analysis for the farm production sub-sectors and Table 2.7
for the food processing and manufacturing sectors.

46 Team PA| Pennsylvania Agriculture: A Look at the Economic Impacts and Future Trends
TABLE 2.6 – FARM PRODUCTION SHIFT SHARE ANALYSIS
2007
National Growth
Effect
Industrial Mix
Effect
Regional Competitive
Effect Total Shift 2016
Corn farming 230 13 97 14 125 355
Vegetable and melon farming 848 48 -13 520 556 1,404
Fruit and tree nut farming 1,651 94 125 -208 11 1,662
Food crops grown under cover 7,140 407 1,337 -2,872 -1,128 6,012
Nursery and floriculture production 3,657 208 -932 206 -518 3,139
Hay farming 54 3 12 13 28 82
All other crop farming 48 3 1 125 129 177
Beef cattle ranching, farming, and feedlots 267 15 16 -77 -46 221
Dairy cattle and milk production 2,206 126 460 350 936 3,142
Hog and pig farming 320 18 46 47 111 431
Poultry and egg production 1,468 84 25 738 846 2,314
Horses and other equine production 243 14 -56 88 46 289
All other animal production 455 26 -37 -57 -68 387
Timber tract operations 61 3 -10 16 9 70
Forest nursery and gathering forest products 80 5 -15 -39 -50 30
Logging 672 38 -130 164 72 744
Support activities for crop production 1,441 82 136 276 494 1,935
Support activities for animal production 1,051 60 0 22 82 1,133
Support activities for forestry 155 9 -14 69 64 219 Source: BLS QCEW (2017)
The Commonwealth appears to have a large competitive advantage in vegetable farming, dairy
cattle and milk production, poultry and egg production, logging and various support activities. In
the poultry and egg production sector, the job growth would have been minimal (approximately
110 jobs) if it were not for the regional competitive effect, which was responsible for adding nearly
740 jobs in the sector. The food grown under cover and fruit and tree nut farming have
experienced large negative regional effects. This suggests that those industries in the
Commonwealth are underperforming the national industry. The regional effect in the food crops
grown under cover was so negative that it wiped out the job increases that were attributed to
general economic growth and growth in the sector nationally. The regional effect was a loss of
nearly 2,900 jobs.

47 Team PA| Pennsylvania Agriculture: A Look at the Economic Impacts and Future Trends
TABLE 2.7 – FOOD PROCESSING AND WOOD PRODUCT MANUFACTURING SHIFT SHARE ANALYSIS
2007
National Growth
Effect Industrial
Mix Effect
Regional Competitive
Effect Total Shift 2016
Animal food manufacturing 3,629 207 386 -353 240 3,869
Grain and oilseed milling 1,858 106 -142 -865 -901 957 Sugar and confectionery product manufacturing 10,444 595 -664 -756 -825 9,619
Fruit and vegetable preserving and specialty 7,094 404 -622 346 128 7,222
Dairy product manufacturing 6,454 368 135 -577 -74 6,380
Animal slaughtering and processing 14,447 823 -1,099 2,032 1,756 16,203
Seafood product preparation and packaging 104 6 -14 -13 -21 83
Bakeries and tortilla manufacturing 14,645 834 504 -2,117 -779 13,866
Other food manufacturing 10,004 570 2,225 -885 1,910 11,914
Beverage manufacturing 5,875 335 1,663 962 2,959 8,834
Tobacco manufacturing 981 56 -464 33 -375 606
Sawmills and wood preservation 5,577 318 -1,304 -321 -1,308 4,269
Plywood and engineered wood product mfg. 3,989 227 -1,397 139 -1,030 2,959
Other wood product manufacturing 18,610 1,060 -5,630 923 -3,647 14,963
Pulp, paper, and paperboard mills 3,951 225 -1,178 271 -682 3,269
Converted paper product manufacturing 22,755 1,296 -5,143 627 -3,220 19,535 Source: BLS QCEW (2017)
Similar to what we found with the LQ analysis, the Commonwealth has a competitive advantage
in the fruit and vegetable processing and animal slaughtering and processing sector. In the
animal processing sector the regional competitive effect was so large (2,030 jobs) that it was able
to offset a large decrease due to changes in the industry naturally. The same holds for many of
wood product manufacturing sectors, where large regional competitive effects were able to offset
large potential job losses due to changes in the industry nationally.

48 Team PA| Pennsylvania Agriculture: A Look at the Economic Impacts and Future Trends
3.0 DRIVERS AND TRENDS IMPACTING AGRICULTURE IN
PENNSYLVANIA
Agriculture is a major industry in Pennsylvania because of more than 200 years of innovation and
hard work. The industry has the opportunity to maintain its strength within the state’s economy
and build on its leadership, but this will take smart policy, public and private investment, and
attention to how the world and industry are changing.
Like any industry, the agricultural sector in the United States is undergoing major changes,
including shifts in consumer tastes, the adoption of automation and technology, workforce
shortages, and evolving environmental pressures. To help Pennsylvania agriculture build on its
strengths and enable producers and processors to best position themselves to adapt to and
capitalize on these changes, the Pennsylvania agricultural industry needs to understand how
these macro-changes will impact the production, processing and manufacturing, forestry, and
landscaping sectors within the state.
In order to identify how national and regional
trends will impact Pennsylvania, we began by
highlighting the strengths, weaknesses,
opportunities, and threats facing agriculture in
Pennsylvania. Next, with the major drivers
identified in the agriculture industry sessions
organized by PDA, Team PA, and the
Pennsylvania Agricultural Advisory Board in
mind, we built on the identified drivers by
undertaking a scan of the macro-level factors
and regional trends affecting supply and
demand for agricultural products. Through our review of existing research studies, analyses, data,
and market reports, we identified several key trends impacting Pennsylvania agriculture:
regulation and the business environment, automation and efficiency, technology and innovation,
trade agreements and exports, decreasing commodity prices, workforce shortages due to
changes in immigration policy and the aging of the existing workforce, changing consumer tastes
including an increased demand for local and organic food, the aging of Pennsylvania
infrastructure, pollinator decline, and the relationship between farm size and profitability in a state
dominated by small farms. The importance of these factors was reinforced by the findings of the
micro sub-sector teams.
Major Drivers Identified in Agricultural Industry Listening Sessions:
Business Development & Environment of the Industry
Human Capital / Workforce / Education
Communication
Technology & Science
Land & Stewardship

49 Team PA| Pennsylvania Agriculture: A Look at the Economic Impacts and Future Trends
3.1 PA AGRICULTURE’S STRENGTHS, WEAKNESSES, OPPORTUNITIES, AND THREATS
The macro-level factors need to be viewed through a lens of the Strengths, Weaknesses,
Opportunities, and Threats (SWOT) facing agriculture in Pennsylvania. The components of
SWOT are defined as follows:
Strengths: characteristics of Pennsylvania agriculture that give it an advantage over
others.
Weaknesses: characteristics of Pennsylvania agriculture that place it at a disadvantage
relative to others.
Opportunities: elements in the environment that Pennsylvania agriculture could exploit to
its advantage.
Threats: elements in the environment that could cause trouble for Pennsylvania
agriculture.
In general, Strengths and Weaknesses are internal, while the Opportunities and Threats are
external. The strengths and weakness can change over time, but not without some work. The
opportunities and threats are out there in the market, happening whether you like it or not and
generally cannot be changed.

50 Team PA| Pennsylvania Agriculture: A Look at the Economic Impacts and Future Trends
The SWOT analysis can help PDA, Team PA, the Agriculture Advisory Board, and industry
stakeholders assesses the changing environment surrounding agriculture in Pennsylvania and
respond proactively to the macro-level factors.
Pennsylvania’s agricultural industry is rooted in a number of strengths that it can build from in
responding to threats and opportunities resulting from the macro-factors (Figure 3.1). The
diversity and quality of crops and producers, smaller farms, a mix of conventional and natural
farming practices, rich soil, a strong framing tradition and good foundation of agricultural
infrastructure will help enable producers and manufacturers to respond proactively.
FIGURE 3.1: PENNSYLVANIA AGRICULTURE SWOT ANALYSIS

51 Team PA| Pennsylvania Agriculture: A Look at the Economic Impacts and Future Trends
3.2 THE MACRO FACTORS
CHANGING CONSUMER TASTES
Changing consumer tastes, particularly the growing demand for local food and transparency in
food production, create both challenges and opportunities for Pennsylvania farmers and food and
beverage processors and manufacturers.10 This is coupled with an increasing demand for
“healthy” and “natural” foods.11 In addition, due to consumers’ shift in preferred products and
growing attention to the transparency of food chains – how food is grown, how it is processed,
and how it is brought to market – traditional food distribution systems are being challenged
through newly-expanded food distribution channels. These include products coming direct from
the producer, consumer-supported agriculture, and farmers’ markets. 12
PDA has been working with producers who
want to transition to organic farming. The
Organic Transition Assistance Program,
created in 2015, provides funding for
farmers to transition to organic production or
processing. The Department also hires
experts to guide producers and processors
through the transition process to minimize
bottlenecks that may impact profit margins.13
PDA also provides support for farmers who
have already transitioned to organic to
support the productivity and profitability of
their organic operations. PDA co-sponsors
the annual Growing Pennsylvania Organic
Farms Conference, which gives organic
farmers the opportunity to learn from
international experts in organic and
sustainable agriculture. The conference
provides direct interactions between organic
farmers and leaders in innovative and
successful organic techniques, while also strengthening Pennsylvania’s ability to meet consumer
demands for high quality organic products.14
The highest demand for healthy foods is in vegetables, dairy, and animal proteins – including
beef, pork, chicken, lamb, and goats – but this also corresponds with changes in demand for
10 Hartman, L. (2016, September 08). Developing Foods for Millennials. Retrieved August 14, 2017, from http://www.foodprocessing.com/ 11 Nancy Gagliardi, “Consumers Want Healthy Foods--And Will Pay More For Them,” Forbes, 2015. https://www.forbes.com 12 Agricultural Education in Pennsylvania, Report of the PA Agriculture Education Advisory Committee 13 PDA, “Funding, Experts Available to Help Farmers Transition to Organic Production” www.media.pa.gov 14 PDA, “Growing Pennsylvania’s Organic Farms Conference to Deep-Dive Into Proven Organic Production Techniques,” www.media.pa.gov
Demand for Organics
In 2016, 78 percent of Pennsylvania households and 82 percent of households nationwide purchased organic products. Household demand has been driving growth at the farm level. Between 2012 and 2016, the number of certified organic farms in Pennsylvania grew by 18 percent and the total value of organic agricultural products sold more than doubled, with the 2016 organic sales value topping $659 million.
Despite rapid growth at the farm level, there has not been a commensurate increase in processing capacity. Growth in organic processing and manufacturing can help Pennsylvania agriculture increase its share of the increase in organic demand, and prevent the leakage of organic production to processing facilities out of state.

52 Team PA| Pennsylvania Agriculture: A Look at the Economic Impacts and Future Trends
snack foods.15 Changing consumer demands are felt across the agricultural industry, but
expressed in different, sector-specific ways. For example, Bell & Evans, located in Lebanon
County, has been able to capitalize on the growing demand for organic poultry and transparency
in animal-welfare. The newest Bell & Evans facility is the world’s first organic, humane, animal-
welfare chicken hatchery and will help meet the demand for organic broilers, which grew by 115
percent from 2008 to 2014.16 The native plant movement has begun to push into the mainstream;
several municipalities in Pennsylvania have enacted native plant ordinances to provide for the
use of native plants in development to protect against the introduction of invasive species that
could harm the natural ecology of a region.17 The Hershey Company recently acquired Amplify
Snack Brands to build up its “better-for-you” snacks portfolio.18
“Healthy” and “natural” can be defined in a number of often sector-specific ways – organic, grass-
fed, anti-biotic free, and/or humane. This demand can be met by expanding and shifting the
product mixes produced, processed, and manufactured in the state, and by branding
Pennsylvania agriculture as natural, authentic, and transparent. The term “local” also adds
significant value to agricultural products, providing opportunities for conventional farmers to
capitalize on consumer trends through marketing strategies. The close proximity of Pennsylvania
agriculture to major urban and suburban centers along the Northeast corridor means that all
sectors have the ability to capitalize on “local” access to 35 percent of the national population.
Sector-specific impacts and recommendations are detailed in Section 4.
REGULATION AND BUSINESS ENVIRONMENT
The agricultural industry listening sessions identified business development and environment of
the industry as one of the major drivers of Pennsylvania agriculture. The industry must ask itself
and ask policymakers whether the state’s business environment supports firms and individuals
who want to enter or stay in agriculture. Analysis of the business environment and regulations
must also be examined in the context of whether they are encouraging or stemming
entrepreneurship and innovation. Agriculture is a core part of Pennsylvania’s economy because
of its long history of leadership and innovation. In order to maintain its current strength, it is
important to analyze whether the business and regulatory environment supports continued
innovation and investments.
Agriculture in Pennsylvania has a number of strengths that should allow it to capitalize on the new
global era in agriculture. It is located in the middle of Boston-Washington corridor, which contains
nearly 50 million residents. The Port of Philadelphia provides a gateway for Pennsylvania
agricultural and forestry products to the burgeoning global middle class. It is also home to some
of the most productive farmland in the world. Farmers in Pennsylvania have also historically
been a leader in the use of science and technology in agriculture, beginning with invention of a
15 B Neese, How the Pennsylvania Snack Food Industry Found Success, Alvernia University, June 9, 2015. https://online.alvernia.edu/ 16 USDA International Egg and Poultry: NAFTA, the First Twenty Years - Market Reports. (2014, February 13). http://www.thepoultrysite.com/ 17 Audubon Pennsylvania, “ Municipalities,” 2017. http://pa.audubon.org 18 Fortune, “Consumers’ Obsession with Snacking is Reshaping the Food Industry,” www.fortune.com

53 Team PA| Pennsylvania Agriculture: A Look at the Economic Impacts and Future Trends
practical cast iron plow and a thresher that cleaned and threshed grain in a single operation, to
the formation of the Board of Agriculture in 1876 to “oversee the proper use of scientific methods
in farming,19 to the current cutting edge research being conducted at Penn State University’s
College of Agricultural Sciences and the University of Pennsylvania School of Veterinary
Medicine.
To unlock the state’s full potential, however, the state needs a more positive business climate.
Pennsylvania has recently made significant strides in this area, providing a foundation for further
changes to create optimal conditions for agribusiness investments in Pennsylvania. Under the
Wolf Administration, tax structures have been updated to provide more appropriate tax conditions
for agriculture. The 2016 tax code bill, Act 84 of 2016, included a realty transfer tax exemption for
operations with an agriculture conservation easement. This change prevents farms on the
backlog for conservation easements and those awaiting final confirmation of easement
agreements from being subjected to reality transfer taxes.20 The subsequent Act 175 made the
realty transfer tax exemption retroactive, further benefiting farm owners.21
Other recent changes to the tax code include SB 356, which amended the Local Tax Enabling Act
to streamline local income tax reporting and subsequently the financial reporting of agricultural
operations.22 The family farm inheritance act was also expanded to include all business structures
and trusts that are solely within one family.23 The 2016 tax code bill made timbering operations
eligible for sales and use tax exemption, extending a tax benefit for other sectors of the
agricultural industry to the hardwoods sector.24
Act 89 of 2016 amended the Clean and Green Preferential Tax Assessment Program, requiring
counties to “lock in” land value assessments and prohibiting further changes to assessments
short of a county-wide reassessment. This change was created to provide farmers with greater
tax predictability. Updated, locked-in assessment values also increased the incentive for farmers
in counties where assessed values had not been updated and use values exceeded count
assessed values, to protect farmland and forest lands through the Farmland Preservation
Program.25 Together, these changes have ensured that Pennsylvania’s tax code better meets the
unique needs of the agricultural sector.
While examining the fiscal and budgetary issues for other aspects of the agricultural industry is
beyond the scope of this project, further progress in this area would benefit all industries in
Pennsylvania, not just the food and agriculture sector. Efforts to make the Pennsylvania overall
business tax and regulatory structure more efficient would generate significant benefits for the
food and agriculture sector.
19 https://web.archive.org/web/20130205110111/http://www.portal.state.pa.us/portal/server.pt/community/things/4280/agriculture/478680 20 Pennsylvania Department of Revenue, “2016 State Tax Summary: Act 84 of 2016,” www.revenue.pa.gov. 21 Pennsylvania General Assembly,” 2016 Act 185,” www.legis.state.pa.us 22 Pennsylvania General Assembly, “Bill Information: Regular Session 2015-2016, Senate Bill 356,” www.legis.state.pa.us 23 Pennsylvania General Assembly, “Bill Information: Regular Session 2015-2016, Senate Bill 580,” www.legis.state.pa.us 24 Pennsylvania Department of Revenue, “2016 State Tax Summary: Act 84 of 2016,” www.revenue.pa.gov. 25 PA Code, “Chapter 137b. Preferential Assessment of Farmland and Forest Land under the Clean and Green Act,” www.pacode.com

54 Team PA| Pennsylvania Agriculture: A Look at the Economic Impacts and Future Trends
INNOVATION
As noted, Pennsylvania agriculture is
grounded in the strength of its innovations
and has the opportunity to develop further by
capitalizing on technological trends.
Innovation in agriculture occurs both with
technology and aside from it, and
Pennsylvania has the opportunity to draw on
the best technology and non-technology
related innovations. The listening session
identified technology and science as one of
the core drivers shaping the future of
agriculture in Pennsylvania. Industry leaders
questioned how the agricultural industry can
adopt technology and science to improve
efficiency and production, while translating
the benefits of this scientific innovation to
consumers who may be wary of technology in their food. Research into mega trends in
agriculture builds on this area identified as a major driver of Pennsylvania agriculture currently
and over the next 10 years.
It is anticipated that future changes in agriculture technology will be driven by major investments
in e-commerce, crop biotechnology, and farm management software, including agriculture data
capturing, decision support software, and big data analytics. 26 These changes can support
farmers in addressing other macro trends. More efficient farm management and resource
efficiency can create financial buffers against decreasing profit margins, detailed below.
Traceability can be used to capitalize on increased consumer demand for transparency in food
supply and product differentiation. Blockchain technology, a comprehensive ledger of all
transactions in a supply chain, promises to improve the transparency of agriculture value chains,
enabling consumers to trace the origin of their food products.
26 Rob Leclerc, “The Next Phase for Agriculture Technology” Forbes, 2016. https://www.forbes.com Shurti Singh, “Agricultural Tech Investment Rises to Record $25 Billion” Bloomberg, 2016. https://www.bloomberg.com/
Technology Investment Venture capital investment in agriculture technology has grown steadily since 2012, reaching $4.6 billion domestically and $25 billion globally in 2015. Although investments in 2016 dipped to $3.2 billion, reflecting broader pullback across global venture markets, investment levels are well ahead of the $2.4 billion invested in 2014 and the $0.4 to $0.5 billion invested per year from 2010 to 2012. In addition, the number of deals closed increased between 2015 and 2016, with an uptick of 10 percent compared to the global venture capital market where the number of deals declined by 24 percent during the same time period.*

55 Team PA| Pennsylvania Agriculture: A Look at the Economic Impacts and Future Trends
The strength of Pennsylvania’s Plain Sect
famers has also driven major innovations
outside of technological advancements.
Plain Sect farmers’ use of no-till farming
and cover crops are major innovations in
soil health. Between 2002 and 2014, no-till
adoption increased from 20 percent of
acres planted to more than 60 percent.
Together with cover crops, no-till farming
improves soil health by reducing runoff,
building soil organic matter, retaining
nutrients, fixing atmospheric nitrogen, and
providing weed control. Cover crops can
also be used for livestock feed, providing
further economic benefit to farmers.
Reduced erosion through no-till and cover
crops has also made Pennsylvania a
leader in addressing the environmental
impacts of crop production. The
innovations shaping Pennsylvania
agriculture come from within and outside
of changing technologies.
TRADE AGREEMENTS AND EXPORTS
The changing political climate around trade has created uncertainty for the future of
Pennsylvania’s agricultural exports. An estimated 18,100 jobs in Pennsylvania are supported by
agricultural exports. The state’s agricultural exports are valued at $2.4 billion annually.27
Renegotiations of the North American Free Trade Agreement (NAFTA), and the United States’
potential exit from the agreement, coupled with the United States’ withdrawal from the Trans-
Pacific Partnership (TPP), threaten both the foundation and potential growth of agricultural
exports.
Nationwide, China, Canada, and Mexico rank as the top three markets for U.S. agricultural
exports. Since NAFTA was signed in 1994, the export of national agricultural and food products to
Canada and Mexico increased from $8.9 billion in 1993 to more than $38 billion in 2017. Thirty-
seven percent of Pennsylvania’s agricultural exports go to Canada and Mexico.28 In 2016,
Pennsylvania exported $1.4 billion of agricultural goods to Canada and $205 million to Mexico. In
27 Office of the United States Trade Representative, “Pennsylvania Trade Facts,” 2014. www.ustr.gov/ 28 Farm and Dairy, “Pa. Farm Bureau Talks NAFTA and Tax Reform,” www.farmanddairy.com
Technology and Broadband The ability of farms to adopt agriculture innovations is impacted by the limited availability of broadband internet in rural areas. The FCC estimates that only 65 percent of rural areas nationwide have access to broadband internet services, compared to 97 percent access rate of urban areas. In addition, only 62 percent of Pennsylvania farms have computers with internet access. Of the 62 percent with internet access, less than two-thirds have broadband internet access. Without internet access and reliance on dial-up-only access, farms are limited in their ability to adopt advances that improve farm productivity, efficiency, and marketing, including e-commerce and blockchain technologies. The New Deal Rural Broadband Act and the Broadband Connections for Rural Opportunities Program Act, both introduced to Congress in 2017, aim to provide grant funding to expand broadband internet access in rural areas. Investment in broadband internet access would open up the technological advances in
agriculture to a broader range of farms.

56 Team PA| Pennsylvania Agriculture: A Look at the Economic Impacts and Future Trends
total, Pennsylvania’s agricultural exports account for 3.4 percent of the NAFTA total of agricultural
goods.29
The United States’ withdrawal from the TPP represents an estimated $101.5 million in lost net
exports and $177.4 million in lost cash receipts for Pennsylvania. It was also estimated that TPP
would have added 760 new jobs to the state from increased agricultural exports. Sectors where
Canada and Mexico make up a significant portion of exports are particularly vulnerable to NAFTA
renegotiations. Pennsylvania is the top state for hardwood lumber and wood products exports,
but China, Canada, and Mexico account for 75 percent of its lumber exports.30 Across all sectors,
trade uncertainty at the federal level is creating uncertainty about the future of Pennsylvania’s
agricultural exports.
WORKFORCE SHORTAGE
The agricultural workforce shortage in Pennsylvania is driven by three trends: the aging of
employees in the sector, tightening immigration laws that decrease the number of both
documented and undocumented guest workers, and a skills gap among potential agricultural
workers, with concern that the state’s pool of skilled workers is insufficient to meet the agricultural
industry’s current and future needs. The high average age of farmers in the United States is well
documented. From 2007 to 2008, the average age of farm principal operators increased from
57.1 years to 58.3 years, more than 17 years older than the average American worker.31
Pennsylvania falls slightly below the national average, with an average principal operator age of
56.1.32 However, the Pennsylvania agricultural workforce is impacted by aging throughout the
supply chain. The hired workforce is aging, with an average age of 39 and a decrease in the
share of workers 20-34 years of age from more than 50 percent in 2000 to less than 40 percent
today.33 The aging of agricultural support workers, including large-animal vets and butchers,
further impacts the industry and future workforce shortages.
The changing immigration environment has the greatest impact on crop and animal production,
including fruit and tree nut farms; dairy, cattle, and milk production; greenhouse, nursery, and
floriculture; vegetable and melon farming; and other crop production, which rely heavily on hired
workers. In 2012, there were more than 65,000 hired workers in Pennsylvania agriculture,
collectively earning an estimated $671 million on nearly 15,000 farms across the state. It is
estimated that 73 percent of hired workers are non-citizens, and 47 percent are unauthorized.34
Farms rely on the H-2A Visa for Temporary Agricultural Workers due to a shortage of qualified
pickers and the H-2B Visa for Temporary Non-Agricultural Workers, which alleviates workforce
29United States Department of Agriculture Foreign Agricultural Service, “NAFTA Totals and PA Percentage.” 30 Interview with Wayne Bender, Bureau Director, Hardwoods Development Council, PDA, October 17, 2017. 31 Farm Credit Council, “Different Ways to Look at the Aging of U.S. Farmers,” 2012. http://www.fccouncil.com/ 32 USDA National Agriculture Statistics Service “2016 State Agriculture Overview Pennsylvania,” 2016. https://www.nass.usda.gov/ 33 Philip Martin, “Hired U.S. and California Farm Workers are Aging and Settling Comparisons From 1990, 2000, and 2016,” University California, Davis, 2017. https://wrdc.usu.edu/files-ou/ 34 PDA, Facts on the Role of Foreign-Born Workers and Hired Farmworker Labor Force

57 Team PA| Pennsylvania Agriculture: A Look at the Economic Impacts and Future Trends
shortages in the supply chain, including processing and packaging. Political uncertainty about the
future of migrant worker programs and increased ICE raids to deport undocumented workers both
threaten the stability of agriculture in Pennsylvania, and the ability of farmers to produce and
harvest crops, and ensure that their products get through the supply chain to consumers.35
PDA projects that there will be 75,042 new and replacement jobs in the agriculture and food
industry and its supply and distribution chains over the next ten years. That represents 22 percent
of the total workforce. The most in-demand jobs over the next decade are: landscaping and
grounds keeping workers; farmworkers and laborers: crop, nursery, and greenhouse; farmers,
ranchers, and other agricultural managers; veterinary technologists and technicians; and
farmworkers: farm, ranch, and aquaculture animals. In addition, there will be a strong demand for
truck drivers, sales representatives, maintenance and repair workers, food batch makers, and
team assemblers, amongst many other traditional, support services, and supply chain positions.36
Together, the aging of the domestic agricultural workforce and potential limitations on temporary
foreign workers pose significant challenges to the productivity of Pennsylvania agriculture.
Agriculture futurists have predicted that farm managers and food manufacturers will increasingly
rely on automation and robots to fill workforce shortages, including where there are not enough
workers available to fill vacancies and for agricultural technology advances that cannot be done
by humans. However, the capital costs of automation create barriers for farms, particularly small
and medium sized operations, in adopting technological advancements, leaving them vulnerable
to ongoing workforce shortages. Therefore, there is a continued need for the agricultural industry
to address workforce shortages by addressing the human capital needs of production and
processing firms.
In the agricultural industry listening sessions, human capital was identified as one of industry’s
major drivers. In particular, industry leaders expressed concern over the skills and education gap
between the state’s current pool of skilled labor and the needs of an increasingly automated and
technological industry. PDA has implemented programs that seek to address this skills gap,
including the Jobs that Pay Apprenticeship Program for STEM Jobs in Agriculture, micro-
credentials, the Desk Guide for Careers in the Agriculture and Food Processing Industry, and
encouraging the growth of work-based training programs in agriculture. Through the continued
development of skills-based programs and matching potential employees with agricultural
careers, PDA can support the industry in meeting its human capital needs through the
educational and training needed to develop a stronger pool of skilled labor.
The strength of the Future Farmers of America (FFA) and 4-H programs in Pennsylvania can be
leveraged to educate current students about the opportunities in the agriculture sector that go
beyond traditional roles, grow the agricultural skills of the next generation of farmers and
agricultural leaders. More than 12,000 young Pennsylvanians are involved in FFA and more
35 Interview with Scott Sheely, Special Assistant for Workforce Development, PDA, October 10, 2017. 36 PDA, Fast Facts on Agricultural Food Careers in Pennsylvania

58 Team PA| Pennsylvania Agriculture: A Look at the Economic Impacts and Future Trends
nearly 100,000 Pennsylvania residents between the ages of 5 and 18 are enrolled in 4-H
activities.37
AUTOMATION AND EFFICIENCY
As noted, industry leaders identified science and technology as a major driver of Pennsylvania
agriculture. This includes technological changes driving increased automation and efficiency
within the industry. Agriculture ranks fourth as the industry for potential automation. It is estimated
that 57 percent agricultural work nationwide can be automated.38 The sectors of crop and animal
production, and food and beverage processing and manufacturing are all highly susceptible to
automation because much of the activity within these sectors is both physical and predictable.
Work that is both physical and predictable suggests the potential for automation.39
Large-scale farms in the United States have been leaders in automation, working to increase
efficiency and get ahead of workforce shortages due to the aging of the agricultural workforce and
the uncertain immigration environment detailed below.40 Automated processes already exist for
cow-milking, apple and other produce picking, and truck driving.41 However, because the speed
of automation adoption is highly correlated with farm size – with large and mega farms having a
higher automation potential – automation may continue to widen the productivity gap between
large/mega and small/medium farms.42
In addition to driving productivity and efficiency gaps, automation will increasingly shape
workforce needs within the agricultural sector. The automation of farm and processing work will
create a growing demand for technological and scientific jobs within the sector. Agriculture job
opportunities with STEM backgrounds are expected to grow. These include plant scientists, food
scientists, precision agricultural specialists, sustainable biomaterials specialists, and water
resources scientists and engineers.43 To best meet the demands of the agriculture sector,
programs will need to address workforce shortages in areas including landscaping and grounds
keeping workers, farmworkers and laborers, and agricultural managers – and STEM-based
careers that support the increased automation of the industry.44
37 PDA, “Fast Facts on Agriculture and Food Careers in Pennsylvania.” 38 James Manyika, Michael Chui, Mehdi Miremadi, Jacques Bughin, Katy George, Paul Willmott, Martin Dewhurst, “A Future That Works: Automation, Employment, And Productivity,” Mckinsey Global Institute, 2017. https://www.mckinsey.com 39 James Manyika, Michael Chui, Mehdi Miremadi, Jacques Bughin, Katy George, Paul Willmott, Martin Dewhurst, “A Future That Works: Automation, Employment, And Productivity,” Mckinsey Global Institute, 2017. https://www.mckinsey.com/ 40 Emily Breslin and John Hartnett, “With Farm Labor Getting Scarcer, Big U.S. Farms Are Preparing To Turn To Robots” Forbes, 2017. https://www.forbes.com/ 41 Olivia Schaber, “Robots take over traditional farming practices, but not jobs, in the 'Silicon Valley of agriculture'” Silicon Valley Business Journal, 2017. https://www.bizjournals.com/ 42 James Manyika, Michael Chui, Mehdi Miremadi, Jacques Bughin, Katy George, Paul Willmott, Martin Dewhurst, “A Future That Works: Automation, Employment, And Productivity,” Mckinsey Global Institute, 2017. https://www.mckinsey.com/ 43 USDA National Institute of Food and Agriculture, “One of the best fields for new college graduates? Agriculture,” 2015. https://nifa.usda.gov/ 44 Pennsylvania Department of Agriculture, “Fast Facts on Agriculture and Food Careers in Pennsylvania,” 2015. http://www.agriculture.pa.gov/
59 Team PA| Pennsylvania Agriculture: A Look at the Economic Impacts and Future Trends
PHYSICAL INFRASTRUCTURE
Aging infrastructure is a problem nationwide, and one that restricts the production and
transportation of agricultural products throughout the supply chain. Transportation infrastructure,
including roads and bridges, rail, airports, and waterways and ports, enables agricultural products
to move from production to processing through to wholesale and retail distribution, both
domestically and internationally. Pennsylvania has recently made investments to improve the
state’s roads and bridges, and doubled the container capacity of the Port of Philadelphia while
supporting its improved efficiency and potential for future growth. Building on these investments,
Pennsylvania can further reduce the negative impact that aging infrastructure can have on the
movement of agricultural goods.
Pennsylvania has worked to mitigate the impact of infrastructure on supply chain efficiency and
costs incurred to producers. Act 34 of 2016 allows the state’s Department of Transportation
(PennDOT) to issue special-travel permits to milk-hauling trucks weighing more than 80,000
pounds, allowing them to travel on Pennsylvania’s interstate highways. This improves the
efficiency of milk shipments, and was developed in response to milk haulers taking longer routes
due to weight restrictions placed on aging bridges.45 The state’s aging infrastructure can create
inefficiencies throughout supply chains, and incurs costs to producers at a time of decreasing
profit margins.
Recent investments in the state’s roads and bridges help mitigate the number of operations and
supply chains that face inefficiencies due to infrastructure. The bipartisan Act 89 of 2013
transportation funding plan provided the funding to address the state’s backlog of transportation
infrastructure needs. Since the funding plan was enacted, PennDOT has completed more than
2,300 projects worth $5.0 billion and has an additional 707 infrastructure project worth $5.3 billion
underway. In the past two years, PennDOT has improved nearly 6,300 miles of two-lane roads,
resurfaced 2,100 roadway miles, and fixed more than 1,000 bridges that had been structurally
deficient. Since 2008, the number of structurally deficient bridges has been nearly halved, from
6,000 to less than 3,300.46 These major investments and are ensuring that Pennsylvania’s
agricultural products will continue to be able to reach markets throughout the state and region,
and connect to national transportation infrastructure.
In 2016, Pennsylvania enacted a $300 million comprehensive Capital Investment Program at the
Port of Philadelphia. The investments will double the container capacity of the Port, enabling
agricultural producers and processors to increase exports transported through the Port of
Philadelphia. Changes in structure and operation, including new electric post-Panamax container
cranes, the reorganization and relocation of warehouse facilities, the construction of new
warehouse facilities, and the matching the depth of the terminal’s berth to match the new 45-foot
depth of the Delaware River’s main channel, another recent, major investment by the
45 Pennsylvania Department of Transportation, “Governor Wolf Signs Law Eliminating Competitive Disadvantage For Pa Dairy Producers,” 2016. http://www.penndot.gov/ 46 PennDOT, “Penn DOT Accomplishments.” Office of the Governor, “Governor Wolf Outlines Plan to Invest Additional $2.1 Billion for Highways and Bridges Through New Road MaP Program,” www.governor.pa.gov

60 Team PA| Pennsylvania Agriculture: A Look at the Economic Impacts and Future Trends
Commonwealth, will all improve the efficiency of the Port. Together, these changes will help
producers and processors increase the export of agricultural products through the Port of
Philadelphia.47
As noted, broadband internet access is another component of infrastructure that impacts the
supply chain, limiting the ability of producers and processors to adopt technologies that increase
productivity and save operational costs. In addition, broadband technology enables producers to
better meet changing consumer demands, including the use of blockchain to increase supply
chain transparency and connect to consumers through alternative distribution systems, including
direct-to-consumer sales.
ENVIRONMENTAL PRESSURES
Pennsylvania’s agricultural leaders recognize the importance of their environmental leadership in
sustaining the future of the industry. In the agricultural industry listening sessions, participants
identified land stewardship as one of the major drivers of the sector. It is important to account for
current and potential environmental pressures that impact the industry in order to build on existing
accomplishments in the area, create collaborative environmental policy that creates trust between
the industry and consumers, and address the use and protection of the state’s natural resources.
The agricultural industry in Pennsylvania, particularly crop production, is vulnerable to
environmental threats. Crop production, forestry, landscaping, and other sectors are vulnerable to
pollinator decline, invasive species, and changing weather patterns that leave the agricultural
industry vulnerable to crop and nutrient losses from droughts, warm winters and cold springs, and
extreme rainfall.48 Together, these threats will impact agricultural productivity and supporting
sectors.
Honeybee population is in steep decline, and Pennsylvania ranks as one of the worst hit in the
country, with significant bee colony loss. Bees pollinate 75 percent of the states’ major crops, and
the continued decline of honeybee population could lead to higher food prices, or require farmers
to put more land into crop production, as poor pollination leads to yields loss and a reduction in
production per acre.49
47 Office of the Governor, “Governor Wolf Touts Port of Philadelphia Investment to Create Thousands of Middle Class Jobs,” www.governor.pa.gov 48 USDA, “USDA Regional Climate Hubs: Managing Your Risk in a Changing Climate,” and “Northeast Climate Hub,” www.climatehubs.oce.usda.gov 49 David Templeton, “Honeybee population in free fall; Pennsylvania among worst hit in nation,” Pittsburgh Gazette, May 16, 2015, http://www.post-gazette.com/
Hold for infographic on broadband resources

61 Team PA| Pennsylvania Agriculture: A Look at the Economic Impacts and Future Trends
Pollinator decline is a major challenge facing
the agriculture industry, but the resources
PDA and Penn State are dedicating to
research and programming are aimed to
slow this decline and mitigate its impact on
Pennsylvania agriculture. The Pennsylvania
Pollinator Protection Plan provides best
practices for agricultural landscapes,
including Integrated Pest and Pollinator
Management (IPPM).50
Crop production and the forestry sector are
also vulnerable to invasive and exotic
species, including the Spotted Lanternfly,
which was first discovered in Berks County
in 2014. This relatively new invasive pest
highlights the threat of invasive and exotic
species to Pennsylvania agriculture and how
PDA and agricultural researchers work to
stem the growth of invasive species. In
response to the Lanternfly, PDA has
established quarantines and regulated the
movement of product and vehicles. In 2016,
PDA received $1.6 from the USDA for
research on Spotted Lanternfly eradication.51
Penn State’s College of Agricultural
Sciences and Penn State Extension are at
the forefront of education and research to stop the insect’s spread and limit the damage it causes
to crops. This work helps to address the species’ threat to Pennsylvania’s hop, grape, tree-fruit,
and nursery industries.52
A large portion of Pennsylvania’s farmland lies within the Chesapeake Bay watershed.
Agriculture is the single largest source of nutrient and sediment pollution entering the Bay.
According to 2015 estimates from the Bay Program, agriculture contributes 42 percent of the
nitrogen, 55 percent of the phosphorous, and 60 percent of the sediment entering the Bay.53 The
Chesapeake Bay Program is working with farmers across the watershed to curb agricultural
runoff through the use of best management practices, which can help reduce agricultural runoff
into streams and rivers and ultimately the Bay.
50 Penn State: Center for Pollinator Research, The Pennsylvania Pollinator Projection Plan, 2017. 51 Pennsylvania Pressroom, “PA Awarded $2.8 Million from USDA to Promote Specialty Crops, Protect Against Plant Pests, Diseases,” www,media.pa.gov. 52 Chuck Gill “Penn State researchers take aim at invasive, 'pernicious' spotted lanternfly“ Penn State News 2017. http://news.psu.edu/story/ Pennsylvania Department of Agriculture, “Spotted Lanternfly“ 2017 http://www.agriculture.pa.gov/ 53 Chesapeake Bay Program. “Agriculture,” www.chesapeakebay.net
Pollinator Loss and Protection Preliminary results of the Bee Informed Partnership’s annual loss survey found that that Pennsylvania’s bee colonies reported a 51.7 percent in total annual loss in colonies, ranked 12th in Top Colony Loss of all states. Historically, Pennsylvania’s bee colonies report a significant increase in total loss each year, often being one of the top 10 states to have a major decline in bee colonies. Pennsylvania beekeepers have been addressing bee shortages by importing honeybees from the south, which are not well suited to Pennsylvania’s climate. PDA is working in cooperation with the Center for Pollinator Research at Penn State on improving the state of pollinator populations in the state through the Pennsylvania Pollinator Projection Plan. The collaborative five-part Pennsylvania Pollinator Protection Plan (P4) serves as a living document to provide current information on the health and status of pollinator populations in the state, as well as provide state-specific best practice recommendations for forage and habitat, pesticide use, and beekeepers, and details on programs throughout the state to support the diverse group of stakeholders involved in pollinator protection.

62 Team PA| Pennsylvania Agriculture: A Look at the Economic Impacts and Future Trends
In 2016, Pennsylvania implemented a comprehensive strategy to improve water quality in the
Chesapeake Watershed and the state more broadly. The Clean Water Restoration Plan is a joint
effort of PDA, DEP, and the Department of Conservation and Natural Resources (DCNR). By
integrating technical and financial assistance for farmers, increased data collection, expanded
program coordination and capacity, technology, and when-required increased enforcement and
compliance measures, the Plan balances agricultural and environmental needs while protecting
water quality in the watershed.54 It is through the collaborative partnerships that Pennsylvania can
continue to strengthen its agricultural sector while preserving natural resources for the future of
farming and broader environmental health.
Pennsylvania farmers’ can apply for Resource Enhancement and Protection (REAP) program tax
credits to implement best management practices or purchase on-farm conservation equipment to
add conservation credits and improve
water quality.55 The CHEMSWEEP will
provide agricultural businesses and
pesticide applicators with safe pesticide
disposal. The program launches in 2018 in
19 counties across the state.
CHEMSWEEP incentivizes safe disposal
by covering disposal costs for the first
2,000 pounds of pesticides disposed per
participant. Through its tax credit and
pesticide disposal programs, PDA is
helping farmers reduce the industry’s
environmental impact.
Changes to on-farm practices must also
account for the changing climate and
weather patterns that are expected to
impact Pennsylvania agriculture. Producers
will need to adapt to continued warming
trends, more frequent and intense heat
waves, and increased precipitation, particularly in the winter and spring.56 Research from Penn
State and the Pennsylvania Department of Environmental Protection has identified several
adaptive strategies including mitigating heat stress in dairy herds, planting different grain and fruit
crop varieties or crops, and preparing for more aggressive pest, disease, and invasive species
outbreaks.57 The USDA’s Northeast Climate Hub is connecting agricultural stakeholders to
54 Pennsylvania Pressroom, “Pennsylvania Unveils Comprehensive Strategy to Improve Water Quality in state and Chesapeake Bay Watershed,” www.media.pa.gov. 55 Pennsylvania Pressroom, “Tax Credits Available to Help Farmers Add Conservation Practices, Improve Water Quality,” www.media.pa.gov 56 Pennsylvania State University, Pennsylvania Department of Agriculture, “Pennsylvania Climate Impact Assessment Report Topics in Focus: Agriculture,” 2016. www.iee.psu.edu/ 57 Pennsylvania State University, Pennsylvania Department of Agriculture, “Pennsylvania Climate Impact Assessment Report Topics in Focus: Agriculture,” 2016
REAP Program Tax Credits The REAP program was created in 2007 as a bi-partisan, partnership effort between PDA and the Pennsylvania General Assembly. The program provides tax credits to support farmers in the adoption of conservation practices. The program provides up to $150,000 in tax credits per agricultural operation to fund 50 to 75 percent of a conservation project investment. In the first 10 years of the program, the tax credit has been used to support more than 4,800 conservation projects, keeping nearly 700,000 tons of sediment on fields, and keeping nearly 12 million pounds of nitrogen and 800,000 pounds of phosphorus out of Pennsylvania waterways.

63 Team PA| Pennsylvania Agriculture: A Look at the Economic Impacts and Future Trends
climate-related resources and addressing gaps in related information by building network
collaborations across 12 states from West Virginia to Maine. The Northeast Climate Hub provides
technical support for land managers, regional assessments for climate change adaptation
planning, and outreach and education to help land managers adapt to climate-related risks while
increasing the long-term sustainability of land under agricultural production.58
58 USDA, “USDA Regional Climate Hubs: Managing Your Risk in a Changing Climate,” and “Northeast Climate Hub,” www.climatehubs.oce.usda.gov

64 Team PA| Pennsylvania Agriculture: A Look at the Economic Impacts and Future Trends
4.0 INDUSTRY AND POLICY RECOMMENDATIONS
Our economic impact analysis demonstrates that agriculture is a core part of Pennsylvania’s
economy. The industry supports more than 575,000 jobs in the Commonwealth, with an annual
economic impact of $135.6 billion. However, as detailed in Chapter 3, the agricultural sector can
best position itself to build on its strengths and capitalize on opportunities by positioning itself to
address and adapt to changing consumer tastes, increased automation, workforce shortages,
and uncertain trade and guest worker conditions.
This section details recommendations for the agricultural industry and for the government to
support industry changes. These recommendations are intended to guide the various sectors of
the agriculture industry in the development of a strategic plan, the next step in the proactive,
collaborative work to best position the industry for the opportunities and challenges it will face
over the next decade and beyond. They build on the major drivers identified in the industry
listening sessions:
The recommendations are organized into seven major areas:
1. Branding and Market Development
2. Agricultural Infrastructure
3. Research and Development
4. Business and Regulatory Environment
5. Workforce and Education
6. Physical Infrastructure Investments
7. Product Diversification
In recent years, Pennsylvania has implemented key policy changes that provide opportunities and
support across these seven areas. These accomplishments are identified to provide context for
the challenges, goals, and strategies within each area. The recommendations are a mix of
pragmatic and aspirational strategies, identifying changes that industry and policymakers can
implement, and goals that both can strive towards in the development of a 10-year strategic plan
that is tailored toward the needs of each particular industry of Pennsylvania’s agricultural sector.
The strategies for achieving each area’s goals are detailed, providing recommendations for how
the Pennsylvania agricultural industry can best capitalize on its strengths and opportunities in the
future.
4.1 INCREASE BRANDING AND MARKET DEVELOPMENT
Challenge: Low visibility of the connection between the PA Preferred™ and consumer demands
for local, natural products and transparent supply chains.

65 Team PA| Pennsylvania Agriculture: A Look at the Economic Impacts and Future Trends
Goal: Develop the PA Preferred™ program as synonymous with local, healthy, and traceable,
and expand producer enrollment in the program, targeting sectors that are well positioned to
capitalize on changing consumer trends.
Recent Related Accomplishments:
PA Preferred™ Culinary Connection: The Pennsylvania Preferred Culinary Connection
Stage provides chefs throughout Pennsylvania the opportunity to demonstrate their use of
state-sourced agricultural products. The program highlights Pennsylvania’s farm to table
connection.59
PA Preferred™ Brews: Launched in 2017, the PA Preferred™ Brews initiative provides
branding for beers that are brewed in Pennsylvania using agricultural commodities that
are grown in state. The branding positions commodity producers, breweries, pubs, and
grocery stores to capitalize on local demand in the rapidly growing $5.8 billion beer
brewing industry in Pennsylvania.60
Philly Farm & Food Fest: In recent years, PDA has begun to participate in the Philly
Farm & Food Fest, an annual event that connects consumers with local farmers,
processors, and food and farm organizations. Participation in this event helps PDA grow
consumer awareness between PA Preferred™ and demand for local products.
Farm to School Tour: The 2015 ‘Farm to School’ tour, where state officials from PDA
and the Department of Education visited schools throughout Pennsylvania to help
students make the connection between healthy, Pennsylvania-grown foods and academic
achievement, is one example of how Farm to School programs build awareness of
Pennsylvania agriculture. The tour also increases agricultural dollars in-state through
procurement programs for cafeterias to purchase local agricultural products for school
meals and snacks.
Strategies:
Focus on branding PA Preferred™ as local and traceable
Increase outreach for enrollment in the PA Preferred™ Program
Strategically market sectors that are well positioned to capitalize on demand for
natural products
Boost domestic markets and value-added manufacturing opportunities for
Pennsylvania hardwoods
Expand farm to school programs to build awareness of agriculture and agricultural
products in Pennsylvania
59 Pennsylvania Pressroom, “PA Preferred™ Culinary Connection Calling All Chefs,” www.media.pa.gov. 60 Penn Live, “Some Craft Beer is now Officially PA Preferred Under New Initiative,” www.pennlive.com

66 Team PA| Pennsylvania Agriculture: A Look at the Economic Impacts and Future Trends
As noted in the review of market trends impacting Pennsylvania agriculture, there is increased
consumer demand for healthy products and products produced through local and traceable
supply chains. This shift in consumer tastes creates a branding and marketing opportunity for
Pennsylvania agriculture. The agricultural industry listening sessions identified the need for the
industry to speak with a single message and to convey to consumers the benefits of purchasing
Pennsylvania-grown products. Pennsylvania agriculture can build on the PA Preferred™ brand to
better meet the growing demand for authenticity and transparency. We recommend four primary
strategies for developing the Pennsylvania agriculture’s branding and marketing: branding PA
Preferred™ as local and traceable, increasing enrollment in the PA Preferred™ Program through
targeted outreach to producers and processors, strategically marketing sectors that are well
positioned to capitalize on demand for natural products, and boosting domestic markets for
Pennsylvania hardwoods. Together, these strategies can raise the profile of Pennsylvania
agriculture and grow regional and national markets for agricultural products produced and
processed in the state.
4.1.1 FOCUS ON BRANDING PA PREFERRED™ AS LOCAL AND TRACEABLE
Changing consumer tastes have increased demand for products that are healthy, natural, and
local. In addition, there is a growing interest in where and how agricultural products are produced
and processed. These consumer trends, for both local and traceable supply chains, is found
across a wide range of foods, including vegetables, dairy, and animal proteins – including beef,
lamb, goats, pork, and poultry – as well as snack foods. The food system creates an opportunity
for Pennsylvania agriculture to focus on branding its existing PA Preferred™ Program as local
and traceable.61 A strategic marketing plan for the PA Preferred™ program can boost recognition
of Pennsylvania agriculture as local and traceable in state and regional markets. As noted,
consumer demand for local products also creates marketing opportunities for conventional
farmers, in addition to those who are looking to transition to organic production.
PA Preferred™, introduced in 2004 and enacted into law in 2011, markets and advertises
Pennsylvania agricultural products. The program is open to products that are entirely harvested
from a Pennsylvania location, or which are grown in the Commonwealth for at least 75 percent of
their production cycle. Agricultural products processed in Pennsylvania, whether in whole or in
part, are also eligible. In addition to certifying products, the program connects Pennsylvania
companies with suppliers, distributors, retailers and restaurants, helping members grow and
reach consumers. As illustrated by the recent marketing push to enroll and promote Pennsylvania
breweries, the program can adopt initiatives with targeted messages.
As part of its strategic marketing plan, PA Preferred™ can continue in external and consumer-
facing events to grow brand recognition. This includes farm and food festivals that target
consumers who are interested in local foods and direct-to-consumer purchasing, such as the
Philly Farm & Food Fest, which PDA and PA Preferred™ have been participating in for the past
61 “Governor Wolf Announces New Branding Program for PA-Brewed Beers; Touts ‘Jobs that Pay’ Potential of Local Brewers,” 2017, /www.governor.pa.gov/

67 Team PA| Pennsylvania Agriculture: A Look at the Economic Impacts and Future Trends
several years. Through strategic marketing, PA Preferred™ can build the perception that
Pennsylvania agriculture is synonymous with local and traceable.
PA Preferred™ should also target marketing in alternative distribution systems, including an
emphasis on Pennsylvania products meeting culinary and ethnic demand for local protein
sources. Through effective branding, PA Preferred™ can also help traditional distribution systems
meet consumer demands for local and traceable food. Raising consumer awareness of PA
Preferred™ should be coupled with connecting regional wholesale and retail food companies with
producers and processors across the state.
Pennsylvania farms are situated in close proximity to major metropolitan areas throughout the
northeast corridor. Their location makes them well positioned to claim localness in both
alternative and traditional food systems. Although Pennsylvania agriculture faces challenges in
price-point and efficiency due to farm size, climate conditions, transportation infrastructure, and
productivity position farms throughout the state to capitalize on premium and value-added
markets, focusing on regional demands for local animal proteins, dairy, produce, and native
plants.
4.1.2 INCREASE PRODUCER ENROLLMENT IN THE PA PREFERRED™ PROGRAM
The Department of Agriculture can increase the effectiveness of strategically marketing the PA
Preferred™ brand by increased outreach for producer and processer enrollment in the program.
The recently launched PA Preferred™ Brews branding initiative demonstrates how innovative
marketing can build on the existing PA Preferred™ brand, and incentivize producers and
processors to enroll in the program. The program was designed to support both the brewers, and
hops and wheat producers across the state. By enrolling in PA Preferred™ Brews, program
members can use the PA Preferred™ logo on products that are brewed in Pennsylvania in
compliance with state and federal standards, and are produced using agricultural commodities
grown in the state.62 In addition to product-branding, the program promotes PA Preferred Brews
with branded tap and handles and coasters at pubs, bars, and restaurants throughout the state.63
Increased enrollment in the PA Preferred™ brand can be used to connect producers and
consumers across a range of agricultural products. Targeted outreach to plant nurseries and
landscapers can be focused on strengthening connection between producers, wholesalers, and
retailers in the landscaping sector. PA Preferred can encourage enrollment by facilitating
connections between plant nurseries and landscapers that produce native plants, and state
municipalities and other institutions that have native plant requirements. This facilitation should be
highlighted as a member benefit when conducting target outreach. PA Preferred™’s efforts to
increase brand recognition in alternative and traditional distribution systems, and among the
62 “Governor Wolf Announces New Branding Program for PA-Brewed Beers; Touts ‘Jobs that Pay’ Potential of Local Brewers,” 2017. https://www.governor.pa.gov 63 Sue Gleiter, “Some craft beer is officially PA Preferred under new initiative” Penn Live 2017. www.pennlive.com/food/index.ssf

68 Team PA| Pennsylvania Agriculture: A Look at the Economic Impacts and Future Trends
general public, should also be highlighted as a member benefit when undertaking efforts to
increase enrollment in the program.
4.1.3 SUPPORT SECTORS WELL POSITIONED TO CAPITALIZE ON DEMAND FOR NATURAL PRODUCTS
As noted, demand for natural and local is uneven amongst sectors. Although there is growth
across all sectors, the effectiveness of strategic marketing can be improved by supporting sectors
that have high consumer demand for local and traceable products. Targeting support in these
areas can help close the gap between current supply and market demand. Inversely, targeted
marketing can close gaps in consumer awareness of local products that already satisfy their
demands.
Market trends have identified animal proteins, produce, dairy, and snack foods as leading sectors
for the demand for natural, local, and traceable products. Demand for grass-fed and organic beef
is projected to account for one-third of beef demand within a decade.64 Between 2008 and 2014,
demand for organic broilers grew by 115 percent.65 Pennsylvania farms have already begun to
capitalize on this trend, with 250 dairy farms adding broiler chicken operations between 2015 and
2017.66
Goat, lamb, and sheep are increasingly used to meet the demand for local animal proteins in the
culinary and Halal communities throughout the mid-Atlantic.67 Demand for local produce has
increased with the demand for community supported agriculture (CSAs), farmers’ markets, and
other, direct-to-consumer distribution systems. Supporting growth in these sectors, through
expanded and diversified production, can enable Pennsylvania agriculture to better meet
changing consumer demands through strategic marketing and brand recognition.
4.1.4 BOOST DOMESTIC MARKETS FOR PENNSYLVANIA HARDWOODS
Pennsylvania hardwoods have strong brand recognition internationally, due to the quality of
hardwoods grown in the state and the work of the Hardwoods Development Council (HDC) to
boost international markets.68 Pennsylvania is the largest producer of hardwoods in the United
States, with $11 billion in annual sales. More than 58 percent of land in Pennsylvania is forested,
including hardwoods as 90 percent of forested lands. The quality of the state’s hardwoods sector
is enabled by Pennsylvania’s rich soil composition, mountain elevation, and tight growth rings.69
The quality of Pennsylvania hardwood has created strong international recognition and demand.
However, changing international market demands are impacting where hardwood processing
64 ix.VanOverbeke, H. a. (n.d.). Retail and Foodservice Marketing Trends for Beef. Retrieved from Cabpartners.com: www.cabpartners.com 65 The Poultry Site, “USDA International Egg and Poultry: NAFTA, the First Twenty Years,” 2014. www.thepoultrysite.com/reports/?id=3446 66 Zack Hoopes, “Diversifying Dairy: Seeking solutions for Pennsylvania farms,” Cumberland Valley Business Journal, 2017. cumberlink.com/ 67 Chris Kick, “Goat meat is in high demand,“ Farm and Dairy, 2012. www.farmanddairy.com/ 68 Sanford Smith, “From the Woods: Ten Important Hardwoods,” Pennsylvania State University, 2017. extension.psu.edu/ 69 PDA, “Hardwoods Development Council,” www.agriculture.pa.gov

69 Team PA| Pennsylvania Agriculture: A Look at the Economic Impacts and Future Trends
occurs, and subsequently the value-add for hardwood products and demand for forestry support
services work. A major concern is that China has increased its demand for raw saw logs. Log
exports from Pennsylvania to China increased 118 percent in 2016 and 32 percent in 2017
(through October), much of this being saw logs. The export of saw logs makes it more difficult for
sawmills to supply lumber for their domestic market and other export customers, and increases
the costs of the raw material. Historically, most log exports were primarily high quality veneer
logs to meet the demand of the veneer industry in Europe and in Southeast Asia. Continued
increased demand in China for saw logs could result in costing jobs in closed sawmills. Growing
the domestic demand for Pennsylvania hardwoods would help keep more sawmill work within the
state.
The expansion of the domestic Pennsylvania hardwoods market should build on the existing
Pennsylvania Hardwoods: Stands for Quality brand. The logo has high brand recognition in
international hardwood markets, and presents a strong foothold for the sector to grow its markets
domestically through consistent branding. HDC has focused its efforts to boost domestic demand
through strategic marketing to architects and designers to grow demand for hardwood in the
United States, participating in more consumer-based shows to create direct-consumer demand
for Pennsylvania hardwoods, and public education on the environmental benefits of hardwood
products. The HDC is has also focused on new hardwoods applications, including thermally
modified hardwoods and cross-laminated timber, to create increase demand for hardwoods in the
construction industry. The hardwood sector is a leader within Pennsylvania’s agricultural
community, and strategic development and marketing can support its continued strength.
4.1.5 EXPAND FARM TO SCHOOL PROGRAMS TO BUILD AWARENESS OF AGRICULTURE AND
AGRICULTURAL PRODUCTS IN PENNSYLVANIA
Farm to School programs have three main areas of focus: 1. Classroom curriculum, 2.
Experiential learning, and 3. Access to healthy, local foods through cafeteria procurement.70
Growing Farm to School programs throughout the state and the emphasis placed on agricultural
careers in classroom curriculum can increase interest in food-related careers. Farm to School
programs introduce children to education activities related to agriculture, food, and health from an
early age, while providing them with access to nutritious food. The integration of food access and
education is strengthened through hands-on, experiential learning about agriculture and provides
a foundation for advanced agricultural-related education at the secondary school level.71
Exposure to Pennsylvania agriculture through Farm to School programs, including the Farm to
School tour, helps to create PA Preferred™ brand awareness, encourage changes in
procurement programs for school cafeterias to purchase PA-grown products, and increase
students’ awareness of potential agricultural careers.
70 Interview with Patrick Andrews, PDA Bureau of Market Development, October 6, 2017. 71 National Farm to School Network, “About Farm to School What is farm to school, and how does it contribute to vibrant communities?” 2017. http://www.farmtoschool.org/about/

70 Team PA| Pennsylvania Agriculture: A Look at the Economic Impacts and Future Trends
Currently there are more than 150 high school agricultural programs in Pennsylvania, with 16,000
agriculture students, approximately 2.9 percent of all high school students in the
Commonwealth.72 To position the Pennsylvania workforce for the increased automation of the
agricultural industry, classroom curriculum on food and agriculture should be encouraged in
science, technology, engineering, and math (STEM) programs. The state can build on existing
programs by emphasizing the technical skills and innovation required in an increasingly
automated sector. Integrating food and agricultural science into STEM-courses outside
agricultural programs can expose a broader number of students to career opportunities in the
industry.
4.2 INVEST IN AGRICULTURAL INFRASTRUCTURE
Challenge: Gaps in production, processing, and manufacturing of agricultural products limits the
productivity and growth of Pennsylvania agriculture.
Goal: Reduce supply/demand gaps throughout the supply chain by strategically increasing
processing and manufacturing capacity, while continuing to preserve agricultural land through the
Farmland Preservation Program
Pennsylvania has strong agricultural production and processing/manufacturing sectors, but
greater alignment between production and current processing capacity strengthens economic
impact and employment. Central to increasing the current efficiency and productivity of
Pennsylvania agriculture and optimizing future growth is strategic investments in the state’s
processing capacity and distribution systems. By targeting sectors that are currently experiencing
processing shortages and areas of anticipated shortages due to changing consumer tastes,
Pennsylvania can best position itself to align supply and demand throughout supply chains.
PDA’s work with the Center for Dairy Excellence to identify the state’s ability to support further
dairy processing operations is one example of how to initiate such development, providing an
data-driven approach to business recruitment and expansion.
The agricultural cluster analysis above identified one such area. The LQ for the poultry
processing sector is a 0.47 which means that poultry processing industry us unable to meet
current demand and a significant portion of the poultry raised within the Commonwealth needs to
leave the Commonwealth to be processed. When coupled with the competitive advantage
enjoyed by the poultry and egg production sector (LQ of 1.28), this suggests that there is
significant opportunity for the poultry processing sector to expand.
Pennsylvania’s agricultural infrastructure is grounded in the strength of its Farmland Preservation
Program, which supports the continued predominance of agriculture in the state’s economy. In
addition to preserving prime farmland, the continued success of Pennsylvania agriculture is
72 Pennsylvania Department of Agriculture, “Fast Facts on Agriculture and Food Careers in Pennsylvania,” (2017). http://www.education.pa.gov/

71 Team PA| Pennsylvania Agriculture: A Look at the Economic Impacts and Future Trends
rooted in the industry’s ongoing land stewardship. Industry leaders have identified land and
stewardship as a major driver of agriculture in Pennsylvania. The Farmland Preservation Program
keeps prime farmland in agricultural use, while environmental responsibility and sustainability
protect the foundation of Pennsylvania agriculture through leadership on water management, land
use, and air quality.
Recent Related Accomplishments:
Farmland Preservation Program: Since 1988, nearly 550,000 acres of Pennsylvania
farmland have been preserved through $1.4 billion in state, local, and federal investments
under the Farmland Preservation Program. This nation-leading program supports the
state’s agricultural infrastructure by protecting prime farmland from development.
Succession Planning for Preserved Farms: PDA recently created a Preserved Farm
Resource Center to support farmers who have preserved land under the Farmland
Preservation Program to develop and implement a farm succession plan. The Center also
holds workshops for preserved farm owners across Pennsylvania. This work further
protects preserved land from being converted to non-agricultural use.
Opportunities and Funding for Farm Transition: Beyond preserved farms, PDA’s
Center for Farm Transition strengthens agricultural infrastructure through the Center for
Farm Transition. By partnering with Pennsylvania Farm Link, the Center holds
succession/transition planning workshops and facilitates potential matches between
landowners and beginning farmers.
Funding to Support New and Beginning Farmers: In addition to matching beginning
farmers to landowners planning farm transitions, Pennsylvania provides tax exempt loans.
Since 1998, the Next Generation Farmer Loan Program (NGFLP) assists beginning and
new farmers with tax exempt loans. In 2015, NGLFP provided 18 tax-exempt loans
totaling more than $7.7 million, which generated an additional $7 million in private and
federal funding. The 18 new farmers that secured these loans enabled the transfer of
1,800 – 2,000 acres of land, further projecting this key agricultural resource.
Southwest Pennsylvania Local Foodshed: In 2017, PDA provided a grant to expand
food production and exportation in Southwestern Pennsylvania through the expansion of
the Republic Food Enterprise Center. The Center serves as an agricultural hub in the
southwest region of the state, and the creation of the Southwestern Pennsylvania Local
Food Shed is structure to create sustainable agricultural products, create jobs in the
agricultural sector, and bridge gaps between farm and table by expanding established
markets and deploying technology to improve efficiency and distribution.
Increased Agricultural Building Code Exemptions: Act 35 of 2017 amended the PA
Construction Code to provide producers with an exemption for one structure that is used
for direct, seasonal sales of agricultural commodities, structures under 1,000 sq. ft. used
72 Team PA| Pennsylvania Agriculture: A Look at the Economic Impacts and Future Trends
to process maple sap, and structures used to load, unload, or sort livestock on livestock
auction facilities. These exemptions support agricultural-related physical infrastructure that
facilitate production and processing.
Expansion into Wholesale Markets through the PA Preferred™ Program: In 2017, the
PA Preferred program launched a series of workshops to help farmers expand into
institutional wholesale markets to expand their sales. The expansion into alternative
distribution systems, including schools, universities, hospitals, and retirement homes, can
create greater economic security from sales diversification.73
Strategies:
Maintain the strength of Pennsylvania’s nation-leading Farmland Preservation
Program
Improve volume, quality and price realization to address existing gaps in the
processing and manufacturing infrastructure
Invest in sectors with projected growth to minimize future processing bottlenecks
Support processing automation to increase productivity and efficiency
Increase byproduct processing capacity to reduce food waste and increase
product diversification
4.2.1. MAINTAIN THE STRENGTH OF PENNSYLVANIA’S NATION-LEADING FARMLAND PRESERVATION
PROGRAM
The future of Pennsylvania agriculture is rooted in the strength of its Farmland Preservation
Program. The program preserves farms in historically rural counties with agricultural sectors that
are increasingly desirable locations for residential development. The Agricultural Land
Preservation Board protects prime farmland from development by approving conservation
easement purchases. Pennsylvania is the national leader in the number of farms and acres
permanently preserved for agricultural use, and the success of the program is rooted in the
strong, bi-partisan support it has continued to receive since its creation.74 Since the Farmland
Preservation Program was launched in 1988, Pennsylvania has preserved nearly 550,000 acres
on 5,242 farms in 59 of the state’s 67 counties. The $1.4 billion invested by federal, state, and
local governments in the Farmland Preservation program over this time period slows the loss of
prime farmland to non-agricultural use. Continued investment in this program will further
strengthen the industry’s place in the state economy.75
73 http://www.media.pa.gov/pages/Agriculture_details.aspx?newsid=609 74 PDA, “Farmland Preservation,” www.agriculture.pa.gov 75 PDA, “Wolf Administration Adds 29 Farms Covering 2,093 Acres to PA Farmland Preservation Program,” www.agriculture.pa.gov

73 Team PA| Pennsylvania Agriculture: A Look at the Economic Impacts and Future Trends
4.2.2. IMPROVE CAPACITY TO ADDRESS EXISTING GAPS IN PROCESSING AND MANUFACTURING
INFRASTRUCTURE
Pennsylvania agricultural supply chains are impacted by supply/demand gaps due to shortages in
processing and manufacturing capacity. Gaps within agricultural sectors are due to multiple
factors. These include capital improvements required for processing, technological investments,
growth and diversification in animal protein processing, and workforce shortages.
One example, milk processing gaps for both fluid milk and dairy solids, including cheese and
yogurt production, limits income potential for dairy farmers and increases transportation costs for
dairy producers, reducing their profit margins.76 Milk transported out of state for processing
removes a segment of the revenue and employment generated by the supply chain. PDA and
The Center Dairy Excellence have been collaborating with the Pennsylvania Department of
Community and Economic Development (DCED) to promote investment in dairy manufacturing in
the state. Building on efforts to attract national cooperatives to the state will help the dairy
industry capitalize on its ability to support additional cheese processing in the state.
Animal protein, another major driver of Pennsylvania agriculture, faces similar challenges from
limited processing capacity. The limited options for beef and poultry processors, particularly in the
western half of the state, create leakages to other states and creates on-farm revenue losses
from producers. Further investments in processing capacity would provide marketing options,
encourage greater investment, and help grow the workforce in Pennsylvania. The LQ for the
poultry processing sector is a 0.47 which means that poultry processing industry is unable to
meet current demand and a significant portion of the poultry raised within the Commonwealth
needs to leave the Commonwealth to be processed. When coupled with the competitive
advantage enjoyed by the poultry and egg production sector (LQ of 1.28), this suggests that there
is significant opportunity for the poultry processing sector to expand.
4.2.3 INVEST IN SECTORS WITH PROJECTED GROWTH TO MINIMIZE POTENTIAL PROCESSING
BOTTLENECKS
In addition to existing processing gaps, current and projected consumer trends can be used to
identify areas for investment to prevent future processing bottlenecks. Investments in product
shifts and diversification can be optimized by supporting the development of processing facilities
that will capture a greater share of value chains within the state. For example, growth in sheep,
lamb, and goat production to meet demand for local animal-protein will require more processing
facilities.77 Diversification of dairy processing can enable processors and manufacturers to
capture the growing demand for cheese, yogurt, and other dairy-products while mitigating the
impact of declining fluid milk consumption. Investment in hops processing technology can support
the growth of the PA Preferred™ Brews program, enabling the industry to capitalize on consumer
76 Ad Crable, “Lancaster is the top dairy county in Pennsylvania, but most of its milk goes out of state” Lancaster County Online, 2015. http://lancasteronline.com/ 77 Chris Kick, “Goat meat is in high demand,“ Farm and Dairy, 2012. www.farmanddairy.com/

74 Team PA| Pennsylvania Agriculture: A Look at the Economic Impacts and Future Trends
demand.78 Strategically coordinating production and processing investments will best position the
state’s agricultural industry to minimize leakages across the value chain.
4.2.4 SUPPORT PROCESSING AUTOMATION TO INCREASE PRODUCTIVITY AND EFFICIENCY
The adoption of automation technologies and robotics are projected to increase efficiency and
productivity through the agricultural value-chain. Historically there has been a lag for agricultural
processing automation compared to other sectors, due to low-profit margins within the industry
compared to the high capital costs of technological adaptions. 79 However, the agricultural sector
has adopted automation techniques from other sectors and has experienced direct venture
capital investments in recent years.80
Further investments are projected to address declining labor supplies from tightening guest
worker regulations.81 At recent workforce levels, automation offers opportunities for increased
productivity and efficiency. Facing increased workforce shortages, there is a new sense that the
adoption of technology is necessary for producers and processors to maintain current outputs.82
Investors are expected to capitalize on the workforce shortage and growing market for agricultural
automation.83 However, small-scale processors and manufacturers will need support to adopt the
technological advancements.
4.2.5 INCREASE BYPRODUCT PROCESSING CAPACITY TO REDUCE WASTE AND INCREASE PRODUCT
DIVERSIFICATION
The efficiency and productivity of supply chains can be further increased by developing byproduct
processing capacity in the state. The value-added from agricultural byproducts, or total resource
use, includes the processing of byproducts and wastes from crop and animal production, and
forestry and wood products into edible food items, functional ingredients, or additional forestry
products.84 Increased utilization of agricultural byproducts processing strengthens the financial
viability of the industry, and can reduce overall environmental impacts from crop and animal
production and processing.85
78 Governor Wolf Announces New Branding Program for PA-Brewed Beers; Touts ‘Jobs that Pay’ Potential of Local Brewers,” 2017. https://www.governor.pa.gov/ 79 Darwin Caldwell, Steve Davis, Rene Moreno Masey, John Gray, “Automation in Food Processing,” Springer Handbook of Automation, 2009. link.springer.com/ 80 Darwin Caldwell, Steve Davis, Rene Moreno Masey, John Gray, “Automation in Food Processing,” Springer Handbook of Automation, 2009 81 Karen Graham, “With immigrants targeted, US farms look to automation,” Digital Journal, 2017. www.digitaljournal.com/ 82 Karen Graham, “With immigrants targeted, US farms look to automation,” Digital Journal, 2017 83 Karen Graham, “With immigrants targeted, US farms look to automation,” Digital Journal, 2017. www.digitaljournal.com/ 84 Linda Benedict, Witoon Prinyawiwatkul, “Value-added from Agricultural and Aquacultural Byproducts and Wastes” Louisiana State University Ag Center, 2005. www.lsuagcenter.com/ 85 Lauryn G. Chan, Joshua L. Cohen, Juliana Maria Leite Nobrega de Moura Bell, “Conversion of Agricultural Streams and Food Processing Byproducts to Value-Added Compounds using Filamentous Fungi,” Annual Review of Food Science and Technology, 2018. www.annualreviews.org/

75 Team PA| Pennsylvania Agriculture: A Look at the Economic Impacts and Future Trends
4.3 IMPROVE IN BUSINESS AND REGULATORY ENVIRONMENT
Challenge: Constraints to productivity, efficiency, and development of agriculture in Pennsylvania
due to the regulatory and business environment, in addition to fragmented levels of government
with shared responsibilities limit investments in production, processing, and manufacturing in the
state.
Goal: Develop streamlined state permitting and regulatory processes for the agricultural industry
and update policies that deter agricultural investments in Pennsylvania.
Recent Related Accomplishments:
Act 84 of 2016 and Act 175 of 2016: The 2016 tax code bill included an exemption for
operations with an agricultural conservation easement. Act 175 made this exemption
retroactive. Together, the two changes created stronger financial incentives for farmers to
enter the Farmland Preservation Program.
Clean and Green Tax Preferential Assessment Values Amendment: Act 89 of 2016
amended the Clean and Green Preferential Tax Assessment Program. The changes
created greater predictability for farmers and incentivized Farmland Preservation
enrollment in counties that had outdated assessments.
Strategies:
Establish an industry-government working group to review regulatory and business
statutes impacting the agriculture industry at the state and local levels, and provide
recommendations to improve existing policies
Establish a point of contact within PDA to help producers and processors navigate
state and federal regulations
4.3.1 ESTABLISH AN INDUSTRY-GOVERNMENT WORKING GROUP TO REVIEW REGULATORY AND
BUSINESS STATUTES IMPACTING THE AGRICULTURAL INDUSTRIES, AND PROVIDE RECOMMENDATIONS TO
IMPROVE EXISTING POLICIES
Pennsylvania’s ability to capitalize on innovation and compete regionally, coupled with other
mega trends, is limited by the state’s current business and regulatory environment. The
agricultural industry listening sessions identified business development and the business climate,
as one of the industry’s major drivers. While significant strides have been made to improve
Pennsylvania’s business climate – including Acts 84, 89, and 175 of 2016 – greater work on the
state’s tax structure, regulatory environment, and economic development assistance programs is
required.

76 Team PA| Pennsylvania Agriculture: A Look at the Economic Impacts and Future Trends
In order to understand how these issues impact both existing producers and processors, and
potential investments in the state, Team PA should form an industry-government working group
to review regulatory and business statutes in the state. The creation of an industry-government
working group was a key recommendation of the Agricultural Advisory Board from its meeting at
the 2017 Ag Progress Days. Following its review of statutes impacting Pennsylvania agriculture,
the working group should make recommendations on improvements to existing policies to
increase agricultural productivity, efficiency, and investments.
4.3.2 ESTABLISH A POINT OF CONTACT WITHIN PDA TO HELP PRODUCERS AND PROCESSORS
NAVIGATE STATE AND FEDERAL REGULATIONS
In addition to establishing a working group to recommend changes to regulations, PDA can
further support industry growth by establishing a point of contact that helps producers and
processors navigate local, state, and federal regulations. The position could facilitate more
efficient development and expansion of agricultural businesses. Coordination with the
Department of Community and Economic Development (DCED) and Department of
Environmental Protection can also help support producers and processors through the navigation
of federal and particularly state regulations.
4.4 INVEST IN WORKFORCE AND EDUCATION
Challenge: A workforce shortage due to aging agricultural workers, changing guest worker
regulations, and a shift in the skills needed to support an increasingly automated industry will limit
the productivity and long-term growth of Pennsylvania agriculture.
Goals: Reduce the current and projected workforce shortages through education and training that
will meet the changing needs of the agriculture industry in Pennsylvania.
Recent Related Accomplishments:
Desk Guide for Careers in the Agriculture and Food Processing Industry: PDA has
developed the Desk Guide for Careers in the Agriculture and Food Processing Industry,
and distributed it to educators and counselors, including career counselors in both the K-
12 and post-secondary education system, vocational guidance program, and veterans’
programs. The Desk Guide details career clusters and occupations that will be in high
demand over the next decade, and the skills, knowledge, and education needed for
employment in those fields.
“Jobs that Pay” Apprenticeship Program for STEM Jobs in Agriculture: In 2017, the
Wolf Administration introduced a new apprenticeship program to help students develop
the hands-on science, technology, engineering, and math (STEM) skills needed for

77 Team PA| Pennsylvania Agriculture: A Look at the Economic Impacts and Future Trends
agricultural equipment service technician jobs. The program also provides a pre-
apprenticeship program for students enrolled in FFA agricultural education programs,
building on the strength of FFA in Pennsylvania. The growth of apprenticeship and work-
based learning programs will help close the skills gap in an increasingly STEM-based
agricultural workforce.86
Strategies:
Support apprenticeship and work-based learning programs to close the skills gap
for an increasingly technology-driven sector
Explore the potential of an ex-offender to work program to help alleviate workforce
shortage issues
Support loan forgiveness programs for large animal veterinarians and other high-
shortage careers
Increase agricultural education in STEM-related courses to prepare the state’s
workforce for increased automation
Diversify business of farming education to address changing consumer tastes and
evolving business models
4.4.1 SUPPORT APPRENTICESHIP AND WORK-BASED LEARNING PROGRAMS TO CLOSE SKILLS GAPS
CONTRIBUTING TO WORKFORCE SHORTAGES
It is anticipated that there will be more than 75,000 new and replacement job openings in
Pennsylvania’s agricultural sector between 2017 and 2027. Many of the occupations with the
highest projected demand are skilled labor, including farm equipment mechanics and service
technicians, packaging machine operators, butchers, industrial machinery mechanics, fallers, and
logging equipment operators.87 Registered apprenticeship and micro-credential programs offer
opportunities for potential employees to acquire the skills needed to enter these careers through
on-the-job training or high school agriculture education programs.88 The recently created “Jobs
that Pay” Apprenticeship Program for STEM jobs in agriculture will help address the shortage of
skilled workers by developing and training more than 1,000 Pennsylvanians as farm and
equipment mechanics and service technicians, with a focus on new and emerging technologies
that will shape agricultural production, including electronics, global positioning, and information
systems.89
In developing its Desk Guide and Fast Facts on Agriculture and Food Careers in Pennsylvania,
PDA has identified Registered Apprenticeships that Pennsylvanians can pursue for employment
opportunities in the agricultural sector. PDA has also been collaborating with industry partners to
promote work-based learning programs, identifying existing training that could lead to micro-
86 http://www.centralpennparent.com/2017/new-apprenticeship-program-for-stem-jobs-that-pay-in-agriculture/ 87 Pennsylvania Department of Agriculture, “Fast Facts on Agriculture and Food Careers in Pennsylvania,” 2017. http://www.education.pa.gov/ 88 Pennsylvania Department of Agriculture, “Fast Facts on Agriculture and Food Careers in Pennsylvania,” 2017 89 http://www.centralpennparent.com/2017/new-apprenticeship-program-for-stem-jobs-that-pay-in-agriculture/

78 Team PA| Pennsylvania Agriculture: A Look at the Economic Impacts and Future Trends
credentials, and identifying opportunities for new micro-credentials to close the skills gap in
meeting workforce demand. One potential untapped labor supply to help close the agricultural
labor gap is ex-offenders. Industry partners should work with PDA to identify potential
opportunities for ex-offenders and also work with the Department of Corrections to explore the
possibility. By continuing to support and expand its work connecting potential employees with
apprenticeship programs, identifying new micro-credential opportunities, and supporting the
educational resources underlying high school programs that provide educational training through
pre-apprenticeships, PDA can help strengthen the agricultural workforce against current and
projected shortages.
4.4.2 SUPPORT LOAN FORGIVENESS PROGRAMS FOR LARGE ANIMAL VETERINARIANS AND OTHER
HIGH-SHORTAGE CAREERS
In addition to apprenticeships, loan forgiveness programs can help address workforce shortages
with high debt barriers. Historically, Pennsylvania’s Agricultural Education Loan Forgiveness
Program provided partial loan forgiveness for degrees in farm operations, the practice of large
animal veterinary medicine, or teaching agricultural curriculums.90 In other states, state
agricultural veterinary loan-repayment programs require veterinarians to devote a portion of their
practice to agricultural animal health and productivity, and/or livestock biosecurity or food animal
disease diagnosis. Minimum portions range from 30 to 51 percent, and are structured as either
loan repayments or up-front tuition grants with a commitment to practicing in-state post-
graduation.91 Although Pennsylvania’s program is not currently funded, reinstating this program is
an important step in addressing the workforce shortage of large animal veterinarians and other
agricultural careers with high-cost educational training or licensing.
4.4.3 DIVERSIFY BUSINESS OF FARMING EDUCATION TO ADDRESS CHANGING CONSUMER TASTES AND
EVOLVING BUSINESS MODELS
The Department of Agriculture Center for Farm Transitions could be expanded to accommodate
changing farm business models. The Center currently provides guidance for transitions, such as
entering the farming vocation or planning farm expansions, including financing for farm groups,
assisting with multi-generational farming families, and management strategies for farm owners,
partnering with PA Preferred™, the Center for Dairy Excellence, USDA’s RMA Risk Management,
PAgrows, and the Pennsylvania Farm Link. The Center also supports Agricultural Security Areas
(ASA), the Pennsylvania Agricultural Conservation Easement Purchase Program, and the Clean
and Green preferential tax assessment program.92 Expanding the transitions program to other
steps in the agricultural supply chain and promoting product diversification in areas with projected
90 “Agriculture Education Loan Forgiveness Act - Agriculture Education Loan Forgiveness Program And Funding,” 2004. http://www.legis.state.pa.us/ 91 American Veterinary Medical Association, “State veterinary loan-repayment program summary,” 2017. https://www.avma.org/ 92 Center for Farm Transitions, Pennsylvania Department of Agriculture, 2017. http://www.iplantofarm.pa.gov/

79 Team PA| Pennsylvania Agriculture: A Look at the Economic Impacts and Future Trends
growth can help strengthen the state’s agricultural sector. In particular, there is growing need for
education to develop marketing, technology, and financial skills.
4.5 INVEST IN PHYSICAL INFRASTRUCTURE
Challenge: Pennsylvania’s existing agriculture and food infrastructure needs greater investments,
both on farms and throughout supply chains.
Goal: Invest in Pennsylvania’s production, processing, transportation, broadband, and distribution
systems’ infrastructure to ensure that the state’s producers and processors can meet consumer
demands through wholesale, retail, and direct-to-consumer channels.
Recent Related Accomplishments:
Act 89 and the Road Map Program: Act 89 of 2013 designated funding to address the
backlog of Pennsylvania infrastructure needs, including roads, highways, and bridges.
The 2017 Road Map program allocated an additional $2.1 billion for major transportation
infrastructure projects over the next decade.
Capital Investment Program at the Port of Philadelphia: The recent $300 million
investment to double the container capacity of the Port of Philadelphia and improve its
overall efficiency will help agricultural producers and processors increase their exports.
Pennsylvania Agricultural Surplus (PASS) Program: The PASS Program utilizes
existing local, charitable food distributers to connect agricultural producers with non-profits
to distribute food to Pennsylvanians at risk of hunger. The program demonstrates
innovation in using existing distribution systems and infrastructure to connect agricultural
producers, packers, and processors with non-profit partners who already distribute food to
low-income Pennsylvanians in need of food assistance, including shelters, food pantries,
and soup kitchens.93
DCED Programs with Broadband Deployment Eligibility: DCED administers several
economic development programs which include broadband deployment as an eligible use.
These programs, along with the USDA Rural Development Community Connect Grants,
can be utilized to develop the broadband capabilities required to implement new
technological innovations in agriculture production and processing.94
Act 34 of 2016: The 2016 Act enabled PennDOT to issue special-travel permits for milk-
hauling trucks that weigh more than 80,000 pounds. The permits allow the 80,000-plus
pound milk-hauling trucks to ravel on interstate highways, increasing the efficiency of dairy
distribution systems and increasing profit markets for the state’s dairy producers.
93 http://www.agriculture.pa.gov/Encourage/food/Pages/Pennsylvania-Agricultural-Surplus-Program.aspx 94 https://dced.pa.gov/broadband-resources/broadband-funding-information/

80 Team PA| Pennsylvania Agriculture: A Look at the Economic Impacts and Future Trends
Strategies:
Invest in transportation infrastructure to strengthen movements in supply chains
Support programs to ensure the expansion and adoption of broadband internet in
rural areas
Work with producers and processors to ensure they have the infrastructure
needed to access alternative distribution systems
4.5.1 INVEST IN TRANSPORTATION INFRASTRUCTURE TO IMPROVE THE EFFICIENCY OF SUPPLY CHAINS
Pennsylvania agriculture is impacted by the state’s aging transportation infrastructure. The
infrastructure deficit impedes the efficiency of agricultural products moving throughout the supply
chain, cutting into profit margins. Increased financing for infrastructure should include
infrastructure improvements that enable agricultural products to move through production,
processing and manufacturing, and through wholesale, retail, and direct-to-consumer distribution
systems.
4.5.2 SUPPORT PROGRAMS TO ENSURE THE EXPANSION AND ADOPTION OF BROADBAND INTERNET IN
RURAL AREAS
Pennsylvania can best position its rural communities and agricultural sector to increase
productivity and efficiency, and adopt automation trends driving the industry by ensuring the
expansion of broadband access across the state. As noted, broadband services enable
producers and processors to adopt technologies that increase productivity, save operational
costs, and better meet changing consumer demands. The adoption of blockchains and direct-to-
consumer distribution open up new markets for producers and processors. Without statewide
broadband access, the productivity and efficiency gap between farms that are able to adopt
automation technologies and those who lack the necessary internet speeds will widen. The
Commonwealth can support statewide broadband access through network investments and
public-private partnerships.
4.5.3 WORK WITH PRODUCERS AND PROCESSORS TO ENSURE THEY HAVE THE INFRASTRUCTURE NEEDED
TO ACCESS ALTERNATIVE DISTRIBUTION SYSTEMS
Transportation infrastructure and broadband internet both enable better accessibility to
distribution systems, including co-ops, farmers’ markets, community supported agriculture (CSA),
and other forms of direct-to-consumer distribution. Alternative distribution has focused primarily
on the produce sector, which is already heavily invested in these systems. There is now growing
demand for local proteins, creating an opportunity to aggregate small-scale animal protein
production and distribute it through the northeast corridor to meet the culinary demand for local
products.

81 Team PA| Pennsylvania Agriculture: A Look at the Economic Impacts and Future Trends
The state can also expand Farm to School programs by using existing infrastructure to connect
producers and procurement programs.95 This could include food banks to move produce from
small farms into schools, and the development or expansion of co-ops and cooperative
distribution networks to ensure that production levels collectively meet procurement needs.96
Working with producers and processors to identify and ensure access to alternative distribution
systems can help diversify and strengthen the agricultural sector.
4.6 SUPPORT PRODUCT DIVERSIFICATION
Challenge: The degree that Pennsylvania agriculture is concentrated in a small number of
products leaves the industry vulnerable to the effects of changing consumer demands.
Goal: Intra- and inter-farm, processor, and manufacturer diversification that strengthens the
resiliency of Pennsylvania agriculture against market changes.
Recent Related Accomplishments:
Industrial Hemp Research Act: Act 92 of 2016 launched the Industrial Hemp Research
Pilot Program. The 2014 Farm Bill gave state departments of agriculture and post-
secondary institutions permission to research industrial hemp cultivation and marketing.
The Pilot Program launched in 2017 with a research permit that studied the effects of
planting variables including dates and seed densities, hemp variety for suitability to
growing conditions in Pennsylvania, and evaluations of hemp’s antibacterial properties.
The Pilot Program has been renewed for 2018. By investing in industrial hemp research
and other potential growth crops, PDA strengthens the potential for agricultural
diversification in Pennsylvania.
PA Preferred™ Brews: As part of the PA Preferred™ Brews initiative, PDA is working
with the Penn State Extension to support farmers growing hops. This includes identifying
the different hops flavors created in the varied climate conditions across the state. The
hops research will help producers and processors better capitalize on the growing
demand for locally brewed beer and the marketing efforts of the PA Preferred™ Brews
program.97
Strategies:
Encourage and support producers, processers, and manufacturers in product
diversification
95 Interview with Patrick Andrews, Division Chief of Markets, Bureau of Market Development, PDA, October 6, 2017. 96Grace Communications Foundation, “Innovative Agriculture,” 2017. http://www.sustainabletable.org/ 97 Cheryl Cook Interview.

82 Team PA| Pennsylvania Agriculture: A Look at the Economic Impacts and Future Trends
Fund research and development to support product diversification
4.6.1 SUPPORT PRODUCERS, PROCESSERS, AND MANUFACTURERS IN PRODUCT DIVERSIFICATION
Product diversification enables producers, processors, and manufacturers to strengthen their
resiliency against changing consumer tastes. The Department of Agriculture can catalyze product
diversification through a mix of research, sharing of best practices, and loans to adapt production
or processing facilities.
For example, PDA can build on the research currently being undertaken at Penn State in support
of the PA Preferred™ Brews program, by supporting farms in transitioning some of their acres to
hops production.98 Farms can go beyond producing the raw materials for the Pennsylvania’s
growing brewing industry; farmers can actively participate by developing farmhouse breweries.
Several states, including Maryland, New York Massachusetts, Virginia, and North Carolina have
farmhouse brewery laws that allow farmers to start commercial brewing operations by obtaining
special licenses with reduced fees. The beer can be sampled and sold onsite and at certain beer
festivals and farmers ma4.rkets. Maryland’s law also allows up to 3,000 barrels to be self-
distributed at restaurants and liquor stores within the state. There is a catch, though: a portion of
the ingredients for the beer – which could include hops, wheat, barley, fruit, or other components
– must be grown on the farm.99 PDA should work with the Pennsylvania Liquor Control Board to
establish a pilot farmhouse brewery program and DCED to connect farmers with low interest
loans and other funding opportunities for the development of the brewery infrastructure.
Industrial hemp is a versatile agricultural plant which could one day be a valuable crop option for
Pennsylvania farmers. The Commonwealth has taken some important steps toward making that a
reality. In 2016, Governor Wolf signed the Industrial Hemp Research Act, or Act 92 of 2016, and
PDA launched the Industrial Hemp Research Pilot Program for the 2017 growing season.
Through this program, the Department of Agriculture issued research permits to institutions of
higher education and to persons interested in contracting with the Department to participate in the
research of industrial hemp cultivation and marketing in Pennsylvania. In 2017, 14 research
permits were issued to 12 researchers, who cultivated industrial hemp in 13 different
Pennsylvania counties.100
Goats, sheep, and lambs can be added in small herds for protein diversification. Low-interest
loans would help processors and manufacturers diversify production to include value-add and
healthier products. The expansion of product diversification highlights where PDA can build on its
existing programs and strengths to best position the agricultural industry over the next 10 years.
98 Interview with Cheryl Cook, Deputy Secretary for Animal Health and Food Safety, October 4, 2017. 99 http://fortune.com/2015/04/21/beer-maryland-farmers/ 100 http://www.agriculture.pa.gov/Plants_Land_Water/industrial_hemp/Pages/default.aspx

83 Team PA| Pennsylvania Agriculture: A Look at the Economic Impacts and Future Trends

A-1 Team PA| Pennsylvania Agriculture: A Look at the Economic Impacts and Future Trends
APPENDIX – A: INPUT/OUTPUT METHODLOGY
A.1 OVERVIEW
Economic impact estimates are generated by utilizing input-output models to translate an initial
amount of direct economic activity into the total amount of economic activity that it supports,
which includes multiple waves of spillover impacts generated by spending on goods and services
and by spending of labor income by employees. This section summarizes the methodologies and
tools used to construct, use, and interpret the input-output models needed to estimate this
project’s economic impact.
A.2 INPUT-OUTPUT MODEL THEORY
In an inter-connected economy, every dollar spent generates two spillover impacts:
First, some amount of the proportion of that expenditure that goes to the purchase of goods
and services gets circulated back into an economy when those goods and services are
purchased from local vendors. This represents what is called the “indirect effect,” and reflects
the fact that local purchases of goods and services support local vendors, who in turn require
additional purchasing with their own set of vendors.
Second, some amount of the proportion of that expenditure that goes to labor income gets
circulated back into an economy when those employees spend some of their earnings on
various goods and services. This represents what is called the “induced effect,” and
reflects the fact that some of those goods and services will be purchased from local
vendors, further stimulating a local economy.
The role of input-output models is to determine the linkages across industries in order to model out the magnitude and composition of spillover impact to all industries of a dollar spent in any one industry. Thus, the total economic impact is the sum of its own direct economic footprint plus the indirect and induced effects generated by that direct footprint.
A.3 INPUT-OUTPUT MODEL MECHANICS
To model the impacts resulting from the direct expenditures, Econsult Solutions, Inc. developed a
customized economic impact model using the IMPLAN input/output modeling system. IMPLAN
represents an industry standard approach to assess the economic and job creation impacts of
economic development projects, the creation of new businesses, and public policy changes within
its surrounding area. IMPLAN has developed a social accounting matrix (SAM) that accounts for
the flow of commodities through economics. From this matrix, IMPLAN also determines the
regional purchase coefficient (RPC), the proportion of local supply that satisfies local demand.
A-2 Team PA| Pennsylvania Agriculture: A Look at the Economic Impacts and Future Trends
These values not only establish the types of goods and services supported by an industry or
institution, but also the level in which they are acquired locally. This assessment determines the
multiplier basis for the local and regional models created in the IMPLAN modeling system.
IMPLAN takes the multipliers and divides them into 536 industry categories in accordance to the
North American Industrial Classification System (NAICS) codes.
The IMPLAN modeling system also allows for customization of its inputs which alters multiplier
outputs. Where necessary, certain institutions may have different levels of demand for
commodities. When this occurs, an “analysis-by-parts” (ABP) approach is taken. This allows the
user to model the impacts of direct economic activity related to and institution or industry with
greater accuracy. Where inputs are unknown, IMPLAN is able to estimate other inputs based on
the level of employment, earnings, or output by an industry or institution.
A.4 EMPLOYMENT AND WAGES SUPPORTED
IMPLAN generates job estimates based on the term “job-years”, or how many jobs will be
supported each year. For instance, if a construction project takes two years, and IMPLAN
estimates there are 100 employees, or more correctly “job-years” supported, over two years, that
represents 50 annual jobs. Additionally, these can be a mix of a full and part-time employment.
Consequently, job creation could feature more part-time jobs than full-time jobs. To account for
this, IMPLAN has a multiplier to covert annual jobs to full-time equivalent jobs.
Income to direct, indirect, and induced jobs is calculated as employee compensation. This
includes wage and salary, all benefits (e.g., health, retirement) and payroll taxes (both sides of
social security, unemployment taxes, etc.). Therefore, IMPLAN’s measure of income estimates
gross pay opposed to just strictly wages.
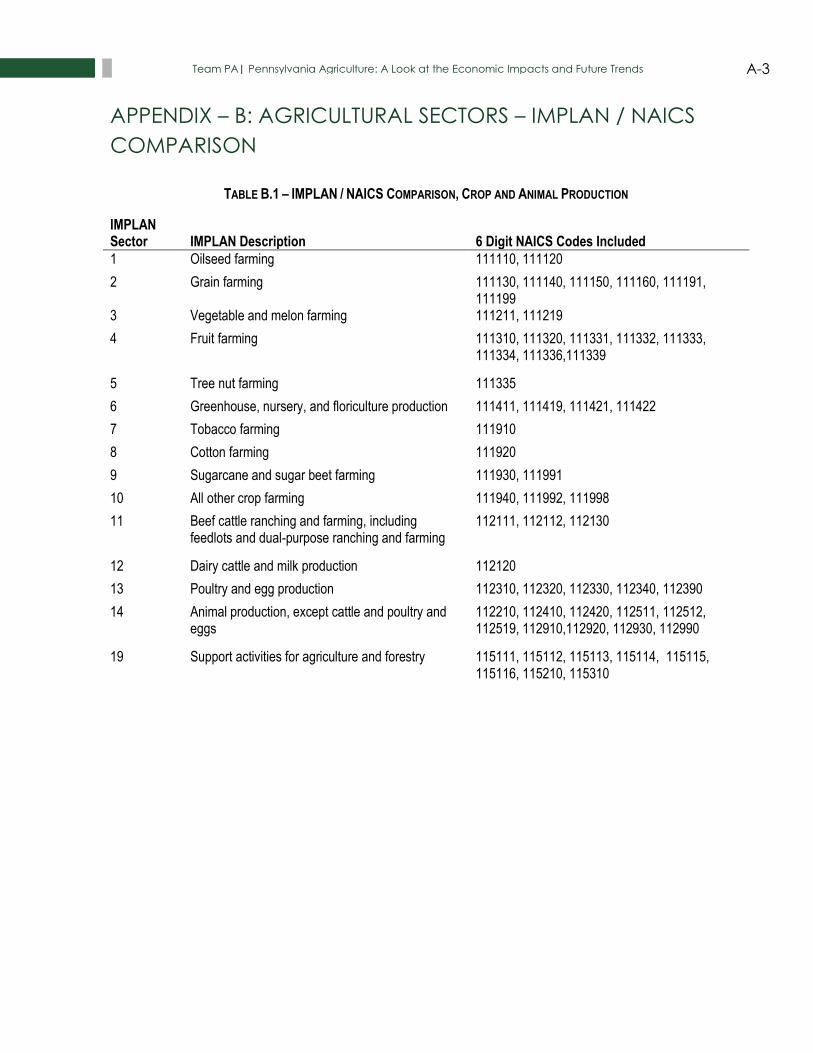
A-3 Team PA| Pennsylvania Agriculture: A Look at the Economic Impacts and Future Trends
APPENDIX – B: AGRICULTURAL SECTORS – IMPLAN / NAICS
COMPARISON
TABLE B.1 – IMPLAN / NAICS COMPARISON, CROP AND ANIMAL PRODUCTION
IMPLAN Sector IMPLAN Description 6 Digit NAICS Codes Included
1 Oilseed farming 111110, 111120
2 Grain farming 111130, 111140, 111150, 111160, 111191, 111199
3 Vegetable and melon farming 111211, 111219
4 Fruit farming 111310, 111320, 111331, 111332, 111333, 111334, 111336,111339
5 Tree nut farming 111335
6 Greenhouse, nursery, and floriculture production 111411, 111419, 111421, 111422
7 Tobacco farming 111910
8 Cotton farming 111920
9 Sugarcane and sugar beet farming 111930, 111991
10 All other crop farming 111940, 111992, 111998
11 Beef cattle ranching and farming, including feedlots and dual-purpose ranching and farming
112111, 112112, 112130
12 Dairy cattle and milk production 112120
13 Poultry and egg production 112310, 112320, 112330, 112340, 112390
14 Animal production, except cattle and poultry and eggs
112210, 112410, 112420, 112511, 112512, 112519, 112910,112920, 112930, 112990
19 Support activities for agriculture and forestry 115111, 115112, 115113, 115114, 115115, 115116, 115210, 115310

A-4 Team PA| Pennsylvania Agriculture: A Look at the Economic Impacts and Future Trends
TABLE B.2 – IMPLAN / NAICS COMPARISON, FOOD AND BEVERAGE PROCESSING AND MANUFACTURING
IMPLAN Sector IMPLAN Description 6 Digit NAICS Codes Included
65 Dog and cat food manufacturing 311111
66 Other animal food manufacturing 311119
67 Flour milling 311211
68 Rice milling 311212
69 Malt manufacturing 311213
70 Wet corn milling 311221
71 Soybean and other oilseed processing 311224
72 Fats and oils refining and blending 311225
73 Breakfast cereal manufacturing 311230
74 Beet sugar manufacturing 311313
75 Sugar cane mills and refining 311314
76 Nonchocolate confectionery manufacturing 311340
77 Chocolate and confectionery manufacturing from cacao beans
311351
78 Confectionery manufacturing from purchased chocolate
311352
79 Frozen fruits, juices and vegetables manufacturing 311411
80 Frozen specialties manufacturing 311412
81 Canned fruits and vegetables manufacturing 311421
82 Canned specialties 311422
83 Dehydrated food products manufacturing 311423
84 Fluid milk manufacturing 311511
85 Creamery butter manufacturing 311512
86 Cheese manufacturing 311513
87 Dry, condensed, and evaporated dairy product manufacturing
311514
88 Ice cream and frozen dessert manufacturing 311520
89 Animal, except poultry, slaughtering 311611
90 Meat processed from carcasses 311612
91 Rendering and meat byproduct processing 311613
92 Poultry processing 311615
94 Bread and bakery product, except frozen, manufacturing
311811, 311812
95 Frozen cakes and other pastries manufacturing 311813
96 Cookie and cracker manufacturing 311821

A-5 Team PA| Pennsylvania Agriculture: A Look at the Economic Impacts and Future Trends
97 Dry pasta, mixes, and dough manufacturing 311824
98 Tortilla manufacturing 311830
99 Roasted nuts and peanut butter manufacturing 311911
100 Other snack food manufacturing 311919
101 Coffee and tea manufacturing 311920
102 Flavoring syrup and concentrate manufacturing 311930
103 Mayonnaise, dressing, and sauce manufacturing 311941
104 Spice and extract manufacturing 311942
105 All other food manufacturing 311991, 311999
106 Bottled and canned soft drinks & water 312111, 312112
107 Manufactured ice 312113
108 Breweries 312120
109 Wineries 312130
110 Distilleries 312140
111 Tobacco product manufacturing 312230

A-6 Team PA| Pennsylvania Agriculture: A Look at the Economic Impacts and Future Trends
TABLE B.3 – IMPLAN / NAICS COMPARISON, FORESTRY
IMPLAN Sector IMPLAN Description 6 Digit NAICS Codes Included 15 Forestry, forest products, and timber tract
production 113110, 113210
16 Commercial logging 113310
134 Sawmills 321113
135 Wood preservation 321114
136 Veneer and plywood manufacturing 321211, 321212
137 Engineered wood member and truss manufacturing 321213, 321214
138 Reconstituted wood product manufacturing 321219
139 Wood windows and door manufacturing 321911
140 Cut stock, resawing lumber, and planing 321912
141 Other millwork, including flooring 321918
142 Wood container and pallet manufacturing 321920
143 Manufactured home (mobile home) manufacturing 321991
144 Prefabricated wood building manufacturing 321992
145 All other miscellaneous wood product manufacturing
321999
146 Pulp mills 322110
147 Paper mills 322121, 322122
148 Paperboard mills 322130
149 Paperboard container manufacturing 322211, 322212, 322219
150 Paper bag and coated and treated paper manufacturing
322220
151 Stationery product manufacturing 322230
152 Sanitary paper product manufacturing 322291
153 All other converted paper product manufacturing 322299
368 Wood kitchen cabinet and countertop manufacturing
337110
370 Nonupholstered wood household furniture manufacturing
337122
373 Wood office furniture manufacturing 337211

A-7 Team PA| Pennsylvania Agriculture: A Look at the Economic Impacts and Future Trends
TABLE B.4 – IMPLAN / NAICS COMPARISON, LANDSCAPING
IMPLAN Sector IMPLAN Description 6 Digit NAICS Codes Included 469 Landscape and horticultural services 561730

A-8 Team PA| Pennsylvania Agriculture: A Look at the Economic Impacts and Future Trends
APPENDIX – C: ECONOMIC IMPACT BY AGRICULTURAL
SECTOR
TABLE C.1 – ECONOMIC IMPACT OF THE CROP AND ANIMAL PRODUCTION INDUSTRIES IN PENNSYLVANIA
Impact Type Employment Earnings ($M) Value Added ($M) Output ($M)
Direct 80,645 $946 $4,267 $9,168
Indirect 10,164 $643 $1,271 $2,288
Induced 26,348 $1,147 $2,231 $3,767
Total 117,157 $2,736 $7,768 $15,222
Source: IMPLAN (2015)
TABLE C.2 – ECONOMIC IMPACT OF THE CROP AND ANIMAL PROCESSING INDUSTRIES IN PENNSYLVANIA
Impact Type Employment Earnings ($M) Value Added ($M) Output ($M)
Direct 90,217 $5,260 $10,360 $50,160
Indirect 78,405 $5,329 $9,369 $16,808
Induced 84,723 $3,709 $7,198 $12,185
Total 253,345 $14,298 $26,928 $79,152
Source: IMPLAN (2015)
TABLE C.3 – ECONOMIC IMPACT OF THE FORESTRY PRODUCTION AND PROCESSING INDUSTRIES IN PENNSYLVANIA
Impact Type Employment Earnings ($M) Value Added ($M) Output ($M)
Direct 64,078 $3,461 $6,135 $21,538
Indirect 38,393 $2,506 $4,391 $8,009
Induced 45,502 $1,990 $3,863 $6,534
Total 147,973 $7,957 $14,389 $36,081
Source: IMPLAN (2015)
TABLE C.4 – ECONOMIC IMPACT OF THE LANDSCAPING INDUSTRY IN PENNSYLVANIA
Impact Type Employment Earnings ($M) Value Added ($M) Output ($M)
Direct 45,569 $1,254 $1,941 $2,885
Indirect 3,449 $194 $390 $689
Induced 11,571 $505 $983 $1,651
Total 60,588 $1,954 $3,314 $5,225
Source: IMPLAN (2015)

A-9 Team PA| Pennsylvania Agriculture: A Look at the Economic Impacts and Future Trends
We also developed an aggregated model using a smaller subset of agriculture industries to
illustrate a narrow definition of Pennsylvania agriculture. The industries we included are crop
production, animal production, crop processing, and animal processing. This aggregation of
IMPLAN industries match the NAICS code industries shown in industry groups 1-3. The total
annual direct output of these industries is $59.3 billion, which generates an estimated $94.4
billion in total economic impact. Each year, these agriculture industries support 370,500 jobs
with $17 billion in earnings (see Table C.5).
TABLE C.5 – ECONOMIC IMPACT OF NARROW AGRICULTURE INDUSTRIES IN PENNSYLVANIA101
Impact Type Employment Earnings ($M) Value Added ($M) Output ($M)
Direct 170,862 $6,206 $14,627 $59,328
Indirect 88,569 $5,971 $10,640 $19,096
Induced 111,071 $4,856 $9,429 $15,952
Total 370,502 $17,033 $34,696 $94,375
Source: IMPLAN (2015)
TABLE C.6 – ECONOMIC IMPACT OF NARROW AGRICULTURE INDUSTRIES IN PENNSYLVANIA102
Impact Type Employment Earnings ($M) Value Added ($M) Output ($M)
Direct 122,790 $3,521 $8,476 $34,170
Indirect 51,292 $3,341 $6,099 $12,581
Induced 71,371 $3,114 $6,050 $10,312
Total 245,453 $9,976 $20,624 $57,063
Source: IMPLAN (2015)
101 This includes the crop and animal production industries, the crop and animal processing industries, and the ag-related services industry. 102 This includes the crop and animal production industries, the crop and animal processing industries, and the ag-related services industry.

A-10 Team PA| Pennsylvania Agriculture: A Look at the Economic Impacts and Future Trends
APPENDIX – D: DEEP-DIVE METHODOLOGY
E.1 OVERVIEW The goals of the micro sub-sector analyses were two-fold: 1. To provide a detailed description of the complex and interacting parts of the chosen sub-sectors and 2. To unearth factors and trends that will change the future of agriculture in Pennsylvania. The sector insights process combined interview data, published research and databases. Each team mapped the supply and value chain for each sub-sector, explored the nature and size of demand, examined competitor dynamics, and analyzed how changes in social, economic, and technological context could impact supply chains, demand, and competitive dynamics.
E.2 GOALS OF THE MICRO SUB-SECTOR ANALYSES
Within each sector, the methods were used to:
Document the sector’s value chain, with specific attention to the dynamics at the buying and selling steps in the chain of commerce – for example, from beef cattle farmers to processors, from processors to wholesalers, from wholesalers to retailers, and from retailers to consumers
Consider how changes in consumer demand, market structure, technology and automation, workforce availability, health and safety, and environmental regulations might affect the value chain over the next 5-10 years
Identify opportunities and challenges related to the changes, including business models or strategies that would capitalize on opportunities and mitigate challenges
Identify policy ideas or targets that could be beneficial policy interventions
The findings of the micro-sector analyses were used to identify and inform examinations of mega trends impacting Pennsylvania agriculture and develop policy recommendations.

A-11 Team PA| Pennsylvania Agriculture: A Look at the Economic Impacts and Future Trends
APPENDIX – E: SUB-SECTOR ANALYSES
The goals of the sector analyses were two-fold: To provide a detailed description of the complex and interacting parts of the chosen sectors and to unearth factors and trends that will shape the future of agriculture in Pennsylvania. These analyses can help practitioners and policy makers identify areas of opportunity, and support PDA and Team Pennsylvania as they lead on policy changes to encourage the development and growth of Pennsylvania agriculture. Insights from the sub-sector analyses were integrated with the findings of this report’s economic impact analysis and research on mega trends impacting agriculture in the state, and helped shape the report’s industry and policy recommendations. Pennsylvania Agriculture includes at least 17 sectors – 15 listed in the 2012 USDA Census of Agriculture as well as plus hardwoods and mushrooms. After careful consideration of priorities, existing recent studies and budget constraints, and conversations with PDA, Team Pennsylvania selected 10 sub-sectors for analysis. Livestock Cluster
1. Poultry 2. Beef 3. Pork 4. Sheep/Lamb/Goat 5. Dairy 6. Equine
Specialty Cluster
1. Fruits & Vegetables 2. Food processing
Green Cluster
1. Hardwoods 2. Nursery/Landscaping
Five common areas stood out from the ten sub-sector analyses:
1. Dramatic Shifts in Consumer Tastes affect nearly every sector studied in ways that increase opportunities for more “natural” products and processes.
2. The relatively small size of most Pennsylvania farms and producers represents a tremendous opportunity to Celebrate and Brand Pennsylvania Agriculture as particularly wholesome and accessible, authentic and local.
3. Attention to changing consumer tastes and branding could, in turn, help realize Targeted Export Potential, especially to adjacent markets for perishables and farther afield for hardwoods and proteins.
4. In many sectors, there is need to Enhance Processing Capacity to improve volume, quality and price realization – while also increasing traceability.
5. Workforce Supply is a pressing concern at all skill levels, from farmers to processors to field hands, and yet there are opportunities to train new workers and retrain existing ones.

A-12 Team PA| Pennsylvania Agriculture: A Look at the Economic Impacts and Future Trends
A detailed summary of these areas of challenge and opportunity, and a summary of each of the ten sector analyses can be found in Agricultural Sub-Sector Analyses: Annex to Pennsylvania Agriculture: A Look at the Economic Impact and Future Trends.

A-13 Team PA| Pennsylvania Agriculture: A Look at the Economic Impacts and Future Trends
APPENDIX – F: INTERVIEWS CONDUCTED
Name Position Organization Date Interviewed
Adam, Timothy Meat Specialist Sysco September 4, 2017
Alberti, Chazz Culinary Director Brulee Catering – Spectra by Comcast Spectacor
August 10, 2017
Amos, Katie US Farmer Marketing Outreach Lead
Animal Welfare Approved August 18, 2017
Andrews, Patrick Division Chief of Markets, Bureau of Market Development
PDA October 6, 2017
Anonymous Manager 44 Farm August 12, 2017
Anonymous River Run Foods August 29, 2017
Anonymous Farmer Pine View Dairy in Lancaster, PA July 24, 2017
Anonymous Farmer Lapp Valley Farm in Lancaster, PA July 25, 2017
Atherholt, Keith, et al President Lewis Lumber Products August 11, 2017
Badger, Mike Director American Pasture Poultry Processors of Association
August 8, 2017
Bailey, Scott Account Leader Wenger Feeds August 10, 2017
Baker, Dudly Dr Owner-Farmer Baker Ranch August 12, 2017
Barr, Ben Farmer Barr Farm August 17, 2017
Bender, Wayne Executive Director, Hardwoods Development Council
PDA October 17, 2017
Bender, Wayne; Strathmeyer, Fred; Geyer, Jon
Hardwoods Development Council, PDA
August 4, 2017
Bergman, Glenn Executive Director Philabundance August 21, 2017
Brett, Terry Owner & Founder Kimberton Whole Foods August 17, 2017
Burchfield, Benjamin Business Development Manager
Kegel’s Produce August 14, 2017
Castorani, Steve CEO North Creek Nurseries, PA August 23, 2017
Chain, Bill Agriculture Specialist Chesapeake Bay Foundation August 9, 2017
Chris, Ruth General Manager Ruth Chris’s Steakhouse, Austin, TX August 12, 2017
Cook, Cheryl Deputy Secretary for Market Development
PDA October 4, 2017
Crawford, Jim Founder New Morning Farms August 17, 2017

A-14 Team PA| Pennsylvania Agriculture: A Look at the Economic Impacts and Future Trends
Critz, Mark Executive Director, Rural Development Council
PDA October 2, 2017
Dise, Amanda Loan Officer Mid-Atlantic Farm Credit August 10, 2017
Dunphy, Mark Manager 7 Stars Farm August 21, 2017
England, Laura Director, Bureau of Market Development
PDA October 6, 2017
Ensill, Craig President Clemens Food Group August 18, 2017
Faunce, Erin Master of Finance Lancaster Farm Fresh Co-op August 17, 2017
Florence, Laura August 14, 2017
Frecon, Steve Farmer Frecon Farms August 18, 2017
Gauker, Jodi Owner-Farmer Gauker Farms August 12, 2017
Geyer, Jonathan Hardwoods Development Specialist, Hardwoods Development Council
PDA October 17, 2017
Guenther, Araceli Executive Principal Victrix Global August 14, 2017
Hale, Michael Pennsylvania Forestry Consultant
Dept. of Ag Conservation Reserve Enhancement Program
August 15, 2017
Hall, Charlie Leading Horticulture Industry Expert
Professor and Ellison Chair in International Floriculture, Dept Horticultural Services, Texas A&M University
August 24, September 1, 2017
Hanzely, John and Sue
Large Scale Nursery Dealer
Hanzely’s Greenhouse/Garden Center, PA
August 22, 2017
Harpster, A Partner Evergreen Farms August 2, 2017
Hoffman, Scott Vice Chairman, Pennsylvania Vegetable Marketing and Research Program
Furmano Foods, Inc
Hollinger, Jason General Manager Four Seasons Produce August 17, 2017
Hostetter, Gregory Deputy Secretary for Animal Health and Food Safety
PDA July 21, 2017
Huntington, Audrey Director Common Market August 10, 2017
Ioele, Kathryn Barn Manager Top Flight Stables August 13, 2017
John, Mike COO of Milk Marketing MD&VA August 16, 2017
Kennedy, Karen Hawkersmith
Owner Crimson Dale Nursery August 1, 2017

A-15 Team PA| Pennsylvania Agriculture: A Look at the Economic Impacts and Future Trends
Kitsch, Bill Vice President, Agricultural Lending Manager
Ephrata National Bank July 25, 2017
Larson, Ben Director of Sustainability Enviva Biomass August 18, 2017
Liss, Jon President Michel's Bakery, Inc August 29, 2017
Livengood, Dwain Owner-Farmer Livengood Family Farm August 12, 2017
Long Early, Caryn Director, Bureau of Food Distribution
PDA October 6, 2017
Mazza, Mario General Manager, Enologist
Mazza Vineyards August 18, 2017
McGinty, Tim GM North Creek Nurseries, PA August 23, 2017
Miller, P Organic Valley August 18, 2017
Moore, Jessica Industry Expert Kitchen Table Consultants August 12, 2017
Morrow, Bill Meat Manager August 17, 2017
Moyer, Brian Program Assistant Penn State Extension August 17, 2017
O’Brien, Dominic Senior Marketing Manager PhilaPort: The Port of Philadelphia August 24, 2017
Pierce, Chris President Heritage Poultry August 14, 2017
Porter, Holly Assistant Executive Director
Delmarva Poultry Industry August 17, 2017
Redding, Russell Secretary PDA July 27, 2017
Rekeweg, Matthew US Industry Relations & Food Chain Leader
Dow AgroSciences August 11, 2017
Rickert, James President Prather Ranch August 15, 2017
Sauder, Mark President & CEO Sauder, Inc August 17, 2017
Sheely, Scott Special Assistant for Workforce Development
PDA October 10, 2017
Shields, Pat PR Representative Capital Farm Investment August 12, 2017
Shimer, Zach General Manager Weis Markets August 19, 2017
Smith, Michael Executive Deputy Secretary
PDA July 19, 2017
Smith, Ron Owner English Home and Garden August 21, 2017
Smith, Seth Owner-Farmer SFI, Inc August 12, 2017
Smucker, Mike Co-owner Smuckers Meats August 18, 2017
Strathmeyer, Fred Deputy Secretary for Plant Industry and Consumer Protection
PDA October 13, 2017
Tait, Kim Owner and Operator Tait Farms August 24, 2017
Thompson, Patrick President & CEO EnergyWorks August 22, 2017
Vaylay, Ravi Ravi, Founder/CEO/Grower SAI Fresh Farms, Inc August 17, 2017

A-16 Team PA| Pennsylvania Agriculture: A Look at the Economic Impacts and Future Trends
PhD
Witmer, Ryan Co-Founder Philly Food Works August 19, 2017

A-17 Team PA| Pennsylvania Agriculture: A Look at the Economic Impacts and Future Trends
APPENDIX – G: ABOUT ECONSULT SOLUTIONS
This report was co-produced by Econsult Solutions, Inc. (“ESI”). ESI
is a Philadelphia-based economic consulting firm that provides
businesses and public policy makers with economic consulting
services in urban economics, real estate economics, transportation,
public infrastructure, development, public policy and finance,
community and neighborhood development and planning, as well as expert witness services for
litigation support. Its principals are nationally recognized experts in urban development, real
estate, government and public policy, planning, transportation, non-profit management, business
strategy and administration, as well as litigation and commercial damages. Staff members have
outstanding professional and academic credentials, including active positions at the collegiate
level, vast experience at the highest levels of the public policy process and extensive consulting
experience.

A-18 Team PA| Pennsylvania Agriculture: A Look at the Economic Impacts and Future Trends
APPENDIX – H: ABOUT FOX MANAGEMENT CONSULTING
This report was co-produced by Fox Management
Consulting (Fox MC). Fox MC, part of the Temple
University’s Fox School of Business offers cost-effective,
research-based consulting to clients within the private,
public, and social sectors across the globe. We’ve
completed nearly 400 consulting projects for a diverse group of organizations – Fortune 500
firms, small & mid-sized enterprises, startups, national nonprofits, government organizations, and
a dozen agricultural entities. Our research and recommendations have helped clients raise over
$400 million in capital investment, startup capital, and grant funding. Each engagement is
completed in the context of an MBA-level course. The course provides our MBA Associates with
academic content, practical consulting support, and faculty oversight to guide them through the
engagement. In addition, each engagement is closely supervised by a project executive, an
experienced business leader who brings substantial expertise to the project. These project
executives ensure that MBA Associates deliver top-quality work to our clients. This structure,
refined over the past 16 years, provides lasting value to our clients.


![ODOT- PDA intro.ppt [Read-Only] · PDA ConclusionsPDA Conclusions • PDA with CAPWAP evaluates capacity at low cost for driven piles, drilled shafts, & augercast piles • PDA gives](https://img.pdfslide.net/doc/110x75/5e80a08e0838cb51cc1301e3/odot-pda-introppt-read-only-pda-conclusionspda-conclusions-a-pda-with-capwap.jpg)