Embed Size (px)
Citation preview

2007 New Mexico Agricultural Statistics
TABLE OF CONTENTS
INTRODUCTION/ACKNOWLEDGMENT
USDA/NASS New Mexico Field Office
National Association of State Departments of Agriculture
GENERAL FIELD CROPS Release Dates for Statistical Publications................................. 3 Crop Summary ...................................................................... 42 Number of Farms and Land in Farms....................................... 4 Acreage and Value of Principal Field Crops ......................... 43 Usual Planting and Harvesting Dates ...................................... 5 Wheat .................................................................................... 44 Climate ..................................................................................... 6 Wheat by County............................................................... 45 Fertilizer Shipped Into New Mexico ........................................ 7 All Hay.................................................................................. 46 Commercial Feed Sold in New Mexico.................................... 8 All Hay by County ............................................................ 46 PRICES AND INCOME Alfalfa and Other Hay........................................................... 47 Farm Sector Economic Analysis .............................................. 9 Alfalfa Hay by County ...................................................... 47 Income From Farming............................................................ 11 Sorghum................................................................................ 48 Cash Receipts by Commodity ................................................ 12 Sorghum by County .......................................................... 49 Cash Receipts by Commodity and by County ........................ 14 Corn ...................................................................................... 50 Government Payments............................................................ 23 Corn Silage by County ...................................................... 50 Prices Received for Hay ......................................................... 25 Corn by County................................................................. 51 Prices Received for Cattle ...................................................... 26 Upland Cotton ....................................................................... 52 Grazing Fees .......................................................................... 27 Upland Cotton by County ................................................. 52 LIVESTOCK Cottonseed......................................................................... 53 Livestock Summary.................................................................. 28 American-Pima Cotton.......................................................... 54 Cattle and Calves...................................................................... 29 American-Pima Cotton by County .................................... 54 Number and Value.............................................................. 29 Potatoes ................................................................................. 55 Number by Class ................................................................ 30 Dry Beans.............................................................................. 55 Commercial Slaughter ........................................................ 30 Peanuts .................................................................................. 56 Inventory, Supply, and Disposition .................................... 31 Peanuts by County............................................................. 56 Production, Price, and Income............................................ 31 Number by County ............................................................. 32 VEGETABLES AND NUTS Number on Feed by County................................................ 33 Chile Range and Pasture Feed Condition..................................... 33 Acreage and Production by County................................... 57 Milk Production Acreage, Yield, and Production by County....................... 58 Milk Production and Income .............................................. 34 Onions Prices Received for Milk .................................................... 34 Monthly Prices Received .................................................. 59 Milk Production by County ................................................ 35 Onions by County ............................................................. 60 Monthly Milk Production ................................................... 35 Pecans ................................................................................... 61 Sheep and Lambs Pecans by County.............................................................. 61 Number and Value.............................................................. 36 Miscellaneous Crops and Livestock....................................... 62 Commercial Slaughter ........................................................ 36 Number by Class ............................................................... 37 COUNTY PROFILES .......................................................... 63 Wool Production and Value................................................ 37 Prices Received for Wool ................................................... 37 NMDA DIRECTORY ............................................(back cover) Inventory, Supply, and Disposition .................................... 38 Production, Price, and Income............................................ 38 Number by County ............................................................. 39 Hogs and Pigs Inventory, Supply, and Disposition .................................... 40 Production, Price, and Income............................................ 40 Goats Inventory ............................................................................ 41 Mohair Production, Price, and Value.................................. 41

2007 New Mexico Agricultural Statistics 2
New Mexico Agricultural Statistics a cooperative program between
United States Department of Agriculture National Agricultural Statistics Service
Cynthia Clark, Ph.D. Administrator
State of New Mexico Department of Agriculture I. Miley Gonzalez, Ph.D.
Director/Secretary
USDA and NMDA thank all NM agriculture producers and trust that you find
the 2007 New Mexico Agricultural Statistics valuable.
United States Department of Agriculture National Agriculture Statistics Service (NASS)
New Mexico Field Office 2507 North Telshor Boulevard, Suite 4, Las Cruces, New Mexico 88011
Jim Brueggen, Director
Scot Rumburg, Deputy Director
Agricultural Statisticians: José Acosta Rita Alirez Anna Bishop Longino Bustillos Data Processing/Support: Lisa Gillis Steven Kowalik Dolores Acosta Jennifer Travis Ana Chavez
NASS conducts all survey data collection for the cooperative program. The federal program information is reviewed and published by the Agricultural Statistics Board, NASS, USDA.
Call us at (575) 522-6023 or (800) 530-8810 or email us at [email protected]
Reports, Releases, and more at: www.nass.usda.gov/nm
A very special ‘Thank You’ to our National Association of State Departments of Agriculture (NASDA)
telephone and field enumerators who diligently collect ‘timely, accurate, and useful statistics’ through personal interviews and telephone calls throughout the State.
NASDA Supervisory Enumerators
Randall Ahlstrom, Silver City, NM Lois Jurney, Artesia, NM Wesley Shafer, Grady, NM
Patsy Herrera, Las Cruces, NM (call center) David Kyea, Clayton, NM Garda Stock, Waterflow, NM
NASS and NASDA maintain a cooperative agreement for the services of this part-time workforce to collect the data for your agricultural statistics program.
FRONT COVER Photo Courtesy of
New Mexico Department of Agriculture

2007 New Mexico Agricultural Statistics 3
NEW MEXICO FIELD OFFICE Reports Issued During the Year
GENERAL REPORTS FREQUENCY APPROXIMATE DATE OF PUBLICATION 1/
Crop Weather Weekly March - November (Mondays)
AgUpdate Monthly Variable depending on national reports
Includes: Weekly: Crop Weather Monthly: Milk Production, Cattle on Feed, and Agricultural Prices Received
New Mexico Agricultural Statistics Annual December
2007 Census of Agriculture Every 5 Years February 2009 www.nass.usda.gov/census
REPORT DATES FOR CROPS 2/
Crop Production Monthly August (mid) through Jan (mid)
Grain Stocks Quarterly January (mid) March - June - September (late)
Prospective Plantings Annual March (late)
Cotton Ginnings Annual May (mid)
Chile Annual April (early)
Pecans - Production and Disposition Annual July (mid)
Crop Yields Monthly August – January (mid-month)
Pecans – Forecast Bi-Annual October; December (mid)
REPORT DATES FOR LIVESTOCK, DAIRY, AND LIVESTOCK PRODUCTS 2/
Cattle Semi-Annual January (late); July (mid)
Sheep and Goats Semi-Annual January (late); July (mid)
Wool and Mohair Production Annual January (late)
Honey Annual February (late) Meat Animal Production, Disposition, and Income Annual April (late)
Milk Production, Disposition, and Income Annual April (late)
ECONOMIC AND MISCELLANEOUS 2/
Farm Labor Quarterly February - May - August - November (mid-month)
Number of Farms and Land in Farms Annual February (late)
Farm Production Expenditures Annual August (early)
Agricultural Land Values/Cash Rents Annual August (early)
COUNTY ESTIMATES (available at www.usda.gov/nass LINK - QUICK STATS) Wheat Feb (mid)
Corn Feb (late)
Sorghum Feb (late)
Cattle and Calves May (late)
Milk Production May (late)
Sheep and Lambs May (late)
Peanuts May (mid)
Alfalfa June (late)
Chile June (early)
Cotton June (mid)
Onions June (mid) 1/ Reports are available on the USDA website www.usda.gov/nass on the approximate date of publication. 2/ Summaries of these reports are also printed in the AgUpdate.
NATIONAL AGRICULTURAL STATISTICS SERVICE
4 2007 New Mexico Agricultural Statistics
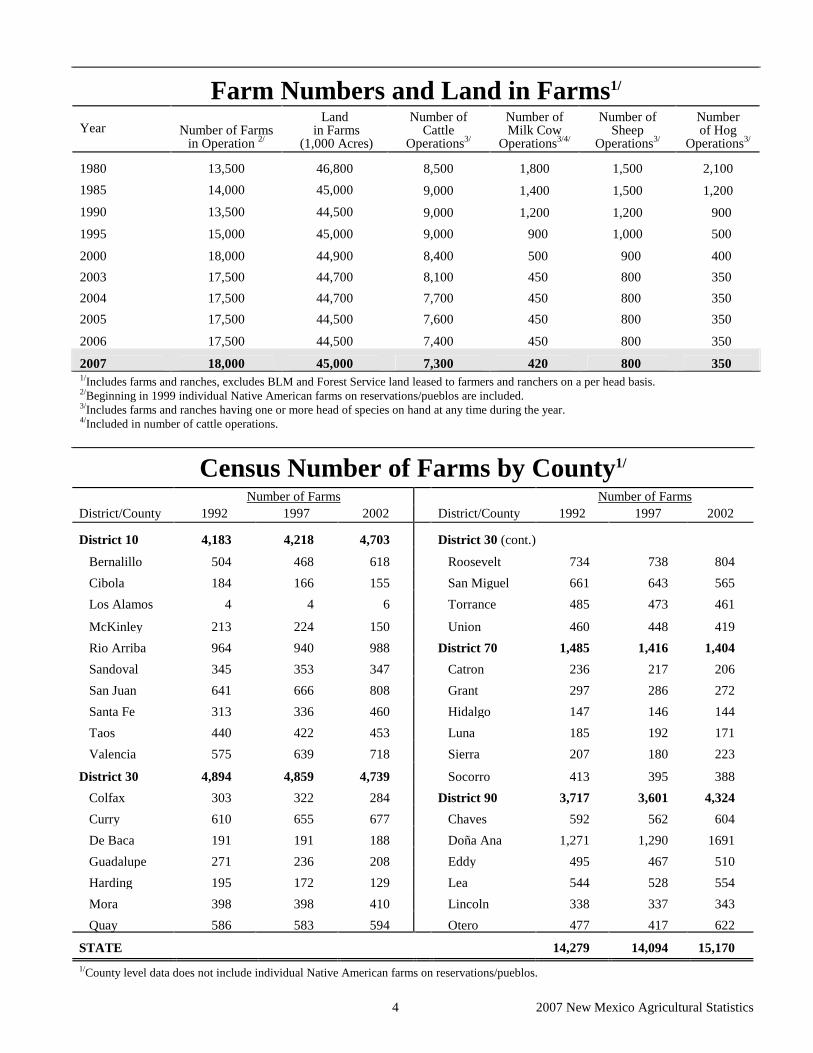
Farm Numbers and Land in Farms1/
Year Number of Farms in Operation 2/
Land in Farms
(1,000 Acres)
Number of Cattle
Operations3/
Number of Milk Cow
Operations3/4/
Number of Sheep
Operations3/
Number of Hog
Operations3/
1980
13,500
46,800
8,500
1,800
1,500
2,100
1985 14,000 45,000 9,000 1,400 1,500 1,200
1990 13,500 44,500 9,000 1,200 1,200 900
1995 15,000 45,000 9,000 900 1,000 500
2000 18,000 44,900 8,400 500 900 400
2003 17,500 44,700 8,100 450 800 350
2004 17,500 44,700 7,700 450 800 350
2005 17,500 44,500 7,600 450 800 350
2006 17,500 44,500 7,400 450 800 350
2007 18,000 45,000 7,300 420 800 350 1/Includes farms and ranches, excludes BLM and Forest Service land leased to farmers and ranchers on a per head basis. 2/Beginning in 1999 individual Native American farms on reservations/pueblos are included.
3/Includes farms and ranches having one or more head of species on hand at any time during the year. 4/Included in number of cattle operations.
Census Number of Farms by County1/
Number of Farms Number of Farms District/County 1992 1997 2002 District/County 1992 1997 2002 District 10
4,183
4,218
4,703
District 30 (cont.)
Bernalillo
504
468
618
Roosevelt
734
738
804
Cibola
184
166
155
San Miguel
661
643
565
Los Alamos
4
4
6
Torrance
485
473
461
McKinley
213
224
150
Union
460
448
419
Rio Arriba
964
940
988
District 70
1,485
1,416
1,404
Sandoval
345
353
347
Catron
236
217
206
San Juan
641
666
808
Grant
297
286
272
Santa Fe
313
336
460
Hidalgo
147
146
144
Taos
440
422
453
Luna
185
192
171
Valencia
575
639
718
Sierra
207
180
223
District 30
4,894
4,859
4,739
Socorro
413
395
388
Colfax
303
322
284
District 90
3,717
3,601
4,324
Curry
610
655
677
Chaves
592
562
604
De Baca
191
191
188
Doña Ana
1,271
1,290
1691
Guadalupe
271
236
208
Eddy
495
467
510
Harding
195
172
129
Lea
544
528
554
Mora
398
398
410
Lincoln
338
337
343
Quay
586
583
594
Otero
477
417
622
STATE
14,279
14,094
15,170
1/County level data does not include individual Native American farms on reservations/pueblos.

5 2007 New Mexico Agricultural Statistics
Planting and Harvesting Dates Crop Jan Feb Mar Apr May Jun Jul Aug Sep Oct Nov Dec
Field Crops
Corn, Grain
Cotton, All
Hay, Alfalfa
Peanuts for Nuts
Sorghum, Grain
Wheat, Winter
Vegetables
Chile Peppers
Green
Red
Onions
Grano
Sweet Spanish
Potatoes
Summer
Fall
Fruits
Apples
Nuts
Pecans
Usual Planting Dates Begin Harvest Most Harvested End Harvest

2007 New Mexico Agricultural Statistics 6
Climate, 2006
Temperature Freeze Date Annual Precipitation
County Station Elevation
(Feet)
Years of
Record
Last Spring Freeze
First Fall
Freeze Years
of Record Normal 2006
(Inches) Bernalillo Albuquerque1/ 5,310 104 4/10 11/16 135 9.47 11.42 Catron Luna Ranger Station 7,050 72 6/19 9/13 82 17.57 *13.96 Chaves Roswell FAA AP 3,649 35 4/2 11/1 35 13.34 10.61 Cibola Grants Airport 6,520 53 5/13 10/12 53 10.80 8.86 Colfax Raton Filter Plant 6,932 53 5/4 10/7 53 16.80 3/
Curry Clovis 4,290 89 4/12 11/14 93 18.50 3/
De Baca Ft. Sumner 4,025 82 4/12 10/25 91 14.41 16.38 Doña Ana Las Cruces2/ 3,881 109 3/18 11/16 143 9.40 10.86 Eddy Carlsbad 3,120 102 4/3 11/16 107 13.32 8.87 Grant Ft. Bayard 6,142 119 4/11 11/12 128 16.25 17.40 Guadalupe Santa Rosa 4,610 88 4/13 3/ 99 15.69 5/ Harding Roy 5,868 60 5/3 10/12 92 15.74 3/ Hidalgo Animas 3 ESE 4,437 62 3/27 11/19 78 4/ 10.83 Lea Hobbs 3,660 83 3/ 3/ 84 16.78 5/ Lincoln Carrizozo 1 SW 5,405 89 5/12 10/12 95 12.83 5/ Los Alamos Los Alamos 7,424 80 4/30 10/24 84 18.93 3/
Luna Deming 4,300 86 4/2 11/14 113 10.58 8.21 McKinley Gallup Sand and Gravel 6,505 33 5/12 10/27 33 12.87 *11.34 Mora Ocate 2 NW 7,655 44 6/5 9/15 46 16.44 3/
Otero Alamogordo 4,350 79 4/1 11/16 91 12.74 12.43 Quay Tucumcari 4 NE 4,086 97 5/2 11/6 101 15.37 3/
Rio Arriba Chama 7,850 92 6/29 9/13 99 21.61 25.67 Roosevelt Portales 4,010 81 4/13 11/1 87 17.17 3/
San Juan Aztec Ruins Nat’l Mon 5,644 87 5/13 10/11 98 10.78 *11.86 San Miguel Las Vegas Sewage Plant 6,349 24 6/5 9/15 24 16.96 *19.24 Sandoval Jemez Springs 6,262 93 5/1 10/12 93 16.96 5/ Santa Fe Santa Fe 2 6,756 35 5/12 10/12 35 14.22 3/
Sierra Elephant Butte Dam 4,576 98 3/16 11/1 98 10.65 *8.88 Socorro Socorro 4,585 103 3/ 11/1 107 10.22 5/ Taos Taos 6,965 92 6/5 10/17 103 12.44 3/ Torrance Estancia 7 NE 6,140 82 5/16 9/15 82 14.86 5/ Union Grenville 6,002 60 3/ 10/7 62 16.34 3/ Valencia Los Lunas 3 SSW 4,840 49 3/ 10/30 49 9.93 5/ * Insufficient or partial data if 1-9 daily values are missing. 1/ National Weather Service Forecast Office - International Airport. 2/ Station is officially known as “State University.” 3/ Data not available. 4/ Data insufficient to determine date. 5/ Values are missing when ten or more daily values are missing. SOURCE: Climatological Data Annual Summary, New Mexico, 2006, Volume 110-Number 13, National Oceanic and Atmospheric Administration.

2007 New Mexico Agricultural Statistics 7
Fertilizer Shipped into New Mexico, 2007
Single-Nutrient Materials First
Quarter Second Quarter
Third Quarter
Fourth Quarter
Total 2007
-------------------------------Tons--------------------------------
NITROGEN MATERIALS
Anhydrous Ammonia 811 2,356 1,238 470 4,875
Ammonium Nitrate 102 --- --- --- 102
Animal Manure 8,810 19,619 185 25 28,639
Ammonium Phosphate Sulfate 461 103 --- --- 564
Ammonium Sulfate 4,002 2,744 812 198 7,756
Ammonium Thiosulfate 106 1,003 497 2 1,608
Calcium Ammonium Nitrate 1 187 197 148 533
Calcium Nitrate 29 27 149 --- 205
Diammonium Phosphate 174 181 96 25 476
Mono Ammonium Phosphate 5,935 3,303 1,657 1,151 12,046
Nitrogen Solution 6,582 14,561 9,221 1,078 31,442
Superphosphate, Single 101 24 --- 50 175
Urea 4,780 5,266 2,784 925 13,755
TOTAL NITROGEN MATERIALS 31,894 49,374 16,836 4,072 102,176
PHOSPHATE MATERIALS
Superphosphate, Treble 58 1 --- --- 59
Liquid Ammonium Polyphosphate 1,241 3,117 327 377 5,062
Phosphoric Acid, Liquid 205 --- 22 46 273
TOTAL PHOSPHATE MATERIALS 1,504 3,118 349 423 5,394
POTASH MATERIALS
Muriate of Potash 4,343 2,735 2,466 1,846 11,390
Potassium Magnesium Sulfate 1,619 625 172 83 2,499
Potassium Sulfate 154 824 127 149 1,254
TOTAL POTASH MATERIALS 6,116 4,184 2,765 2,078 15,143
TOTAL SINGLE-NUTRIENT TONS 20,804 28,700 16,994 4,814 71,312
TOTAL MULTI-NUTRIENT TONS AND OTHER1/ 42,046 63,524 2,642 25,836 134,048
GRAND TOTAL 62,850 92,224 49,053 30,650 234,777 1/Other includes secondary, organics, and miscellaneous materials; excludes lime.
SOURCE: Feed, Seed, and Fertilizer Bureau, New Mexico Department of Agriculture.

8 2007 New Mexico Agricultural Statistics
Commercial Feed 2007 Sales
Kind of Feed First
Quarter Second
Quarter Third
Quarter Fourth
Quarter Grand
Total
-----------------------------------------------Tonnage-----------------------------------------------
Alfalfa Products 572 233 277 173 1,205
Animal By-Products 3,075 4,701 2,287 2,386 12,449
Barley Products 624 379 600 859 2,462
Beet Pulp Pellets 14,989 25,859 17,614 9,908 68,370
Canola Pellets 46,368 52,481 46,736 50,810 196,395
Cattle Feeds 106,754 90,650 78,484 112,743 388,631
Citrus Pulp Pellets 527 --- --- --- 527
Corn Products 155,327 168,856 148,621 145,622 618,426
Cottonseed Products 14,208 14,897 9,119 11,833 50,057
Custom Mixed Feeds 5,146 4,269 3,026 3,986 16,427
Dairy Feeds 95,314 84,662 92,337 108,463 380,776
Distillers By-Products 57,544 42,286 44,920 47,299 192,049
Fish Feeds 50 19 141 138 348
Grain Sorghum Products 3,662 4,868 6,671 5,718 20,919
Horse Feeds 6,775 7,019 6,452 6,867 27,113
Mineral Feeds 15,233 13,671 15,988 19,312 64,204
Miscellaneous1/ 18,825 10,738 34,950 17,554 82,067
Molasses 282 9,649 10,496 15,008 35,435
Molasses-Urea Feed 5,420 2,348 3,133 4,229 15,130
Oat Products 418 454 604 415 1,891
Other Mixed Feeds 1,207 1,061 655 531 3,454
Other Products 4,305 4,949 5,486 9,859 24,599
Oyster Shell Products 172 2 1 1 176
Peanut Meal/Ground Hulls 3,282 2,047 2,539 2,216 10,084
Pet Foods2/ 8,446 9,258 3,288 5,016 26,008
Poultry Feeds 3,365 2,905 2,699 2,869 11,838
Rabbit Feeds 248 250 247 244 989
Rice Mill By-Products 10 13 16 13 52
Sheep Feeds 945 744 434 697 2,820
Soybean Products 53,593 54,466 58,931 36,472 203,462
Swine Feeds 410 826 712 401 2,349
Turkey Feeds 22 109 124 18 273
Urea Feed Products 108 --- 77 50 235
Wheat Products 974 2,267 2,535 946 6,722
TOTAL TONNAGE 628,200 616,936 600,150 622,656 2,467,942
1/ Miscellaneous tonnage includes products unidentified on quarterly reports submitted by manufacturers. 2/ Tonnage of pet food does not include total amount merchandised in packages of 10 pounds or less.
SOURCE: Feed, Seed, and Fertilizer Bureau, New Mexico Department of Agriculture.

9 2007 New Mexico Agricultural Statistics
FARM SECTOR ECONOMIC ANALYSIS
INCOME
The total value of the agriculture sector output from New Mexico farmers and ranchers increased in 2007 to $3.3 billion, up 20 percent from 2006. The value of livestock production increased to $2.3 billion in 2007, up 22 percent. The value of crop production increased to $705 million, up 19 percent. Revenues from forestry and services totaled $282 million in 2007, up 9.0 percent from the previous year. Direct government payments dropped 23 percent to $66.9 million. After deductions for production expenses, hired labor, and other economic factors, the state’s net farm income totaled $821.7 million, up 92 percent from a year earlier.
PRODUCTION EXPENSES
New Mexico farmers and ranchers purchased $1.9 billion of inputs in 2007 to produce their crops and livestock. This was 6.9 percent more than 2006. As in previous years, livestock feed continued to be the largest purchase at $748 million, followed by livestock purchases of $420 million. The repair and maintenance of capital items cost farmers and ranchers $115 million, and petroleum fuel and oil costs rose 12 percent to $100 million. Property taxes were higher at $40.8 million.
CASH RECEIPTS
New Mexico crop and livestock product sales in 2007 totaled $3.0 billion, a 24 percent increase from the previous year. Total cash receipts from livestock products increased in 2007 to $2.4 billion. The number one cash commodity for the state was once again milk. Milk also had the largest increase, at 49 percent, from the previous year. This was followed by cattle and calves as the number two cash commodity. Total crop cash receipts increased by 16 percent to $700 million. Hay sales increased to $195 million in 2007, remaining in third place. Pecans remained fourth in the state in total cash receipts with an 11 percent increase for the year, coming in with $96.2 million. Onions were ranked fifth with $63.4 million, a 38 percent increase. Greenhouse and nursery receipts were steady at $62.3 million and were ranked sixth. Corn Silage was seventh in the rankings with receipts of $53.0 million. Chile ranked eighth in the state with cash receipts at $32.9 million.

10 2007 New Mexico Agricultural Statistics
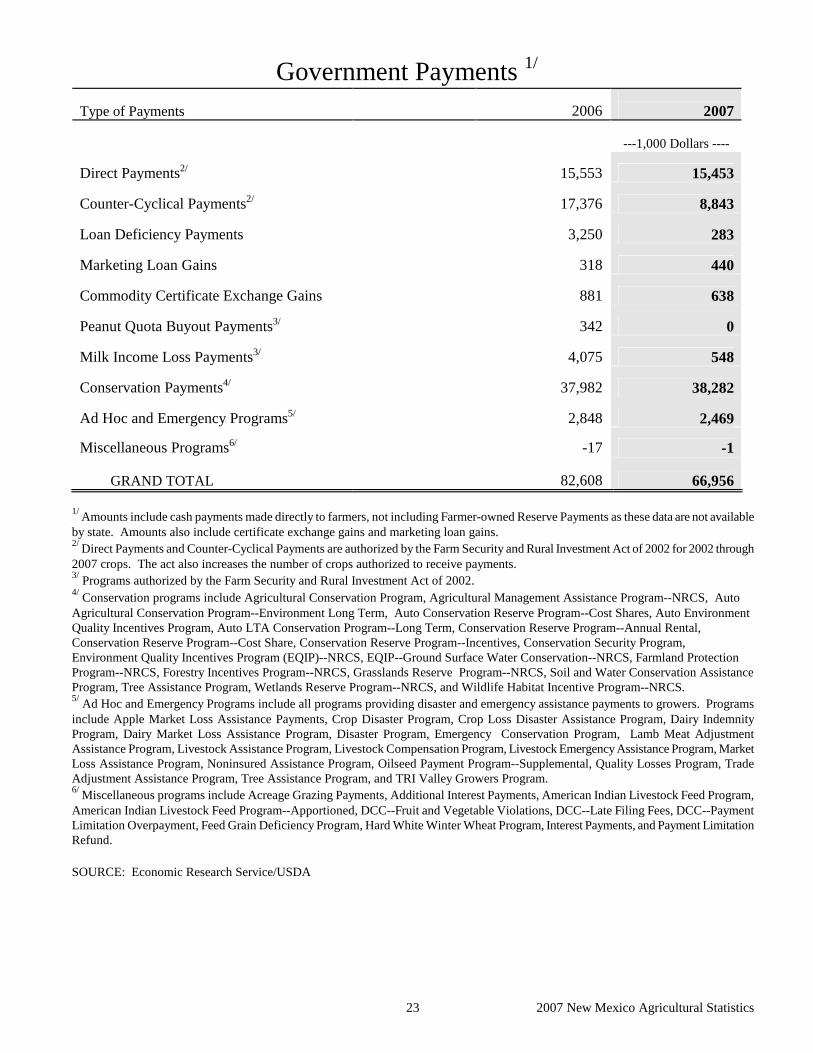
GOVERNMENT PAYMENTS Direct government payments to New Mexico producers totaled $67 million in 2007, down 23 percent from 2006 payments of $82.6 million. If ranked with cash receipts, government payments would be our fifth largest cash commodity. Conservation program payments remained at $38 million. Fixed Direct payments remained at $15 million in 2007. Counter-Cyclical payments decreased to $8.8 million, from $17 million a year earlier. Milk Income Loss Payments decreased to $548,000, down from $4.0 million a year earlier.
LAND VALUES
New Mexico’s farm real estate value has risen consistently since 2002. The value in 2002 was $250 per acre. The average per acre in 2008 was $630 per acre compared to $610 in 2006. In the Mountain States (Arizona, Colorado, Idaho, Montana, Nevada, New Mexico, Utah and Wyoming), values in 2008 ranged from a high of $3,500 per acre in Arizona to a low of $630 per acre in New Mexico. The highest values in the country were in the northeast where values averaged $5,080 per acre.
PRICES
Cattle prices declined during 2007. Prices for beef cattle averaged $80.40 per hundredweight (cwt), a decrease of $0.70 from the 2006 price. Calf prices dropped $8.00 per cwt, to $120.00. Cow prices, at $49.40 per cwt, increased by $4.90 per cwt. Steer and heifer prices averaged $101.00 per cwt compared to $106.00 in 2006. Milk prices, at $18.80 per cwt, increased 55 percent from the $12.10 received in 2006. Alfalfa prices for the year averaged $166.00 per ton consistent with 2006 prices. All hay decreased by $1 from the 2006 price of $164 to $163 per ton in 2007. Other hay prices averaged $136 per ton in 2007, compared to $138 in 2006. Prices for dry beans, upland cotton, American-Pima cotton, potatoes, peanuts, and onions increased in 2007, as did corn for grain, corn for silage, sorghum, chile, and wheat. Pecan prices showed a decrease of $0.55 for the year.

2007 New Mexico Agricultural Statistics
11
Net Income from Farming1/ 2003 2/ 2004 2/ 2005 2/ 20062/ 2007
---------------------------------------1,000 Dollars----------------------------------
Value of crop production 538,365 601,949 622,902
594,083 705,309
Value of livestock production 1,565,323 1,995,041 2,053,715 1,895,866 2,306,709
Revenues from services and forestry 176,889 172,979 239,586 258,785 282,151
Machine hire and custom work 16,382 9,169 27,999 21,391 25,556
Forest products sold 4,500 4,500 4,500 4,500 4,600
Other farm income 83,991 62,585 73,537 79,592 78,223 Gross imputed rental value of farm dwellings 72,016 96,725 133,550 153,302 173,772
Value of Agricultural Sector Production 2,280,577 2,769,970 2,916,203 2,748,733 3,294,169
less: Purchased inputs 1,382,789 1,488,455 1,641,213 1,814,102 1,939,846
Farm origin 815,004 941,058 988,850 1,073,299 1,193,910
Feed purchased 424,467 465,279 500,748 614,478 748,494
Livestock and poultry purchased 366,206 454,026 460,355 430,804 419,979
Seed purchased 24,331 21,750 28,017 28,017 25,437
Manufactured inputs 148,066 154,302 187,872 198,229 217,998
Fertilizers and lime 29,647 31,635 41,426 44,585 49,895
Pesticides 21,394 21,540 24,069 24,833 24,451
Petroleum fuel and oils 56,413 65,654 80,934 88,841 99,861
Electricity 40,612 34,473 41,443 39,970 43,791
Other purchased inputs 419,719 393,095 464,491 542,574 527,938
Repair and maintenance of capital items 81,515 85,773 91,771 109,399 115,181
Machine hire and custom work 25,207 21,465 15,931 22,177 24,674
Marketing, storage, and transportation expenses 82,057 72,812 102,568 116,050 96,631
Contract labor 17,224 26,761 24,136 30,148 37,961 Miscellaneous expenses 213,716 186,284 230,085 264,800 253,491
plus: Net government transactions 64,105 49,003 81,687 42,223 20,324
+ Direct government payments 92,920 78,558 116,636 82,602 66,956
- Motor vehicle registration and licensing fees 5,727 5,579 5,644 4,858 5,783
- Property taxes 23,088 23,976 29,305 35,521 40,849
Gross Value Added 961,893 1,330,518 1,356,676 976,855 1,374,647 less: Capital consumption 116,101 126,838 143,756 154,268 161,369
Net Value Added 845,792 1,204,680 1,212,920 822,587 1,213,278 less: Payments to stakeholders 306,287 324,767 382,349 393,414 391,524
Employment compensation (total hired labor) 176,081 192,711 231,661 239,340 242,431
Net rent received by nonoperator landlords 36,443 37,592 43,448 40,350 27,904
Real estate and nonreal estate interest 93,763 94,464 107,240 113,724 121,189 Net Farm Income 539,505 878,913 830,571 429,173 821,754 1/ Value of agricultural sector production is the gross value of the commodities and services produced within a year. Net value-added is the sector’s contribution to the national economy and is the sum of the income from production earned by all factors of production. Net farm income is the farm operators’ share of income from the sector’s production activities. The concepts presented are consistent with those employed by the Organization for Economic Cooperation and Development (OECD). 2/Revised.
SOURCE: USDA, Economic Research Service.

2007 New Mexico Agricultural Statistics 12
Cash Receipts: All Commodities1/
Commodity 2007 Rank
20052/ 20062/ 2007
-----------------------1,000 Dollars--------------- All Commodities 2,614,491 2,467,241 3,057,900 Livestock Products 1,992,796 1,861,756 2,358,193
Meat Animals 970,866 911,305 957,476
Cattle and Calves 2 964,445 905,138 951,847
Sheep and Lambs 21 5,908 5,888 5,414
Hogs and Pigs 24 513 279 215
Milk 1 981,409 909,194 1,353,788
Wholesale 981,409 909,194 1,353,788
Poultry and Eggs 3/ 13 19,632 19,835 24,008
Miscellaneous Livestock 20,889 21,422 22,921
Wool and Mohair 22 1,536 1,022 1,440
Other Livestock 15 19,000 20,000 21,481
Crops 621,695 605,458 699,707 Feed Crops 215,243 247,305 282,178
Hay 3 139,514 166,976 195,406
Sorghum Grain 17 7,010 7,122 9,852
Corn for Grain 14 16,303 16,507 23,892
Corn for Silage 7 52,416 56,700 53,028
Food Grains 30,264 18,855 38,489
Wheat 8 30,264 18,855 38,489
Cotton 9 39,936 36,000 35,029
Cotton Lint 36,254 30,979 30,445
Cottonseed 3,682 5,022 4,584
Peanuts 18 13,300 7,992 7,035
Vegetables 139,913 127,386 143,684
Dry Beans 20 4,405 4,491 6,070
Onions 5 53,594 45,936 63,440
Potatoes 16 9,110 11,322 14,324
Chile 10 47,803 39,636 32,850
Miscellaneous Vegetables 12 25,000 26,000 27,000
Fruits and Nuts 115,645 91,250 103,000
Pecans 4 110,500 86,950 96,200
Other Fruits and Nuts 19 5,145 4,300 6,800
All Other Crops 67,394 76,670 90,293
Greenhouse Nursery 6 62,286 62,270 62,371
Other Seeds 23 300 300 300
Other Field Crops 11 4,808 14,100 27,622 1/ Does not include cash receipts for livestock grazing. May not sum due to rounding. 2/ Revised. 3/ Poultry and Eggs includes farm chickens and eggs, turkeys, ducks, geese, etc.

13 2007 New Mexico Agricultural Statistics
New Mexico Cash Receipts, 2007 All Commodities
Figure 1: May not sum due to rounding
Crops Livestock
Sorghum 1.4%
Wheat 5.5%
Potatoes 2.0%
Peanuts 1.0%
Onions 9.1%Hay 27.9%
Greenhouse 8.9%
Cotton 5.0%
Corn Silage 7.6%
Corn 3.4%Chile 4.7%Other 9.8%
Pecans 13.7%
Other 1.1%
Poultry 1.0%
Sheep 0.2%
Cattle & Calves 40.4%
Dairy 57.3%
Milk 44.3%
Meat Animals 31.3%
Feed Crops 10.5%
Vegetables 4.8%Other Crops 3.0%
Fruits & Nuts 3.4%
Poultry/Misc Livestock 1.5%
Cotton 1.2%

2007 New Mexico Agricultural Statistics 14
Cash Receipts: All Farm Commodities by County1/
--------------------All Farm Commodities---------------------- District/County 2007 Rank 20052/ 20062/ 2007 -----------------------1,000 Dollars------------------------------ DISTRICT 10 188,805 170,131 202,589 Bernalillo 15 26,921 24,762 28,771 Cibola 30 7,994 6,342 9,005 McKinley 25 13,848 12,016 14,582 Rio Arriba 22 13,931 13,947 17,348 Sandoval 31 8,394 6,972 7,575 San Juan 8 68,984 62,568 73,462 Santa Fe 28 13,078 14,190 13,116 Taos 32 4,201 4,017 5,005 Valencia 14 31,455 25,318 33,725 DISTRICT 30 1,061,099 1,060,727 1,262,909 Colfax 16 23,913 22,205 24,651 Curry 2 382,650 401,812 502,245 De Baca 18 21,077 20,152 22,370 Guadalupe 24 14,549 12,181 15,413 Harding 29 11,839 11,917 12,396 Mora 27 12,428 10,995 13,958 Quay 12 39,605 39,828 47,087 Roosevelt 4 305,843 297,967 382,284 San Miguel 19 22,113 19,388 21,223 Torrance 11 51,171 47,357 55,561 Union 6 175,911 176,925 165,720 DISTRICT 70 243,773 199,850 236,278 Catron 26 15,084 13,859 14,274 Grant 23 18,752 16,560 16,510 Hidalgo 17 25,970 23,669 24,197 Luna 9 77,975 64,439 72,529 Sierra 13 37,398 30,012 41,139 Socorro 10 68,593 51,310 67,629 DISTRICT 90 1,120,814 1,036,505 1,356,125 Chaves 1 413,664 380,873 520,957 Doña Ana 3 413,548 372,504 466,572 Eddy 7 116,390 114,115 148,525 Lea 5 143,718 138,581 182,538 Lincoln 21 17,861 15,647 18,152 Otero 20 15,632 14,786 19,381 STATE 2,614,491 2,467,213 3,057,900 1/ Does not include cash receipts received for livestock grazing. May not sum due to rounding. 2/ Revised.

2007 New Mexico Agricultural Statistics 15
Cash Receipts: All Livestock, All Crops1/
------------All Livestock---------------- ----------------All Crops----------------- County 20052/ 20062/ 2007 20052/ 20062/ 2007 ---------------------------------------1,000 Dollars-------------------------------------- DISTRICT 10 115,545 94,660 117,816 73,260 75,471 84,773 Bernalillo 19,454 17,200 20,812 7,466 7,561 7,959 Cibola 7,803 5,891 8,482 191 451 523 McKinley 13,206 11,357 13,996 642 660 586 Rio Arriba 11,109 10,189 12,358 2,822 3,758 4,990 Sandoval 5,813 4,553 4,833 2,580 2,419 2,742 San Juan 24,040 19,535 22,730 44,944 43,033 50,732 Santa Fe 5,957 5,168 5,493 7,121 9,022 7,623 Taos 3,019 2,153 2,478 1,182 1,864 2,527 Valencia 25,145 18,614 26,634 6,311 6,704 7,091 DISTRICT 30 920,727 916,094 1,083,081 140,372 144,632 179,829 Colfax 21,677 19,489 21,120 2,235 2,716 3,531 Curry 333,161 358,904 441,773 49,489 42,908 60,472 De Baca 16,337 14,968 16,295 4,740 5,184 6,074 Guadalupe 14,146 11,682 14,685 403 499 728 Harding 11,138 10,943 11,676 701 973 720 Mora 11,286 9,693 11,294 1,142 1,301 2,664 Quay 32,343 30,039 31,803 7,262 9,789 15,284 Roosevelt 264,390 253,833 330,179 41,454 44,134 52,106 San Miguel 20,438 18,034 19,920 1,675 1,354 1,303 Torrance 34,348 31,233 38,188 16,823 16,124 17,373 Union 161,463 157,275 146,147 14,448 19,650 19,574 DISTRICT 70 160,381 130,311 156,390 83,392 69,539 79,888 Catron 14,528 13,387 13,972 556 473 302 Grant 18,444 16,274 16,254 309 286 256 Hidalgo 13,899 12,365 13,888 12,071 11,303 10,309 Luna 20,234 16,681 17,764 57,741 47,758 54,765 Sierra 29,833 24,434 32,346 7,565 5,578 8,793 Socorro 63,443 47,170 62,165 5,150 4,140 5,464 DISTRICT 90 796,143 720,691 1,000,907 324,671 315,814 355,218 Chaves 367,064 325,921 458,571 46,600 54,952 62,386 Doña Ana 213,356 191,636 270,394 200,192 180,868 196,178 Eddy 77,166 75,500 95,598 39,224 38,615 52,927 Lea 114,132 107,012 149,244 29,586 31,568 33,294 Lincoln 17,591 15,084 17,593 270 562 558 Otero 6,834 5,537 9,506 8,799 9,249 9,874 STATE 1,992,796 1,861,756 2,358,193 621,695 605,457 699,708 1/ Does not include cash receipts received for livestock grazing. May not sum due to rounding. 2/ Revised.

2007 New Mexico Agricultural Statistics 16
Cash Receipts: Cattle and Calves, Milk1/
----------------Cattle and Calves------------- ---------------------Milk 2/---------------------
District/County 2005 2006 2007 20053/ 20063/ 2007
----------------------------------------------1,000 Dollars--------------------------------------------
DISTRICT 10 76,285 62,515 76,080 20,941 13,342 19,958 Bernalillo 4,937 4,213 4/ 4/ 4/ 4/ Cibola 6,583 4,682 7,663 --- --- --- McKinley 9,874 7,959 9,306 --- --- --- Rio Arriba 9,874 8,895 10,948 --- --- --- Sandoval 5,486 4,213 4,379 --- --- --- San Juan 21,124 16,438 19,309 --- --- --- Santa Fe 5,486 4,682 4,927 --- --- --- Taos 2,743 1,873 2,190 --- --- --- Valencia 10,180 9,561 4/ 4/ 4/ 4/ Combined Counties --- --- 17,359 20,941 13,342 19,958 DISTRICT 30 541,149 542,413 529,193 373,893 367,780 547,772 Colfax 21,394 19,194 20,801 --- --- --- Curry 150,216 179,522 166,654 182,135 178,553 274,241 De Baca 15,908 14,513 15,874 --- --- --- Guadalupe 13,714 11,236 14,232 --- --- --- Harding 10,971 10,767 11,495 --- --- --- Mora 10,971 9,363 10,948 --- --- --- Quay 31,816 29,493 31,201 --- --- --- Roosevelt 82,283 74,436 71,708 191,758 189,227 273,531 San Miguel 19,748 17,322 19,159 --- --- --- Torrance 23,039 19,662 21,348 --- --- --- Union 161,089 156,906 145,771 --- --- --- DISTRICT 70 102,904 88,606 94,774 55,843 40,026 59,874 Catron 14,262 13,108 13,685 --- --- --- Grant 18,102 15,917 15,874 --- --- --- Hidalgo 13,714 12,172 13,685 --- --- --- Luna 20,072 16,511 17,592 --- --- --- Sierra 12,068 10,767 4/ 4/ 4/ 4/ Socorro 24,685 20,130 4/ 4/ 4/ 4/ Combined Counties --- --- 33,938 55,843 40,026 59,874 DISTRICT 90 244,107 211,604 251,801 530,732 488,046 726,183 Chaves 98,740 85,203 100,720 265,436 238,071 355,772 Doña Ana 46,627 40,729 49,813 152,908 136,891 203,828 Eddy 31,268 27,153 30,107 45,181 47,614 64,699 Lea 46,079 40,729 46,528 67,206 65,470 101,914 Lincoln 15,908 13,576 16,422 --- --- --- Otero 5,486 4,213 8,211 --- --- --- STATE 964,445 905,138 951,847 981,409 909,194 1,353,788 1/ Does not include cash receipts received for livestock grazing. May not sum due to rounding. 2/ Milk cow estimates are not made for counties with fewer than 200 head. 3/ Revised. 4/ Included with Combined Counties to prevent disclosure.

2007 New Mexico Agricultural Statistics 17
Cash Receipts: Sheep and Other Livestock1/
-----------------------Sheep2/---------------------- -------------Other Livestock3/-----------------
District/County 2005 2006 2007 20054/ 20064/ 2007
-----------------------------------------------------1000 Dollars----------------------------------------------
DISTRICT 10 2,581 2,554 3,676 15,737 16,250 18,102 Bernalillo 71 62 26 7,466 7,588 8,971 Cibola 705 673 257 515 536 562 McKinley 1,034 984 2,156 2,298 2,414 2,534 Rio Arriba 188 207 257 1,047 1,087 1,153 Sandoval 5/ 5/ 5/ 304 314 330 San Juan 470 518 698 2,446 2,579 2,724 Santa Fe 5/ 5/ 5/ 457 476 505 Taos 47 41 36 229 239 253 Valencia 28 31 62 976 1,017 1,070 Combined Counties 38 36 185 --- --- --- DISTRICT 30 828 896 796 4,857 5,004 5,320 Colfax --- --- --- 274 285 299 Curry --- --- --- 797 813 847 De Baca 94 104 51 335 352 370 Guadalupe 188 192 185 244 255 268 Harding 5/ 5/ 5/ 157 166 175 Mora 24 26 26 291 305 321 Quay 28 26 56 498 519 545 Roosevelt 61 73 21 758 771 885 San Miguel 5/ 5/ 5/ 680 702 736 Torrance 376 414 365 462 483 509 Union 5/ 5/ 5/ 360 354 366 Combined Counties 56 62 92 --- --- --- DISTRICT 70 122 104 82 1,512 1,576 1,659 Catron 5/ 5/ 5/ 256 268 282 Grant 5/ 5/ 5/ 337 352 370 Hidalgo 5/ 5/ 5/ 176 183 193 Luna 5/ 5/ 5/ 153 160 168 Sierra 5/ 5/ 5/ 309 319 335 Socorro 85 62 5/ 281 294 312 Combined Counties 38 41 82 --- --- --- DISTRICT 90 3,757 3,181 2,120 17,548 17,860 20,803 Chaves 1,787 1,502 878 1,101 1,144 1,201 Doña Ana 71 62 41 13,750 13,954 16,712 Eddy 75 62 118 643 671 704 Lea 179 155 123 668 658 679 Lincoln 1,223 1,036 678 461 472 494 Otero 423 363 282 925 961 1,013
STATE 7,288 6,734 6,674 39,654 40,690 45,884 1/ Does not include cash receipts received for livestock grazing. May not sum due to rounding. 2/ Includes wool. 3/ Includes mohair, poultry, hogs, and other miscellaneous livestock. 4/ Revised. 5/ Included in Combined Counties.

2007 New Mexico Agricultural Statistics 18
Cash Receipts: Wheat and Hay1/
-----------------------Wheat---------------------- -------------------------Hay------------------------
District/County 2005 20062/ 2007 2005 20062/ 2007
-------------------------------------------------1,000 Dollars---------------------------------------------
DISTRICT 10 5,562 1,866 4,956 27,849 30,924 32,236 Bernalillo 3/ 3/ 3/ 1,728 1,509 2,156 Cibola --- --- --- 153 410 492 McKinley --- --- --- 607 624 517 Rio Arriba 3/ 3/ 3/ 1,762 2,698 4,022 Sandoval 3/ 3/ 3/ 809 982 1,248 San Juan 5,464 1,846 3/ 14,149 13,264 11,762 Santa Fe 3/ 3/ 3/ 3,379 4,148 3,782 Taos 3/ 3/ 3/ 1,121 1,795 2,458 Valencia 3/ 3/ 3/ 4,142 5,494 5,799 Combined Counties 98 20 4,956 --- --- --- DISTRICT 30 23,529 16,307 32,706 35,501 40,327 51,953 Colfax 3/ 3/ 3/ 2,150 2,692 3,530 Curry 12,489 5,953 14,729 6,289 7,139 7,564 De Baca 3/ 3/ 3/ 3,323 4,005 4,917 Guadalupe 3/ 3/ 3/ 348 442 668 Harding 3/ 3/ 3/ 701 936 681 Mora --- --- --- 1,126 1,274 2,660 Quay 2,740 2,701 4,722 3,919 6,593 9,682 Roosevelt 4,297 2,558 7,560 8,141 9,610 13,552 San Miguel 3/ 3/ 3/ 1,481 1,300 1,223 Torrance --- --- --- 5,297 4,317 5,270 Union 3,129 4,920 5,536 2,725 2,016 2,206 Combined Counties 875 176 158 --- --- --- DISTRICT 70 625 566 384 10,659 10,872 12,632 Catron 3/ 3/ 3/ 507 423 252 Grant --- --- --- 240 221 202 Hidalgo 3/ 3/ 3/ 726 1,365 1,639 Luna --- --- --- 2,559 3,043 3,669 Sierra 3/ 3/ 3/ 2,243 2,438 2,332 Socorro 3/ 3/ 3/ 4,384 3,381 4,538 Combined Counties 625 566 384 --- --- --- DISTRICT 90 547 116 443 65,505 84,853 98,585 Chaves 3/ 3/ 3/ 21,736 31,210 34,165 Doña Ana --- --- --- 14,350 19,572 23,953 Eddy 3/ 3/ 3/ 22,900 24,383 29,122 Lea 262 3/ 306 5,115 7,022 8,068 Lincoln --- --- --- 181 455 529 Otero --- --- --- 1,224 2,211 2,748 Combined Counties 286 116 137 --- --- --- STATE 30,264 18,855 38,489 139,514 166,976 195,406 1/ May not sum due to rounding. 2/ Revised. 3/ Included in Combined Counties.

2007 New Mexico Agricultural Statistics 19
Cash Receipts: Cotton and Sorghum1/
----------------------Cotton----------------------- ---------------Sorghum for Grain----------------
District/County 2005 20062/ 2007 2005 20062/ 2007
---------------------------------------------------1,000 Dollars-------------------------------------------------
DISTRICT 10 --- --- --- --- --- ---
DISTRICT 30 7,987 6,372 6,433 6,671 6,366 8,588
Curry 3,686 3,504 2,829 3,210 3,798 3,317
Quay --- --- --- 382 292 680
Roosevelt 4,301 2,867 3,604 2,985 2,259 4,525
Union --- --- --- 3/ 3/ 3/
Other Counties --- --- --- 93 17 66
DISTRICT 70 2,150 3,218 3,009 281 644 870
Hidalgo --- --- --- 3/ 3/ 3/
Luna 2,150 3,218 3,009 241 610 690
Other Counties --- --- --- 40 34 180
DISTRICT 90 29,798 26,411 25,587 59 112 394
Chaves 2,458 1,370 1,171 3/ 3/ 3/
Doña Ana 13,824 10,004 8,667 3/ 3/ 3/
Eddy 3,686 3,377 3,279 3/ 3/ 3/
Lea 9,830 11,660 12,469 3/ 3/ 3/
Other Counties --- --- --- 59 112 394
STATE 39,936 36,000 35,029 7,010 7,122 9,852 1/ May not sum due to rounding. 2/ Revised. 3/ Included in Other Counties.

2007 New Mexico Agricultural Statistics 20
Cash Receipts: Corn1/
-----------------Corn for Grain------------------- ---------------Corn Silage---------------
District/County 2005 20062/ 2007 2005 2006 2007 ----------------------------------------- 1,000 Dollars------------------------------------------------
District 10 5,629 4,709 5,957 1,292 2,349 1,330 District 30 9,553 11,076 16,780 27,930 30,213 34,090 Curry 1,169 1,636 3,177 12,780 9,126 17,640 Roosevelt 540 1,515 2,433 7,791 8,964 8,470 Union 7,641 7,618 10,922 865 5,076 840 Other Counties 202 307 248 6,494 7,047 7,140 District 70 999 178 968 2,023 3,483 4,095 Sierra 202 3/ 3/ 543 3/ 3/ Other Counties 880 178 968 1,479 3,483 4,095 District 90 122 543 186 21,172 20,655 30,555 Chaves 3/ 313 --- 11,487 11,475 17,500 Doña Ana --- --- --- 4,930 4,968 7,455 Eddy 3/ 3/ --- 629 3/ 1,925 Lea --- --- 186 --- --- --- Other Counties 122 230 --- 4,126 4,212 3,675 STATE 16,303 16,507 23,892 52,416 56,700 70,070
Cash Receipts: Chile & Onions1/
------------------Chile-------------------- -----------------Onions-------------------
District/County 2005 20062/ 2007 2005 2006 2007 ------------------------------------------------ 1,000 Dollars----------------------------------------------
Districts 10 and 30 431 378 268 1,390 2,088 1,560 District 70 34,183 22,961 21,252 16,685 12,528 20,592 Hidalgo 5,154 3,483 1,911 --- --- --- Luna 25,415 17,442 16,861 16,685 12,528 3/ Other Counties 3,614 2,036 2,481 --- --- 20,592 District 90 13,190 16,027 11,330 35,519 31,320 41,288 Chaves 2,192 1,485 1,475 --- --- --- Doña Ana 9,005 11,934 8,581 35,519 31,320 41,080 Other Counties 1,993 2,608 1,274 --- --- 208 STATE 47,803 39,636 32,850 53,594 45,936 63,440 1/ May not add due to rounding. 2/ Revised. 3/ Included in Other Counties.

2007 New Mexico Agricultural Statistics 21
Cash Receipts: Vegetables, Fruits, and Nuts1/
------------------Vegetables2/----------------- ----------Fruits & Nuts3/------------
District/County 2005 20064/ 2007 2005 20064/ 2007 --------------------------------------------1,000 Dollars-------------------------------------------
DISTRICT 10 13,987 15,981 18,929 1,167 1,052 929 Bernalillo 109 114 118 167 142 199 Cibola --- --- --- 7 7 1 McKinley 34 35 36 1 1 --- Rio Arriba 268 279 290 425 393 263 Sandoval 335 349 362 140 127 101 San Juan 13,131 15,090 18,004 129 124 42 Santa Fe 73 75 78 143 130 110 Taos 7 7 7 23 23 6 Valencia 31 32 33 132 106 207 DISTRICT 30 10,105 10,923 11,576 104 98 48 Colfax --- --- --- 9 9 --- Curry 5,916 6,088 6,200 20 19 7 De Baca 16 16 17 --- --- --- Guadalupe 28 29 30 4 4 --- Harding --- --- --- --- --- --- Mora 2 2 2 13 13 1 Quay 3 3 4 6 6 8 Roosevelt 3,515 4,134 4,649 5 5 2 San Miguel 18 19 20 16 14 13 Torrance 604 628 652 32 30 16 Union 3 3 3 --- --- --- DISTRICT 70 4,993 5,192 5,392 1,343 1,077 2,141 Catron 1 1 2 1 1 --- Grant 10 10 11 47 43 32 Hidalgo 469 487 506 189 150 313 Luna 4,406 4,582 4,758 1,007 800 1,667 Sierra 80 83 86 77 65 93 Socorro 28 29 30 22 18 36 DISTRICT 90 5,025 5,226 5,427 2,531 2,073 3,683 Chaves --- --- --- 37 37 --- Doña Ana 3,622 3,767 3,911 128 104 193 Eddy 294 306 318 --- --- --- Lea 1,060 1,102 1,145 --- --- --- Lincoln --- --- --- 66 66 5 Otero 49 50 52 2,300 1,867 3,484 STATE 34,110 37,322 41,324 5,145 4,300 6,800 1/ May not sum due to rounding. 2/ Excludes chile, dry beans, and onions. 3/ Excludes pecans. 4/ Revised.

2007 New Mexico Agricultural Statistics 22
Cash Receipts: Pecans & Other Crops1/
-------------Pecans------------- --------------Other Crops2/---------------- District/County 2005 20063/ 2007 20053/ 20063/ 2007 ---------------------------------------1,000 Dollars-------------------------------------------- DISTRICT 10 34 19 13 17,469 18,193 18,662 Bernalillo --- --- --- 5,398 5,400 5,406 Cibola --- --- --- 30 34 30 McKinley --- --- --- --- --- 33 Rio Arriba --- --- --- 352 388 349 Sandoval --- --- --- 958 961 959 San Juan --- --- --- 7,625 8,267 8,529 Santa Fe --- --- --- 2,320 2,319 2,323 Taos --- --- --- 31 40 31 Valencia --- --- --- 754 784 1,002 DISTRICT 30 153 151 117 17,288 20,442 17,471 Colfax --- --- --- 2 15 1 Curry --- --- --- 2,488 5,607 4,969 De Baca --- --- --- 1,150 1,140 1,126 Guadalupe --- --- --- 24 24 24 Mora --- --- --- 2 13 1 Quay --- --- --- 129 177 175 Roosevelt --- --- --- 9,631 9,769 7,180 San Miguel --- --- --- 161 20 10 Torrance --- --- --- 3,653 3,677 3,985 Union --- --- --- 48 --- --- DISTRICT 70 4,556 3,790 3,530 4,896 5,030 5,023 Catron --- --- --- 48 48 48 Grant 4/ 4/ 4/ 12 12 12 Hidalgo 4/ 4/ 4/ 4,547 4,622 4,546 Luna 3,400 2,835 2,600 25 41 222 Sierra 1,105 917 878 162 250 154 Socorro --- --- 4/ 103 57 42 Other Counties 51 38 52 --- --- --- DISTRICT 90 105,757 82,990 92,541 45,446 45,488 45,200 Chaves 8,160 7,561 6,500 471 1,371 1,289 Doña Ana 81,600 62,094 65,000 37,159 37,107 37,251 Eddy 10,710 8,922 16,900 399 638 678 Lea 4/ 4/ 4/ 6,903 5,839 5,467 Lincoln 4/ 4/ 4/ 6 23 4 Otero 3,910 3,261 3,081 508 510 509 Other Counties 1,377 1,153 1,060 --- --- --- STATE 110,500 86,950 96,200 85,099 89,153 86,356 1/ May not sum due to rounding. 2/ Includes dry beans, peanuts, and all other crops not presented separately. 3/ Revised. 4/ Included in other counties.
2007 New Mexico Agricultural Statistics 23
Government Payments 1/
Type of Payments 2006
2007
---1,000 Dollars ----
Direct Payments2/ 15,553 15,453
Counter-Cyclical Payments2/ 17,376 8,843
Loan Deficiency Payments 3,250 283
Marketing Loan Gains 318 440
Commodity Certificate Exchange Gains 881 638
Peanut Quota Buyout Payments3/ 342 0
Milk Income Loss Payments3/ 4,075 548
Conservation Payments4/ 37,982 38,282
Ad Hoc and Emergency Programs5/ 2,848 2,469
Miscellaneous Programs6/ -17 -1
GRAND TOTAL 82,608 66,956
1/ Amounts include cash payments made directly to farmers, not including Farmer-owned Reserve Payments as these data are not available by state. Amounts also include certificate exchange gains and marketing loan gains. 2/ Direct Payments and Counter-Cyclical Payments are authorized by the Farm Security and Rural Investment Act of 2002 for 2002 through 2007 crops. The act also increases the number of crops authorized to receive payments. 3/ Programs authorized by the Farm Security and Rural Investment Act of 2002. 4/ Conservation programs include Agricultural Conservation Program, Agricultural Management Assistance Program--NRCS, Auto Agricultural Conservation Program--Environment Long Term, Auto Conservation Reserve Program--Cost Shares, Auto Environment Quality Incentives Program, Auto LTA Conservation Program--Long Term, Conservation Reserve Program--Annual Rental, Conservation Reserve Program--Cost Share, Conservation Reserve Program--Incentives, Conservation Security Program, Environment Quality Incentives Program (EQIP)--NRCS, EQIP--Ground Surface Water Conservation--NRCS, Farmland Protection Program--NRCS, Forestry Incentives Program--NRCS, Grasslands Reserve Program--NRCS, Soil and Water Conservation Assistance Program, Tree Assistance Program, Wetlands Reserve Program--NRCS, and Wildlife Habitat Incentive Program--NRCS. 5/ Ad Hoc and Emergency Programs include all programs providing disaster and emergency assistance payments to growers. Programs include Apple Market Loss Assistance Payments, Crop Disaster Program, Crop Loss Disaster Assistance Program, Dairy Indemnity Program, Dairy Market Loss Assistance Program, Disaster Program, Emergency Conservation Program, Lamb Meat Adjustment Assistance Program, Livestock Assistance Program, Livestock Compensation Program, Livestock Emergency Assistance Program, Market Loss Assistance Program, Noninsured Assistance Program, Oilseed Payment Program--Supplemental, Quality Losses Program, Trade Adjustment Assistance Program, Tree Assistance Program, and TRI Valley Growers Program. 6/ Miscellaneous programs include Acreage Grazing Payments, Additional Interest Payments, American Indian Livestock Feed Program, American Indian Livestock Feed Program--Apportioned, DCC--Fruit and Vegetable Violations, DCC--Late Filing Fees, DCC--Payment Limitation Overpayment, Feed Grain Deficiency Program, Hard White Winter Wheat Program, Interest Payments, and Payment Limitation Refund.
SOURCE: Economic Research Service/USDA

2007 New Mexico Agricultural Statistics
24
GOVERNMENT PAYMENTS
New Mexico, 2007
Other Programs*1.6%
Direct Payments23.2%
Ad Hoc and Emergency Programs3.7%
Milk Income Loss Payments0.8%
Conservation Programs57.4%
Counter-Cyclical Payments13.3%
* Other Programs Include: Marketing Loan Gains Commodity Certificate Exchange Gains Peanut Quota Buyout Payments Miscellaneous Programs

2007 New Mexico Agricultural Statistics
25
Prices Received for Hay Year1/ and Month
All Hay $/Ton
Alfalfa $/Ton
Other Hay
$/Ton
2003 142.00 144.00 118.00
2004 121.00 124.00 102.00
2005 125.00 128.00 104.00
2006 164.00 166.00 138.00
2007 163.00 166.00 136.00 2007
January 16700 172.00 145.00
February 167.00 172.00 145.00
March 168.00 172.00 145.00
April 166.00 172.00 145.00
May 172.00 175.00 145.00
June 174.00 177.00 145.00
July 164.00 167.00 136.00
August 158.00 160.00 131.00
September 157.00 160.00 131.00
October 154.00 157.00 128.00
November 158.00 162.00 132.00
December 160.00 165.00 135.00
1/ Yearly prices based on marketing year average price (Market year is May through following April).
0
20
40
60
80
100
120
140
160
180
Dol
lars
Per
Ton
2003 2004 2005 2006 2007
Hay Prices ReceivedNew Mexico, 2003-2007
All Hay Alfalfa Other Hay

2007 New Mexico Agricultural Statistics
26
Prices Received for Cattle
Year 1/ and Month
Beef Cattle
$/Cwt.
Calves $/Cwt.
Cows $/Cwt.
Steers & Heifers
$/Cwt. 2003
69.50
101.00
43.30
88.20
2004 82.00 119.00 51.50 104.00
2005
87.00 131.00
53.30 109.00
2006 81.10 128.00 44.50 106.00
2007 80.40 120.00 49.40 101.00
2007 January 73.10 106.00 46.70 93.00
February 75.00 118.00 46.50 94.00
March 81.80 122.00 47.60 101.00
April 84.60 130.00 49.00 103.00
May 85.00 125.00 52.00 102.00
June 81.90 128.00 52.00 98.00
July 80.50 122.00 53.00 98.00
August 82.70 126.00 54.00 101.00
September 83.70 122.00 52.00 104.00
October 81.90 117.00 49.00 102.00
November 75.90 113.00 44.00 100.00
December 76.50 115.00 44.00 101.00
1/ Yearly prices based on calendar year average price.
0
20
40
60
80
100
120
140
Dol
lars
Per
Ton
2003 2004 2005 2006 2007
Cattle Prices ReceivedNew Mexico, 2003-2007
Beef Cattle Calves Cows Steers & Heifers

2007 New Mexico Agricultural Statistics 27
Grazing Fees As of 2007, approximately 39 percent of New Mexico's total area of 77,667,840 acres is federal and state public trust land administered by the United States Department of Interior (USDI) Bureau of Land Management, the United States Department of Agriculture (USDA) Forest Service, and the New Mexico State Land Office. A majority of these public lands are leased for livestock grazing. For the years 1979-1985, fees for grazing on federal public lands were determined by a formula established in the Public Rangelands Improvement Act of 1978 (PRIA). The act expired December 31, 1985. On February 14, 1986, in the absence of Congressional action, the President, through Executive Order 12548, indefinitely extended the PRIA formula, subject to a few minor changes. These minor changes included: (1) the Forage Value Index would use the weighted average estimate of the annual rental charge per head per month rather than Animal Unit Month, (2) the Beef Cattle Price Index means the weighted average annual selling price for beef cattle in the 11 western states, and (3) the Prices Paid Index would reflect selected livestock production costs in the western states. In addition, the Executive Order specified the fee shall not be less than
$1.35 per Animal Unit Month; and those annual adjustments would not exceed plus or minus 25 percent of the previous year’s grazing fee. Effective March 1988, the Secretary of Agriculture issued a final ruling that established regulations for annually determining federal grazing fees. The fee system now in effect is the formula prescribed in the Executive Order of February 1986 and, in most respects, is the same grazing fee formula enacted by Congress in 1978. Grazing fees will be based on a rate-per-head month. A head month is a month's use and occupancy of range by one animal, except for sheep or goats. A full head month's fee is charged for a month of grazing by adult animals, if the grazing animal is weaned or 6 months of age or older at the time of entering the federal lands or will become 12 months of age during the permitted period of use. For fee purposes, five sheep or goats are equivalent to one cow, bull, steer, heifer, horse, or mule. Grazing fee formula components are compiled by the USDA Agricultural Statistics Board and furnished to USDI Bureau of Land Management and the USDA Forest Service for calculating the grazing fee each year.
Public Land Grazing Fee Formulation *
Grazing Fee Components Base Year 1964-68
2002 2003 2004 2005 2006 2007 2008
Grazing Rates on Private Land (Dollars) 1/ 3.65 12.60 13.00 13.40 13.80 14.60 15.10 15.60 Forage Value Index (FVI) 2/ 100 345 356 367 378 400 414 427 Average Price Received for Beef Cattle per Cwt (Dollars) 3/
22.04 72.80 66.76 75.33 88.53 91.04 92.17 86.80
Beef Cattle Price Index (BCPI) 4/ 100 330 303 342 402 413 418 394 Prices Paid Index (PPI) 5/ 100 559 559 593 618 686 724 762 Federal Grazing Fee (Dollars) 6/ (1.23) 1.43 1.35 1.43 1.79 1.56 1.35 1.35 State Grazing Fee (Dollars) 7/ 4.22 4.22 4.22 4.42 4.17 3.86 4.07
* The Federal Grazing Fee for the year specified, as constrained by Presidential Executive Order 12548, is based on prior year values for the formula components. 1/ Privately-owned, nonirrigated land in 11 western states: Arizona, California, Colorado, Idaho, Montana, Nevada, New Mexico, Oregon, Utah, Washington, and
Wyoming. Rates are per head month. Private fee grazing rates, for the prior year, are published by NASS-USDA in the January Agricultural Prices report. 2/ Private land grazing rates current year divided by base year times 100. 3/ Average for 12 months November-October prior to the fee year for 11 western states (see footnote 1). Average Beef Cattle Price Index for the November-
October period is published by NASS-USDA in the December Agricultural Prices report. 4/ Beef cattle price current year divided by base year times 100. 5/ Index of prices paid for beef cattle production inputs as percent of base year. The Prices Paid Index for Beef Cattle Production for the November-October
period are published by NASS-USDA in the December Agricultural Prices report. 6/ The grazing fee = base year fee (FVI + BCPI - PPI)/100. 2006 for example = $1.23 (400 + 413 - 686)/100 = $1.56 (Federal), per Executive Order, $1.35 is the
legal minimum. 7/ Source: New Mexico State Land Office. Data not available prior to 1988.
28 2007 New Mexico Agricultural Statistics
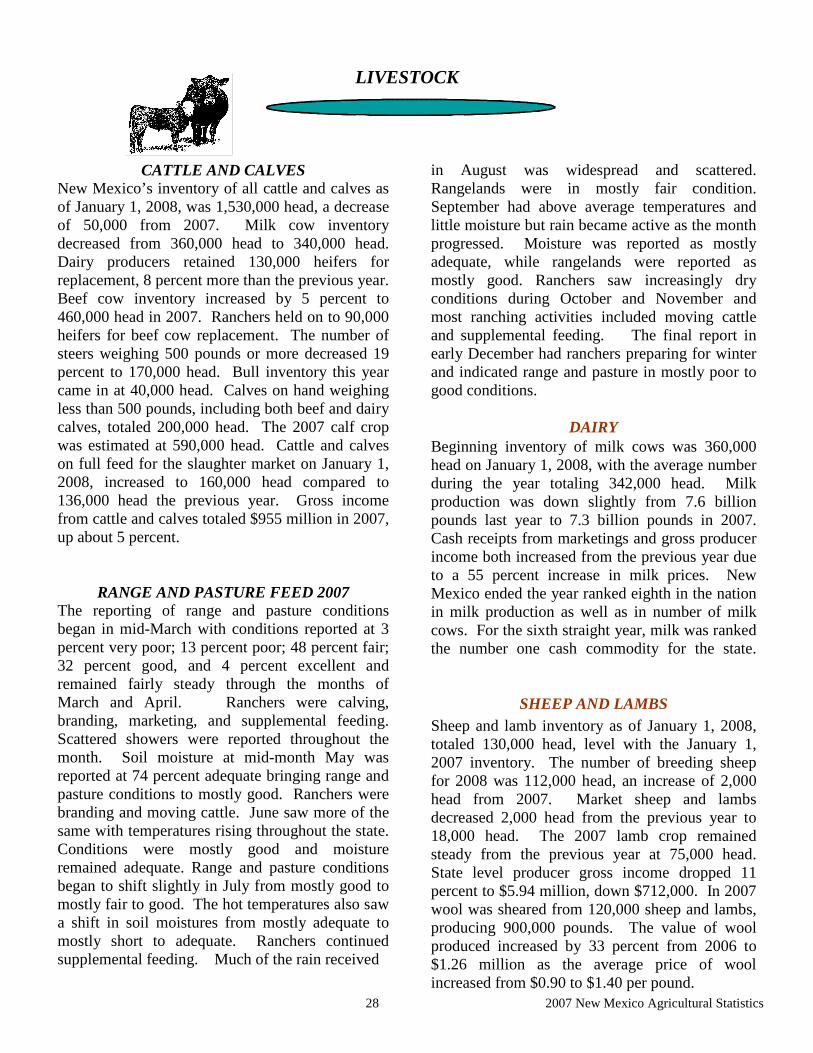
LIVESTOCK
CATTLE AND CALVES
New Mexico’s inventory of all cattle and calves as of January 1, 2008, was 1,530,000 head, a decrease of 50,000 from 2007. Milk cow inventory decreased from 360,000 head to 340,000 head. Dairy producers retained 130,000 heifers for replacement, 8 percent more than the previous year. Beef cow inventory increased by 5 percent to 460,000 head in 2007. Ranchers held on to 90,000 heifers for beef cow replacement. The number of steers weighing 500 pounds or more decreased 19 percent to 170,000 head. Bull inventory this year came in at 40,000 head. Calves on hand weighing less than 500 pounds, including both beef and dairy calves, totaled 200,000 head. The 2007 calf crop was estimated at 590,000 head. Cattle and calves on full feed for the slaughter market on January 1, 2008, increased to 160,000 head compared to 136,000 head the previous year. Gross income from cattle and calves totaled $955 million in 2007, up about 5 percent.
RANGE AND PASTURE FEED 2007 The reporting of range and pasture conditions began in mid-March with conditions reported at 3 percent very poor; 13 percent poor; 48 percent fair; 32 percent good, and 4 percent excellent and remained fairly steady through the months of March and April. Ranchers were calving, branding, marketing, and supplemental feeding. Scattered showers were reported throughout the month. Soil moisture at mid-month May was reported at 74 percent adequate bringing range and pasture conditions to mostly good. Ranchers were branding and moving cattle. June saw more of the same with temperatures rising throughout the state. Conditions were mostly good and moisture remained adequate. Range and pasture conditions began to shift slightly in July from mostly good to mostly fair to good. The hot temperatures also saw a shift in soil moistures from mostly adequate to mostly short to adequate. Ranchers continued supplemental feeding. Much of the rain received
in August was widespread and scattered. Rangelands were in mostly fair condition. September had above average temperatures and little moisture but rain became active as the month progressed. Moisture was reported as mostly adequate, while rangelands were reported as mostly good. Ranchers saw increasingly dry conditions during October and November and most ranching activities included moving cattle and supplemental feeding. The final report in early December had ranchers preparing for winter and indicated range and pasture in mostly poor to good conditions.
DAIRY Beginning inventory of milk cows was 360,000 head on January 1, 2008, with the average number during the year totaling 342,000 head. Milk production was down slightly from 7.6 billion pounds last year to 7.3 billion pounds in 2007. Cash receipts from marketings and gross producer income both increased from the previous year due to a 55 percent increase in milk prices. New Mexico ended the year ranked eighth in the nation in milk production as well as in number of milk cows. For the sixth straight year, milk was ranked the number one cash commodity for the state.
SHEEP AND LAMBS Sheep and lamb inventory as of January 1, 2008, totaled 130,000 head, level with the January 1, 2007 inventory. The number of breeding sheep for 2008 was 112,000 head, an increase of 2,000 head from 2007. Market sheep and lambs decreased 2,000 head from the previous year to 18,000 head. The 2007 lamb crop remained steady from the previous year at 75,000 head. State level producer gross income dropped 11 percent to $5.94 million, down $712,000. In 2007 wool was sheared from 120,000 sheep and lambs, producing 900,000 pounds. The value of wool produced increased by 33 percent from 2006 to $1.26 million as the average price of wool increased from $0.90 to $1.40 per pound.

2007 New Mexico Agricultural Statistics 29
1,000
1,100
1,200
1,300
1,400
1,500
1,600
1,700
Hea
d (T
hous
ands
)80 85 90 95 00 04 05 06 07 08
Cattle and CalvesNew Mexico, January 1, 1980-2008
Year
Cattle and Calves Inventory ValueNew Mexico, January 1, 1980-2008
0
500
1,000
1,500
2,000
1980 1985 1990 1995 2000 2004 2005 2006 2007 2008
Dol
lars
(M
illi
ons)
Year
Cattle and Calves: Number and Value1/
Year
Number
Value
Per Head
Total
Value
1,000 Head
Dollars
1,000
Dollars 1980
1,600
415.00
664,000
1985
1,410
350.00
493,500
1990
1,360
590.00
802,400
1995
1,500
650.00
975,000
2000
1,640
740.00
1,213,600
2004
1,510
860.00
1,298,600
2005
1,500
1,090.00
1,635,600
2006 1,550 1,160.00 1,798,000 2007 1,580 1,060.00 1,674,800 2008 1,530 1,160.00 1,774,800 1/As of January 1.

2007 New Mexico Agricultural Statistics 30
Cattle and Calves: Number by Class1/
Cows and Heifers That Have Calved
Heifers 500 Lbs. and Over
Year All Cattle
and Calves All
Cows Beef Cows
Milk Cows
Bulls 500 Lbs. & Over
Beef Replace-
ment
Milk Replace-
ment Other Total
Steers 500 Lbs. & Over
Calves Under
500 Lbs. -----------------------------------------------------------1,000 Head-----------------------------------------------------------------
1980 1,600 665 626 39 46 114 8 105 227 224 438
1985 1,410 620 555 65 41 87 28 78 193 210 346
1990 1,360 660 589 71 40 101 19 60 180 220 260
1995 1,500 730 560 170 45 105 40 110 255 210 260
2000 1,640 800 564 236 50 100 55 135 290 200 300
2004 1,510 780 455 325 45 85 75 105 265 190 230
2005 1,500 790 472 318 45 90 100 95 285 150 230
2006 1,550 800 460 340 40 90 105 105 300 190 220
2007 1,580 800 440 360 40 90 120 100 310 210 220
2008 1,530 800 460 340 40 90 130 100 320 170 200 1/As of January 1.
Cattle and Calves: Commercial Slaughter
2003
2004
2005
2006
2007
Number (1,000 Head) 25.1 13.1 11.5 11.0 7.9 Average Live Weight (Pounds) 919 972 994 977 974 Total Live Weight (1,000 Pounds) 23,107 12,731 11,478 10,346 7,196
Beef Cows 30.1%
Milk Cows 22.2%
Steers 11.1%
Heifers 20.9%
Bulls 2.6%
Calves 13.1%
As of January 1, 2008
New Mexico Cattle and Calves by Class

2007 New Mexico Agricultural Statistics 31
Cattle and Calves: Inventory, Supply, and Disposition
1/ Includes cattle on feed in feedlots. Inventory as of January 1. 2/ Includes custom slaughter for use on farms where produced, but excludes interfarm sales within the state. 3/ Excludes custom slaughter for farmers at commercial establishments.
Cattle and Calves: Production, Price, and Income Price Per 100 Pounds
Year Production1/ Marketings2/ Cattle
Calves Value of
Production Cash
Receipts3/ Value of
Home Use Gross
Income
--------1,000 Pounds-------- ---------Dollars-------- ------------------------1,000 Dollars--------------------
1980 673,370 1,199,520 64.30 77.60 435,917 777,401 4,325 781,726
1985 667,030 1,044,120 49.40 68.10 339,136 525,787 5,628 531,415
1990 587,530 1,068,800 68.00 96.80 429,827 756,736 5,924 762,660
1995 684,500 1,062,200 52.40 68.80 338,784 568,762 3,359 572,121
2000 722,280 1,307,480 67.80 101.00 450,935 919,339 4,388 923,727
2003 541,240 1,025,490 69.50 101.00 375,695 757,918 2,717 760,635
2004 601,166 1,097,340 82.00 119.00 492,693 948,659 3,464 952,123
2005 617,926 1,045,440 87.00 131.00 545,683 964,445 3,817 968,262
2006 602,484 1,041,650 81.10 128.00 498,640 905,138 3,670 908,808
2007 614,203 1,120,500 80.40 120.00 507,438 951,847 3,510 955,357 1/ Adjustments made for changes in inventory and for inshipments. 2/ Excludes custom slaughter for use on farms where produced and interfarm sales within the state. 3/ Receipts from marketings and sale of farm slaughter.
Marketings2/ Deaths
Year All Cattle and
Calves1/ Calf Crop Inshipments Cattle Calves
Farm Slaughter3/ Cattle & Calves Cattle Calves
--------------------------------------------------------------1,000 Head---------------------------------------------------------
1980 1,600 600 700 1,313 117 5 30 35
1985 1,410 535 720 1,073 137 5 25 35
1990 1,360 520 860 1,079 260 3 19 39
1995 1,500 590 800 1,045 212 3 23 37
2000 1,640 630 1,010 1,333 300 3 26 38
2003 1,550 590 840 994 410 2 26 38
2004 1,510 600 895 1,041 400 2 26 36
2005 1,500 600 865 962 390 2 26 35
2006 1,550 600 850 964 390 2 29 35
2007 1,580 590 870 1,047 390 2 34 37

2007 New Mexico Agricultural Statistics 32
Cattle and Calves: Number on Farms by County1/
1/As of January 1. 2/Includes cattle on feed. 3/To avoid disclosure, Torrance County milk cows are combined with Roosevelt County.
District/County All Cattle Beef Cows Milk Cows Other Cattle2/ --------------------------------------------------- Head ------------------------------------------------------ 2007 2008 2007 2008 2007 2008 2007 2008
DISTRICT 10 120,000 125,000 54,000 58,000 5,000 7,000 61,000 60,000 Bernalillo 7,000 --- 1,000 --- --- --- 6,000 --- Cibola 10,000 14,000 6,000 8,000 --- --- 4,000 6,000 McKinley 17,000 17,000 10,000 10,000 --- --- 7,000 7,000 Rio Arriba 19,000 20,000 12,000 12,000 --- --- 7,000 8,000 Sandoval 9,000 8,000 6,000 5,000 --- --- 3,000 3,000 San Juan 24,000 22,000 6,000 7,000 --- --- 18,000 15,000 Santa Fe 10,000 9,000 7,000 6,000 --- --- 3,000 3,000 Taos 4,000 4,000 2,000 2,000 --- --- 2,000 2,000 Valencia 15,000 --- 4,000 --- --- --- 11,000 --- Combined Counties 5,000 31,000 --- 8,000 5,000 7,000 --- 16,000 DISTRICT 30 826,000 777,000 196,000 207,000 140,000 137,000 486,000 433,000 Colfax 41,000 38,000 21,000 21,000 --- --- 20,000 17,000 Curry 222,000 221,000 12,000 12,000 70,000 75,000 140,000 134,000 De Baca 31,000 29,000 16,000 17,000 --- --- 15,000 12,000 Guadalupe 24,000 26,000 13,000 16,000 --- --- 11,000 10,000 Harding 23,000 21,000 11,000 12,000 --- --- 12,000 9,000 Mora 20,000 20,000 10,000 10,000 --- --- 10,000 10,000 Quay 63,000 57,000 24,000 26,000 --- --- 39,000 31,000 Roosevelt 159,000 133,000 16,000 17,000 70,000 62,000 69,000 54,000 San Miguel 37,000 35,000 20,000 21,000 --- --- 17,000 14,000 Torrance3/ 42,000 39,000 20,000 21,000 --- --- 22,000 18,000 Union 164,000 158,000 33,000 34,000 --- --- 131,000 124,000 DISTRICT 70 182,000 168,000 89,000 87,000 15,000 15,000 78,000 66,000 Catron 28,000 25,000 16,000 15,000 --- --- 12,000 10,000 Grant 34,000 29,000 20,000 19,000 --- --- 14,000 10,000 Hidalgo 26,000 25,000 15,000 15,000 --- --- 11,000 10,000 Luna 28,000 27,000 12,000 12,000 --- --- 16,000 15,000 Sierra 18,000 --- 8,000 --- --- --- 10,000 --- Socorro 33,000 --- 18,000 26,000 --- --- 15,000 --- Combined Counties 15,000 62,000 --- --- 15,000 15,000 --- 21,000 DISTRICT 90 452,000 460,000 101,000 108,000 196,000 181,000 155,000 171,000 Chaves 182,000 184,000 27,000 26,000 92,000 87,000 63,000 71,000 Doña Ana 87,000 91,000 6,000 7,000 56,000 54,000 25,000 30,000 Eddy 58,000 55,000 17,000 17,000 20,000 16,000 21,000 22,000 Lea 87,000 85,000 28,000 31,000 28,000 24,000 31,000 30,000 Lincoln 29,000 30,000 17,000 18,000 --- --- 12,000 12,000 Otero 9,000 15,000 6,000 9,000 --- --- 3,000 6,000 STATE 1,580,000 1,530,000 440,000 460,000 360,000 340,000 780,000 730,000

2007 New Mexico Agricultural Statistics 33
Cattle and Calves: Number on Feed by District1/ District 2002 2003 2004 2005 2006 2007 2008
DISTRICT 30 97,000 103,000 100,000 115,000 134,000 126,000 156,000
OTHER DISTRICTS 11,000 16,000 15,000 11,000 9,000 10,000 4,000
STATE 108,000 119,000 115,000 126,000 143,000 136,000 160,000 1/Includes only those animals on full feed for the slaughter market as of January 1.
Range and Pasture Feed Condition1/
Year May June July August September October November --------------------------------------Percent------------------------------------------------
1995 37 49 49 56 52 62 60
2000 47 53 54 49 41 28 33
2001 71 62 53 56 50 48 43
2002 16 13 19 26 30 32 35
2003 31 34 32 23 24 21 19
2004 56 45 49 62 78 84 80
2005 89 84 67 72 79 78 68
2006 36 20 31 68 83 83 95
2007 73 87 85 82 80 74 73 1/ Represents the percentage of range and pasture feed rated fair or better.
Range and Pasture Feed Condition
0
10
20
30
40
50
60
70
80
90
100
May June July Aug. Sept. Oct. Nov.
Per
cent
5 Yr Avg 2002-2006 2007
2007 New Mexico Agricultural Statistics 34
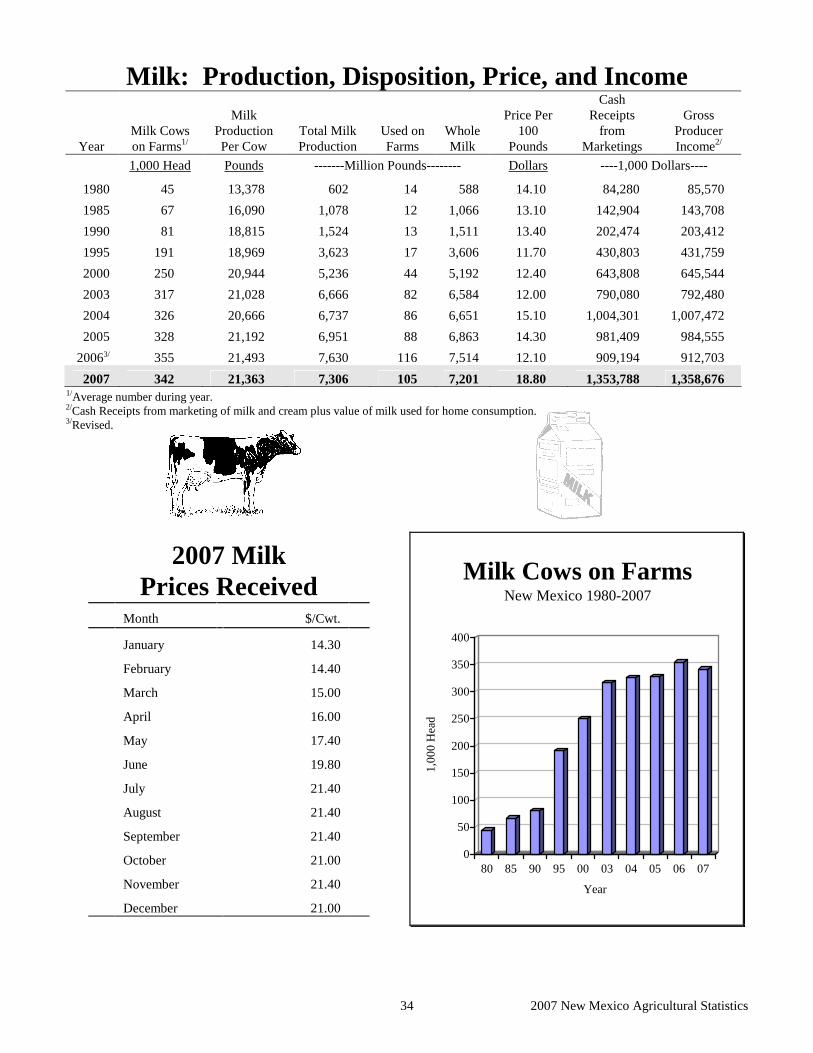
2007 Milk Prices Received
Month $/Cwt.
January 14.30
February 14.40
March 15.00
April 16.00
May 17.40
June 19.80
July 21.40
August 21.40
September 21.40
October 21.00
November 21.40
December 21.00
Milk: Production, Disposition, Price, and Income
Year Milk Cows on Farms1/
Milk Production Per Cow
Total Milk Production
Used on Farms
Whole Milk
Price Per 100
Pounds
Cash Receipts
from Marketings
Gross Producer Income2/
1,000 Head Pounds -------Million Pounds-------- Dollars ----1,000 Dollars----
1980 45 13,378 602 14 588 14.10 84,280 85,570
1985 67 16,090 1,078 12 1,066 13.10 142,904 143,708
1990 81 18,815 1,524 13 1,511 13.40 202,474 203,412
1995 191 18,969 3,623 17 3,606 11.70 430,803 431,759
2000 250 20,944 5,236 44 5,192 12.40 643,808 645,544
2003 317 21,028 6,666 82 6,584 12.00 790,080 792,480
2004 326 20,666 6,737 86 6,651 15.10 1,004,301 1,007,472
2005 328 21,192 6,951 88 6,863 14.30 981,409 984,555
20063/ 355 21,493 7,630 116 7,514 12.10 909,194 912,703
2007 342 21,363 7,306 105 7,201 18.80 1,353,788 1,358,676 1/Average number during year. 2/Cash Receipts from marketing of milk and cream plus value of milk used for home consumption. 3/Revised.
0
50
100
150
200
250
300
350
400
1,00
0 H
ead
80 85 90 95 00 03 04 05 06 07
Year
Milk Cows on FarmsNew Mexico 1980-2007

2007 New Mexico Agricultural Statistics 35
2007 Milk Production by County District/County Milk Cows1/ Milk Production Per Cow Total Milk Production
-----------Pounds------------- ----------1,000 Lbs----------
2006 2007 2006 2007 20062/ 2007
DISTRICT 30 138,000 132,000 21,700 21,700 3,000,000 2,870,000 Curry 69,000 68,000 21,700 21,800 1,500,000 1,480,000
Roosevelt 69,000 64,000 21,700 21,700 1,500,000 1,390,000
DISTRICT 90 193,000 187,000 21,200 21,000 4,092,000 3,919,000 Chaves 91,000 90,000 22,000 21,300 2,000,000 1,920,000
Doña Ana 55,000 51,000 20,900 21,600 1,150,000 1,100,000
Eddy 20,000 19,000 20,100 18,400 402,000 349,000
Lea 27,000 27,000 20,000 20,400 540,000 550,000
OTHER DISTRICTS3/ 24,000 23,000 22,400 22,500 538,000 517,000
STATE 355,000 342,000 21,493 21,363 7,630,000 7,306,000 1/Average number of cows on farms during year, excluding heifers not yet fresh. 2/Revised. 3/Includes Bernalillo, Sierra, Socorro, Torrance, and Valencia counties.
2007 Monthly Milk Production Jan Feb Mar Apr May June July Aug Sept Oct Nov Dec
Cows (1,000) (Average) 357 353 349 345 341 335 335 335 336 337 337 339
Milk Per Cow (Lbs.) 1,690 1,535 1,790 1,740 1,870 1,815 1,850 1,855 1,800 1,845 1,780 1,835
Production (Million Lbs.) 603 542 625 600 638 608 620 621 605 622 600 622
Milk Gross Producer IncomeNew Mexico, 1980-2007
0
200,000
400,000
600,000
800,000
1,000,000
1,200,000
1,400,000
1,600,000
1980 1985 1990 1995 2000 2003 2004 2005 2006 2007
1,00
0 D
olla
rs

36 2007 New Mexico Agricultural Statistics
Sheep and Lambs: Number and Value1/ Year Number Value Per Head Total Value
1,000 Head Dollars 1,000 Dollars
1980 660 77 50,820
1985 538 55 29,590
1990 505 78 38,610
1995 365 70 25,550
2000 250 89 22,250
2004 160 113 18,080
2005 145 119 17,255
2006 155 133 20,615
2007 130 125 16,250
2008 130 131 17,030 1/As of January 1.
0
10
20
30
40
50
60
Mil
lion
s
1980 1985 1990 1995 2000 2004 2005 2006 2007 2008
Year
Sheep and Lamb Total ValueNew Mexico, 1980-2008
Sheep and Lambs: Commercial Slaughter 2002 2003 2004 2005 2006 2007
Number (1,000 Head) 32.1 24.7 21.5 14.8 8.9 12.2 Average Live Weight (Pounds) 112 104 135 120 125 137 Total Live Weight (1,000 Pounds) 3,577 2,567 2,914 1,769 1,109 1,678

37 2007 New Mexico Agricultural Statistics
Sheep and Lambs: Number on Farms by Class1/
Breeding Sheep & Lambs
Market Sheep & Lambs
Year
Total Sheep
& Lambs Ewes Rams Lambs Lambs Sheep
---------------------------------------------------1,000 Head------------------------------------------------------------
1980
660
468
23
104
---
65
1985 538 391 19 76 --- 52
1990 495 373 21 79 --- 22
1995 365 250 15 50 47 3
2000 250 170 10 25 43 2
2004 160 108 7 18 25 2
2005 145 97 6 17 23 2
2006 155 102 6 22 23 2
2007 130 90 5 15 18 2
2008 130 89 6 17 16 2 1/ As of January 1.
0
1
2
3
4
5
6
Poun
ds (
Mill
ion)
80 85 90 95 00 03 04 05 06 07
Year
Wool ProductionNew Mexico 1980-2007
Wool: Production and Value
Year
Sheep Shorn
Average Weight
of Fleece
Production
Price Per
Pound
Value
1,000 Head Pounds
1,000 Pound Dollars
1,000 Dollars
1980
555
9.2
5,080
0.90
4,572
1985 522 9.2 4,819 0.72 3,470
1990 453 9.8 4,422 1.07 4,732
1995 340 8.8 3,000 1.17 3,510
2000 195 9.2 1,800 0.65 1,170
2003 160 7.8 1,240 1.10 1,364
2004 140 7.3 1,020 0.90 918
2005 155 7.4 1,150 1.20 1,380
2006 125 7.5 940 0.90 846
2007 120 7.5 900 1.40 1,260

38 2007 New Mexico Agricultural Statistics
Sheep and Lambs: Inventory, Supply, and Disposition Lamb Crop Inshipments Marketings2/
Farm Slaughter3/ Deaths
Year Total Sheep & Lambs1/ Number
As % of Ewes 1 Yr. & Older
Sheep & Lambs Sheep Lambs
Sheep & Lambs Sheep Lambs
-----1,000 Head----- Percent --------------------------------1,000 Head---------------------------------
1980 660 356 76 132 106 220 30 74 68
1985 538 325 83 44 99 172 23 38 50
1990 505 260 70 37 97 138 25 35 35
1995 365 200 80 7 83 143 9 10 12
2000 250 140 82 10 55 114 8 11 12
2003 175 99 86 9 19 81 7 8 8
2004 160 85 79 8 26 64 5 7 6
2005 145 85 88 11 12 57 4 6 7
2006 155 75 74 7 30 59 6 6 6
2007 130 75 83 10 15 56 4 5 5 1/ Includes sheep on feed. Inventory as of January 1. Beginning in 1995, new crop lambs included in Total Sheep & Lambs. 2/ Includes custom slaughter for use on farms where produced, but excludes interfarm sales within the state. 3/ Excludes custom slaughter for farmers at commercial establishments.
Sheep and Lambs: Production, Price, and Income Price Per Cwt.
Year Production1/ Marketings2/ Sheep Lambs Value of
Production Cash
Receipts3/ Value of
Home Use Gross
Income --------1,000 Pounds-------- ---------Dollars-------- ----------------------1,000 Dollars----------------------
1980 17,886 29,506 22.60 61.90 9,984 13,514 1,166 14,680
1985 21,577 25,090 28.00 68.80 13,406 13,341 1,396 14,737
1990 17,495 21,170 26.40 50.20 7,781 8,545 1,454 9,999
1995 16,479 21,270 28.00 77.20 10,739 12,288 779 13,067
2000 10,551 15,660 41.00 79.70 7,958 10,391 871 11,262
2003 7,579 8,370 37.00 89.20 6,230 6,902 801 7,703
2004 7,006 7,920 42.00 100.00 6,137 6,667 897 7,564
2005 6,978 5,850 51.00 108.00 6,636 5,908 748 6,656
2006 6,105 7,950 38.00 92.00 4,575 5,888 766 6,654
2007 6,385 6,360 36.00 98.00 5,356 5,414 528 5,942 1/ Adjustments made for changes in inventory and for inshipments. 2/ Excludes custom slaughter for use on farms where produced and interfarm sales within the state. 3/ Receipts from marketings and sale of farm slaughter.

39 2007 New Mexico Agricultural Statistics
Sheep and Lambs: Number on Farms by County1/ District/County 2006 2007 2008 DISTRICT 10 54,900 49,300 71,600 Bernalillo 1,500 1,200 500 Cibola 15,000 13,000 5,000 McKinley 22,000 19,000 42,000 Rio Arriba 4,000 4,000 5,000 San Juan 10,000 10,000 13,600 Taos 1,000 800 700 Valencia 600 600 1,200 Other Counties 800 700 3,600 DISTRICT 30 17,600 17,300 15,500 De Baca 2,000 2,000 2/
Guadalupe 4,000 3,700 3,600 Mora 500 500 500 Quay 600 500 1,100 Roosevelt 1,300 1,400 400 Torrance 8,000 8,000 7,100 Other Counties 1,200 1,200 2,800 DISTRICT 70 2,600 2,000 1,600 Socorro 1,800 1,200 800 Other Counties 800 800 800 DISTRICT 90 79,900 61,400 41,300 Chaves 38,000 29,000 17,100 DoZa Ana 1,500 1,200 800 Eddy 1,600 1,200 2,300 Lea 3,800 3,000 2,400 Lincoln 26,000 20,000 13,200 Otero 9,000 7,000 5,500 STATE 155,000 130,000 130,000 1/ As of January 1. 2/ Included in Other Counties.

40 2007 New Mexico Agricultural Statistics
Hogs and Pigs: Inventory, Supply, and Disposition
Pig Crop: December1/ - November
Year Total Hogs Sows Farrowed
Pigs Per Litter
Pigs Saved Inshipments Marketings2/
Farm Slaughter Deaths
---------1,000 Head---------- Number -----------------------------1,000 Head--------------------------------
1980 74.0 15.0 7.33 110.0 4.0 81.0 4.0 7.0
1985 38.0 8.4 7.50 63.0 2.0 56.0 2.0 4.0
1990 27.0 5.6 7.64 42.8 2.2 39.0 1.0 3.0
1995 5.0 2.0 6.75 27.0 4.0 49.0 1.0 1.0
2000 3.0 0.6 7.25 5.80 3.0 10.7 1.0 0.1
2003 2.5 0.4 7.50 3.00 3.4 5.8 1.0 0.1
2004 2.5 0.4 7.50 3.00 3.0 4.6 1.0 0.4
2005 2.0 0.4 8.50 3.40 1.0 4.1 0.5 0.3
2006 2.0 0.4 8.50 3.40 1.0 3.6 0.5 0.3
2007 2.0 0.4 8.00 3.20 0.6 3.0 0.5 0.3 1/ December previous year. 2/ Includes custom slaughter for use on farms where produced, but excludes interfarm sales within the state.
Hogs and Pigs: Production, Price, and Income
Year Production Marketings1/ Price
Per Cwt. Value of
Production Cash
Receipts2/ Value of
Home Use Gross
Income
--1,000 Pounds Live Weight-- Dollars ---------------------------1,000 Dollars--------------------------
1980 20,334 17,367 39.10 7,951 6,864 437 7,301
1985 12,994 11,858 45.50 5,959 5,482 501 5,983
1990 8,441 7,831 50.70 4,298 4,059 190 4,249
1995 7,595 9,925 40.90 3,074 4,165 172 4,337
2000 1,211 1,658 37.60 408 687 158 845
2003 1,102 1,080 34.50 294 373 145 518
2004 1,363 1,080 48.30 608 522 291 813
2005 1,143 1,080 47.50 521 513 142 655
2006 771 649 42.00 316 279 112 391
2007 678 518 40.80 272 215 101 316 1/ Excludes custom slaughter for use on farms where produced and interfarm sales within the state. 2/ Receipts from marketings and sale of farm slaughter.

41 2007 New Mexico Agricultural Statistics
Goats: Inventory
1995 2000 2004 2005 2006 2007 2008
Angora (1,000 Head) 85.0 15.0 10.0 10.0 8.0 7.0 7.5
Milk (1,000 Head) 1/ --- --- --- 4.5 4.0 3.0 4.0
Meat & Other (1,000 Head) 1/ --- --- --- 13.0 14.0 15.0 15.0 1/ Not estimated prior to 2005.
Angora Goat InventoryNew Mexico, 1995-2008
0
10
20
30
40
50
60
70
80
90
1995 2000 2004 2005 2006 2007 2008
Hea
d (T
hous
ands
)
Mohair: Production, Price, and Value
Year
Goats Clipped
Average Clip
Per Goat
Production
Price Per Pound
Value of
Production
1,000 Head Pounds 1,000 Pounds Dollars 1,000 Dollars
1995 85 4.0 340 1.66 564
2000 25 5.5 138 1.90 262
2003 10 6.0 60 1.25 75
2004 10 6.4 64 1.10 70
2005 8 6.0 48 3.25 156
2006 7 6.3 44 4.00 176
2007 6 6.7 40 4.50 180

42 2007 New Mexico Agricultural Statistics
FIELD CROPS
HAY
All harvested hay totaled 350,000 acres in 2007, up from 310,000 acres in 2006. Yield for all hay totaled 4.43 tons an acre for a total production of 1.55 million tons. The average price for all hay was $163 per ton. Harvested alfalfa acreage increased to 260,000 acres from the previous year’s total of 220,000 acres. Yield per acre was 5.20 tons for a total production of 1.35 million tons. The price of alfalfa hay averaged $167 per ton.
SORGHUM
New Mexico’s sorghum acreage harvested for grain increased to 75,000 in 2007 compared to 60,000 acres harvested the previous year. Yields averaged 40 bushels per acre for a total production of 3.0 million bushels compared to 2.1 million bushels produced a year earlier. The average price increased to $3.81 per bushel. Total value of production was $11.4 million, increasing from $6.4 million in 2006. There was a total of 22,000 acres harvested for silage with an average yield of 19 tons per acre, which produced 418,000 tons.
CORN
Corn for grain production increased from 8.3 million bushels in 2006 to 9.6 million bushels in 2007. Yield dropped to 175 bushels an acre; harvested acres increased 10,000 acres to 55,000. The 2007 price per bushel averaged $4.45 for a total value of production of $42.8 million. Acres harvested for silage decreased 9 percent to 77,000. Yield increased to 26 tons per acre for a total production of 2.0 million tons.
WHEAT
Winter wheat production in the state for 2007 was 7.8 million bushels, an increase of 4.0 million bushels from last year. Harvested acreage was 300,000 compared to 120,000 acres the previous year. The average yield was 26 bushels per acre. The value of production was $43 million with an average price of $5.50 per bushel.
PEANUTS
Peanut harvested acreage decreased by 2,000 acres from the previous year to 10,000 acres in 2007. Yields were slightly lower than a year earlier at 3,500 pounds per acre. Production was 35 million pounds. Crop value declined from $8.0 million in 2006 to $7.0 million in 2007 with the average price slightly higher at $0.20 per pound.
COTTON
Upland cotton producers harvested 39,000 acres in 2007, a decrease of 9,000 acres from the previous year. Yields averaged 1,095 pounds per acre. Total production for the year was estimated at 89,000 bales. Price per pound averaged $0.63 with total value of production at $32.7 million. American-Pima harvested acres totaled 4,600. Yields for the year averaged 856 pounds per acre with a total production of 8,200 bales. The price per pound averaged $0.96 with total value of production at $5.1 million.

43 2007 New Mexico Agricultural Statistics
Acreage and Value of Principal Field Crops
Commodity Year Unit Harvested
Acres Yield
Per Acre Production Season
Avg. Price Value of
Production
GENERAL CROPS 1,000 Acres Units 1,000 Units Dollars 1,000 Dollars
Corn for Grain 2006 Bu. 45 185 8,325 3.70 30,803
2007 Bu. 55 175 9,625 4.45 42,831
Corn for Silage 2006 Tons 84 25 2,100 27.00 56,700
2007 Tons 77 26 2,002 35.00 70,070
Wheat for Grain 2006 Bu. 120 32 3,840 4.55 17,472
2007 Bu. 300 26 7,800 5.50 42,900
Dry Beans1/ 2006 Cwt. 8.2 24 197 26.00 5,122
2007 Cwt. 7.5 24 180 39.00 7,020
Sorghum Grain 2006 Bu. 60 35 2,100 3.16 6,644
2007 Bu. 75 40 3,000 3.81 11,424
Sorghum Silage 2006 Tons 17 19 323 --- ---
2007 Tons 22 19 418 --- ---
Upland Cotton2/ 2006 Lbs. 48 930 93 .48 21,427
2007 Lbs. 39 1,095 89 .63 26,914
American-Pima Cotton2/ 2006 Lbs. 12.5 768 20.0 .87 8,314
2007 Lbs. 4.6 856 8.2 .96 5,069
Cottonseed3/ 2006 Tons --- --- 40.0 173.00 6,920
2007 Tons --- --- 33.5 183.00 7,686
Potatoes 2006 Cwt. 5.0 420 2,100 6.50 13,650
2007 Cwt. 5.4 370 1,998 7.00 13,986
Peanuts3/ 2006 Lbs. 12 3,600 43,200 .185 7,992
2007 Lbs. 10 3,500 35,000 .201 7,035
Chile4/ 2006 Tons 13.8 5.3 73,400 540 39,630
2007 Tons 11.0 4.5 49,000 585 28,680
Onions 2006 Cwt. 5.5 480 2,640 17.40 45,936
2007 Cwt. 6.1 500 3,050 20.80 63,440
Pecans 2006 Lbs. --- --- 47,000 1.85 86,950
2007 Lbs. --- --- 74,000 1.30 96,200
HAY CROPS
All Hay5/ 2006 Tons 310 4.14 1,284 164.00 208,608
2007 Tons 350 4.43 1,550 163.00 251,360
Alfalfa Hay 2006 Tons 220 5.10 1,122 166.00 186,252
2007 Tons 260 5.20 1,352 166.00 224,432
All Other Hay 2006 Tons 90 1.80 162 138.00 22,356
2007 Tons 90 2.20 198 136.00 26,928 1/ Production in cwt., season average price in dollars per cwt. 2/ Production in 480 pound net weight bales. 3/ 2007 value of production is preliminary. 4/ Production includes both wet and dry tonnage combined. 5/ Value of production may not equal production times season average price.

44 2007 New Mexico Agricultural Statistics
Wheat: Acreage, Production, Price, and Value
Acreage
Year Planted1/
Harvested
Yield
Per Acre
Production
Price
Per Bushel
Value of
Production
1,000 Acres
1,000 Acres
Bushels
1,000
Bushels
Dollars
1,000
Dollars 1980
650
500
21
10,500
3.76
39,480
1985 730 570 36 20,520
2.90
59,508
1990 520 300 27 8,100
2.79
22,599
1995 460 150 22 3,300
4.50
14,850
2000 470 175 24 4,200 2.70 11,340
2003 500 140 30 4,200
3.30
13,860
2004 490 300 26 7,800
3.15
24,570
2005 450 270 36 9,720
3.25
31,590
2006 440 120 32 3,840 4.55 17,472
2007 490 300 26 7,800 5.50 42,900
1/ Includes acres planted in preceding fall.
New Mexico Wheat Acreage 1980-2007
0
200
400
600
800
1980 1985 1990 1995 2000 2003 2004 2005 2006 2007
Acr
es (
Tho
usan
ds)
Planted Harvested
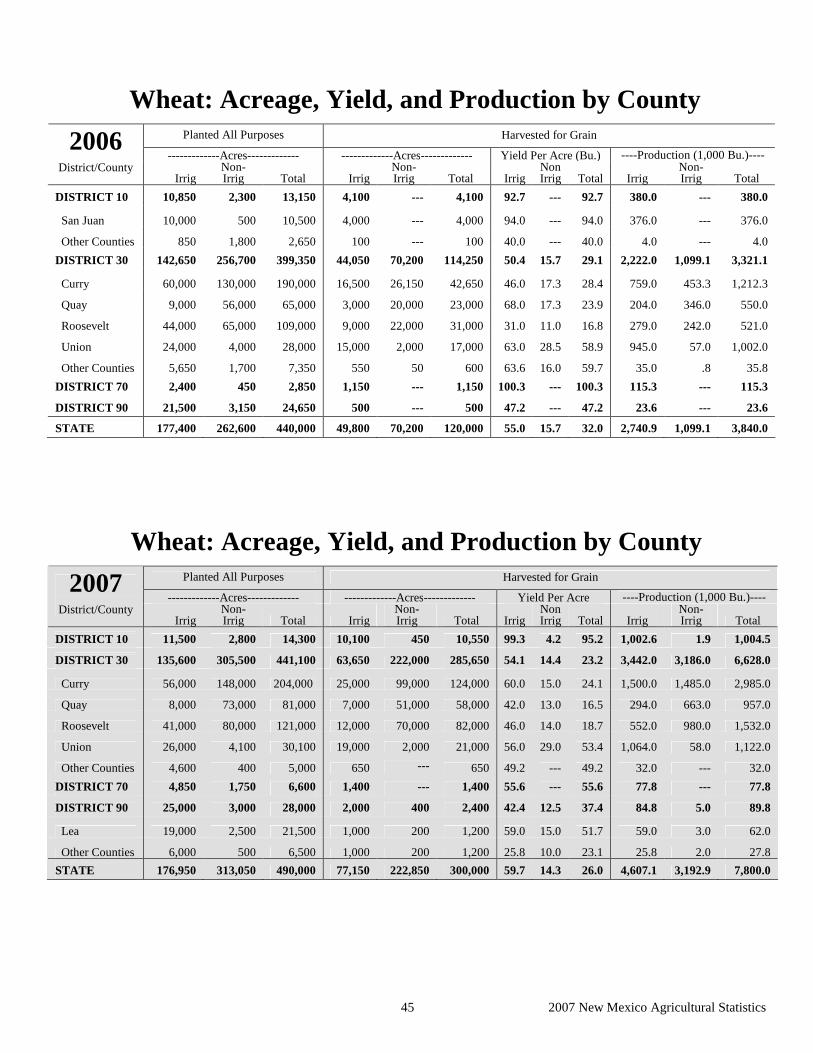
45 2007 New Mexico Agricultural Statistics
Wheat: Acreage, Yield, and Production by County
Planted All Purposes Harvested for Grain
-------------Acres-------------
-------------Acres------------- Yield Per Acre (Bu.)
----Production (1,000 Bu.)----
2006 District/County
Irrig Non- Irrig Total Irrig
Non- Irrig Total Irrig
Non Irrig Total Irrig
Non- Irrig Total
DISTRICT 10 10,850 2,300 13,150 4,100 --- 4,100 92.7 --- 92.7 380.0 --- 380.0
San Juan 10,000 500 10,500 4,000 --- 4,000 94.0 --- 94.0 376.0 --- 376.0
Other Counties 850 1,800 2,650 100 --- 100 40.0 --- 40.0 4.0 --- 4.0 DISTRICT 30 142,650 256,700 399,350 44,050 70,200 114,250 50.4 15.7 29.1 2,222.0 1,099.1 3,321.1
Curry 60,000 130,000 190,000 16,500 26,150 42,650 46.0 17.3 28.4 759.0 453.3 1,212.3
Quay 9,000 56,000 65,000 3,000 20,000 23,000 68.0 17.3 23.9 204.0 346.0 550.0
Roosevelt 44,000 65,000 109,000 9,000 22,000 31,000 31.0 11.0 16.8 279.0 242.0 521.0
Union 24,000 4,000 28,000 15,000 2,000 17,000 63.0 28.5 58.9 945.0 57.0 1,002.0
Other Counties 5,650 1,700 7,350 550 50 600 63.6 16.0 59.7 35.0 .8 35.8 DISTRICT 70 2,400 450 2,850 1,150 --- 1,150 100.3 --- 100.3 115.3 --- 115.3 DISTRICT 90 21,500 3,150 24,650 500 --- 500 47.2 --- 47.2 23.6 --- 23.6 STATE 177,400 262,600 440,000 49,800 70,200 120,000 55.0 15.7 32.0 2,740.9 1,099.1 3,840.0
Wheat: Acreage, Yield, and Production by County
Planted All Purposes Harvested for Grain
-------------Acres-------------
-------------Acres-------------
Yield Per Acre (Bu.)
----Production (1,000 Bu.)----
2007 District/County
Irrig Non- Irrig Total Irrig
Non- Irrig Total Irrig
Non Irrig Total Irrig
Non- Irrig Total
DISTRICT 10 11,500 2,800 14,300 10,100 450 10,550 99.3 4.2 95.2 1,002.6 1.9 1,004.5 DISTRICT 30 135,600 305,500 441,100 63,650 222,000 285,650 54.1 14.4 23.2 3,442.0 3,186.0 6,628.0
Curry 56,000 148,000 204,000 25,000 99,000 124,000 60.0 15.0 24.1 1,500.0 1,485.0 2,985.0
Quay 8,000 73,000 81,000 7,000 51,000 58,000 42.0 13.0 16.5 294.0 663.0 957.0
Roosevelt 41,000 80,000 121,000 12,000 70,000 82,000 46.0 14.0 18.7 552.0 980.0 1,532.0
Union 26,000 4,100 30,100 19,000 2,000 21,000 56.0 29.0 53.4 1,064.0 58.0 1,122.0
Other Counties 4,600 400 5,000 650 --- 650 49.2 --- 49.2 32.0 --- 32.0 DISTRICT 70 4,850 1,750 6,600 1,400 --- 1,400 55.6 --- 55.6 77.8 --- 77.8 DISTRICT 90 25,000 3,000 28,000 2,000 400 2,400 42.4 12.5 37.4 84.8 5.0 89.8
Lea 19,000 2,500 21,500 1,000 200 1,200 59.0 15.0 51.7 59.0 3.0 62.0
Other Counties 6,000 500 6,500 1,000 200 1,200 25.8 10.0 23.1 25.8 2.0 27.8 STATE 176,950 313,050 490,000 77,150 222,850 300,000 59.7 14.3 26.0 4,607.1 3,192.9 7,800.0

46 2007 New Mexico Agricultural Statistics
All Hay: Acreage, Production, Price, Value, and Stocks1/ On Farm Stocks Crop
Year Acreage
Harvested Yield
Per Acre Production Price Per Ton Value of
Production2/ Dec 1 May 1 1,000 Acres Tons 1,000 Tons Dollars 1,000 Dollars 1,000 Tons 1980 310 3.69 1,144 86.50 98,956 456 108 1985 340 4.38 1,488 80.00 119,040 432 119 1990 320 4.30 1,376 111.00 153,840 482 138 1995 345 4.17 1,440 113.00 162, 575 576 50 2000 390 4.33 1,688 122.00 205,352 600 185 2003 300 4.27 1,281 142.00 180,460 525 98 2004 330 4.14 1,365 121.00 165,102 545 115 2005 330 4.28 1,413 125.00 176,328 545 164 20063/ 310 4.14 1,284 164.00 208,608 470 133 2007 350 4.43 1,550 163.00 251,360 580 105
1/ Dry hay only. Excludes silage and green chop. 2/ Sum of Alfalfa and All Other Hay; value may not equal production times price. 2/ Revised.
All Hay: Acreage, Yield, and Production by County1/ ----------------------------2006------------------------- ------------------------------2007----------------------------
District/County
Acreage Harvested
Yield Per Acre Production
Acreage Harvested
Yield Per Acre Production
Acres Tons Tons Acres Tons Tons DISTRICT 10 68,500 3.47 237,800 75,600 3.38 255,700 Bernalillo 3,000 3.87 11,600 3,900 4.38 17,100 Cibola 1,100 2.86 3,150 1,450 2.69 3,900 McKinley 1,800 2.67 4,800 2,000 2.05 4,100 Rio Arriba 14,500 1.43 20,750 15,500 2.06 31,900 Sandoval 2,700 2.80 7,550 3,450 2.87 9,900 San Juan 20,400 5.00 102,000 22,200 4.20 93,300 Santa Fe 7,500 4.25 31,900 7,900 3.80 30,000 Taos 9,000 1.53 13,800 9,900 1.97 19,500 Valencia 8,500 4.97 42,250 9,300 4.95 46,000 DISTRICT 30 112,000 2.77 310,100 125,850 3.27 412,100 Colfax 9,500 2.18 20,700 11,500 2.43 28,000 Curry 22,000 2.50 54,900 25,600 2.34 60,000 De Baca 7,000 4.40 30,800 8,500 4.59 39,000 Guadalupe 1,200 2.83 3,400 1,700 3.12 5,300 Harding 1,800 4.00 7,200 1,950 2.77 5,400 Mora 6,500 1.51 9,800 7,300 2.89 21,100 Quay 16,500 3.07 50,700 19,000 4.04 76,800 Roosevelt 31,000 2.38 73,900 31,000 3.47 107,500 San Miguel 4,000 2.50 10,000 4,000 2.42 9,700 Torrance 7,000 4.74 33,200 8,000 5.23 41,800 Union 5,500 2.82 15,500 7,300 2.40 17,500 DISTRICT 70 17,500 4.78 83,600 19,650 5.10 100,200 Catron 1,100 2.95 3,250 850 2.35 2,000 Grant 900 1.89 1,700 700 2.29 1,600 Hidalgo 2,500 4.20 10,500 3,000 4.33 13,000 Luna 4,000 5.85 23,400 4,200 6.93 29,100 Sierra 3,000 6.25 18,750 3,000 6.17 18,500 Socorro 6,000 4.33 26,000 7,900 4.56 36,000 DISTRICT 90 112,000 5.83 652,500 128,900 6.07 782,000 Chaves 36,000 6.67 240,000 41,300 6.56 271,000 Doña Ana 23,000 6.54 150,500 26,000 7.31 190,000 Eddy 33,000 5.68 187,500 41,700 5.54 231,000 Lea 13,000 4.15 54,000 14,000 4.57 64,000 Lincoln 1,000 3.50 3,500 1,100 3.82 4,200 Otero 6,000 2.83 17,000 4,800 4.54 21,800 STATE 310,000 4.14 1,284,000 350,000 4.43 1,550,000
1/ Dry hay only. Excludes silage and green chop.

47 2007 New Mexico Agricultural Statistics
Alfalfa and Other Hay: Acreage, Yield, and Production1/ -------------------------Alfalfa Hay-------------------------- -------------------------All Other Hay------------------------
Year Acreage Harvested Yield Per Acre Production Acreage Harvested Yield Per Acre Production 1,000 Acres Tons 1,000 Tons 1,000 Acres Tons 1,000 Tons
1980 240 4.30 1,032 70 1.60 112 1985 260 5.20 1,352 80 1.70 136 1990 250 5.00 1,250 70 1.80 126 1995 245 5.10 1,250 100 1.90 190 2000 290 5.20 1,508 100 1.80 180 2003 230 4.90 1,127 70 2.20 154 2004 240 4.90 1,176 90 2.10 189 2005 240 5.10 1,224 90 2.10 189 2006 220 5.10 1,122 90 1.80 162 2007 260 5.20 1,352 90 2.20 198
1/ Dry hay only. Excludes silage and green chop.
Alfalfa Hay: Acreage, Yield, and Production by County1/
---------------------------2006--------------------------- --------------------------2007-----------------------------
District/County Acreage
Harvested Yield Per
Acre Production Acreage
Harvested Yield Per
Acre Production Acres Tons Tons Acres Tons Tons DISTRICT 10 59,000 3.75 221,100 66,400 3.45 229,200 Bernalillo 2,000 4.60 9,200 2,500 5.00 12,500 Cibola 1,000 3.00 3,000 1,200 2.67 3,200 McKinley 1,500 3.00 4,500 1,800 2.11 3,800 Rio Arriba 12,500 1.50 18,750 13,300 1.80 23,900 Sandoval 2,500 2.90 7,250 3,000 3.00 9,000 San Juan 18,000 5.40 97,200 20,000 4.42 88,300 Santa Fe 6,500 4.60 29,900 7,300 3.84 28,000 Taos 8,000 1.60 12,800 9,000 2.00 18,000 Valencia 7,000 5.50 38,500 8,300 5.12 42,500 DISTRICT 30 59,000 4.25 250,600 71,650 4.46 319,800 Colfax 8,000 2.40 19,200 9,500 2.47 23,500 Curry 7,000 5.70 39,900 8,600 5.00 43,000 De Baca 6,000 4.80 28,800 7,500 4.93 37,000 Guadalupe 1,000 3.00 3,000 1,300 3.23 4,200 Harding 1,500 4.40 6,600 1,600 2.75 4,400 Mora 5,500 1.60 8,800 6,000 3.00 18,000 Quay 9,500 4.60 43,700 13,000 4.60 59,800 Roosevelt 11,000 4.90 53,900 13,000 5.69 74,000 San Miguel 2,000 4.00 8,000 2,250 3.38 7,600 Torrance 6,000 5.20 31,200 7,100 5.68 40,300 Union 1,500 5.00 7,500 1,800 4.44 8,000 DISTRICT 70 13,500 5.43 73,300 15,850 5.55 88,000 Catron 1,000 3.10 3,100 750 2.40 1,800 Grant 500 2.60 1,300 500 2.40 1,200 Hidalgo 1,500 5.00 7,500 2,100 5.00 10,500 Luna 3,000 6.80 20,400 3,600 7.50 27,000 Sierra 2,500 7.00 17,500 2,500 7.00 17,500 Socorro 5,000 4.70 23,500 6,400 4.69 30,000 DISTRICT 90 88,500 6.52 577,000 106,100 6.74 715,000 Chaves 30,000 7.00 210,000 36,000 6.97 251,000 Doña Ana 19,500 7.00 136,500 23,500 7.74 182,000 Eddy 29,500 6.00 177,000 34,700 6.14 213,000 Lea 7,000 6.00 42,000 8,600 6.05 52,000 Lincoln 500 5.00 2,500 600 4.50 2,700 Otero 2,000 4.50 9,000 2,700 5.30 14,300 STATE 220,000 5.10 1,122,000 260,000 5.20 1,352,000
1/ Dry hay only. Excludes silage and green chop.
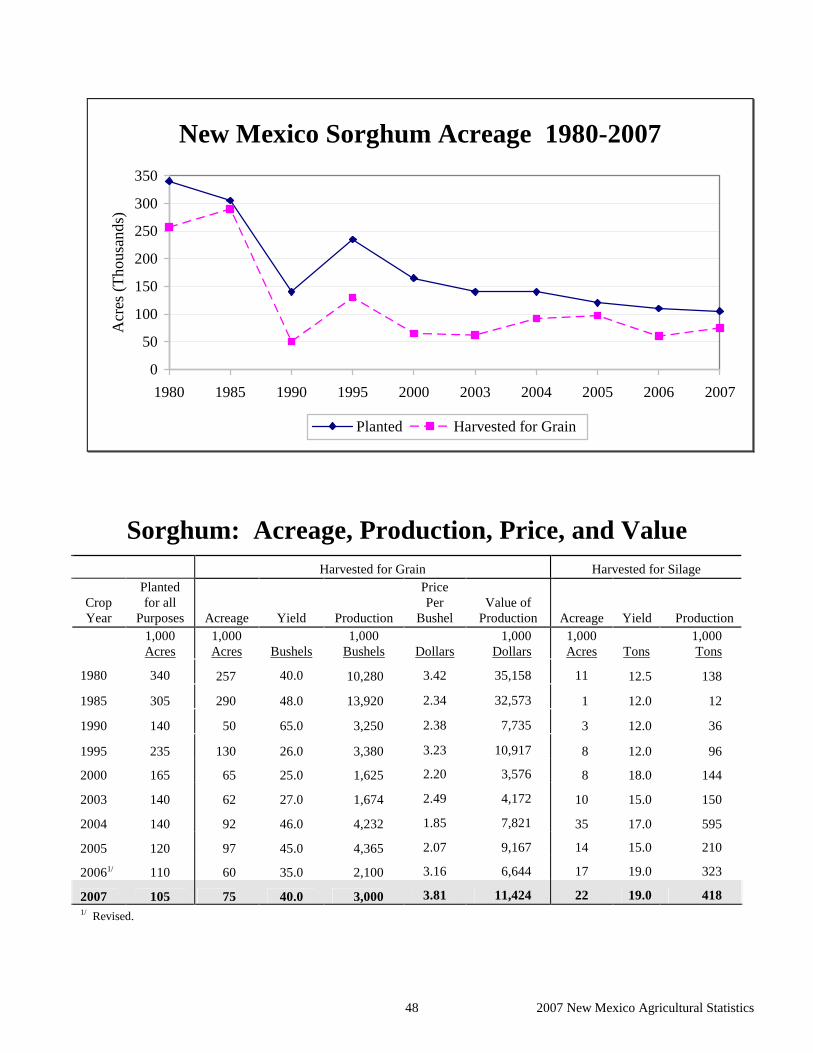
48 2007 New Mexico Agricultural Statistics
Sorghum: Acreage, Production, Price, and Value
Harvested for Grain
Harvested for Silage
Crop Year
Planted for all
Purposes Acreage Yield Production
Price Per
Bushel Value of
Production Acreage Yield Production
1,000 Acres
1,000 Acres Bushels
1,000 Bushels Dollars
1,000 Dollars
1,000 Acres Tons
1,000 Tons
1980
340
257
40.0
10,280
3.42
35,158
11
12.5
138
1985 305 290 48.0 13,920
2.34
32,573 1 12.0 12
1990 140 50 65.0 3,250
2.38
7,735 3 12.0 36
1995 235 130 26.0 3,380
3.23
10,917 8 12.0 96
2000 165 65 25.0 1,625 2.20 3,576 8 18.0 144
2003 140 62 27.0 1,674
2.49
4,172 10 15.0 150
2004 140 92 46.0 4,232
1.85
7,821 35 17.0 595
2005 120 97 45.0 4,365
2.07
9,167 14 15.0 210
20061/ 110 60 35.0 2,100 3.16 6,644 17 19.0 323
2007 105 75 40.0 3,000 3.81 11,424 22 19.0 418 1/ Revised.
New Mexico Sorghum Acreage 1980-2007
0
50
100
150
200
250
300
350
1980 1985 1990 1995 2000 2003 2004 2005 2006 2007
Acr
es (
Tho
usan
ds)
Planted Harvested for Grain

49 2007 New Mexico Agricultural Statistics
Sorghum: Acreage, Yield, and Production by County Planted All Purposes Harvested for Grain 2006 --------------Acres-------------- --------------Acres------------- -Yield Per Acre (Bu.)- ---Production (1,000 Bu.)---
District/County Irrig
Non-Irrig Total
Irrig
Non- Irrig Total Irrig
Non- Irrig Total
Irrig
Non- Irrig Total
DISTRICT 10 300 200 500 --- --- --- --- --- --- --- --- --- DISTRICT 30 24,000 81,200 105,200 13,100 45,000 58,100 72.0 20.8 32.3 943.0 934.0 1,877.0 Curry 14,000 38,000 52,000 10,000 16,000 26,000 80.0 20.0 43.1 800.0 320.0 1,120.0 Quay 2,000 9,000 11,000 1,000 3,000 4,000 38.0 16.0 21.5 38.0 48.0 86.0 Roosevelt 6,000 34,000 40,000 2,000 26,000 28,000 50.0 21.8 23.8 100.0 566.0 666.0 Other Counties 2,000 200 2,200 100 --- 100 50.0 --- 50.0 5.0 --- 5.0
DISTRICT 70 1,600 --- 1,600 1,600 --- 1,600 118.8 --- 118.8 190.0 --- 190.0 Luna 1,500 --- 1,500 1,500 --- 1,500 120.0 --- 120.0 180.0 --- 180.0 Other Counties 100 --- 100 100 --- 100 100.0 --- 100.0 10.0 --- 10.0
DISTRICT 90 2,400 300 2,700 300 --- 300 110.0 --- 110.0 33.0 --- 33.0 Other Counties 2,400 300 2,700 300 --- 300 110.0 --- 110.0 33.0 --- 33.0 STATE 28,300 81,700 110,000 15,000 45,000 60,000 77.7 20.8 35.0 1,166.0 934.0 2,100.0
Sorghum: Acreage, Yield, and Production by County
Planted All Purposes Harvested for Grain 2007 --------------Acres-------------- --------------Acres------------- -Yield Per Acre (Bu.)- ---Production (1,000 Bu.)---
District/County Irrig
Non- Irrig Total Irrig
Non- Irrig Total Irrig
Non- Irrig Total Irrig
Non-Irrig Total
DISTRICT 30 28,800 59,000 96,800 11,900 59,000 70,900 60.1 32.2 36.9 715.0 1,900.0 2,615.0 Curry 17,700 29,200 46,900 5,500 21,500 27,000 67.3 29.8 37.4 370.0 640.0 1,010.0 Quay 1,600 5,600 7,200 1,600 4,800 6,400 50.0 26.5 32.3 80.0 127.0 207.0 Roosevelt 9,000 32,800 41,800 4,600 32,400 37,000 55.2 34.7 37.2 254.0 1,124.0 1,378.0 Other Counties 500 400 900 200 300 500 55.0 30.0 40.0 11.0 9.0 20.0
DISTRICT 70 2,800 --- 2800 2,300 --- 2,300 115.2 --- 115.2 265.0 --- 265.0 Luna 1,900 --- 1900 1,800 --- 1,800 116.7 --- 116.7 210.0 --- 210.0 Other Counties 900 --- 900 500 --- 500 110.0 --- 110.0 55.0 --- 55.0
DISTRICT 90 5,400 --- 5,400 1,800 --- 1,800 66.7 --- 66.7 120.0 --- 120.0STATE 37,000 68,000 105,000 16,000 59,000 75,000 68.8 32.2 40.0 1,100.0 1,900.0 3,000.0
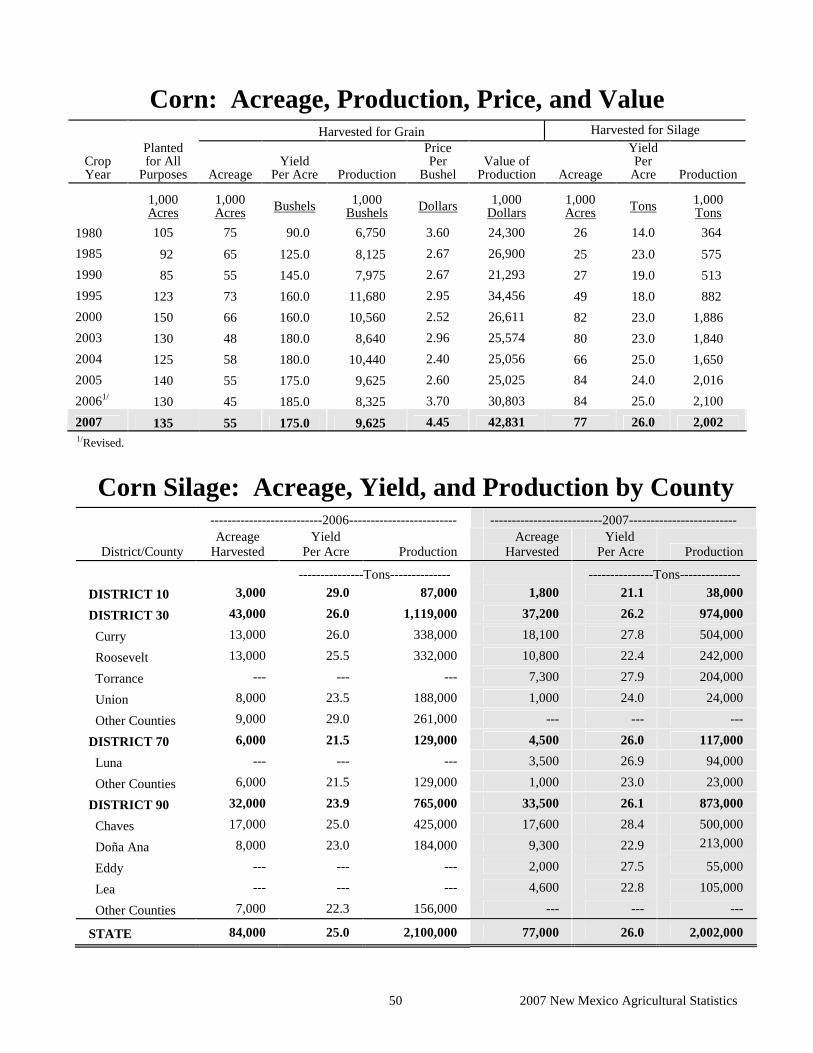
50 2007 New Mexico Agricultural Statistics
Corn: Acreage, Production, Price, and Value
Harvested for Grain
Harvested for Silage
Crop Year
Planted for All
Purposes Acreage Yield
Per Acre Production
Price Per
Bushel Value of
Production Acreage
Yield Per
Acre Production
1,000 Acres
1,000 Acres
Bushels
1,000
Bushels
Dollars
1,000
Dollars
1,000 Acres
Tons
1,000 Tons
1980
105
75
90.0
6,750
3.60
24,300
26
14.0
364
1985 92 65 125.0 8,125
2.67
26,900 25 23.0 575
1990 85 55 145.0 7,975
2.67
21,293 27 19.0 513
1995 123 73 160.0 11,680
2.95
34,456 49 18.0 882
2000 150 66 160.0 10,560 2.52 26,611 82 23.0 1,886 2003 130 48 180.0 8,640
2.96
25,574 80 23.0 1,840
2004 125 58 180.0 10,440 2.40 25,056 66 25.0 1,650 2005 140 55 175.0 9,625 2.60 25,025 84 24.0 2,016
20061/ 130 45 185.0 8,325 3.70 30,803 84 25.0 2,100
2007 135 55 175.0 9,625 4.45 42,831 77 26.0 2,002 1/Revised.
Corn Silage: Acreage, Yield, and Production by County
--------------------------2006-------------------------
--------------------------2007-------------------------
District/County Acreage
Harvested Yield Per Acre Production
Acreage Harvested
Yield Per Acre Production
---------------Tons-------------- ---------------Tons--------------
DISTRICT 10 3,000 29.0 87,000 1,800 21.1 38,000
DISTRICT 30 43,000 26.0 1,119,000 37,200 26.2 974,000
Curry 13,000 26.0 338,000 18,100 27.8 504,000
Roosevelt 13,000 25.5 332,000 10,800 22.4 242,000
Torrance --- --- --- 7,300 27.9 204,000
Union 8,000 23.5 188,000 1,000 24.0 24,000
Other Counties 9,000 29.0 261,000 --- --- ---
DISTRICT 70 6,000 21.5 129,000 4,500 26.0 117,000
Luna --- --- --- 3,500 26.9 94,000
Other Counties 6,000 21.5 129,000 1,000 23.0 23,000
DISTRICT 90 32,000 23.9 765,000 33,500 26.1 873,000
Chaves 17,000 25.0 425,000 17,600 28.4 500,000
Doña Ana 8,000 23.0 184,000 9,300 22.9 213,000
Eddy --- --- --- 2,000 27.5 55,000
Lea --- --- --- 4,600 22.8 105,000
Other Counties 7,000 22.3 156,000 --- --- ---
STATE 84,000 25.0 2,100,000 77,000 26.0 2,002,000

51 2007 New Mexico Agricultural Statistics
Corn Grain: Acreage, Yield, and Production by County -------------------------2006------------------------ -------------------------2007---------------------------
District/County
Planted for all
Purposes Harvested for Grain
Yield Per Acre Production
Planted for all
Purposes Harvested for Grain
Yield Per Acre Production
----------Acres---------- ---------Bushels---------- ----------Acres---------- ---------- Bushels--------
DISTRICT 10 18,500 15,500 153.2 2,375,000 15,800 13,800 173.9 2,400,000
DISTRICT 30 70,000 27,000 206.9 5,586,000 77,000 38,400 176.0 6,760,000
Curry 18,000 5,000 165.0 825,000 26,100 7,500 170.7 1,280,000
Roosevelt 17,000 4,000 191.0 764,000 16,800 5,600 175.0 980,000
Torrance --- --- --- --- 7,400 --- --- ---
Union 25,000 17,000 226.0 3,842,000 26,000 24,700 178.1 4,400,000
Other Counties 10,000 1,000 155.0 155,000 700 600 166.7 100,000
DISTRICT 70 7,000 500 180.0 90,000 7,200 2300 180.0 90,000
Luna --- --- --- --- 3,500 --- --- ---
Other Counties 7,000 500 180.0 90,000 3,700 2,300 169.6 390,000
DISTRICT 90 34,500 2,000 137.0 274,000 35,000 500 150.0 75,000
Chaves 18,000 1,000 158.0 158,000 17,800 --- --- ---
Doña Ana 8,000 --- --- --- 9,600 --- --- ---
Eddy --- --- --- --- 2,200 --- --- ---
Lea --- --- --- --- 5,400 500 150.0 75,000
Other Counties 8,500 1,000 116.0 116,000 --- --- --- ---
STATE 130,000 45,000 185.0 8,325,000 135,000 55,000 175.0 9,625,000
New Mexico Corn Acreage 1980-2007
0
20
40
60
80
100
120
140
160
1980 1985 1990 1995 2000 2003 2004 2005 2006 2007
Acr
es (
Tho
usan
ds)
Total Planted Harvested: Silage Harvested: Grain

52 2007 New Mexico Agricultural Statistics
Upland Cotton: Acreage, Production, Price, and Value Acreage
Crop Year Planted Harvested
Yield Per Acre
Production (480-Pound Net Weight Bales)
Price Per Pound
Value of Production
1,000 Acres 1,000 Acres Net Pounds 1,000 Bales Cents 1,000 Dollars
1980 151.0 120.0 428 107.0 81.00 41,602
1985 70.0 54.0 631 71.0 57.60 19,630
1990 69.0 62.0 735 95.0 70.90 32,330
1995 61.0 56.0 609 71.0 81.70 27,843
2000 72.0 67.0 724 101.0 53.10 25,743
2003 53.0 38.0 884 70.0 56.30 18,917
2004 68.0 64.0 848 113.0 48.00 26,035
2005 56.0 51.0 1,016 108.0 54.00 27,994
20061/ 50.0 48.0 930 93.0 48.00 21,427
2007 43.0 39.0 1,095 89.0 63.00 26,914 1/Revised.
Upland Cotton: Acreage, Yield, and Production by County Acreage
District/County Planted Harvested Yield Per Acre
Production (480-Pound Net Weight Bales)
Acres Acres Pounds Bales
2006 2007 2006 2007 2006 2007 2006 2007
DISTRICT 30 12,900 7,800 11,900 6,900 807 1,242 20,000 17,850
Curry1/ 6,300 2,500 6,100 2,500 866 1,507 11,000 7,850
Roosevelt 6,600 --- 5,800 --- 745 --- 9,000 ---
Other Counties --- 5,300 --- 4,400 --- 1,091 --- 10,000
DISTRICT 70 3,300 2,900 3,300 2,400 1,625 1,600 8,700 8,000
DISTRICT 90 33,800 32,300 32,800 29,700 941 1,021 64,300 63,150
Chaves 2,000 1,500 2,000 1,400 912 960 3,800 2,800
Doña Ana2/ 6,500 7,500 6,500 7,000 1,108 1,183 15,000 17,250
Eddy 4,300 4,300 4,300 4,300 993 949 8,900 8,500
Lea 21,000 19,000 20,000 17,000 878 977 36,600 34,600
STATE 50,000 43,000 48,000 39,000 930 1,095 93,000 89,000 1/Quay County is included in Curry County.
2/Sierra County is included in Doña Ana County.

53 2007 New Mexico Agricultural Statistics
Cotton Harvested Acreage 1980-2007
0
20
40
60
80
100
120
140
1980 1985 1990 1995 2000 2003 2004 2005 2006 2007
Acr
es (
Tho
usan
ds)
Pima Upland
Cottonseed: Production, Farm Disposition, Price, and Value
Farm Disposition
Crop Year Production Sold to Oil Mills Other1/
Season Average Price Per Ton
Value of Production
--------------------------1,000 Tons---------------------- Dollars 1,000 Dollars
1980 45.0 40.0 5.0 124 5,580
1985 31.3 20.0 11.3 61 1,909
1990 48.0 13.0 35.0 143 6,864
1995 33.4 3.1 30.3 137 4,576
2000 39.7 6.3 33.4 120 4,764
2003 31.6 3.8 27.8 145 4,582
2004 52.5 11.7 40.8 118 6,195
2005 45.0 --- 45.0 108 4,860
20062/ 40.0 --- 40.0 173 6,920
20073/ 33.5 --- 33.5 183 7,686 1/Includes planting seed, exports, inter-farm sales, shrinkage, losses, and other uses. 2/Revised. 3/Value of production is preliminary.

54 2007 New Mexico Agricultural Statistics
American-Pima Cotton: Acreage, Production, Price, and Value
Acreage Crop Year Planted Harvested
Yield Per Acre
Production (480-Pound Net Weight Bales) Price Per Pound
Value of Production
1,000 Acres 1,000 Acres Net Pounds 1,000 Bales Cents 1,000 Dollars
1980 7.1 7.0 464 6.8 105.00 3,427
1985 8.0 7.9 687 11.3 98.80 5,359
1990 19.3 19.3 609 24.5 117.00 3,759
1995 15.0 15.0 605 18.9 118.00 10,705
2000 4.2 4.1 539 4.6 93.80 2,071
2003 6.1 6.0 1,056 13.2 110.00 6,970
2004 10.6 10.5 869 19.0 83.00 7,570
2005 11.5 11.5 918 22.0 110.00 11,616
20061/ 13.0 12.5 768 20.0 86.60 8,314
2007 4.7 4.6 856 8.2 96.00 3,779 1/Revised.
American-Pima Cotton:
Acreage, Yield, and Production by County
Acreage
District/County Planted Harvested Yield
Per Acre
Production (480-Pound Net Weight Bales)
Acres Acres Pounds Bales
2006 2007 2006 2007 2006 2007 2006 2007
DISTRICT 70 600 150 600 120 1,120 1,400 1,400 350
DISTRICT 90 12,400 4,550 11,900 4,480 750 841 18,600 7,850 Doña Ana 11,150 3,900 10,650 3,900 739 837 16,400 6,800
Other Counties 1,250 650 1,250 580 845 869 2,200 1,050
STATE 13,000 4,700 12,500 4,600 768 856 20,000 8,200

55 2007 New Mexico Agricultural Statistics
Potatoes: Acreage, Yield, Production, Price, and Value
Acreage
Crop Year
Planted
Harvested
Yield
Per Acre
Production
Price
Per Cwt.
Value of
Production1/
1,000 Acres
1,000 Acres
Cwt.
1,000 Cwt.
Dollars
1,000 Dollars
1980
3.5
3.0
180
540
6.85
3,699
1985 10.5 10.4 275 2,860
4.70
13,442
1990 12.0 10.0 340 3,400
8.30
28,220
1995 10.5 10.5 356 3,738
7.00
25,996
2000 10.1 9.8 385 3,770 3.70 13,826
2003 5.9 5.9 361 2,132
4.80
10,260
2004 5.2 5.0 412 2,060
5.30
10,895
2005 4.7 4.2 420 1,764
6.80
11,995
2006 5.0 5.0 420 2,100 6.50 13,650
2007 5.5 5.4 370 1,998 7.00 13,986 1/ Sum of seasonal groups (summer and fall) value of production.
Dry Beans: Acreage, Yield, Production, Price, and Value
Acreage
Crop Year
Planted
Harvested
Yield
Per Acre
Production
Price
Per Cwt.
Value of
Production
1,000 Acres
1,000 Acres
Lbs.
1,000 Cwt.
Dollars
1,000 Dollars
1990 14.5 14.0 1,650 231
22.50
5,198
1995 12.5 12.5 2,010 251
25.00
6,275
2000 6.0 6.0 1,800 108
19.00
2,052
2003 10.0 10.0 1,860 186
16.00
2,976
2004 6.0 6.0 2,600 156
28.00
4,368
2005 6.3 6.3 2,200 139
32.00
4,448
2006 8.2 8.2 2,400 197 26.00 5,122
2007 7.5 7.5 2,400 180 39.00 7,020

56 2007 New Mexico Agricultural Statistics
Peanuts: Acreage, Yield, Production, Price, and Value1/
Acreage
Crop Year Planted Harvested
Yield Per Acre Production
Price Per Pound
Value of Production
Acres Pounds 1,000 Pounds Cents 1,000 Dollars
1980 8,900 8,800 2,540 22,352 28.0 6,259
1985 12,400 12,400 2,580 31,992 29.3 9,374
1990 20,000 20,000 2,500 50,000 31.7 15,850
1995 20,000 20,000 2,150 43,000 33.6 14,448
2000 27,300 26,000 2,115 54,990 32.0 17,597
2003 18,000 17,000 2,700 45,900 23.0 10,557
2004 17,000 17,000 3,500 59,500 24.0 14,280
2005 19,000 19,000 3,500 66,500 20.0 13,300
20062/ 12,000 12,000 3,600 43,200 18.5 7,992
20073/ 10,000 10,000 3,500 35,000 20.1 7,035 1/ Estimates comprised of quota and nonquota peanuts. 2/ Revised. 3/ Preliminary Value of Production.
Peanuts: Acreage, Yield, and Production by County
Acreage
District/County Planted Harvested Yield
Per Acre Production ----------------------Acres----------------------- ------Pounds------ ---1,000 Pounds----
2006 2007 2006 2007 2006 2007 2006 2007
DISTRICT 30 8,000 5,700 8,000 5,700 2,875 2,630 23,000 15,000
Roosevelt 8,000 5,700 8,000 5,700 2,875 2,630 23,000 15,000
DISTRICT 90 4,000 4,300 4,000 4,300 5,050 4,650 20,200 20,000
Lea 4,000 4,300 4,000 4,300 5,050 4,650 20,200 20,000
STATE 12,000 10,000 12,000 10,000 3,600 3,500 43,200 35,000

2007 New Mexico Agricultural Statistics 57
Vegetables and Nuts
2007 Chile: Acreage and Production by District & County
Planted Acreage Harvested Acreage Production (Tons)
District/ County 2005 2006 2007 2005 2006 2007 2005 2006 2007
Districts 10 & 30 550 400 300 400 400 300 800 1,200 400
District 70 9,050 7,800 5,600 8,700 7,000 5,200 63,470 42,520 31,700
Hidalgo 3,300 2,200 700 3,200 1,900 600 9,570 6,450 2,850
Luna 4,900 4,600 4,000 4,700 4,200 3,700 47,190 32,300 25,150
Other Counties 850 1,000 900 800 900 900 6,710 3,770 3,700
District 90 7,900 7,100 6,100 7,100 6,400 5,500 24,490 29,680 16,900
Chaves 1,300 1,200 900 1,300 1,100 700 4,070 2,750 2,200
Doña Ana 4,000 3,400 3,400 3,500 3,000 3,200 16,720 22,100 12,800
Other Counties 2,600 2,500 1,800 2,300 2,300 1,600 3,700 4,830 1,900
STATE 17,500 15,300 12,000 16,200 13,800 11,000 88,760 73,400 49,000
Green Chile Production 2007Wet Weight
Lo ng M i ld , 79 %
Lo ng Ho t , 13 %
Jalap eño , 8 %
Red Chile Production 2007Wet Weight
Long Mild, 18%
Long Hot, 10%
Paprika, 49%
Cayenne, 23%
1/ A 5:1 drying ratio was used to convert cayenne production to a dry weight.
CHILE: New Mexico chile production declined for the third year in a row to 49,000 tons, 33 percent below 2006. The decline was primarily due to a large drop in planted and harvested acreage. Overall state yields were down from a year earlier with jalapeño averaging 9.0 tons per acre. Long mild averaged 10.8 tons per acre, and cayenne averaged 7.0 tons per acre. The value of New Mexico chile was estimated at $28.68 million, 28 percent below the previous year.

58 2007 New Mexico Agricultural Statistics
Chile Acreage, Yield, Production, and Value by Variety
2007 Variety
Acreage Harvested1/
Yield Per Acre Production
Average Price Per Ton
Value of Production
Green -------------Tons------------- -----Dollars----- -----$1,000-----
Jalapeño 300 9.0 2,700 315 850
Long Mild2/ 2,700 10.8 29,100 315 9,180
Long Hot 600 8.2 4,900 408 2,000
Red
Paprika 4,800 1.3 6,000 1,528 9,170
Cayenne3/ 400 7.0 2,800 407 1,140
Long Mild 1,800 1.3 2,250 1,707 3,840
Long Hot 1,100 1.1 1,250 2,000 2,500
Total
11,000 4.5 49,000 585
28,680 1/ 800 acres were harvested for both green and red, but only counted once in the total. 2/ Includes a small amount of other peppers; not published separately to avoid disclosure of individual operations. 3/ Production and yield are wet tonnage.
Chile: Yields by District and County by Variety
2007 ----Green---- ----Red----
District/County JalapeZo Long Mild Long Hot Paprika Cayenne1/ Long Mild Long Hot
----------------- Tons --------------- ---------------------- Tons ----------------------
District 70 2/ 11.4 9.0 1.1 --- 1.1 1.1
Hidalgo 2/ 2/ --- --- --- 1.3 2/
Luna 2/ 11.5 9.0 1.1 --- 1.0 2/
Other Counties --- 9.6 --- 2/ --- 1.0 2/
District 90 2/ 8.0 8.0 1.3 7.0 1.4 1.1
Chaves 2/ --- --- 1.2 2/ --- --
DoZa Ana 2/ 8.0 8.0 1.6 2/ 1.4 1.1
Other Counties --- 2/ --- 1.2 --- --- ---
STATE 9.0 10.8 8.2 1.3 7.0 1.3 1.1 1/ Dry tonnage except cayenne, which is a wet tonnage. 2/ Not published to avoid disclosing individual information.

2007 New Mexico Agricultural Statistics 59
Onion Harvested AcreageNew Mexico, 1980-2007
0
1,000
2,000
3,000
4,000
5,000
6,000
7,000
8,000
9,000
10,000
1980 1985 1990 1995 2000 2003 2004 2005 2006 2007
Acr
es
Onions: Monthly Prices Received Year June July August September -----------------------------------Dollars Per 100 Lbs.----------------------------------
1980 9.00 9.00 9.80 ---
1985 9.60 21.50 9.80 7.50
1990 10.40 9.55 9.00 8.50
1995 11.70 14.80 11.40 ---
2000 11.30 7.80 11.90 ---
2003 16.80 12.60 10.20 ---
2004 13.60 12.00 12.10 ---
2005 12.70 17.80 18.10 ---
2006 13.10 20.50 20.30 ---
2007 24.90 22.00 13.30 ---
ONIONS: Onion growers in New Mexico planted 6,300 acres and harvested 6,100 acres in 2007. The average yield was up from 480 hundredweight (cwt) per acre in 2006 to 500 cwt in 2007. Price per cwt increased by $3.40 to $20.80, bringing the value of production to $63.4 million. The major varieties of commercially grown New Mexico onions include Grano, Granex, Sweet Spanish, and mid-summer hybrids such as the popular Nu-Mex variety. Most of the state’s onions are nonstorage types. During our peak summer harvest period, New Mexico is a major supplier for the nation. Harvest usually begins mid-May and continues through September.

60 2007 New Mexico Agricultural Statistics
Onions: Acreage, Yield, Production, and Value
Acreage Crop Year
Planted
Harvested
Yield
Per Acre
Production
Price
Per Cwt.
Value of
Production
Acres
Acres
Cwt.
1,000 Cwt.
Dollars
1,000 Dollars
1980
4,000
3,900
290
1,131
9.20
10,405
1985
4,700
4,500
325
1,463
12.90
18,873
1990
8,800
8,400
350
2,940
9.71
28,547
1995
9,100
9,100
450
4,095
12.90
52,826
2000
8,000
7,700
460
3,542
9.25
32,764
2003
7,700
7,700
550
4,312
13.60 58,643
2004
7,300
7,100
515
3,657
12.60 46,078
2005 6,500 6,400 530 3,392 15.80 53,594
2006 6,000 5,500 480 2,640 17.40 45,936
2007 6,300 6,100 500 3,050 20.80 63,440
Onions: Acreage, Yield, and Production by County
Acreage District/County
Planted Harvested
Yield
Per Acre
Production
---------------------Acres--------------------
--------Cwt.--------
----1,000 Cwt.----
2006 2007 2006 2007 2006 2007 2006 2007 DISTRICT 90 3,800 3,900 3,600 3,800 500 520 1,800 1,976 Doña Ana 3,800 3,900 3,600 3,800 500 520 1,800 1,976 OTHER DISTRICTS 2,200 2,400 1,900 2,300 495 467 940 1,074 STATE 6,000 6,300 5,500 6,100 480 500 2,640 3,050

2007 New Mexico Agricultural Statistics 61
0
10
20
30
40
50
60
70
80
Po
un
ds
(M
illio
n)
85 90 95 00 02 03 04 05 06 07
Year
Pecan ProductionNew Mexico Total In-Shell 1985-2007
Pecans: Production, Price, and Value
Crop Year Production (in shell)
Price Per Pound
Value of Production
1,000 Pounds Dollars 1,000
Dollars
1985 29,000 .88 25,520
1990 34,000 1.53 52,020
1995 45,000 1.24 55,800
2000 35,000 1.37 47,950
2002 36,000 1.25 45,000
2003 55,000 1.28 70,400
2004 39,000 2.28 88,920
2005 65,000 1.70 110,500
20061/ 47,000 1.85 86,950
2007 74,000 1.30 96,200 1/ Revised.
Pecans: Orchards, Acres, and Production by County
2002 Census1/ Production
District/County Bearing Acres Number
of Farms 2005 2006 2007
-----------Number-----------------
-------------------1,000 Pounds -----------------
DISTRICT 70 2/ 65 2,650 1,985 2,705
Luna 2/ 22 2,000 1,500 2,000
Sierra 514 43 650 485 675
DISTRICT 90 2/ 1,425 62,200 43,895 71,185
Chaves 3,414 81 4,800 4,000 5,000
Doña Ana 23,745 1,056 48,000 32,850 50,000
Eddy 2,415 119 6,300 4,720 13,000
Lea 2/ 35 800 600 800
Otero 2/ 134 2,300 1,725 2,370
OTHER DISTRICTS3/ 2/ 46 150 120 110 STATE 33,123 1,536 65,000 46,000 74,000
1/ Orchards of 20 or more trees. 2/ Withheld to avoid disclosing data for individual farms. 3/ Includes Bernalillo, Grant, Hidalgo, Lincoln, and Quay counties.
PECANS: Total pecan production in New Mexico totaled 74 million pounds in 2007, a high-bearing year in the alternate bearing cycle. This ranked New Mexico second in the nation behind Georgia in production. Production for 2007 was a record high, 57 percent above 2006 and 14 percent higher than 2005, the previous high-bearing year. Farmers received $1.30 per pound on average for their pecans. Value of production totaled $96.2 million compared to $87 million for 2006 and $110.5 million for 2005.
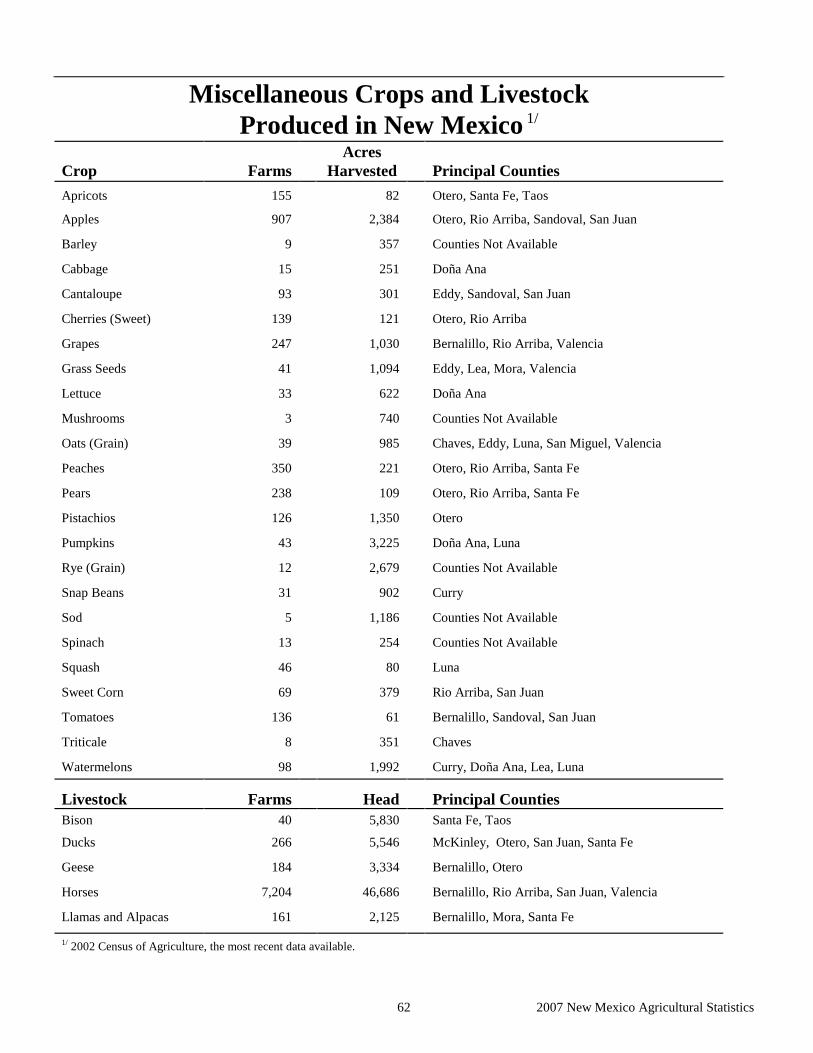
2007 New Mexico Agricultural Statistics 62
Miscellaneous Crops and Livestock Produced in New Mexico
1/
Crop Farms
Acres Harvested Principal Counties
Apricots 155 82 Otero, Santa Fe, Taos
Apples 907 2,384 Otero, Rio Arriba, Sandoval, San Juan
Barley 9 357 Counties Not Available
Cabbage 15 251 Doña Ana
Cantaloupe 93 301 Eddy, Sandoval, San Juan
Cherries (Sweet) 139 121 Otero, Rio Arriba
Grapes 247 1,030 Bernalillo, Rio Arriba, Valencia
Grass Seeds 41 1,094 Eddy, Lea, Mora, Valencia
Lettuce 33 622 Doña Ana
Mushrooms 3 740 Counties Not Available
Oats (Grain) 39 985 Chaves, Eddy, Luna, San Miguel, Valencia
Peaches 350 221 Otero, Rio Arriba, Santa Fe
Pears 238 109 Otero, Rio Arriba, Santa Fe
Pistachios 126 1,350 Otero
Pumpkins 43 3,225 Doña Ana, Luna
Rye (Grain) 12 2,679 Counties Not Available
Snap Beans 31 902 Curry
Sod 5 1,186 Counties Not Available
Spinach 13 254 Counties Not Available
Squash 46 80 Luna
Sweet Corn 69 379 Rio Arriba, San Juan
Tomatoes 136 61 Bernalillo, Sandoval, San Juan
Triticale 8 351 Chaves
Watermelons 98 1,992 Curry, Doña Ana, Lea, Luna Livestock
Farms
Head
Principal Counties
Bison 40 5,830 Santa Fe, Taos
Ducks 266 5,546 McKinley, Otero, San Juan, Santa Fe
Geese 184 3,334 Bernalillo, Otero
Horses 7,204 46,686 Bernalillo, Rio Arriba, San Juan, Valencia
Llamas and Alpacas 161 2,125 Bernalillo, Mora, Santa Fe
1/ 2002 Census of Agriculture, the most recent data available.

County Profiles
63 2007 New Mexico Agricultural Statistics
Bernalillo County Crops 2007 Acres Harv.
Yield Production Unit Rank
Hay, All 3,900 4.38
17,100 Tons 22
Hay, Alfalfa 2,500 5.00 12,500 Tons 21
Livestock - Jan 1, 2008 No. of Head Rank
Sheep & Lambs 500 18
Census 2002 Cash Receipts 2007 1,000 Dollars Rank
Number of Farms 618 Crops 7,959 15
Land in Farms (Acres) Not Published Livestock 20,812 15
Catron County Crops 2007 Acres Harv.
Yield Production Unit Rank
Hay, All 850 2.35 2,000 Tons 31
Hay, Alfalfa 750 2.40 1,800 Tons 31
Livestock - Jan 1, 2008 No. of Head Rank
Cattle & Calves
25,000 17
Cash Receipts 2007 1,000 Dollars Rank
Crops 302 31
Census 2002 Livestock 13,974 23
Number of Farms 206
Land in Farms (Acres) 1,644,937
Chaves County Crops 2007 Acres Harv.
Yield Production Unit Rank
Chile 700 -- 2,200 Tons 5
Corn, Silage 17,600 28.4 500,000 Tons 2 Cotton, Upland Upland Up
1,400 960 2,800 Bales 7
Hay, All 41,300 6.56 271,000 Tons 1
Hay, Alfalfa 36,000 6.97 251,000 Tons 1
Pecans -- -- 5,000,000 Lbs. 3
Census 2002
Number of Farms 604 Livestock - Jan 1, 2008 No. of Head Rank
Land in Farms 2,515,660 Cattle & Calves
184,000 2
Census 2002 U.S. Rank Rank
Milk Cows 90,000 1
Chile 8 Sheep & Lambs
17,000 2
Milk Cows 12 Cash Receipts 2007 1,000 Dollars Rank
Pecans 27 Crops 62,386 2
Cattle & Calves 40 Livestock 458,571 1

County Profiles
2007 New Mexico Agricultural Statistics 64
Cibola County Crops 2007 Acres Harv.
Yield Production Unit Rank
Hay, All 1,450 2.69
3,900 Tons 30
Hay, Alfalfa 1,200 2.67 3,200 Tons 29
Livestock - Jan 1, 2008 No. of Head Rank
Cattle & Calves 14,000 25
Sheep & Lambs 5,000 8
Census 2002 Cash Receipts 2007 1,000 Dollars Rank
Number of Farms 155 Crops 523 30
Land in Farm 1,690,832 Livestock 8,482 29
Colfax County Crops 2007 Acres Harv.
Yield Production Unit Rank
Hay, All 9,500 2.47
28,000 Tons 16
Hay, Alfalfa 11,500 2.43 23,500 Ttons
Tons 16
Livestock - Jan 1, 2008 No. of Head Rank
Cattle & Calves 38,000 10
Census 2002 Cash Receipts 2007 1,000 Dollars Rank
Number of Farms 284 Crops 3,531 21
Land in Farms 2,216,306 Livestock 21,120 14
Curry County Crops 2007 Acres Harv.
Yield Production Unit Rank
Corn, Grain 7,500 170.7 1,280,000 Bu. 2
Corn, Silage 18,100 27.8 504,000 Tons 1
Cotton, Upland 2,500 1507 7,850 Bales 6
Hay, All 25,600 2.34 60,000 Tons 8
Hay, Alfalfa 8,600 5.00 43,000 Tons 8
Sorghum 27,000 37.4 1,010,000 Bu. 2
Census 2002 Wheat 124,000 24.1 2,985,000 Bu. 1
Number of Farms 677
Land in Farms 916,320 Livestock - Jan 1, 2008 No. of Head Rank
Avg. Size of Farm 1,354 Cattle & Calves
221,000 1
Avg. Net Farm Income 66,587 Milk Cows 68,000 2
Census 2002 U.S. Rank Cash Receipts 2007 1,000 Dollars Rank
Milk Cows 22 Crops 60,472 3
Cattle & Calves 36 Livestock 441,773 2

County Profiles
2007 New Mexico Agricultural Statistics 65
De Baca County Crops 2007 Acres Harv.
Yield Production Unit Rank
Hay, All 8,500 4.59
39,000 Tons 11
Hay, Alfalfa 7,500 4.93 37,000 Tons 11
Livestock - Jan 1, 2008 No. of Head Rank
Cattle & Calves 29,000 13
Census 2002 Cash Receipts 2007 1,000 Dollars Rank
Number of Farms 188 Crops 6,074 18
Land in Farms 1,409,434 Livestock 16,295 19
Doña Ana County Crops 2007 Acres Harv.
Yield Production Unit Rank
Chile 3,200 — 12,800 Tons 2
Hay, All 26,000 7.31 190,000 Tons 3
Hay, Alfalfa 23,500 7.74 182,000 Tons 3
Corn Silage 9,300 22.9 213,000 Tons 4
Cotton, Upland 7,000 1,183 17,250 Bales 2
Cotton, Pima 3,900 837 6,800 Bales 1
Census 2002 Onions 3,800 520 1,976,000 Cwt. 1
Number of Farms 1,691 Pecans — — 50,000,000 Lbs. 1
Land in Farms 580,769 Livestock - Jan 1, 2008 No. of Head Rank
Census 2002 U.S. Rank ValueRan
Cattle & Calves 91,000 5
Pecans 1 Milk Cows 51,000 4
Chile 2 Sheep & Lambs 800 15
Cotton, Pima 5 Cash Receipts 2007 1,000 Dollars Rank
Onions 11 Crops 196,178 1
Milk Cows 30 Livestock 270,394 4

County Profiles
2007 New Mexico Agricultural Statistics 66
Eddy County Crops 2007 Acres Harv.
Yield Production Unit Rank
Cotton, Upland 4,300 949 8,500 Bales 4
Hay, All 41,700 5.54
231,000 Tons 2
Hay, Alfalfa 29,500 6.00
213,000 Tons 2
Pecans — — 13,000,000 Lbs. 2
Livestock - Jan 1, 2008 No. of Head Rank
Cattle & Calves 55,000 8
Census 2002 Milk Cows 19,000 6
Number of Farms 510 Sheep & Lambs 2,300 11
Land in Farms 1,183,073 Cash Receipts 2007 1,000 Dollars Rank
Avg. Size of Farm 2,320 Crops 52,927 5
Avg. Net Farm Income 14,083 Livestock 95,598 7
Grant County Crops 2007 Acres Harv.
Yield Production Unit Rank
Hay, All 700 2.29
1,600 Tons 32
Hay, Alfalfa 500 2.40 1,200 Tons 32
Livestock - Jan 1, 2008 No. of Head Rank
Cattle & Calves 29,000 13
Census 2002 Cash Receipts 2007 1,000 Dollars Rank
Number of Farms 272 Crops 256 32
Land in Farms 1,218,119 Livestock 16,254 20
Guadalupe County Crops 2007 Acres Yield Production Unit Rank
Hay, All 1,700 3.12 5,300 Tons 27
Hay, Alfalfa 1,300 3.23 4,200 Tons 27
Livestock - Jan 1, 2008 No. of Head Rank
Cattle & Calves 26,000 16
Sheep & Lambs 3,600 9
Census 2002 Cash Receipts 2007 1,000 Dollars Rank
Number of Farms 208 Crops 728 26
Land in Farms 1,461,766 Livestock 14,685 21

County Profiles
2007 New Mexico Agricultural Statistics 67
Harding County Crops 2007 Acres Harv.
Yield Production Unit Rank
Hay, All 1,950 2.77 5,400 Tons 26
Hay, Alfalfa 1,600 2.75 4,400 Tons 26
Livestock - Jan 1, 2008 No. of Head Rank
Cattle & Calves 21,000 20
Census 2002 Cash Receipts 2007 1,000 Dollars Rank
Number of Farms 129 Crops 720 27
Land in Farms 991,940 Livestock 11,676 26
Hidalgo County Crops 2007 Acres Harv.
Yield Production Unit Rank
Chile 600 — 2,850 Tons 4
Hay, All 3,000 4.33 13,00 Tons 23
Hay, Alfalfa 2,100 5.00 10,500 Tons 22
Livestock - Jan 1, 2008 No. of Head Rank
Cattle & Calves 25,000 17
Census 2002 Cash Receipts 2007 1,000 Dollars Rank
Number of Farms 144 Crops 10,309 12
Land in Farms 1,127,578580,769
Livestock 13,888 24
Lea County Crops 2007 Acres Harv.
Yield Production Unit Rank
Cotton, Upland 17,000 977 34,600 Bales 1
Hay, All 14,000 4.57 64,000 Tons 7
Hay, Alfalfa 8,600 6.05 52,000 Tons 7
Peanuts 4,300 4,650 20,000,000 Lbs. 1
Pecans — — 800,000 Lbs. 6
Census 2002 Livestock - Jan 1, 2008 No. of Head Rank
Number of Farms 554 Cattle & Calves
85,000 6
Land in Farms 2,258,353 Milk Cows 27,000 5
Avg. Size of Farm 4,076 Sheep & Lambs
2,400 10
Avg. Net Income 12,130 Cash Receipts 2007 1,000 Dollars Rank
Census 2002 U.S. Rank ValueRank
Crops 33,294 8
Chile 7 Livestock 149,244 5

County Profiles
2007 New Mexico Agricultural Statistics 68
Lincoln County Crops 2007 Acres Harv.
Yield Production Unit Rank
Hay, All 1100 3.82
4,200 Tons 28
Hay, Alfalfa 600 4.50 2,700 Tons 31
Livestock - Jan 1, 2008 No. of Head Rank
Cattle & Calves 30,000 12
Sheep & Lambs 13,200 4
Census 2002 Cash Receipts 2007 1,000 Dollars Rank
Number of Farms 343 Crops 558 29
Land in Farms 1,605,566 Livestock 17,593 18
Luna County Crops 2007 Acres Harv.
Yield Production Unit Rank
Chile 3,700 --- 25,150 Tons 1
Cotton, Upland 2,400 1,600 8,000 Bales 5
Hay, All 4,200 6.93 29,100 Tons 15
Hay, Alfalfa 3,600 7.50 27,000 Tons 14
Pecans — — 2,000,000 Lbs. 5
Sorghum 1,800 116.7 210,000 Bu. 3
Census 2002
Number of Farms 171
Land in Farms 709,518 Livestock - Jan 1, 2008 No. of Head Rank
Avg. Size of Farm 4,149 Cattle & Calves
27,000 15
Avg. Net Farm Income 54,417
Census 2002 U.S. Rank ValueRank
Cash Receipts 2007 1,000 Dollars Rank
Chile 1 Crops 54,765 4
Onions 15 Livestock 17,764 17
McKinley County Crops 2007 Acres Harv.
Yield Production Unit Rank
Hay, All 2,000 2.05 4,100 Tons 29
Hay, Alfalfa 1,800 2.11 3,800 Tons 28
Livestock - Jan 1, 2008 No. of Head Rank
Cattle & Calves 17,000 23
Sheep & Lambs 42,000 1
Census 2002 Cash Receipts 2007 1,000 Dollars Rank
Number of Farms 150 Crops 586 28
Land in Farms 3,169,857 Livestock 13,996 22

County Profiles
2007 New Mexico Agricultural Statistics 69
Mora County Crops 2007 Acres Harv.
Yield Production Unit Rank
Hay, All 7,300 2.89
21,100 Tons 18
Hay, Alfalfa 6,000 3.00 18,000 Tons 17
Livestock - Jan 1, 2008 No. of Head Rank
Cattle & Calves 20,000 21
Sheep & Lambs 500 17
Census 2002 Cash Receipts 2007 1,000 Dollars Rank
Number of Farms 410 Crops 2,664 23
Land in Farms 954,572 Livestock 11,294 27
Otero County Crops 2007 Acres Yield Production Unit Rank
Hay, All 4,800 4.54 21,800 Tons 17
Hay, Alfalfa 2,700 5.30 14,300 Tons 20
Pecans — — 2,370,000 Lbs. 4
Livestock - Jan 1, 2008 No. of Head Rank
Cattle & Calves 15,000 24
Sheep & Lambs 5,500 6
Census 2002 Cash Receipts 2007 1,000 Dollars Rank
Number of Farms 622 Crops 9,874 13
Land in Farms 1,207,598 Livestock 9,506 28
Quay County Crops 2007 Acres Harv.
Yield Production Unit Rank
Hay, All 19,000 4.04 76,800 Tons 6
Hay, Alfalfa 13,000 4.60 59,800 Tons 6
Sorghum 6,400 32.3 207,000 Bu. 4
Wheat 58,000 16.5 957,000 Bu. 4
Livestock - Jan 1, 2008 No. of Head Rank
Cattle & Calves 57,000 7
Census 2002 Sheep & Lambs 1,100 13
Number of Farms 594 Cash Receipts 2007 1,000 Dollars Rank
Land in Farms 1,651,616 Crops 15,284 11
Livestock 31,803 11

County Profiles
2007 New Mexico Agricultural Statistics 70
Rio Arriba County Crops 2007 Acres Harv.
Yield Production Unit Rank
Hay, All 15,500 2.06 31,900 Tons 13
Hay, Alfalfa 13,300 1.80 23,900 Tons 15
Livestock - Jan 1, 2008 No. of Head Rank
Cattle & Calves 20,000 21
Sheep & Lambs 5,000 7
Census 2002 Cash Receipts 2007 1,000 Dollars Rank
Number of Farms 988 Crops 4,990 20
Land in Farms 1,431,119 Livestock 12,358 25
Roosevelt County Crops 2007 Acres Harv.
Yield Production Unit Rank
Corn, Grain 5,600 175.0 980,000 Bu. 3
Corn, Silage 10,800 22.4 242,000 Tons 3
Hay, All 31,000 3.47 107,500 Tons 4
Hay, Alfalfa 13,000 5.69 74,000 Tons 5
Peanuts 5,700 2,630 15,000,000 Lbs. 2
Sorghum 37,000 37.2 1,378,000 Bu. 1
Census 2002 Wheat 82,000 18.7 1,532,000 Bu. 2
Number of Farms 804 Livestock - Jan 1, 2008 No. of Head Rank
Land in Farms 1,500,821 Cattle & Calves
133,000 4
Avg. Size of Farm 1,867 Milk Cows 64,000 3
Avg. Net Farm Income 51,731 Sheep & Lambs
400 19
Census 2002 U.S. Rank ValueRan
Cash Receipts 2007 1,000 Dollars Rank
Milk Cows 21 Crops 52,106 6
Cattle & Calves 58 Livestock 330,179 3
Sandoval County Crops 2007 Acres Harv.
Yield Production Unit Rank
Hay, All 3,450 2.87 9,900 Tons 24
Hay, Alfalfa 3,000 3.00 9,000 Tons 23
Livestock - Jan 1, 2008 No. of Head Rank
Cattle & Calves 8,000 27
Census 2002 Cash Receipts 2007 1,000 Dollars Rank
Number of Farms 347 Crops 2,742 22
Land in Farms 763,197 Livestock 4,833 31

County Profiles
2007 New Mexico Agricultural Statistics 71
San Juan County Crops 2007 Acres Harv.
Yield Production Unit Rank
Hay, All 22,200 4.20 93,300 Tons 5
Hay, Alfalfa 20,000 4.42 88,300 Tons 4
Livestock - Jan 1, 2008 No. of Head Rank
Cattle & Calves 22,000 19
Sheep & Lambs 13,600 3
Census 2002 Cash Receipts 2007 1,000 Dollars Rank
Number of Farms Crops
Crops 50,732 7
Land in Farms Livestock Livestock 22,730 13
San Miguel County Crops 2007 Acres Harv.
Yield Production Unit Rank
Hay, All 4,000 2.42 9,700 Tons 25
Hay, Alfalfa 2,250 3.38 7,600 Tons 25
Livestock - Jan 1, 2008 No. of Head Rank
Cattle & Calves 35,000 11
Census 2002 Cash Receipts 2007 1,000 Dollars Rank
Number of Farms 565 Crops 1,303 25
Land in Farms 2,091,643 Livestock 19,902 16
Santa Fe County Crops 2007 Acres Harv.
Yield Production Unit Rank
Hay, All 7,900 3.80 30,000 Tons 14
Hay, Alfalfa 7,300 3.84 28,000 Tons 13
Livestock - Jan 1, 2008 No. of Head Rank
Cattle & Calves 9,000 26
Census 2002 Cash Receipts 2007 1,000 Dollars Rank
Number of Farms 460 Crops 7,623 16
Land in Farms 683,508 Livestock 5,493 30

County Profiles
2007 New Mexico Agricultural Statistics 72
Sierra County Crops 2007 Acres Harv.
Yield Production Unit Rank
Hay, All 3,000 6.17 18,500 Tons 20
Hay, Alfalfa 2,500 7.00 17,500 Tons 19
Pecans — — 675,000 Lbs. 7
Census 2002 Cash Receipts 2007 1,000 Dollars Rank
Number of Farms 223 Crops 8,793 14
Land in Farms 1,362,866 Livestock 32,346 10
Socorro County Crops 2007 Acres Harv.
Yield Production Unit Rank
Hay, All 7,900 4.56 36,000 Tons 12
Hay, Alfalfa 6,400 4.69 30,000 Tons 12
Livestock - Jan 1, 2008 No. of Head Rank
Sheep & Lambs 800 14
Census 2002 Cash Receipts 2007 1,000 Dollars Rank
Number of Farms 388 Crops 5,464 19
Land in Farms 1,523,280 Livestock 62,165 8
Taos County Crops 2007 Acres Harv.
Yield Production Unit Rank
Hay, All 9,900 1.97 19,500 Tons 19
Hay, Alfalfa 9,000 2.00 18,000 Tons 18
Livestock - Jan 1, 2008 No. of Head Rank
Cattle & Calves 4,000 28
Sheep & Lambs 700 16
Census 2002 Cash Receipts 2007 1,000 Dollars Rank
Number of Farms 453 Crops 2,527 24
Land in Farms 466,254 Livestock 2,478 32

County Profiles
2007 New Mexico Agricultural Statistics 73
Torrance County Crops 2007 Acres Harv.
Yield Production Unit Rank
Hay, All 8,000 5.23 41,800 Tons 10
Hay, Alfalfa 7,100 5.68 40,300 Tons 10
Livestock - Jan 1, 2008 No. of Head Rank
Cattle & Calves 39,000 9
Sheep & Lambs 7,100 5
Census 2002 Cash Receipts 2007 1,000 Dollars Rank
Number of Farms 461 Crops 17,373 10
Land in Farms 1,696,831 Livestock 38,188 9
Union County Crops 2007 Acres Harv.
Yield Production Unit Rank
Corn, Grain 24,700 178.1 4,400,000 Bu. 1
Corn, Silage 1,000 24.0 24,000 Tons 9
Hay, All 7,200 2.40 17,500 Tons 21
Hay, Alfalfa 1,800 4.44 8,000 Tons 24
Wheat 21,000 53.4 1,122,000 Bu. 3
Census 2002 Livestock - Jan 1, 2008 No. of Head Rank
Number of Farms 419 Cattle & Calves 158,000 3
Land in Farms 2,243,404 Cash Receipts 2007 1,000 Dollars Rank
Census 2002 U.S. Rank ValueRan
Crops 19,574 9
Cattle & Calves 53 Livestock 146,147 6
Valencia County Crops 2007 Acres Harv.
Yield Production Unit Rank
Hay, All 9,300 4.95 46,000 Tons 9
Hay, Alfalfa 8,300 5.12 42,000 Tons 9
Livestock - Jan 1, 2008 No. of Head Rank
Sheep & Lambs 1,200 12
Census 2002 Cash Receipts 2007 1,000 Dollars Rank
Number of Farms 718 Crops 7,091 17
Land in Farms 368,864 Livestock 26,634 12