Embed Size (px)
Citation preview
Tackling Living Costs in the NWT
Dennis Bevington, MP Western Arctic
November 2013
i
www.dennisbevington.ca
A Message from Dennis Bevington, MP Western Arctic
The more equal everyone is the better off we all are. The evidence of this is well
documented in The Spirit Level: Why More Equal Societies Almost Always Do Better.1
With our history of sharing and working cooperatively in the NWT, we know that this
is true. We know that equality helps us all to be more secure, safer, healthier, and able
to fully participate in our families and communities. We also know that equality builds
resilience so we can cope with, and manage change – changes in our climate, our
environment, and our social and economic circumstances.
Throughout Canada including the NWT, our communities are becoming less equal. The
gap between ‘haves’ and ‘have nots’ is growing. Inequalities put us all at risk.
A main factor contributing to inequalities in the NWT is living costs. As Member of
Parliament for the Western Arctic, I am committed to addressing inequalities and
improving quality of life in ways that are sustainable and make sense for everyone.
With this report, I want to stimulate changes that will eliminate inequalities in our
communities, throughout the north, and between northern and southern Canada.
I have prepared this report to highlight cost of living issues in the Western Arctic but
these circumstances are generally mirrored throughout remote regions in Canada. As
such, I trust that both residents of the NWT and my colleagues in the House of
Commons will find this report both informative and useful.
This report is organized to:
Identify the inequalities created by income and cost of living,
Examine current responses to cost of living issues in the NWT, and
Propose actions to deal with cost of living issues.
The GNWT Bureau of Statistics was a main data source. Information produced by the
NWT No Place for Poverty Coalition2 was also referenced. This report also draws on
information from northerners who made time to voice their concerns and share their
research.
1Richard G. Wilkinson and Kate Pickett, published in 2009 by Allen
Lanehttp://canadiandimension.com/articles/3806/
2 About 30 social justice, municipal, women’s, church, union, environmental, and indigenous
organizations are part of the Coalition.
Cost of Living in the NWT
ii
www.dennisbevington.ca
Table of Contents Page
Income and Cost of Living 1
Personal Income 1
Family Income 3
Lone Parent Families 4
Families in Low Income 4
Government Transfers/ Income Assistance and Income Tax 5
Income Assistance 5
Income Tax and Disposable (After Tax) Income 6
Cost of Living 7
Shelter and Affordability 8
Food 10
Income and Cost of Living Inequalities 11
Current Responses to Cost of Living Issues in the NWT 12
What Can be Done to Deal with Cost of Living Issues in the NWT? 16
Other Things that Can be Done 19
Appendix A:
Income and Cost of Living
Cost of Living in the NWT
1
www.dennisbevington.ca
Income and Cost of Living
Personal Income
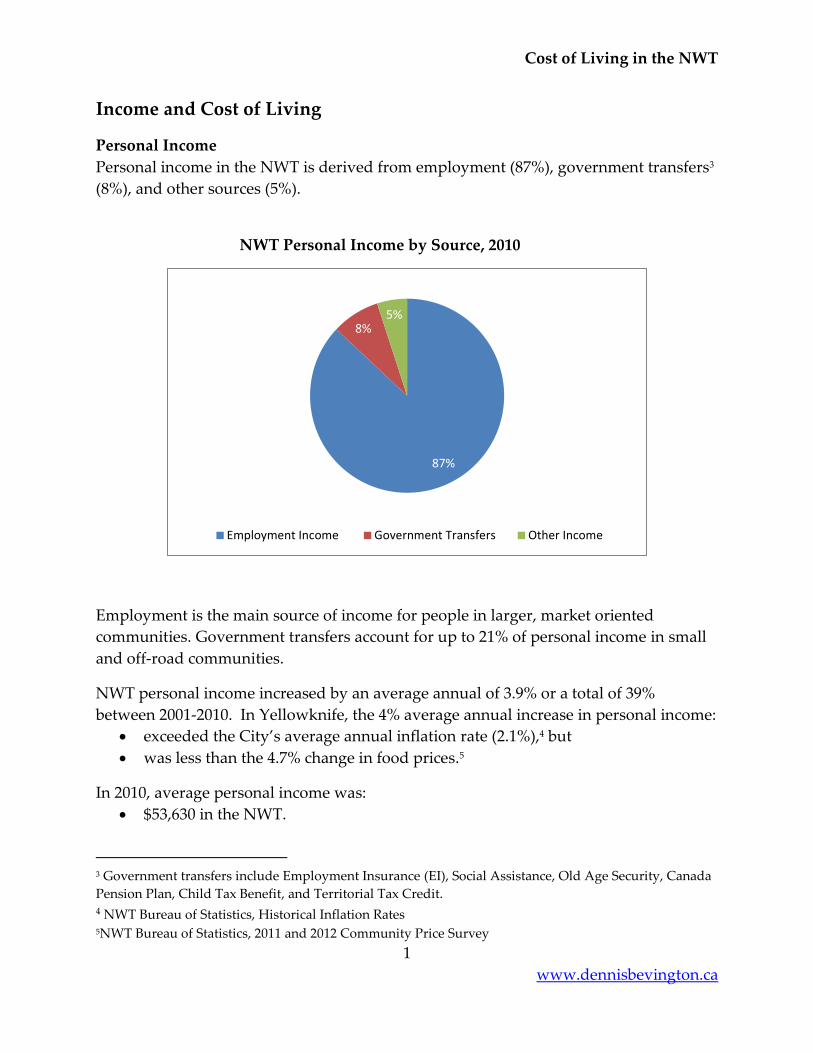
Personal income in the NWT is derived from employment (87%), government transfers3
(8%), and other sources (5%).
NWT Personal Income by Source, 2010
Employment is the main source of income for people in larger, market oriented
communities. Government transfers account for up to 21% of personal income in small
and off-road communities.
NWT personal income increased by an average annual of 3.9% or a total of 39%
between 2001-2010. In Yellowknife, the 4% average annual increase in personal income:
exceeded the City’s average annual inflation rate (2.1%),4 but
was less than the 4.7% change in food prices.5
In 2010, average personal income was:
$53,630 in the NWT.
3 Government transfers include Employment Insurance (EI), Social Assistance, Old Age Security, Canada
Pension Plan, Child Tax Benefit, and Territorial Tax Credit. 4 NWT Bureau of Statistics, Historical Inflation Rates 5NWT Bureau of Statistics, 2011 and 2012 Community Price Survey
87%
8% 5%
Employment Income Government Transfers Other Income
Cost of Living in the NWT
2
www.dennisbevington.ca
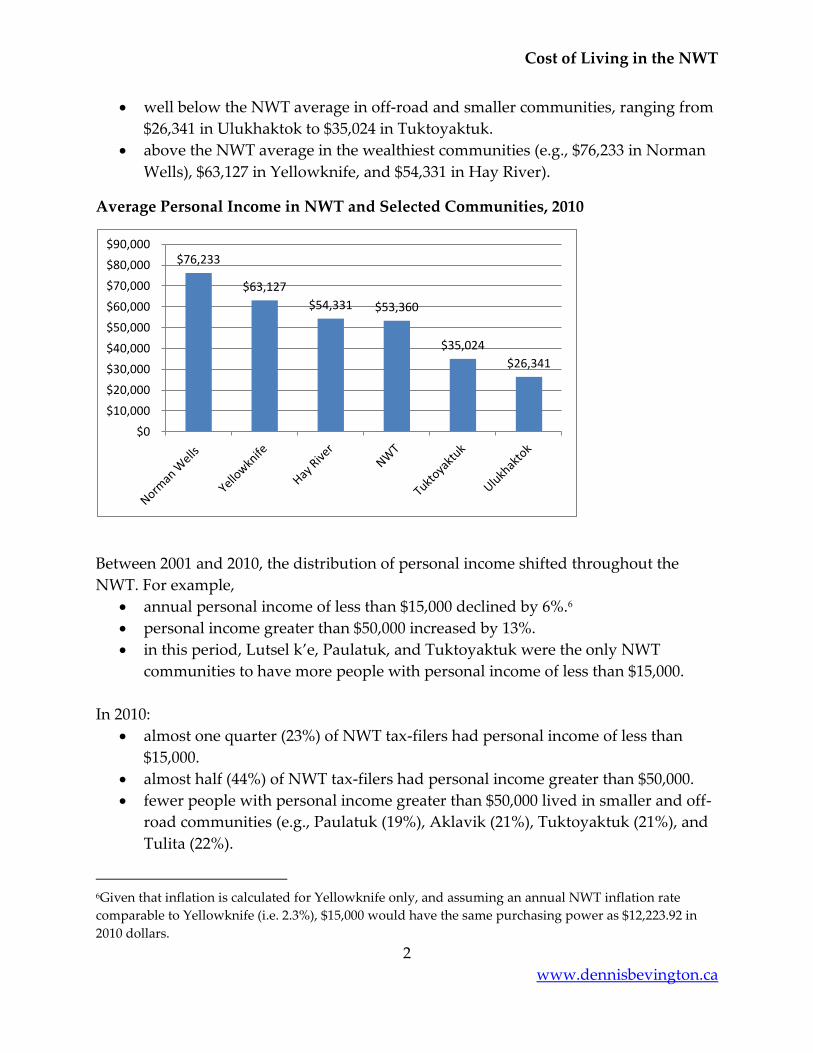
well below the NWT average in off-road and smaller communities, ranging from
$26,341 in Ulukhaktok to $35,024 in Tuktoyaktuk.
above the NWT average in the wealthiest communities (e.g., $76,233 in Norman
Wells), $63,127 in Yellowknife, and $54,331 in Hay River).
Average Personal Income in NWT and Selected Communities, 2010
Between 2001 and 2010, the distribution of personal income shifted throughout the
NWT. For example,
annual personal income of less than $15,000 declined by 6%.6
personal income greater than $50,000 increased by 13%.
in this period, Lutsel k’e, Paulatuk, and Tuktoyaktuk were the only NWT
communities to have more people with personal income of less than $15,000.
In 2010:
almost one quarter (23%) of NWT tax-filers had personal income of less than
$15,000.
almost half (44%) of NWT tax-filers had personal income greater than $50,000.
fewer people with personal income greater than $50,000 lived in smaller and off-
road communities (e.g., Paulatuk (19%), Aklavik (21%), Tuktoyaktuk (21%), and
Tulita (22%).
6Given that inflation is calculated for Yellowknife only, and assuming an annual NWT inflation rate
comparable to Yellowknife (i.e. 2.3%), $15,000 would have the same purchasing power as $12,223.92 in
2010 dollars.
$76,233
$63,127
$54,331 $53,360
$35,024
$26,341
$0
$10,000
$20,000
$30,000
$40,000
$50,000
$60,000
$70,000
$80,000
$90,000
Cost of Living in the NWT
3
www.dennisbevington.ca
Family Income
Between 2001 and 2010:
NWT family income increased by an annual average of 4.2% or 42% over this
period.
the distribution of family income shifted, with 25% more NWT families earning
in excess of $75,000 and 5% fewer families earning less than $30,000.
Ulukhaktok was the only NWT communitywith fewer families earning more
than $75,000 and having no change in the number of families earning less than
$30,000.
while NWT families earning less than $30,000 declined in most communities, the
number of families earning less than $30,000 actually increased in Behchoko,
Paulatuk, and Lutsel k’e.
In 2010:
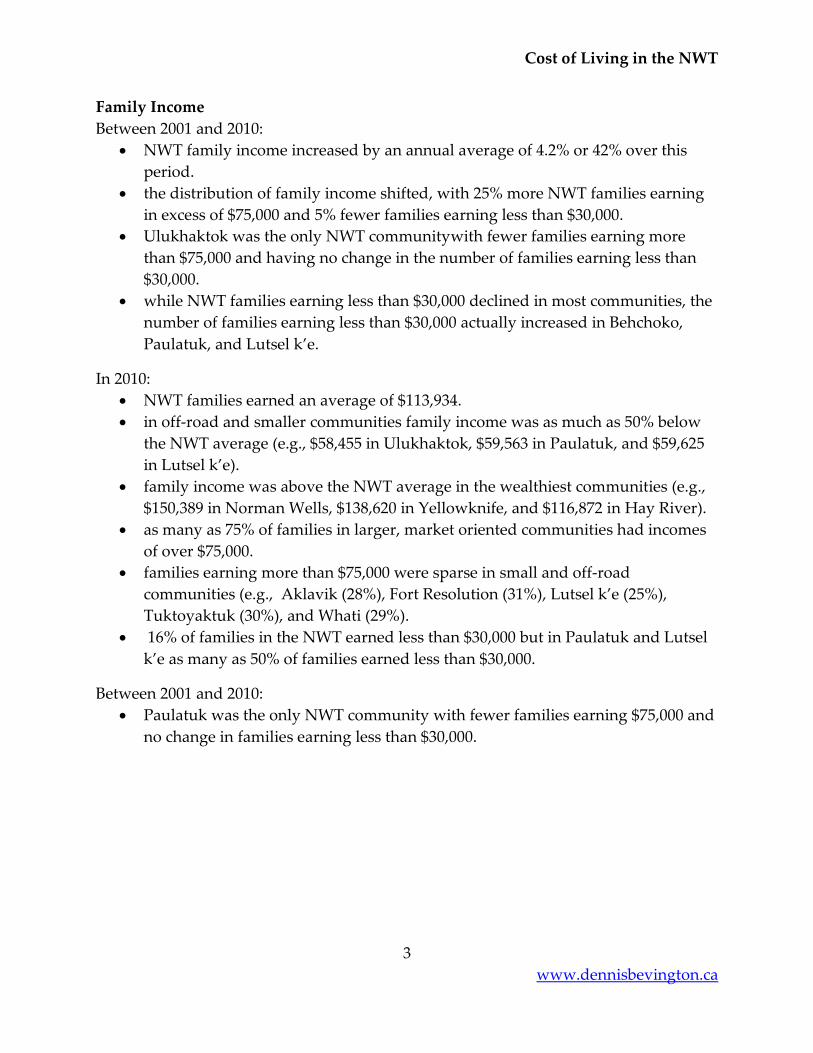
NWT families earned an average of $113,934.
in off-road and smaller communities family income was as much as 50% below
the NWT average (e.g., $58,455 in Ulukhaktok, $59,563 in Paulatuk, and $59,625
in Lutsel k’e).
family income was above the NWT average in the wealthiest communities (e.g.,
$150,389 in Norman Wells, $138,620 in Yellowknife, and $116,872 in Hay River).
as many as 75% of families in larger, market oriented communities had incomes
of over $75,000.
families earning more than $75,000 were sparse in small and off-road
communities (e.g., Aklavik (28%), Fort Resolution (31%), Lutsel k’e (25%),
Tuktoyaktuk (30%), and Whati (29%).
16% of families in the NWT earned less than $30,000 but in Paulatuk and Lutsel
k’e as many as 50% of families earned less than $30,000.
Between 2001 and 2010:
Paulatuk was the only NWT community with fewer families earning $75,000 and
no change in families earning less than $30,000.
Cost of Living in the NWT
4
www.dennisbevington.ca
Average Family Income in NWT and Selected Communities, 2010
Lone Parent Families
Almost one-quarter (24%) of NWT families are lone parent families. Between 2001 and
2010:
lone parent family income increased by 32% but this was 10% less than the
increase recorded for all NWT families.
In 2010:
lone parent families earned an average of $50,930 or 45% of the family average
income in the NWT.
Families in Low Income
Families in low income have to struggle more than other families. In 2010, 15% of NWT
families were in low income.
Between 1998 and 2010:
there was a modest decline (2%) in the number of low income families in the
NWT.
there was a small decline in the number of families in low income in most NWT
communities but an increased number in Fort McPherson and Lutsel k’e.
Lone parent families are vulnerable and more likely to be in low income than two
parent families. In 2010:
$150,389 $138,620
$116,872 $113,934
$59,563 $59,625 $58,455
$0
$20,000
$40,000
$60,000
$80,000
$100,000
$120,000
$140,000
$160,000
Cost of Living in the NWT
5
www.dennisbevington.ca
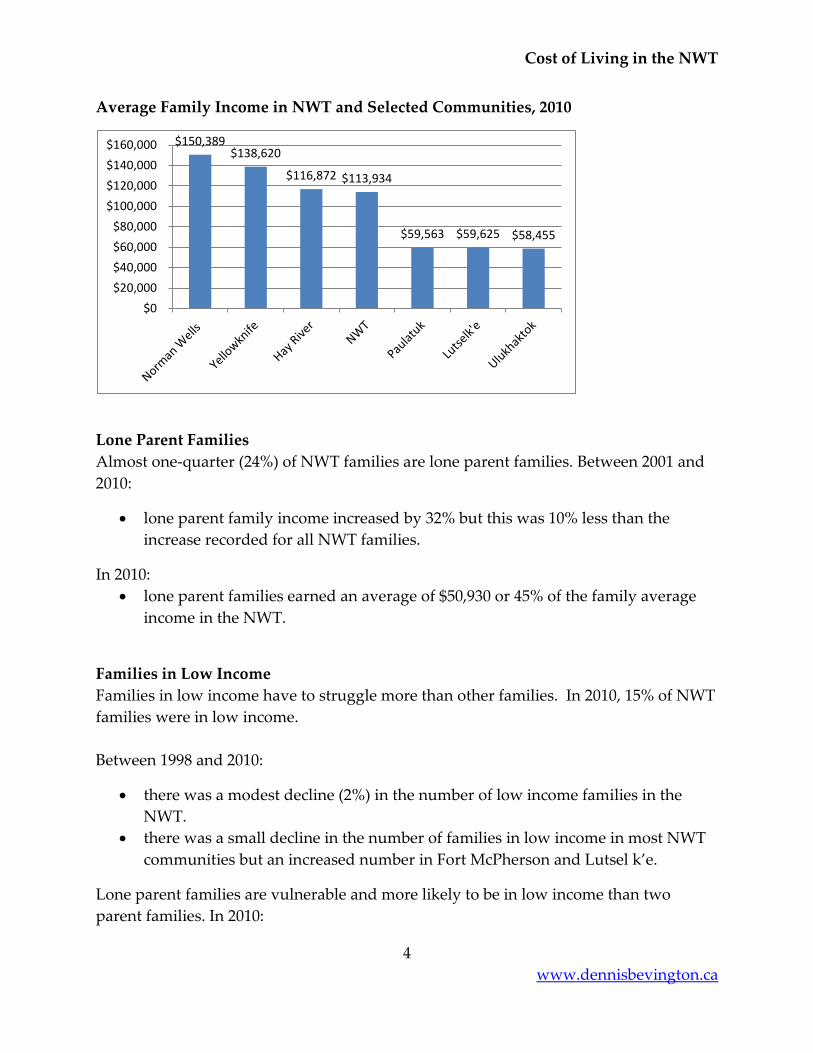
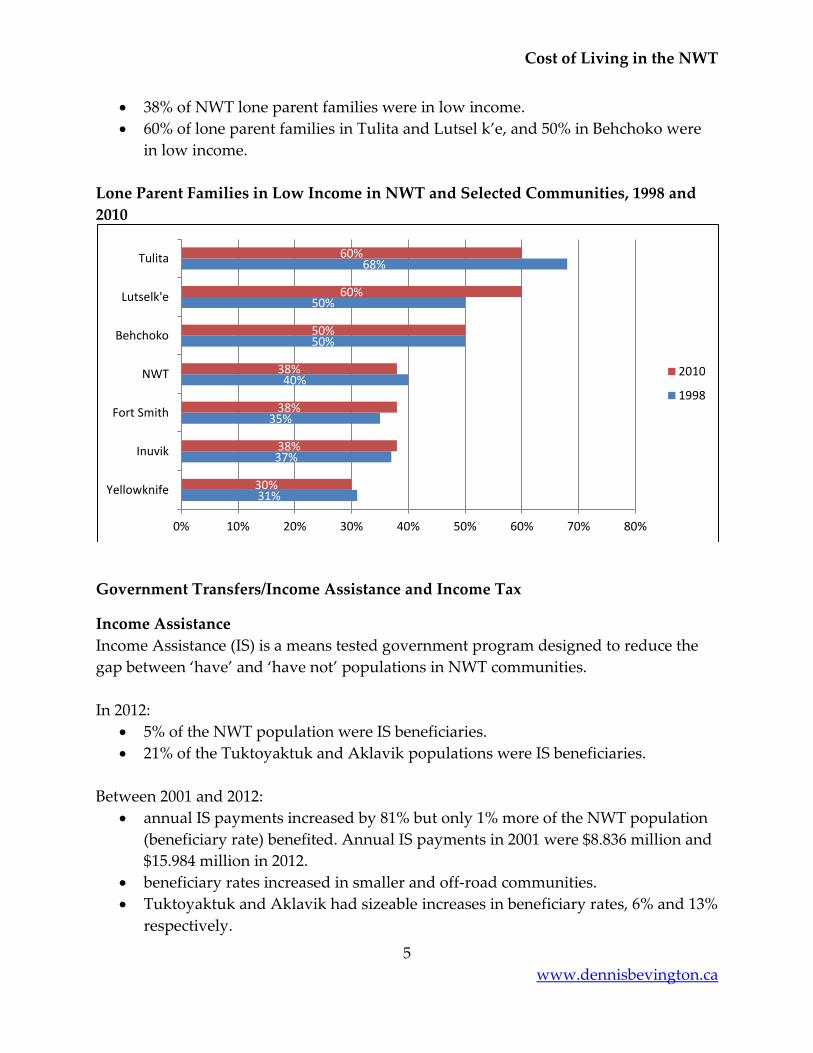
38% of NWT lone parent families were in low income.
60% of lone parent families in Tulita and Lutsel k’e, and 50% in Behchoko were
in low income.
Lone Parent Families in Low Income in NWT and Selected Communities, 1998 and
2010
Government Transfers/Income Assistance and Income Tax
Income Assistance
Income Assistance (IS) is a means tested government program designed to reduce the
gap between ‘have’ and ‘have not’ populations in NWT communities.
In 2012:
5% of the NWT population were IS beneficiaries.
21% of the Tuktoyaktuk and Aklavik populations were IS beneficiaries.
Between 2001 and 2012:
annual IS payments increased by 81% but only 1% more of the NWT population
(beneficiary rate) benefited. Annual IS payments in 2001 were $8.836 million and
$15.984 million in 2012.
beneficiary rates increased in smaller and off-road communities.
Tuktoyaktuk and Aklavik had sizeable increases in beneficiary rates, 6% and 13%
respectively.
31%
37%
35%
40%
50%
50%
68%
30%
38%
38%
38%
50%
60%
60%
0% 10% 20% 30% 40% 50% 60% 70% 80%
Yellowknife
Inuvik
Fort Smith
NWT
Behchoko
Lutselk'e
Tulita
2010
1998
Cost of Living in the NWT
6
www.dennisbevington.ca
Income Tax and Disposable (After Tax) Income
The tax system in the NWT has helped to redistribute income to families and move
some out of low income. The effectiveness of the tax system has diminished in recent
years.
Tax system redistribution of income helped:
2% of NWT families moved from low income in 2010, compared to 3% in 1998;
and
4% of NWT lone parent families moved from low income in 2010, compared to
6% in 1998.
The rate of tax affects an individual’s disposable (after tax) income available to pay for
living costs.
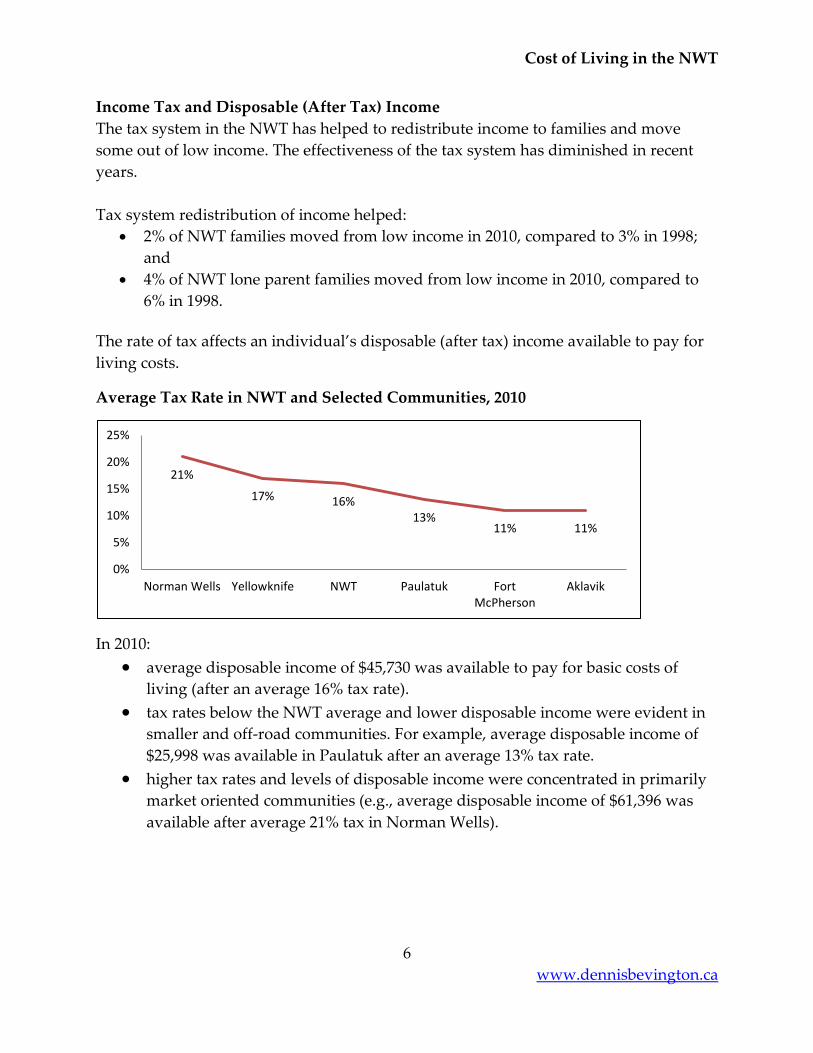
Average Tax Rate in NWT and Selected Communities, 2010
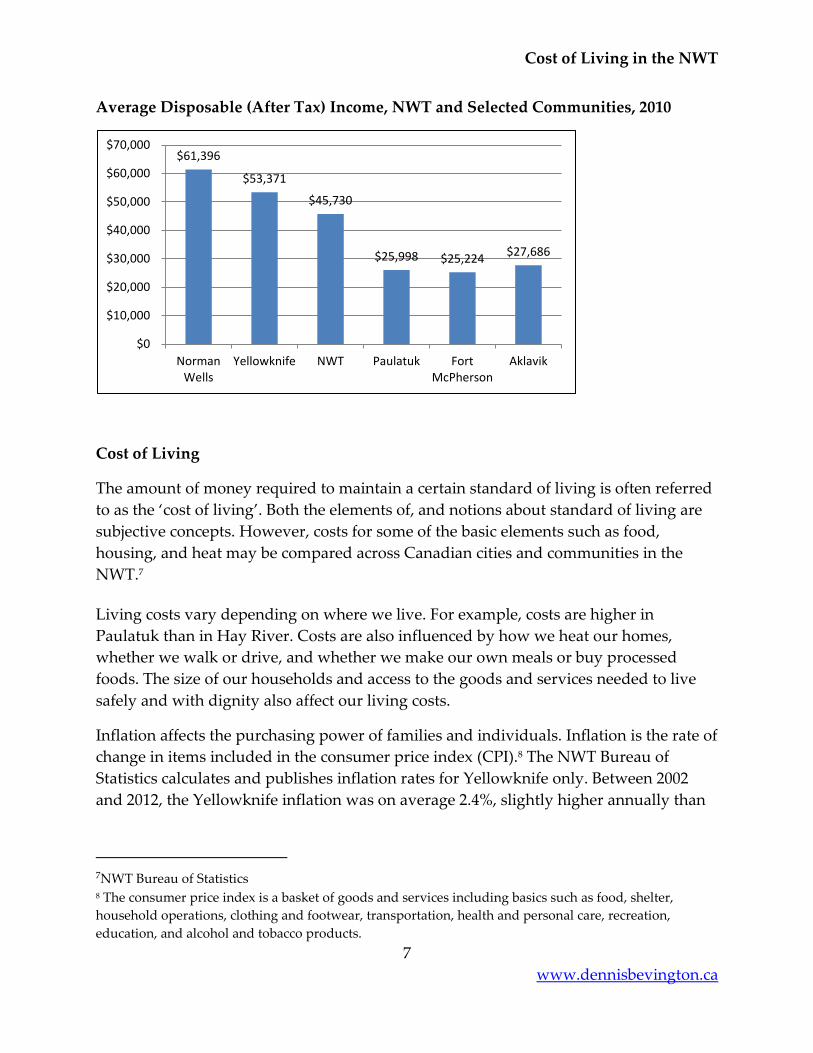
In 2010:
average disposable income of $45,730 was available to pay for basic costs of
living (after an average 16% tax rate). tax rates below the NWT average and lower disposable income were evident in
smaller and off-road communities. For example, average disposable income of
$25,998 was available in Paulatuk after an average 13% tax rate. higher tax rates and levels of disposable income were concentrated in primarily
market oriented communities (e.g., average disposable income of $61,396 was
available after average 21% tax in Norman Wells).
21%
17% 16% 13%
11% 11%
0%
5%
10%
15%
20%
25%
Norman Wells Yellowknife NWT Paulatuk FortMcPherson
Aklavik
Cost of Living in the NWT
7
www.dennisbevington.ca
Average Disposable (After Tax) Income, NWT and Selected Communities, 2010
Cost of Living
The amount of money required to maintain a certain standard of living is often referred
to as the ‘cost of living’. Both the elements of, and notions about standard of living are
subjective concepts. However, costs for some of the basic elements such as food,
housing, and heat may be compared across Canadian cities and communities in the
NWT.7
Living costs vary depending on where we live. For example, costs are higher in
Paulatuk than in Hay River. Costs are also influenced by how we heat our homes,
whether we walk or drive, and whether we make our own meals or buy processed
foods. The size of our households and access to the goods and services needed to live
safely and with dignity also affect our living costs.
Inflation affects the purchasing power of families and individuals. Inflation is the rate of
change in items included in the consumer price index (CPI).8 The NWT Bureau of
Statistics calculates and publishes inflation rates for Yellowknife only. Between 2002
and 2012, the Yellowknife inflation was on average 2.4%, slightly higher annually than
7NWT Bureau of Statistics 8 The consumer price index is a basket of goods and services including basics such as food, shelter,
household operations, clothing and footwear, transportation, health and personal care, recreation,
education, and alcohol and tobacco products.
$61,396
$53,371
$45,730
$25,998 $25,224 $27,686
$0
$10,000
$20,000
$30,000
$40,000
$50,000
$60,000
$70,000
NormanWells
Yellowknife NWT Paulatuk FortMcPherson
Aklavik
Cost of Living in the NWT
8
www.dennisbevington.ca
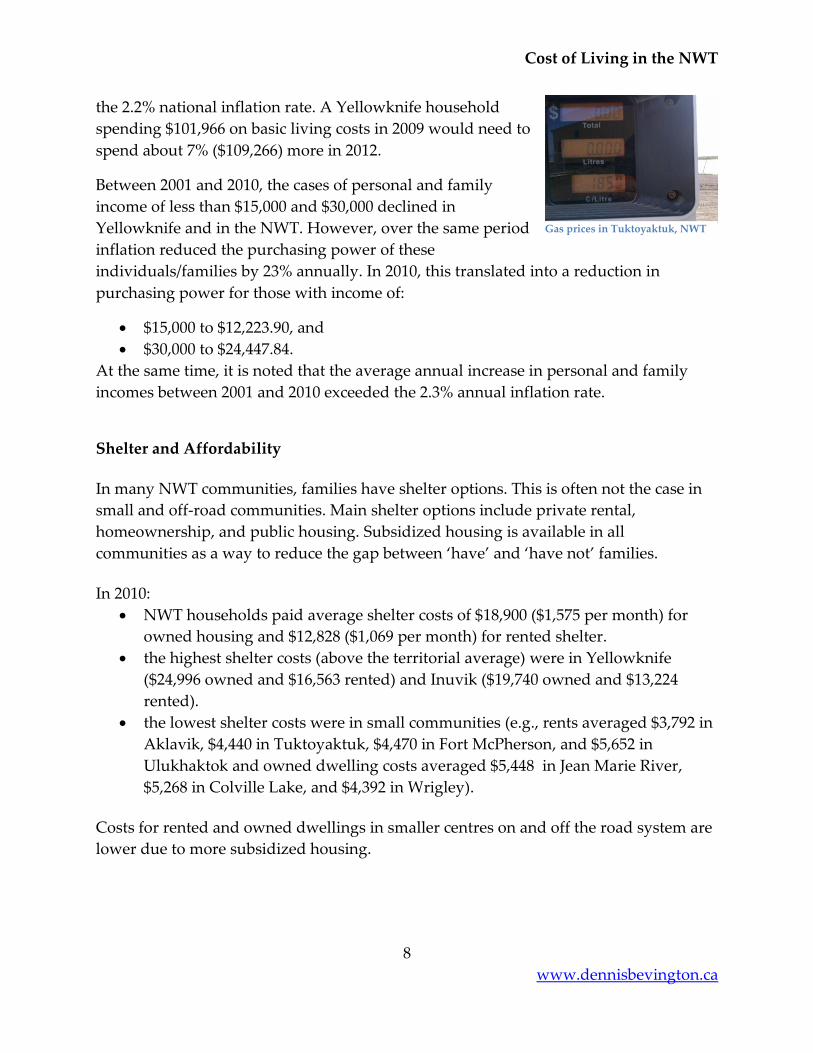
the 2.2% national inflation rate. A Yellowknife household
spending $101,966 on basic living costs in 2009 would need to
spend about 7% ($109,266) more in 2012.
Between 2001 and 2010, the cases of personal and family
income of less than $15,000 and $30,000 declined in
Yellowknife and in the NWT. However, over the same period
inflation reduced the purchasing power of these
individuals/families by 23% annually. In 2010, this translated into a reduction in
purchasing power for those with income of:
$15,000 to $12,223.90, and
$30,000 to $24,447.84.
At the same time, it is noted that the average annual increase in personal and family
incomes between 2001 and 2010 exceeded the 2.3% annual inflation rate.
Shelter and Affordability
In many NWT communities, families have shelter options. This is often not the case in
small and off-road communities. Main shelter options include private rental,
homeownership, and public housing. Subsidized housing is available in all
communities as a way to reduce the gap between ‘have’ and ‘have not’ families.
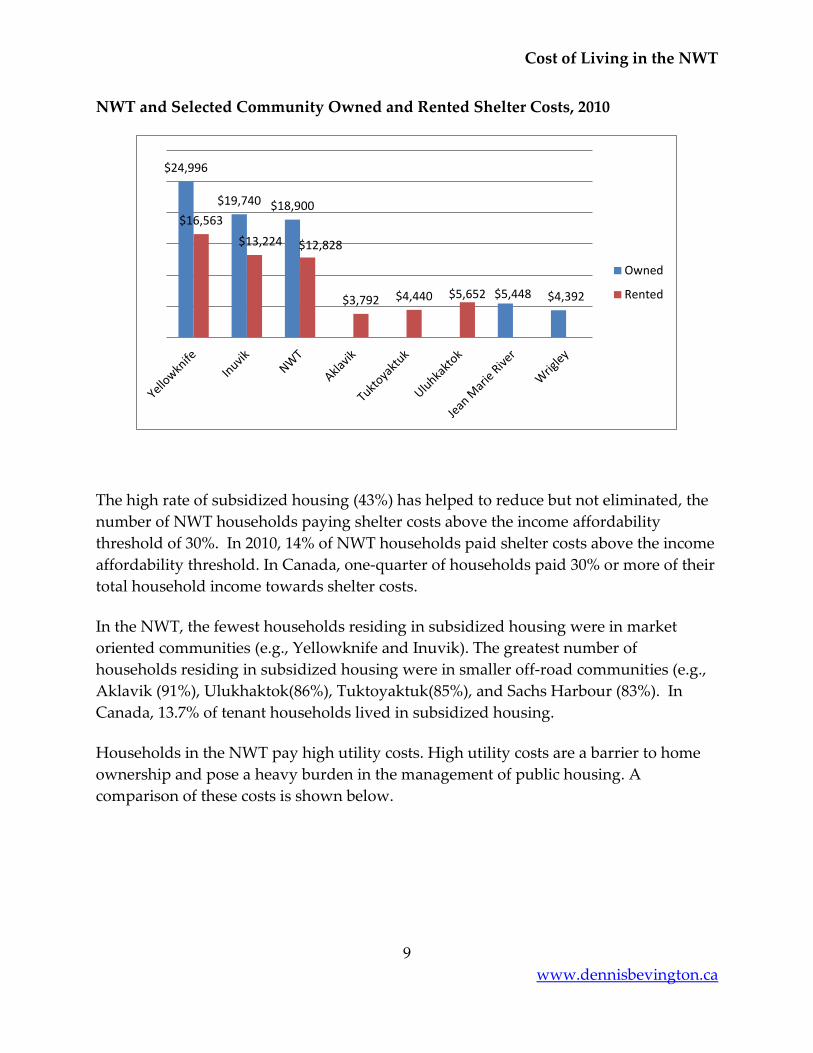
In 2010:
NWT households paid average shelter costs of $18,900 ($1,575 per month) for
owned housing and $12,828 ($1,069 per month) for rented shelter.
the highest shelter costs (above the territorial average) were in Yellowknife
($24,996 owned and $16,563 rented) and Inuvik ($19,740 owned and $13,224
rented).
the lowest shelter costs were in small communities (e.g., rents averaged $3,792 in
Aklavik, $4,440 in Tuktoyaktuk, $4,470 in Fort McPherson, and $5,652 in
Ulukhaktok and owned dwelling costs averaged $5,448 in Jean Marie River,
$5,268 in Colville Lake, and $4,392 in Wrigley).
Costs for rented and owned dwellings in smaller centres on and off the road system are
lower due to more subsidized housing.
Gas prices in Tuktoyaktuk, NWT
Cost of Living in the NWT
9
www.dennisbevington.ca
NWT and Selected Community Owned and Rented Shelter Costs, 2010
The high rate of subsidized housing (43%) has helped to reduce but not eliminated, the
number of NWT households paying shelter costs above the income affordability
threshold of 30%. In 2010, 14% of NWT households paid shelter costs above the income
affordability threshold. In Canada, one-quarter of households paid 30% or more of their
total household income towards shelter costs.
In the NWT, the fewest households residing in subsidized housing were in market
oriented communities (e.g., Yellowknife and Inuvik). The greatest number of
households residing in subsidized housing were in smaller off-road communities (e.g.,
Aklavik (91%), Ulukhaktok(86%), Tuktoyaktuk(85%), and Sachs Harbour (83%). In
Canada, 13.7% of tenant households lived in subsidized housing.
Households in the NWT pay high utility costs. High utility costs are a barrier to home
ownership and pose a heavy burden in the management of public housing. A
comparison of these costs is shown below.
$24,996
$19,740 $18,900
$5,448 $4,392
$16,563
$13,224 $12,828
$3,792 $4,440 $5,652
Owned
Rented
Cost of Living in the NWT
10
www.dennisbevington.ca
Household Heating Cost Comparison9
Yellowknife- Heating residence with fuel oil - $1.20/litre $6,500/year
Paulatuk- Heating residence with fuel oil - $1.50/litre $11,000/year
Edmonton- Heating residence with natural gas -$3.00/gig $700/year
Household Electrical Cost Comparison (based on consumption of 12,000 kWh per year)10
Yellowknife - $3,600 (market rate no GNWT subsidy)
Edmonton- $1,626
Montreal- $824
Paulatuk- $4,000 (subsidized rate)
Paulatuk- $12,000 (estimated full market cost)11
Comparison of Residential water charges (based on 300 cubic meters/year)12
Edmonton- $782.02
Winnipeg- $507
Yellowknife- $1,504.80 (piped)
Yellowknife- $4,200.00 (trucked)
Paulatuk- $900 (estimated subsidized rate)
Paulatuk- $24,900 (estimated full market cost based on rate changed to government)
Food
Food like shelter is a living essential. Food costs vary significantly between large and
small communities. Between 2002 and 2012, food costs in Yellowknife increased by 23%
(an annual average of 2.3%). These increases were slightly above the average annual
inflation rate.
The NWT Temporal Food Price Index13 for 2012 measured the annual change in food
prices.
Food prices increased by 4.7% in Yellowknife and 4.4% in the NWT.
The largest increases in food costs were in Inuvik (6%), Fort Smith (8.5%), and
Hay River (10.2%).
9 NEB Energy Facts 2011 10 Energy Markets Fact Book 2013-2014 Natural Resources Canada 11 The rates for Paulatuk are considerably higher than those noted in Appendix A. The reason for this is
that rates noted in Appendix A refer to affordable housing rates rather than the full market rate. 12 www.crd.bc.ca/water/waterbilling 13 NWT Bureau of Statistics
Cost of Living in the NWT
11
www.dennisbevington.ca
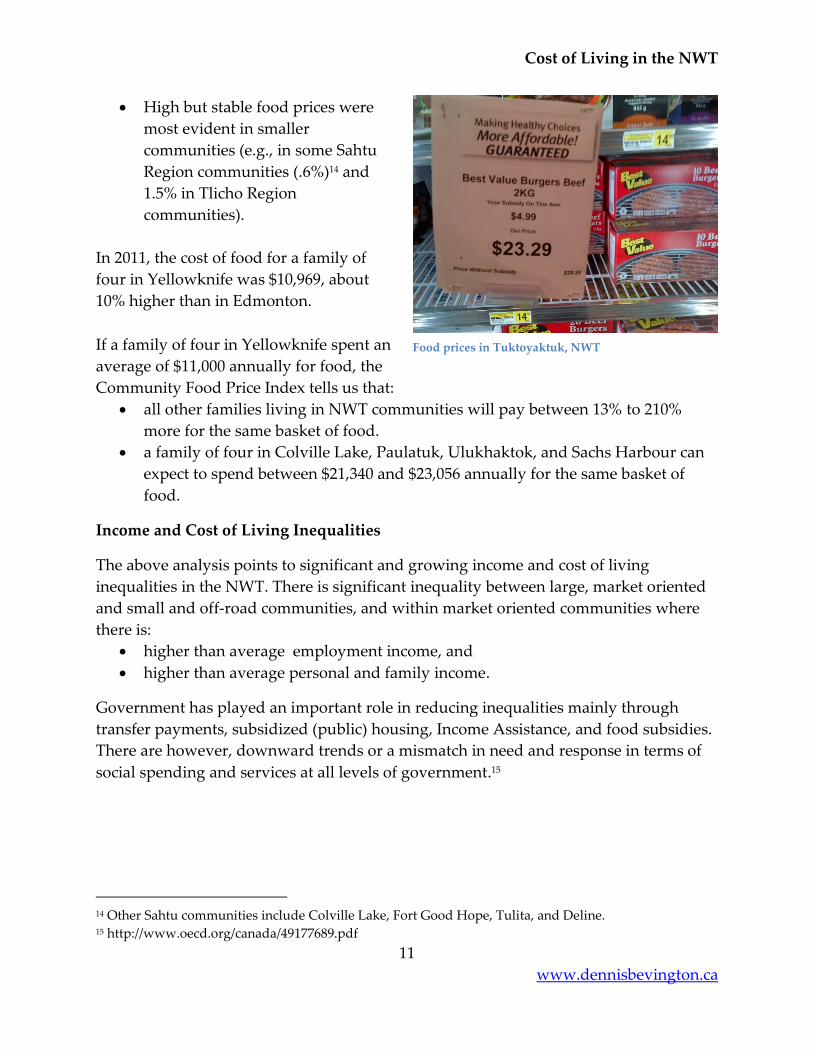
High but stable food prices were
most evident in smaller
communities (e.g., in some Sahtu
Region communities (.6%)14 and
1.5% in Tlicho Region
communities).
In 2011, the cost of food for a family of
four in Yellowknife was $10,969, about
10% higher than in Edmonton.
If a family of four in Yellowknife spent an
average of $11,000 annually for food, the
Community Food Price Index tells us that:
all other families living in NWT communities will pay between 13% to 210%
more for the same basket of food.
a family of four in Colville Lake, Paulatuk, Ulukhaktok, and Sachs Harbour can
expect to spend between $21,340 and $23,056 annually for the same basket of
food.
Income and Cost of Living Inequalities
The above analysis points to significant and growing income and cost of living
inequalities in the NWT. There is significant inequality between large, market oriented
and small and off-road communities, and within market oriented communities where
there is:
higher than average employment income, and
higher than average personal and family income.
Government has played an important role in reducing inequalities mainly through
transfer payments, subsidized (public) housing, Income Assistance, and food subsidies.
There are however, downward trends or a mismatch in need and response in terms of
social spending and services at all levels of government.15
14 Other Sahtu communities include Colville Lake, Fort Good Hope, Tulita, and Deline. 15 http://www.oecd.org/canada/49177689.pdf
Food prices in Tuktoyaktuk, NWT
Cost of Living in the NWT
12
www.dennisbevington.ca
Current Responses to Cost of Living Issues in the NWT
The statistical analysis of the income and living costs tells a very persuasive story of the
inequalities that exist in NWT communities and among northerners. This mirrors
national trends. But inequality in the north is very much exacerbated by higher inflation
rates and fewer options to mitigate against the factors widening the gaps between
‘have’ and ‘have not’ northerners.
Over the past decade, the NWT experienced a very high rate of growth in its GDP that
was much higher than the national average. The development and expansion of three
diamond mines was a major part of this increase. The rapid expansion of extractive
industries is expected to continue across the north in the coming decade. While local
communities get some jobs and business opportunities and territorial and Aboriginal
governments may receive increased taxes and royalties, most of the benefits of
extractive industries flow out of the north through profits to non-northern corporations,
transient workers, and royalties and corporate income taxes to the federal government.
As a result, extractive industries do little to address cost of living issues or the
inequalities among northerners or between northern and southern Canadians. In fact,
there is an argument that extractive industries drive up living costs and increase income
gaps.16
In the NWT, there are five typical responses to cost of living and equality issues. Each
has had varying levels of success.
1. Loans, subsidies, and incentives to businesses to encourage job creation and increase
income earning potential, are practices of various federal and territorial government
agencies. For example:
Discovery Air received a $34-million loan from the GNWT’s Northwest
Territories Opportunities Fund to retire its debt. Unfortunately in 2013,
Discovery Air moved its operations out of the NWT.17
GNWT Industry, Tourism and Investment (ITI) invests in industry associations
such as the NWT Film and Media Arts Association to build the sector and
expand capacity, which in this case is a professional film and media industry
that can work with such TV productions as Arctic Air and Ice Pilots.18
16 http://www.naho.ca/documents/naho/english/resourceExtraction/Social_EN.pdf 17http://norj.ca/2013/08/discovery-air-joins-other-airlines-in-southward-migration/ 18http://www.iti.gov.nt.ca/publications/2011/artscrafts/FINALNWTFilmIndustryBriefingMay13%2711.pdf
Cost of Living in the NWT
13
www.dennisbevington.ca
In partnership with the federal government, the GNWT invests in community
and individual agricultural and harvesting enterprises.19 An example is public
investment to enhance the equipment of Kakisa fishers so they have a steady
income.20
Both the federal and territorial governments have invested in business ventures
of Aboriginal-owned development corporations such as Denendeh Investments
Inc., which has ownership in utility, communications, energy, real estate,
construction, and environmental ventures.21
Direct GNWT investment in secondary diamond industries such as cutting and
polishing helped to establish three plants, of which two were shut down and the
last one sold in 2013.22
Tax incentives such as the mineral exploration tax credit recommended in the
GNWT’s 2013 background report toward the development of a mineral
strategy.23
2. Educating and training people for a place in the labour force, for example through:
The NWT Mine Training Society, a mine training partnership funded half by the
Government of Canada’s Aboriginal Skills and Employment Partnership (ASEP)
and half by Diavik Diamond Mine Inc., BHP Billiton, De Beers Canada, and
others.24 The federal government committed to $5.8 million to support training
in the NWT mining sector in 2013.25 It is debated whether northerners trained for
mining thrive in these occupations, whether jobs are sustainable, and if mine
employment addresses the issues of income or living cost inequalities.26
Territorial government investment in regional training partnerships such as the
Sahtu Regional Training Partnership Committee and the South Slave Regional
Labour Market Planning Partnership that work with employers, governments,
and trainers to ready the labour force for employment mainly in hydrocarbon
industries. 27
19http://www.iti.gov.nt.ca/fursagriculturefisheries/agriculture.shtml 20http://www.nnsl.com/frames/newspapers/2012-07/jul19_12FIS.html 21http://www.denendeh.ca/welcome/index.shtml 22http://www.iti.gov.nt.ca/publications/2008/Diamonds/diamond07.pdf and
http://www.nnsl.com/frames/newspapers/2012-03/mar21_12d.html 23http://www.iti.gov.nt.ca/publications/2013/mineralsoilgas/FINAL_MDS_PanelReport_29May13.pdf 24http://minetraining.ca/sites/default/files/prospects_annual_report_2012.pdf
25 http://norj.ca/2013/08/harper-re-announces-funding-for-nwt-mine-training-on-first-hay-river-visit/ 26 http://norj.ca/2013/04/mining-holds-empty-promises-for-northerners/ 27 http://news.exec.gov.nt.ca/jackson-lafferty-addressing-workforce-hurdles-training-recruitment-and-
retention/
Cost of Living in the NWT
14
www.dennisbevington.ca
Direct government investment in job specific education and training mainly
through Aurora College such as in the Teacher Education Program (TEP),
Northern Registered Nursing Program, and Aboriginal Language and Cultural
Instruction Program (ALCIP).
Mentorships,28 internships,29 and student employment30 to expose and develop
skills among potential workers.
3. Government sponsored programs designed to offset living costs is a third response
to cost of living issues. Examples include:
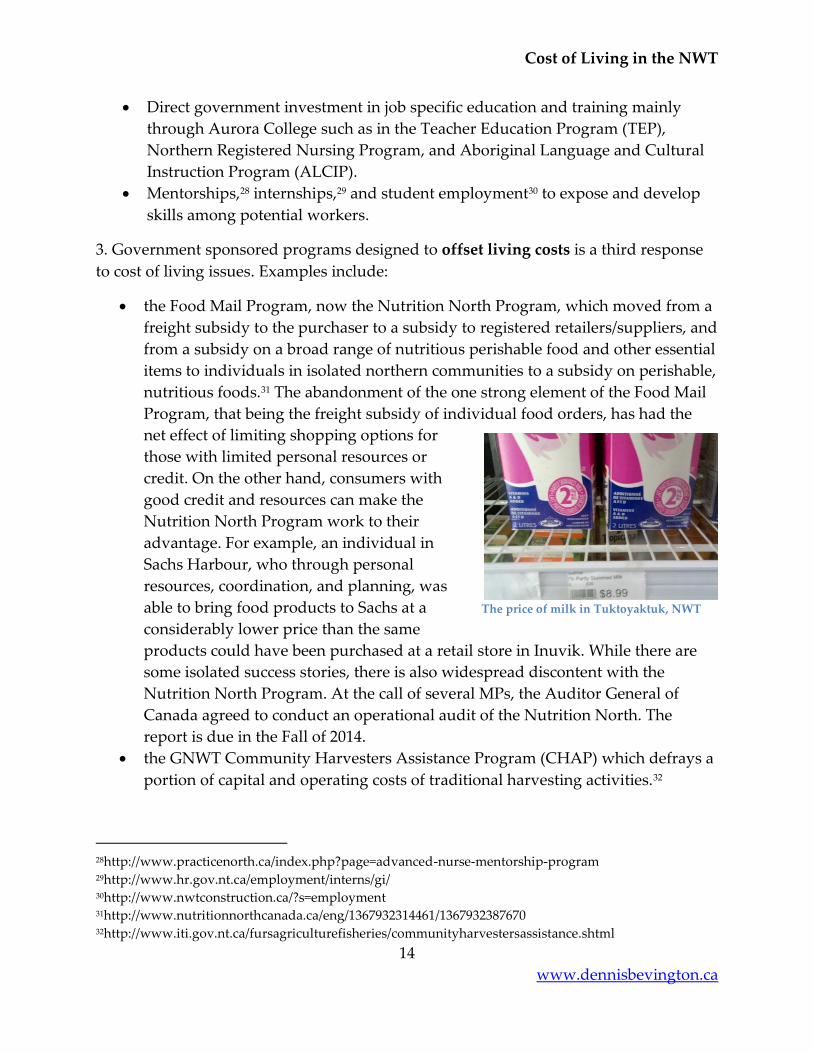
the Food Mail Program, now the Nutrition North Program, which moved from a
freight subsidy to the purchaser to a subsidy to registered retailers/suppliers, and
from a subsidy on a broad range of nutritious perishable food and other essential
items to individuals in isolated northern communities to a subsidy on perishable,
nutritious foods.31 The abandonment of the one strong element of the Food Mail
Program, that being the freight subsidy of individual food orders, has had the
net effect of limiting shopping options for
those with limited personal resources or
credit. On the other hand, consumers with
good credit and resources can make the
Nutrition North Program work to their
advantage. For example, an individual in
Sachs Harbour, who through personal
resources, coordination, and planning, was
able to bring food products to Sachs at a
considerably lower price than the same
products could have been purchased at a retail store in Inuvik. While there are
some isolated success stories, there is also widespread discontent with the
Nutrition North Program. At the call of several MPs, the Auditor General of
Canada agreed to conduct an operational audit of the Nutrition North. The
report is due in the Fall of 2014.
the GNWT Community Harvesters Assistance Program (CHAP) which defrays a
portion of capital and operating costs of traditional harvesting activities.32
28http://www.practicenorth.ca/index.php?page=advanced-nurse-mentorship-program 29http://www.hr.gov.nt.ca/employment/interns/gi/ 30http://www.nwtconstruction.ca/?s=employment 31http://www.nutritionnorthcanada.ca/eng/1367932314461/1367932387670 32http://www.iti.gov.nt.ca/fursagriculturefisheries/communityharvestersassistance.shtml
The price of milk in Tuktoyaktuk, NWT

Cost of Living in the NWT
15
www.dennisbevington.ca
4. Rights-based advocacy and program initiatives are another response. Examples
include:
the Yellowknife Homelessness Coalition which is a collective of social and local
government agencies that advocates and facilitates housing and services to assert
the right to safe, secure, and affordable housing. The Coalition instigated the
Bailey House, a transitional facility for men, and is currently involved in the
Betty House, a transitional facility for women.
the NWT No Place for Poverty Anti-Poverty Coalition which is a collective of
groups that assert the right of all northerners to live with dignity, free from
poverty. The GNWT NWT Anti-Poverty Strategy Framework (2013) is a result of
the Coalition’s efforts. The Anti-Poverty Framework commits to actions in five
priority areas: children and families, healthy living, safe and affordable housing,
sustainable communities, and better integration of services.33 At the time of this
report, no implementation strategy had yet been developed.
5. A fifth response is charitable efforts mainly of non-profit organizations that assist
people most negatively impacted by income and living cost issues. Charitable efforts
are evident in such activities as food banks, soup kitchens, clothing exchanges, and
homeless shelters.
Food banks in Inuvik, Tuktoyaktuk, Fort Smith, Yellowknife, and some other
NWT communities have difficulty sustaining operations and meeting demand.
The Food Banks Canada (FBC) 2012 survey found that northerners across the
three territories are not getting enough to eat, and not eating enough healthy
food. Too many northerners don’t have access to a food bank or any other source
of emergency food. The survey pointed to important focal points for
improvement, including Inuvik and Paulatuk in the NWT and Cambridge Bay,
Arctic Bay, and Pangnirtung in Nunavut. FBC said that local food systems are
needed to build and sustain community-led food initiatives. A food security
innovation fund is also needed to support these initiatives. Comprehensive
school breakfast programs and investing in infrastructure, like community
centres and community freezers, are also needed. Similar recommendations were
made in a 2010 plan in Yellowknife, Dettah, and Ndilo.34
Non-profit and volunteer run homeless shelters exist in many different forms
and serve various client groups. Shelters exist in Fort Smith, Yellowknife, Inuvik,
33http://www.gov.nt.ca/research/publications/pdfs/Anti-poverty_Strategic_Framework.pdf 34Yellowknife, Ndilo and Dettah Food System Assessment and Community Food Action Plan. 2010.
/www.yhssa.org/ContentPages/2486530663.pdf
Cost of Living in the NWT
16
www.dennisbevington.ca
and several other communities. Like food banks and other charitable
endeavours, sustained resources and community support are challenges.
While these five main responses to living costs and inequality in the NWT continue, the
data above show the gaps among northerners are growing wider. Other solutions must
be found if we are to have a society where everyone is safe and secure and can live with
dignity.
What Can be Done to Deal with Cost of Living Issues in the
NWT?
While earning adequate income to cover living costs is an obvious response high living
costs, job creation through industry investment hasn’t had the overall effect that
governments have hoped for. Not all northerners are benefiting from focused
government investment in extractive industries. Investments in diverse and sustainable
economic activities are needed to generate income for a broader range of northerners so
they are in a position to manage living costs. These investment opportunities are
identified in the broad array of strategies in play within northern governments and
communities. For example, the GNWT has its NWT Arts Strategy, NWT Mineral
Development Strategy, NWT Water Stewardship Strategy, GNWT Land Use and Sustainability
Framework, and the Building on the Strengths of Northerners anti-poverty framework.
Communities also have their plans, for example, A Framework for Economic Development
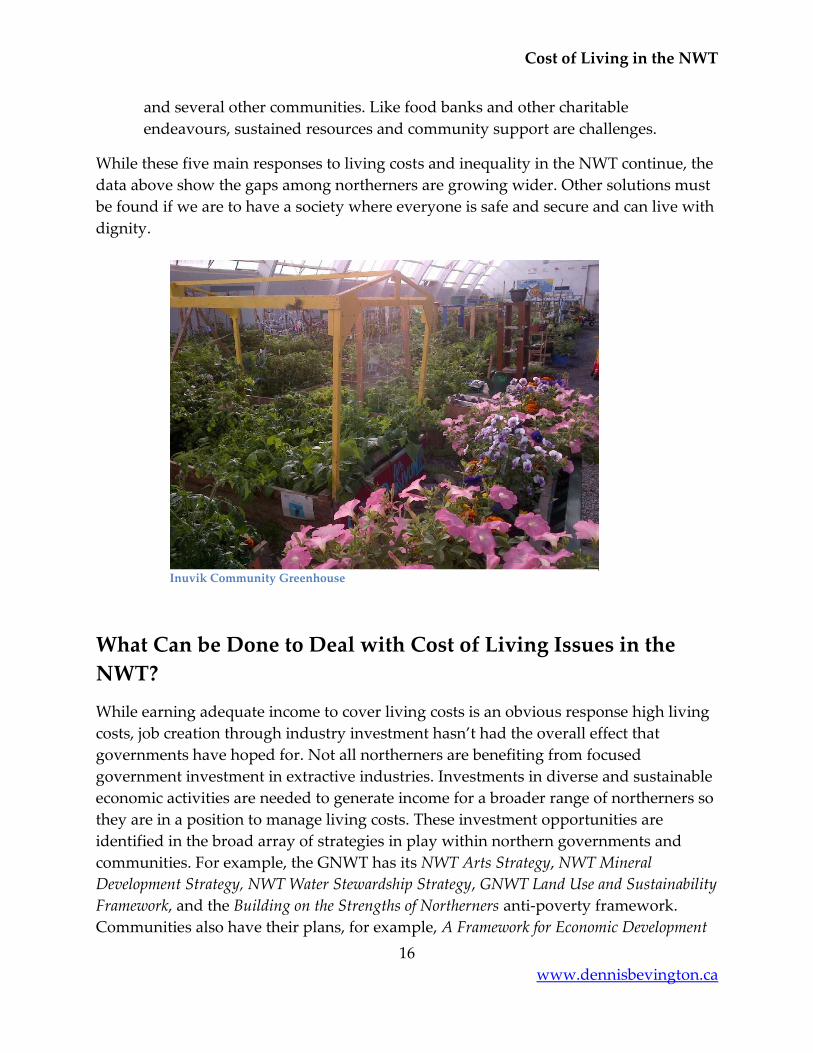
Inuvik Community Greenhouse
Cost of Living in the NWT
17
www.dennisbevington.ca
in Fort Good Hope (2013). A more coordinated approach and linkages among these
strategies would strengthen these initiatives as well as provide a stronger rationale for
investment.
Similarly, training partnerships to address a broader spectrum of human resource
development rather than just extractive industries are required. More specifically,
territorial, Aboriginal, and community governments need to broaden existing training
partnerships so that federal government funding is not directed only at extractive
industries.35
Lowering living costs is an action that northerners can take to address living costs. But
some of us have more opportunity and power than others to do this. Taking control
over basic needs and a strong interdependence among family and community members
are known to lower living costs and strengthen equality among people and
communities. Community-based partnerships and collaborations, and focused and
sustained effort also contribute to greater equality. In 2012 Alternatives North
documented examples of this for the No Place for Poverty Coalition and GNWT.36
Other examples of efforts to lower living costs are everywhere in the NWT.
The NWT Food Network, a collaboration of the NWT Farmers’ Association and
Ecology North, had its inaugural meeting in March 2013.37 Inspired by the UN
Special Rapporteur on the right to food and food network advocates from
northern Manitoba, the NWT Network committed to developing a sustainable
food system and culture throughout the NWT. Unfortunately, in recent months
sufficient resources to ‘kick start’ the Network have not been available.
The Yellowknife Garden Collective facilitates the participation of an estimated
165 gardeners sharing 88 garden plots at three garden sites. The Collective is
actively working with neighbourhoods and the City to develop more sites.
Gardeners reduce their own food costs and contribute 25% of their yield to
35http://www.theasianconnectionsnewspaper.com/new-mining-sector-skills-training-program/ 36Addressing Poverty in the NWT – An Appreciative Inquiry of Program Success.http://alternativesnorth-
ca.web33.winsvr.net/Portals/0/Documents/Poverty/Alt%20North%20Anti-
Poverty%20Appreciative%20Inquiry.pdf 37https://dl.dropboxusercontent.com/u/78305835/NWT%20Food%20Network%20Gathering%20Report.pd
f
Cost of Living in the NWT
18
www.dennisbevington.ca
organizations feeding others.38 The Collective donated 545 kg of garden produce
and 175 bags of greens to local charities in 2012.39
Volunteers with Food Rescue in Yellowknife ‘rescue’ food from grocery stores
and wholesalers for redistribution to organizations needing food (e.g.,
Yellowknife Food Bank, Centre for Northern Families, Salvation Arm). In 2009,
Food Rescue redistributed over $250,000 in food into the community.40
Food producers sell their products at farmers’ markets in Hay River,
Yellowknife, and Inuvik. The markets help food producers generate income and
offset their own and others food costs.
The Tuktoyaktuk Hamlet Council recently purchased 75 fish nets to distribute to
people to increase the harvest in this area. The Council sees increasing the
harvest of this food source as vital in a region where access to caribou and other
species is dwindling.
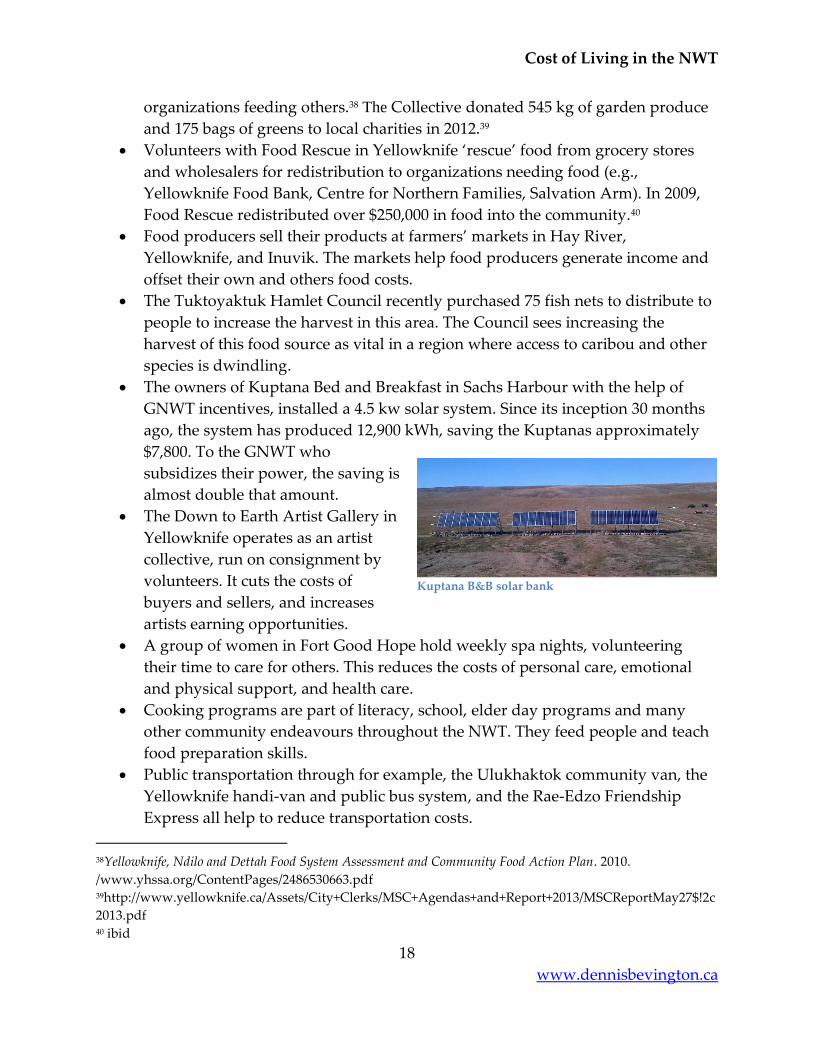
The owners of Kuptana Bed and Breakfast in Sachs Harbour with the help of
GNWT incentives, installed a 4.5 kw solar system. Since its inception 30 months
ago, the system has produced 12,900 kWh, saving the Kuptanas approximately
$7,800. To the GNWT who
subsidizes their power, the saving is
almost double that amount.
The Down to Earth Artist Gallery in
Yellowknife operates as an artist
collective, run on consignment by
volunteers. It cuts the costs of
buyers and sellers, and increases
artists earning opportunities.
A group of women in Fort Good Hope hold weekly spa nights, volunteering
their time to care for others. This reduces the costs of personal care, emotional
and physical support, and health care.
Cooking programs are part of literacy, school, elder day programs and many
other community endeavours throughout the NWT. They feed people and teach
food preparation skills.
Public transportation through for example, the Ulukhaktok community van, the
Yellowknife handi-van and public bus system, and the Rae-Edzo Friendship
Express all help to reduce transportation costs.
38Yellowknife, Ndilo and Dettah Food System Assessment and Community Food Action Plan. 2010.
/www.yhssa.org/ContentPages/2486530663.pdf 39http://www.yellowknife.ca/Assets/City+Clerks/MSC+Agendas+and+Report+2013/MSCReportMay27$!2c
2013.pdf 40 ibid
Kuptana B&B solar bank
Cost of Living in the NWT
19
www.dennisbevington.ca
Other Things that Can be Done
Other actions can be taken to reduce the inequalities among, and the costs of living of
northerners. As MP of the Western Arctic, I am prepared to advocate for these actions.
Direct Federal Action
The federal tax system can be changed so that it does truly redistribute wealth.
Specifically, three changes need to be made:
1. Increase the basic Northern Residents Tax Deduction (NRTD) by 50%.41 First
established in 1989, a 50% increase in the NRTD would account for inflation and
result in the same effect that it had when it was first introduced. Further, an
increase in the NRTD would ensure the viability of the workforce, particularly in
the larger market oriented communities that are the backbone of the northern
economy.
2. Introduce a new NRTD category to recognize communities where most earnings
are well below the territorial average. Preferably, the new category would be a
refundable credit rather than a deduction and would be 200% - 300% greater
than the present level, given that the cost of basic living in these communities is
in many cases, 200% greater than in southern Canada.
3. As a factor of changes to the NRTD, ensure that northerners accrue increases in
the basic personal exemption, the NWT basic credit for self ($942), and the
variable NWT non-refundable tax credit rate (5.9%).
Choosing a Different Path
Improving the taxation regime is just one action to deal with the northern inequalities
and living costs. Other significant actions are needed but they require choosing a
sustainability path rather than continuing along the standard consumer path.
Standard Consumer Path
The standard consumer path is that most of Canada is on is where we continue to think
of costs in relation to a consumer lifestyle. To tackle high living costs and growing
inequality, going forward on this path entails raising subsidies and increasing support
programs for those on low and fixed income. It also requires much larger wage
increases for the average worker, higher fees for northern located services, and a
41 This was recently recommended by the GNWT Economic Opportunities Strategy Governance
Committee. http://www.cbc.ca/news/canada/north/northern-living-tax-break-needs-50-hike-committee-
says-1.2287515
Cost of Living in the NWT
20
www.dennisbevington.ca
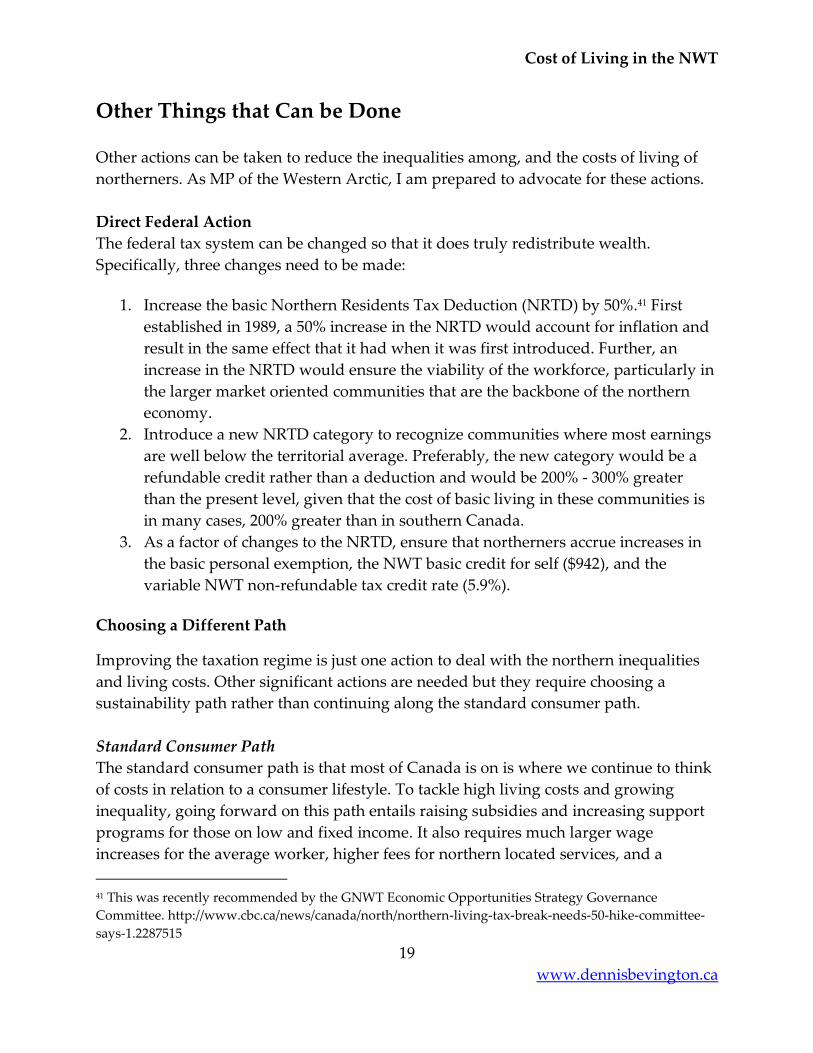
continued focus on convenience packaging and products.
This path as we have seen, results in increased inflation, loss
of northern-based services, reduced government finances for
long term service improvements, and more fly-in workers
for resource extraction industries.
The standard consumer path in practice is evident in
northern housing that emphasizes standard southern
lifestyles and ignores the highest standards for energy efficiency and alternative heating
sources. This path is also evidenced in the Nutrition North Program. Unlike the
previous Food Mail Program, Nutrition North accepts the standard consumer premise
that the existing southern based marketing model, represented by CO-OP and Northern
retail stores, should remain the model for food delivery. Further, it assumes that the
costs of retailers should be the primary focus of the subsidy. The move away from the
individual focused Food Mail Program to the retail focused Nutrition North Program
assumes that everyone in the community should share the costs and inefficiencies of the
local retailer. The net effects of the shift from the Food Mail to the Nutrition North have
been:
government support for convenience packaging, brand name promotion, and
other elements of conventional retailing as the preferred way of doing business
in remote communities.
intensification of a system of dependency on market rather than individual
driven food choices.
perpetuation of a food system that threatens the health of northerners. For
instance, a recent study found that 25% of nutrition for Nunavut children comes
from soda pop and sugar laden fruit juice,42 a finding that likely can be
duplicated to some degree across the north. This is a crisis of epic proportions in
health and well being that threatens our communities. Even cancer rates,
according to the Aboriginal and Global Health Research Group from the
University of Alberta, presenting in Fort Good Hope this fall, have as one of the
key contributing factors, the poor nutrition common in northern communities.
Moving northerners toward a dependency on foods imported by local retailers is
supported by the federal government through policy but with declining investment.
The actual dollar amount spent on the Nutrition North Program has been reduced. In
the last year of the Food Mail Program, the expenditures had exceeded the budgeted
42 http://digitool.library.mcgill.ca/webclient/StreamGate?folder_id=0&dvs=138
The price of cheese in Tuktoyaktuk
Cost of Living in the NWT
21
www.dennisbevington.ca
amounts and were close to $60 million Canada-wide. Three years later after significant
inflation in the northern communities, the budget was set at $52 million.
The Sustainability Path
The other path is sustainability. Sustainability is a term used to cover a variety of
situations from large industrial projects that support local employment and business to
the allowable yield of wild animals for human consumption. But as a lifelong
northerner, I see sustainability as the ability to maintain a modest lifestyle, heavily
focused on local production and utilization. It is a lifestyle enhanced and made
prosperous with the participation of northerners in smaller scale and carefully paced
extractive industry projects. Within this definition, sustainability has a temporal aspect
in that it gives confidence to the people engaged in a sustainable economy that their
grandchildren will continue to enjoy a prosperous and secure lifestyle in the future,
regardless of the resource development cycle.
In practical terms regarding northern living costs and inequalities, sustainability can
apply to supply systems, attitudes, materials, local economics, and consumption
practices. Tools available to influence and make the sustainable path more attractive
include full market pricing (based on a complete understanding of all costs), education
and training in alternative economies, advertisement and promotion of lifestyle choices,
incentives for local production, regulation, and public policy. Taking the sustainable
path on food and energy issues are real options for northerners.
Food
As discussed elsewhere in this paper, healthy food options, even with the Nutrition
North retailer subsidy, are out of reach for too many northerners, particularly those
living in isolated communities. The high cost of food is compounded by rising costs of
doing business resulting from energy, transportation, and salaries. While traditional
hunting, trapping, and fishing play a significant role in the modern northern economy,
the high cost of harvesting equipment and fuel, lack of suitable processing facilities, loss
of traditional skills, effects of climate disruption, and changing availability of species
are limiting local harvesting efforts. The decline in local harvesting is negatively
impacting community cohesion. For example, those who pay so much for food have
very little to share with others or give to food banks. Community sharing of country
foods also took a major step backward with the abandonment of the community freezer
program.
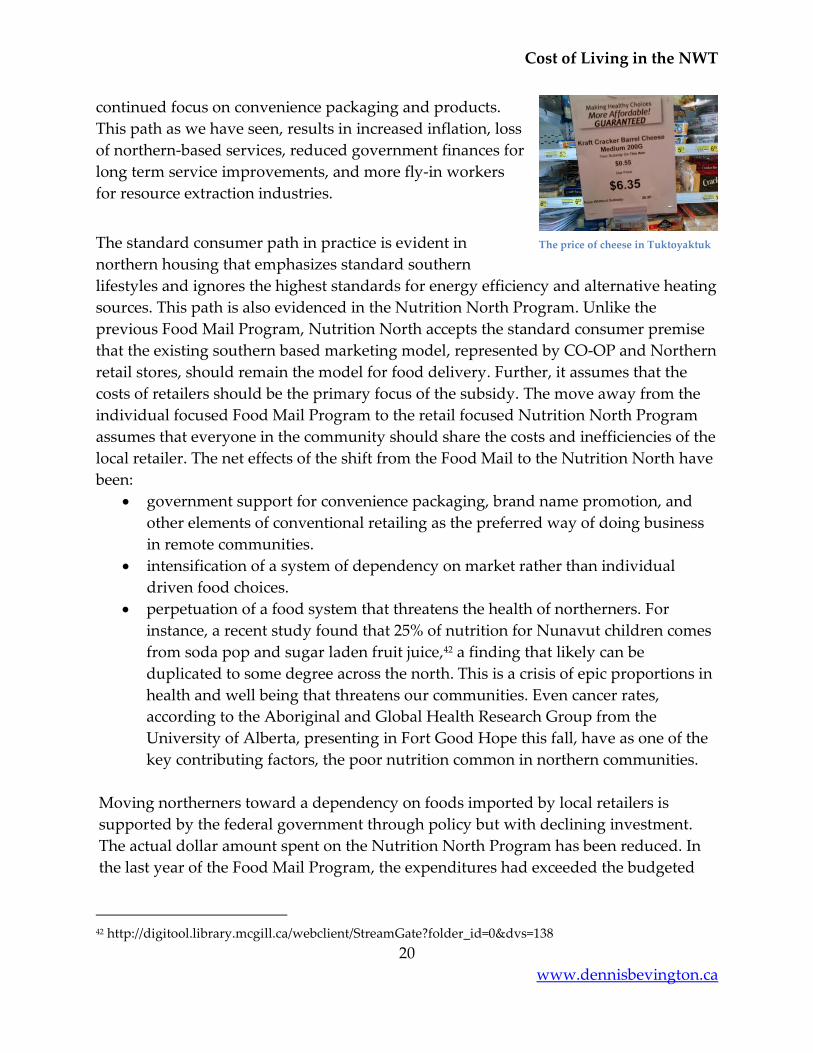
As discussed elsewhere in this paper, several communities are taking steps to develop a
local food system. For example, in Fort Good Hope efforts are being made to acquire
Cost of Living in the NWT
22
www.dennisbevington.ca
community supervised processing
and storage units for traditional foods
(e.g., a multifunctional community
processing facility, one side for fish
and the other for meat with packaging
and freezing capacity). Similar ideas
are being discussed in Tuktoyaktuk
and Ulukhaktok. The model for this is
a facility created by a Hay River
fisherman, who in a 200 sq. ft. shed
has his processing, flash freezing,
vacuum sealing, and storage area. He can market his product effectively, with a higher
return than selling it unprocessed or to the Fresh Fish Marketing Corp.
To improve the success of community food production efforts, harvester training
programs are needed.
Energy
Energy is one of the more pervasive elements contributing to living cost increases
throughout the north. Diesel fuel is the main energy source for at least one-third of the
population. It also runs the industrial resource extraction economy. Over the last
decade, there has been at least a three fold increase in diesel prices. In Yellowknife, the
NWT’s most cost competitive location, the price for a litre of home heating oil has risen
from the .30 - .40 cents in 2002 to $1.20 - $1.40 today. But in southern Canada, the price
of natural gas for heating homes is now at a similar cost (or less) in dollar terms as ten
years ago. Rising energy costs have a spill-over effect into all areas of northern life.
With the pressures of global increases in crude oil continuing as they have for the past
two decades at a rate of 6% per year, a primary key to sustainability will be the
development of local renewable energy sources. Small scale hydro, wind, solar, and
biomass (including energy storage) are all practical solutions for the north. Investment
in some innovation is required, but to a great degree, many of the technologies are
already available. The most significant factor going ahead will be retraining the energy
workforce, encouraging business development, and opening up individual investment
opportunities.
Progress on alternative energies has been painfully slow. The federal government
announced in its 2011 budget, an investment of $6 million over two years for clean
energy in northern and Aboriginal communities. This is a paltry sum compared to the
Fishing processing facility in Hay River
Cost of Living in the NWT
23
www.dennisbevington.ca
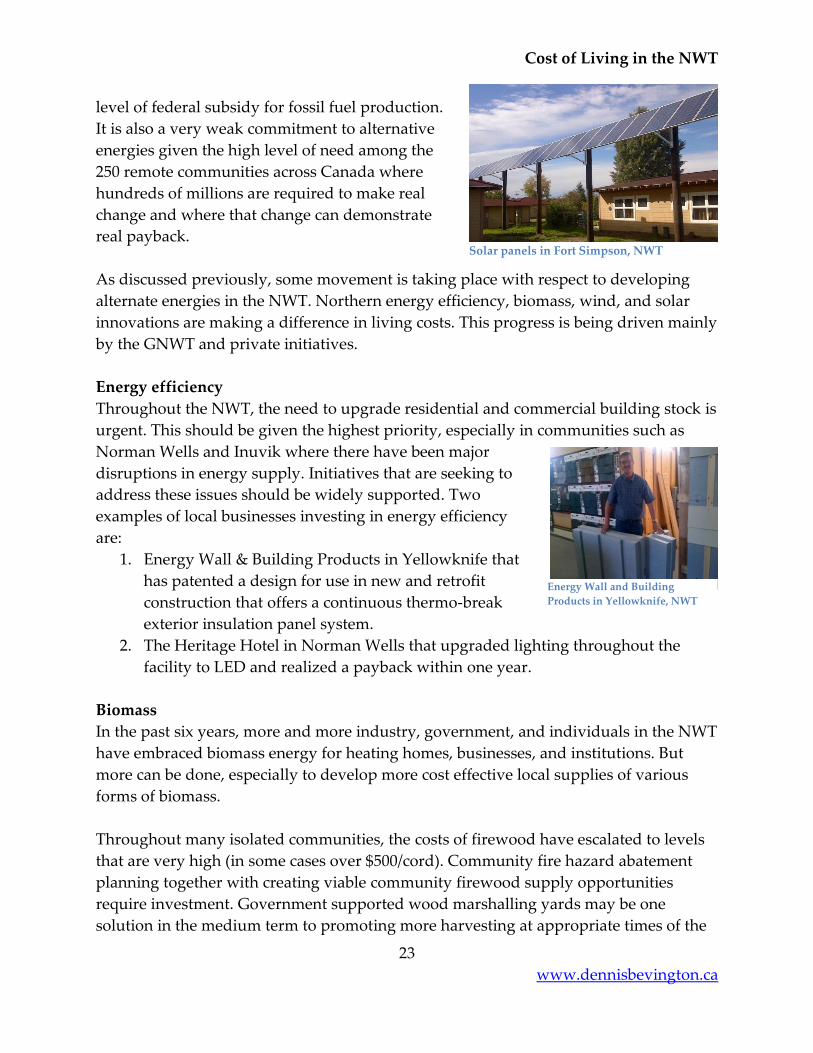
level of federal subsidy for fossil fuel production.
It is also a very weak commitment to alternative
energies given the high level of need among the
250 remote communities across Canada where
hundreds of millions are required to make real
change and where that change can demonstrate
real payback.
As discussed previously, some movement is taking place with respect to developing
alternate energies in the NWT. Northern energy efficiency, biomass, wind, and solar
innovations are making a difference in living costs. This progress is being driven mainly
by the GNWT and private initiatives.
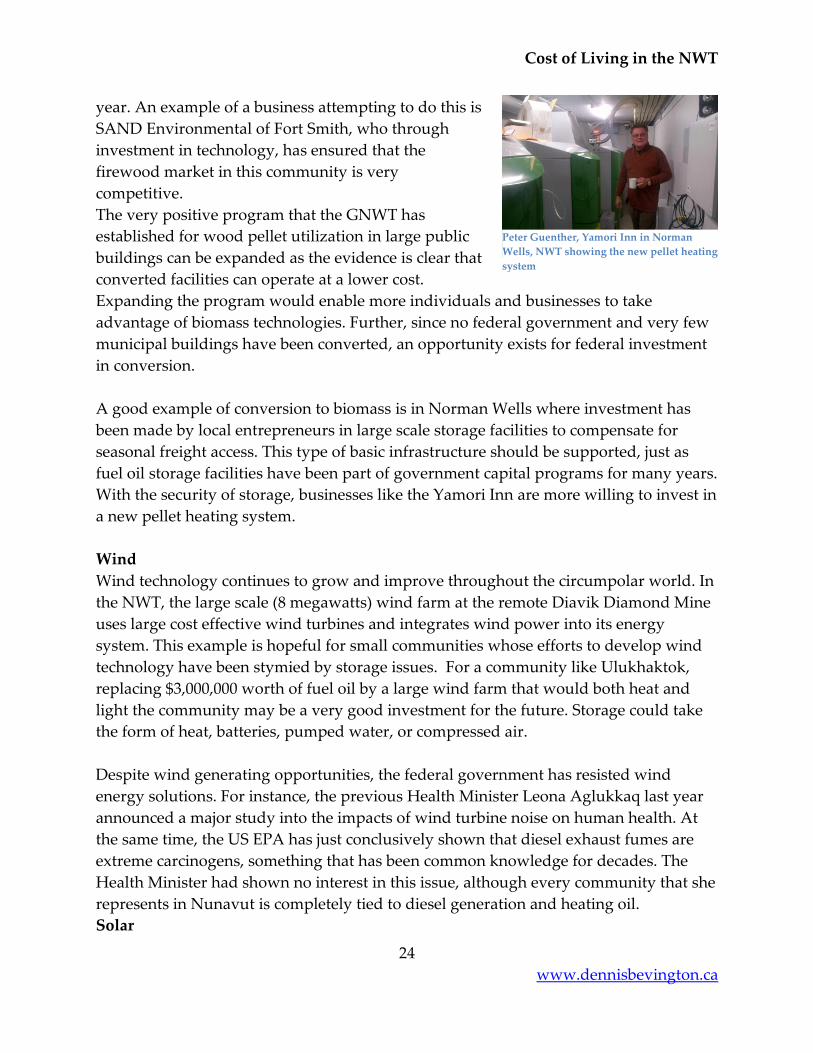
Energy efficiency
Throughout the NWT, the need to upgrade residential and commercial building stock is
urgent. This should be given the highest priority, especially in communities such as
Norman Wells and Inuvik where there have been major
disruptions in energy supply. Initiatives that are seeking to
address these issues should be widely supported. Two
examples of local businesses investing in energy efficiency
are:
1. Energy Wall & Building Products in Yellowknife that
has patented a design for use in new and retrofit
construction that offers a continuous thermo-break
exterior insulation panel system.
2. The Heritage Hotel in Norman Wells that upgraded lighting throughout the
facility to LED and realized a payback within one year.
Biomass
In the past six years, more and more industry, government, and individuals in the NWT
have embraced biomass energy for heating homes, businesses, and institutions. But
more can be done, especially to develop more cost effective local supplies of various
forms of biomass.
Throughout many isolated communities, the costs of firewood have escalated to levels
that are very high (in some cases over $500/cord). Community fire hazard abatement
planning together with creating viable community firewood supply opportunities
require investment. Government supported wood marshalling yards may be one
solution in the medium term to promoting more harvesting at appropriate times of the
Energy Wall and Building
Products in Yellowknife, NWT
Solar panels in Fort Simpson, NWT
Cost of Living in the NWT
24
www.dennisbevington.ca
year. An example of a business attempting to do this is
SAND Environmental of Fort Smith, who through
investment in technology, has ensured that the
firewood market in this community is very
competitive.
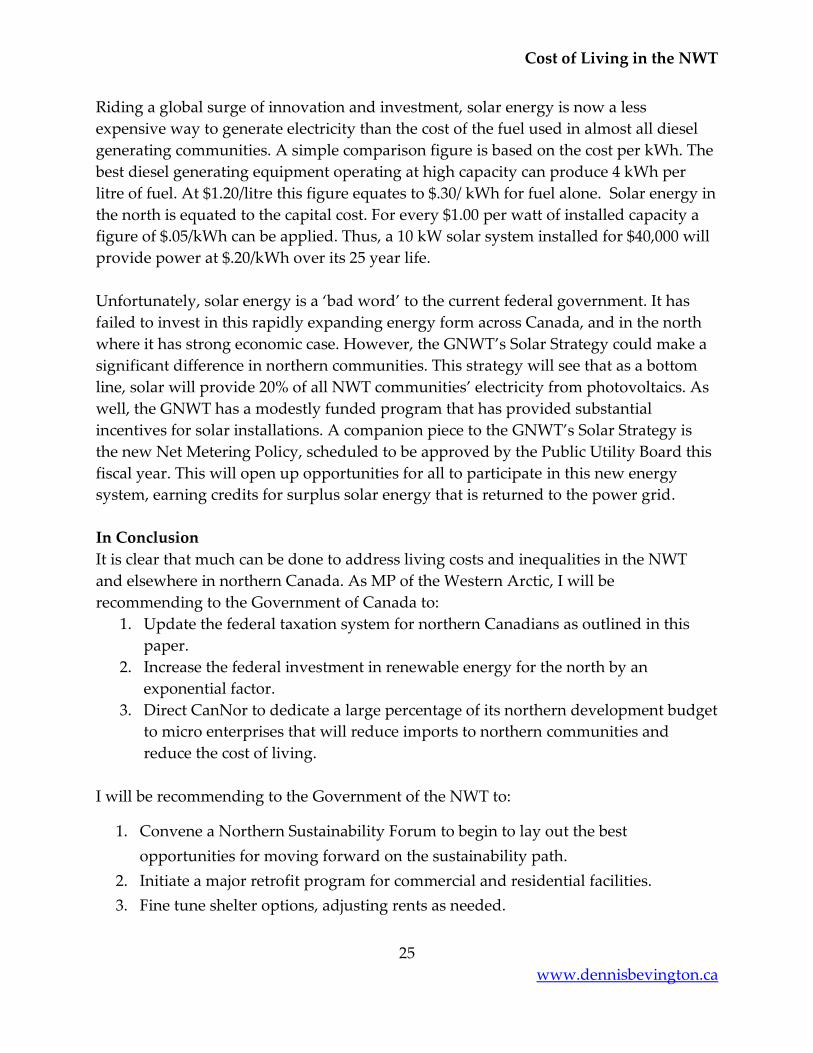
The very positive program that the GNWT has
established for wood pellet utilization in large public
buildings can be expanded as the evidence is clear that
converted facilities can operate at a lower cost.
Expanding the program would enable more individuals and businesses to take
advantage of biomass technologies. Further, since no federal government and very few
municipal buildings have been converted, an opportunity exists for federal investment
in conversion.
A good example of conversion to biomass is in Norman Wells where investment has
been made by local entrepreneurs in large scale storage facilities to compensate for
seasonal freight access. This type of basic infrastructure should be supported, just as
fuel oil storage facilities have been part of government capital programs for many years.
With the security of storage, businesses like the Yamori Inn are more willing to invest in
a new pellet heating system.
Wind
Wind technology continues to grow and improve throughout the circumpolar world. In
the NWT, the large scale (8 megawatts) wind farm at the remote Diavik Diamond Mine
uses large cost effective wind turbines and integrates wind power into its energy
system. This example is hopeful for small communities whose efforts to develop wind
technology have been stymied by storage issues. For a community like Ulukhaktok,
replacing $3,000,000 worth of fuel oil by a large wind farm that would both heat and
light the community may be a very good investment for the future. Storage could take
the form of heat, batteries, pumped water, or compressed air.
Despite wind generating opportunities, the federal government has resisted wind
energy solutions. For instance, the previous Health Minister Leona Aglukkaq last year
announced a major study into the impacts of wind turbine noise on human health. At
the same time, the US EPA has just conclusively shown that diesel exhaust fumes are
extreme carcinogens, something that has been common knowledge for decades. The
Health Minister had shown no interest in this issue, although every community that she
represents in Nunavut is completely tied to diesel generation and heating oil.
Solar
Peter Guenther, Yamori Inn in Norman
Wells, NWT showing the new pellet heating
system
Cost of Living in the NWT
25
www.dennisbevington.ca
Riding a global surge of innovation and investment, solar energy is now a less
expensive way to generate electricity than the cost of the fuel used in almost all diesel
generating communities. A simple comparison figure is based on the cost per kWh. The
best diesel generating equipment operating at high capacity can produce 4 kWh per
litre of fuel. At $1.20/litre this figure equates to $.30/ kWh for fuel alone. Solar energy in
the north is equated to the capital cost. For every $1.00 per watt of installed capacity a
figure of $.05/kWh can be applied. Thus, a 10 kW solar system installed for $40,000 will
provide power at $.20/kWh over its 25 year life.
Unfortunately, solar energy is a ‘bad word’ to the current federal government. It has
failed to invest in this rapidly expanding energy form across Canada, and in the north
where it has strong economic case. However, the GNWT’s Solar Strategy could make a
significant difference in northern communities. This strategy will see that as a bottom
line, solar will provide 20% of all NWT communities’ electricity from photovoltaics. As
well, the GNWT has a modestly funded program that has provided substantial
incentives for solar installations. A companion piece to the GNWT’s Solar Strategy is
the new Net Metering Policy, scheduled to be approved by the Public Utility Board this
fiscal year. This will open up opportunities for all to participate in this new energy
system, earning credits for surplus solar energy that is returned to the power grid.
In Conclusion
It is clear that much can be done to address living costs and inequalities in the NWT
and elsewhere in northern Canada. As MP of the Western Arctic, I will be
recommending to the Government of Canada to:
1. Update the federal taxation system for northern Canadians as outlined in this
paper.
2. Increase the federal investment in renewable energy for the north by an
exponential factor.
3. Direct CanNor to dedicate a large percentage of its northern development budget
to micro enterprises that will reduce imports to northern communities and
reduce the cost of living.
I will be recommending to the Government of the NWT to:
1. Convene a Northern Sustainability Forum to begin to lay out the best
opportunities for moving forward on the sustainability path.
2. Initiate a major retrofit program for commercial and residential facilities.
3. Fine tune shelter options, adjusting rents as needed.
Cost of Living in the NWT
26
www.dennisbevington.ca
4. Invest more in harvesting support programs (e.g., community freezers, mobile
kitchens, equipment) and in supporting cooperatives and credit union that
encourage joint effort and less individual resources.
I will also be:
1. Monitoring the Auditor General’s audit of the Northern Nutrition Program and
keeping northerners apprised to ensure recommendations are actioned.
2. Working with other members of the NDP to continue to advocate for national
food, anti-poverty, housing, and energy strategies and policies.
3. Supporting and advocating both for those community efforts mentioned in this
report but all the others that are working to reduce inequalities.
4. Monitoring the GNWT’s implementation of its anti-poverty and housing
strategies.
Appendix A
1
www.dennisbevington.ca
APPENDIX A: Income and Cost of Living
All northerners have some form of income. Earnings may come from a job, harvesting,
selling things, or some form of support such as a pension or income assistance. In the
NWT, data are mainly collected for earnings from jobs, pensions, and income assistance
but income data are unavailable for communities with less than 100 tax filers. Limited
data are available about earnings that come from harvesting or sale of handmade
products. What we know about income is summarized here.
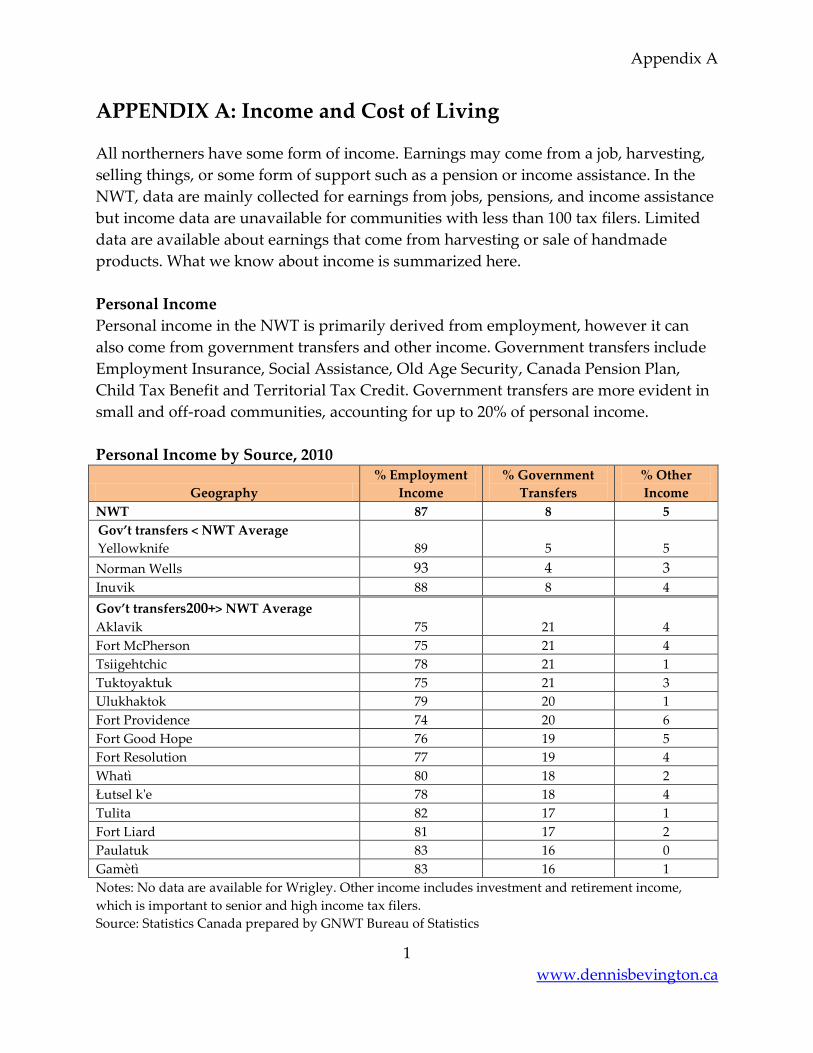
Personal Income
Personal income in the NWT is primarily derived from employment, however it can
also come from government transfers and other income. Government transfers include
Employment Insurance, Social Assistance, Old Age Security, Canada Pension Plan,
Child Tax Benefit and Territorial Tax Credit. Government transfers are more evident in
small and off-road communities, accounting for up to 20% of personal income.
Personal Income by Source, 2010
Geography
% Employment
Income
% Government
Transfers
% Other
Income
NWT 87 8 5
Gov’t transfers < NWT Average
Yellowknife 89 5 5
Norman Wells 93 4 3
Inuvik 88 8 4
Gov’t transfers200+> NWT Average
Aklavik 75 21 4
Fort McPherson 75 21 4
Tsiigehtchic 78 21 1
Tuktoyaktuk 75 21 3
Ulukhaktok 79 20 1
Fort Providence 74 20 6
Fort Good Hope 76 19 5
Fort Resolution 77 19 4
Whatì 80 18 2
Łutsel k'e 78 18 4
Tulita 82 17 1
Fort Liard 81 17 2
Paulatuk 83 16 0
Gamètì 83 16 1
Notes: No data are available for Wrigley. Other income includes investment and retirement income,
which is important to senior and high income tax filers.
Source: Statistics Canada prepared by GNWT Bureau of Statistics
Appendix A
2
www.dennisbevington.ca
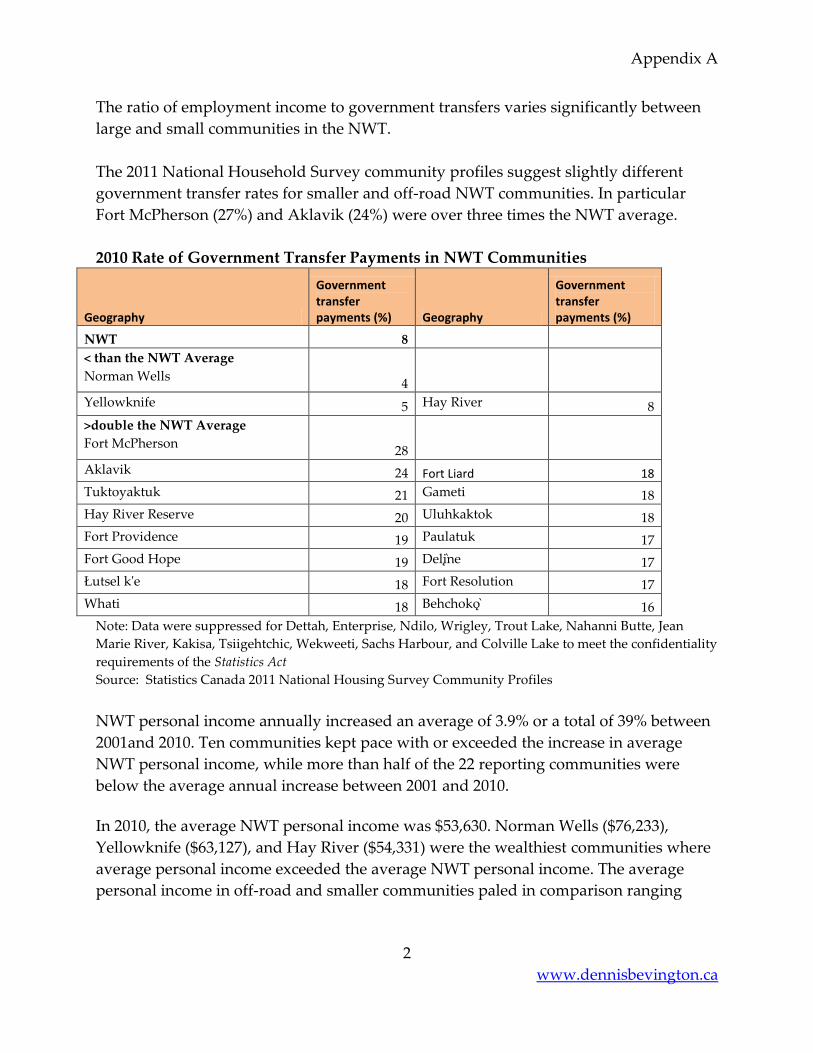
The ratio of employment income to government transfers varies significantly between
large and small communities in the NWT.
The 2011 National Household Survey community profiles suggest slightly different
government transfer rates for smaller and off-road NWT communities. In particular
Fort McPherson (27%) and Aklavik (24%) were over three times the NWT average.
2010 Rate of Government Transfer Payments in NWT Communities
Geography
Government transfer payments (%) Geography
Government transfer payments (%)
NWT 8
< than the NWT Average
Norman Wells 4
Yellowknife 5 Hay River 8
>double the NWT Average
Fort McPherson 28
Aklavik 24 Fort Liard 18
Tuktoyaktuk 21 Gameti 18
Hay River Reserve 20 Uluhkaktok 18
Fort Providence 19 Paulatuk 17
Fort Good Hope 19 Deli ne 17
Łutsel k'e 18 Fort Resolution 17
Whati 18 Behchoko 16
Note: Data were suppressed for Dettah, Enterprise, Ndilo, Wrigley, Trout Lake, Nahanni Butte, Jean
Marie River, Kakisa, Tsiigehtchic, Wekweeti, Sachs Harbour, and Colville Lake to meet the confidentiality
requirements of the Statistics Act
Source: Statistics Canada 2011 National Housing Survey Community Profiles
NWT personal income annually increased an average of 3.9% or a total of 39% between
2001and 2010. Ten communities kept pace with or exceeded the increase in average
NWT personal income, while more than half of the 22 reporting communities were
below the average annual increase between 2001 and 2010.
In 2010, the average NWT personal income was $53,630. Norman Wells ($76,233),
Yellowknife ($63,127), and Hay River ($54,331) were the wealthiest communities where
average personal income exceeded the average NWT personal income. The average
personal income in off-road and smaller communities paled in comparison ranging
Appendix A
3
www.dennisbevington.ca
from $26,341 in Ulukhaktok (49% of the average NWT personal income) to $35,024 in
Tuktoyaktuk (65% of the average NWT personal income).
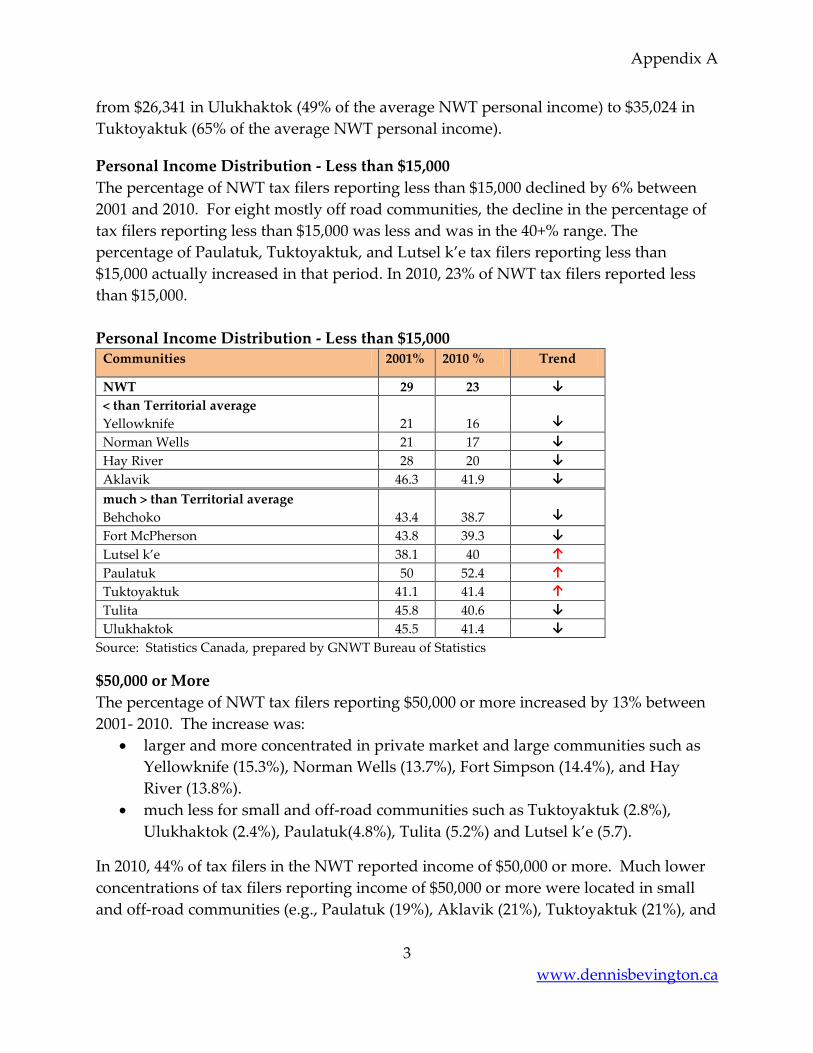
Personal Income Distribution - Less than $15,000
The percentage of NWT tax filers reporting less than $15,000 declined by 6% between
2001 and 2010. For eight mostly off road communities, the decline in the percentage of
tax filers reporting less than $15,000 was less and was in the 40+% range. The
percentage of Paulatuk, Tuktoyaktuk, and Lutsel k’e tax filers reporting less than
$15,000 actually increased in that period. In 2010, 23% of NWT tax filers reported less
than $15,000.
Personal Income Distribution - Less than $15,000 Communities 2001% 2010 % Trend
NWT 29 23 ↓
< than Territorial average
Yellowknife
21
16
↓
Norman Wells 21 17 ↓
Hay River 28 20 ↓
Aklavik 46.3 41.9 ↓
much > than Territorial average
Behchoko
43.4
38.7
↓
Fort McPherson 43.8 39.3 ↓
Lutsel k’e 38.1 40 ↑
Paulatuk 50 52.4 ↑
Tuktoyaktuk 41.1 41.4 ↑
Tulita 45.8 40.6 ↓
Ulukhaktok 45.5 41.4 ↓
Source: Statistics Canada, prepared by GNWT Bureau of Statistics
$50,000 or More
The percentage of NWT tax filers reporting $50,000 or more increased by 13% between
2001- 2010. The increase was:
larger and more concentrated in private market and large communities such as
Yellowknife (15.3%), Norman Wells (13.7%), Fort Simpson (14.4%), and Hay
River (13.8%).
much less for small and off-road communities such as Tuktoyaktuk (2.8%),
Ulukhaktok (2.4%), Paulatuk(4.8%), Tulita (5.2%) and Lutsel k’e (5.7).
In 2010, 44% of tax filers in the NWT reported income of $50,000 or more. Much lower
concentrations of tax filers reporting income of $50,000 or more were located in small
and off-road communities (e.g., Paulatuk (19%), Aklavik (21%), Tuktoyaktuk (21%), and
Appendix A
4
www.dennisbevington.ca
Tulita (22%) compared to higher concentrations in private market and large
communities (e.g., Norman Wells (58%), Yellowknife (55%), and Hay River (46%).
Family Income
Average Family Income
NWT family income increased an average annual 4.2% (or a total of 42%) between 2001-
2010. Increases in this period were spread over NWT communities with:
higher than average increases in family income which was primarily in larger
communities (e.g., Norman Wells (49%), Hay River (45%), Fort Smith
(43%),Yellowknife (42%), Fort Resolution (62%), Fort Simpson (51%); and
lower than average increases in family income which were primarily in off-road
communities such as Aklavik (22%), Ulukhaktok(26%), Paulatuk (23%),Tulita
(27%), and Lutsel k’e (34%).
In 2010, NWT families earned an average $113, 934.43 Family incomes were:
highest in Norman Wells ($150,389), Yellowknife ($138,620), and Hay River
($116,872); and
lowest for many of the smaller and off-road communities44for example,
Ulukhaktok $58,455 (51% below the territorial average), Paulatuk $59,563, Lutsel
k’e $59,625, and Tulita $63,250.
Families Earning More than $75,000
Between 2001 and 2010, 25% more NWT families earned in excess of $75,000. With the
exception of Ulukhaktok, the percentage of families with higher income increased in
each community. In 2010, higher family income was:
highly concentrated (above the NWT average) in private market and
larger centres such as Yellowknife (75%), Hay River (68%), and Norman
Wells (67%); and
sparsely concentrated (half or less of the NWT average) in small and off-
road communities such as Aklavik (28%), Fort Resolution (31%), Lutsel k’e
(25%), Tuktoyaktuk (30%), and Whati (29%).
43 The 2011 National Household Survey Community Profiles reported higher NWT average family
income of $127,512 and higher incomes in each community. 44Paulatuk, Tuktoyaktuk, Ulukhaktok, Sachs Harbour, Coville Lake, Fort Good Hope, Deline, Tulita,
Norman Wells, Trout Lake, Nahanni Butte, Gameti, Whati, Lutsel k’e, and Aklavik.
Appendix A
5
www.dennisbevington.ca
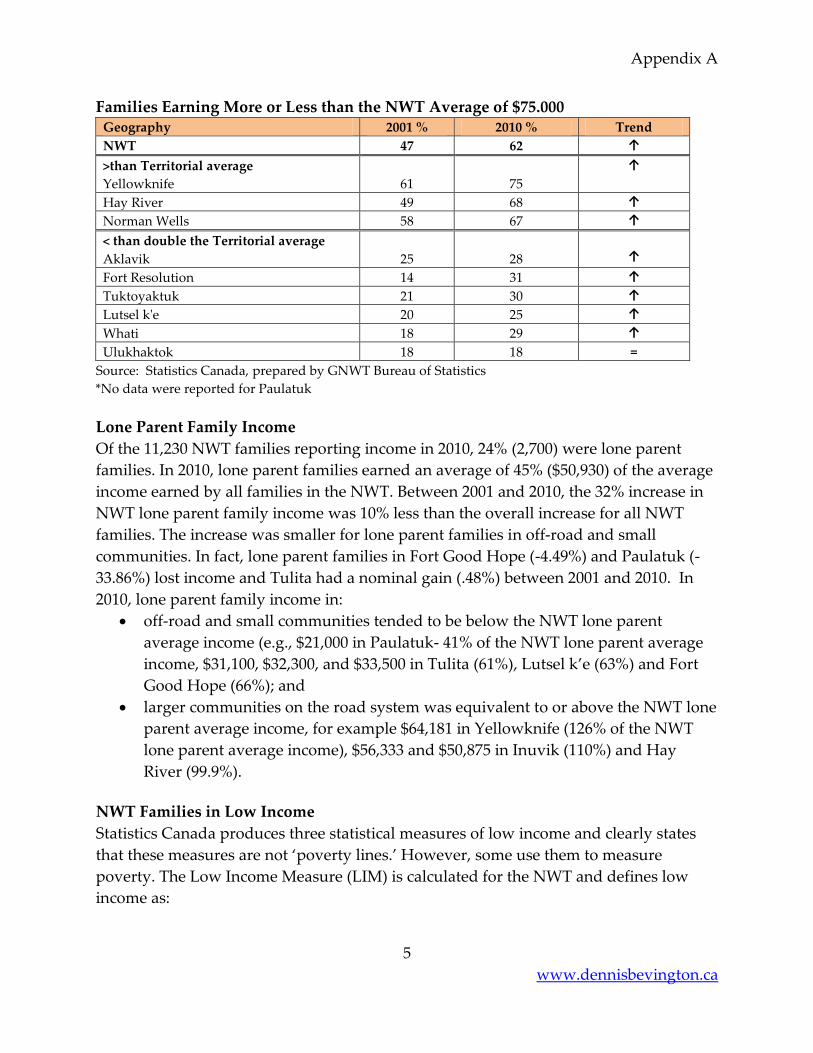
Families Earning More or Less than the NWT Average of $75.000 Geography 2001 % 2010 % Trend
NWT 47 62 ↑
>than Territorial average
Yellowknife 61 75
↑
Hay River 49 68 ↑
Norman Wells 58 67 ↑
< than double the Territorial average
Aklavik 25 28
↑
Fort Resolution 14 31 ↑
Tuktoyaktuk 21 30 ↑
Lutsel k'e 20 25 ↑
Whati 18 29 ↑
Ulukhaktok 18 18 =
Source: Statistics Canada, prepared by GNWT Bureau of Statistics
*No data were reported for Paulatuk
Lone Parent Family Income
Of the 11,230 NWT families reporting income in 2010, 24% (2,700) were lone parent
families. In 2010, lone parent families earned an average of 45% ($50,930) of the average
income earned by all families in the NWT. Between 2001 and 2010, the 32% increase in
NWT lone parent family income was 10% less than the overall increase for all NWT
families. The increase was smaller for lone parent families in off-road and small
communities. In fact, lone parent families in Fort Good Hope (-4.49%) and Paulatuk (-
33.86%) lost income and Tulita had a nominal gain (.48%) between 2001 and 2010. In
2010, lone parent family income in:
off-road and small communities tended to be below the NWT lone parent
average income (e.g., $21,000 in Paulatuk- 41% of the NWT lone parent average
income, $31,100, $32,300, and $33,500 in Tulita (61%), Lutsel k’e (63%) and Fort
Good Hope (66%); and
larger communities on the road system was equivalent to or above the NWT lone
parent average income, for example $64,181 in Yellowknife (126% of the NWT
lone parent average income), $56,333 and $50,875 in Inuvik (110%) and Hay
River (99.9%).
NWT Families in Low Income
Statistics Canada produces three statistical measures of low income and clearly states
that these measures are not ‘poverty lines.’ However, some use them to measure
poverty. The Low Income Measure (LIM) is calculated for the NWT and defines low
income as:
Appendix A
6
www.dennisbevington.ca
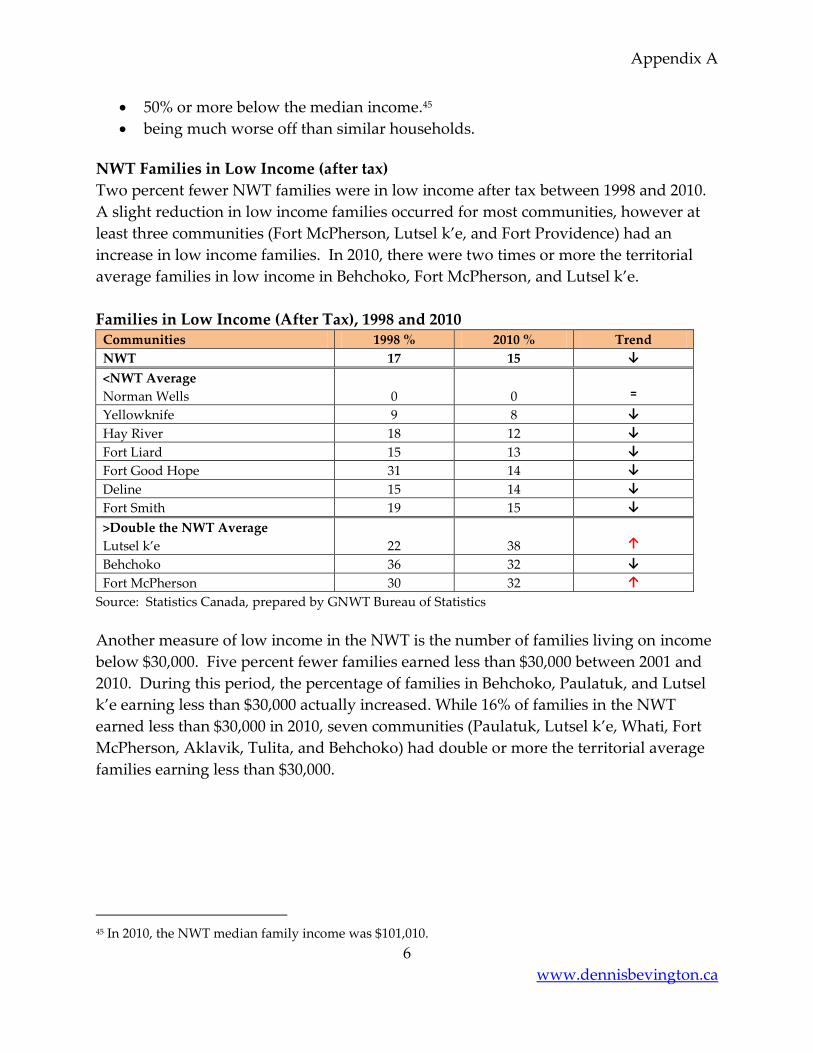
50% or more below the median income.45
being much worse off than similar households.
NWT Families in Low Income (after tax)
Two percent fewer NWT families were in low income after tax between 1998 and 2010.
A slight reduction in low income families occurred for most communities, however at
least three communities (Fort McPherson, Lutsel k’e, and Fort Providence) had an
increase in low income families. In 2010, there were two times or more the territorial
average families in low income in Behchoko, Fort McPherson, and Lutsel k’e.
Families in Low Income (After Tax), 1998 and 2010 Communities 1998 % 2010 % Trend
NWT 17 15 ↓
<NWT Average
Norman Wells
0
0
=
Yellowknife 9 8 ↓
Hay River 18 12 ↓
Fort Liard 15 13 ↓
Fort Good Hope 31 14 ↓
Deline 15 14 ↓
Fort Smith 19 15 ↓
>Double the NWT Average
Lutsel k’e
22
38
↑
Behchoko 36 32 ↓
Fort McPherson 30 32 ↑
Source: Statistics Canada, prepared by GNWT Bureau of Statistics
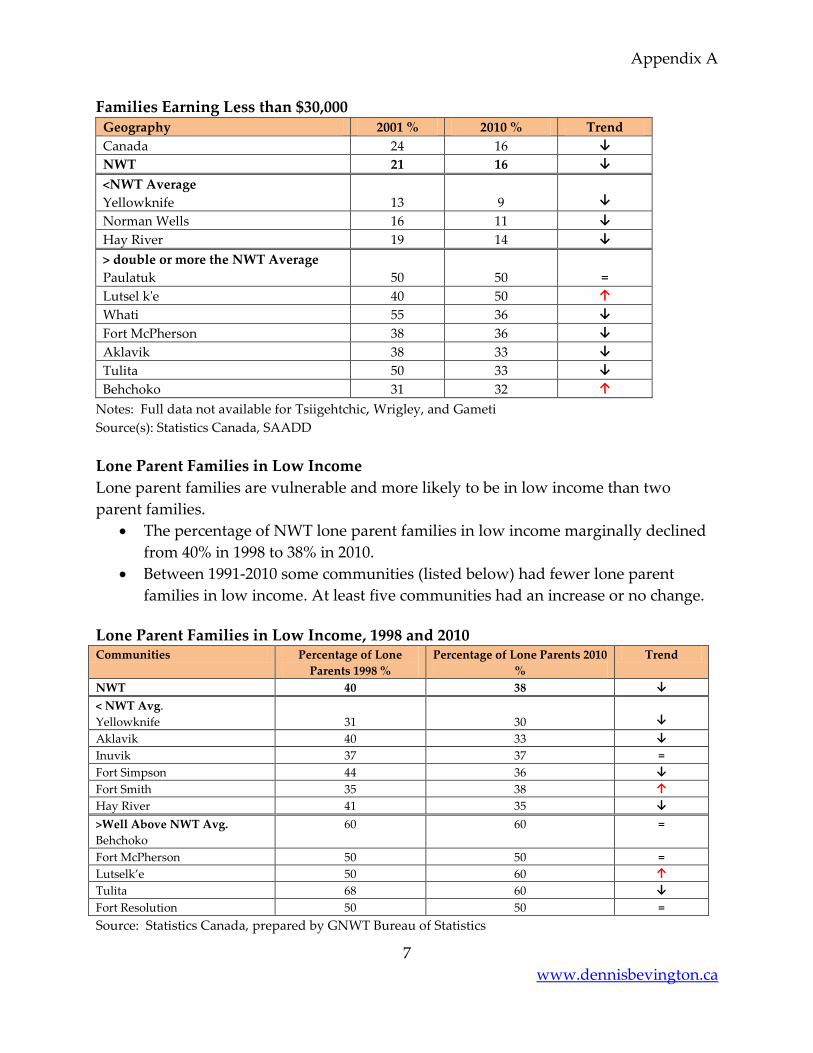
Another measure of low income in the NWT is the number of families living on income
below $30,000. Five percent fewer families earned less than $30,000 between 2001 and
2010. During this period, the percentage of families in Behchoko, Paulatuk, and Lutsel
k’e earning less than $30,000 actually increased. While 16% of families in the NWT
earned less than $30,000 in 2010, seven communities (Paulatuk, Lutsel k’e, Whati, Fort
McPherson, Aklavik, Tulita, and Behchoko) had double or more the territorial average
families earning less than $30,000.
45 In 2010, the NWT median family income was $101,010.
Appendix A
7
www.dennisbevington.ca
Families Earning Less than $30,000 Geography 2001 % 2010 % Trend
Canada 24 16 ↓
NWT 21 16 ↓
<NWT Average
Yellowknife 13 9
↓
Norman Wells 16 11 ↓
Hay River 19 14 ↓
> double or more the NWT Average
Paulatuk 50 50
=
Lutsel k'e 40 50 ↑
Whati 55 36 ↓
Fort McPherson 38 36 ↓
Aklavik 38 33 ↓
Tulita 50 33 ↓
Behchoko 31 32 ↑
Notes: Full data not available for Tsiigehtchic, Wrigley, and Gameti Source(s): Statistics Canada, SAADD
Lone Parent Families in Low Income
Lone parent families are vulnerable and more likely to be in low income than two
parent families.
The percentage of NWT lone parent families in low income marginally declined
from 40% in 1998 to 38% in 2010.
Between 1991-2010 some communities (listed below) had fewer lone parent
families in low income. At least five communities had an increase or no change.
Lone Parent Families in Low Income, 1998 and 2010 Communities Percentage of Lone
Parents 1998 %
Percentage of Lone Parents 2010
%
Trend
NWT 40 38 ↓
< NWT Avg.
Yellowknife
31
30
↓
Aklavik 40 33 ↓
Inuvik 37 37 =
Fort Simpson 44 36 ↓
Fort Smith 35 38 ↑
Hay River 41 35 ↓
>Well Above NWT Avg.
Behchoko
60 60 =
Fort McPherson 50 50 =
Lutselk’e 50 60 ↑
Tulita 68 60 ↓
Fort Resolution 50 50 =
Source: Statistics Canada, prepared by GNWT Bureau of Statistics
Appendix A
8
www.dennisbevington.ca
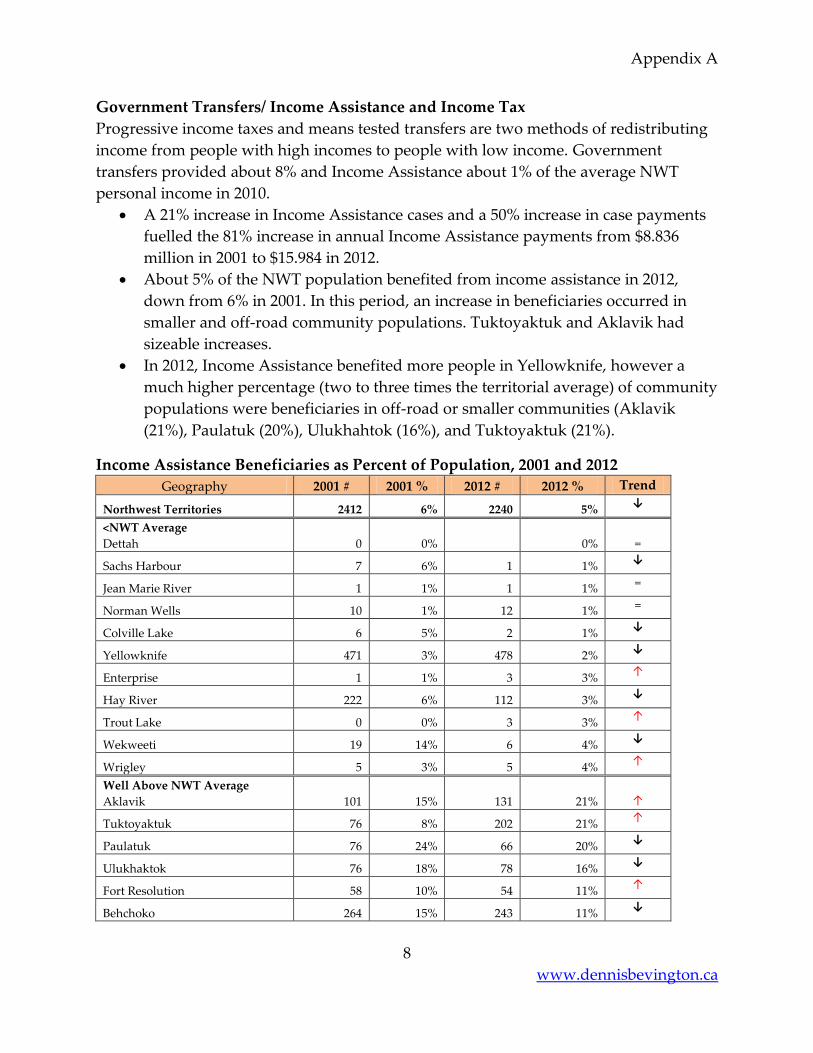
Government Transfers/ Income Assistance and Income Tax
Progressive income taxes and means tested transfers are two methods of redistributing
income from people with high incomes to people with low income. Government
transfers provided about 8% and Income Assistance about 1% of the average NWT
personal income in 2010.
A 21% increase in Income Assistance cases and a 50% increase in case payments
fuelled the 81% increase in annual Income Assistance payments from $8.836
million in 2001 to $15.984 in 2012.
About 5% of the NWT population benefited from income assistance in 2012,
down from 6% in 2001. In this period, an increase in beneficiaries occurred in
smaller and off-road community populations. Tuktoyaktuk and Aklavik had
sizeable increases.
In 2012, Income Assistance benefited more people in Yellowknife, however a
much higher percentage (two to three times the territorial average) of community
populations were beneficiaries in off-road or smaller communities (Aklavik
(21%), Paulatuk (20%), Ulukhahtok (16%), and Tuktoyaktuk (21%).
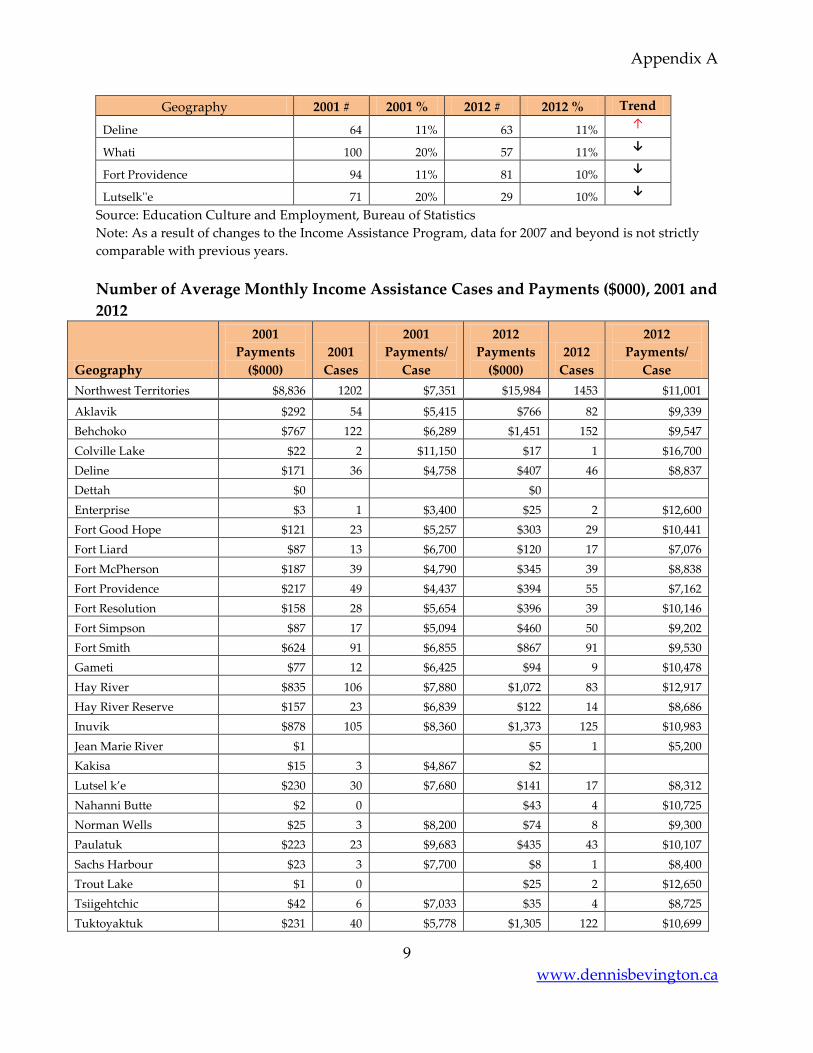
Income Assistance Beneficiaries as Percent of Population, 2001 and 2012
Geography 2001 # 2001 % 2012 # 2012 % Trend
Northwest Territories 2412 6% 2240 5% ↓
<NWT Average
Dettah 0 0% 0%
=
Sachs Harbour 7 6% 1 1% ↓
Jean Marie River 1 1% 1 1% =
Norman Wells 10 1% 12 1% =
Colville Lake 6 5% 2 1% ↓
Yellowknife 471 3% 478 2% ↓
Enterprise 1 1% 3 3% ↑
Hay River 222 6% 112 3% ↓
Trout Lake 0 0% 3 3% ↑
Wekweeti 19 14% 6 4% ↓
Wrigley 5 3% 5 4% ↑
Well Above NWT Average
Aklavik 101 15% 131 21%
↑
Tuktoyaktuk 76 8% 202 21% ↑
Paulatuk 76 24% 66 20% ↓
Ulukhaktok 76 18% 78 16% ↓
Fort Resolution 58 10% 54 11% ↑
Behchoko 264 15% 243 11% ↓
Appendix A
9
www.dennisbevington.ca
Geography 2001 # 2001 % 2012 # 2012 % Trend
Deline 64 11% 63 11% ↑
Whati 100 20% 57 11% ↓
Fort Providence 94 11% 81 10% ↓
Lutselk''e 71 20% 29 10% ↓
Source: Education Culture and Employment, Bureau of Statistics
Note: As a result of changes to the Income Assistance Program, data for 2007 and beyond is not strictly
comparable with previous years.
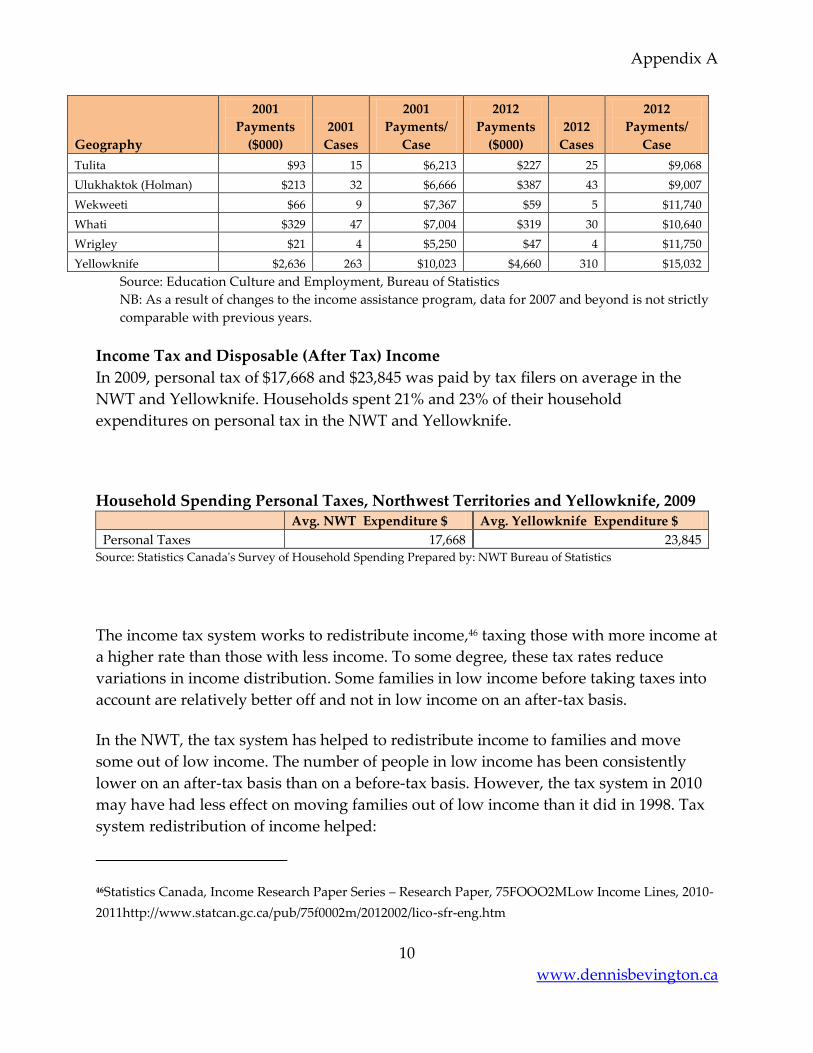
Number of Average Monthly Income Assistance Cases and Payments ($000), 2001 and
2012
Geography
2001
Payments
($000)
2001
Cases
2001
Payments/
Case
2012
Payments
($000)
2012
Cases
2012
Payments/
Case
Northwest Territories $8,836 1202 $7,351 $15,984 1453 $11,001
Aklavik $292 54 $5,415 $766 82 $9,339
Behchoko $767 122 $6,289 $1,451 152 $9,547
Colville Lake $22 2 $11,150 $17 1 $16,700
Deline $171 36 $4,758 $407 46 $8,837
Dettah $0
$0
Enterprise $3 1 $3,400 $25 2 $12,600
Fort Good Hope $121 23 $5,257 $303 29 $10,441
Fort Liard $87 13 $6,700 $120 17 $7,076
Fort McPherson $187 39 $4,790 $345 39 $8,838
Fort Providence $217 49 $4,437 $394 55 $7,162
Fort Resolution $158 28 $5,654 $396 39 $10,146
Fort Simpson $87 17 $5,094 $460 50 $9,202
Fort Smith $624 91 $6,855 $867 91 $9,530
Gameti $77 12 $6,425 $94 9 $10,478
Hay River $835 106 $7,880 $1,072 83 $12,917
Hay River Reserve $157 23 $6,839 $122 14 $8,686
Inuvik $878 105 $8,360 $1,373 125 $10,983
Jean Marie River $1
$5 1 $5,200
Kakisa $15 3 $4,867 $2
Lutsel k’e $230 30 $7,680 $141 17 $8,312
Nahanni Butte $2 0
$43 4 $10,725
Norman Wells $25 3 $8,200 $74 8 $9,300
Paulatuk $223 23 $9,683 $435 43 $10,107
Sachs Harbour $23 3 $7,700 $8 1 $8,400
Trout Lake $1 0
$25 2 $12,650
Tsiigehtchic $42 6 $7,033 $35 4 $8,725
Tuktoyaktuk $231 40 $5,778 $1,305 122 $10,699
Appendix A
10
www.dennisbevington.ca
Geography
2001
Payments
($000)
2001
Cases
2001
Payments/
Case
2012
Payments
($000)
2012
Cases
2012
Payments/
Case
Tulita $93 15 $6,213 $227 25 $9,068
Ulukhaktok (Holman) $213 32 $6,666 $387 43 $9,007
Wekweeti $66 9 $7,367 $59 5 $11,740
Whati $329 47 $7,004 $319 30 $10,640
Wrigley $21 4 $5,250 $47 4 $11,750
Yellowknife $2,636 263 $10,023 $4,660 310 $15,032
Source: Education Culture and Employment, Bureau of Statistics
NB: As a result of changes to the income assistance program, data for 2007 and beyond is not strictly
comparable with previous years.
Income Tax and Disposable (After Tax) Income
In 2009, personal tax of $17,668 and $23,845 was paid by tax filers on average in the
NWT and Yellowknife. Households spent 21% and 23% of their household
expenditures on personal tax in the NWT and Yellowknife.
Household Spending Personal Taxes, Northwest Territories and Yellowknife, 2009 Avg. NWT Expenditure $ Avg. Yellowknife Expenditure $
Personal Taxes 17,668 23,845
Source: Statistics Canada's Survey of Household Spending Prepared by: NWT Bureau of Statistics
The income tax system works to redistribute income,46 taxing those with more income at
a higher rate than those with less income. To some degree, these tax rates reduce
variations in income distribution. Some families in low income before taking taxes into
account are relatively better off and not in low income on an after-tax basis.
In the NWT, the tax system has helped to redistribute income to families and move
some out of low income. The number of people in low income has been consistently
lower on an after-tax basis than on a before-tax basis. However, the tax system in 2010
may have had less effect on moving families out of low income than it did in 1998. Tax
system redistribution of income helped:
46Statistics Canada, Income Research Paper Series – Research Paper, 75FOOO2MLow Income Lines, 2010-
2011http://www.statcan.gc.ca/pub/75f0002m/2012002/lico-sfr-eng.htm
Appendix A
11
www.dennisbevington.ca
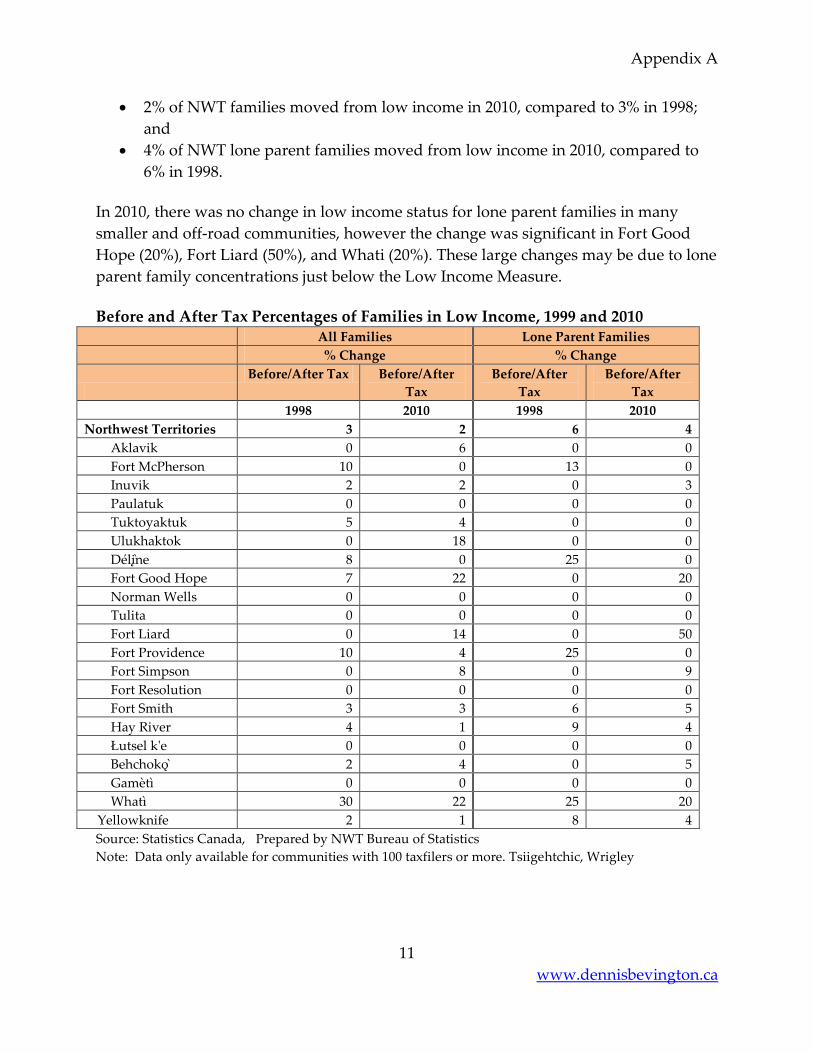
2% of NWT families moved from low income in 2010, compared to 3% in 1998;
and
4% of NWT lone parent families moved from low income in 2010, compared to
6% in 1998.
In 2010, there was no change in low income status for lone parent families in many
smaller and off-road communities, however the change was significant in Fort Good
Hope (20%), Fort Liard (50%), and Whati (20%). These large changes may be due to lone
parent family concentrations just below the Low Income Measure.
Before and After Tax Percentages of Families in Low Income, 1999 and 2010
All Families Lone Parent Families
% Change % Change
Before/After Tax Before/After
Tax
Before/After
Tax
Before/After
Tax
1998 2010 1998 2010
Northwest Territories 3 2 6 4
Aklavik 0 6 0 0
Fort McPherson 10 0 13 0
Inuvik 2 2 0 3
Paulatuk 0 0 0 0
Tuktoyaktuk 5 4 0 0
Ulukhaktok 0 18 0 0
Déli ne 8 0 25 0
Fort Good Hope 7 22 0 20
Norman Wells 0 0 0 0
Tulita 0 0 0 0
Fort Liard 0 14 0 50
Fort Providence 10 4 25 0
Fort Simpson 0 8 0 9
Fort Resolution 0 0 0 0
Fort Smith 3 3 6 5
Hay River 4 1 9 4
Łutsel k'e 0 0 0 0
Behchoko 2 4 0 5
Gamètì 0 0 0 0
Whatì 30 22 25 20
Yellowknife 2 1 8 4
Source: Statistics Canada, Prepared by NWT Bureau of Statistics
Note: Data only available for communities with 100 taxfilers or more. Tsiigehtchic, Wrigley
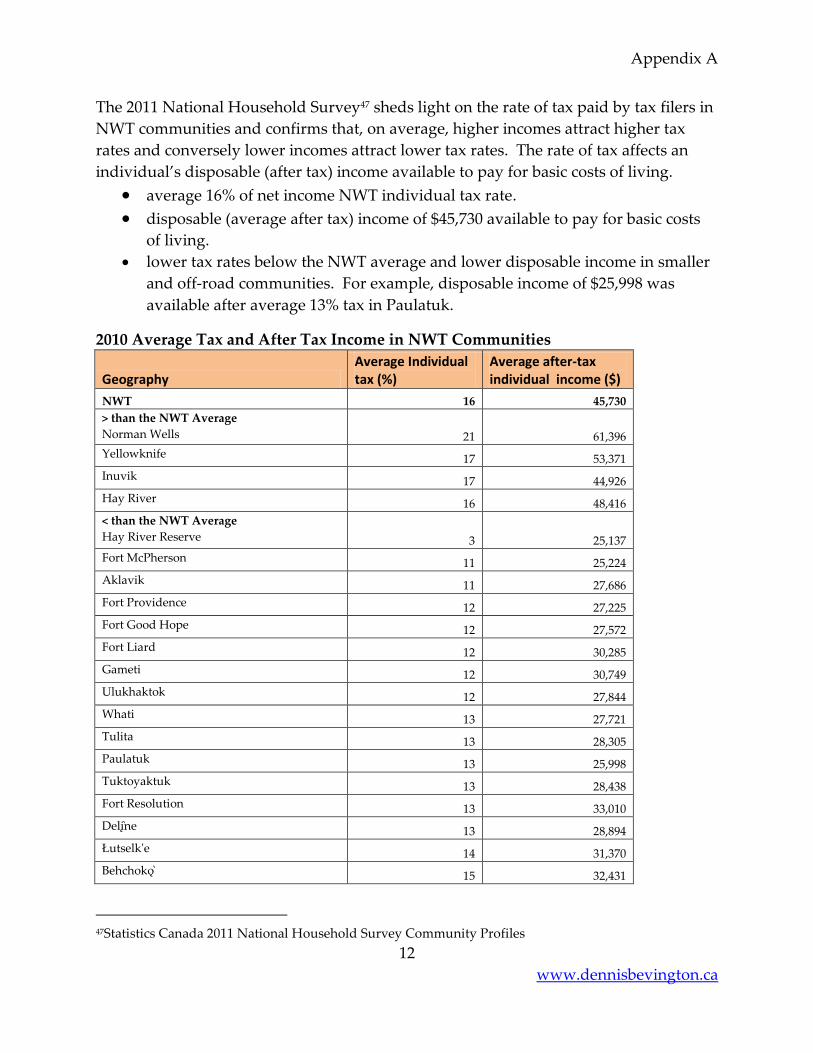
Appendix A
12
www.dennisbevington.ca
The 2011 National Household Survey47 sheds light on the rate of tax paid by tax filers in
NWT communities and confirms that, on average, higher incomes attract higher tax
rates and conversely lower incomes attract lower tax rates. The rate of tax affects an
individual’s disposable (after tax) income available to pay for basic costs of living.
average 16% of net income NWT individual tax rate. disposable (average after tax) income of $45,730 available to pay for basic costs
of living. lower tax rates below the NWT average and lower disposable income in smaller
and off-road communities. For example, disposable income of $25,998 was
available after average 13% tax in Paulatuk.
2010 Average Tax and After Tax Income in NWT Communities
Geography Average Individual tax (%)
Average after-tax individual income ($)
NWT 16 45,730
> than the NWT Average
Norman Wells 21 61,396
Yellowknife 17 53,371
Inuvik 17 44,926
Hay River 16 48,416
< than the NWT Average
Hay River Reserve 3 25,137
Fort McPherson 11 25,224
Aklavik 11 27,686
Fort Providence 12 27,225
Fort Good Hope 12 27,572
Fort Liard 12 30,285
Gameti 12 30,749
Ulukhaktok 12 27,844
Whati 13 27,721
Tulita 13 28,305
Paulatuk 13 25,998
Tuktoyaktuk 13 28,438
Fort Resolution 13 33,010
Deli ne 13 28,894
Łutselk'e 14 31,370
Behchoko 15 32,431
47Statistics Canada 2011 National Household Survey Community Profiles
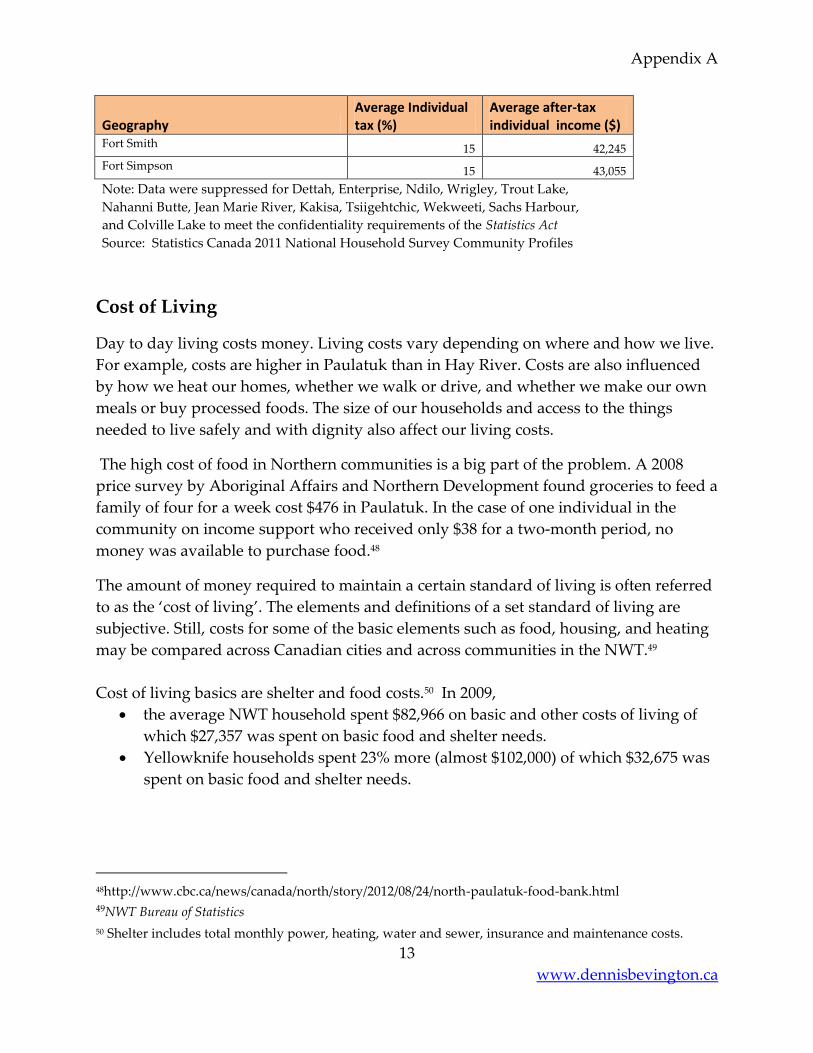
Appendix A
13
www.dennisbevington.ca
Geography Average Individual tax (%)
Average after-tax individual income ($)
Fort Smith 15 42,245
Fort Simpson 15 43,055
Note: Data were suppressed for Dettah, Enterprise, Ndilo, Wrigley, Trout Lake,
Nahanni Butte, Jean Marie River, Kakisa, Tsiigehtchic, Wekweeti, Sachs Harbour,
and Colville Lake to meet the confidentiality requirements of the Statistics Act
Source: Statistics Canada 2011 National Household Survey Community Profiles
Cost of Living
Day to day living costs money. Living costs vary depending on where and how we live.
For example, costs are higher in Paulatuk than in Hay River. Costs are also influenced
by how we heat our homes, whether we walk or drive, and whether we make our own
meals or buy processed foods. The size of our households and access to the things
needed to live safely and with dignity also affect our living costs.
The high cost of food in Northern communities is a big part of the problem. A 2008
price survey by Aboriginal Affairs and Northern Development found groceries to feed a
family of four for a week cost $476 in Paulatuk. In the case of one individual in the
community on income support who received only $38 for a two-month period, no
money was available to purchase food.48
The amount of money required to maintain a certain standard of living is often referred
to as the ‘cost of living’. The elements and definitions of a set standard of living are
subjective. Still, costs for some of the basic elements such as food, housing, and heating
may be compared across Canadian cities and across communities in the NWT.49
Cost of living basics are shelter and food costs.50 In 2009,
the average NWT household spent $82,966 on basic and other costs of living of
which $27,357 was spent on basic food and shelter needs.
Yellowknife households spent 23% more (almost $102,000) of which $32,675 was
spent on basic food and shelter needs.
48http://www.cbc.ca/news/canada/north/story/2012/08/24/north-paulatuk-food-bank.html 49NWT Bureau of Statistics 50 Shelter includes total monthly power, heating, water and sewer, insurance and maintenance costs.
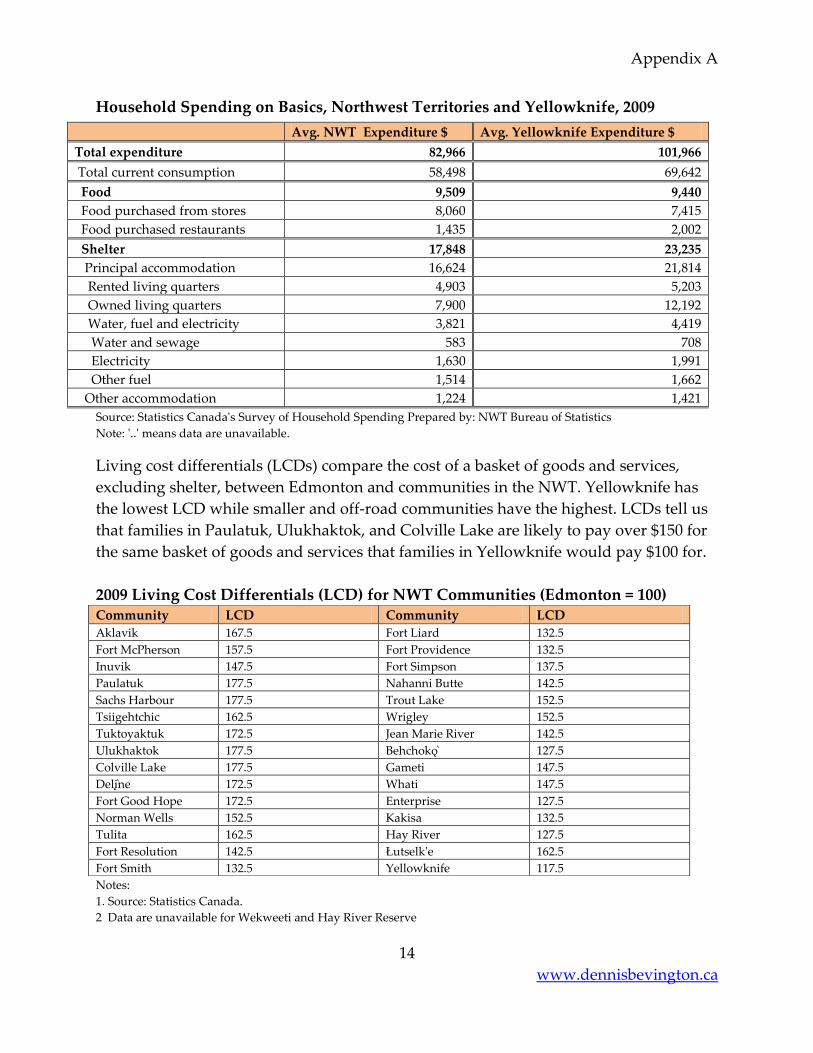
Appendix A
14
www.dennisbevington.ca
Household Spending on Basics, Northwest Territories and Yellowknife, 2009
Avg. NWT Expenditure $ Avg. Yellowknife Expenditure $
Total expenditure 82,966 101,966
Total current consumption 58,498 69,642
Food 9,509 9,440
Food purchased from stores 8,060 7,415
Food purchased restaurants 1,435 2,002
Shelter 17,848 23,235
Principal accommodation 16,624 21,814
Rented living quarters 4,903 5,203
Owned living quarters 7,900 12,192
Water, fuel and electricity 3,821 4,419
Water and sewage 583 708
Electricity 1,630 1,991
Other fuel 1,514 1,662
Other accommodation 1,224 1,421
Source: Statistics Canada's Survey of Household Spending Prepared by: NWT Bureau of Statistics
Note: '..' means data are unavailable.
Living cost differentials (LCDs) compare the cost of a basket of goods and services,
excluding shelter, between Edmonton and communities in the NWT. Yellowknife has
the lowest LCD while smaller and off-road communities have the highest. LCDs tell us
that families in Paulatuk, Ulukhaktok, and Colville Lake are likely to pay over $150 for
the same basket of goods and services that families in Yellowknife would pay $100 for.
2009 Living Cost Differentials (LCD) for NWT Communities (Edmonton = 100)
Notes:
1. Source: Statistics Canada.
2 Data are unavailable for Wekweeti and Hay River Reserve
Community LCD Community LCD
Aklavik 167.5 Fort Liard 132.5
Fort McPherson 157.5 Fort Providence 132.5
Inuvik 147.5 Fort Simpson 137.5
Paulatuk 177.5 Nahanni Butte 142.5
Sachs Harbour 177.5 Trout Lake 152.5
Tsiigehtchic 162.5 Wrigley 152.5
Tuktoyaktuk 172.5 Jean Marie River 142.5
Ulukhaktok 177.5 Behchoko 127.5
Colville Lake 177.5 Gameti 147.5
Deli ne 172.5 Whati 147.5
Fort Good Hope 172.5 Enterprise 127.5
Norman Wells 152.5 Kakisa 132.5
Tulita 162.5 Hay River 127.5
Fort Resolution 142.5 Łutselk'e 162.5
Fort Smith 132.5 Yellowknife 117.5
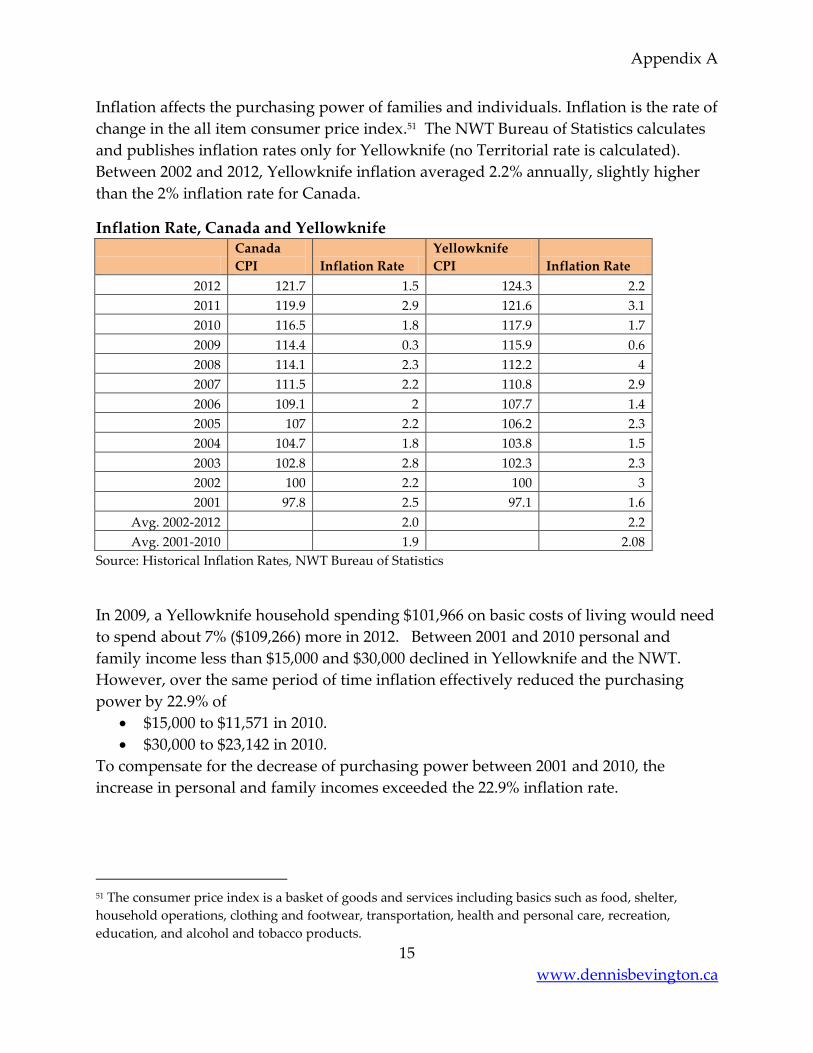
Appendix A
15
www.dennisbevington.ca
Inflation affects the purchasing power of families and individuals. Inflation is the rate of
change in the all item consumer price index.51 The NWT Bureau of Statistics calculates
and publishes inflation rates only for Yellowknife (no Territorial rate is calculated).
Between 2002 and 2012, Yellowknife inflation averaged 2.2% annually, slightly higher
than the 2% inflation rate for Canada.
Inflation Rate, Canada and Yellowknife
Canada
CPI Inflation Rate
Yellowknife
CPI Inflation Rate
2012 121.7 1.5 124.3 2.2
2011 119.9 2.9 121.6 3.1
2010 116.5 1.8 117.9 1.7
2009 114.4 0.3 115.9 0.6
2008 114.1 2.3 112.2 4
2007 111.5 2.2 110.8 2.9
2006 109.1 2 107.7 1.4
2005 107 2.2 106.2 2.3
2004 104.7 1.8 103.8 1.5
2003 102.8 2.8 102.3 2.3
2002 100 2.2 100 3
2001 97.8 2.5 97.1 1.6
Avg. 2002-2012 2.0
2.2
Avg. 2001-2010
1.9
2.08
Source: Historical Inflation Rates, NWT Bureau of Statistics
In 2009, a Yellowknife household spending $101,966 on basic costs of living would need
to spend about 7% ($109,266) more in 2012. Between 2001 and 2010 personal and
family income less than $15,000 and $30,000 declined in Yellowknife and the NWT.
However, over the same period of time inflation effectively reduced the purchasing
power by 22.9% of
$15,000 to $11,571 in 2010.
$30,000 to $23,142 in 2010.
To compensate for the decrease of purchasing power between 2001 and 2010, the
increase in personal and family incomes exceeded the 22.9% inflation rate.
51 The consumer price index is a basket of goods and services including basics such as food, shelter,
household operations, clothing and footwear, transportation, health and personal care, recreation,
education, and alcohol and tobacco products.
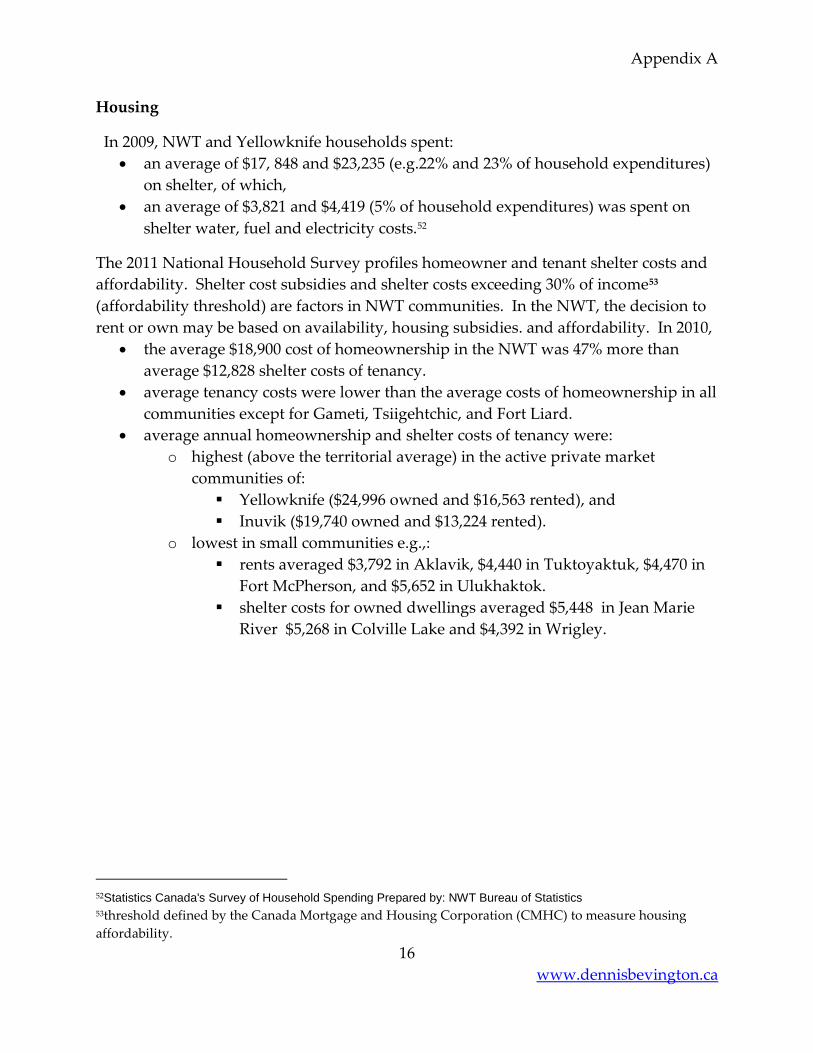
Appendix A
16
www.dennisbevington.ca
Housing
In 2009, NWT and Yellowknife households spent:
an average of $17, 848 and $23,235 (e.g.22% and 23% of household expenditures)
on shelter, of which,
an average of $3,821 and $4,419 (5% of household expenditures) was spent on
shelter water, fuel and electricity costs.52
The 2011 National Household Survey profiles homeowner and tenant shelter costs and
affordability. Shelter cost subsidies and shelter costs exceeding 30% of income53
(affordability threshold) are factors in NWT communities. In the NWT, the decision to
rent or own may be based on availability, housing subsidies. and affordability. In 2010,
the average $18,900 cost of homeownership in the NWT was 47% more than
average $12,828 shelter costs of tenancy.
average tenancy costs were lower than the average costs of homeownership in all
communities except for Gameti, Tsiigehtchic, and Fort Liard.
average annual homeownership and shelter costs of tenancy were:
o highest (above the territorial average) in the active private market
communities of:
Yellowknife ($24,996 owned and $16,563 rented), and
Inuvik ($19,740 owned and $13,224 rented).
o lowest in small communities e.g.,:
rents averaged $3,792 in Aklavik, $4,440 in Tuktoyaktuk, $4,470 in
Fort McPherson, and $5,652 in Ulukhaktok.
shelter costs for owned dwellings averaged $5,448 in Jean Marie
River $5,268 in Colville Lake and $4,392 in Wrigley.
52Statistics Canada's Survey of Household Spending Prepared by: NWT Bureau of Statistics 53threshold defined by the Canada Mortgage and Housing Corporation (CMHC) to measure housing
affordability.
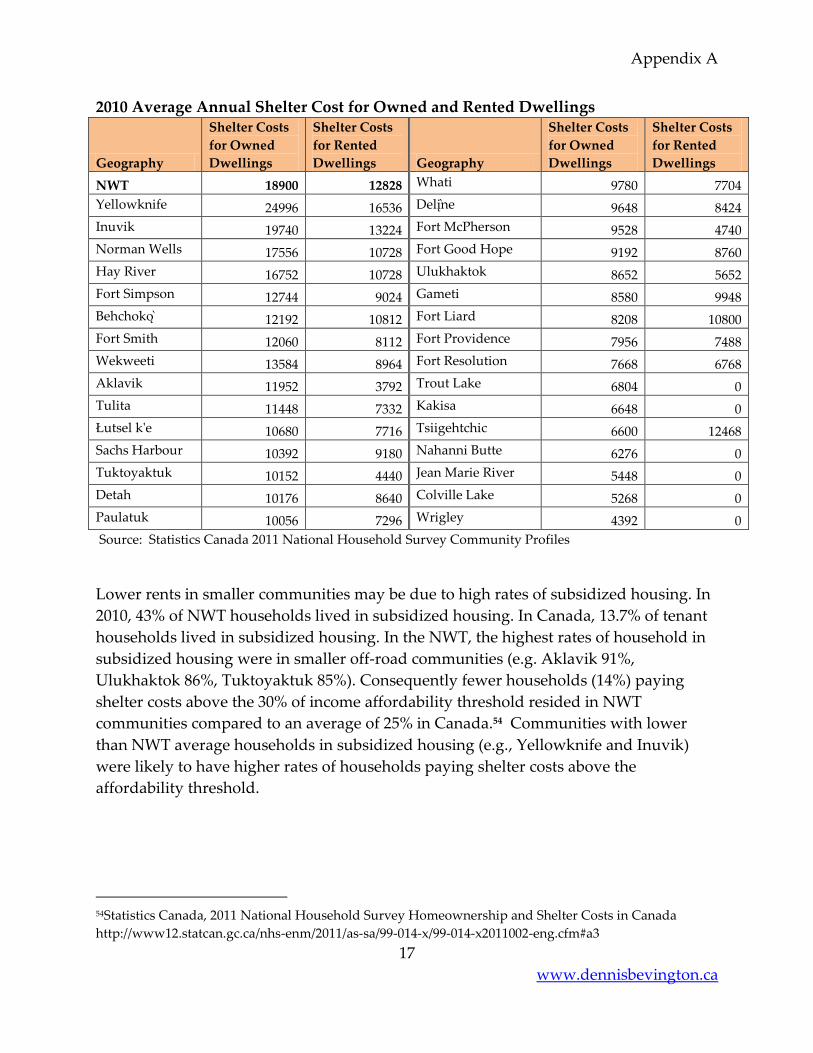
Appendix A
17
www.dennisbevington.ca
2010 Average Annual Shelter Cost for Owned and Rented Dwellings
Geography
Shelter Costs
for Owned
Dwellings
Shelter Costs
for Rented
Dwellings Geography
Shelter Costs
for Owned
Dwellings
Shelter Costs
for Rented
Dwellings
NWT 18900 12828 Whati 9780 7704
Yellowknife 24996 16536 Deli ne 9648 8424
Inuvik 19740 13224 Fort McPherson 9528 4740
Norman Wells 17556 10728 Fort Good Hope 9192 8760
Hay River 16752 10728 Ulukhaktok 8652 5652
Fort Simpson 12744 9024 Gameti 8580 9948
Behchoko 12192 10812 Fort Liard 8208 10800
Fort Smith 12060 8112 Fort Providence 7956 7488
Wekweeti 13584 8964 Fort Resolution 7668 6768
Aklavik 11952 3792 Trout Lake 6804 0
Tulita 11448 7332 Kakisa 6648 0
Łutsel k'e 10680 7716 Tsiigehtchic 6600 12468
Sachs Harbour 10392 9180 Nahanni Butte 6276 0
Tuktoyaktuk 10152 4440 Jean Marie River 5448 0
Detah 10176 8640 Colville Lake 5268 0
Paulatuk 10056 7296 Wrigley 4392 0
Source: Statistics Canada 2011 National Household Survey Community Profiles
Lower rents in smaller communities may be due to high rates of subsidized housing. In
2010, 43% of NWT households lived in subsidized housing. In Canada, 13.7% of tenant
households lived in subsidized housing. In the NWT, the highest rates of household in
subsidized housing were in smaller off-road communities (e.g. Aklavik 91%,
Ulukhaktok 86%, Tuktoyaktuk 85%). Consequently fewer households (14%) paying
shelter costs above the 30% of income affordability threshold resided in NWT
communities compared to an average of 25% in Canada.54 Communities with lower
than NWT average households in subsidized housing (e.g., Yellowknife and Inuvik)
were likely to have higher rates of households paying shelter costs above the
affordability threshold.
54Statistics Canada, 2011 National Household Survey Homeownership and Shelter Costs in Canada
http://www12.statcan.gc.ca/nhs-enm/2011/as-sa/99-014-x/99-014-x2011002-eng.cfm#a3

Appendix A
18
www.dennisbevington.ca
2010 Tenants Households in Subsidized Housing and Households Spending > 30% of
Income on Shelter Costs
Geography
% of tenant
households in
subsidized
housing
> than 30% of
income on
shelter costs Geography
% of tenant
households in
subsidized
housing
> than 30% of
income on
shelter costs
NWT 43 14 Fort Smith 51 11
Yellowknife 29 16 Hay River 42 12
Inuvik 41 19 Fort Liard 40 13
Norman Wells 49 6 Fort Providence 61 13
Aklavik 91 7 Fort Simpson 60 12
Fort McPherson 83 x Jean Marie River 0 x
Paulatuk 71 17 Nahanni Butte 0 x
Sachs Harbour 83 x Trout Lake 0 x
Tsiigehtchic 60 x Wrigley 0 x
Tuktoyaktuk 85 10 Behchoko 56 x
Ulukhaktok 86 7 Gameti 50 0
Colville Lake 0 x Wekweeti 0 x
Deli ne 81 13 Whati 58 8
Fort Good Hope 60 15 Dettah 75 x
Tulita 82 14 Fort Resolution 47 11
Łutsel k'e 77 19 Kakisa 0 x
Source: Statistics Canada 2011 National Household Survey Community Profiles
Northerners have three main shelter options: homeownership, private rental, and
public housing.
Homeownership
The core need income threshold (CNIT) is an income limit for each community that
represents the amount of income a household must have to afford the cost of owning
and operating a home or renting in the private market without government assistance.
The CNIT formula55 ensures that mortgage and shelter cost do not exceed 30% of
income.56 CNITS are also calculated for one person, two, four, and five bedroom houses
and range from around $50,000 for one person on K'atlodeeche First Nation to $180,000
for a five bedroom in Ulukhaktok. Annual shelter costs (e.g. power, heat, taxes, water,
55 Mortgage cost (total construction and land cost) amortized over 25 years at 5.69% interest compounded
semi-annually + shelter costs 56 NWT Housing Corporation http://nwthc.gov.nt.ca/_live/pages/wpPages/HCNIT.aspx
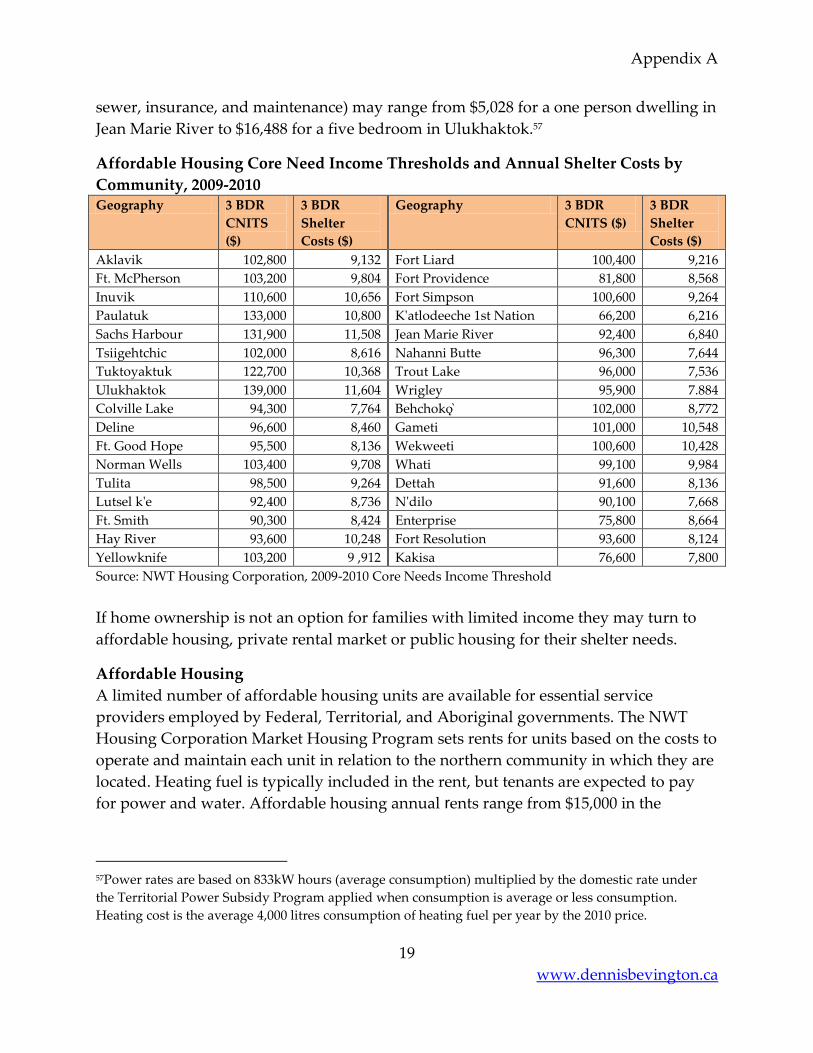
Appendix A
19
www.dennisbevington.ca
sewer, insurance, and maintenance) may range from $5,028 for a one person dwelling in
Jean Marie River to $16,488 for a five bedroom in Ulukhaktok.57
Affordable Housing Core Need Income Thresholds and Annual Shelter Costs by
Community, 2009-2010 Geography 3 BDR
CNITS
($)
3 BDR
Shelter
Costs ($)
Geography 3 BDR
CNITS ($)
3 BDR
Shelter
Costs ($)
Aklavik 102,800 9,132 Fort Liard 100,400 9,216
Ft. McPherson 103,200 9,804 Fort Providence 81,800 8,568
Inuvik 110,600 10,656 Fort Simpson 100,600 9,264
Paulatuk 133,000 10,800 K'atlodeeche 1st Nation 66,200 6,216
Sachs Harbour 131,900 11,508 Jean Marie River 92,400 6,840
Tsiigehtchic 102,000 8,616 Nahanni Butte 96,300 7,644
Tuktoyaktuk 122,700 10,368 Trout Lake 96,000 7,536
Ulukhaktok 139,000 11,604 Wrigley 95,900 7.884
Colville Lake 94,300 7,764 Behchoko 102,000 8,772
Deline 96,600 8,460 Gameti 101,000 10,548
Ft. Good Hope 95,500 8,136 Wekweeti 100,600 10,428
Norman Wells 103,400 9,708 Whati 99,100 9,984
Tulita 98,500 9,264 Dettah 91,600 8,136
Lutsel k'e 92,400 8,736 N'dilo 90,100 7,668
Ft. Smith 90,300 8,424 Enterprise 75,800 8,664
Hay River 93,600 10,248 Fort Resolution 93,600 8,124
Yellowknife 103,200 9 ,912 Kakisa 76,600 7,800
Source: NWT Housing Corporation, 2009-2010 Core Needs Income Threshold
If home ownership is not an option for families with limited income they may turn to
affordable housing, private rental market or public housing for their shelter needs.
Affordable Housing
A limited number of affordable housing units are available for essential service
providers employed by Federal, Territorial, and Aboriginal governments. The NWT
Housing Corporation Market Housing Program sets rents for units based on the costs to
operate and maintain each unit in relation to the northern community in which they are
located. Heating fuel is typically included in the rent, but tenants are expected to pay
for power and water. Affordable housing annual rents range from $15,000 in the
57Power rates are based on 833kW hours (average consumption) multiplied by the domestic rate under
the Territorial Power Subsidy Program applied when consumption is average or less consumption.
Heating cost is the average 4,000 litres consumption of heating fuel per year by the 2010 price.
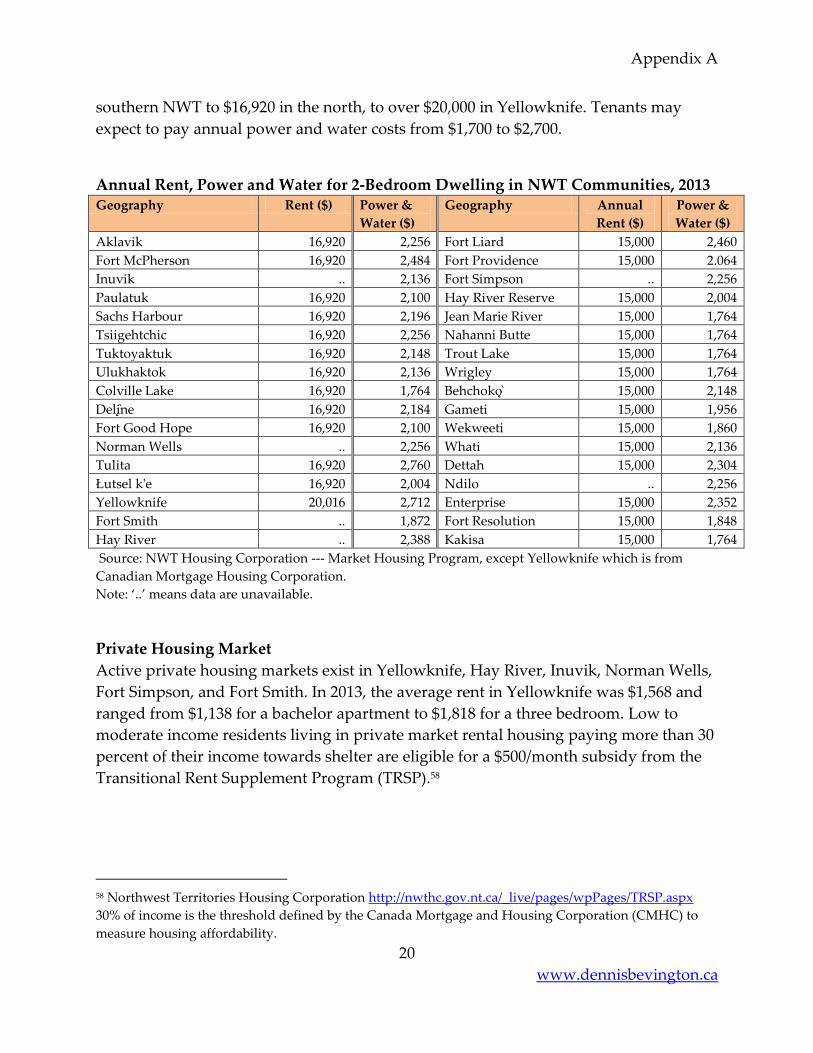
Appendix A
20
www.dennisbevington.ca
southern NWT to $16,920 in the north, to over $20,000 in Yellowknife. Tenants may
expect to pay annual power and water costs from $1,700 to $2,700.
Annual Rent, Power and Water for 2‐Bedroom Dwelling in NWT Communities, 2013 Geography Rent ($) Power &
Water ($)
Geography Annual
Rent ($)
Power &
Water ($)
Aklavik 16,920 2,256 Fort Liard 15,000 2,460
Fort McPherson 16,920 2,484 Fort Providence 15,000 2.064
Inuvik .. 2,136 Fort Simpson .. 2,256
Paulatuk 16,920 2,100 Hay River Reserve 15,000 2,004
Sachs Harbour 16,920 2,196 Jean Marie River 15,000 1,764
Tsiigehtchic 16,920 2,256 Nahanni Butte 15,000 1,764
Tuktoyaktuk 16,920 2,148 Trout Lake 15,000 1,764
Ulukhaktok 16,920 2,136 Wrigley 15,000 1,764
Colville Lake 16,920 1,764 Behchoko 15,000 2,148
Deli ne 16,920 2,184 Gameti 15,000 1,956
Fort Good Hope 16,920 2,100 Wekweeti 15,000 1,860
Norman Wells .. 2,256 Whati 15,000 2,136
Tulita 16,920 2,760 Dettah 15,000 2,304
Łutsel k'e 16,920 2,004 Ndilo .. 2,256
Yellowknife 20,016 2,712 Enterprise 15,000 2,352
Fort Smith .. 1,872 Fort Resolution 15,000 1,848
Hay River .. 2,388 Kakisa 15,000 1,764
Source: NWT Housing Corporation --‐ Market Housing Program, except Yellowknife which is from
Canadian Mortgage Housing Corporation.
Note: ‘..’ means data are unavailable.
Private Housing Market
Active private housing markets exist in Yellowknife, Hay River, Inuvik, Norman Wells,
Fort Simpson, and Fort Smith. In 2013, the average rent in Yellowknife was $1,568 and
ranged from $1,138 for a bachelor apartment to $1,818 for a three bedroom. Low to
moderate income residents living in private market rental housing paying more than 30
percent of their income towards shelter are eligible for a $500/month subsidy from the
Transitional Rent Supplement Program (TRSP).58
58 Northwest Territories Housing Corporation http://nwthc.gov.nt.ca/_live/pages/wpPages/TRSP.aspx
30% of income is the threshold defined by the Canada Mortgage and Housing Corporation (CMHC) to
measure housing affordability.
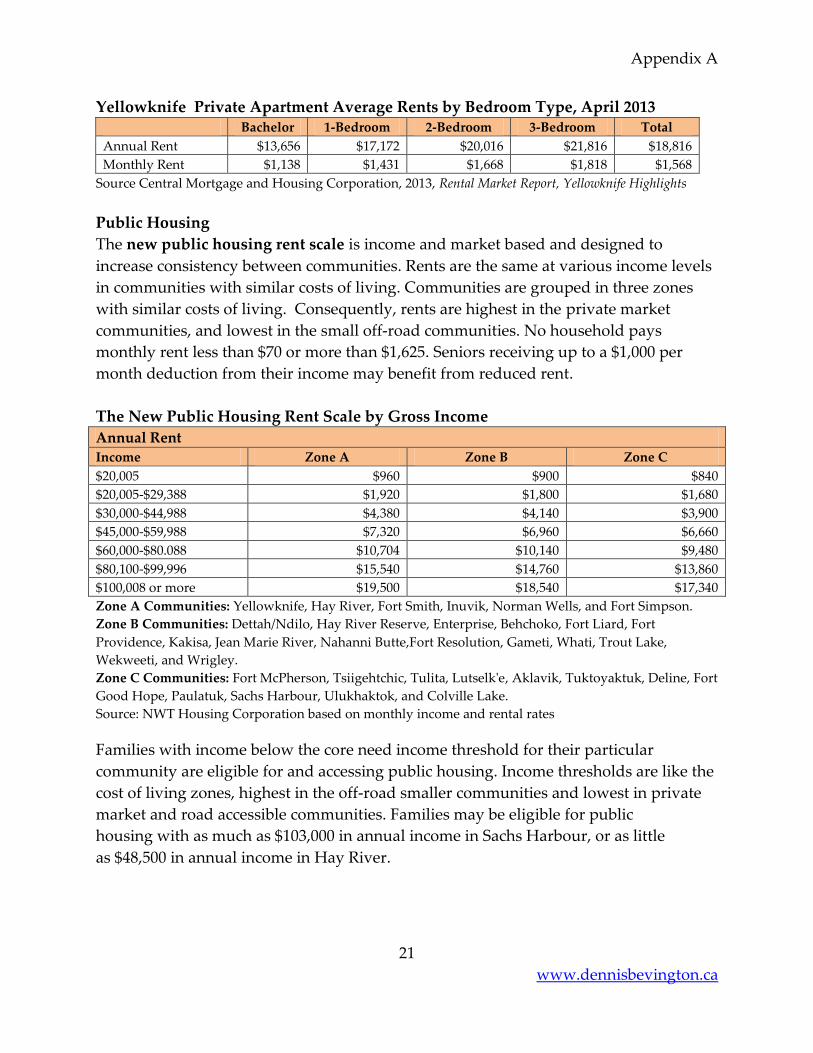
Appendix A
21
www.dennisbevington.ca
Yellowknife Private Apartment Average Rents by Bedroom Type, April 2013 Bachelor 1-Bedroom 2-Bedroom 3-Bedroom Total
Annual Rent $13,656 $17,172 $20,016 $21,816 $18,816
Monthly Rent $1,138 $1,431 $1,668 $1,818 $1,568
Source Central Mortgage and Housing Corporation, 2013, Rental Market Report, Yellowknife Highlights
Public Housing
The new public housing rent scale is income and market based and designed to
increase consistency between communities. Rents are the same at various income levels
in communities with similar costs of living. Communities are grouped in three zones
with similar costs of living. Consequently, rents are highest in the private market
communities, and lowest in the small off-road communities. No household pays
monthly rent less than $70 or more than $1,625. Seniors receiving up to a $1,000 per
month deduction from their income may benefit from reduced rent.
The New Public Housing Rent Scale by Gross Income
Annual Rent
Income Zone A Zone B Zone C
$20,005 $960 $900 $840
$20,005-$29,388 $1,920 $1,800 $1,680
$30,000-$44,988 $4,380 $4,140 $3,900
$45,000-$59,988 $7,320 $6,960 $6,660
$60,000-$80.088 $10,704 $10,140 $9,480
$80,100-$99,996 $15,540 $14,760 $13,860
$100,008 or more $19,500 $18,540 $17,340
Zone A Communities: Yellowknife, Hay River, Fort Smith, Inuvik, Norman Wells, and Fort Simpson.
Zone B Communities: Dettah/Ndilo, Hay River Reserve, Enterprise, Behchoko, Fort Liard, Fort
Providence, Kakisa, Jean Marie River, Nahanni Butte,Fort Resolution, Gameti, Whati, Trout Lake,
Wekweeti, and Wrigley.
Zone C Communities: Fort McPherson, Tsiigehtchic, Tulita, Lutselk'e, Aklavik, Tuktoyaktuk, Deline, Fort
Good Hope, Paulatuk, Sachs Harbour, Ulukhaktok, and Colville Lake.
Source: NWT Housing Corporation based on monthly income and rental rates
Families with income below the core need income threshold for their particular
community are eligible for and accessing public housing. Income thresholds are like the
cost of living zones, highest in the off-road smaller communities and lowest in private
market and road accessible communities. Families may be eligible for public
housing with as much as $103,000 in annual income in Sachs Harbour, or as little
as $48,500 in annual income in Hay River.
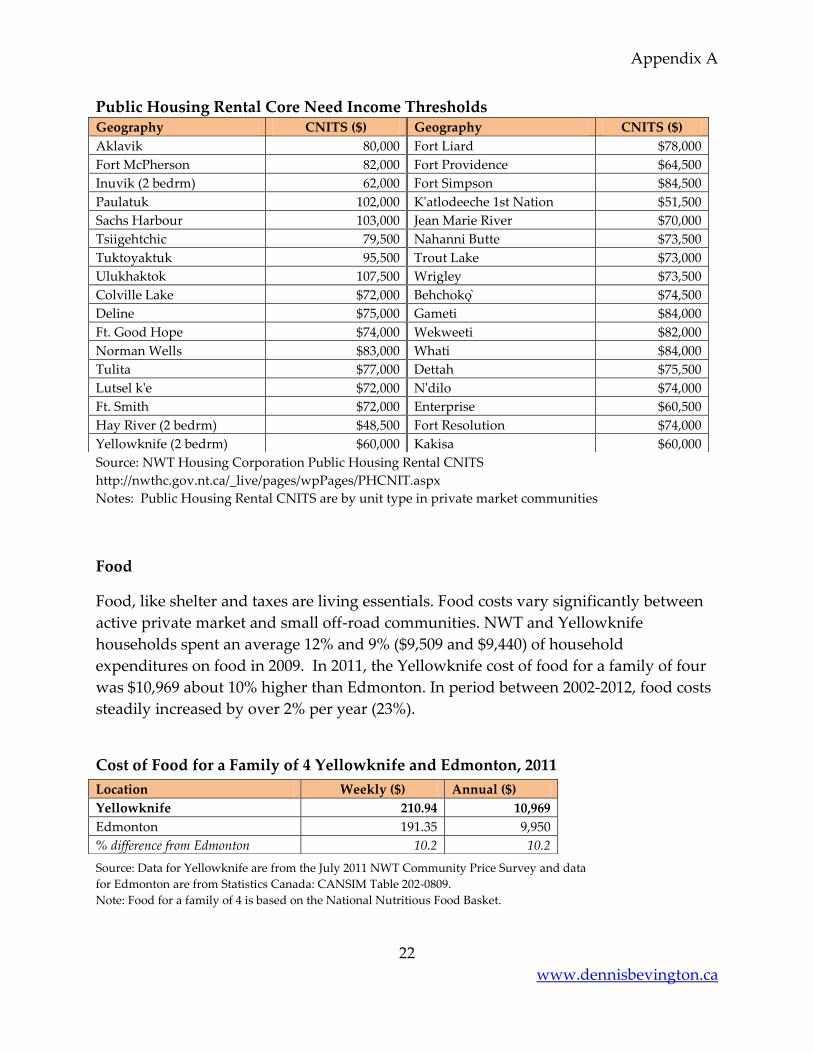
Appendix A
22
www.dennisbevington.ca
Public Housing Rental Core Need Income Thresholds
Source: NWT Housing Corporation Public Housing Rental CNITS
http://nwthc.gov.nt.ca/_live/pages/wpPages/PHCNIT.aspx Notes: Public Housing Rental CNITS are by unit type in private market communities
Food
Food, like shelter and taxes are living essentials. Food costs vary significantly between
active private market and small off-road communities. NWT and Yellowknife
households spent an average 12% and 9% ($9,509 and $9,440) of household
expenditures on food in 2009. In 2011, the Yellowknife cost of food for a family of four
was $10,969 about 10% higher than Edmonton. In period between 2002-2012, food costs
steadily increased by over 2% per year (23%).
Cost of Food for a Family of 4 Yellowknife and Edmonton, 2011
Source: Data for Yellowknife are from the July 2011 NWT Community Price Survey and data
for Edmonton are from Statistics Canada: CANSIM Table 202-0809.
Note: Food for a family of 4 is based on the National Nutritious Food Basket.
Geography CNITS ($) Geography CNITS ($)
Aklavik 80,000 Fort Liard $78,000
Fort McPherson 82,000 Fort Providence $64,500
Inuvik (2 bedrm) 62,000 Fort Simpson $84,500
Paulatuk 102,000 K'atlodeeche 1st Nation $51,500
Sachs Harbour 103,000 Jean Marie River $70,000
Tsiigehtchic 79,500 Nahanni Butte $73,500
Tuktoyaktuk 95,500 Trout Lake $73,000
Ulukhaktok 107,500 Wrigley $73,500
Colville Lake $72,000 Behchoko $74,500
Deline $75,000 Gameti $84,000
Ft. Good Hope $74,000 Wekweeti $82,000
Norman Wells $83,000 Whati $84,000
Tulita $77,000 Dettah $75,500
Lutsel k'e $72,000 N'dilo $74,000
Ft. Smith $72,000 Enterprise $60,500
Hay River (2 bedrm) $48,500 Fort Resolution $74,000
Yellowknife (2 bedrm) $60,000 Kakisa $60,000
Location Weekly ($) Annual ($)
Yellowknife 210.94 10,969
Edmonton 191.35 9,950
% difference from Edmonton 10.2 10.2
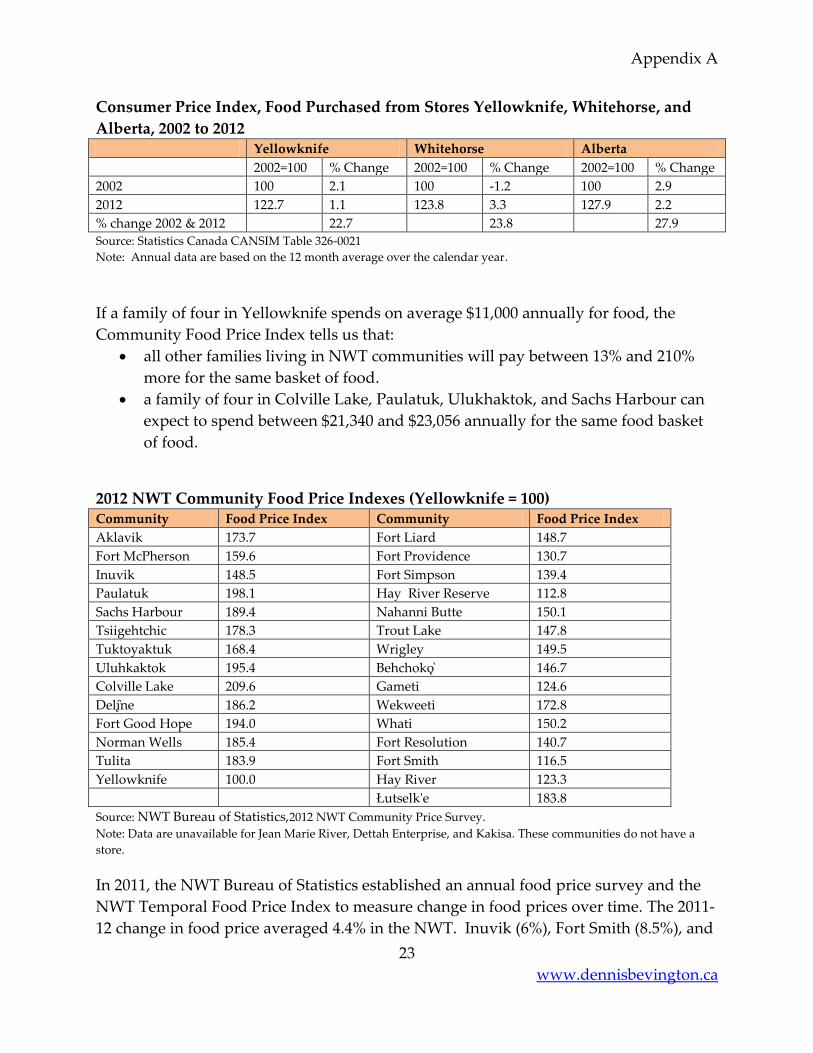
Appendix A
23
www.dennisbevington.ca
Consumer Price Index, Food Purchased from Stores Yellowknife, Whitehorse, and
Alberta, 2002 to 2012 Yellowknife Whitehorse Alberta
2002=100 % Change 2002=100 % Change 2002=100 % Change
2002 100 2.1 100 -1.2 100 2.9
2012 122.7 1.1 123.8 3.3 127.9 2.2
% change 2002 & 2012 22.7 23.8 27.9
Source: Statistics Canada CANSIM Table 326-0021
Note: Annual data are based on the 12 month average over the calendar year.
If a family of four in Yellowknife spends on average $11,000 annually for food, the
Community Food Price Index tells us that:
all other families living in NWT communities will pay between 13% and 210%
more for the same basket of food.
a family of four in Colville Lake, Paulatuk, Ulukhaktok, and Sachs Harbour can
expect to spend between $21,340 and $23,056 annually for the same food basket
of food.
2012 NWT Community Food Price Indexes (Yellowknife = 100) Community Food Price Index Community Food Price Index
Aklavik 173.7 Fort Liard 148.7
Fort McPherson 159.6 Fort Providence 130.7
Inuvik 148.5 Fort Simpson 139.4
Paulatuk 198.1 Hay River Reserve 112.8
Sachs Harbour 189.4 Nahanni Butte 150.1
Tsiigehtchic 178.3 Trout Lake 147.8
Tuktoyaktuk 168.4 Wrigley 149.5
Uluhkaktok 195.4 Behchoko 146.7
Colville Lake 209.6 Gameti 124.6
Deli ne 186.2 Wekweeti 172.8
Fort Good Hope 194.0 Whati 150.2
Norman Wells 185.4 Fort Resolution 140.7
Tulita 183.9 Fort Smith 116.5
Yellowknife 100.0 Hay River 123.3
Łutselk'e 183.8
Source: NWT Bureau of Statistics,2012 NWT Community Price Survey.
Note: Data are unavailable for Jean Marie River, Dettah Enterprise, and Kakisa. These communities do not have a
store.
In 2011, the NWT Bureau of Statistics established an annual food price survey and the
NWT Temporal Food Price Index to measure change in food prices over time. The 2011-
12 change in food price averaged 4.4% in the NWT. Inuvik (6%), Fort Smith (8.5%), and
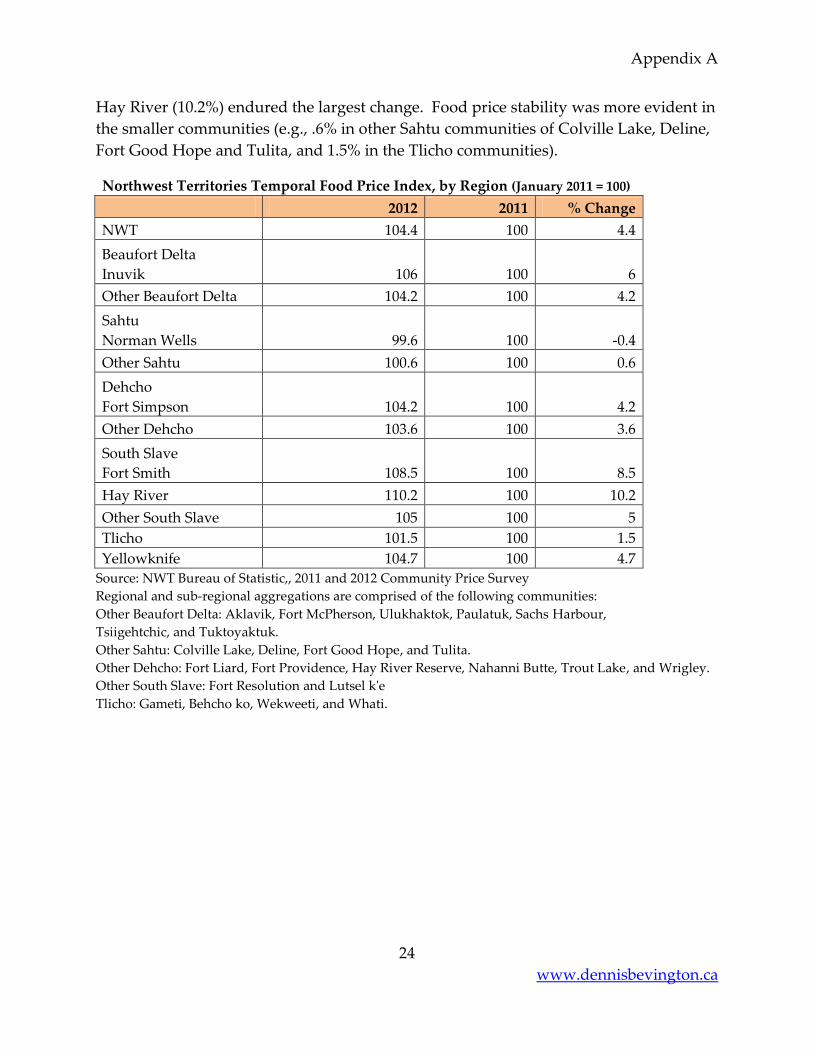
Appendix A
24
www.dennisbevington.ca
Hay River (10.2%) endured the largest change. Food price stability was more evident in
the smaller communities (e.g., .6% in other Sahtu communities of Colville Lake, Deline,
Fort Good Hope and Tulita, and 1.5% in the Tlicho communities).
Northwest Territories Temporal Food Price Index, by Region (January 2011 = 100)
2012 2011 % Change
NWT 104.4 100 4.4
Beaufort Delta
Inuvik 106 100 6
Other Beaufort Delta 104.2 100 4.2
Sahtu
Norman Wells 99.6 100 -0.4
Other Sahtu 100.6 100 0.6
Dehcho
Fort Simpson 104.2 100 4.2
Other Dehcho 103.6 100 3.6
South Slave
Fort Smith 108.5 100 8.5
Hay River 110.2 100 10.2
Other South Slave 105 100 5
Tlicho 101.5 100 1.5
Yellowknife 104.7 100 4.7
Source: NWT Bureau of Statistic,, 2011 and 2012 Community Price Survey
Regional and sub-regional aggregations are comprised of the following communities:
Other Beaufort Delta: Aklavik, Fort McPherson, Ulukhaktok, Paulatuk, Sachs Harbour,
Tsiigehtchic, and Tuktoyaktuk.
Other Sahtu: Colville Lake, Deline, Fort Good Hope, and Tulita.
Other Dehcho: Fort Liard, Fort Providence, Hay River Reserve, Nahanni Butte, Trout Lake, and Wrigley.
Other South Slave: Fort Resolution and Lutsel k'e
Tlicho: Gameti, Behcho ko, Wekweeti, and Whati.


![[Philip Bevington, D. Keith Robinson] Data Reducti(BookFi.org)](https://img.pdfslide.net/doc/110x75/55cf9739550346d033905810/philip-bevington-d-keith-robinson-data-reductibookfiorg.jpg)