Embed Size (px)
Citation preview
1
Tailings and Mine Waste Management for the 21st Century 2015
Paper Number: 52
Review of static and seismic stability of a cross-valley sand tailings embankment in a high rainfall, high seismicity setting
P.J. Chapman1, B.P. Wrench2, M.J. Gowan3
1. Associate, Senior Tailings Engineer, Golder Associates Pty Ltd, 1 Havelock Street, West Perth, Western Australia, 6005. Email: [email protected] 2. Principal, Principal Tailings Engineer, Golder Associates Pty Ltd, 570 – 588 Swan Street, Richmond, Victoria, 3121. Email: [email protected] 3. Principal, Principal Tailings Engineer, Golder Associates Pty Ltd, 147 Coronation Drive, Milton, Queensland, 4064. Email: [email protected]
2
ABSTRACT Embankment dams constructed mainly of sand or non-plastic fine soils are susceptible to liquefaction,
particularly in high rainfall, high seismicity environments where there is sufficient water to saturate the
materials, and sufficient energy from the earthquake to cause liquefaction. This paper shows the process
adopted to review the stability of an existing cross-valley centerline-raised cyclone tailings sand embankment
dam. The study shows that two-dimensional stability analyses did not sufficiently capture the potential for
instability and that three-dimensional modelling was required to provide a reasonable representation.
The study showed that two-dimensional stability analyses did not sufficiently capture the potential for
instability, over-estimating the depth of the critical failure surface, and that three-dimensional modelling was
required to provide a reasonable representation. Post-liquefaction stability analyses, carried out using the
three-dimensional model, indicated an adequate factor of safety. The factor of safety under seismic
conditions was still considered to be a concern based on pseudo-static analyses (but noting the limitations of
the analysis method).
Earthquake induced settlements were estimated using an empirical approach based on case history records
(Swaisgood, 2003). The post-earthquake event settlement was estimated to be in the order of 600 mm,
which is considered to be acceptable for the embankment, taking account of the proposed long-term
freeboard of more than 8 m under operating conditions and 2 m under the probable maximum flood
condition.
INTRODUCTION Tailings storage facilities (TSFs) that are located in high rainfall and/or high seismicity areas must be
designed to meet stability criteria and provide an adequate level of assurance that the tailings will be
contained during operations and in the longer term. Where suitable hard rock is not available, the materials
used to construct the confining embankment can often be constructed using sandey or clayey soils, and
sometimes the tailings themselves. These materials may be susceptible to liquefaction, particularly in high
rainfall, high seismicity environments, where there is sufficient water to saturate these materials and
sufficient energy from the earthquake to cause liquefaction.
An increased awareness from mining companies, and improvements in the accessibility of information
relating to TSF failures and the contributory causes, has resulted in a review of the stability conditions for a
number of large TSFs and a change in the approach adopted for seismic stability assessments. New
guidelines issued by various jurisdictions and mining companies indicate an increasing rigour that needs to
be applied to address seismic risks.
This paper shows the process adopted to review the stability of an existing cross-valley centerline-raised
sand tailings embankment using limit equilibrium methods. The review was required to provide assurance to
the insurers that appropriate engineering rigour had been carried out with respect to stability and that future
raises to the TSF embankment would not compromise its stability.
3
PROJECT SETTING The copper/gold mine is located in a high rainfall, high seismic setting in South East Asia. Tailings is
contained by a cross-valley embankment predominantly constructed using cyclone underflow tailings sands.
Thickened total tailings was used to construct portions of the embankment. The TSF site is subject to hot
and humid weather and a high annual rainfall. Severe cyclonic rainfall events are frequently experienced.
Not only are the climatic conditions more challenging than at most other sites, but the site is also located in
close proximity to significant geological fault systems and in a very seismically active area. The seismicity
conditions are similar to those encountered in Chile and western North America.
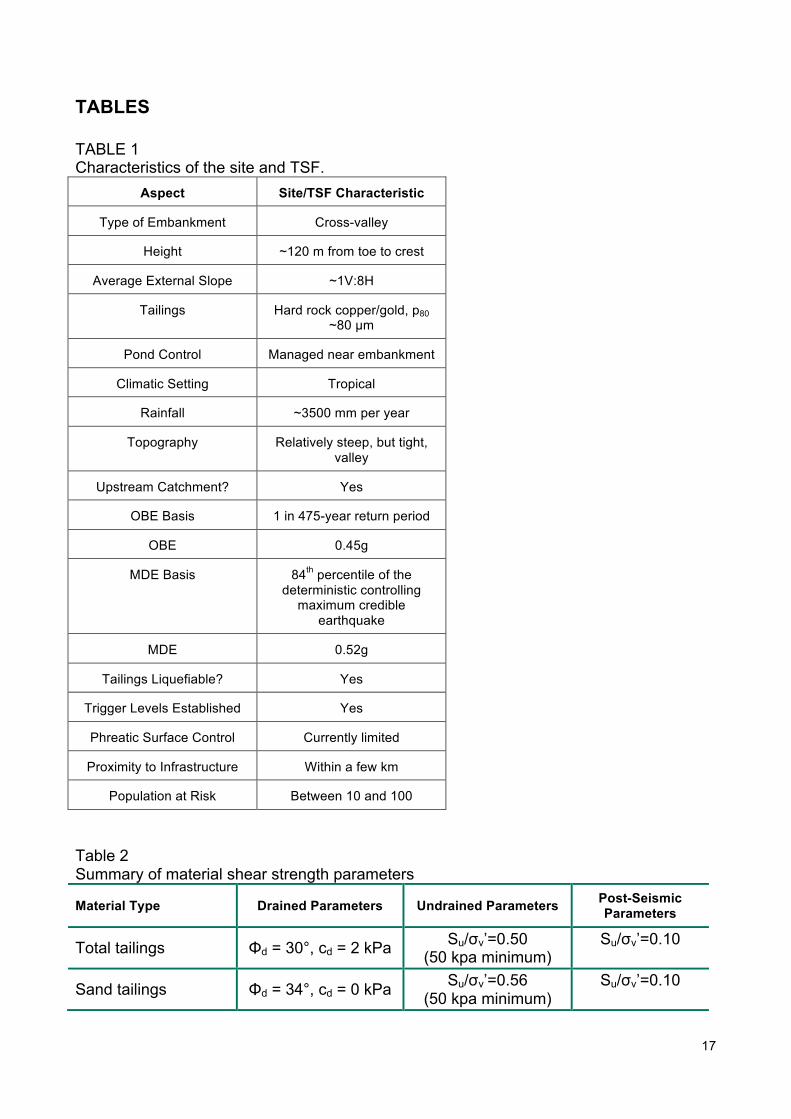
Table 1 presents the relevant characteristics of the site and TSF. As indicated in Table 1, the TSF is ~120 m
in height, with an average downstream batter of ~1V:8H and located in a tight, steep valley.
INSTABILITY MECHANISMS There are three mechanisms that were considered to be able to induce instability of the TSF embankment,
summarised as follows.
Effective stress failure under static loading conditions. When an embankment is loaded under static, drained
conditions, the potential for failure is related to the available shear strength of the materials (the resisting
forces). As TSFs are raised, additional loading is applied, increasing the shear stress along a potential failure
surface (referred to as the activating forces). If the available shear strength along such potential failure
surface is less than the activating forces, movement is indicated and failure may occur. As noted in Fourie
(2008), this method assumes that shearing takes place at a rate that is slow enough for sufficient drainage to
occur and hence the pore pressures in the materials (tailings) along the surface do not change. If this is not
the case, undrained parameters should be used.
Total stress failure arising from increased pore pressure under dynamic loading (seismic) conditions. When
tailings are subjected to shear stresses such as those experienced under seismic conditions, the void ratio of
the material will tend to change, indicating a change in volume. Contractant materials will tend to decrease in
void ratio, and dilatant materials will increase in void ratio. For a contractant, undrained material, the volume
change will induce excess pore pressures, reducing the shear strength of the material. This reduced shear
strength results in a concomitant reduction in the resisting forces, and hence instability may occur. Fourie
(2008) notes that initially contractant material that is loaded may experience strain-softening. In the event
that deformation of the material is occurring, it is possible that the resulting shear stresses could also induce
excess pore pressures, resulting in a reduction in shear strength without dynamic loading, referred to as
strain-induced liquefaction.
Strength loss arising from resaturation of tailings above the phreatic surface. For many tailings materials, a
large portion of their in situ shear strength is derived from negative pore water pressures (matric suction, a
result of surface tension of the water in the pores of the unsaturated material). This increased strength is
invariably detected during cone penetration with pore pressure measurement (CPTu) profiling through
unsaturated materials. For a given void ratio, resaturation of the tailings material may result in a strength
reduction as a result of the loss of the negative pore water pressures, i.e. as the air is expelled from the

4
pores and the surface tension is reduced. In turn, this could result in slope instability through either of the
mechanisms outlined above.
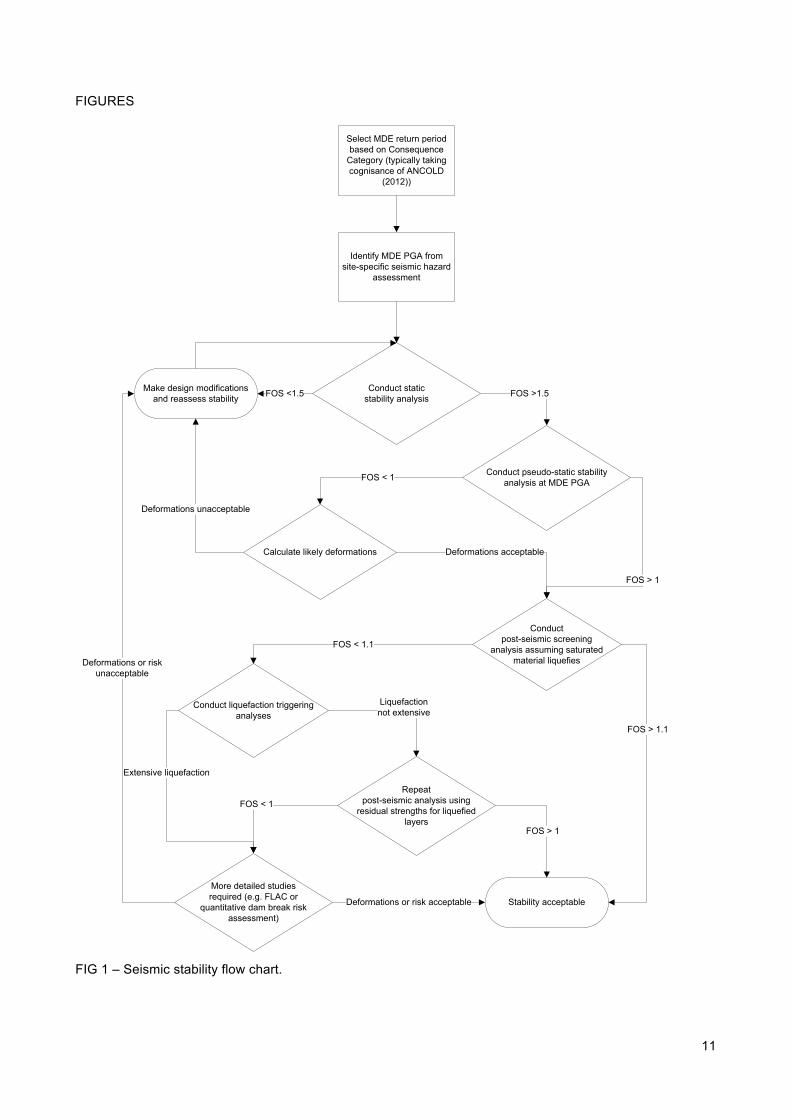
STABILITY ANALYSES The following stability analyses were carried out to estimate the Factor of Safety (FoS) against failure of the
embankment using the limit equilibrium software package Slope/W 2012 and SoilVision SVSlope 3D. The
process is consistent with the flow chart included as Figure 1.
• Static analyses, using peak undrained shear strengths inferred from cone penetration with pore
pressure measurement (CPTu) and laboratory testing data. The target minimum FoS for these
analyses was 1.5 in line with internationally accepted guidelines. These analyses were
representative of the normal operating conditions, with no earthquake or unusual loading applied to
the outer slopes or tailings.
• Pseudo-static analyses, using undrained shear strength ratios and a peak ground acceleration for
the design earthquake. These analyses simulate horizontal loading arising from an earthquake,
superimposed upon the operating conditions described above. A deterministic seismic hazard
assessment was carried out to identify the peak ground acceleration (PGA) for the design
earthquake. The target minimum FoS for these analyses was 1.1 for the operating basis earthquake
(OBE) and unity for the maximum design earthquake (MDE).
• Post-liquefaction screening analyses, using residual undrained shear strength ratios estimated from
CPTu data for the material below the inferred phreatic surface. The target minimum FoS for these
analyses was 1.1. These analyses represent a scenario where the saturated tailings within the TSF
have liquefied and are supported by the remainder of the material in and under the embankment.
A deformation assessment, using the approach published by Swaisgood (2003 was also performed.
BASIS OF SEISMIC DESIGN EVENT Selection of the design seismic event followed established procedures for TSFs, taking cognisance of the
2012 ANCOLD guidelines as well as Canadian Dam Association guidelines. For both guidelines, the TSF
was rated at or near to the highest category indicating that the maximum design earthquake (MDE) should
consider either the deterministic maximum credible earthquake or the 1 in 10 000-year probabilistic
earthquake. For this TSF, a value of 0.45g was adopted for the OBE and a value of 0.52g was adopted for
the MDE, based on a site-specific seismic hazard assessment carried out by Golder.
GEOMETRY The embankment of the TSF is constructed using the centreline method across a narrow gorge in a valley
about 250 m upstream of the confluence of a creek and a river. The embankment was founded on
weathered diorite over the entire footprint. Rock starter and toe dams were initially constructed for the
embankment and cyclone underflow (coarse) tailings was placed hydraulically in paddocks, separated by
5
rock embankments, to form the downstream embankment slope. Thickened total tailings was deposited in
some of the paddocks in the early stages of construction.
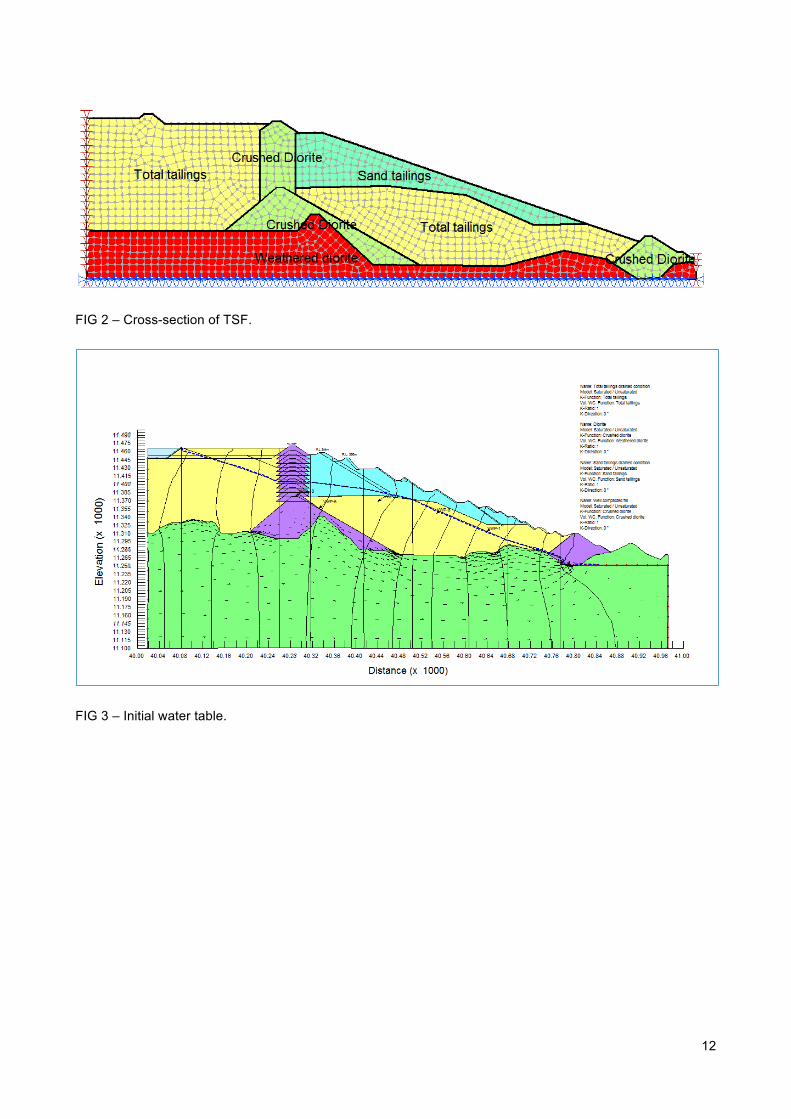
The borehole logs and the results of the laboratory tests were used to develop a geotechnical cross-section
for the stability analyses. While this cross-section simplifies the complexity of the layering of the tailings
inside the embankment, it is considered to be representative and considers the main issues affecting the
stability of the embankment. The cross section adopted is presented in Figure 2.
PARAMETER SELECTION Undrained parameters are appropriate to use where the permeability of the material is low and the rate of
loading is high (e.g. under seismic conditions), and there focus is on the short-term behaviour. Undrained
parameters consist of single component (su) representing the shear strength that incorporated the effects of
pore pressure on the strength of the material. It is commonly applied to a material type as a cohesion value
(in kPa). However, preferred practice is to relate the undrained shear strength to vertical initial effective
stress. This is referred to as the shear strength ratio (su/σvo’).
Residual strengths (sr) are also typically referred to as an undrained parameter. This value corresponds to
the strength after significant strain has occurred and residual conditions have been reached. This could be
through movement of the material or through dynamic conditions inducing excess pore pressures
(sometimes denoted as sliq indicating liquefaction has occurred).
Undrained strength parameters have been adopted for the pseudo-static analyses, specifically for saturated
material (i.e. material located below the phreatic surface). For static analyses, and material above the
phreatic surface, drained parameters have been adopted.
Table 2 summarises the material types and parameters adopted for the stability analyses.
PHREATIC CONDITIONS The phreatic conditions for the analyses were selected based on data from a series of piezometers that had
been installed to monitor the rise and fall of the phreatic surface within the embankment, as well as
information gathered from a simplified, steady-state seepage model. The initial phreatic surface adopted,
based on long term monitoring results and the seepage model, is shown in Figure 3. An elevated phreatic
surface was also considered and was based on predictions from the seepage model for the tailings pond
located against the upstream embankment (i.e. a worst case scenario).
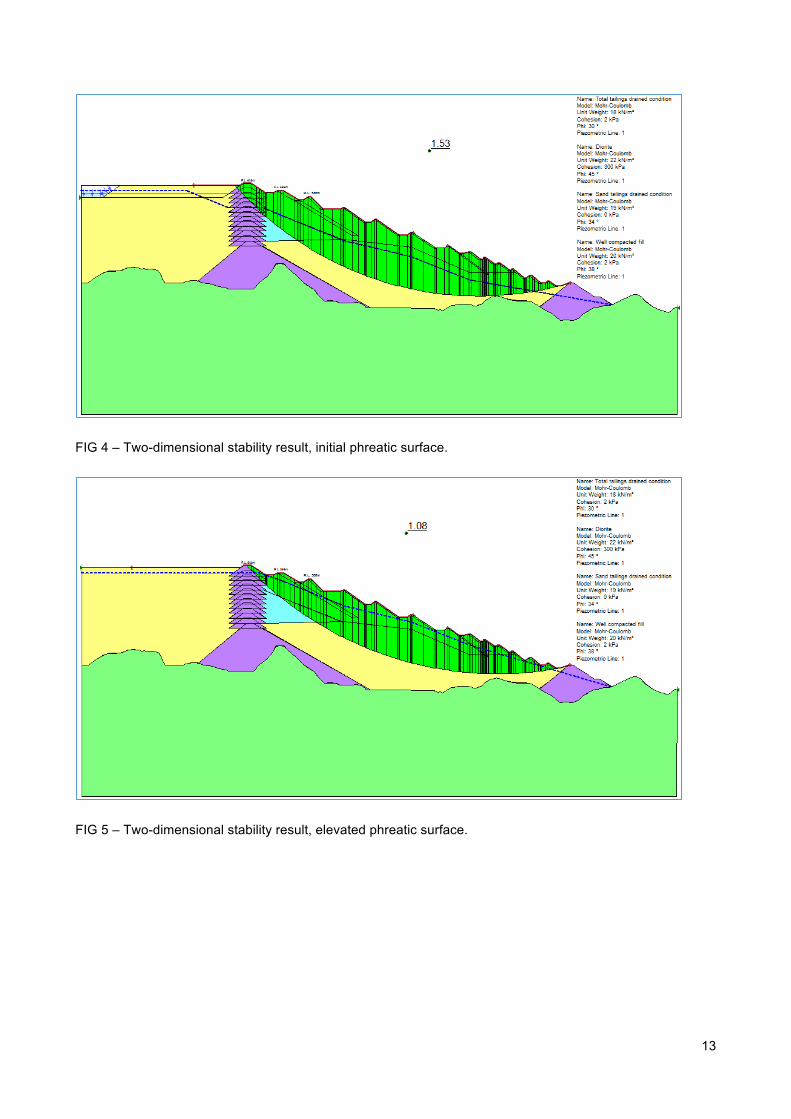
STATIC ANALYSES The stability analyses were carried out targeting a factor of safety greater than 1.5. If the target FoS was
achieved, it was deemed to have passed the screening for static stability; whereas failure to meet the target
FoS required design changes to be made to the embankment. This feedback loop is illustrated on Figure 1.
The results for the two-dimensional analysis of the TSF with the initial water table are shown in Figure 4.
While an acceptable FoS was indicated, sensitivity analyses indicated that the static stability was strongly

6
influenced by the elevation of the phreatic surface. An increase in phreatic surface could result in a much
lower FoS, as indicated in Figure 5.
IMPACT OF THREE-DIMENSIONALITY The typical two-dimensional (2D) approach to modelling represents a section with stresses applied from
external walls (i.e. the model represents one location on an embankment that is long enough not to impact
the section analysed). In reality, the original ground surface comprises a steep sided valley and the slope is
three-dimensional (3D). At this site, the deep-seated failure surface presented in Figure 4 and 5 are likely to
be unreliable, due to the 3D effect of the valley walls which results in portions of the failure surface passing
through natural material. Study of the site geometry lead to the conclusion that shallower failure surfaces
are more representative.
A two-dimensional approach for slope stability analysis is the generally accepted method to obtain
acceptable design FoS that range between 1.3 and 1.5 (SoilVision, 2010). It is known that 2D solutions used
in design will obtain a conservative evaluation (Li, et. al, 2010). Nevertheless, 2D limit equilibrium analysis is
the accepted method as it has been used for many years and calibrated with experience and observation
(Krahn, 2003).
SoilVision (2010) notes that:
“There is a fundamental difference between calculations of failed slopes performed using a 2D analysis as
opposed to a 3D analysis. The difference in the 2D and 3D analysis is closely related to the geometry of the
failed surface. A homogeneous slope with the same slip surface will result in a difference in the computed
factor of safety depending upon whether a 2D analysis or a 3D analysis is performed.”
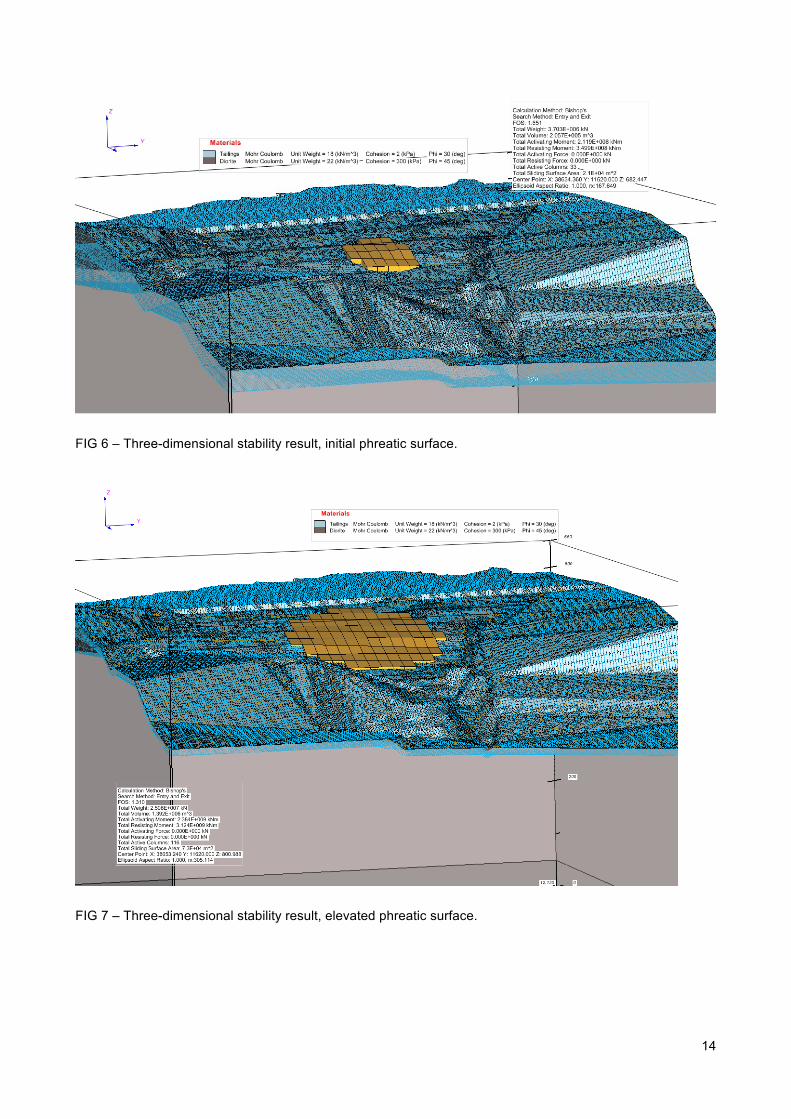
3D slope stability modelling was carried out to improve confidence in the FoS for the TSF embankment,
taking cognisance of its geometry. It was conservatively assumed that the material is all total tailings, rather
than cyclone underflow sands, for the 3D analyses.
The results of the 3D analysis indicate a failure surface of reduced size, located about halfway up the TSF
embankment face, with an increased FoS. This is shown in Figures 6 and 7. For the two phreatic surface
scenarios considered, the FoS increased from 1.53 (2D – initial phreatic surface) to 1.65 (3D – initial phreatic
surface) and from 1.08 (2D – elevated phreatic surface) to 1.31 (3D – elevated phreatic surface).
PSEUDO-STATIC ANALYSES The peak ground acceleration (PGA) selected for the pseudo-static analyses was taken at 50% of the
amplified OBE PGA, as recommended by Kramer (1996) and others. The targeted minimum FoS was 1.1.
The analyses were carried out with the initial and elevated phreatic surfaces, consistent with the static
analyses.
The results of the assessment using the 3D model indicated a FOS of less than 1.1, suggesting that further
analysis was required. As a check, the 2D model was also interrogated, with the critical slip circle limited to a
similar area to that indicated by the 3D model. The FoS indicated by the 2D analysis was 0.95.
7
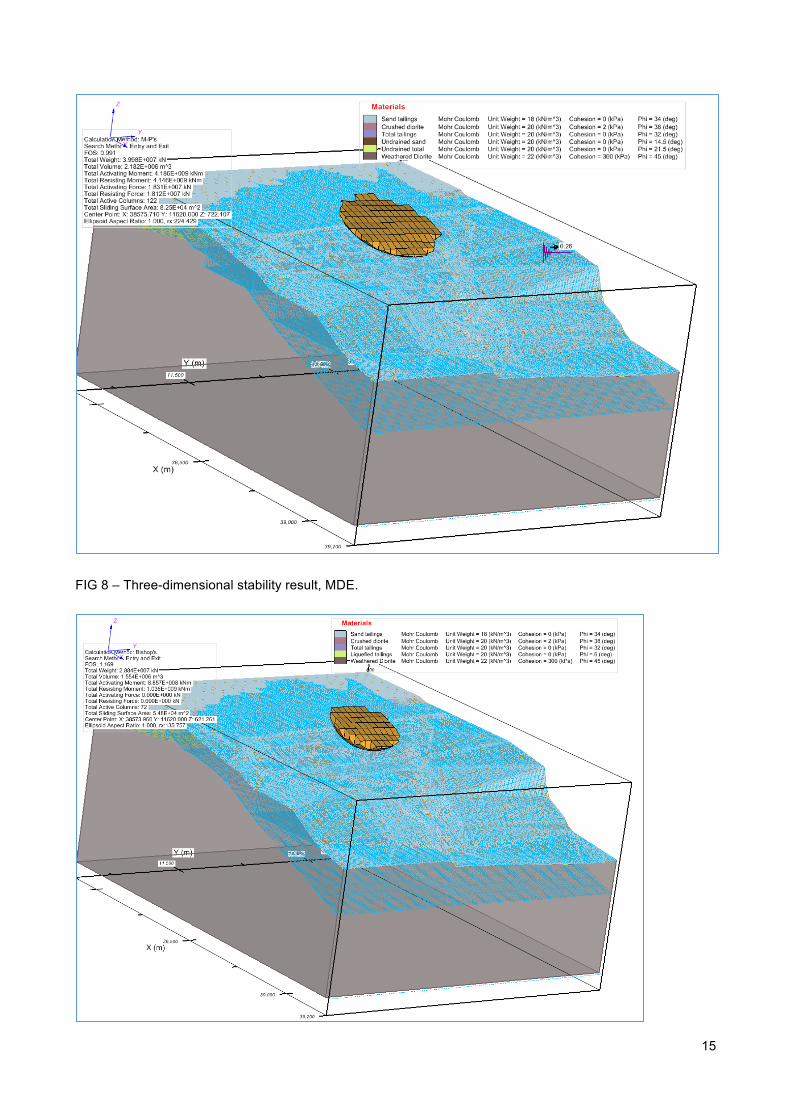
When the MDE earthquake was applied, a FoS of 0.99 was indicated by the 3D model (Figure 8).
The results of the pseudo-static analyses indicated a FOS lower than the target adopted for OBE and MCE
loading. Notwithstanding that the estimated displacements (discussed in the next section), an analysis was
carried out to identify the elevation of the phreatic surface that would result in acceptable FoS values. The
sensitivity analysis indicated that the modelled (existing) phreatic surface would need to be lowered by 5 m
to achieve satisfactory results. These phreatic surface elevations were adopted by the mine as operational
‘trigger levels’ for the remainder of tailings disposal operations and would be achieved by depositing tailings
to move the tailings pond far from the embankment crest.
LIQUEFACTION ANALYSES The liquefaction of the embankment tailings below the phreatic surface will result in a significant reduction in
the shear strength for a short period of time after the earthquake occurs and until the excess pore pressures
have dissipated. Laboratory static post-liquefaction simple shear tests were undertaken on samples
prepared to replicate different tailings deposition (placement) conditions: slurry deposition with self-weight
consolidation and slurry deposition and samples prepared by moist tamping (compaction).
Static post-liquefaction 3D stability analyses were carried out using the results for both deposition methods
and compaction conditions, with the post-liquefied shear strength converted to an equivalent friction angle for
analysis purposes. A conservative stability assessment was undertaken by selecting a low post-liquefaction
shear strength ratio of 0.1 for all of the tailings below the phreatic surface for slurry deposition and 0.27 for all
tailings prepared by moist tamping deposition. The conservative result (shear strength ratio of 0.1) is shown
in Figure 9. An acceptable FoS, greater than 1.1, was indicated by the stability assessments for both
placement scenarios, suggesting that post-liquefaction stability is acceptable for this TSF.
DEFORMATION ESTIMATES One of the most important factors affecting the seismic stability of a TSF embankment dams is the
settlement induced as a result of strong earthquake motion (shaking). Following review of a number of
embankment dams subjected to significant earthquake events, Swaisgood (2003) concluded that the
magnitude of crest settlement is related primarily to two factors: peak ground acceleration (PGA) at the dam
site and magnitude of the causative earthquake. Based on the observed displacements of the surveyed
dams, Swaisgood proposed an empirical equation as an aid in estimating the magnitude of post-earthquake
deformation that may be expected. The empirical equation presented by Swaisgood was used to estimate a
maximum crest settlement at the centre of the TSF embankment of 600 mm, assuming a PGA=0.45, a
magnitude M=7.1 earthquake (OBE) event and a maximum embankment height of 200 m founded directly on
bedrock. Lesser displacements would occur on the crest away from the centre as the embankment height
reduces. This displacement is considered to be acceptable for the TSF, taking into account the expected
long-term freeboard of more than 8 m under operating conditions and 2 m under the probable maximum
flood condition. Numerical analyses would be required to provide a more accurate estimate of displacement.
8
CONCLUSIONS Stability analyses were carried out to estimate the FoS against failure of the embankment using the limit
equilibrium software package Slope/W 2012 and SoilVision SVSlope 3D. A process was used that stepped
through a series of analyses, each with a minimum accepted FoS. The process commenced with static
analyses, using peak undrained shear strengths inferred from CPTu and laboratory testing data.
Pseudo-static analyses were then carried out, using undrained shear strength ratios and a peak ground
acceleration for the design earthquake. The target minimum FoS for these analyses was 1.1 for the
operating basis earthquake (OBE) and unity for the maximum design earthquake (MDE).
The stability of the TSF under post-seismic conditions, assuming liquefaction of the tailings had occurred
below the inferred phreatic surface. The target minimum FoS for these analyses was 1.1. Finally, a
deformation assessment was carried out, using the approach published by Swaisgood (2003).
The study showed that two-dimensional stability analyses did not sufficiently capture the potential for
instability, over-estimating the depth of the critical failure surface, and that three-dimensional modelling was
required to provide a reasonable representation. Post-liquefaction stability analyses, carried out using the
three-dimensional model, indicated an adequate factor of safety.
The factor of safety under seismic conditions was still considered to be a concern based on pseudo-static
analyses but noting the limitations of the analysis approach. Earthquake induced settlements were also
estimated using an empirical approach based on case history records (Swaisgood, 2003). The post-
earthquake event settlement was estimated to be in the order of 600 mm, which is considered to be
acceptable for the embankment, taking account of the adopted freeboard for surface water management.
REFERENCES Australian National Committee on Large Dams (ANCOLD), 2012. Guidelines on Tailings Dams: Planning,
Design, Construction, Operation and Closure. Published in May 2012.
Fourie, A.B. 2008. “Future tailings strategies - High time we took the high road”. Proceedings of Tailings and
Mine Waste ’08. Taylor and Francis Group, London, 2009.
Krahn, 2003, “The 2001 R.M. Hardy Lecture: The limits of limit equilibrium analyses”, published 21 May
2003, NCR Research Press Web.
Kramer, S.L. 1996. Geotechnical Earthquake Engineering, University of Washington, Prentice-Hall Inc, pp
436-7.
Li, Merifield, and Lyamin 2010, “Three-dimensional stability charts for slopes based on limit analysis
methods”, published 11 November 2010, NRC Research Press Web
SoilVision Ltd, 2010. Why Perform 3D Slope Stability Analysis?, webpage dated 5 June 2010.
http://www.soilvision.com/subdomains/svslope.com/why_3d_slope_stability.shtml accessed 19
February 2015.

9
Swaisgood, J. R. 2003. Embankment dam deformations caused by earthquakes. Proceedings of 2003
Pacific Conference on Earthquake Engineering, Christchurch, New Zealand.

10
FIGURE CAPTIONS FIG 1 – Seismic stability flow chart.
FIG 2 – Cross-section of TSF.
FIG 3 – Initial water table.
FIG 4 – Two-dimensional stability result, initial phreatic surface.
FIG 5 – Two-dimensional stability result, elevated phreatic surface.
FIG 6 – Three-dimensional stability result, initial phreatic surface.
FIG 7 – Three-dimensional stability result, elevated phreatic surface.
FIG 8 – Three-dimensional stability result, MDE.
FIG 9 – Three-dimensional stability result, post-seismic.
TABLE CAPTIONS TABLE 1
Characteristics of the site and TSF.
TABLE 2
Summary of material shear strength parameters.
11
FIGURES
Select MDE return period based on Consequence
Category (typically taking cognisance of ANCOLD
(2012))
Identify MDE PGA from site-specific seismic hazard
assessment
Conduct static stability analysis
Conduct pseudo-static stability analysis at MDE PGA
FOS >1.5FOS <1.5
Calculate likely deformations
FOS < 1
Conduct post-seismic screening
analysis assuming saturated material liquefies
Conduct liquefaction triggering analyses
FOS < 1.1
Deformations acceptable
Make design modifications and reassess stability
Stability acceptable
Deformations unacceptable
FOS > 1
More detailed studies required (e.g. FLAC or
quantitative dam break risk assessment)
Extensive liquefaction
Deformations or riskunacceptable
Deformations or risk acceptable
Repeat post-seismic analysis using
residual strengths for liquefied layers
Liquefaction not extensive
FOS < 1
FOS > 1
FOS > 1.1
FIG 1 – Seismic stability flow chart.
12
FIG 2 – Cross-section of TSF.
FIG 3 – Initial water table.
13
FIG 4 – Two-dimensional stability result, initial phreatic surface.
FIG 5 – Two-dimensional stability result, elevated phreatic surface.
14
FIG 6 – Three-dimensional stability result, initial phreatic surface.
FIG 7 – Three-dimensional stability result, elevated phreatic surface.
15
FIG 8 – Three-dimensional stability result, MDE.

16
FIG 9 – Three-dimensional stability result, post-seismic.
17
TABLES TABLE 1 Characteristics of the site and TSF.
Aspect Site/TSF Characteristic
Type of Embankment Cross-valley
Height ~120 m from toe to crest
Average External Slope ~1V:8H
Tailings Hard rock copper/gold, p80 ~80 µm
Pond Control Managed near embankment
Climatic Setting Tropical
Rainfall ~3500 mm per year
Topography Relatively steep, but tight, valley
Upstream Catchment? Yes
OBE Basis 1 in 475-year return period
OBE 0.45g
MDE Basis 84th percentile of the deterministic controlling
maximum credible earthquake
MDE 0.52g
Tailings Liquefiable? Yes
Trigger Levels Established Yes
Phreatic Surface Control Currently limited
Proximity to Infrastructure Within a few km
Population at Risk Between 10 and 100
Table 2 Summary of material shear strength parameters
Material Type Drained Parameters Undrained Parameters Post-Seismic Parameters
Total tailings Φd = 30°, cd = 2 kPa Su/σv’=0.50 (50 kpa minimum)
Su/σv’=0.10
Sand tailings Φd = 34°, cd = 0 kPa Su/σv’=0.56 (50 kpa minimum)
Su/σv’=0.10

18
Material Type Drained Parameters Undrained Parameters Post-Seismic Parameters
Compacted diorite fill Φd = 38°, cd = 2 kPa - - Diorite foundation rock
Φd = 45°, cd = 300 kPa - -