Embed Size (px)
Citation preview
Take Out
• Catalyst Sheet• Pencil• Science notebook
Catalyst
What potential sources for error do you foresee occurring in this lab?
Homework
Start Post-Lab Document
Create final Raw Data Table and start typing Observations

Take Out
• Catalyst Sheet• Pencil• Science notebook
Catalyst1. Find the average of the following pieces of data:
• 0.4 mL• 0.5 mL• 0.4 mL• 0.32 mL
2. Find the average of the following pieces of data:• 10.456 g• 12.342 g• 10.654 g• 0.013425 kg
Page 68
Split page in half horizontally
Top half – Mathematical AnalysisInclude one example of all calculations done in this lab
Bottom half – Data Analysis Table

Page 69
Rough draft of Graph and Graphical Analysis
Homework
Complete final Raw Data Table and type final Observations
Complete page 68

Take Out
• Catalyst Sheet• Pencil• Science notebook
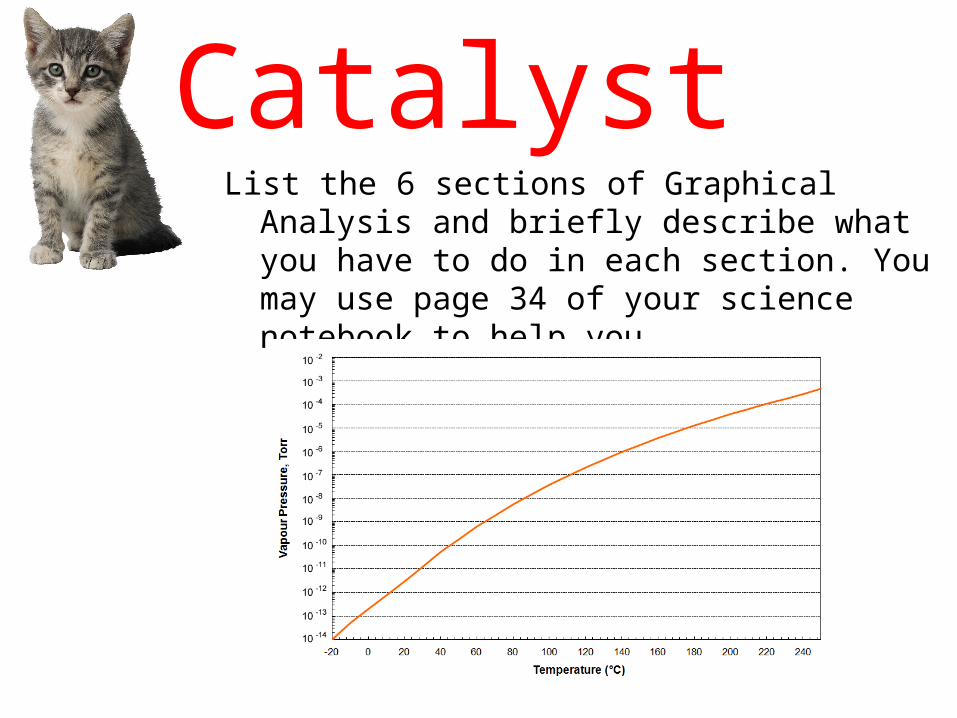
CatalystList the 6 sections of Graphical Analysis and briefly
describe what you have to do in each section. You may use page 34 of your science notebook to help you.

Page 68
Split page in half horizontally
Top half – Mathematical AnalysisInclude one example of all calculations done in this lab
Bottom half – Data Analysis Table
Page 69
Rough draft of Graph and Graphical Analysis
Homework
Complete final Data Analysis Table (either on the computer or a separate piece of graph paper)
Complete final Graph and Graphical Analysis (must be on separate sheet of graph paper). I will check this on Monday.
Take Out
• Catalyst Sheet• Pencil• Science notebook• Final graph
Catalyst1.What is the purpose of
the Evaluation of your lab report?
2.Use your rubric to list the 6 parts of your Evaluation
White Board
• Purpose• Hypothesis• Data Analysis Table• Graph w/ LOBF• Graphical Analysis
Homework
Type final Evaluation
At this point, you should have the following parts of your post-lab completed in final draft form:
Raw Data TableObservationsData Analysis TableGraphGraphical Analysis

Take Out
• Catalyst Sheet• Pencil• Science notebook
Catalyst1.What is your slope? 2.What do you think the
units of your slope are?3.What does your slope
mean?
Homework
Write a rough draft of your Inference on page 72 of science notebook
Use your rubric as a guide
Your Inference should have in-text citations