Embed Size (px)
Citation preview
Taking a leap forwardEPRA Annual Report Survey 2012/13
To start a new section, hold down the apple+shift keys and click
to release this object and type the section title in the box below.
Foreword 1
1. Highlights 2
2. Introducing the survey 3
3. Award winners 6
4. Survey results 8
5. EPRA reporting measures 11
6. Reporting developments 13
7. Investment property reporting 14
8. Award process 16
9. Participant list 17
Contents
To start a new section, hold down the apple+shift keys and click
to release this object and type the section title in the box below.
Foreword
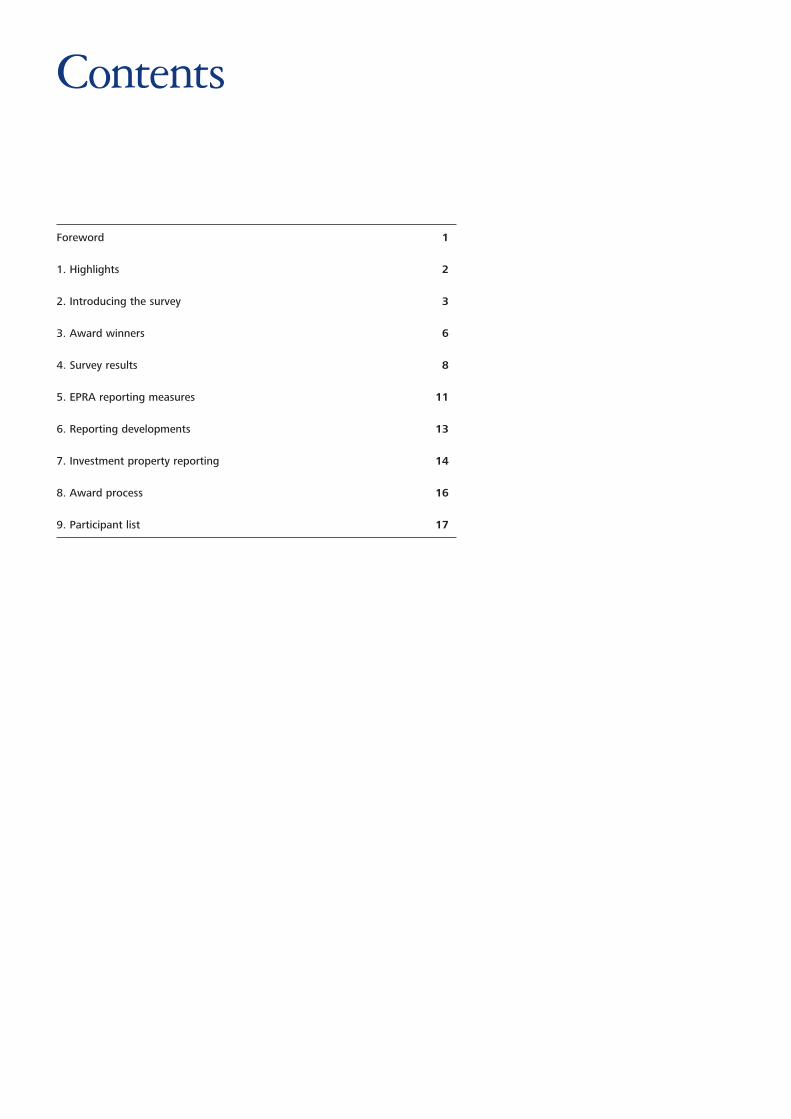
Taking a leap forwardI am delighted to announce the results of our EPRA Annual Report Survey 2012/13. The survey comprised a review of 86 annual reports from leading listed real estate companies across Europe to assess compliance with EPRA’s Best Practices Recommendations (BPR).
The survey results this year have taken a leap forward with a significant increase in average scores as companies respond to industry and peer pressure and seek to improve their compliance with the BPR.
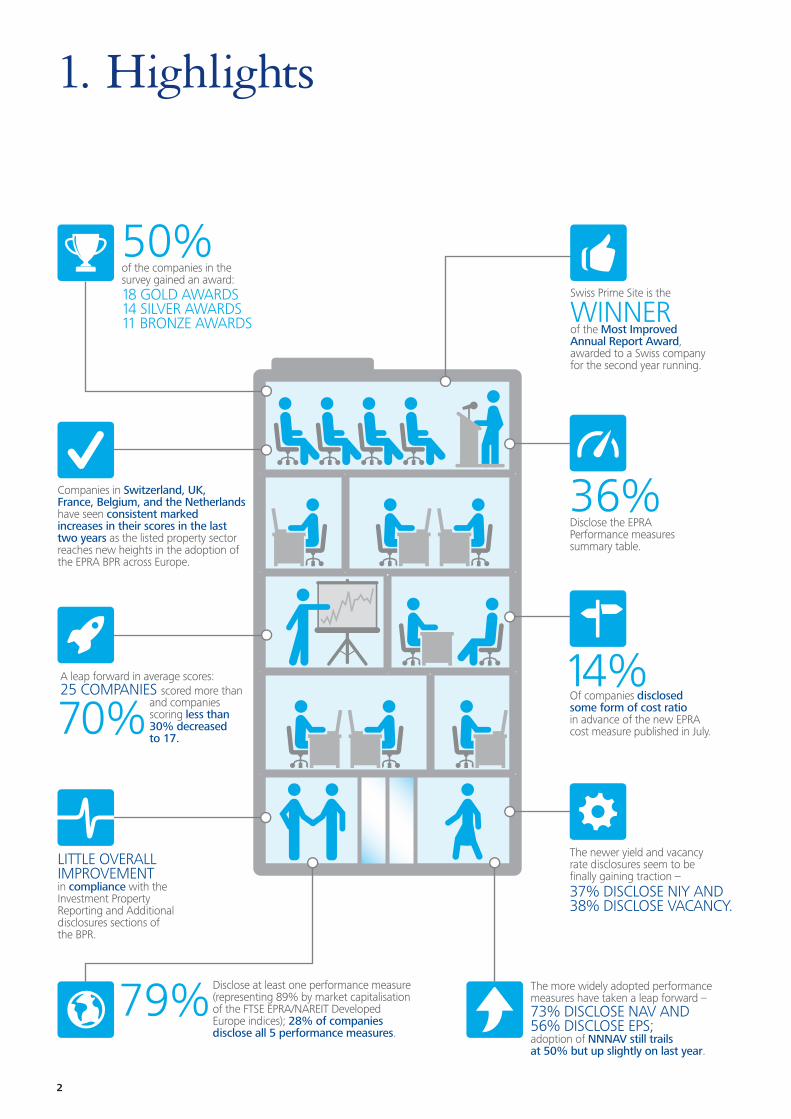
A new threshold has been reached – 50% of companies (representing 71% by market capitalisation) in the survey gained an award this year, with 18 Gold, 14 Silver, and 11 Bronze awards issued.
I would also like to congratulate this year’s winner of the Most Improved Annual Report, Swiss Prime Site, a Swiss company winning this award for the second year running.
The EPRA Performance Measures are now widely recognised as important KPIs in the real estate industry, with 79% of companies surveyed disclosing at least one EPRA Performance Measure (representing 89% by market capitalisation), helping to highlight the benefits of investing in the listed property sector.
As companies strive to reach new heights in their compliance, we would like to see greater attention paid to the finer detail of the BPR: companies should ensure they use the EPRA definitions, follow the BPR guidance as to what specifically should be included or excluded from a particular reporting measure, and provide clear reconciliations to the statutory IFRS disclosures. This can only help to improve the credibility of EPRA reporting.
Looking ahead, the BPR are to be refreshed later this year, and will incorporate the new EPRA cost ratio which was published in July. We will be taking a fresh look at the scoring as a result and hope to see significant adoption of this new metric in next year’s survey.
Finally, I would like to thank Catherine Rolph, Matthew Parrott, Steven Yan Too Sang and the team of reviewers at Deloitte from across our European real estate practice.
Please contact myself, or alternatively Mohamed Abdel Rahim at EPRA, if you would like any further information about this survey. Deloitte real estate teams from across Europe were involved in the survey, and would welcome the opportunity to meet locally with companies to discuss the survey and individual company results, as well as current trends in financial reporting.
Jennifer ChaseDirector, Real EstateDeloitte UK+44 (0) 20 7007 [email protected]
“ I am delighted to see that the number of listed property companies adopting EPRA Best Practice Reporting continues to grow. The increased transparency which comes from reporting EPRA KPIs is now widely understood. This year, we have continued our drive towards greater, consistent disclosure by developing additional KPIs on operating costs.”
Martin Greenslade Chief Finanical Officer of Land Securities and Chair of EPRA Reporting & Accounting Committee
89%OF COMPANIES BY MARKET CAPITALISATIONDISCLOSE AT LEAST ONEPERFORMANCE MEASURE
Taking a leap forward EPRA Annual Report Survey 2012/13 1
To start a new section, hold down the apple+shift keys and click
to release this object and type the section title in the box below.
1. Highlights
of the companies in thesurvey gained an award: 18 GOLD AWARDS 14 SILVER AWARDS 11 BRONZE AWARDS
50%
Companies in Switzerland, UK, France, Belgium, and the Netherlandshave seen consistent marked increases in their scores in the lasttwo years as the listed property sector reaches new heights in the adoption ofthe EPRA BPR across Europe.
A leap forward in average scores:25 COMPANIES scored more than
79% The more widely adopted performancemeasures have taken a leap forward –
The newer yield and vacancyrate disclosures seem to befinally gaining traction –
14%
36%
LITTLE OVERALLIMPROVEMENTin compliance with theInvestment Property Reporting and Additional disclosures sections of the BPR.
70%
and companies scoring less than30% decreased to 17.
Disclose at least one performance measure (representing 89% by market capitalisation of the FTSE EPRA/NAREIT Developed Europe indices); 28% of companies disclose all 5 performance measures.
73% DISCLOSE NAV AND56% DISCLOSE EPS;adoption of NNNAV still trails at 50% but up slightly on last year.
37% DISCLOSE NIY AND38% DISCLOSE VACANCY.
Of companies disclosedsome form of cost ratioin advance of the new EPRA cost measure published in July.
Disclose the EPRAPerformance measuressummary table.
Swiss Prime Site is the
WINNER of the Most Improved Annual Report Award, awarded to a Swiss company for the second year running.
2
To start a new section, hold down the apple+shift keys and click
to release this object and type the section title in the box below.
2. Introducing the survey
EPRA’s Best Practices RecommendationsEPRA’s Best Practices Recommendations (BPR), as published in August 2011, include specific additional disclosures for real estate companies within the IFRS framework:
•Emphasis is currently placed on five key performance measures, EPRA Earnings, NAV, NNNAV, yield and vacancy rate.
•EPRA produces additional guidance on how to apply the EPRA BPR (the latest guidance was issued in January 2013).
•In July 2013, EPRA published guidance on a new performance measure, the cost ratio. While it has no impact on the survey findings for the current year, this will be taken into account next year.
Purpose of the EPRA Annual Report SurveyThe purpose of this survey is to promote awareness of EPRA’s BPR and to encourage companies to recognise and promote the value in consistency and transparency in financial reporting.
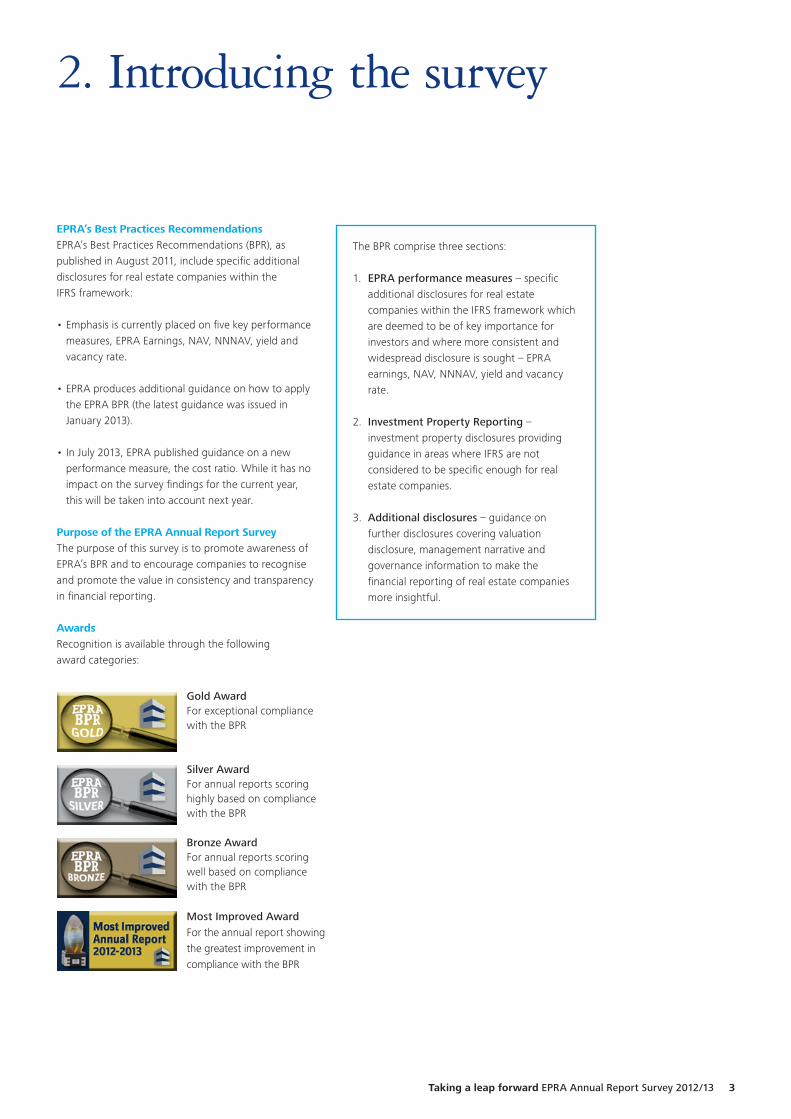
AwardsRecognition is available through the following award categories:
Gold AwardFor exceptional compliance with the BPR
Silver AwardFor annual reports scoring highly based on compliance with the BPR
Bronze AwardFor annual reports scoring well based on compliance with the BPR
Most Improved Award For the annual report showing the greatest improvement in compliance with the BPR
The BPR comprise three sections:
1. EPRA performance measures – specific additional disclosures for real estate companies within the IFRS framework which are deemed to be of key importance for investors and where more consistent and widespread disclosure is sought – EPRA earnings, NAV, NNNAV, yield and vacancy rate.
2. Investment Property Reporting – investment property disclosures providing guidance in areas where IFRS are not considered to be specific enough for real estate companies.
3. Additional disclosures – guidance on further disclosures covering valuation disclosure, management narrative and governance information to make the financial reporting of real estate companies more insightful.
Taking a leap forward EPRA Annual Report Survey 2012/13 3
To start a new section, hold down the apple+shift keys and click
to release this object and type the section title in the box below.
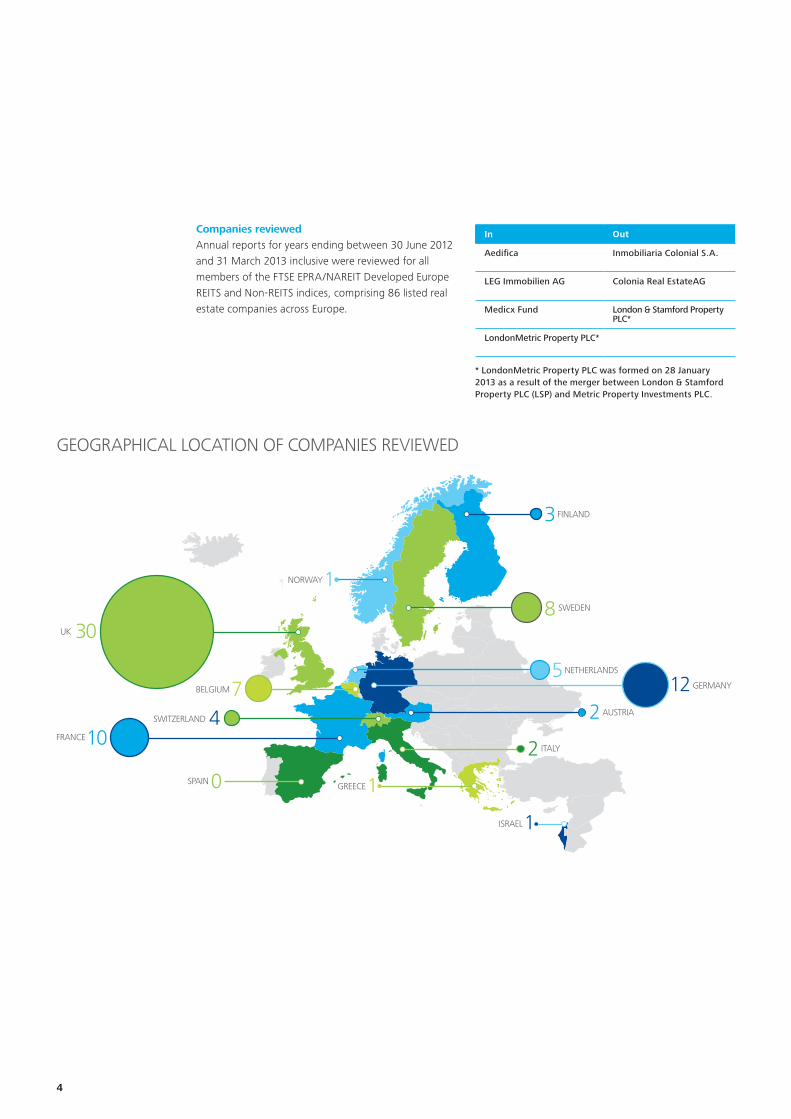
30UK
1NORWAY
3FINLAND
10FRANCE
0SPAIN
12GERMANY
2 AUSTRIA
2 ITALY
5NETHERLANDS
8 SWEDEN
4SWITZERLAND
7BELGIUM
1GREECE
1ISRAEL
Companies reviewedAnnual reports for years ending between 30 June 2012 and 31 March 2013 inclusive were reviewed for all members of the FTSE EPRA/NAREIT Developed Europe REITS and Non-REITS indices, comprising 86 listed real estate companies across Europe.
* LondonMetric Property PLC was formed on 28 January 2013 as a result of the merger between London & Stamford Property PLC (LSP) and Metric Property Investments PLC.
In Out
Aedifica Inmobiliaria Colonial S.A.
LEG Immobilien AG Colonia Real EstateAG
Medicx Fund London & Stamford Property PLC*
LondonMetric Property PLC*
GEOGRAPHICAL LOCATION OF COMPANIES REVIEWED
4
To start a new section, hold down the apple+shift keys and click
to release this object and type the section title in the box below.
“ The EPRA Reporting & Accounting Committee has recently established a new EPRA Best Practice Reporting (BPR) sub-committee. This sub-committee, under the chairmanship of Simon Carlyon of SEGRO, was established to assist the R&A Committee in its ongoing efforts to clarify and enhance the BPR by considering requests for guidance from companies applying the BPR. This is a direct reflection of the success of the BPR and its widespread use amongst European listed property companies and the investment community.”
Gareth Lewis Director, EPRA
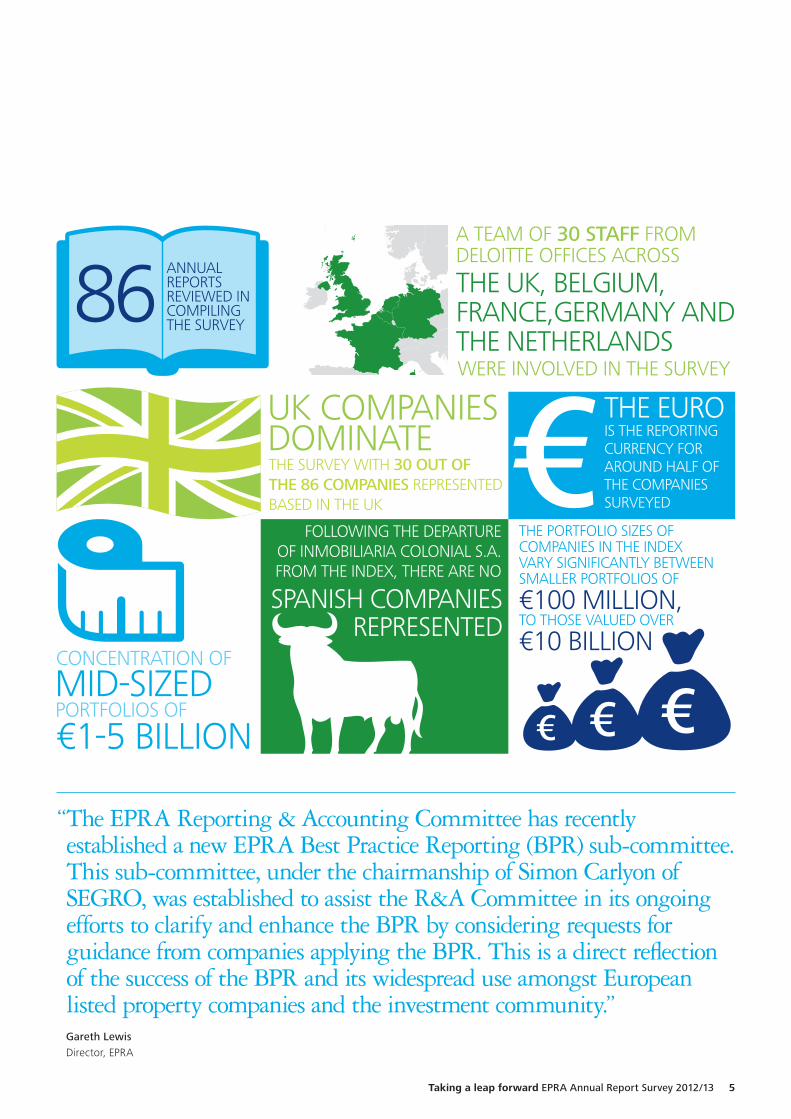
86
€
ANNUALREPORTSREVIEWED IN COMPILING THE SURVEY
A TEAM OF 30 STAFF FROMDELOITTE OFFICES ACROSS
WERE INVOLVED IN THE SURVEY
THE UK, BELGIUM,FRANCE,GERMANY AND THE NETHERLANDS
UK COMPANIES DOMINATE
THE PORTFOLIO SIZES OF COMPANIES IN THE INDEX VARY SIGNIFICANTLY BETWEEN SMALLER PORTFOLIOS OF
TO THOSE VALUED OVER
€10 BILLION
€100 MILLION,
FOLLOWING THE DEPARTURE OF INMOBILIARIA COLONIAL S.A. FROM THE INDEX, THERE ARE NO
CONCENTRATION OF
PORTFOLIOS OF
€1-5 BILLIONMID-SIZED
THE EURO IS THE REPORTING CURRENCY FOR AROUND HALF OF THE COMPANIES SURVEYED
SPANISH COMPANIES REPRESENTED
THE SURVEY WITH 30 OUT OF THE 86 COMPANIES REPRESENTED BASED IN THE UK
Taking a leap forward EPRA Annual Report Survey 2012/13 5
To start a new section, hold down the apple+shift keys and click
to release this object and type the section title in the box below.
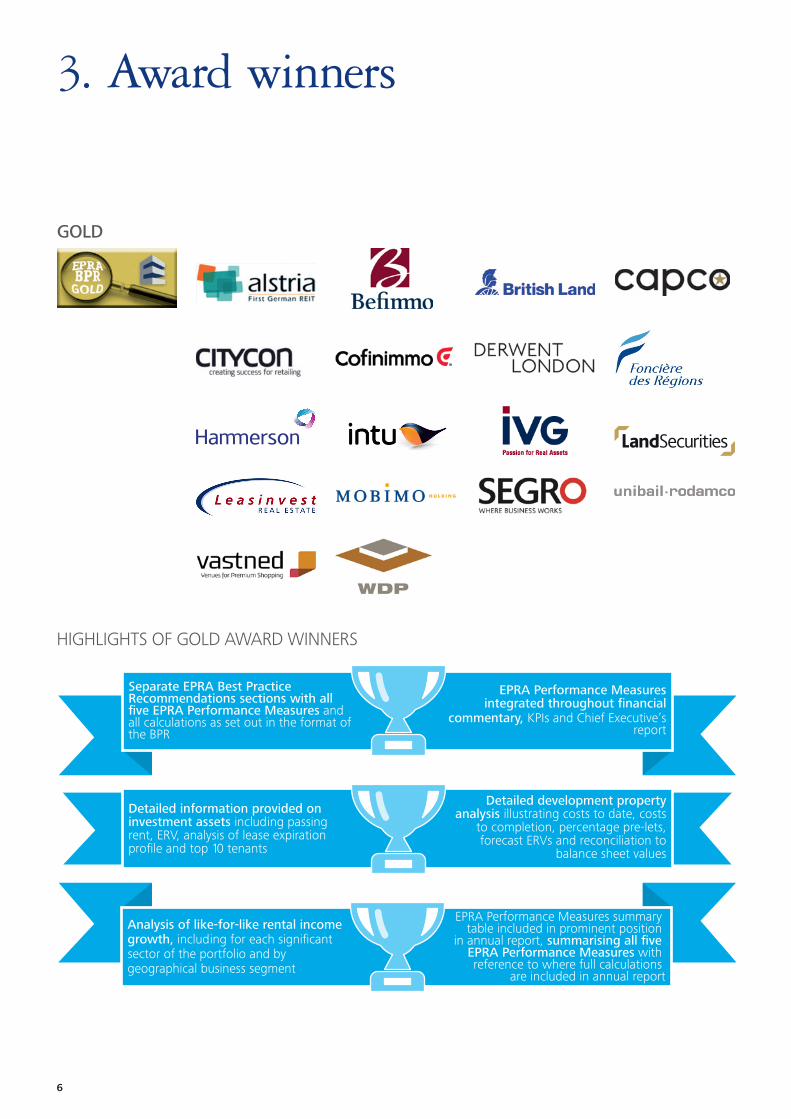
3. Award winners
HIGHLIGHTS OF GOLD AWARD WINNERS
Separate EPRA Best Practice Recommendations sections with allfive EPRA Performance Measures and all calculations as set out in the format ofthe BPR
EPRA Performance Measuresintegrated throughout financial
commentary, KPIs and Chief Executive’sreport
Detailed information provided oninvestment assets including passingrent, ERV, analysis of lease expirationprofile and top 10 tenants
Detailed development propertyanalysis illustrating costs to date, costs
to completion, percentage pre-lets,forecast ERVs and reconciliation to
balance sheet values
Analysis of like-for-like rental incomegrowth, including for each significantsector of the portfolio and bygeographical business segment
EPRA Performance Measures summary table included in prominent position
in annual report, summarising all five EPRA Performance Measures with reference to where full calculations
are included in annual report
GOLD
6
To start a new section, hold down the apple+shift keys and click
to release this object and type the section title in the box below.
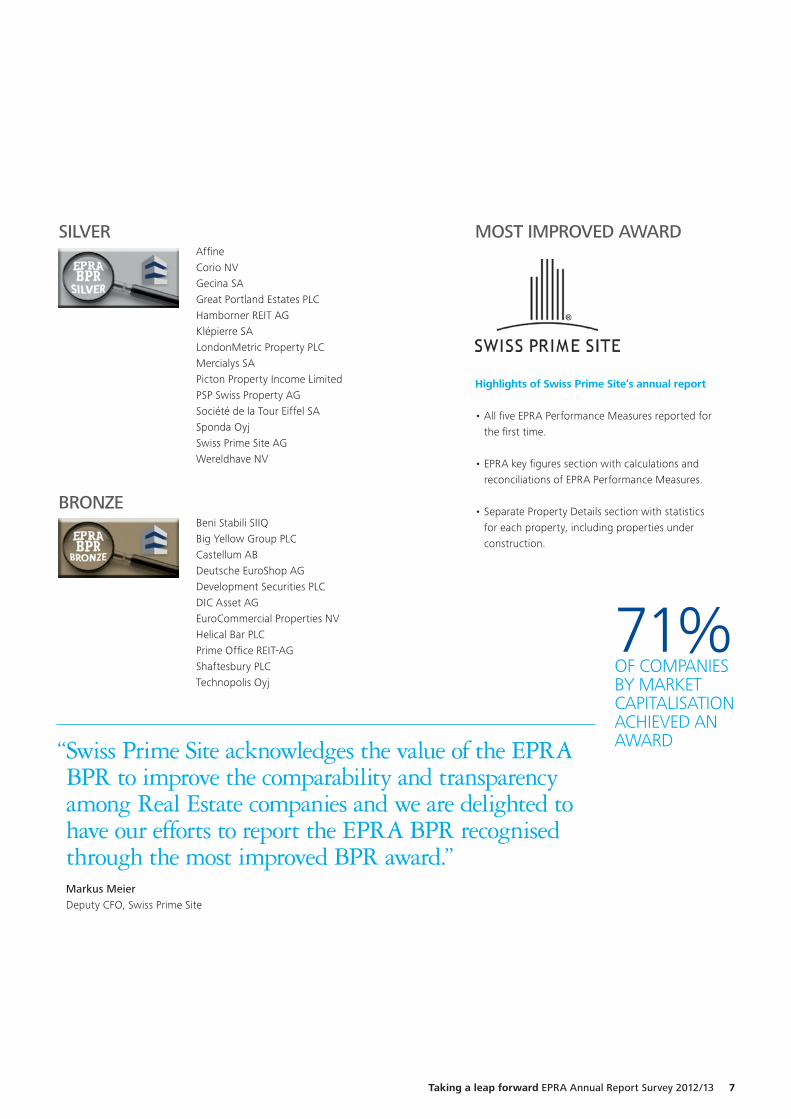
Affine Corio NVGecina SAGreat Portland Estates PLCHamborner REIT AGKlépierre SALondonMetric Property PLCMercialys SAPicton Property Income LimitedPSP Swiss Property AGSociété de la Tour Eiffel SASponda OyjSwiss Prime Site AGWereldhave NV
Beni Stabili SIIQBig Yellow Group PLC Castellum ABDeutsche EuroShop AGDevelopment Securities PLCDIC Asset AGEuroCommercial Properties NVHelical Bar PLCPrime Office REIT-AGShaftesbury PLCTechnopolis Oyj
Highlights of Swiss Prime Site’s annual report
•AllfiveEPRAPerformanceMeasuresreportedfor the first time.
•EPRAkeyfiguressectionwithcalculationsandreconciliations of EPRA Performance Measures.
•SeparatePropertyDetailssectionwithstatisticsfor each property, including properties under construction.
SILVER
BRONZE
MOST IMPROVED AWARD
71%OF COMPANIES BY MARKET CAPITALISATIONACHIEVED AN AWARD “ Swiss Prime Site acknowledges the value of the EPRA
BPR to improve the comparability and transparency among Real Estate companies and we are delighted to have our efforts to report the EPRA BPR recognised through the most improved BPR award.”
Markus Meier Deputy CFO, Swiss Prime Site
Taking a leap forward EPRA Annual Report Survey 2012/13 7
To start a new section, hold down the apple+shift keys and click
to release this object and type the section title in the box below.
4. Survey results
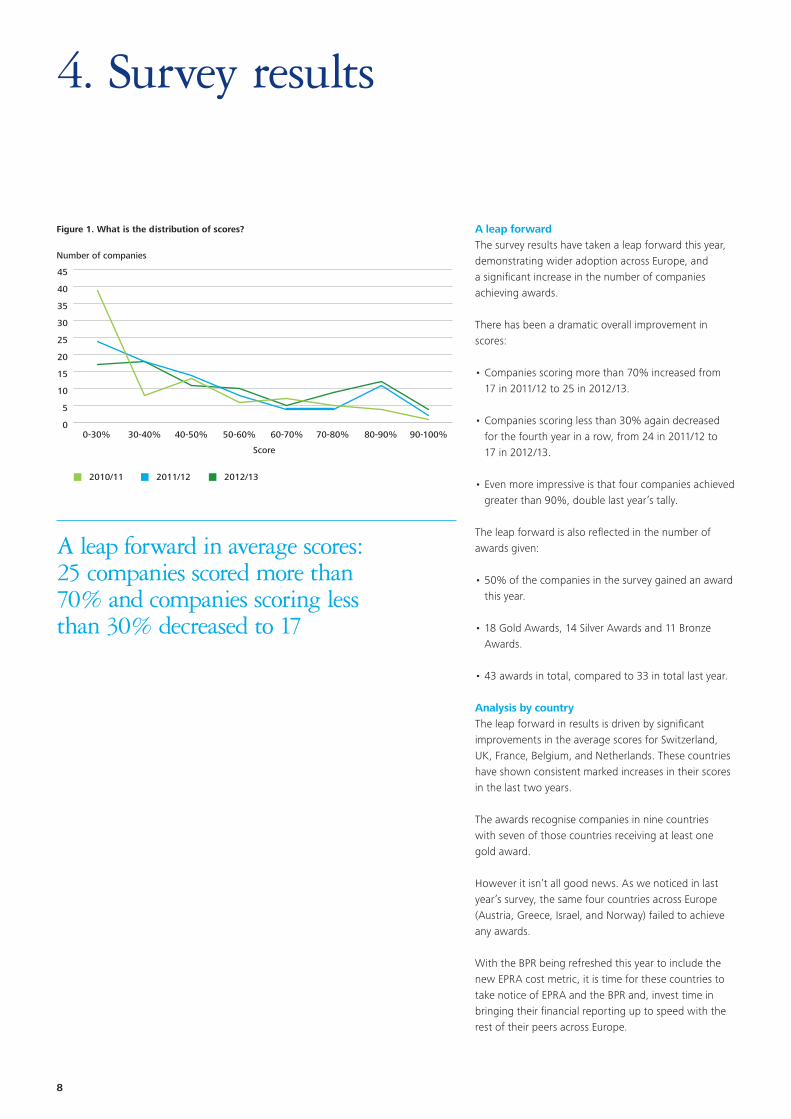
A leap forwardThe survey results have taken a leap forward this year, demonstrating wider adoption across Europe, and a significant increase in the number of companies achieving awards.
There has been a dramatic overall improvement in scores:
•Companies scoring more than 70% increased from 17 in 2011/12 to 25 in 2012/13.
•Companies scoring less than 30% again decreased for the fourth year in a row, from 24 in 2011/12 to 17 in 2012/13.
•Even more impressive is that four companies achieved greater than 90%, double last year’s tally.
The leap forward is also reflected in the number of awards given:
•50% of the companies in the survey gained an award this year.
•18 Gold Awards, 14 Silver Awards and 11 Bronze Awards.
•43 awards in total, compared to 33 in total last year.
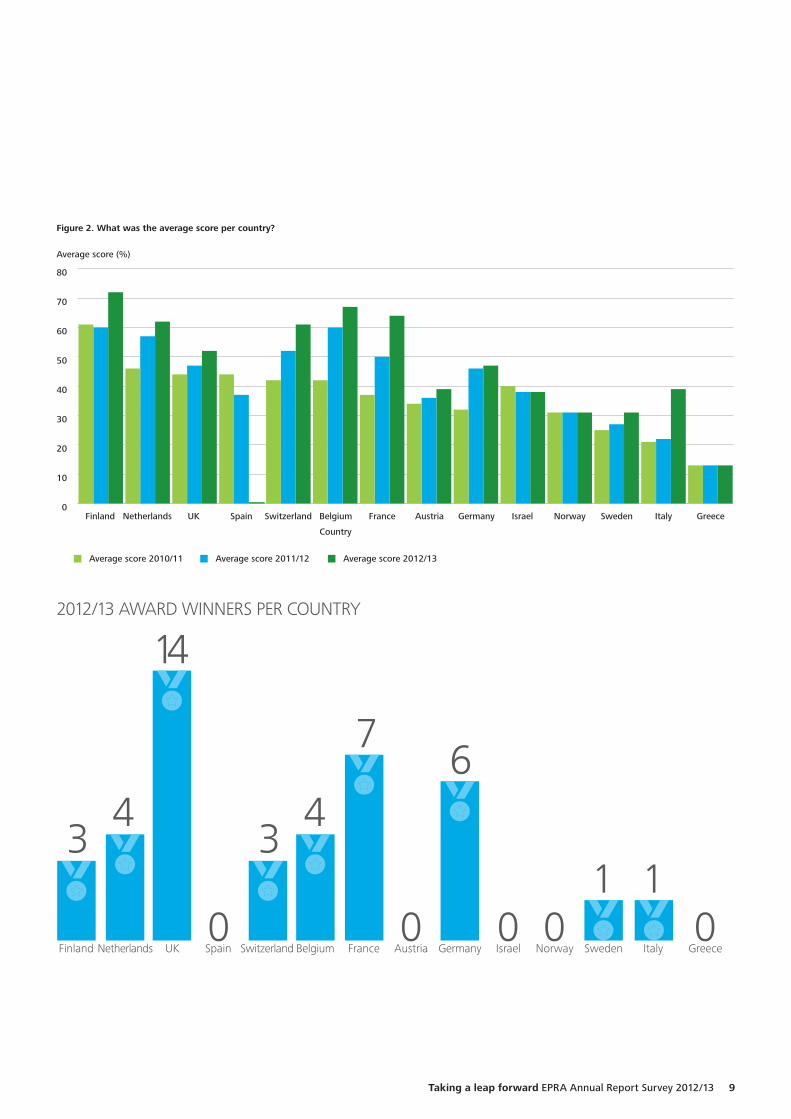
Analysis by countryThe leap forward in results is driven by significant improvements in the average scores for Switzerland, UK, France, Belgium, and Netherlands. These countries have shown consistent marked increases in their scores in the last two years.
The awards recognise companies in nine countries with seven of those countries receiving at least one gold award.
However it isn’t all good news. As we noticed in last year’s survey, the same four countries across Europe (Austria, Greece, Israel, and Norway) failed to achieve any awards.
With the BPR being refreshed this year to include the new EPRA cost metric, it is time for these countries to take notice of EPRA and the BPR and, invest time in bringing their financial reporting up to speed with the rest of their peers across Europe.
Figure 1. What is the distribution of scores?
Number of companies
2010/11 2011/12 2012/13
0-30% 30-40% 40-50%
Score
50-60% 60-70% 70-80% 80-90% 90-100%0
5
10
15
20
25
30
35
40
45
A leap forward in average scores: 25 companies scored more than 70% and companies scoring less than 30% decreased to 17
8
To start a new section, hold down the apple+shift keys and click
to release this object and type the section title in the box below.
Figure 2. What was the average score per country?
Average score (%)
Average score 2010/11 Average score 2011/12 Average score 2012/13
Finland Netherlands UK
Country
Spain Switzerland Belgium France Austria Germany Israel Norway Sweden Italy Greece0
10
20
30
40
50
60
70
80
UK
14
76
4 4
France GermanyNetherlands Belgium Norway Sweden Italy
1 1Austria Greece0
Israel0
Spain0 0
Finland0
3
Switzerland
3
2012/13 AWARD WINNERS PER COUNTRY
Taking a leap forward EPRA Annual Report Survey 2012/13 9
To start a new section, hold down the apple+shift keys and click
to release this object and type the section title in the box below.
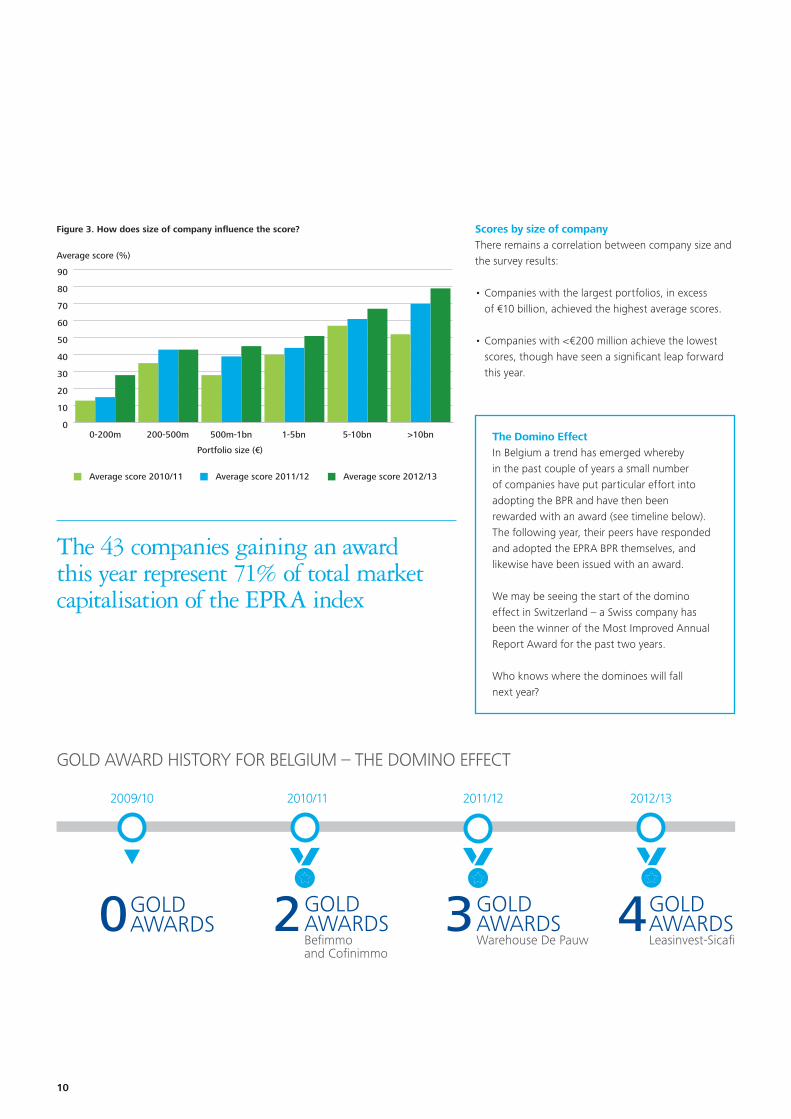
The Domino EffectIn Belgium a trend has emerged whereby in the past couple of years a small number of companies have put particular effort into adopting the BPR and have then been rewarded with an award (see timeline below). The following year, their peers have responded and adopted the EPRA BPR themselves, and likewise have been issued with an award.
We may be seeing the start of the domino effect in Switzerland – a Swiss company has been the winner of the Most Improved Annual Report Award for the past two years.
Who knows where the dominoes will fall next year?
Figure 3. How does size of company influence the score?
Average score (%)
Average score 2010/11 Average score 2011/12 Average score 2012/13
0-200m 200-500m 500m-1bn
Portfolio size (€)
1-5bn 5-10bn >10bn0
10
20
30
40
50
60
70
80
90
Scores by size of companyThere remains a correlation between company size and the survey results:
•Companies with the largest portfolios, in excess of €10 billion, achieved the highest average scores.
•Companies with <€200 million achieve the lowest scores, though have seen a significant leap forward this year.
The 43 companies gaining an award this year represent 71% of total market capitalisation of the EPRA index
2010/11
GOLDAWARDSBefimmoand Cofinimmo
2 GOLDAWARDSWarehouse De Pauw
3 GOLDAWARDSLeasinvest-Sicafi
4GOLDAWARDS0
2012/132009/10 2011/12
GOLD AWARD HISTORY FOR BELGIUM – THE DOMINO EFFECT
10
To start a new section, hold down the apple+shift keys and click
to release this object and type the section title in the box below.
5. EPRA reporting measures
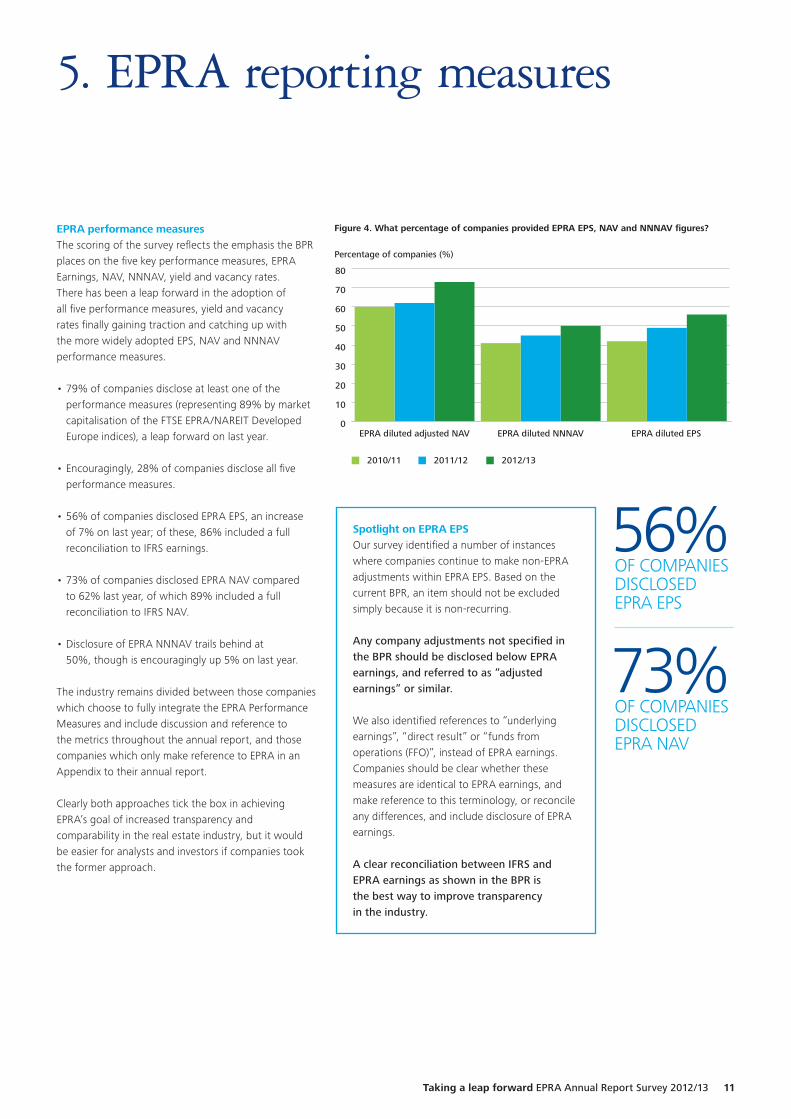
EPRA performance measuresThe scoring of the survey reflects the emphasis the BPR places on the five key performance measures, EPRA Earnings, NAV, NNNAV, yield and vacancy rates. There has been a leap forward in the adoption of all five performance measures, yield and vacancy rates finally gaining traction and catching up with the more widely adopted EPS, NAV and NNNAV performance measures.
•79% of companies disclose at least one of the performance measures (representing 89% by market capitalisation of the FTSE EPRA/NAREIT Developed Europe indices), a leap forward on last year.
•Encouragingly, 28% of companies disclose all five performance measures.
•56% of companies disclosed EPRA EPS, an increase of 7% on last year; of these, 86% included a full reconciliation to IFRS earnings.
•73% of companies disclosed EPRA NAV compared to 62% last year, of which 89% included a full reconciliation to IFRS NAV.
•Disclosure of EPRA NNNAV trails behind at 50%, though is encouragingly up 5% on last year.
The industry remains divided between those companies which choose to fully integrate the EPRA Performance Measures and include discussion and reference to the metrics throughout the annual report, and those companies which only make reference to EPRA in an Appendix to their annual report.
Clearly both approaches tick the box in achieving EPRA’s goal of increased transparency and comparability in the real estate industry, but it would be easier for analysts and investors if companies took the former approach.
Spotlight on EPRA EPSOur survey identified a number of instances where companies continue to make non-EPRA adjustments within EPRA EPS. Based on the current BPR, an item should not be excluded simply because it is non-recurring.
Any company adjustments not specified in the BPR should be disclosed below EPRA earnings, and referred to as “adjusted earnings” or similar.
We also identified references to “underlying earnings”, “direct result” or “funds from operations (FFO)”, instead of EPRA earnings. Companies should be clear whether these measures are identical to EPRA earnings, and make reference to this terminology, or reconcile any differences, and include disclosure of EPRA earnings.
A clear reconciliation between IFRS and EPRA earnings as shown in the BPR is the best way to improve transparency in the industry.
56%OF COMPANIESDISCLOSEDEPRA EPS
73%OF COMPANIESDISCLOSEDEPRA NAV
Figure 4. What percentage of companies provided EPRA EPS, NAV and NNNAV figures?
Percentage of companies (%)
2010/11 2011/12 2012/13
EPRA diluted adjusted NAV EPRA diluted NNNAV EPRA diluted EPS0
10
20
30
40
50
60
70
80
Taking a leap forward EPRA Annual Report Survey 2012/13 11
To start a new section, hold down the apple+shift keys and click
to release this object and type the section title in the box below.
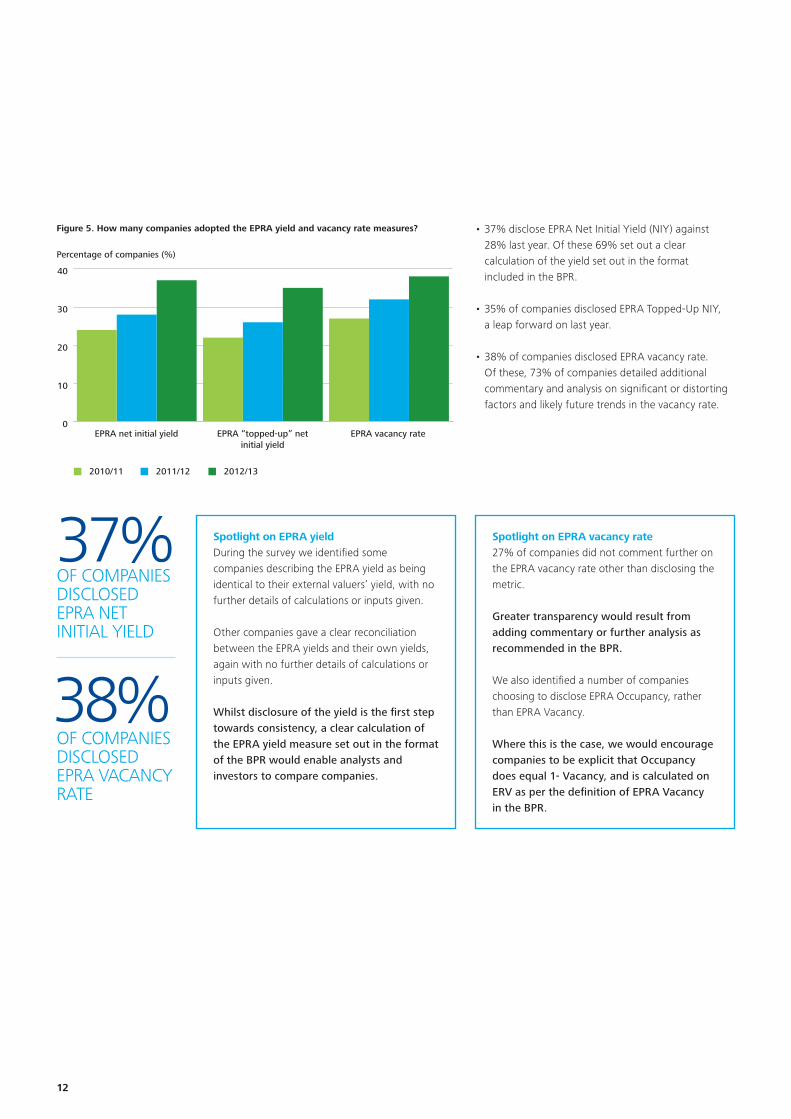
•37% disclose EPRA Net Initial Yield (NIY) against 28% last year. Of these 69% set out a clear calculation of the yield set out in the format included in the BPR.
•35% of companies disclosed EPRA Topped-Up NIY, a leap forward on last year.
•38% of companies disclosed EPRA vacancy rate. Of these, 73% of companies detailed additional commentary and analysis on significant or distorting factors and likely future trends in the vacancy rate.
Spotlight on EPRA vacancy rate27% of companies did not comment further on the EPRA vacancy rate other than disclosing the metric.
Greater transparency would result from adding commentary or further analysis as recommended in the BPR.
We also identified a number of companies choosing to disclose EPRA Occupancy, rather than EPRA Vacancy.
Where this is the case, we would encourage companies to be explicit that Occupancy does equal 1- Vacancy, and is calculated on ERV as per the definition of EPRA Vacancy in the BPR.
Spotlight on EPRA yieldDuring the survey we identified some companies describing the EPRA yield as being identical to their external valuers’ yield, with no further details of calculations or inputs given.
Other companies gave a clear reconciliation between the EPRA yields and their own yields, again with no further details of calculations or inputs given.
Whilst disclosure of the yield is the first step towards consistency, a clear calculation of the EPRA yield measure set out in the format of the BPR would enable analysts and investors to compare companies.
37%OF COMPANIES DISCLOSED EPRA NET INITIAL YIELD
38%OF COMPANIES DISCLOSED EPRA VACANCYRATE
Figure 5. How many companies adopted the EPRA yield and vacancy rate measures?
Percentage of companies (%)
2010/11 2011/12 2012/13
EPRA net initial yield EPRA “topped-up” netinitial yield
EPRA vacancy rate0
10
20
30
40
12
To start a new section, hold down the apple+shift keys and click
to release this object and type the section title in the box below.
NEW EPRA COST RATIOIN JULY 2013 EPRA PUBLISHED A NEW EPRA PERFORMANCE MEASURE, THE EPRA COST RATIO, WHICH IS TO BE INCORPORATED INTO THE BPR LATER THIS YEAR.
Whilst not the focus of this year’s survey, we have been encouraged by the number of companies in the survey who have either adopted some form of cost ratio, or have transparently disclosed some of the inputs into the EPRA cost ratio.
14% of companies included in the survey published a cost ratio, the majority of these being UK companies, although the definitions
and calculations were not consistently applied. None of the companies included in the survey disclosed cost ratios both including and excluding direct vacancy costs, which will be a requirement of the new EPRA BPR.
Whilst not all of these disclosures met the requirement of the EPRA measure, it is clear there is recognition amongst companies that the disclosure of a cost ratio is important, and we hope that there will be sufficient traction within the industry to be able to report significant adoption of the new EPRA cost ratio in next year’s survey.
6. Reporting developments
Non EPRA trends in financial reportingThis survey has focused on compliance with the EPRA BPR, which covers specific areas of disclosure, and rewards companies solely for compliance with the BPR.
The compliance with governance regulations in individual countries is not the focus of EPRA, nor of this survey and its awards, although we do take note of areas of emerging best practice in reporting in general and interesting trends. In particular, this year we have noted:
•companies including timelines showing activity on a month by month basis;
•clearer, often diagrammatical, linkage between the business model, risks and KPIs;
•one-page strategic summaries included at front of annual report;
•up front statements from Chairman on governance and remuneration; and
•separate property analysis booklets with lots of tables of information.
Companies should pay attention to their peers’ annual reports, identify areas where they could improve the overall quality of their annual reporting, not just EPRA compliance, and so help to increase confidence in investing in the listed real estate sector.
Taking a leap forward EPRA Annual Report Survey 2012/13 13
To start a new section, hold down the apple+shift keys and click
to release this object and type the section title in the box below.
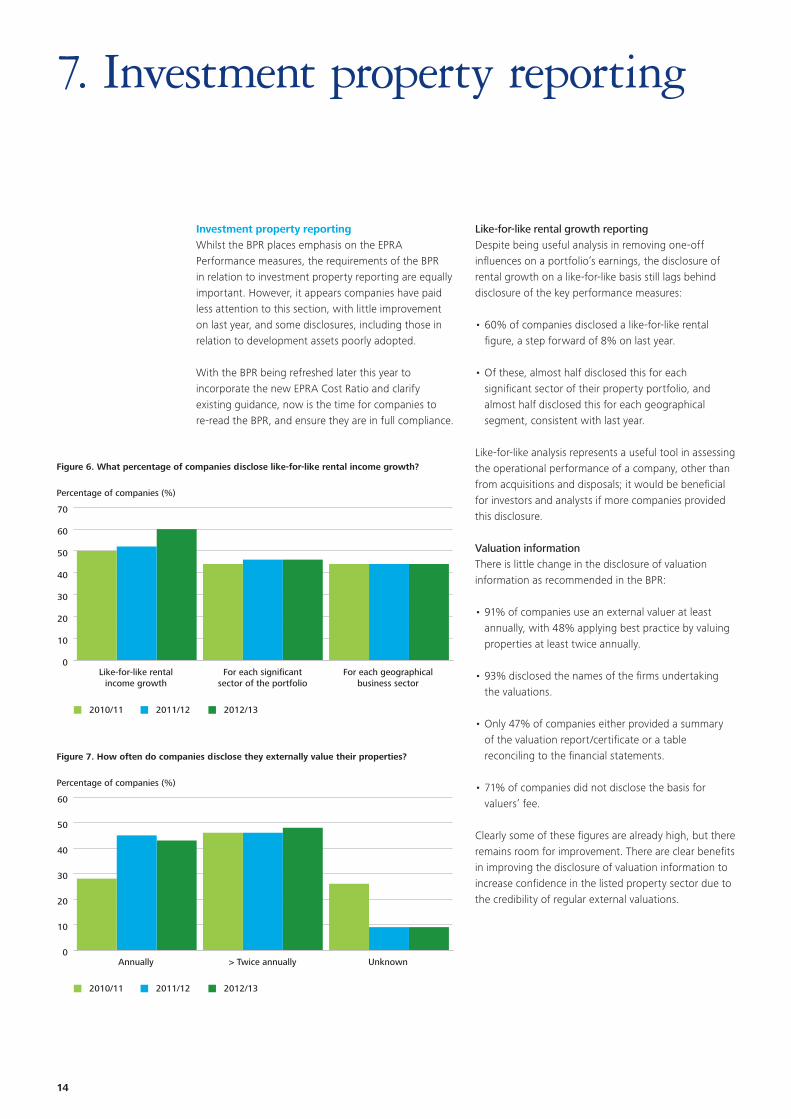
Like-for-like rental growth reportingDespite being useful analysis in removing one-off influences on a portfolio’s earnings, the disclosure of rental growth on a like-for-like basis still lags behind disclosure of the key performance measures:
•60% of companies disclosed a like-for-like rental figure, a step forward of 8% on last year.
•Of these, almost half disclosed this for each significant sector of their property portfolio, and almost half disclosed this for each geographical segment, consistent with last year.
Like-for-like analysis represents a useful tool in assessing the operational performance of a company, other than from acquisitions and disposals; it would be beneficial for investors and analysts if more companies provided this disclosure.
Valuation informationThere is little change in the disclosure of valuation information as recommended in the BPR:
•91% of companies use an external valuer at least annually, with 48% applying best practice by valuing properties at least twice annually.
•93% disclosed the names of the firms undertaking the valuations.
•Only 47% of companies either provided a summary of the valuation report/certificate or a table reconciling to the financial statements.
•71% of companies did not disclose the basis for valuers’ fee.
Clearly some of these figures are already high, but there remains room for improvement. There are clear benefits in improving the disclosure of valuation information to increase confidence in the listed property sector due to the credibility of regular external valuations.
Figure 6. What percentage of companies disclose like-for-like rental income growth?
Percentage of companies (%)
2010/11 2011/12 2012/13
Like-for-like rentalincome growth
For each significantsector of the portfolio
For each geographicalbusiness sector
0
10
20
30
40
50
60
70
Figure 7. How often do companies disclose they externally value their properties?
Percentage of companies (%)
2010/11 2011/12 2012/13
Annually > Twice annually Unknown0
10
20
30
40
50
60
Investment property reportingWhilst the BPR places emphasis on the EPRA Performance measures, the requirements of the BPR in relation to investment property reporting are equally important. However, it appears companies have paid less attention to this section, with little improvement on last year, and some disclosures, including those in relation to development assets poorly adopted.
With the BPR being refreshed later this year to incorporate the new EPRA Cost Ratio and clarify existing guidance, now is the time for companies to re-read the BPR, and ensure they are in full compliance.
7. Investment property reporting
14
To start a new section, hold down the apple+shift keys and click
to release this object and type the section title in the box below.
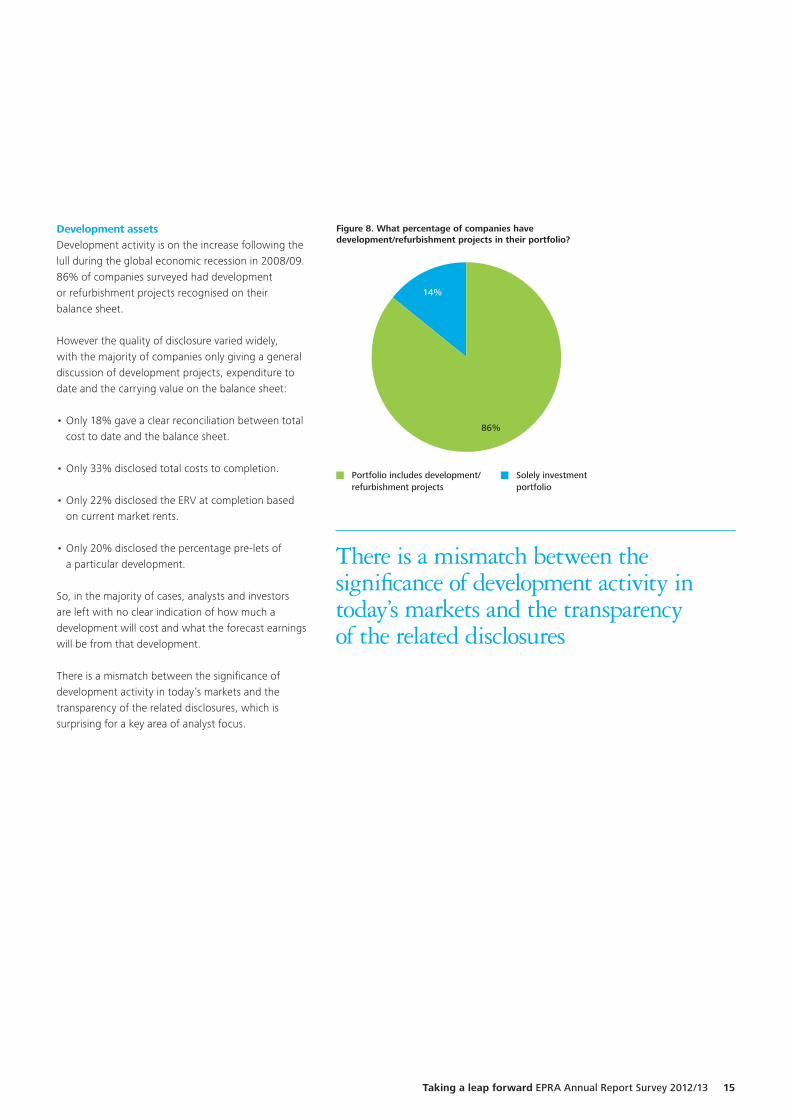
Development assetsDevelopment activity is on the increase following the lull during the global economic recession in 2008/09. 86% of companies surveyed had development or refurbishment projects recognised on their balance sheet.
However the quality of disclosure varied widely, with the majority of companies only giving a general discussion of development projects, expenditure to date and the carrying value on the balance sheet:
•Only 18% gave a clear reconciliation between total cost to date and the balance sheet.
•Only 33% disclosed total costs to completion.
•Only 22% disclosed the ERV at completion based on current market rents.
•Only 20% disclosed the percentage pre-lets of a particular development.
So, in the majority of cases, analysts and investors are left with no clear indication of how much a development will cost and what the forecast earnings will be from that development.
There is a mismatch between the significance of development activity in today’s markets and the transparency of the related disclosures, which is surprising for a key area of analyst focus.
Figure 8. What percentage of companies have development/refurbishment projects in their portfolio?
14%
86%
Portfolio includes development/refurbishment projects
Solely investment portfolio
There is a mismatch between the significance of development activity in today’s markets and the transparency of the related disclosures
Taking a leap forward EPRA Annual Report Survey 2012/13 15

To start a new section, hold down the apple+shift keys and click
to release this object and type the section title in the box below.
8. Award process
A detailed process was undertaken by the Deloitte real estate assurance team, comprising members from across Europe, to assess the annual reports of the 86 companies included in the FTSE EPRA/NAREIT Developed Europe REITs and Non-REITs indices.
Where applicable, Deloitte client engagement teams were excluded from the review of the relevant company annual reports to ensure that objectivity was maintained. A questionnaire set by Deloitte containing the key areas of focus based directly on the EPRA BPR was followed and was consistent across each of the companies surveyed.
THE REVIEW PROCESS
RANKING OF ALL COMPANIESBASED ON SCORING AND BPR SECTION WEIGHTINGAS PRE-DETERMINED IN CONJUNCTION WITH EPRA
THE MOST IMPROVED REPORTWAS IDENTIFIED BASED ON THE LARGEST INCREASE IN SCORE IN COMPARISON TO THE PRIOR YEAR REVIEW
DETAILED PRIMARY REVIEWOF ALL ANNUAL REPORTS WAS PERFORMED BYTHE DELOITTE REAL ESTATE ASSURANCE TEAM
SECONDARY REVIEWSWERE PERFORMED BY DELOITTE REAL ESTATE SPECIALISTS FOCUSING ON AREAS OF JUDGEMENTAND KEY MEASURES
BASED ON THE RESULTS,COMPANIES WERE IDENTIFIED FOR THE GOLD, SILVER AND BRONZE AWARDS
REVIEW AND DEBATE OF DELOITTE RECOMMENDATIONS BY DELOITTE REAL ESTATE SPECIALISTS AND CONCLUSIONON AWARDS TO BE ALLOCATED
1
2
4
5
3
6
16
To start a new section, hold down the apple+shift keys and click
to release this object and type the section title in the box below.
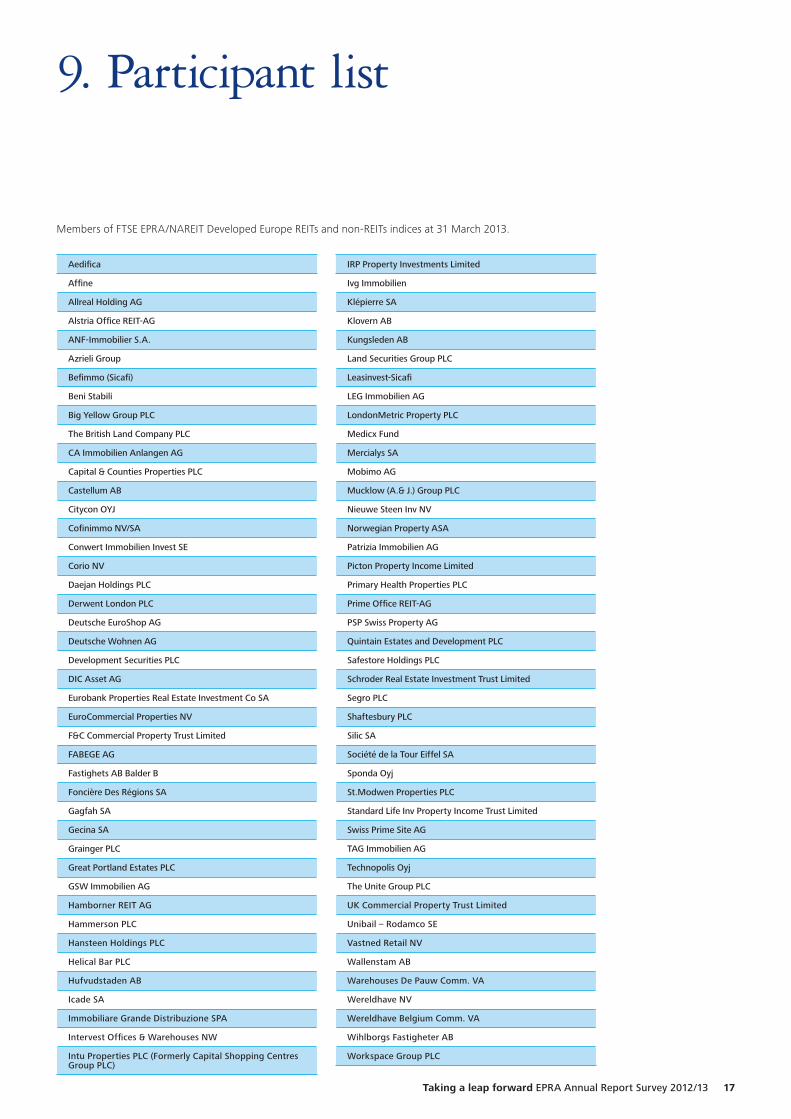
9. Participant list
Members of FTSE EPRA/NAREIT Developed Europe REITs and non-REITs indices at 31 March 2013.
Aedifica
Affine
Allreal Holding AG
Alstria Office REIT-AG
ANF-Immobilier S.A.
Azrieli Group
Befimmo (Sicafi)
Beni Stabili
Big Yellow Group PLC
The British Land Company PLC
CA Immobilien Anlangen AG
Capital & Counties Properties PLC
Castellum AB
Citycon OYJ
Cofinimmo NV/SA
Conwert Immobilien Invest SE
Corio NV
Daejan Holdings PLC
Derwent London PLC
Deutsche EuroShop AG
Deutsche Wohnen AG
Development Securities PLC
DIC Asset AG
Eurobank Properties Real Estate Investment Co SA
EuroCommercial Properties NV
F&C Commercial Property Trust Limited
FABEGE AG
Fastighets AB Balder B
Foncière Des Régions SA
Gagfah SA
Gecina SA
Grainger PLC
Great Portland Estates PLC
GSW Immobilien AG
Hamborner REIT AG
Hammerson PLC
Hansteen Holdings PLC
Helical Bar PLC
Hufvudstaden AB
Icade SA
Immobiliare Grande Distribuzione SPA
Intervest Offices & Warehouses NW
Intu Properties PLC (Formerly Capital Shopping Centres Group PLC)
IRP Property Investments Limited
Ivg Immobilien
Klépierre SA
Klovern AB
Kungsleden AB
Land Securities Group PLC
Leasinvest-Sicafi
LEG Immobilien AG
LondonMetric Property PLC
Medicx Fund
Mercialys SA
Mobimo AG
Mucklow (A.& J.) Group PLC
Nieuwe Steen Inv NV
Norwegian Property ASA
Patrizia Immobilien AG
Picton Property Income Limited
Primary Health Properties PLC
Prime Office REIT-AG
PSP Swiss Property AG
Quintain Estates and Development PLC
Safestore Holdings PLC
Schroder Real Estate Investment Trust Limited
Segro PLC
Shaftesbury PLC
Silic SA
Société de la Tour Eiffel SA
Sponda Oyj
St.Modwen Properties PLC
Standard Life Inv Property Income Trust Limited
Swiss Prime Site AG
TAG Immobilien AG
Technopolis Oyj
The Unite Group PLC
UK Commercial Property Trust Limited
Unibail – Rodamco SE
Vastned Retail NV
Wallenstam AB
Warehouses De Pauw Comm. VA
Wereldhave NV
Wereldhave Belgium Comm. VA
Wihlborgs Fastigheter AB
Workspace Group PLC
Taking a leap forward EPRA Annual Report Survey 2012/13 17
Deloitte refers to one or more of Deloitte Touche Tohmatsu Limited (“DTTL”), a UK private company limited by guarantee, and its network of member firms, each of which is a legally separate and independent entity. Please see www.deloitte.co.uk/about for a detailed description of the legal structure of DTTL and its member firms.
Deloitte LLP is the United Kingdom member firm of DTTL.
This publication has been written in general terms and therefore cannot be relied on to cover specific situations; application of the principles set out will depend upon the particular circumstances involved and we recommend that you obtain professional advice before acting or refraining from acting on any of the contents of this publication. Deloitte LLP would be pleased to advise readers on how to apply the principles set out in this publication to their specific circumstances. Deloitte LLP accepts no duty of care or liability for any loss occasioned to any person acting or refraining from action as a result of any material in this publication.
© 2013 Deloitte LLP. All rights reserved.
Deloitte LLP is a limited liability partnership registered in England and Wales with registered number OC303675 and its registered office at 2 New Street Square, London EC4A 3BZ, United Kingdom. Tel: +44 (0) 20 7936 3000 Fax: +44 (0) 20 7583 1198.
Designed and produced by The Creative Studio at Deloitte, London. 28797A
Deloitte has an unparalleled breadth and depth of services which make it a world force in its chosen areas of business – audit, tax, consulting and corporate finance. As a leading business advisory firm, we are renowned for our commitment to innovation, quality, client service excellence and for the calibre of our people.
We serve governments and a broad range of public sector departments, major international and leading corporates, mid market and high growth smaller companies and many private individuals. By harnessing talent and expertise across the firm, we deliver solutions to clients that inspire confidence in what we promise.
Deloitte Real Estate redefines the concept of a full-service real estate business, offering a breadth of capability and an innovative approach unequalled in the market.
Our team combines traditional property services with financial and business advisory expertise to deliver integrated solutions on the most simple assignment to the most complex. We apply a depth of insight drawn from our understanding of all industries and sectors to advise occupiers, lenders, investors and the public sector on every aspect of real estate in an increasingly complex world.
And as is the case with all of Deloitte’s services, you can be assured of our relentless focus on continually providing the highest standards of quality and integrity.
EPRA was established in 1999 and now represents over €250 billion of real estate assets – 90% of the market capitalisation of the FTSE EPRA/NAREIT Europe Index.
EPRA’s mission is to promote, develop and represent the European public real estate sector. Its members constitute property companies, investors, advisers and academics in the real estate sector. EPRA provides effective and continuous leadership in matters of common interest by publishing research and encouraging discussion of issues impacting the industry both within the membership and with a wide range of stakeholders, including the EU institutions, governmental and regulatory bodies, and business partners.
EPRA works to foster trust and encourage greater investment in listed real estate companies in Europe. EPRA develops policies concerning standards of reporting disclosure, taxation and industry practices, including EPRA Best Practices Recommendations (BPR). The EPRA BPR provides guidance for property investment companies on interpretation of IFRS, industry specific reporting practices, and key performance indicators. The aim of the EPRA BPR is to ‘raise the bar’ for listed property investment companies in Europe through improved consistency, comparability and transparency in reporting practices. The EPRA BPRs are continuously developed through wider consultation with EPRA members and other interested parties and fall under the jurisdiction of the EPRA Reporting and Accounting Committee.


![FTSE EPRA-NAREIT Global Real Estate Index Ground Rules v4 9[1]](https://img.pdfslide.net/doc/110x75/55cf99d1550346d0339f51df/ftse-epra-nareit-global-real-estate-index-ground-rules-v4-91.jpg)