Embed Size (px)
Citation preview

Taklimat Laporan Tahunan 2015 dan Laporan Kestabilan Kewangan dan Sistem Pembayaran 2015
Gabenor Bank Negara Malaysia 23 Mac 2016
Embargo
Not for publication or broadcast before 1800 hours on Wednesday, 23 March 2016

In 2015, the Malaysian economy is still on a stable growth path despite a challenging environment
Domestic Demand: 2014
Source: IMF, Department of Statistics, Malaysia and Bank Negara Malaysia
6.0 5.0
-2
0
2
4
6
8
2007 2009 2011 2013 2015p
Malaysian economy grew by 5.0% in 2015
Annual change (%)
Within the region, Malaysia was among the faster-growing economies
0.7
2.0
2.6
2.8
4.8
5.0
5.8
6.9
7.3
0 2 4 6 8
Chinese Taipei
Singapore
Korea
Thailand
Indonesia
Malaysia
Philippines
PR China
India
Annual change (%)
Real GDP Growth Real GDP Growth
Global growth: 3.3%
p preliminary
2

3.6 3.6 3.1
1.9 1.8 1.1
0.8 0.6 0.6
0.2
-0.5 -0.1 -1.0
1.1
-0.3 -0.8
-0.6
0.6
-4
-2
0
2
4
6
8
2013 2014 2015p
Change in Stocks Net Exports Public Investment Public Consumption Private Investment Private Consumption GDP Growth
• Private consumption:
- Weighed down by weaker sentiments and households adjusting to rising cost of living
- But supported by continued income growth and stable labour market conditions
• Private investment:
- Driven by the manufacturing and services sectors
• Net exports:
- Weighed down growth as domestic demand-driven imports grew stronger than exports
Private domestic demand continued to anchor growth
3
Contribution to growth (ppt.)
Real GDP Growth
Source: Department of Statistics, Malaysia p preliminary
3
-4
-2
0
2
4
6
8
10
12
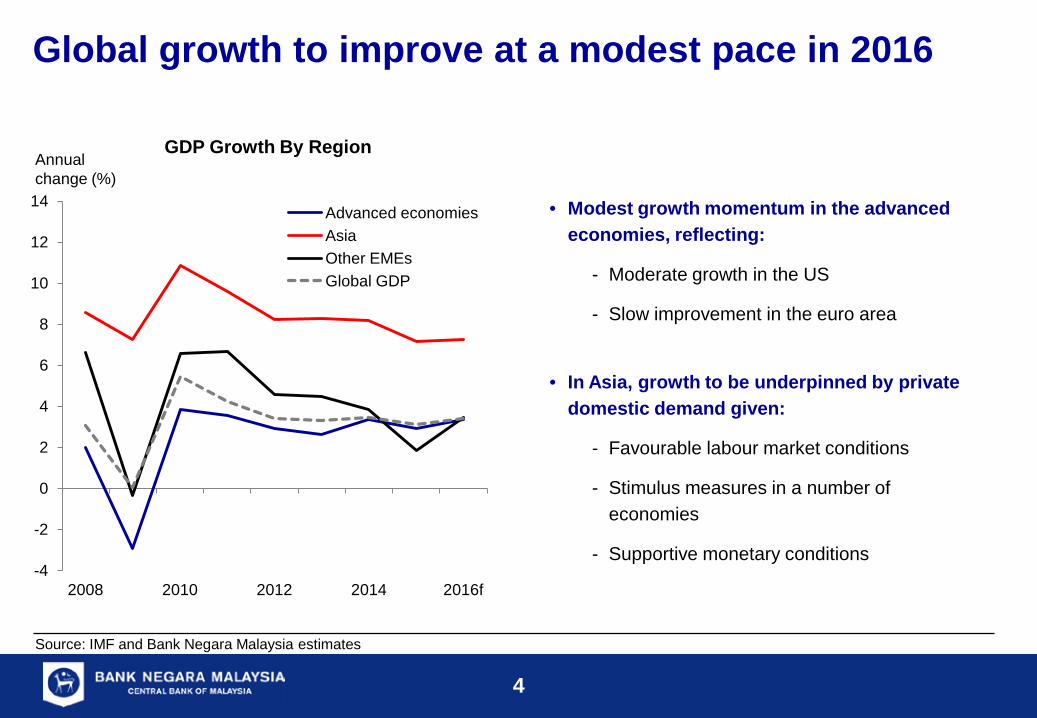
14
2008 2010 2012 2014 2016f
Advanced economies Asia Other EMEs Global GDP
GDP Growth By Region
L
• Modest growth momentum in the advanced economies, reflecting:
- Moderate growth in the US
- Slow improvement in the euro area
• In Asia, growth to be underpinned by private domestic demand given:
- Favourable labour market conditions
- Stimulus measures in a number of economies
- Supportive monetary conditions
Global growth to improve at a modest pace in 2016
Annual change (%)
Source: IMF and Bank Negara Malaysia estimates
4

L
5
Moderate expansion in global trade
• Structural and cyclical factors contribute to the decline in trade intensity
− Structural factors:
• Waning impact of previous drivers of trade growth
• Slower expansion of global value chains
• Weaker investment by corporates
− Cyclical factors:
• Modest economic recovery in a number of major advanced economies
• Greater economic and financial uncertainty
0
1
2
3
4
1992 1996 2000 2004 2008 2012 2016f
1990 – 2000
average : 2.1 times 2002 -
2007 average: 1.6 times
2011 - 2016
average: 1.0 times
Lower global trade intensity post-GFC
*The ratio increased significantly in 2009, due to weak world growth
2001: Dot-com bubble
2008 / 2009: GFC
World Trade-to-GDP Ratio* Ratio (No. of times)
Source: IMF and Bank Negara Malaysia estimates
5

Global inflationary pressures to remain subdued amid lower commodity prices
6
Low commodity prices to contain inflationary pressures across economies
Global commodity prices are expected to remain low in 2016 amid excess supply
0
1
2
3
4
5
6
Jan-10 Jan-11 Jan-12 Jan-13 Jan-14 Jan-15 Jan-16
G3***
Asia**
* Price index simple average of three spot prices - Brent, West Texas Intermediate, and the Dubai Fateh ** Asia refers to Chinese Taipei, Hong Kong SAR, Indonesia, Korea, Malaysia, the Philippines, PR China, Singapore and Thailand *** G3 refers to the US, euro area and Japan
0
50
100
150
200
250
2000 2004 2008 2012 2016f
Index (2005=100)
Selected Commodity Prices Headline Inflation Rates Annual change (%)
Metal
Crude Oil*
Food
Source: Haver, IMF and Bank Negara Malaysia estimates
6

Divergent but still very accommodative monetary policies in the major economies
0
10
20
30
40
50
60
70
80
Jan-08 Jan-10 Jan-12 Jan-14 Jan-16
…whereas ECB and BOJ continue with monetary accommodation through asset purchases and
negative interest rates Central Bank Balance Sheet Size
% of GDP
ECB
Fed
BOJ
Source: National authorities, Haver and Bank Negara Malaysia estimates
7
0
1
2
3
4
5
Jan-08 Jan-10 Jan-12 Jan-14 Jan-16
Policy Rates of Selected Major Central Banks
The US Federal Reserve has begun a slow-paced interest rate normalisation…
ECB
Fed
BOJ
Rate (%)

The Malaysian economy to expand at between 4.0 – 4.5% in 2016
• Domestic demand will continue to be the
principal driver of growth, sustained primarily
by the private sector
• External sector to provide support to growth
in 2016
• All economic sectors, except for agriculture,
are expected to expand, with the services and
manufacturing sectors remaining as the key
drivers of overall growth.
L
-2
0
2
4
6
8
2008 2009 2010 2011 2012 2013 2014 2015p 2016f
6.0
Annual change (%)
Real GDP Growth
5.0 4.5
4.0
Source: Department of Statistics, Malaysia and Bank Negara Malaysia p preliminary, f forecast
8

Domestic demand will continue to drive growth with support from external demand
Real GDP Annual change (%)
% share of GDP (2015)
2015p 2016f
Domestic demand (excluding stocks) 91.6 5.1 4.3
Private expenditure 69.2 6.1 5.2 Private consumption 52.4 6.0 5.1 Private investment 16.9 6.4 5.5
Public expenditure 22.4 2.1 1.6 Public consumption 13.5 4.3 2.0 Public investment 8.9 -1.0 1.1
Gross Fixed Capital Formation 25.8 3.7 4.0 Net exports of Goods & Services 8.6 -3.7 1.1
Exports of Goods & Services 73.0 0.7 3.2 Imports of Goods & Services 64.4 1.3 3.4
Real GDP 100.0 5.0 4.0 - 4.5
6.0
5.0
4.0 – 4.5
-2
-1
0
1
2
3
4
5
6
7
8
2014 2015p 2016f
Change in Stocks Net Exports Public Investment Public Consumption Private Investment Private Consumption GDP growth
Real GDP Growth Contribution to growth (ppt.)
Source: Department of Statistics, Malaysia and Bank Negara Malaysia p preliminary, f forecast
9

Private consumption to grow by 5.1% in 2016
6.0
5.1
4
5
6
7
8
9
2011 2012 2013 2014 2015p 2016f
Consumer spending to be affected by an environment of higher prices and greater uncertainty…
…but remain supported by continued income and employment growth
Unemployment and Salary Growth
2.9 3.2 3.3-3.5
5.5 5.6 5.5-6.0
0
1
2
3
4
5
6
7
2011 2012 2013 2014 2015p 2016f
Salary increment (Annual change, %)
Unemployment rate (Share of labour force, %)
Annual change (%)
Real Private Consumption Growth
Annual change (%)
Long-term average (1990-2014): 6.7%
Source: Department of Statistics, Malaysia, Bank Negara Malaysia and Malaysian Employers Federation (MEF) p preliminary, f forecast
10

52 72 75
148 153
108
20 14
4
0
50
100
150
200
250
300
2013 2014 2015
Manufacturing Services Primary
11.0
6.4 5.5
0
5
10
15
20
25
2011 2012 2013 2014 2015p 2016f
Long-term average (1990-2014): 8.5%
RM billion Approved Investment
by MIDA
However, growth remains supported by on-going and new investments, particularly in the manufacturing sector
Real Private Investment Growth
Private investment to trend below long-term average in 2016
219 240
187
Private investment to expand by 5.5%
Annual change (%)
Source: Department of Statistics, Malaysia Investment Development Authority (MIDA) and Bank Negara Malaysia p preliminary, f forecast
11

p preliminary, f forecast Note: G3 refers to the US, EU and Japan, NIEs refers to Hong Kong, Korea and Chinese Taipei
Malaysia’s exports supported by a diversified trade structure
Trade Annual change (%)
% share (2015) 2015p 2016f
Gross exports 100.0 1.9 2.4
Manufactured 80.2 6.5 5.6
E&E 35.6 8.5 5.5
Non-E&E 44.6 5.0 5.7
Commodities 19.2 -13.4 -11.1
Gross imports 100.0 0.4 4.9
Capital goods 14.0 0.0 8.9
Intermediate goods 58.2 -2.3 4.7
Consumption goods 9.1 24.1 3.0
Trade balance (RM billion) - 94.6 79.5
Continued expansion in manufactured exports amid a smaller decline in commodity exports
Malaysia’s exports supported by diversified structure across products and markets
19.2
35.6
44.6
0
20
40
60
80
100
2015
% share of total exports
Non-E&E
E&E
Commodities
Exports by Product
18.9
11.0
13.0
28.1
29.0
0
20
40
60
80
100
2015
% share of total exports
G3
China
ROW
ASEAN
NIEs
Exports by Market
Source: Department of Statistics, Malaysia
12

Current account to remain in surplus
p preliminary, f forecast
Narrower current account surplus reflects global developments and domestic structural transformation
0
50
100
150
200
250
300
350
400
2010 2011 2012 2013 2014 2015p 2016f
Gross Capital Formation
Savings-Investment Gap
RM billion
Gross National Savings
Continued expansion of investment activity, particularly to boost productivity and capacity
16.6 17.6
11.2
3.0 1-2
-12 -8 -4 0 4 8 12 16 20 24
-100
-50
0
50
100
150
200
2006 2008 2010 2012 2014 2016f Goods Services Primary income Secondary income % of GNI (RHS)
RM billion % of GNI Current Account Balance Savings-Investment Gap
Source: Department of Statistics, Malaysia
13

While ringgit has strengthened in recent months, volatility is likely to persist going forward
Ringgit has outperformed most regional currencies since end Sept 2015
-11.3
3.3
-29.4
10.6
-30
-20
-10
0
10
20
30
1 Sep 2014- 29 Sep 2015 30 Sep 2015- 22 Mar 2016
Regional Currencies (Average) MYR
NEER: -21.3% REER: -19.6%
NEER: 7.6% REER: 8.1%
Ringgit vis-à-vis USD
Note: Regional currencies include IDR, KRW, SGD, THB, TWD, INR, PHP, CNY
Ringgit volatility since September 2014 has exceeded levels in previous episodes of sharp adjustments
*Average historical volatility of the stated period. Historical volatility defined as a 22-day (trading days in 1 month) rolling standard deviation of daily currency change (%)
Historical Volatility* of Ringgit against USD
Pre-
GFC
GFC
Euro
pean
SD
C
Tape
r Tan
trum
Sinc
e Se
pt ‘1
4
0
1
2
3
4
5
6
7
8
9
10
Past MYR volatility
Annual change (%)
change (%)
Source: Bloomberg and Bank Negara Malaysia
14

Malaysia is well-positioned to smoothly intermediate the large volume in capital flows
Short-term capital flows were largely driven by conditions in the global financial markets
• Going forward, large and volatile shifts in
global liquidity will continue to shape capital
flow movements
• Malaysia will be able to withstand these
external shocks, drawing on its economic
adaptability, financial buffers and prevailing
robust policy framework
• Well-developed and resilient financial system
accord Malaysia the capacity to intermediate
large and volatile flows -30
-20
-10
0
10
20
30
1Q 2014
2Q 2014
3Q 2014
4Q 2014
1Q 2015
2Q 2015
3Q 2015
4Q 2015
Resident Non-Resident
RM billion Net Portfolio Flows
Source: Department of Statistics, Malaysia
15

1%
1%
2%
10%
13%
29%
44%
0 20 40 60 80 100
Nominees/ Custodians
Others
Insurance Companies
Banks
Pension Funds
Central Bank/ Government
Asset Management
Distribution of Non-resident Holdings in Government Bonds as at end-January’16
Non-resident holdings of Malaysian government bonds are stable, underpinned by long-term investors
29% 30%
0%
5%
10%
15%
20%
25%
30%
35%
0
50
100
150
200
250
300
Jan-14 Jun-14 Nov-14 Apr-15 Sep-15
Govt Bond (LHS) % NR of Govt (RHS)
Non-resident holdings of Malaysian government bonds are stable at 30%
Majority of non-residents are long-term investors
15
16
RM billion
Non-Resident Holdings of Malaysian Government Bonds
% NR holding
RM billion
Source: Bank Negara Malaysia Note: *Others include individuals, non-financial corporations and unidentified sectors
Jan-16

USD 118.7 billion USD384.1 billion
International reserves are adequate to provide a buffer against external shocks and facilitate international transactions
8.4
1.2
0
2
4
6
8
10
12
14
0
20
40
60
80
100
120
140
160
180
200
1991 1994 1997 2000 2003 2006 2009 2012 2015
Net International Reserves Retained import cover (RHS) Reserves/ST ext debt (RHS)*
15 Mar. 2016 USD96.1 bil
1997: USD21.7 bil
Reserves position remains at about four-times the level during Asian Financial Crisis
Redefinition of external debt
Net International Reserves
Source: Department of Statistics, Malaysia and Bank Negara Malaysia
0
10
20
30
40
50
60
70
80
90
100
2005 2015
Malaysia’s External Assets1
International reserves Bank & non-bank corporates external assets
2005
59%
25%
41%
75%
% share
Increased holdings of foreign assets by banks and corporations
1 International investment position
2015
USD billion Times
17

External debt remains manageable
696.6 747.5 833.7
0
200
400
600
800
1000
-20
0
20
40
60
80
100
120
140
160
2013 2014 2015 Revaluation changes Changes in external debt, excl. valuation changes Total external debt (RHS)
(68.4% of GDP)
(67.5%) (72.1%)
Contribution to changes in
external debt
• Healthy external debt profile:
- Contained risks of foreign exchange fluctuations as 36% of external debt is denominated in ringgit
- Limited rollover risks as 57.8% of external debt is skewed towards medium- to long-term tenures
- Debt service ratio remained low at 22.6%
Higher external debt in 2015 due mainly to foreign exchange valuation effects
18
RM billion RM billion
Total External Debt
Source: Department of Statistics, Malaysia and Bank Negara Malaysia

Foreign currency debt remains low while short-term external debt is mostly covered by assets
60.0*
41.8
0
20
40
60
1998 2015
% of GDP
262.0
324.8
0
100
200
300
400
2015
RM billion
Short-Term External Position of Banks and Non-bank Corporations
Foreign currency external debt remained stable at 41.8% of GDP
Short-term external debt is mostly covered by the short-term external assets
*Based on previous definition of external debt, which excludes trade credits
19
Short-term external
debt
Short-term external assets
Foreign Currency External Debt
Source: Department of Statistics, Malaysia and Bank Negara Malaysia

• Higher inflation reflects upward adjustment of
administered prices and the weaker ringgit
exchange rate
• Inflationary pressures will be mitigated by:
− Low global energy and commodity prices
− Subdued global inflation
− More moderate domestic demand
• However, rising cost of living continues to
affect low- and middle-income households
0
1
2
3
4
5
6
2008 2009 2010 2011 2012 2013 2014 2015 2016f
3.5
2.1 2.5
Long-term average (1991-2015) = 3%
While headline inflation to range between 2.5 – 3.5% in 2016, cost of living expected to remain elevated Annual change (%)
Inflation Forecast
Source: Department of Statistics, Malaysia and Bank Negara Malaysia f forecast
20

Monetary policy will focus on sustainable economic growth and price stability
• Monetary policy in 2016 will focus on ensuring
monetary conditions remain supportive of the
sustainable growth of the domestic economy
and price stability
• The Bank will continue to ensure that liquidity
is sufficient, to support the orderly functioning
of the money and foreign exchange markets
3.25
1
2
3
4
Jan-09 Jan-10 Jan-11 Jan-12 Jan-13 Jan-14 Jan-15 Jan-16
Overnight Policy Rate (OPR) Rate (%)
Source: Bank Negara Malaysia
21

151 184 220 232 239 273 0
300
600
900
1200
1500
2010 2011 2012 2013 2014 2015
Loans Disbursed to SMEs Loan Disbursements by the Banking System and DFIs Funds Raised via Capital Markets
1,084
842 926
1,124
Continued access to financing for private sector
Gross Financing through Banking System and the Capital Markets*
• Going forward, financing activity is expected to remain supportive of economic activity
− Level of loans disbursed to remain healthy, and broad-based across all economic sectors
− Funds raised from the capital market to be sustained given continued investment activity
1,208 1,225
RM billion
*Comprises gross loans from the banking system and DFIs, and gross funds raised from the capital markets Source: Bank Negara Malaysia
22

Borrowing costs for the private sector remain stable
• Private sector will continue to benefit from stable financing costs
− Lending rates in the banking system remains stable. In particular, lending rates to businesses and SMEs remain below their long-run average
− Despite financial market volatility, cost of financing from the capital markets remains attractive for fund-raising
2
3
4
5
6
7
Overall private sector
Overall businesses
SMEs Large Corporate (5y
AAA PDS)
Long-run average* Jan-16
Interest Rates to the Private Sector
Note: * Average (Jan 2002 – Dec 2015)
Rate (%)
Source: Bank Negara Malaysia
23

55.5 97.4
11.8 16.1
0
10
20
0
50
100
150
1998 2015 Size of Bond Market Capital Ratio* (RHS)
Malaysia’s macroeconomic fundamentals remain supportive of growth
61.7
69.2
50
60
70
80
2011 2013 2015p
% of GDP
3.7
2.9 3.2
2.5
3.0
3.5
4.0
2009 2012 2015p
Rate (%)
0.6 1.7
3.2 2.1
0
4
8
2009 2011 2013 2015p
Annual change (%)
Steady growth path High private sector participation in the economy
Low and stable inflation environment
Stable labour market conditions
Deeper markets and strong financial buffers
-1.5
7.4 6.0 5.0
-4
0
4
8
12
2009 2011 2013 2015p
Current account balance reflects strong investment
15.8
3.0 0
10
20
30
2009 2011 2013 2015p
Annual change (%)
% of GNI Current Account Balance Headline Inflation
Real GDP Private Expenditure Unemployment Rate
% of nominal GDP
Size of Bond Market and Banking Capital Ratio
%
* Capital ratio in ‘98 refers to the risk-weighted capital ratio; Ratio in 2015 refers to total capital ratio, reported based on Basel III Capital Adequacy Framework adopted since January 2013.
Source: Department of Statistics, Malaysia and Bank Negara Malaysia
24
p preliminary

The economy remains resilient with the ability to manage potential downside risks to growth
In this challenging environment, the Malaysian economy is projected to expand by 4.0 – 4.5% in 2016, driven by domestic demand Lower and more stable inflation of 2.5 – 3.5%
Downside risks to growth emanating from global and domestic developments - Moderate recovery in the major economies - Further weakness in global commodity prices - Households’ ongoing adjustments to higher cost of living
Malaysia’s strong fundamentals and benefits from earlier reforms and structural adjustments - Diversified sources of growth - Favourable external position - Well-capitalised banking system and well-developed capital markets
1
3
4
2
25

Financial position remained stable in 2015:
• Total assets of BNM amounted to RM440.6 billion with International Reserves of RM409.1 billion (USD 95.3 billion)
• Net profit of RM7.79 billion
• Dividend of RM3.0 billion to the Government
Bank Negara Malaysia: Annual Financial Statements 2015
26

RM bil
Total Income 11.79
Less:
Recurring Expenditure 1.21
Development Expenditure 2.74
Taxation 0.05
Total Expenditure 4.00
Net Profit 7.79
Income Statement (Year ended 31 December 2015)
0
100
200
300
400
500
Assets Gold and Foreign Exchange IMF Reserve Position SDR MGS Deposits with FIs Loans and Advances Land and Buildings Other Assets
Statement of Financial Position (as at 31 December 2015)
RM billion
0
100
200
300
400
500
Liabilities and Capital
Total Capital Total Liabilities
RM billion
Updated
Bank Negara Malaysia: Annual Financial Statements 2015
27

Laporan Kestabilan Kewangan dan Sistem Pembayaran 2015
28

• Financial institutions continue to
maintain strong capitalisation with ample
liquidity buffers and sustained
profitability
• Malaysian banks adopt global reforms
from a strong starting point
• Stable asset quality, reinforced by sound
provisioning practices
Financial stability in 2016 to remain sound Banking sector (%) 2014 Jan ‘16
Capitalisation Common equity tier 1 ratio Total capital ratio Excess capital buffer (RM bil)
13.3 15.9 107.2
12.8 16.4 120.5
Profitability Return on assets Return on equity
1.5 15.2
1.3 12.2
Asset quality Net impaired loans ratio Loans in arrears (1-<3 mths)
1.2 2.5
1.2 2.2
Liquidity position Liquidity coverage ratio*
-
124.7
Insurance/Takaful sector (%) 2014 2015 Capitalisation
Capital adequacy ratio – Insurance Capital adequacy ratio – Takaful Capital buffer (RM bil)
251.9 190.2 32.3
251.9 190.3 46.0
Profitability Profit (RM bil)
16.9
14.7
* Basel III Liquidity Coverage Ratio requirement implemented from 1 June 2015, superseding the previous Liquidity Framework and Liquidity Framework-i requirements
29

1,031 960
2,116 2,018
0
4
8
12
16
0 500
1,000 1,500 2,000 2,500
2010 2011 2012 2013 2014 2015 Debt Financial asset Debt growth (RHS) Financial asset growth (RHS)
Household debt and financial assets • Household debt: Slower pace of growth
since 2010
‒ Sustained slower expansion in personal financing (+4.6%)
‒ Share of debt by vulnerable borrowers declined further (23.6%), with stable leverage
• Stable growth in average house prices since 2Q 2014
‒ Speculative purchases with borrowings remained in check
‒ Continued strong demand for affordable housing
‒ 74% of housing loans are to first time house buyers
Sustained moderation in the growth of household debt and property prices RM billion Annual change (%)
0
4
8
12
16
0
5
10
15
20
1Q 2007
1Q 2008
1Q 2009
1Q 2010
1Q 2011
1Q 2012
1Q 2013
1Q 2014
1Q 2015
Borrowers with ≥3 HL MHPI (RHS)
LTV 70%
Malaysian House Price Index (MHPI) and number of Housing Loan (HL) borrowers
Annual change (%) Annual change (%) LTV 60%
30
4Q 2015

• Expansion in domestic borrowings (+9.5%) remained close to long term trend
- Driven by capital expenditure for private sector investments and public infrastructure projects
• Higher external borrowings (24.8% of GDP) largely driven by exchange rate valuation effects
- 54% of external debt associated with trade credits, non-resident holdings of RM-denominated securities and intra-group borrowings, with low currency and funding risks
• Overall debt servicing capacity of businesses remained sound
- Relatively low share of debt-at-risk
- Aggregate debt service capacity of large borrowers supported by stable and healthy cash buffers
Expansion in corporate borrowings reflected increased domestic investment activities
0
20
40
60
80
100
2014 2015 2014 2015 2014 2015
Average for regional comparators
Malaysia % of debt
Return on assets >3%
Interest coverage ratio>1.5 times
Debt-to-equity ratio <1 time
131.7%
94.6% 98.5% 96.8% 104.8%
45.5 42.5 40.0
46.8*
25
35
45
55
0
50
100
150
1998 2012 2013 2014 2015 Domestic Loans to GDP Domestic PDS to GDP External debt to GDP Debt-to-Equity ratio (RHS)
% of GDP %
Corporate Leverage and Debt Composition
Distribution of Corporate Debt by Financial Indicators * First nine month
31

32
• Banking system surplus liquidity remained high at RM178.3 billion as at January 2016
• Measures taken by the Bank to ease funding pressures amid heightened deposit competition
‒ Liquidity facilities
‒ Reduction in SRR
• Expansion of liquidity metrics to capture effects of financial deepening on banks funding structure
‒ Publication of loan-to-funds and loan-to-funds and equity ratios from January 2016
Liquidity and funding conditions remained supportive of financing activities
60
80
100
120
140
0
100
200
300
400
500
Jun-15 Jul-15 Aug-15 Sep-15 Oct-15 Nov-15 Dec-15 Jan-16
% RM bil
Banks' surplus liquidity placed with BNM (including SRR) Stock of HQLA Liquidity Coverage Ratio (RHS)
Banking System Surplus Liquidity and LCR
70
75
80
85
90
M J S D M J S D M J S D
% Banking System Funding Ratios
Loan-to-deposit ratio Loan-to-funds ratio 2013 2014 2015

• Domestic banking groups maintained net external asset position reflect operations of overseas branches and subsidiaries
• Net external liability position of locally-incorporated foreign banks reflects parent funding, as operations in Malaysia remain profitable
• Banks continue to maintain prudent risk controls to manage credit risks and currency and maturity mismatches
‒ Capitalisation, profitability and asset quality of overseas operations remain healthy
Risk of contagion from banks’ external exposures were well-contained
0
8
16
24
32
2014 2015 2014 2015 2014 2015
Capital ratio Return on equity Gross impaired loans ratio (RHS)
%
0
2
4
6 % Range of Key FSI of Selected Overseas Operations
-120
-80
-40
0
40
80
-450
-300
-150
0
150
300
2011 2012 2013 2014 2015
RM billion RM billion Banks’ external assets and liabilities
Interbank Deposits & nostro Loans Debt securities Capital funds Securities under custody Others Banking system net exposures Net exposures of LIFBs (RHS) Net exposures of DBGs (RHS)
Assets
Liabilities
33

• Capitalisation of banks and insurers remained above minimum regulatory requirement under simulated stress scenarios:
‒ Synchronised sharp economic slowdown and banking sector distress in several major trade partners;
‒ Heightened geopolitical tensions;
‒ Protracted commodity market rebalancing and extreme global financial market volatility; and
‒ Domestic economy in recession deeper than 2008 with sharp correction across major asset classes.
4
9
14
19
24
2015 2016 2017 2018 2019 2015 2016 2017 2018 2019
%
1st quartile Median 3rd quartile Average
Banks’ post-shock common equity tier 1 capital ratio
Adverse scenario 2 Adverse scenario 1
System-wide post-shock capitalisation from the Bank’s multiyear solvency stress test
Banks Total capital ratio: 10.4% and 9.9% Common equity Tier-1 ratio: 7.6% and 6.9%
Insurers Capital adequacy ratio between 176% and 245%
Banks and insurers well-placed to withstand severe macroeconomic and financial shocks
34

• Malaysia’s admission into the Renminbi Qualified Foreign Institutional Investor (RQFII) programme by PR China in November 2015
- Enables development of more renminbi-denominated financial products
- Guidance Note issued jointly by the Bank and Securities Commission Malaysia to facilitate applications by qualified Malaysian institutions
Measures to further promote the utilisation of renminbi as a settlement currency
Continued expansion in financing for SMEs
1 2
Effective financial intermediation and the further deepening of financial markets have continued to support economic activity
• Financing to SMEs expanded by 14.4% to RM273.3 billion
• Additional RM1 billion funding for the Shariah Compliant SME Financing Scheme
0 50
100 150 200 250 300
2011 2012 2013 2014 2015
RM billion Loans disbursed to SMEs
35

ASEAN financial integration gained further traction
Conclusion of ASEAN Banking Integration Framework
Liberalisation of foreign exchange administration measures
Broad framework on ASEAN Financial Integration post-2015
Operationalisation of first local currency trade settlement framework in
ASEAN currencies
• Greater market access and operational flexibilities for Qualified ASEAN Banks based on mutually agreed commitments between home and host countries in the region
1 3
2 4
• To facilitate cross-border offerings of collective investment scheme (CIS) products within ASEAN under the ASEAN Capital Market Forum
• 10-year plan based on the three pillars of financial integration, financial stability and financial inclusion
• Further integration opportunities to be pursued in areas of financial sector, capital market and cross border payments
• Collaboration with the Bank of Thailand to promote the use of the ringgit and Thai baht for settlement activities
36

Strengthening independence and role of the
appointed actuary
Implementation of capital
management for takaful operators Implementation of
Life Insurance and Family Takaful
Framework
Phased liberalisation of motor and fire insurance
tariffs Standards on
management of participating life
insurance business
Improving consumer outcomes and promoting long-term sustainability in the insurance/takaful sector
37

New
R Further liberalisation of Motor and Fire Tariffs will benefit consumers while ensuring long-term sustainability
* New products/coverage not defined under the Motor/Fire Tariff, or any variation to, or extension of, existing products/coverage.
Roadmap for further liberalisation
Assessment of readiness of consumers and industry for further liberalisation
Removal of tariff rates for Motor
Comprehensive and Motor Third Party Fire
and Theft policies
Gradual adjustments for Motor Third Party
tariff rates
Gradual adjustments to Fire Tariff rates
Insurers may introduce new non-tariff products and optional add-on covers*
Existing tariff-based products will continue to be available
Motor Class Fire Class
1 July 2017 onwards
2019 onwards
Outcomes achieved Initiatives under New Motor Cover Framework
Gradual adjustments to the Motor Tariff (2012-
2015)
Inter-agency committee to drive efficiency
improvements
24-hour nationwide accident call centre
Loss ratio for bodily injury and death claims
improved from 301% to 210%
42% reduction in declined risks
(previously under MMIP)
Claim settlement time reduced by 17%
More than 1,000 calls to Accident Assist
Call Centre per month
Number of complaints reduced by 33%
1 July 2016 onwards
38

55% women
Gender
Age group
46% from age of 15-24 years old
Income
86% no income & low income
33% in East Malaysia
Region
8% of adult population still unbanked
Convenient accessibility
Malaysia’s Financial Inclusion Indicators
• Mukim with at least 2,000 population with at least one access point
• Population living in mukim with at least one access point
• Deposit accounts
• Micro enterprise with financing accounts
2011 2015
Take-up rate (adult population)
Responsible usage
• Customers with active deposit accounts
• Customers with performing financing accounts
Satisfaction level
• Malaysians who are satisfied with overall financial services
46%
98% 82%
91% 92%
73% 51%
92% 87%
98% 97%
73% 61%
96%
3
2
1
4
• Need to improve take-up rate among lower income groups for financial services
• Microsavings, microinsurance/ microtakaful and microfinancing products to be pursued to expand reach
Further progress in financial inclusion
39

Development Financial
Institutions Act (Amendment)
2015
Business Activities
Regulatory Oversight
Shariah Governance
Business Conduct & Consumer Protection
Enforcement Framework
Corporate Governance
Further strengthen the ability of DFIs to support Malaysia’s socio-economic development and promote inclusive growth
Ensure sound financial management and improve the operational efficiency and resilience of DFIs to ensure long-term sustainability
Key outcomes
1
2
3
4
5
6
Enhanced provisions
New provisions
Amendments to DFIA will support more effective role and performance of DFIs
40

Operationalisation of Financial Ombudsman Scheme
My Ringgit My Tabung My BNM BNM MyLINK
• To commence operations in 2Q 2016 with expanded scope and, enhanced governance and operational arrangements
• Progressive integration of financial education into formal school curriculum
• Targeted financial education programmes by AKPK to more than 370,000 adults in 2015
• Launched nationwide Financial Capability and Inclusion Demand Side survey to measure financial capability levels of consumers
• Introduced mobile applications to elevate consumer awareness and skills in money management matters
Supported by sustained financial education agenda
Expansion of AKPK’s Debt Management Programme to non-
bank borrowers
3
2
1
• Services expanded to borrowers of non-banks including credit cooperatives and Malaysia Building Society Berhad
Expansion of redress and debt resolution arrangements for financial consumers
41

Continued development of an efficient Islamic financial system built on strong Shariah foundations
• Expansion of investment accounts
- New investment accounts offered by 8 Islamic banks as part of measures to comply with IFSA
- RM47.1 billion placed in investment accounts as at end December 2015 representing 10% of total funding of Islamic banks
- Investment Account Platform serves as an online market place for entrepreneurs and investors to participate in investment accounts
• Further progress on development of a comprehensive Shariah contract-based regulatory framework
- 13 key Shariah standards and 5 operational guidelines issued to date
42

R
Payment indicators 2011 2015 2020 target
E-payment per capita 49 82 200
Cheques cleared (million) 205 148 100
Card terminals (per 1,000 inhabitants)
7 9 25
Debit card transactions per capita
1 3 30
Five focus areas to accelerate the migration to e-payments
Cheques, IBG and IBFT Transaction Volume
Price signal Industry incentive structure
Awareness and confidence
Quality and value proposition
Access points
• Encouraging progress in the migration away from cheques with accelerated decline rate
• Payment Card Reform Framework to promote wider acceptance and usage of debit cards
Cheques
IBG
0
2
4
6
8
10
12
14
16
18
20
J M M J S N J M M J S N J M M J S N J M M J S N J M M J S N
Million
2015 2014 2013 2012 2011
IBFT
50 sen cheque fee and ePIF framework
IBFT fee capped at 50 sen
IBG fee capped at 10 sen
Increasing momentum in the migration to e-payments
43

Strong leadership
Technically competent
Qualified and certified
Ethical and professional
Creation of comprehensive infrastructure to nurture a deep professional talent pool
Recent Key Outcomes
1
2
3
4
• Training institutes and standard-setters continually enhanced and evolving to deliver highest, globally-benchmarked standards in learning
• Over 50,000 technically-competent banking, insurance and Islamic finance employees produced in past 5 years
• Over 20,000 strong leaders including senior management, Board of Director and Shariah experts nurtured in past 5 years
• Chartered Banker qualifications track benchmarked against the highest standards of industry excellence and professionalism
• Over 1,300 students enrolled/registered
• Industry code of ethics (CoE) published in January 2016 will set a high bar for professionalism and ethics
Lead Institutions
44
Professionalising talent to meet the evolving need of the financial sector

Financial sector is in a stronger position to cope with the more challenging environment
Resilient financial institutions and ample liquidity to support financial intermediation activities - Financial institutions well-placed to withstand severe macroeconomic and financial shocks Deep and diversified financial system will continue to support orderly market conditions Priorities of the Bank going forward include: - Maintaining close vigilance over domestic developments and management of risks by
financial institutions including overseas operations - Continuing with the implementation of global prudential standards and insurance reforms - Strengthening inter-agency and cross-border arrangements for management of financial
stability
1
2
45
3

Financial sector is in a stronger position to cope with the more challenging environment
Resilient financial institutions and ample liquidity to support financial intermediation activities - Financial institutions well-placed to withstand severe macroeconomic and financial shocks Deep and diversified financial system will continue to support orderly market conditions Priorities of the Bank going forward include: - Maintaining close vigilance over domestic developments and management of risks by
financial institutions including overseas operations - Continuing with the implementation of global prudential standards and insurance reforms - Strengthening inter-agency and cross-border arrangements for management of financial
stability
1
2
46
3