Embed Size (px)
Citation preview
TAMÁS NOVÁK International Economics VI.
Development and competitiveness indicators
Readings
Human Development Report 2009.
http://hdr.undp.org/en/media/HDR_2009_EN_Overview.pdf
http://hdr.undp.org/en/media/HDR_2009_EN_Indicators.pdf
Poverty Facts and Stats http://www.globalissues.org/article/26/poverty-facts-and-stats
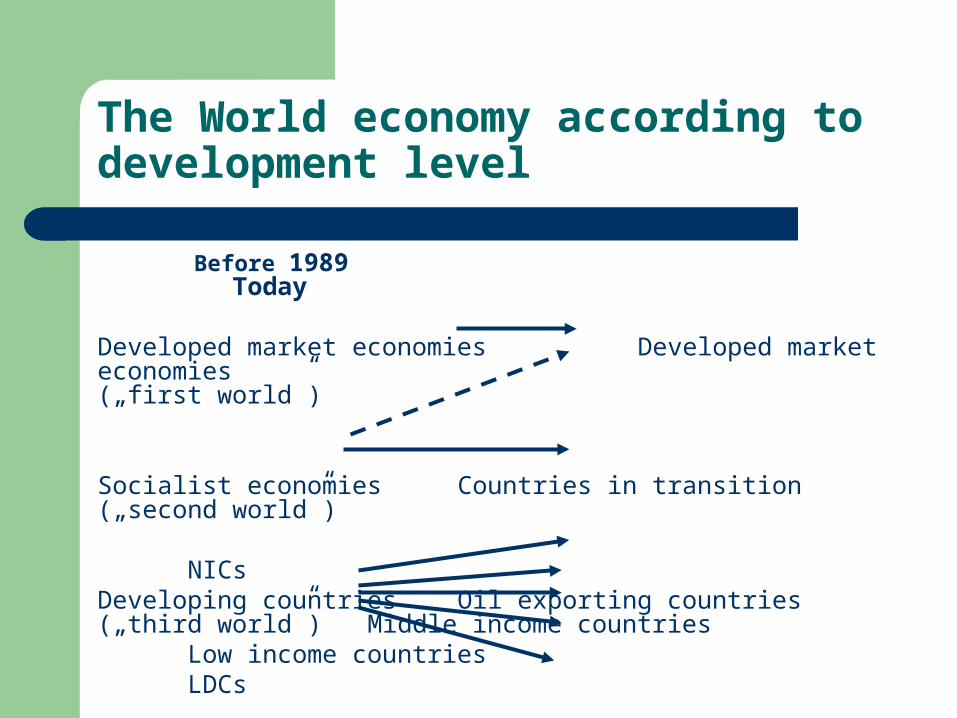
The World economy according to development level
Before 1989 Today
Developed market economies Developed market economies („first world”)
Socialist economies Countries in transition(„second world”)
NICsDeveloping countries Oil exporting countries(„third world”) Middle income countries
Low income countries LDCs
Successful path of industrialisation – via export of manufactured goods
HPAE (High Performing Asian Economies) or NIC (Newly Industrialised Countries:
1. Hong-Kong, Taiwan, Singapour, South Korea
Export oriented industrialisation: the East Asian miracle
2. Malaysia, Indonesia, Thailand, Philippines
3. China, Vietnam
High growth rates, open to international trade
Other factors:– high saving rates – rapid improvement in education
Export oriented industrialisation: the East Asian miracle

Measuring economic development and backwardness I.
– Static and dynamic indicators;– Economic performance;– Structure;– External trade;– Infrastructure;– Society, demography, health care;– Competitiveness.

Measuring economic development and backwardness II.
„Human development index” (UNCTAD): composition of three basic indicators – GNI (PPP);– Life expectancy at birth;– Adult literacy rate, combined gross enrolment
ratio.

HDI value Life expectancy at birth (years)
Adult literacy rate (% ages 15 and above)
Combined gross enrolment ratio (%)
GDP per capita(PPP US$)
1. Norway (0.971) 1. Japan (82.7) 1. Georgia (100.0)
1. Australia (100.2)
1. Liechtenstein (85,382)
41. Poland (0.880) 65. Saint Lucia (73.6)
19. Albania (99.0)
28. Bahrain (90.4)
44. Bahamas (20,253)
42. Slovakia (0.880) 66. Occupied Palestinian Territories (73.3)
20. Antigua and Barbuda (99.0)
29. Belarus (90.4)
45. Slovakia (20,076)
43. Hungary (0.879) 67. Hungary (73.3)
21. Hungary (98.9)
30. Hungary (90.2)
46. Hungary (18,755)
44. Chile (0.878) 68. Bahamas (73.2)
22. Italy (98.9) 31. Latvia (90.2)
47. Antigua and Barbuda (18,691)
45. Croatia (0.871) 69. Bulgaria (73.1)
23. Croatia (98.7)
32. Ukraine (90.0)
48. Barbados (17,956)
182. Niger (0.340) 176. Afghanistan (43.6)
151. Mali (26.2) 177. Djibouti (25.5)
181. Congo (Democratic Republic of the) (298)

Income disparities in the world economy, TOP15 countries (HDI Report 2009)
Rank Country Intl. $
1 Qatar 87,717
2 Luxembourg 78,723
3 Norway 53,269
4 Brunei 50,103
5 Singapore 49,433
6 United States 46,443
7 Switzerland 42,948
8 Ireland 39,441
9 Netherlands 39,278
10 Austria 38,896
11 Kuwait 38,876
12 Canada 38,290
13 United Arab Emirates 38,284
14 Australia 37,302
15 Iceland 37,243

Rank Country Intl. $
40 Slovakia 21,374
44 Hungary 18,548
46 Estonia 18,051
47 Poland 17,989
48 Croatia 17,876
50 Lithuania 15,803
51 Russia 15,039
54 Latvia 14,304
67 Bulgaria 11,760
68 Romania 11,755
176 Niger 736
177 Guinea-Bissau 489
178 Burundi 401
179 Liberia 379
180 Congo, Democratic Republic of the 334
Income disparities in the world economy, some CEE countries and the last 5 (HDI Report 2009)

Indicators of inequality

Indicators of inequality
Lorenz curve– Percentage of households is plotted on the x-axis, the percentage of
income on the y-axis. – Every point on the Lorenz curve represents a statement like "the
bottom 20% of all households have 10% of the total income." – Perfectly equal income distribution would be one in which every
person has the same income. In this case, the bottom "N"% of society would always have "N"% of the income. This can be depicted by the straight line "y" = "x"; called the "line of perfect equality.
– By contrast, a perfectly unequal distribution would be one in which one person has all the income and everyone else has none. In that case, the curve would be at "y" = 0 for all "x" < 100%, and "y" = 100% when "x" = 100%. This curve is called the "line of perfect inequality
Indicators of inequality
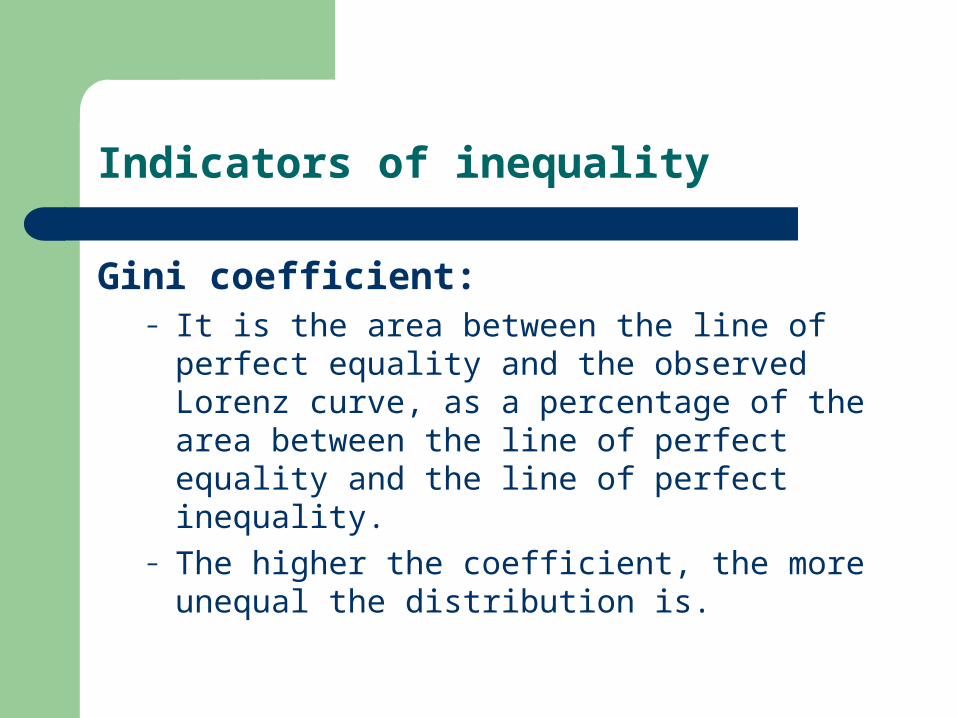
Gini coefficient: – It is the area between the line of perfect equality
and the observed Lorenz curve, as a percentage of the area between the line of perfect equality and the line of perfect inequality.
– The higher the coefficient, the more unequal the distribution is.

Explanations of poverty
– Demography;– Dual economic structure;– Problems with agriculture, worsening
terms of trade;– Mistakes in economic policy.
Dual economy
The division of a single economy into two sectors that appear to be at a very different levels of development (e.g. a modern, capital-intensive, high wage industrial sector and a very poor traditional agricultural sector) is referred to as economic dualism.
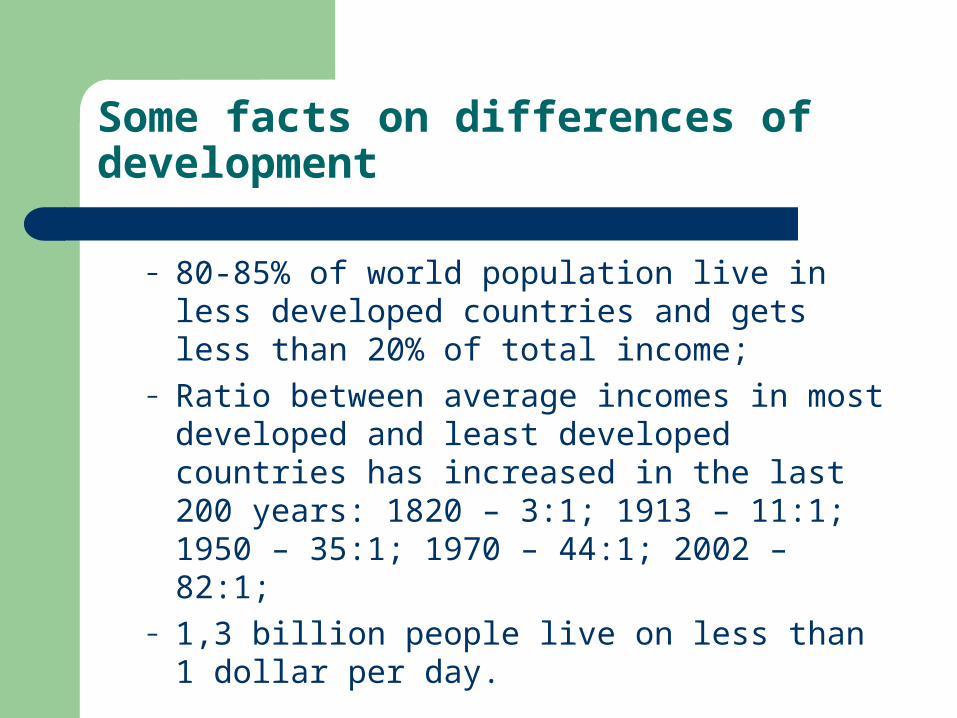
Some facts on differences of development
– 80-85% of world population live in less developed countries and gets less than 20% of total income;
– Ratio between average incomes in most developed and least developed countries has increased in the last 200 years: 1820 – 3:1; 1913 – 11:1; 1950 – 35:1; 1970 – 44:1; 2002 – 82:1;
– 1,3 billion people live on less than 1 dollar per day.

Some facts on differences of development
– More than 800 million people are threatened continuously by hunger;
– 35% world population (above 18) is illiterate; – Migration due to wars and political abuses; – Cumulative process of indebtedness.
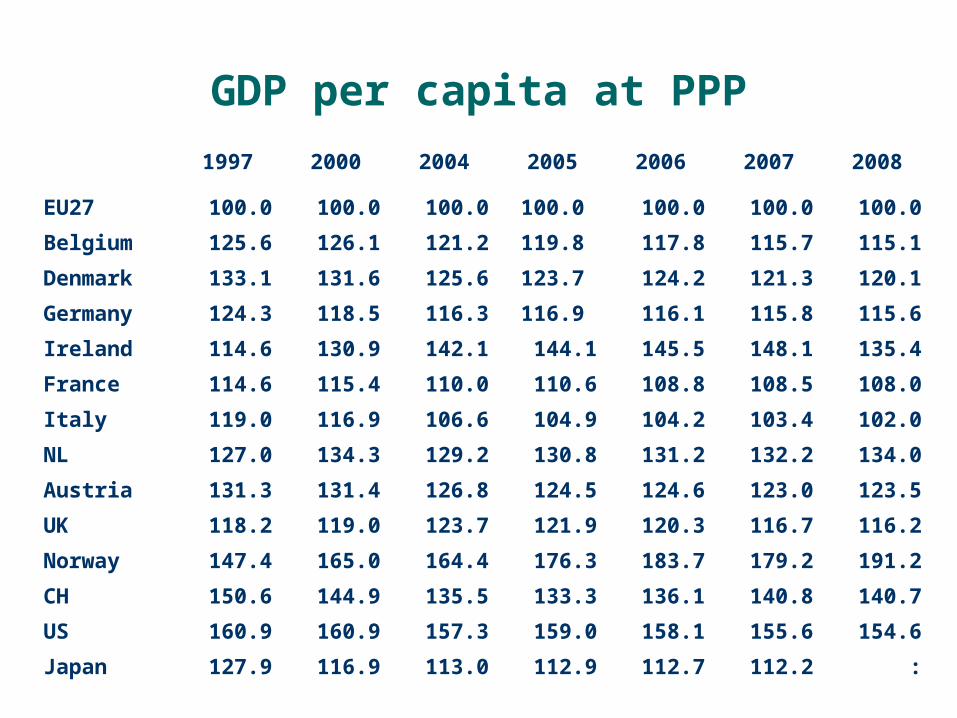
1997 2000 2004 2005 2006 2007 2008
EU27 100.0 100.0 100.0 100.0 100.0 100.0 100.0
Belgium 125.6 126.1 121.2 119.8 117.8 115.7 115.1
Denmark 133.1 131.6 125.6 123.7 124.2 121.3 120.1
Germany 124.3 118.5 116.3 116.9 116.1 115.8 115.6
Ireland 114.6 130.9 142.1 144.1 145.5 148.1 135.4
France 114.6 115.4 110.0 110.6 108.8 108.5 108.0
Italy 119.0 116.9 106.6 104.9 104.2 103.4 102.0
NL 127.0 134.3 129.2 130.8 131.2 132.2 134.0
Austria 131.3 131.4 126.8 124.5 124.6 123.0 123.5
UK 118.2 119.0 123.7 121.9 120.3 116.7 116.2
Norway 147.4 165.0 164.4 176.3 183.7 179.2 191.2
CH 150.6 144.9 135.5 133.3 136.1 140.8 140.7
US 160.9 160.9 157.3 159.0 158.1 155.6 154.6
Japan 127.9 116.9 113.0 112.9 112.7 112.2 :
GDP per capita at PPP
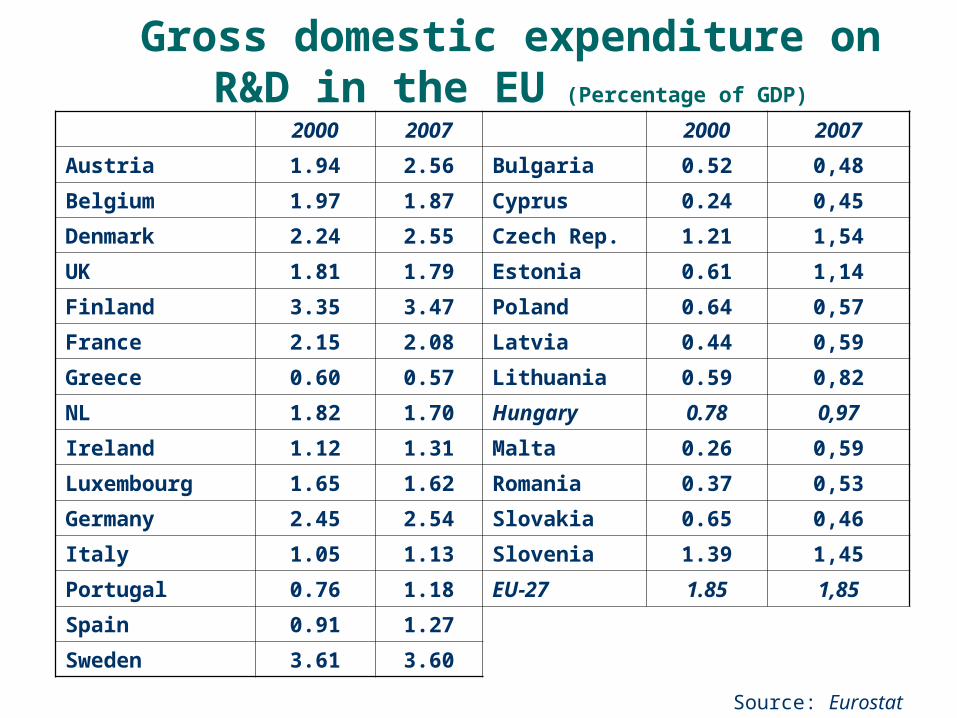
Gross domestic expenditure on R&D in the EU (Percentage of GDP)
2000 2007 2000 2007
Austria 1.94 2.56 Bulgaria 0.52 0,48
Belgium 1.97 1.87 Cyprus 0.24 0,45
Denmark 2.24 2.55 Czech Rep. 1.21 1,54
UK 1.81 1.79 Estonia 0.61 1,14
Finland 3.35 3.47 Poland 0.64 0,57
France 2.15 2.08 Latvia 0.44 0,59
Greece 0.60 0.57 Lithuania 0.59 0,82
NL 1.82 1.70 Hungary 0.78 0,97
Ireland 1.12 1.31 Malta 0.26 0,59
Luxembourg 1.65 1.62 Romania 0.37 0,53
Germany 2.45 2.54 Slovakia 0.65 0,46
Italy 1.05 1.13 Slovenia 1.39 1,45
Portugal 0.76 1.18 EU-27 1.85 1,85
Spain 0.91 1.27
Sweden 3.61 3.60
Source: Eurostat
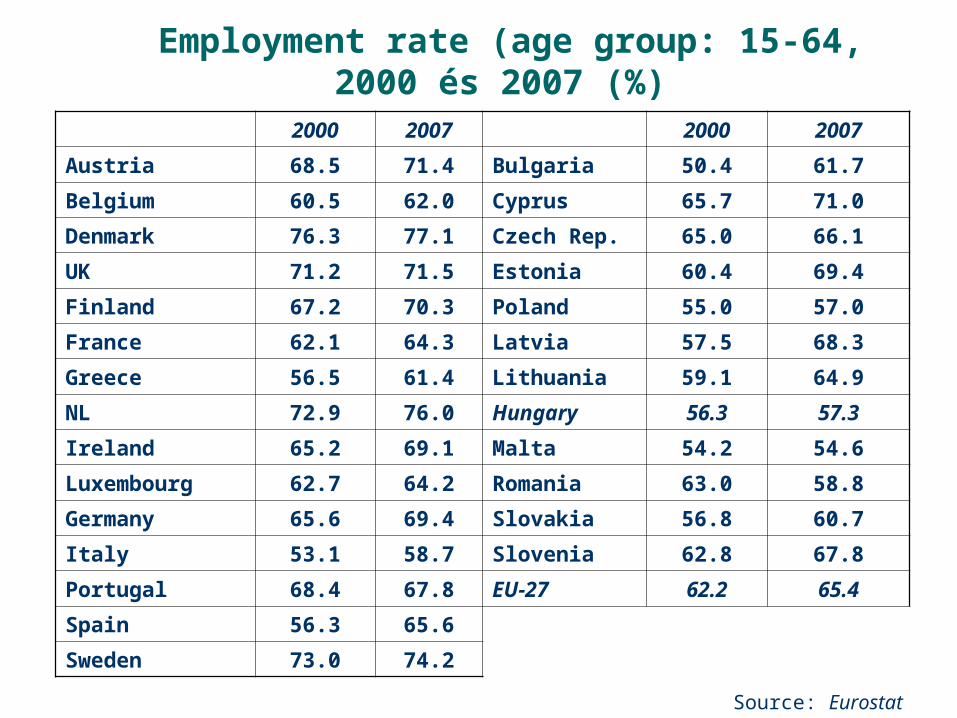
Employment rate (age group: 15-64, 2000 és 2007 (%)
2000 2007 2000 2007
Austria 68.5 71.4 Bulgaria 50.4 61.7
Belgium 60.5 62.0 Cyprus 65.7 71.0
Denmark 76.3 77.1 Czech Rep. 65.0 66.1
UK 71.2 71.5 Estonia 60.4 69.4
Finland 67.2 70.3 Poland 55.0 57.0
France 62.1 64.3 Latvia 57.5 68.3
Greece 56.5 61.4 Lithuania 59.1 64.9
NL 72.9 76.0 Hungary 56.3 57.3
Ireland 65.2 69.1 Malta 54.2 54.6
Luxembourg 62.7 64.2 Romania 63.0 58.8
Germany 65.6 69.4 Slovakia 56.8 60.7
Italy 53.1 58.7 Slovenia 62.8 67.8
Portugal 68.4 67.8 EU-27 62.2 65.4
Spain 56.3 65.6
Sweden 73.0 74.2
Source: Eurostat
Definitions of competitiveness (WEF)
Country-level / macroeconomic competitiveness
World economic Forum (WEF):– Institutions, policies and factors influencing
productivity and growth potential of a given country.

– Basic requirements:
1. Institutions;2. Infrastructure;3. Macroeconomic stability;4. Health and primary education.
Key for factor-driven economies
Pillars of competitiveness (WEF)

– Efficiency enhancers:
5. Higher education and training;6. Goods market efficiency;7. Labour market efficiency;8. Financial market sophistication;9. Technological readiness;10. Market size.
Key for efficiency-driven economies
Pillars of competitiveness (WEF)

– Innovation and sophistication factors:
11. Business sophistication;12. Innovation.
Key for innovation-driven economies.
Pillars of competitiveness (WEF)
Global competitiveness rankings
WEF: Global Competitiveness Report 2009-2010
133 countries110 „hard” (statistical) and „soft” (based on questionnaire) data
Global Competitiveness Index, GCI

WEF competitiveness ranking, 2009-2010
GCIAccording to pillars
Basic requirements
Efficiency enhancers
Innovation factors
1.Switzerland 3. 3. 3.
2. USA 28. 1. 1.
3. Singapore 2. 2. 10.
4. Sweden 5. 7. 4.
5. Denmark 4. 6. 7.
…
129. Mozambique 129. 124. 113.
130. Mali 128. 127. 102.
131. Chad 131. 131. 126.
132. Zimbabwe 132. 130. 124.
133. Burundi 133. 133. 119.

WEF competitiveness ranking, 2009-2010
GCIAccording to pillars
Basic requirements
Efficiency enhancers
Innovation factors
31. Czech Rep. 45. 24. 26.
35. Estonia 34. 27. 42.
37. Slovenia 29. 37. 30.
46. Poland 71. 31. 46.
47. Slovakia 54. 34. 57.
53. Lithuania 47. 47. 53.
58. Hungary 58. 45. 61.
64. Romania 86. 49. 75.
68. Latvia 60. 51. 86.
76. Bulgaria 80. 62. 89.

International Institute for Management Development:
The IMD World Competitiveness Yearbook (WCY) is the world’s most renowned and comprehensive annual report on the competitiveness of nations, ranking and analyzing how a nation’s environment creates and sustains the competitiveness of enterprises.
Definitions of competitiveness (IMD)
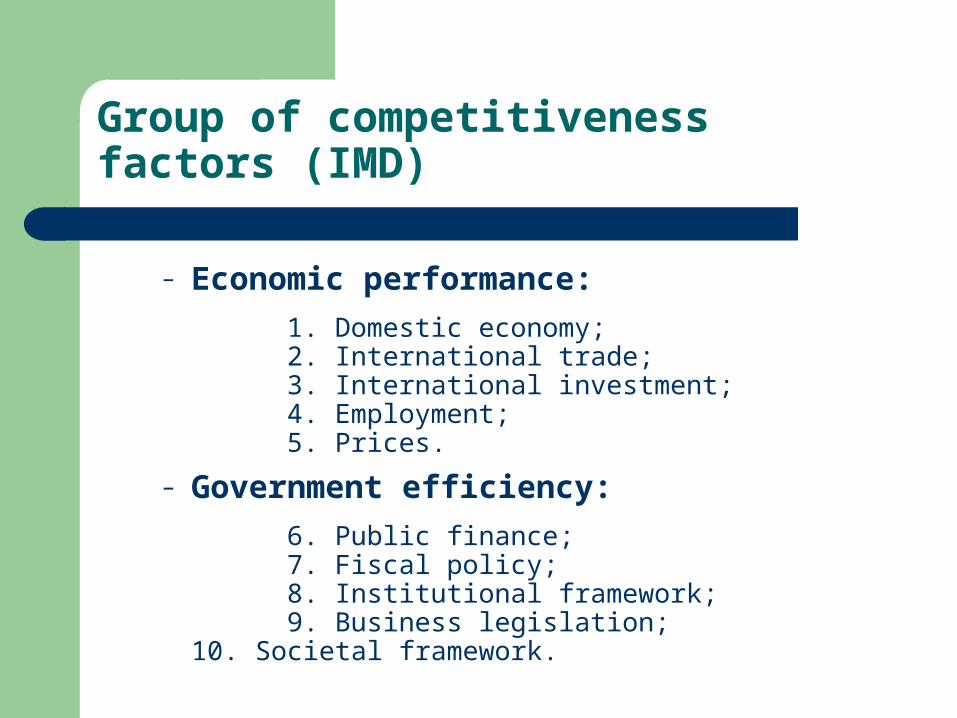
– Economic performance:
1. Domestic economy;2. International trade;3. International investment;4. Employment;5. Prices.
– Government efficiency:
6. Public finance;7. Fiscal policy;8. Institutional framework;9. Business legislation;
10. Societal framework.
Group of competitiveness factors (IMD)

– Business efficiency:11. Productivity;12. Labour market;13. Finance;14. Management practices;15. Attitudes and values.
– Infrastructure:16. Basic infrastructure;17. Technological infrastructure;18. Scientific infrastructure;19. Health and environment;20. Education.
Group of competitiveness factors (IMD)

Krugman :
International competitiveness today can not be understand at country level, but rather between enterprises.
Competitiveness = productivity
Critics

57 countries329 „hard” and „soft” dataValue: 0-100
World Competitiveness Score, WCS
IMD: World Competitiveness Yearbook 2009
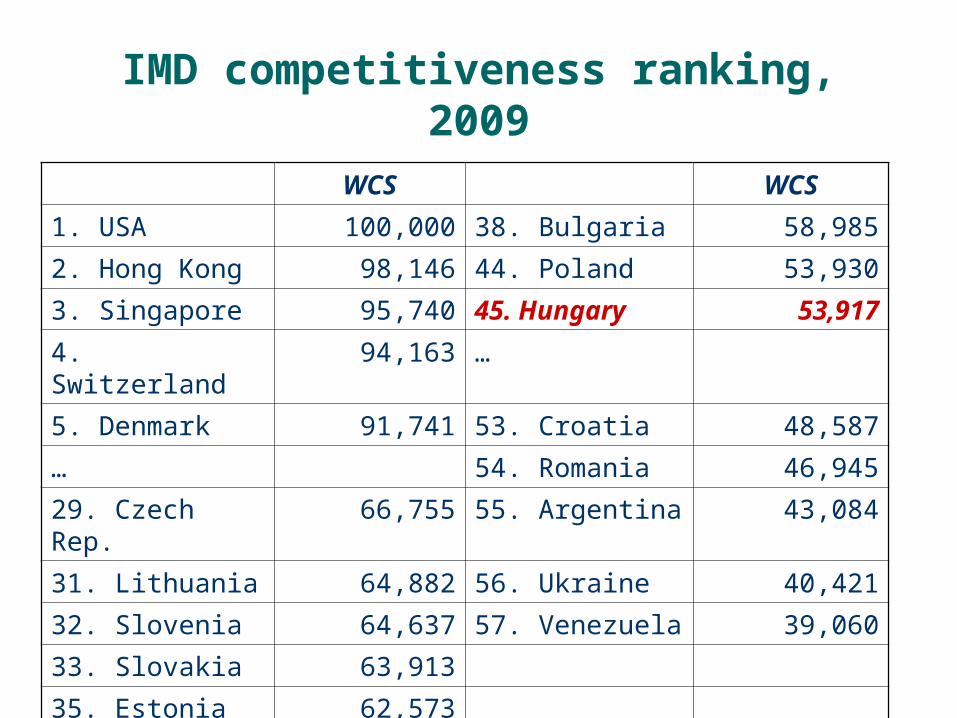
IMD competitiveness ranking, 2009
WCS WCS
1. USA 100,000 38. Bulgaria 58,985
2. Hong Kong 98,146 44. Poland 53,930
3. Singapore 95,740 45. Hungary 53,917
4. Switzerland 94,163 …
5. Denmark 91,741 53. Croatia 48,587
… 54. Romania 46,945
29. Czech Rep. 66,755 55. Argentina 43,084
31. Lithuania 64,882 56. Ukraine 40,421
32. Slovenia 64,637 57. Venezuela 39,060
33. Slovakia 63,913
35. Estonia 62,573
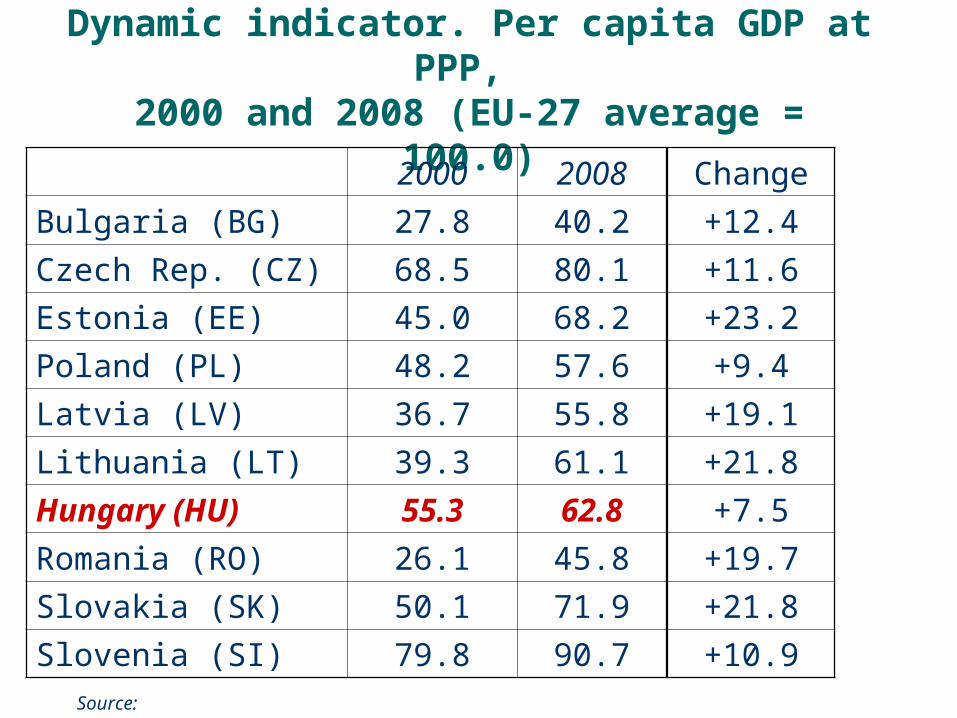
Dynamic indicator. Per capita GDP at PPP, 2000 and 2008 (EU-27 average = 100.0)
2000 2008
Bulgaria (BG) 27.8 40.2
Czech Rep. (CZ) 68.5 80.1
Estonia (EE) 45.0 68.2
Poland (PL) 48.2 57.6
Latvia (LV) 36.7 55.8
Lithuania (LT) 39.3 61.1
Hungary (HU) 55.3 62.8
Romania (RO) 26.1 45.8
Slovakia (SK) 50.1 71.9
Slovenia (SI) 79.8 90.7Source: Eurostat
Change
+12.4
+11.6
+23.2
+9.4
+19.1
+21.8
+7.5
+19.7
+21.8
+10.9
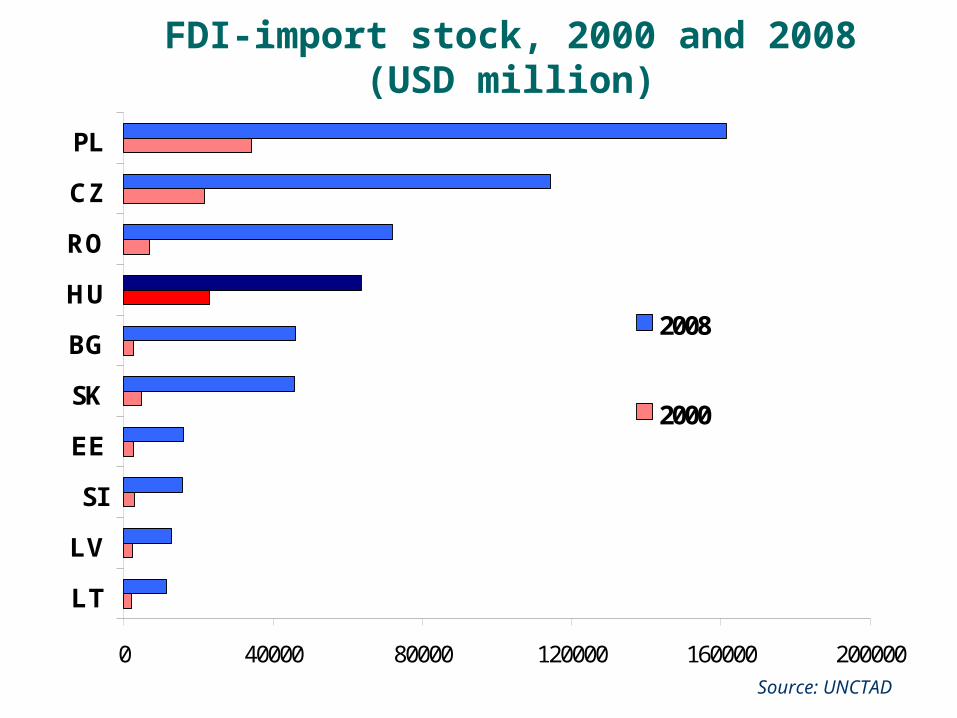
FDI-import stock, 2000 and 2008 (USD million)
Source: UNCTAD
0 40000 80000 120000 160000 200000
LT
LV
SI
EE
SK
BG
HU
RO
CZ
PL
2008
2000