Embed Size (px)
Citation preview
Working Papers No. 8 / 2015
Christoph Böhringer, Brita Bye, Taran Fæhn and Knut Einar Rosendahl
Targeted carbon tariffs.
Carbon leakage and welfare effects
ISSN: 2464-1561
Norwegian University of Life Sciences
School of Economics and Business
1
Targeted carbon tariffs.
Carbon leakage and welfare effects
Christoph Böhringera, Brita Byeb, Taran Fæhnc and Knut Einar Rosendahld
a Department of Economics, University of Oldenburg, Germany. E-mail: boehringer@uni-olden-
burg.de
b Statistics Norway, Research Department. E-mail: [email protected]
c Statistics Norway, Research Department. E-mail: [email protected]
d Norwegian University of Life Sciences, School of Economics and Business. E-mail:
Abstract:
Climate effects of unilateral carbon policies are undermined by carbon leakage. To counteract leakage
and increase global cost-effectiveness carbon tariffs can be imposed on the emissions embodied in im-
ports from non-regulating regions. We present a theoretical analysis on the economic incentives for
emission abatement of producers subjected to carbon tariffs. We quantify the impacts of different car-
bon tariff designs by an empirically based multi-sector, multi-region CGE model of the global econ-
omy. We find that firm-targeted tariffs can deliver much stronger leakage reduction and higher effi-
ciency gains than tariff designs operated at the industry level. In particular, because the exporters are
able to reduce their carbon tariffs by adjusting emissions, their competitiveness and the overall welfare
of their economies will be less randomly and less adversely affected than in previously studied carbon
tariff regimes. This beneficial distributional impact could facilitate a higher degree of legitimacy and
legality of carbon tariffs.
Keywords: carbon leakage, border carbon adjustment, carbon tariffs, computable general equilibrium
(CGE)
JEL classification: Q43, Q54, H2, D61
Acknowledgements: Financial support from the European Community’s Seventh Framework Pro-
gramme, Project ENTRACTE (No 308481) and The Research Council of Norway, Project WILL (No
235689) are acknowledged. While carrying out this research, all the authors have been associated with
CREE – Oslo Centre for Research on Environmentally friendly Energy. The CREE centre acknowl-
edges financial support from the Research Council of Norway, University of Oslo and user partners.
2
1. Introduction
The climate effect of unilateral carbon pricing is undermined if emission-intensive production is
relocated to less regulated jurisdictions, so-called carbon leakage. Seminal theoretical papers by
Markusen (1975) and Hoel (1996) suggest that a region should supplement its unilateral carbon
pricing with border carbon adjustments (BCAs). BCAs are tariffs designed so as to tax, equally to
domestic emissions, the carbon emissions directly and indirectly embodied in imports (carbon tariffs),
combined with rebates of emission payments for exports from the unilaterally regulating region.
Markusen (1975) and Hoel (1996) show that the most cost-effective BCA system for reducing carbon
leakage is one that incentivises foreign producers to abate until their marginal abatement costs equal
the carbon price of the unilaterally regulating region.
Although carbon tariffs have not been implemented so far, they are assessed and debated in several
OECD countries. In the US and Australia the discussions have been closely linked to proposed cap-
and-trade systems.1 The EU, that already has a cap-and-trade system, has been nearest to a system
taxing imports by its attempt in 2012 to incorporate into the EU Emission Trading System (ETS) all
flights to and from EU airports (Directive 2008/101/EC). The plan has been put on hold due to fierce
opposition from the international aviation community and major non-EU countries such as the US and
China (Ireland, 2012). The ongoing political debate on measures for pricing emission from aviation at
a global scale highlights the importance of distributional and legal issues at stake.
Various empirical studies have quantified the implications of carbon tariffs with alternative designs on
the coverage of embodied carbon and the range of sectors (goods) subjected to the tariff (see e.g. the
EMF 29 model cross-comparison study summarised in Böhringer et al., 2012a). However, the carbon
tariff designs investigated so far are not targeted towards the individual firm or shipment, but based on
the average carbon content of regions or industries. Such tariffs, however, do not give individual
polluters responsible for the upstream emissions included in embodied carbon metrics a direct
incentive to reduce the emission intensity of their production. To our knowledge, the only exception in
the literature is Winchester (2011) who analyses systems designed to incentivise low-carbon
production processes abroad. The aim of our contribution is to elaborate further on the possibilities,
limitations, and implications of various carbon tariff systems designed particularly for targeting the
emission intensities of foreign producers, which we will refer to as (firm-)targeted tariffs. Succeeding
1 E.g., The American Clean Energy and Security Act, which was passed by the House of Representatives (2009) but not by
the U.S. Senate.
3
to design and implement such systems could improve the economic efficiency and environmental
effectiveness of BCA.
Compared to Winchester (2011), our contribution is threefold. First, we investigate analytically how
alternative tariff designs affect firms’ incentives for emission abatement. Second, our numerical
simulation model is much more disaggrated at the industry- and region-level thereby enhancing the
policy relevance of our assessment. Third, we cover a broader range of alternative tariff designs which
offer policy makers more comprehensive insights into the trade-off across different policy options.
Over the last decade, a large number of computable general equilibrium (CGE) studies of BCAs have
been carried out. The majority of the studies focus on carbon tariffs on imports, only; i.e. they do not
consider simultaneous export subsidies. They confirm that carbon tariffs reduce the carbon leakage
problem of unilateral policies. Also, the coalition’s efficiency costs of its carbon policies, as well as
the competitiveness losses of its emission-intensive industries, decline, while the opposite is true for
non-coalition countries. See Branger and Quirion (2014), Böhringer et al. (2012a), and Zhang (2012)
for recent overviews. The numerical studies have increased our knowledge of the role of various
factors like coalition size, the coverage of the carbon tariffs, and how embodied emissions are
calculated. Many studies include indirect emissions in the the tariff calculations. Only rarely are all
embodied emissions accounted for (e.g., Böhringer et al., 2012b), but rather often are the emissions
arising from the use of electricity accounted for (e.g. Mattoo et al. 2009, Winchester 2011, Böhringer
et al. 2012a).
However, most previous studies look at carbon tariffs calculated based on the industry’s average
emission intensities in the exporting countries/regions. They depart from the theoretical principle that
the carbon tariff should adjust according to the the specific embodied emissions in each imported good
shipped to the border. Only by responding to the actual emission intensity of the good will the system
be able to incentivise exporters oriented towards the coalition to reduce the carbon intensity of own
production and also look for inputs with low carbon contents, as they would be remunerated with a
lower carbon tariff. Our intention is to analyse carbon tariff regimes that go further in this direction. In
practice, simplifications and generalisations need to be made in order to make the systems realistic and
manageable. Winchester (2011) studied carbon tariffs that were based on the exporting firms’ actual
emissions and that would, therefore, adjust to producers’ unit emission changes. In a global model
with only two regions and one emission-intensive, trade-exposed industry, he found very modest
effects of allowing for exporter emission responses. We take his ideas further, first, by including far
4
more details in the numerical model and, second, by also allowing for flexible carbon tariffs in
response to low-carbon choices of electricity input.
Our results are more promising with respect to carbon tariffs than previous findings. Firm-targeted
tariffs can deliver much stronger leakage reduction and higher global efficiency gains than region-
specific tariffs. In particular, because the exporters are able to reduce their carbon tariffs by adjusting
to the implicit carbon taxation of the system, both their competitiveness and the overall welfare of
their economies will be less adversely affected than with region-specific tariff regimes. This beneficial
distributional impact could facilitate a higher degree of legitimacy and legality. We discuss possible
practical designs of targeted carbon tariffs in Section 2, then model these systems analytically in
Section 3 and within a computable framework in Section 4. The numerical results are discussed in
Section 5, and Section 6 concludes.
2. Feasibility aspects of targeted carbon tariffs
According to Hoel (1996), the welfare-maximising carbon tariff on an imported good to a region with
unilateral carbon pricing should equal the unilateral carbon price times the emissions embodied in the
good. In practice, proposed and analysed systems depart from the ideal system for legal, practical and
political reasons. There are particularly two criteria for optimal carbon tariffs that encounter such
restrictions:
(i) Embodiment of emissions: The tariff calculations must encompass all carbon emissions in-
volved in the production of the good exported from the non-regulating region to the regulating
region.
(ii) The targeting of the tariffs: Carbon tariff rates must be product and firm targeted. Only when
each shipment gets an individual treatment based on its embodied emissions, will exporters
face the correct incentives to reduce the embodied emissions per unit of export, and not just
the total export volume as for conventional tariff rates.
When comes to criteria (i) previous studies have discussed how to practically delimit the emission
embodiment in the tariff calculations; see, e.g., Böhringer et al. (2012b). Total embodied carbon can
be decomposed into three components; a) the carbon emissions directly originating from the
production process of a good, b) indirect emissions involved in generating the electricity that is used in
the production of the good and c) all other indirect carbon emissions caused when producing all the
inputs in the production of the good. The tracking of embodied emissions will, obviously, be more
complex and costly the more comprehensive the coverage.

5
Carbon tariff designs proposed and analysed so far adopt aggregate measures of embodiment. Most
designs refer to region-specific averages for each traded good where either the exporting region or the
importing region is taken as the reference. Ismer and Neuhoff (2007) suggest using the carbon content
of the best available technology globally. Common to all aggregate approaches is that they do not
target emissions at the firm (product) level. As a consequence, exporters in atomistic markets perceive
the tariff rate as given. This will bring about reductions in exports to the unilaterally regulating region
and more so the more embodied emissions are included. Since the tariff rate is taken as given,
however, it provides no incentives to reduce embodied emissions per unit of exports. This clearly
limits the efficiency of the tariff system.
Criteria (ii) on targeting, above, would ensure correct incentives to reduce unit emissions. The strength
of these incentives for a particular firm would depend on the share of the firm’s sales to the regulating
region versus non-regulating regions and its flexibility in terms of specialising in either of the markets
or building separate market-specific production lines.
One important barrier for designing systems in accordance with theory is administration (transaction)
cost. The more targeted the tariff system, and the more of the indirect emission content to account, the
more bureaucracy will be involved. Unless a (high) default tariff is accepted by the exporter, the
information on emissions content would have to be collected by the producers (exporters) or importers
and validated by some external body. A resembling system exists for food products.2 The
responsibility of providing, managing and controlling compliance with a certificate system can be
given to the exporting countries and be administred at the exit border. This would give incentives for
the administration to rationalise the information and certificate procedures, but there may also be a risk
of cheating.
To our knowledge, no calculations have been undertaken so far of costs associated with the
governments’ administration of, and firms’ compliance with, alternative carbon tariff designs. Persson
(2010) presents scattered estimates of transaction cost components in international trading and carbon
accounting. Evans (2003) reviews studies of administrative costs of tax systems. He observes that in
cases where individual companies, not only centralised public bodies, bear a substantial part of the
2 The ISO 22000 standards are established for the purpose of food safety management. A previous system in the EU
regulated food imports for the purpose of applying variable input levies to protect agricultural production. These two systems
have in common with an information system for targeted carbon tariffs that inputs of the imported goods have to be mapped
on a detailed level.
6
paperwork, the administrative costs of tax systems rise substantially. Especially in developing
countries with inefficient trading environments this would add to already high transaction costs.
However, communications and data technologies develop fast and, recently, novel emissions
inventories and standards designed for tracking carbon contents have been established that could ease
the administrative load. One such promising data system is the international standards of carbon
footprints launched in 2013 – the ISO standard of carbon footprint (ISO 14067: 2013). Until recently
there has been no common operational definition of the carbon footprint (CPA) of a product. The ISO
standard of carbon footprint defines CPA as the sum of greenhouse gas (GHG) emissions and
removals in a product system expressed as CO2 equivalents and based on a life-cycle assessment. The
product system includes inputs of other products, materials and energy flows, starting from the
deployment of the raw material of natural resources (see also ISO 14044:2006). The life-cycle
assessment implies that for all products the carbon emissions from both the initial raw material
depletion, and the final disposal are included, a feature that makes it less relevant for direct use in
carbon tariff calculations. Offsetting impacts as, e.g., investments in new renewable energy
technologies, energy efficiency measures, or afforestration/reforestration, are also included.
Another relevant guide to calculating carbon contents is The Greenhouse Gas Protocol (2010), which
is an updated version of the first Greenhouse Gas (GHG) Protocol. The GHG Protocol provides
guidance and standards for companies and organisations preparing a GHG emissions inventory. The
objective is to harmonise GHG accounting and reporting standards internationally. This shall ensure
that different regimes for emission regulation adopt consistent approaches to GHG accounting. The
GHG Protocol also includes adjustments for indirect emissions from electricity production, c.f. b)
above.
Another possibility for documenting the carbon content of products could be to apply procedures
similar to those practised for the Clean Development Mechanism (CDM), UNFCCC (2012). In
contrast to, e.g., ISO certificates, the CDM certificates are based on reports from a Designated
National Authority (DNA), a body in the country receiving the CDM project, which is granted the
responsibility to authorise and approve participation in CDM projects.3 In addition, the system requires
an external validator which has technical expertise in assessing the abatement potential of the project.
The DNAs are regulated by a CDM accreditation standard (UNFCC 2014), and must report to the
3 http://cdm.unfccc.int/DNA/index.html
7
CDM Executive Board (nominated by the UNFCCC), which takes the final decision on whether the
project qualifies as a CDM project. A main issue in the CDM procedure is the assessment of the
project’s additionality, i.e., the abatement it adds compared to a baseline in the absence of the CDM
project. This task is not relevant when settling carbon tariff rates. Another difference is that only direct
emissions are measured in CDM projects, which limits the usefulness of the CDM standards. Other
drawbacks are that the standards appear less transparent than the ISO standards and the procedures are
labour-consuming as both the DNA, the external validator and the CDM Executive Board have to
approve the assessments.
From the discussion above, it seems that the new ISO certification procedure would be the most
accurate and easiest to implement. In this context, experiences from existing and previous border
procedures for food products could be highly relevant for an ISO carbon footprint system.
Along with the practical obstacles of implementing and operating firm-targeted carbon tariffs come
several legal and political hindrances. Böhringer et al. (2012b) discuss these issues in more detail. The
main legal challenge is to comply with the World Trade Organisation (WTO) law. Discrimination of
equal goods based on their production methods is not legal. Though it may be legal to take action
based on environmental considerations, the rules are strict. Allowing exporters to affect their tariff rate
by adjusting their carbon input could be more acceptable than rigid average tariff rates. On the other
hand, comprehensive documentation requirements can be regarded as non-tariff trade barriers.
The international political implications of carbon tariffs are also a critical issue. Trade disputes can
deteriorate the political climate for international cooperation and hurt further climate negotiations. The
danger of retaliation from large countries must also be taken into account. This became obvious in the
dispute on EU’s attempt to include international flights into the EU ETS, as alluded above. Previous
studies of carbon tariff systems show that the distributional effects are in disfavour of the countries
subjected to them (Branger and Quirron, 2014). Distributional aspects could strengthen the case for
firm-targeted tariffs, as these allow exporting firms to reduce their tariff costs and competitiveness
losses.
Based on the discussion above, we cannot unambiguously conclude that a targeted system which treats
firms individually increases the political, legal and practical barriers. Some aspects of firm-targeted
systems can actually be politically and legally superior to less targeted systems because they have
distributional advantages and can be regarded as more fair. Furthermore, practical barriers have
8
diminished during recent years as complex electronic data bases are developed and border registration
procedures established.
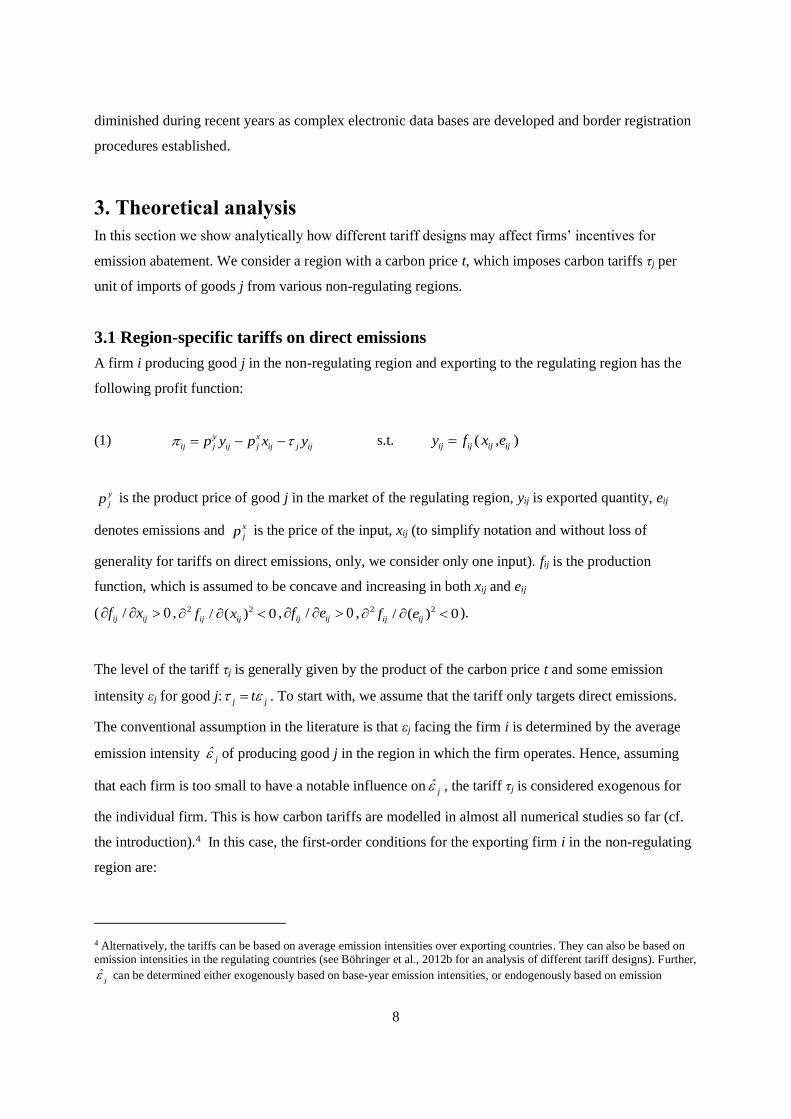
3. Theoretical analysis
In this section we show analytically how different tariff designs may affect firms’ incentives for
emission abatement. We consider a region with a carbon price t, which imposes carbon tariffs τj per
unit of imports of goods j from various non-regulating regions.
3.1 Region-specific tariffs on direct emissions
A firm i producing good j in the non-regulating region and exporting to the regulating region has the
following profit function:
(1) y x
ij j ij j ij j ijp y p x y s.t. ( )ij ij ij ijy f x ,e
y
jp is the product price of good j in the market of the regulating region, yij is exported quantity, eij
denotes emissions and x
jp is the price of the input, xij (to simplify notation and without loss of
generality for tariffs on direct emissions, only, we consider only one input). fij is the production
function, which is assumed to be concave and increasing in both xij and eij
( / 0ij ijf x , 2 2/ ( ) 0ij ijf x , / 0ij ijf e , 2 2/ ( ) 0ij ijf e ).
The level of the tariff τj is generally given by the product of the carbon price t and some emission
intensity εj for good j: j jt . To start with, we assume that the tariff only targets direct emissions.
The conventional assumption in the literature is that εj facing the firm i is determined by the average
emission intensity j of producing good j in the region in which the firm operates. Hence, assuming
that each firm is too small to have a notable influence on j , the tariff τj is considered exogenous for
the individual firm. This is how carbon tariffs are modelled in almost all numerical studies so far (cf.
the introduction).4 In this case, the first-order conditions for the exporting firm i in the non-regulating
region are:
4 Alternatively, the tariffs can be based on average emission intensities over exporting countries. They can also be based on emission intensities in the regulating countries (see Böhringer et al., 2012b for an analysis of different tariff designs). Further,
j can be determined either exogenously based on base-year emission intensities, or endogenously based on emission
9
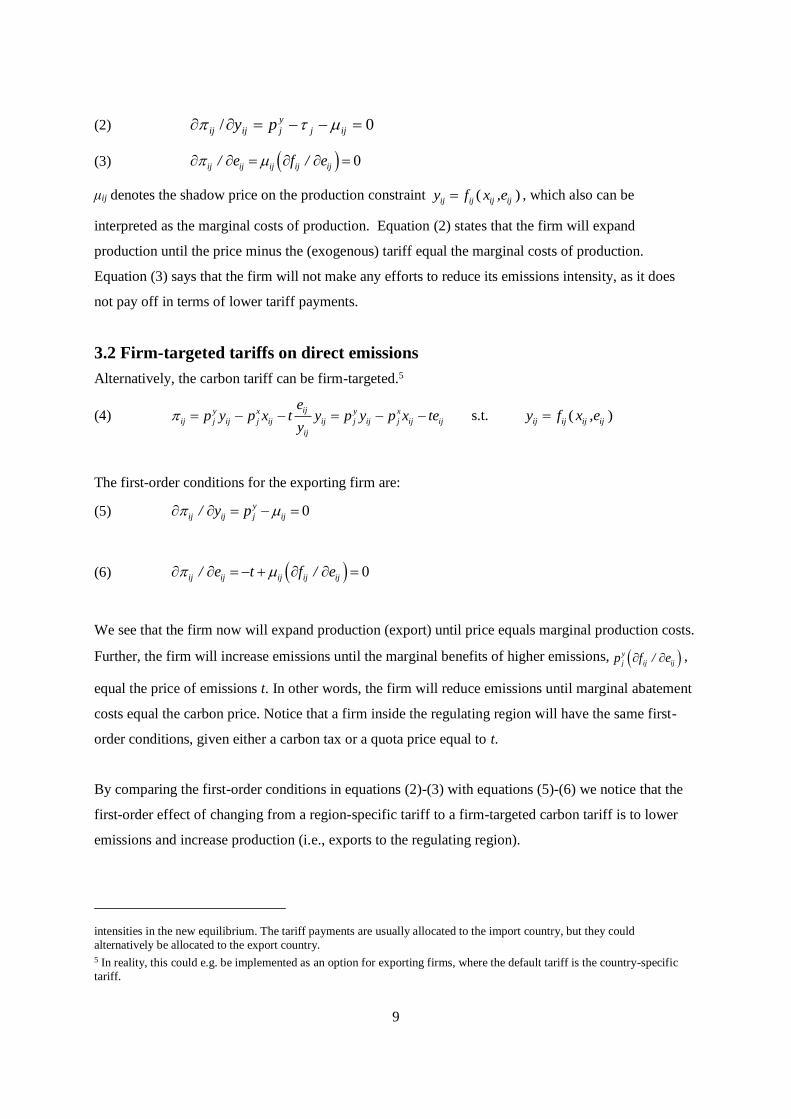
(2) 0/ ijj
y
jijij py
(3) 0ij ij ij ij ij/ e f / e
μij denotes the shadow price on the production constraint ( )ij ij ij ijy f x ,e , which also can be
interpreted as the marginal costs of production. Equation (2) states that the firm will expand
production until the price minus the (exogenous) tariff equal the marginal costs of production.
Equation (3) says that the firm will not make any efforts to reduce its emissions intensity, as it does
not pay off in terms of lower tariff payments.
3.2 Firm-targeted tariffs on direct emissions
Alternatively, the carbon tariff can be firm-targeted.5
(4) ijy x y x
ij j ij j ij ij j ij j ij ij
ij
ep y p x t y p y p x te
y s.t. ( )ij ij ij ijy f x ,e
The first-order conditions for the exporting firm are:
(5) 0y
ij ij j ij/ y p
(6) 0ij ij ij ij ij/ e t f / e
We see that the firm now will expand production (export) until price equals marginal production costs.
Further, the firm will increase emissions until the marginal benefits of higher emissions, y
j ij ijp f / e ,
equal the price of emissions t. In other words, the firm will reduce emissions until marginal abatement
costs equal the carbon price. Notice that a firm inside the regulating region will have the same first-
order conditions, given either a carbon tax or a quota price equal to t.
By comparing the first-order conditions in equations (2)-(3) with equations (5)-(6) we notice that the
first-order effect of changing from a region-specific tariff to a firm-targeted carbon tariff is to lower
emissions and increase production (i.e., exports to the regulating region).
intensities in the new equilibrium. The tariff payments are usually allocated to the import country, but they could
alternatively be allocated to the export country. 5 In reality, this could e.g. be implemented as an option for exporting firms, where the default tariff is the country-specific
tariff.

10
3.3 Region-specific tariffs on direct and indirect emissions
So far we have only considered emissions at the production plant, and disregarded indirect emissions
from generating electricity or other inputs that are used in producing good j. For various goods,
electricity is an important input into production, accounting for a significant share of the total carbon
footprint of producing these goods. To increase the outreach and effectiveness proposals of carbon
tariffs often include indirect emissions from electricity production when calculating the tariff. Again,
the conventional assumption in the literature is that the tariff gets an additional term which is
determined based on average emission intensities in the electricity sector and the average use of
electricity per unit production of good j. In this case equations (1)-(3) are unchanged, except that the
value of the tariff has increased.
3.4 Firm-targeted tariffs on direct and region-specific on indirect emissions
We now assume that firm-targeted tariffs are based on direct emissions (as in Equation (4)) and
indirect emissions from own use of electricity (denoted E
ijx ). Furthermore, we consider the case where
the average emission intensity in the electricity sector E is used to calculate the second part of the
tariff. Hence, the tariff for firm i is equal to )ˆ)/(( Eij
E
ijij yxt . The profit function of the firm then
becomes:
(7) E
ij ijy x E E y x E E E
ij j ij j ij j ij E ij j ij j ij j ij ij ij E
ij ij
e xˆ ˆp y p x p x t y p y p x p x t e x
y y
s.t. ( )E
ij ij ij ij ijy f x ,x ,e
Without the tariff the optimal use of electricity is given by the standard first-order condition
0E E E
ij ij j ij ij ij/ x p f / x , similar to equation (6) for emissions. With the tariff, however,
the first-order condition for electricity use becomes (the first-order conditions given in equations (5)-
(6) carry over with this tariff):
(8) 0E E E
ij ij j E ij ij ijˆ/ x p t f / x
We notice that the tariff enhances incentives for firms to cut back on electricity use, as the shadow
price of electricity is equal to the electricity price plus the extra tariff payments per unit of electricity
use.
11
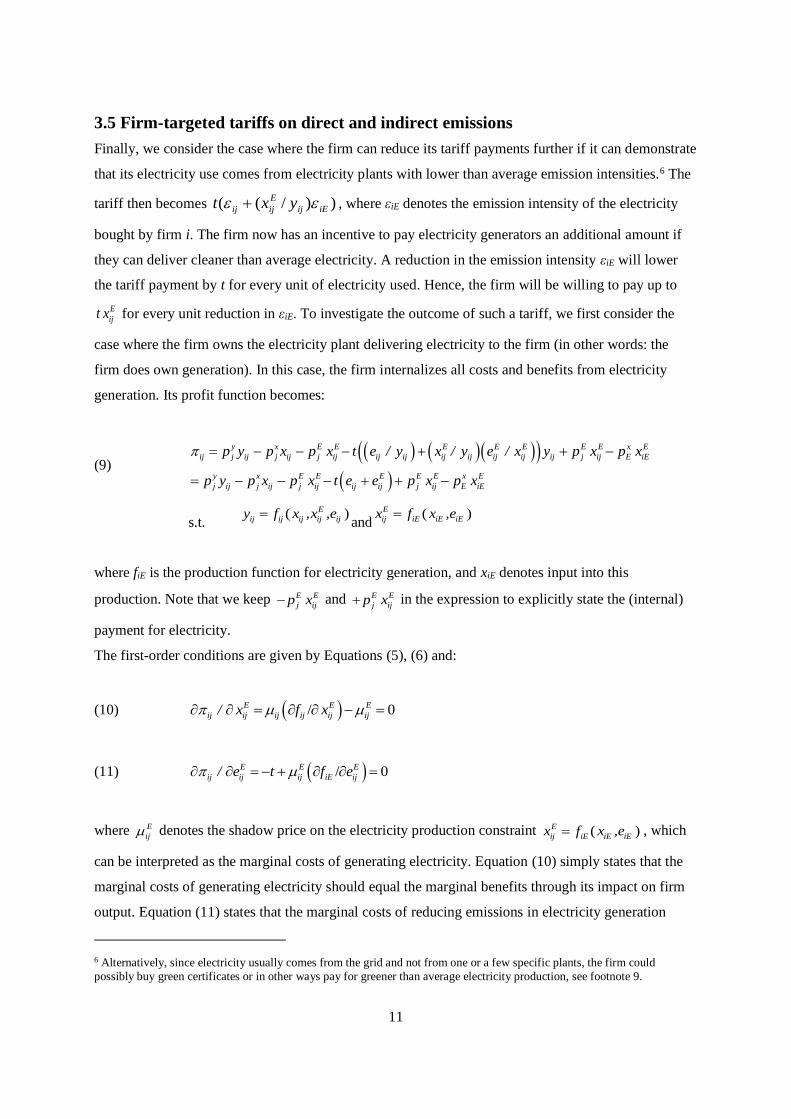
3.5 Firm-targeted tariffs on direct and indirect emissions
Finally, we consider the case where the firm can reduce its tariff payments further if it can demonstrate
that its electricity use comes from electricity plants with lower than average emission intensities.6 The
tariff then becomes ))/(( iEij
E
ijij yxt , where εiE denotes the emission intensity of the electricity
bought by firm i. The firm now has an incentive to pay electricity generators an additional amount if
they can deliver cleaner than average electricity. A reduction in the emission intensity εiE will lower
the tariff payment by t for every unit of electricity used. Hence, the firm will be willing to pay up to
E
ijt x for every unit reduction in εiE. To investigate the outcome of such a tariff, we first consider the
case where the firm owns the electricity plant delivering electricity to the firm (in other words: the
firm does own generation). In this case, the firm internalizes all costs and benefits from electricity
generation. Its profit function becomes:
(9)
y x E E E E E E E x E
ij j ij j ij j ij ij ij ij ij ij ij ij j ij E iE
y x E E E E E x E
j ij j ij j ij ij ij j ij E iE
p y p x p x t e / y x / y e / x y p x p x
p y p x p x t e e p x p x
s.t. ( )E
ij ij ij ij ijy f x ,x ,eand
( )E
ij iE iE iEx f x ,e
where fiE is the production function for electricity generation, and xiE denotes input into this
production. Note that we keep E E
j ijp x and E E
j ijp x in the expression to explicitly state the (internal)
payment for electricity.
The first-order conditions are given by Equations (5), (6) and:
(10) / 0E E E
ij ij ij ij ij ij/ x f x
(11) / 0E E E
ij ij ij iE ij/ e t f e
where E
ij denotes the shadow price on the electricity production constraint ( )E
ij iE iE iEx f x ,e , which
can be interpreted as the marginal costs of generating electricity. Equation (10) simply states that the
marginal costs of generating electricity should equal the marginal benefits through its impact on firm
output. Equation (11) states that the marginal costs of reducing emissions in electricity generation
6 Alternatively, since electricity usually comes from the grid and not from one or a few specific plants, the firm could
possibly buy green certificates or in other ways pay for greener than average electricity production, see footnote 9.
12
should equal the carbon price t. Hence, the electricity generation used to supply the firms exporting to
the regulating region faces the same incentives as electricity producers inside the regulating region.
Finally, we drop the assumption that the firm does own generation. In this case electricity generation is
“outsourced”, and the firm makes an agreement with an electricity producer. A likely outcome is that
the two firms will come to an agreement that optimizes their joint profit. If so, the first order
conditions above still hold.
4. Numerical analysis
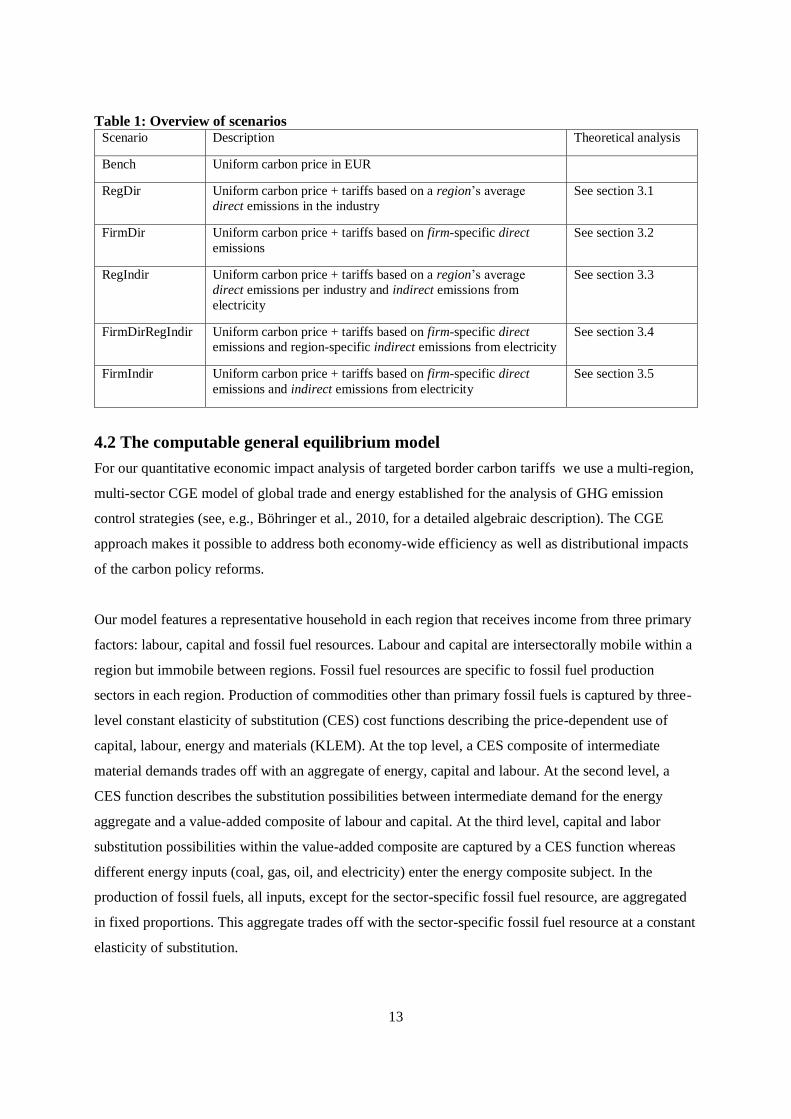
4.1 Scenarios
Our numerical analysis is designed to compare alternate carbon tariff designs that combine variations
of the two dimensions presented in Section 2: (i) the embodiment of emissions and (ii) the degree of
targeting. When it comes to (i) we look at systems including direct emissions (Dir) and both direct and
indirect emissions from electricity (Indir). In terms of (ii) we study region-specific (Reg) and firm-
targeted (Firm) tariffs.
We consider six different carbon policy scenarios, which we compare against the business-as-usual
(BaU) without carbon policy regulation. In the benchmark scenario (Bench) we introduce uniform
carbon pricing via a domestic cap-and-trade regime in the regulating region. The five remaining
scenarios combine carbon pricing with tariffs based on embodied carbon. The combinations are in line
with the five systems analysed in our theoretical exposition in Section 3; see Table 1. Beyond the four
scenarios representing all combinations of the dimensions (i) and (ii), they include the system studied
by Winchester (2011) that combines firm-targeting of direct emissions with embodiment of indirect
emissions from electricity in a region-specific manner (FirmDirRegIndir).
We impose the same cap on global emissions across all policy scenarios at the level that emerges from
the Bench scenario.7 Thus, welfare outcomes can be compared across scenarios irrespective of the
evaluation of emissons. In our core simulations we take Europe (EU28 plus EFTA) as the unilaterally
abating region. Carbon tariff systems apply to emission-intensive and trade-exposed goods (industries)
imported to Europe from all other regions, see Table 2 for details.
7 Technically, we adjust the emission cap of the regulating region endogenously such that the carbon price in the regulating
region ensures the global emissions to be ceiled at the emission level of the Bench scenario.
13
Table 1: Overview of scenarios Scenario Description Theoretical analysis
Bench Uniform carbon price in EUR
RegDir Uniform carbon price + tariffs based on a region’s average
direct emissions in the industry
See section 3.1
FirmDir Uniform carbon price + tariffs based on firm-specific direct
emissions
See section 3.2
RegIndir Uniform carbon price + tariffs based on a region’s average
direct emissions per industry and indirect emissions from
electricity
See section 3.3
FirmDirRegIndir Uniform carbon price + tariffs based on firm-specific direct
emissions and region-specific indirect emissions from electricity
See section 3.4
FirmIndir Uniform carbon price + tariffs based on firm-specific direct
emissions and indirect emissions from electricity
See section 3.5
4.2 The computable general equilibrium model
For our quantitative economic impact analysis of targeted border carbon tariffs we use a multi-region,
multi-sector CGE model of global trade and energy established for the analysis of GHG emission
control strategies (see, e.g., Böhringer et al., 2010, for a detailed algebraic description). The CGE
approach makes it possible to address both economy-wide efficiency as well as distributional impacts
of the carbon policy reforms.
Our model features a representative household in each region that receives income from three primary
factors: labour, capital and fossil fuel resources. Labour and capital are intersectorally mobile within a
region but immobile between regions. Fossil fuel resources are specific to fossil fuel production
sectors in each region. Production of commodities other than primary fossil fuels is captured by three-
level constant elasticity of substitution (CES) cost functions describing the price-dependent use of
capital, labour, energy and materials (KLEM). At the top level, a CES composite of intermediate
material demands trades off with an aggregate of energy, capital and labour. At the second level, a
CES function describes the substitution possibilities between intermediate demand for the energy
aggregate and a value-added composite of labour and capital. At the third level, capital and labor
substitution possibilities within the value-added composite are captured by a CES function whereas
different energy inputs (coal, gas, oil, and electricity) enter the energy composite subject. In the
production of fossil fuels, all inputs, except for the sector-specific fossil fuel resource, are aggregated
in fixed proportions. This aggregate trades off with the sector-specific fossil fuel resource at a constant
elasticity of substitution.
14
Final consumption demand in each region is determined by the representative agent who maximizes
welfare subject to a budget constraint with fixed investment (i.e., a given demand for savings) and
exogenous government provision of public goods and services. Total income of the representative
agent consists of net factor income and tax revenues net of subsidies. Consumption demand of the
representative agent is given as a CES composite that combines consumption of composite energy and
an aggregate of other (non-energy) consumption goods. Substitution patterns within the energy bundle
as well as within the non-energy composite are reflected by means of CES functions.
Bilateral trade is specified following the Armington’s differentiated goods approach, where domestic
and foreign goods are distinguished by origin (Armington, 1969). All goods used on the domestic
market in intermediate and final demand correspond to a CES composite that combines the
domestically produced good and the imported good from other regions. A balance of payment
constraint incorporates the base-year trade deficit or surplus for each region.
CO2 emissions are linked in fixed proportions to the use of fossil fuels, with CO2 coefficients
differentiated by the specific carbon content of fuels. Restrictions to the use of CO2 emissions in
production and consumption are implemented through a CO2 tax or (in the sensitivity analysis) as an
(equivalent) exogenous emission constraint. CO2 emission abatement takes place by fuel switching
(interfuel substitution) or energy savings (either by fuel-non-fuel substitution or by a scale reduction of
production and final consumption activities).
4.3 Implementation of firm-targeted tariffs
We differentiate trade flows at the bilateral level. Each industry (sector) in each region disposes of
production lines distinguished by destination.8 When firm-targeted tariffs are introduced on bilateral
trade flows, the export production lines subjected to tariffs will have incentives to change the input
mix as shown in the theory part, Section 3.
We consider tariffs based on both direct emissions and indirect emissions from electricity use. When
the latter part of the tariff is based on average emission intensities in the region, electricity will
become more expensive for exporters inducing them to use less electricity than before. When the tariff
is based on the individual firm’s indirect emissions, i.e., emissions from the electricity used by the
8 All production lines within a sector share the same CES production technology (see section 4.2). Thus, BaU production
across the different lines split proportionally to BaU supply shares.
15
individual firm, the firm has a direct incentive to buy less emission-intensive electricity. To represent
this mechanism, we distinguish electricy supply to the different production lines
Obviously, with a national electricity grid, it is not possible to know where exactly the electricity
comes from (unless it is produced in the firm through own generation). Our setting can be interpreted
as if a market will emerge for some labelling or certificate system, providing firms with credible
documentation on the carbon content of their electricity input. This system could resemble systems
already exisiting in countries with regulations, including several US states, the UK and the common
Swedish-Norwegian green certificate market.9
It should be noted that our implementation of tariffs in the model still keeps the assumption that firms
within each industry and region have homogenous technologies. This simplifying assumption
significantly reduces the necessary data input of the already comprehensive and detailed model.
However, this comes at some loss in real-world heterogeneity. Even before introducing carbon tariffs
emission intensities will likely vary across firms within the same sector. Carbon tariffs could, thus,
lead to sorting where the least emission-intensive firms export to the regulating region, while the most
emission-intensive firms supply to the other regions. Although the least emission-intensive firms may
still find it profitable to reduce emissions further when tariffs are firm-targeted rather than region-
specific, our model setting will probably overestimate the difference. This is also the case when we
consider emissions from electricity generation. Instead of reducing emission intensities in some plants,
the reality could be that the exporters switch to electricity plants with relatively low emissions. Thus,
the options could be more discrete than our modelling implicitly assumes and, again, the firm-
targeting will have smaller impacts compared to a setting where agents are representative.
4.4 Data
Our CGE analysis is based on the most recent version of the Global Trade, Assistance and Production
(GTAP) database which includes detailed national accounts on production and consumption (input–
output tables) together with bilateral trade flows and CO2 emissions for the year 2007 (version 8 of
GTAP – see Narayanan et al., 2012). GTAP can be flexibly aggregated towards a composite dataset
that accounts for the specific requirements of the policy issue under investigation. As to sectoral
disaggregation our composite dataset includes all major primary and secondary energy carriers: coal,
crude oil, natural gas, refined oil products and electricity. This disaggregation is essential in order to
9 See http://www.cleanpowermarkets.com/green_certificates.php for states in the US, http://www.greenenergyscheme.org/
for the UK, and http://www.nve.no/en/Electricity-market/Electricity-certificates/ for Norway-Sweden.
16
distinguish energy goods by CO2 intensity and the degree of substitutability. In addition, we separate
the main emission-intensive and trade-exposed (EITE) sectors: chemical products, non-metallic
minerals, iron and steel products, and non-ferrous metals, as they will be potentially most affected by
emission control policies and therefore are the prime candidates for compensatory measures such as
carbon tariffs.10 The remaining industries covered in our dataset include three transport sectors, as well
as a composite sector of all remaining manufacturers and services. Regarding regional coverage, we
explicitly include major industrialised and developing countries to capture international market
responses to unilateral emission regulation. Table 1 summarises the sectors (commodities) and regions
present in our actual impact analysis of alternative carbon tariff schemes.
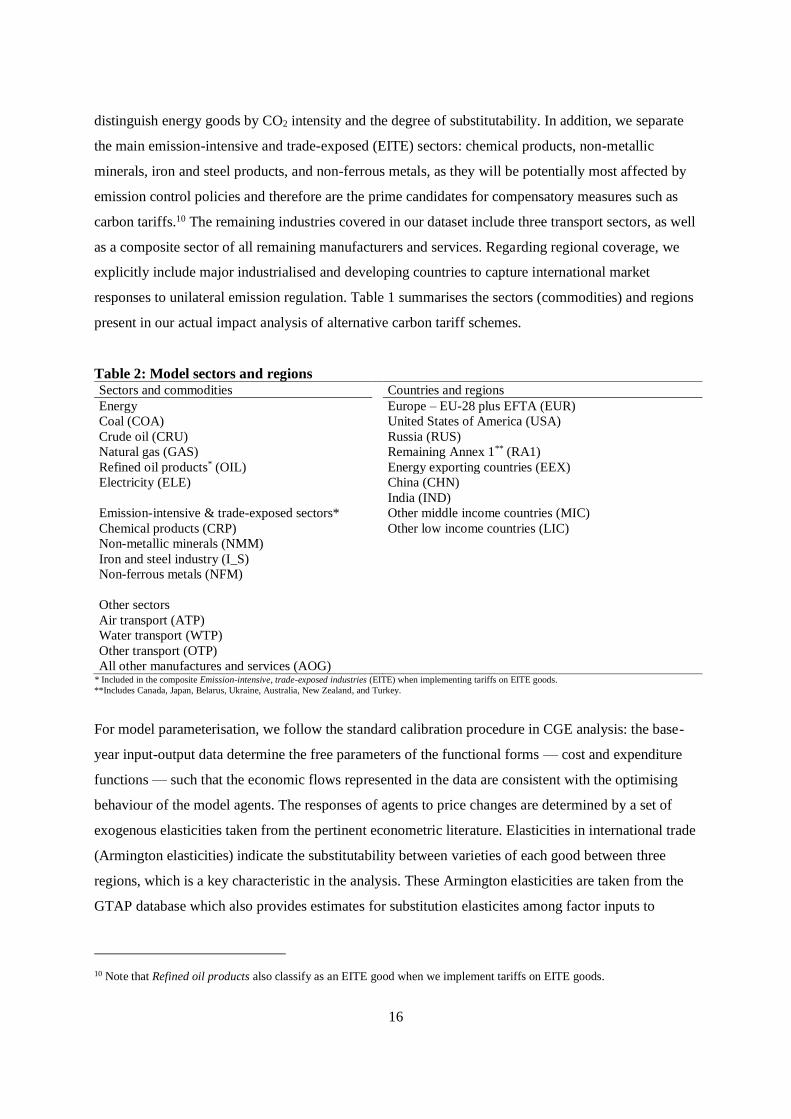
Table 2: Model sectors and regions Sectors and commodities Countries and regions
Energy Europe – EU-28 plus EFTA (EUR)
Coal (COA) United States of America (USA)
Crude oil (CRU) Russia (RUS)
Natural gas (GAS) Remaining Annex 1** (RA1)
Refined oil products* (OIL) Energy exporting countries (EEX)
Electricity (ELE) China (CHN)
India (IND)
Emission-intensive & trade-exposed sectors* Other middle income countries (MIC)
Chemical products (CRP) Other low income countries (LIC)
Non-metallic minerals (NMM)
Iron and steel industry (I_S)
Non-ferrous metals (NFM)
Other sectors
Air transport (ATP)
Water transport (WTP)
Other transport (OTP)
All other manufactures and services (AOG) * Included in the composite Emission-intensive, trade-exposed industries (EITE) when implementing tariffs on EITE goods.
**Includes Canada, Japan, Belarus, Ukraine, Australia, New Zealand, and Turkey.
For model parameterisation, we follow the standard calibration procedure in CGE analysis: the base-
year input-output data determine the free parameters of the functional forms — cost and expenditure
functions — such that the economic flows represented in the data are consistent with the optimising
behaviour of the model agents. The responses of agents to price changes are determined by a set of
exogenous elasticities taken from the pertinent econometric literature. Elasticities in international trade
(Armington elasticities) indicate the substitutability between varieties of each good between three
regions, which is a key characteristic in the analysis. These Armington elasticities are taken from the
GTAP database which also provides estimates for substitution elasticites among factor inputs to
10 Note that Refined oil products also classify as an EITE good when we implement tariffs on EITE goods.
17
production. The elasticities of substitution in fossil fuel sectors are calibrated to match exogenous
estimates of fossil fuel supply elasticities (Graham et al., 1999; Krichene, 2002).
4.5 Simulation results
Our core simulations refer to unilateral emission regulation of Europe. The Bench scenario involves a
20% reduction in domestic CO2 emissions for Europe as compared to its BaU emission levels. The
remaining five climate policy scenarios achieve the same global emission reduction as Bench for
alternative assumptions on the design of supplemental carbon tariffs that are applied to EITE goods. If
not stated otherwise, the effects of policy regulation are reported as percentage change from the BaU
situation. In our exposition below, we use the acronym EUR to refer to Europe and the acronym non-
EUR to denote all other regions.
Carbon leakage
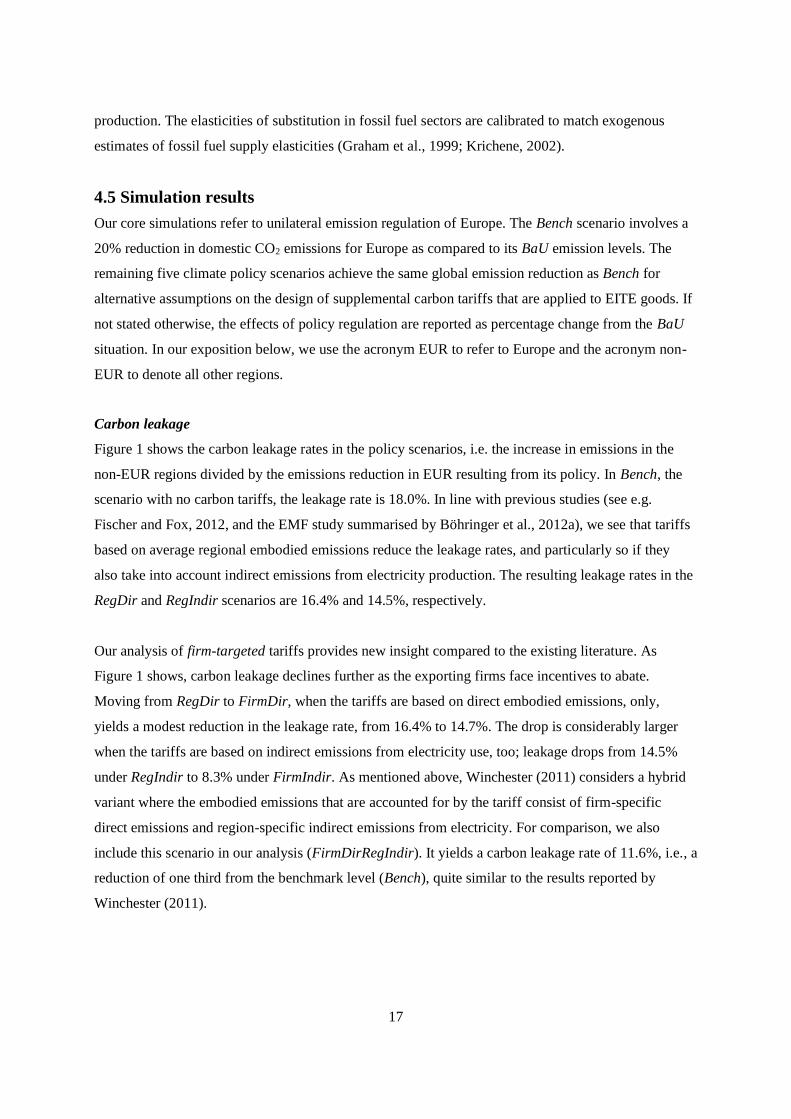
Figure 1 shows the carbon leakage rates in the policy scenarios, i.e. the increase in emissions in the
non-EUR regions divided by the emissions reduction in EUR resulting from its policy. In Bench, the
scenario with no carbon tariffs, the leakage rate is 18.0%. In line with previous studies (see e.g.
Fischer and Fox, 2012, and the EMF study summarised by Böhringer et al., 2012a), we see that tariffs
based on average regional embodied emissions reduce the leakage rates, and particularly so if they
also take into account indirect emissions from electricity production. The resulting leakage rates in the
RegDir and RegIndir scenarios are 16.4% and 14.5%, respectively.
Our analysis of firm-targeted tariffs provides new insight compared to the existing literature. As
Figure 1 shows, carbon leakage declines further as the exporting firms face incentives to abate.
Moving from RegDir to FirmDir, when the tariffs are based on direct embodied emissions, only,
yields a modest reduction in the leakage rate, from 16.4% to 14.7%. The drop is considerably larger
when the tariffs are based on indirect emissions from electricity use, too; leakage drops from 14.5%
under RegIndir to 8.3% under FirmIndir. As mentioned above, Winchester (2011) considers a hybrid
variant where the embodied emissions that are accounted for by the tariff consist of firm-specific
direct emissions and region-specific indirect emissions from electricity. For comparison, we also
include this scenario in our analysis (FirmDirRegIndir). It yields a carbon leakage rate of 11.6%, i.e., a
reduction of one third from the benchmark level (Bench), quite similar to the results reported by
Winchester (2011).
18
Figure 1: Leakage rates (in %)
EITE exports, emissions and tariff payments
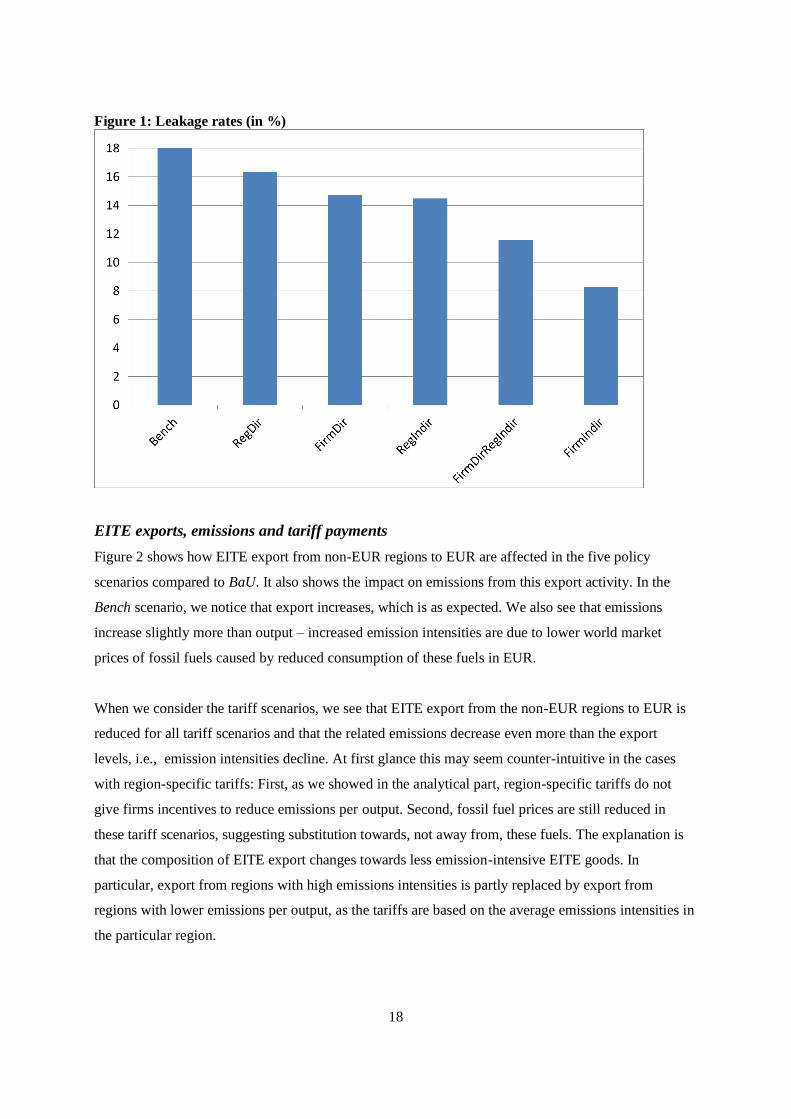
Figure 2 shows how EITE export from non-EUR regions to EUR are affected in the five policy
scenarios compared to BaU. It also shows the impact on emissions from this export activity. In the
Bench scenario, we notice that export increases, which is as expected. We also see that emissions
increase slightly more than output – increased emission intensities are due to lower world market
prices of fossil fuels caused by reduced consumption of these fuels in EUR.
When we consider the tariff scenarios, we see that EITE export from the non-EUR regions to EUR is
reduced for all tariff scenarios and that the related emissions decrease even more than the export
levels, i.e., emission intensities decline. At first glance this may seem counter-intuitive in the cases
with region-specific tariffs: First, as we showed in the analytical part, region-specific tariffs do not
give firms incentives to reduce emissions per output. Second, fossil fuel prices are still reduced in
these tariff scenarios, suggesting substitution towards, not away from, these fuels. The explanation is
that the composition of EITE export changes towards less emission-intensive EITE goods. In
particular, export from regions with high emissions intensities is partly replaced by export from
regions with lower emissions per output, as the tariffs are based on the average emissions intensities in
the particular region.
19
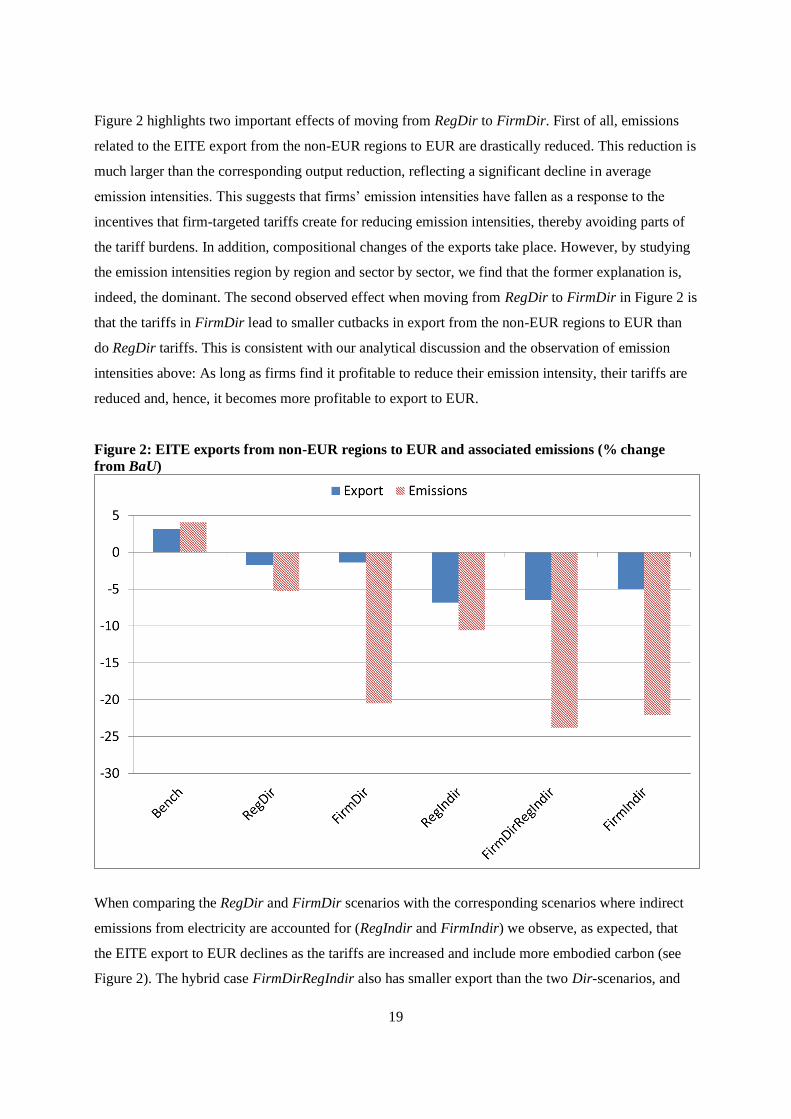
Figure 2 highlights two important effects of moving from RegDir to FirmDir. First of all, emissions
related to the EITE export from the non-EUR regions to EUR are drastically reduced. This reduction is
much larger than the corresponding output reduction, reflecting a significant decline in average
emission intensities. This suggests that firms’ emission intensities have fallen as a response to the
incentives that firm-targeted tariffs create for reducing emission intensities, thereby avoiding parts of
the tariff burdens. In addition, compositional changes of the exports take place. However, by studying
the emission intensities region by region and sector by sector, we find that the former explanation is,
indeed, the dominant. The second observed effect when moving from RegDir to FirmDir in Figure 2 is
that the tariffs in FirmDir lead to smaller cutbacks in export from the non-EUR regions to EUR than
do RegDir tariffs. This is consistent with our analytical discussion and the observation of emission
intensities above: As long as firms find it profitable to reduce their emission intensity, their tariffs are
reduced and, hence, it becomes more profitable to export to EUR.
Figure 2: EITE exports from non-EUR regions to EUR and associated emissions (% change
from BaU)
When comparing the RegDir and FirmDir scenarios with the corresponding scenarios where indirect
emissions from electricity are accounted for (RegIndir and FirmIndir) we observe, as expected, that
the EITE export to EUR declines as the tariffs are increased and include more embodied carbon (see
Figure 2). The hybrid case FirmDirRegIndir also has smaller export than the two Dir-scenarios, and
20
also lower (direct) emissions associated with this production. However, we notice that emissions do
not decline as much as exports when moving from FirmDir to FirmIndir, i.e., average emission
intensities at the EITE plants increase. This is partly due a lower CO2 price in EUR (see Figure 4).
Lower carbon leakage and, thus, less CO2 cuts necessary in EUR in order to keep global emissions
unchanged, explain the drop in the CO2 price. This is carried over to the carbon tariff, which thus gives
a weaker incentive to reduce emissions at the EITE firm. An additional explanation for the increased
emission intensity is that when the tariff also includes indirect emissions from electricity, the EITE
firms have incentives to switch away from the use of electricity towards other inputs such as fossil
fuels (in the FirmIndir and FirmDirRegIndir scenarios). The economy-wide emission responses of
including indirect emissions are, however, far larger in the Firm than in the Reg cases, because of the
additional abatement incentives in the electricity sector of the former.
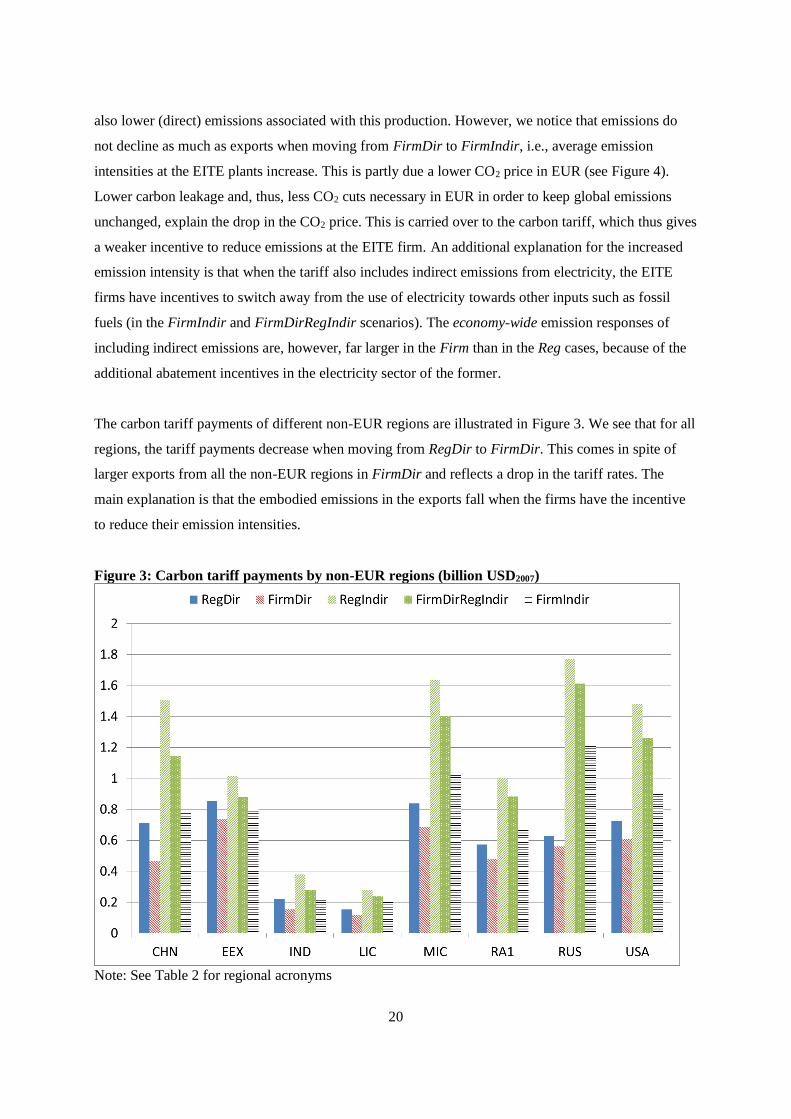
The carbon tariff payments of different non-EUR regions are illustrated in Figure 3. We see that for all
regions, the tariff payments decrease when moving from RegDir to FirmDir. This comes in spite of
larger exports from all the non-EUR regions in FirmDir and reflects a drop in the tariff rates. The
main explanation is that the embodied emissions in the exports fall when the firms have the incentive
to reduce their emission intensities.
Figure 3: Carbon tariff payments by non-EUR regions (billion USD2007)
Note: See Table 2 for regional acronyms
21
The reduction in tariff payments of the non-EUR regions is even stronger when moving from RegIndir
to FirmIndir. There are two mechanisms driving this result. First, emissions from the electricity
generating plants that supply the EITE producers exporting to EUR, decline by 18%. This is due to a
combination of lower emission intensity among these plants, and the reduction in electricity use for the
EITE producers. These behavioural changes illustrate the potential benefits of additionally targeting
indirect emissions from electricity generation when firm-specific tariffs are used. The second
explanation is that the necessary CO2 price to reach the global emission reduction target is reduced by
12% in the FirmIndir case compared to RegIndir; see Figure 4. As explained above, reduced carbon
leakage allows for a drop in the domestic EUR emission price.
Figure 4: CO2 price (USD2007 per ton CO2)
The hybrid regime FirmDirRegIndir provides incentives in the EITE industries to use less electricity
than in the FirmDir case. However, as for RegIndir, the emission intensities of power generators do
not respond. This case, thus, reduces tariff payments for all non-EUR regions compared to RegIndir,
but not as much as is seen for the FirmIndir case.
EITE output
The introduction of carbon pricing in EUR (the Bench scenario) leads to lower output of EITE goods;
see Figure 5. EITE goods are emission-intensive such that carbon pricing induces a non-negligible
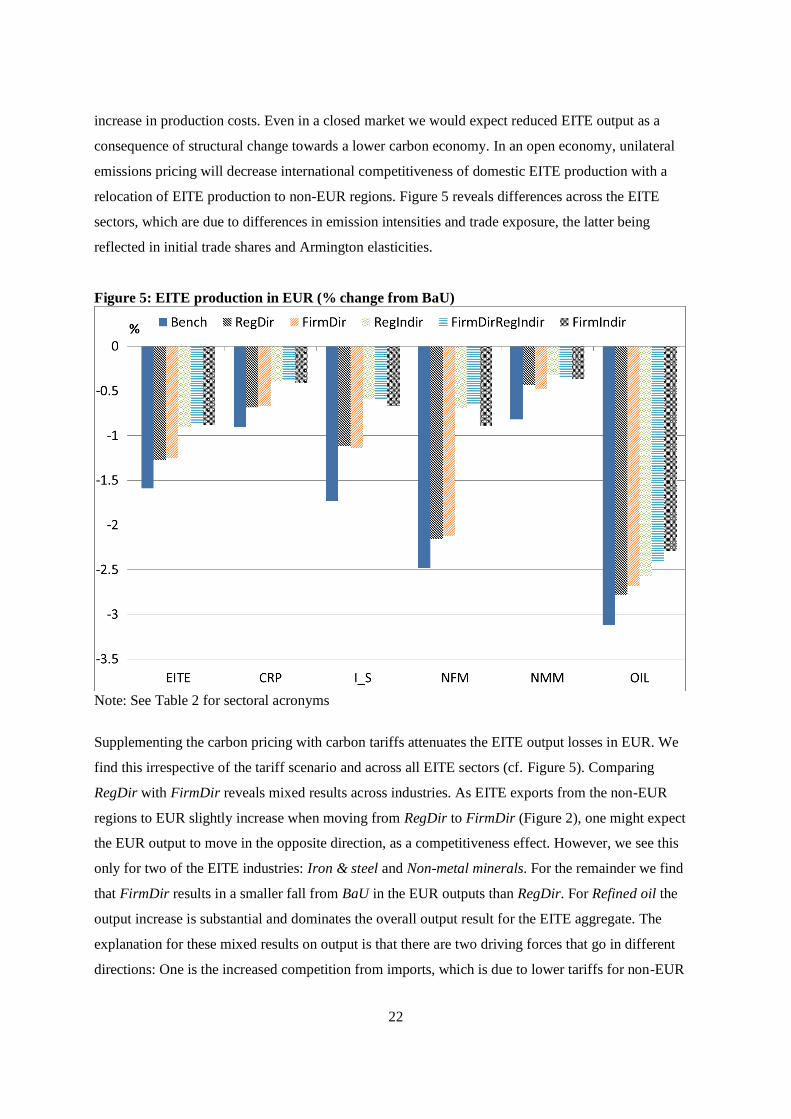
22
increase in production costs. Even in a closed market we would expect reduced EITE output as a
consequence of structural change towards a lower carbon economy. In an open economy, unilateral
emissions pricing will decrease international competitiveness of domestic EITE production with a
relocation of EITE production to non-EUR regions. Figure 5 reveals differences across the EITE
sectors, which are due to differences in emission intensities and trade exposure, the latter being
reflected in initial trade shares and Armington elasticities.
Figure 5: EITE production in EUR (% change from BaU)
Note: See Table 2 for sectoral acronyms
Supplementing the carbon pricing with carbon tariffs attenuates the EITE output losses in EUR. We
find this irrespective of the tariff scenario and across all EITE sectors (cf. Figure 5). Comparing
RegDir with FirmDir reveals mixed results across industries. As EITE exports from the non-EUR
regions to EUR slightly increase when moving from RegDir to FirmDir (Figure 2), one might expect
the EUR output to move in the opposite direction, as a competitiveness effect. However, we see this
only for two of the EITE industries: Iron & steel and Non-metal minerals. For the remainder we find
that FirmDir results in a smaller fall from BaU in the EUR outputs than RegDir. For Refined oil the
output increase is substantial and dominates the overall output result for the EITE aggregate. The
explanation for these mixed results on output is that there are two driving forces that go in different
directions: One is the increased competition from imports, which is due to lower tariffs for non-EUR
23
firms under FirmDir. The other is lower production costs due to lower CO2 and energy prices in
FirmDir than in RegDir (see e.g. Figure 4), which tends to stimulate domestic output. In the same
vein, we can explain the sector-specific output effects of moving from regeion-specific to firm-
targeted tariffs when indirect emissions from electricity are accounted for (from RegIndir to
FirmIndir). In this case, the competition effect dominates the effects of lower production costs for all
EITE industries, except Refined oil and, thus, output is lower. Aggregate EITE output also drops.
Welfare effects
Previous studies have shown that carbon tariffs are likely to reduce the welfare costs of climate
policies, both for the unilaterally abating region and for the world as a whole, while non-abating
regions suffer from the imposition of tariffs (Böhringer et al., 2012a; Fischer and Fox, 2012; Mattoo et
al., 2009).
Figure 6 confirms these findings. Welfare effects are stated in Hicksian equivalent variation in income.
Carbon tariffs moderate the welfare costs of unilateral action for EUR, while the costs for non-EUR
rise. For EUR, moving to more targeted systems either by including indirect emissions and/or by
giving non-EUR firms incentives to reduce emissions is beneficial. The most targeted system
(FirmIndir) reduces the welfare costs of EUR by as much as 32% compared to Bench. The gain
reflects both lower competition from non-EUR exporters (see Figure 2 and 5), and lower carbon
leakage which allows for higher emissions in EUR (see Figure 2 and 4).
A main observation from Figure 6 is that trade-offs between the welfare effects for EUR and non-EUR
are not severe. In particular, we notice that firm-targeted tariffs are better than region-specific tariffs
for both EUR and non-EUR. This is true whether the tariffs are based on direct emissions, only, or
both direct and indirect. Furthermore, including indirect emissions in firm-targeted tariffs (FirmIndir
vs. FirmDir) benefits EUR without increasing the costs for non-EUR, because firm-targeted tariffs
ensure non-EUR firms the opportunity to reduce their tariff rates by reducing emission intensities both
in own production and their electricity input. This possibility is absent when tariffs on similar goods
are common for all firms in a non-EUR region. Then, including indirect embodied emissions in the
basis for the tariff rates (RegIndir vs. RegDir) will unavoidably increase the rates, and the costs for the
non-EUR regions increase by 12%. Interestingly, the most targeted system, where firms exporting to
the coalition are tariffed according to their direct and indirect emissions (FirmIndir) is slightly less
costly for the non-EUR regions than the least targeted (RegDir). Moreover, welfare costs for EUR are
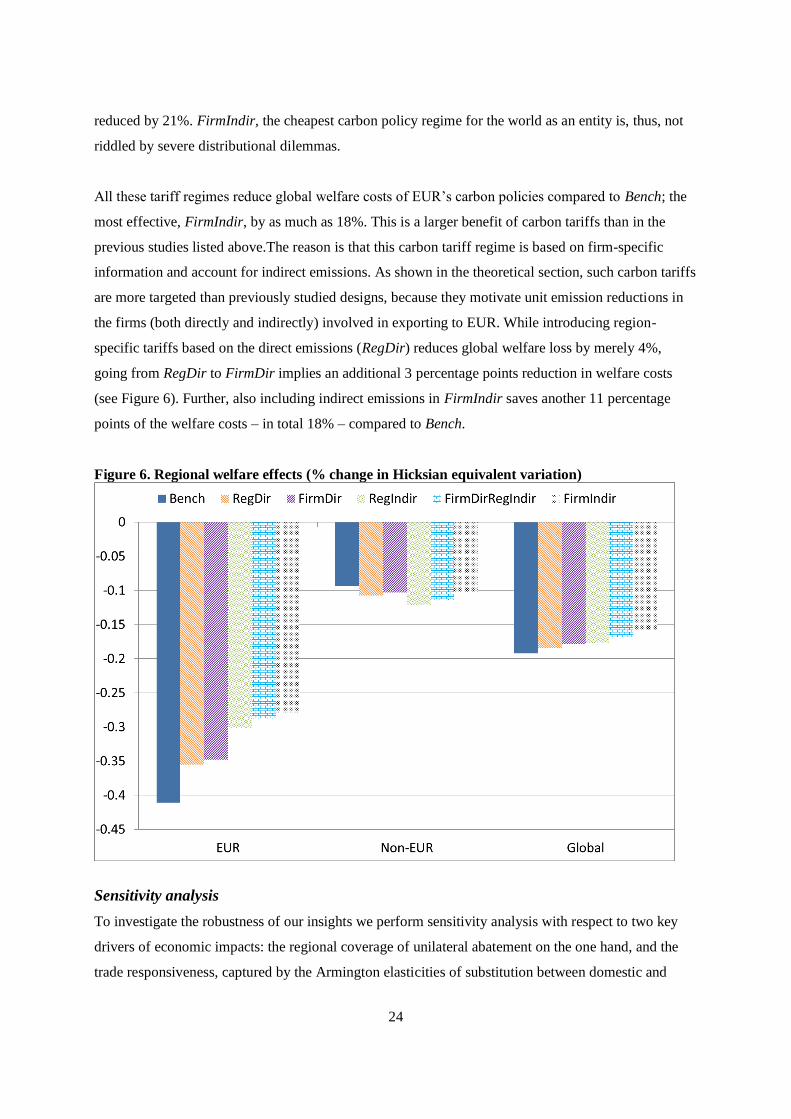
24
reduced by 21%. FirmIndir, the cheapest carbon policy regime for the world as an entity is, thus, not
riddled by severe distributional dilemmas.
All these tariff regimes reduce global welfare costs of EUR’s carbon policies compared to Bench; the
most effective, FirmIndir, by as much as 18%. This is a larger benefit of carbon tariffs than in the
previous studies listed above.The reason is that this carbon tariff regime is based on firm-specific
information and account for indirect emissions. As shown in the theoretical section, such carbon tariffs
are more targeted than previously studied designs, because they motivate unit emission reductions in
the firms (both directly and indirectly) involved in exporting to EUR. While introducing region-
specific tariffs based on the direct emissions (RegDir) reduces global welfare loss by merely 4%,
going from RegDir to FirmDir implies an additional 3 percentage points reduction in welfare costs
(see Figure 6). Further, also including indirect emissions in FirmIndir saves another 11 percentage
points of the welfare costs – in total 18% – compared to Bench.
Figure 6. Regional welfare effects (% change in Hicksian equivalent variation)
Sensitivity analysis
To investigate the robustness of our insights we perform sensitivity analysis with respect to two key
drivers of economic impacts: the regional coverage of unilateral abatement on the one hand, and the
trade responsiveness, captured by the Armington elasticities of substitution between domestic and
25
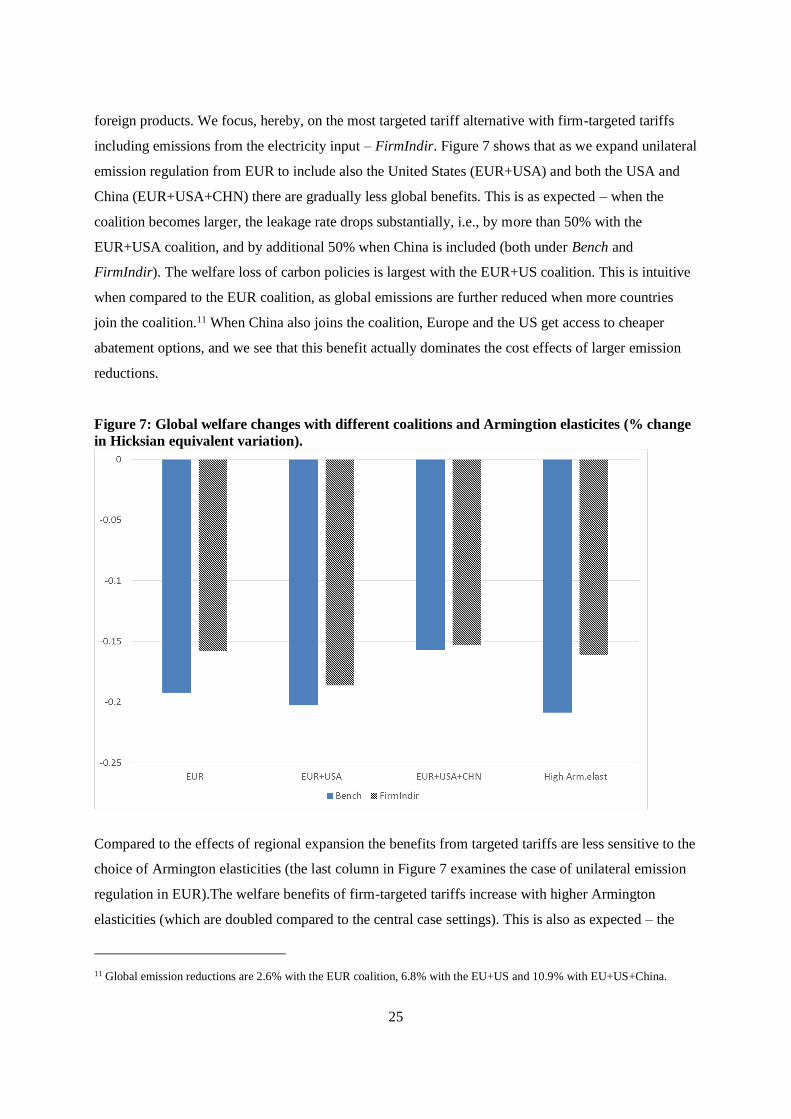
foreign products. We focus, hereby, on the most targeted tariff alternative with firm-targeted tariffs
including emissions from the electricity input – FirmIndir. Figure 7 shows that as we expand unilateral
emission regulation from EUR to include also the United States (EUR+USA) and both the USA and
China (EUR+USA+CHN) there are gradually less global benefits. This is as expected – when the
coalition becomes larger, the leakage rate drops substantially, i.e., by more than 50% with the
EUR+USA coalition, and by additional 50% when China is included (both under Bench and
FirmIndir). The welfare loss of carbon policies is largest with the EUR+US coalition. This is intuitive
when compared to the EUR coalition, as global emissions are further reduced when more countries
join the coalition.11 When China also joins the coalition, Europe and the US get access to cheaper
abatement options, and we see that this benefit actually dominates the cost effects of larger emission
reductions.
Figure 7: Global welfare changes with different coalitions and Armingtion elasticites (% change
in Hicksian equivalent variation).
Compared to the effects of regional expansion the benefits from targeted tariffs are less sensitive to the
choice of Armington elasticities (the last column in Figure 7 examines the case of unilateral emission
regulation in EUR).The welfare benefits of firm-targeted tariffs increase with higher Armington
elasticities (which are doubled compared to the central case settings). This is also as expected – the
11 Global emission reductions are 2.6% with the EUR coalition, 6.8% with the EU+US and 10.9% with EU+US+China.
26
larger the trade sensitivity the bigger is the leakage rates and, thus, the higher are the benefits of
targeted carbon tariffs.
5. Conclusions
The climate effect of unilateral carbon pricing is undermined due to carbon leakage. To mitigate
leakage and increase global cost-effectiveness of unilateral abatement action, the literature suggests
supplementing unilateral carbon pricing with carbon tariffs designed so as to tax all the carbon
emissions directly and indirectly embodied in net imports equally to domestic emissions. In this paper
we discuss the possibilities, limitations, and implications of alternative carbon tariff systems designed
to capture the carbon footprint of producers in non-regulating countries. In particular, we propose
practical carbon tariff systems designed to mimic the theoretical principle that the carbon tariff should
adjust according to the specific embodied emissions in each imported good. We first present a
theoretical analysis on the economic incentives for emission abatement of producers in unregulated
countries that are subjected to different designs of carbon tariffs. We then operationalise these carbon
tariff systems in a multi-sector, multi-region CGE model of the global economy to quantify the
different impacts based on empirical data and practical systems.
Theoretical analysis shows that introducing carbon tariffs increases the efficiency of a region’s carbon
policy more the more targeted the carbon tariffs are and the more emissions they embody. Our
numerical analysis indicates that implementable firm-targeted systems have substantial welfare
advantages compared to previously studied systems. Particularly promising are systems that also target
embodied indirect emissions from electricity supply in the non-regulating regions. The reductions in
carbon leakage and the gains in global welfare that we find are significantly larger than suggested by
previous studies.
Furthermore, the exporters’ competitiveness and the overall welfare of their economies will be less
randomly and less adversely affected. This beneficial distributional impact of a more targeted
approach could facilitate a higher degree of legitimacy and legality of carbon tariffs as a supplemental
instrument in unilateral climate policy.
27
References
Armington, P.S. (1969), A Theory of Demand for Producers Distinguished by Place of Production,
IMF Staff Papers 16(1), 159–78.
Balistreri, E.J., Al-Qahtani, A., Dahl, C.A. (2010), Oil and Petroleum Product Armington Elasticities:
A New-Geography-of-Trade Approach to Estimation, The Energy Journal 31(3), 167-179.
Böhringer, C., Fischer, C., Rosendahl, K.E. (2010), The Global Effects of Subglobal Climate Policies,
The B.E. Journal of Economic Analysis & Policy 10(2) (Symposium): Article 13.
Böhringer, C., Balistreri, E., Rutherford, T. (2012a), The Role of Border Carbon Adjustment in
Unilateral Climate Policy: Overview of an Energy Modeling Forum Study (EMF29), Energy
Economics, 34 Supplement 2, 97-110.
Böhringer, C., Bye, B. , Fæhn, T., Rosendahl, K. E. (2012b), Alternative designs for tariffs on
embodied carbon: A global cost-effectiveness analysis, Energy Economics, 34 Supplement 2, 143-152.
Branger, F., Quirion, P. (2014), Would border carbon adjustments prevent carbon leakage and heavy
industry competitiveness losses? Insights from a meta-analysis of recent economic studies, Ecological
Economics 99, 29–39.
Directive 2008/101/EC (2008), Amending Directive 2003/87/EC so as to include aviation activities in
the scheme for greenhouse gas emission allowance trading within the Community, The European
Parliament and The Council of the European Union (http://eur-lex.europa.eu/legal-
content/EN/TXT/?uri=CELEX:32008L0101)
Evans, C. (2003), Studying the studies: An overview of recent research into taxation operating costs,
Journal of Tax Research 1(1), 64-92.
Fischer, C., Fox, A. K. (2012), Comparing policies to combat emissions leakage: Border carbon
adjustments versus rebates, Journal of Environmental Economics and Management.
Graham, P., Thorpe, S., Hogan, L. (1999), Non-competitive market behaviour in the international
coking coal market, Energy Economics 21, 195-212.
Hoel, M. (1996), Should a carbon tax be differentiated across sectors?, Journal of Public Economics
59, 17–32.
House of Representatives (2009), The American Clean Energy and Security Act (H.R. 2454), Bill Text
as Passed by House of Representatives.
Ireland, R. (2012), The EU Aviation Emissions Policy and Border Tax Adjustments, WCO Policy
Research Brief, WCO Research Paper No. 26
Ismer R. ,Neuhoff, K. (2007), Border tax adjustment: a feasible way to support stringent emission
trading, European Journal of Law and Economics 24(2), 137-164.
ISO 14044:2006, Environmental management – Life cycle assessment – Requirements and guidelines,
https://www.iso.org/obp/ui/#iso:std:iso:14044:ed-1:v1:en
28
ISO/TS 14067:2013, Greenhouse gases – Carbon footprints of products – Requirements and
guidelines for quantification and communication,
http://www.iso.org/iso/catalogue_detail?csnumber=59521
Krichene, N. (2002), World crude oil and natural gas: a demand and supply model, Energy Economics
24, 557-576.
Markusen, J.R. (1975), International Externalities and Optimal Tax Structures, Journal of
International Economics 5, 15–29.
Mattoo, A., Subramanian, A., van der Mensbrugghe, D., and He, J. (2009), Reconciling Climate
Change and Trade Policy, Policy Research Working Paper Series 5123, the World Bank.
Narayanan, G.B., Aguiar, A., McDougall, R. (2012), Global Trade, Assistance, and Production: The
GTAP 8 Data Base. Center for Global Trade Analysis, Purdue University.
Persson, S, (2010), Practical Aspects of Border Carbon Adjustment Measures: Using a Trade
Facilitation Perspective to Assess Trade Costs, Issue Paper No. 13, International Centre for Trade and
Sustainable Development (ICTSD), Geneva, Switzerland. http://ictsd.org/i/publications/129482/
The Greehouse Gas Protocol (2010), Corporate Accounting and Reporting Standards, World
Resource Institute, WRI, Washington, USA and the World Business Council for Sustainble
Development, WBCSD, Geneva, Switzerland, http://www.ghgprotocol.org/files/ghgp/public/ghg-
protocol-revised.pdf
UNFCCC (2012), Procedure Development, revision and clarification of baseline and monitoring
methodologies and methodological tools, Version 01.1, CDM-EB70-A36-PROC, United Nations
Framework Convention on Climate Change,
http://cdm.unfccc.int/Reference/Procedures/meth_proc09.pdf
UNFCCC (2014), CDM accreditation standard, Version 06.0, CDM-EB46-A02-STAN, United
Nations Framework Convention on Climate Change,
http://cdm.unfccc.int/sunsetcms/storage/contents/stored-file-20140721152731014/accr_stan01.pdf
Winchester, N. (2011), The impact of border carbon adjustments u
nder alternative producer responses, American Journal of Agricultural Economics, 94(2), 354-359.
Zhang, Z. X. (2012), Competitiveness and Leakage Concerns and Border Carbon Adjustments,
International Review of Environmental and Resource Economics 6 (3), 225-287.