Embed Size (px)
Citation preview
TAXATION AND INFORMAL SECTOR:
A CASE STUDY OF BOLGATANGA MUNICIPALITY
By
Patrick Somuah
(PG. 2065408)
A Thesis submitted to the Institute Of Distance Learning, Kwame
Nkrumah University of Science and Technology, Kumasi, in partial
fulfillment of the requirements for the degree of
COMMONWEALTH EXECUTIVE MASTERS OF BUSINESS
ADMINISTRATION
AUGUST 2011
DECLARATION
I hereby declare that this submission is my own work towards the Commonwealth Executive
Masters of Business Administration and that, to the best of my knowledge, it contains no
material previously published by another person nor material which has been accepted for the
ward of any other degree of the University, except where due acknowledgement has been made
in the text.
Patrick Somuah …………………….... …………………….
PG 2065408
Student Name and ID Signature Date
Certified by:
G.S. Ahinful …………………….... …………………….
Supervisor Name Signature Date
Certified by:
Prof. I. K. Dontwi …………………….... …………………….
Dean ,IDL Signature Date
DEDICATION
I dedicate this work to the memory of my late parents, Mad. Mary Obenewah and J. K. Dede.
ACKNOWLEDGEMENT

First and foremost, I would like to thank the Almighty God for giving me the knowledge and
strength to come out with this work.
Secondly, my deepest appreciation goes to Mr. Gabriel Ahinful, my supervisor, for his tolerance,
understanding, constructive criticisms and useful suggestions which helped me in no small way
in coming out with this work.
To my wife and children I say thank you for your prayers, support and encouragement.
Also my appreciation goes to Miss Agnes Ayine for typing the whole work.
My apologies are due to any one whose name should have been mentioned but has been
unwittingly omitted.
ABSTRACT
Many developing countries including Ghana are faced with the problem of raising the necessary
revenues to meet governments‘ expenditures. Governments‘ budgeted revenues usually fall short
of the expected expenditures. Owing to the lack of liquidity on the international market due to
the current financial crisis domestic revenue mobilization is seen as the most reliable source of
revenue mobilization. Taxation is therefore seen as the most efficient and effective means of
raising revenue domestically for the government. One major sector of developing countries that
should have contributed greatly to domestic revenue mobilization through taxation is the
informal sector given its employment size and contribution to GNP of low-income countries. But
the tax inflow from the informal sector relative to its sheer size is just a drop in the national
coffers. Over the past years almost every aspect of dealing with the informal sector has been a
problem which has defied all measures aimed at improving the relative share of taxes of the
sector. In this regard, the study sought to find out why non compliance with income tax is high
in the informal sector and besides, explore further the challenges in taxing the informal sector in
Bolgatanga Municipality. In order to achieve the objectives of the study, a sample size of
seventy-five (75), comprising seventy (70) tax payers and five tax officials in the Bolgatanga
Municipality responded to the administered questionnaire. At the end of the study, it was
established that factors such as application of sanctions, regular tax education, anticipation of
benefits, high tax rates, among others affect compliance level of the tax payers while capacity
constraints, large size of the informal sector, large size of the tax district, improper books of
accounts were some of the challenges facing the tax district in the Bolgatanga Municipality.
Measures such as intensive and regular monitoring; capacity building; logistical support; regular
tax education and advertisement; effective customer relations among others were recommended

as means of raising compliance level of tax payers as well as reducing the challenges in taxing
the informal sector in the tax district.
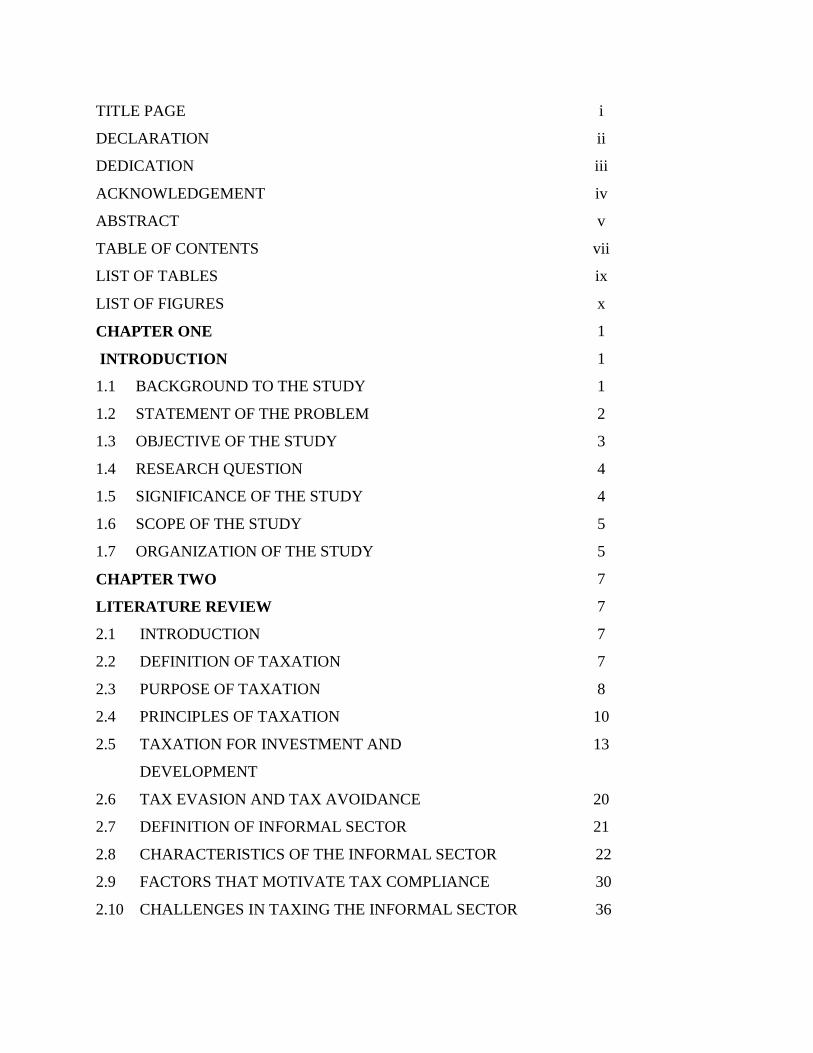
TABLE OF CONTENTS
TITLE PAGE i
DECLARATION ii
DEDICATION iii
ACKNOWLEDGEMENT iv
ABSTRACT v
TABLE OF CONTENTS vii
LIST OF TABLES ix
LIST OF FIGURES x
CHAPTER ONE 1
INTRODUCTION 1
1.1 BACKGROUND TO THE STUDY 1
1.2 STATEMENT OF THE PROBLEM 2
1.3 OBJECTIVE OF THE STUDY 3
1.4 RESEARCH QUESTION 4
1.5 SIGNIFICANCE OF THE STUDY 4
1.6 SCOPE OF THE STUDY 5
1.7 ORGANIZATION OF THE STUDY 5
CHAPTER TWO 7
LITERATURE REVIEW 7
2.1 INTRODUCTION 7
2.2 DEFINITION OF TAXATION 7
2.3 PURPOSE OF TAXATION 8
2.4 PRINCIPLES OF TAXATION 10
2.5 TAXATION FOR INVESTMENT AND
DEVELOPMENT
13
2.6 TAX EVASION AND TAX AVOIDANCE 20
2.7 DEFINITION OF INFORMAL SECTOR 21
2.8 CHARACTERISTICS OF THE INFORMAL SECTOR 22
2.9 FACTORS THAT MOTIVATE TAX COMPLIANCE 30
2.10 CHALLENGES IN TAXING THE INFORMAL SECTOR
36
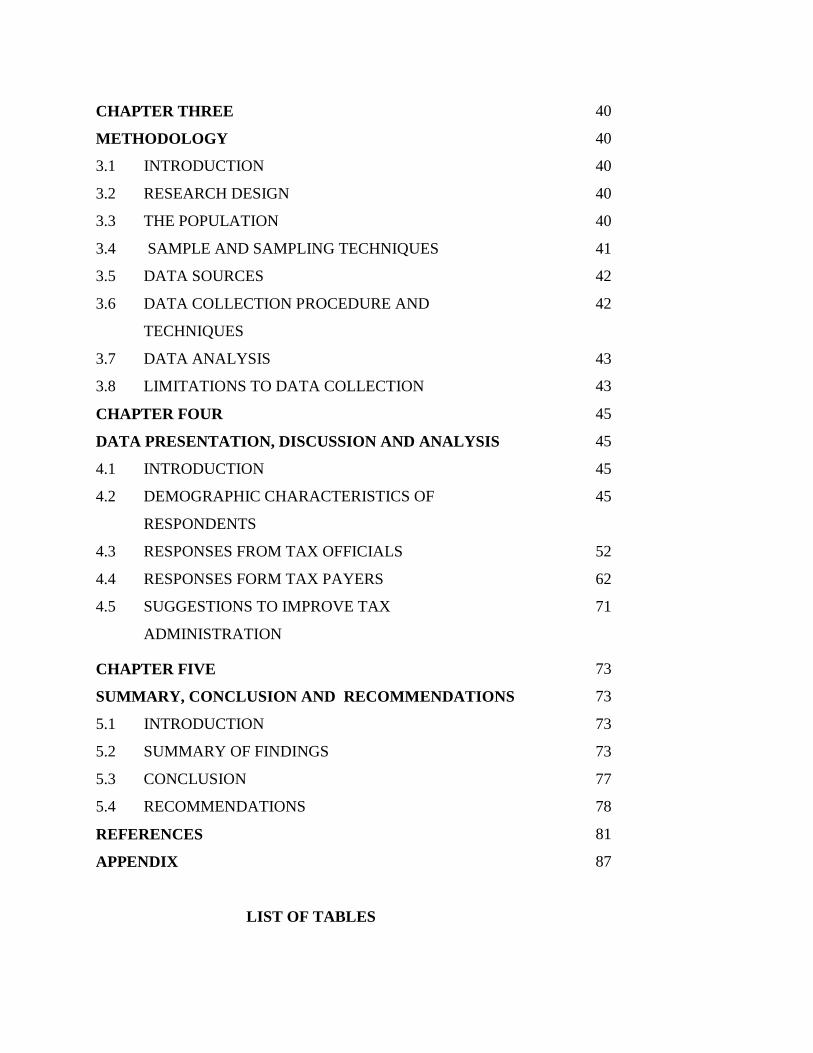
CHAPTER THREE 40
METHODOLOGY 40
3.1 INTRODUCTION 40
3.2 RESEARCH DESIGN 40
3.3 THE POPULATION 40
3.4 SAMPLE AND SAMPLING TECHNIQUES 41
3.5 DATA SOURCES 42
3.6 DATA COLLECTION PROCEDURE AND
TECHNIQUES
42
3.7 DATA ANALYSIS 43
3.8 LIMITATIONS TO DATA COLLECTION 43
CHAPTER FOUR 45
DATA PRESENTATION, DISCUSSION AND ANALYSIS 45
4.1 INTRODUCTION 45
4.2 DEMOGRAPHIC CHARACTERISTICS OF
RESPONDENTS
45
4.3 RESPONSES FROM TAX OFFICIALS 52
4.4 RESPONSES FORM TAX PAYERS 62
4.5 SUGGESTIONS TO IMPROVE TAX
ADMINISTRATION
71
CHAPTER FIVE 73
SUMMARY, CONCLUSION AND RECOMMENDATIONS 73
5.1 INTRODUCTION 73
5.2 SUMMARY OF FINDINGS 73
5.3 CONCLUSION 77
5.4 RECOMMENDATIONS 78
REFERENCES 81
APPENDIX
87
LIST OF TABLES
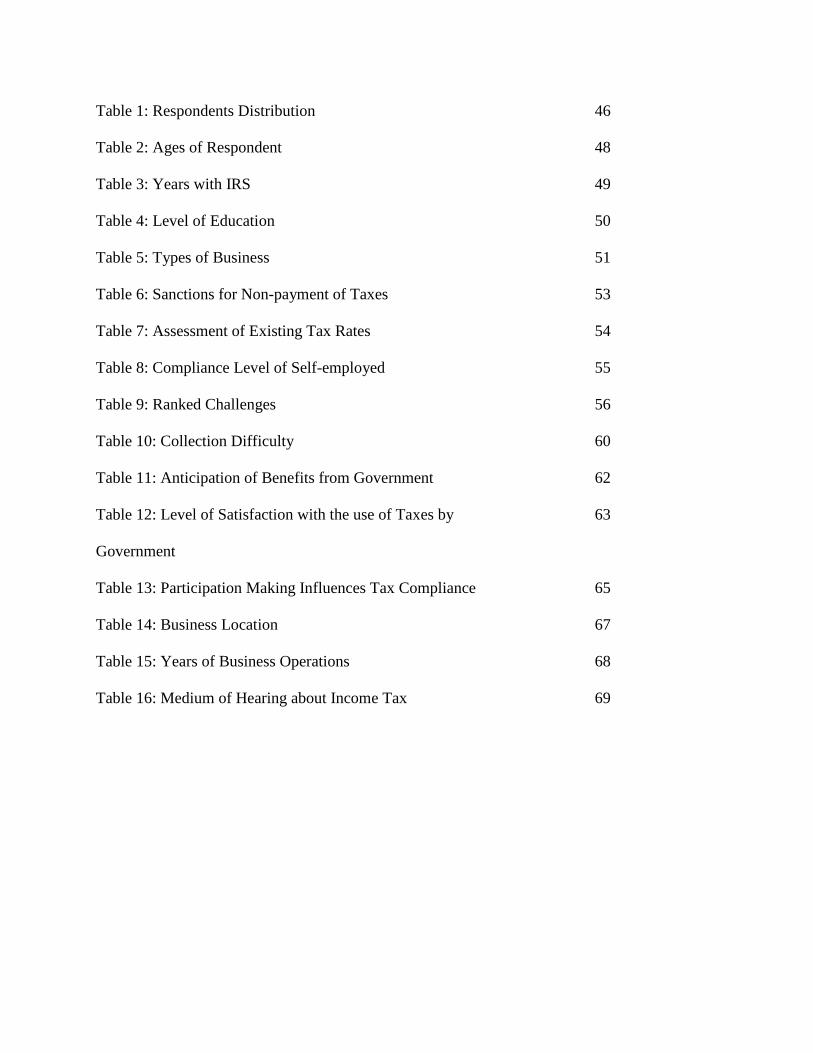
Table 1: Respondents Distribution 46
Table 2: Ages of Respondent 48
Table 3: Years with IRS 49
Table 4: Level of Education 50
Table 5: Types of Business 51
Table 6: Sanctions for Non-payment of Taxes 53
Table 7: Assessment of Existing Tax Rates 54
Table 8: Compliance Level of Self-employed 55
Table 9: Ranked Challenges 56
Table 10: Collection Difficulty 60
Table 11: Anticipation of Benefits from Government 62
Table 12: Level of Satisfaction with the use of Taxes by
Government
63
Table 13: Participation Making Influences Tax Compliance 65
Table 14: Business Location 67
Table 15: Years of Business Operations 68
Table 16: Medium of Hearing about Income Tax 69

LIS
T
OF
FIG
UR
ES
Figu
re 1:
Res
pon
dent
s
Dist
ribu
tion
46
Figu
re 2:
Gen
der
Rati
o
47
Figu
re 3:
Age
48

s of
Res
pon
dent
Figu
re 4:
Yea
rs
with
IRS
49
Figu
re 5:
Typ
es
of
Busi
ness
51
Figu
re 6:
San
ctio
ns
for
53

Non
-
pay
men
t of
Tax
es
Figu
re 7:
Ass
ess
men
t of
Exis
ting
Tax
Rate
s
54
Figu
re 8:
Co
mpli
ance
55

Lev
el of
Self
-
emp
loye
d
Figu
re
9:R
ank
ed
Cha
llen
ges
57
Figu
re
10:
Coll
ecti
on
Diff
icult
60

y
Figu
re
11:
Anti
cipa
tion
of
Ben
efits
fro
m
Gov
ern
men
t
63
Figu
re
12:
Lev
el of
Sati
sfac
64

tion
with
the
use
of
Tax
es
by
Gov
ern
men
t
Figu
re
13:
Part
icip
atio
n
Dec
isio
n
Mak
66

ing
Infl
uen
ces
Tax
Co
mpli
ance
Figu
re
14:
Busi
ness
Loc
atio
n
67
Figu
re
15:
Yea
rs of
Busi
ness
68
Ope
ratio
ns
Figu
re
16:
Med
ium
of
Hea
ring
abo
ut
Inco
me
Tax
70
CHAPTER ONE
INTRODUCTION
1.1 BACKGROUND TO THE STUDY
Many developing countries including Ghana are faced with the problem of raising
the necessary revenues to meet governments‘ expenditures. Governments‘
budgeted revenues usually fall short of the expected expenditures. This was
acknowledged by the 2007 budget statement of Ghana when the Minister of
Finance mentioned that ―given the revenues and expenditures outlined above, the
2007 budget is expected to result in an overall budget deficit equivalent to 3.2% of
GDP‖ (Budget of Ghana, 2007). Over the past two decades, the government of
Ghana has consistently spent more than it is able to generate as revenue and the
gap is often financed with foreign aid which has perpetuated the country‘s aid
dependency (Osei and Quartey, 2005).
The current financial crisis has created financial difficulties for many developing
countries that depend mainly on external source for public finance, given the lack
of liquidity on the international market, putting into question the robustness of
their development (Drine, 2009).
To avoid excessive foreign financing which may in the long run lead to problem of
debt sustainability, developing countries need to rely substantially on domestic
revenue mobilization (Gupta, 2007). To strengthen domestic resource mobilization
developing countries have to rely on taxation and seek to raise additional revenue
by expanding the tax base and strengthening revenue administration. Taxation is
the most efficient and effective means of raising revenue for the government
(Gberegbe, 2007).
The Ghanaian economy is divided into formal and informal sectors. While the
formal sector employs about 14% of the labour force, the informal sector
(including agricultural sector) is the source of livelihood for the remaining 86% of
the working population (GTUC, 2004). According to World Bank estimates, the
informal sector accounts for 40% of GNP of low-income countries (Farrell, 2004
cited by Yadav, 2009). Despite the significant contribution of the informal sector
to the economies of developing countries, they are the least taxed. According to
the Commissioner of Internal Revenue Service (IRS), Major (Rtd) Daniel Ablorh
– Quarcoo records at the Registrar General Department of Ghana show that there
are 226,760 self-employed registered in the informal sector, but only 53,352 are
registered with IRS and are being assessed to tax (GNA, 2009).
Despite the low tax revenue from the informal sector the Government is still
determined to expand the tax base to the informal sector to ensure fairness and
equity as Baah Wiredu, the former Minister for Finance and Economic Planning,
put it ―the burden of tax must be shared by all no matter how little one‘s
contribution is‖ (GNA, 2006).
1.2 STATEMENT OF THE PROBLEM
One of the major challenges facing the governments of developing countries is
how to tax the informal sector. This assertion was recognized by Joshi and Ayee
(2009), when they did state that ―how to tax the informal sector remains a pressing
question‖. Over the past years almost every aspect of dealing with the informal
sector (self-employed) has been a problem which has defied all measures aimed at
improving the relative share of taxes of the informal sector (Adom, 2000). The tax
inflow of the informal sector relative to its sheer size is just a drop in the national
coffers. In spite of the low revenue share of the informal sector, the government is
still determined to expand the tax base to the informal sector since ignoring the
sector‘s activities will lower compliance morale and increase the risk of
generalized non compliance (Terkper, 2003). There are many informal sector
operators who either intentionally evade tax payment or are not captured by IRS.
The purpose of this study is therefore to find out the causes of tax non compliance
behaviour in the informal sector and besides, explore further the challenges in
taxing the informal sector in Bolgatanga Municipality.
1.3 OBJECTIVE OF THE STUDY
The study aims at achieving the following:
(a) To find out why non compliance with income tax is high in the informal
sector.
(b) To identify the challenges that militate against effective revenue
mobilization by IRS from the informal sector.
(c) Making recommendations as to how to incorporate good tax administration
principles, procedures and practices in Bolgatanga Municipality IRS.
1.4 RESEARCH QUESTIONS
In order to achieve the set objectives of the study the researcher seeks to find
answers to the following questions.
(a) What factors contribute to the high rate of non compliance among
businesses in the informal sector in Bolgatanga?
(b) What are the challenges that militate against effective revenue mobilization
by IRS from the informal sector in Bolgatanga?
(c) How can IRS improve upon their tax collection in the informal sector by
incorporating good tax administration principles, procedures and practices
in Bolgatanga Municipality IRS?
1.5 SIGNIFICANCE OF THE STUDY
The study would help policy makers to be able to understand the factors
underlying the individual‘s decision as to whether to pay taxes or not. Also, it
would help the self-employed in the informal sector to know their rights as
taxpayers and besides, they would be motivated to appreciate the need to pay taxes
regularly and on time.
Again, since the study would unveil some of the problems associated with tax
collection in the informal sector in Bolgatanga Municipality and recommend ways
of solving them, it would serve as a guide to management for future policies and
programmes relating to tax collection in the informal sector.
In addition, it would provide some directions for future research and serve as
source of reference for future research into the subject matter.
1.6 SCOPE OF THE STUDY
The study covered businesses in the informal sector such as petty traders, hawkers,
hairdressers, dressmakers, artisans and so on in the Bolgatanga Municipality. The
decision of the researcher to use the tax district in Bolgatanga Municipality as a
case study was based on the fact that the tax district is full of informal sector
operators who are purported to be paying taxes to the state.
Besides, the tax district lacks the requisite personnel and other resources as
compared to other districts of IRS given its area of jurisdiction which covers five
District Assemblies in addition to Bolgatanga Municipal Assembly. The selection
of the tax district was also based on the researcher‘s familiarity with the district.
1.7 ORGANISATION OF THE STUDY
The study consists of five chapters. Chapter one deals with the background of the
study, the statement of the problem, the objective of the study and research
questions. Other aspects of the chapter are significance and scope of the study.
Chapter two focuses on the review of related literature. In this chapter, books,
journals, articles, published and unpublished research works relating to the study
have been reviewed. The methodology of the study is the subject of chapter three.
It describes the research design, the population, sample and sampling procedures
of the study. Also covered in the chapter are the variables of the study, methods of
data analysis and limitations to data collection. In chapter four, results and
discussion of the findings are presented. Finally, the summary of findings,
conclusions and recommendations form the concluding chapter of the study that is
chapter five.
CHAPTER TWO
LITERATURE REVIEW
2.1 INTRODUCTION
This chapter discusses the relevant literature on concepts in taxation,
characteristics of informal sector, causes of non compliance behaviour of the
informal sector, and challenges in taxing the informal sector.
2.2 DEFINITION OF TAXATION
One of the most flexible ways to raise per capita income and to support increases
in real GDP growth rates is through taxation. Taxation is a sovereign right of the
state used to transfer resources from private to public use in order to achieve the
economic and political goals of society (Bird, 1992).
According to Bannock et al., (1998) taxation is a compulsory transfer of money
(or occasionally of goods and services) from private individuals, institutions or
groups to the government.
The US Treasury Department also defined it as a compulsory payment for which
no specific benefit is received in return (Slavin, 1999). Tax policy is concerned
with the reasoning behind how much revenue the government is collecting, what
the revenue is being used for, and whether the government is collecting revenue in
the most appropriate way.
Therefore, the above definition by the US Treasury Department is adopted for this
study.
2.3 PURPOSE OF TAXATION
The imposition and collection of taxes is simply one of the fundamental policy
instruments use to achieve governmental social and economic goals. The
objectives of tax policy are similar to those of public policy in developing
countries and overlap with the purposes of the tax system or the purpose of most
governments.
Edgar and Sandler (2005) revealed that there are five purposes for collecting
revenue through taxes: to give government power to allocate resources; to enable
government to provide/support social development; to stabilize the economy; to
constitute and define the market place; and to encourage optimal economic
growth. Furthermore, three of these are of greatest urgency in developing
countries: economic growth; internal and external stability; and ensuring that
incomes are distributed appropriately.
2.3.1 ECONOMIC GROWTH
Most developing countries are extremely focused on economic growth in both the
private and public sectors. Even in primarily market based economies,
governments need to acquire assets for public sector capital formation and
development related expenditures (Bird, 1992). There appears to be no limit to
the tax gadgetry used in different countries to stimulate economic growth.
Most developing countries encourage foreign direct investment to stimulate
economic growth through the use of tax incentives and many developing countries
impose higher taxes on retained profits than on distributed profit in order to
encourage distribution.
However, the effectiveness of some of the policies especially of incentives
remains uncertain because there is still insufficient data to link such policies with
growth performance (Shihata, 1991).
2.3.2 STABILIZATION
The use of tax instrument to enhance economic stability is important in developing
countries because this enable them to ensure elasticity with respect to changes in
the value of money and income levels. If tax yields rise when national income
rises, governments have less need to rely on deficit financing to maintain and
expand the level of public – sector activity in a growing economy (Bird, 1992).
2.3.3 DISTRIBUTION OF INCOME
The distributional role of taxes in developing countries is another important
purpose of tax system. Disparities in income can block development and increase
demands for government social spending. The main redistributive tax in most tax
systems is personal income tax (Zee, 2005). In practice, the personal income tax
in developing countries is far from being progressive due to large disparities in
incomes. These disparities are compounded by the influence of the rich, who may
end up paying fewer taxes due to numerous exemptions or favours from the
government (ibid).
2.4 PRINCIPLES OF TAXATION
A good tax system should possess some principles or qualities. In his book, the
Wealth of Nations Adam Smith stated four principles which he called ―the canons
of taxation‖ (Hardwick et al., 1994). These include:
2.4.1 EQUITY PRINCIPLE
This principle has been subjected to two interpretations by Modern Economists –
the benefit principle and ability-to-pay principle. The benefit principle is based on
the idea that people should be taxed in proportion to benefit they receive from the
government (goods and services provided by that tax) (Strafford and LoCascio,
1995). Thus, the amount of tax paid by an individual should be directly related to
the benefits, which that individual derives from government expenditure.
The ability-to- pay principle on the other hand, is based on the idea that people
who are better able to pay taxes should pay a larger proportion of their income or
wealth than people who are less able to pay (Strafford and LoCascio, 1995). This
means that taxes should be imposed on people according to what they can afford
to pay. Thus, the amount of tax paid should correlate the income available to the
taxpayer. In modern day taxation progressive taxation supports this principle.
2.4.2 CERTAINTY PRINCIPLE
This principle means that the payment of taxes should be clear and certain to the
taxpayer and the tax collector. Thus, both the taxpayer and the tax collecting
agency should be certain about how much, when and where to pay the tax. In this
direction, tax laws must be made available to the citizens so that they will know
their rights and obligations with regard to tax.
2.4.3 CONVENIENCE PRINCIPLE
This principle means that the method, manner, and time of payment should be
convenient to the tax payer. For instance the location of the tax offices must be at
the convenience of the tax payer as well as the forms to be completed must be
simple for the tax payer. Thus, taxes should be enforced in a manner that
facilitates voluntary compliance to the maximum extent possible
(www.BusinessDictionary.com,2011)
2.4.4 THE PRINCIPLE OF ECONOMY
This principle means that the cost of collection in relation to the tax yield should
be minimal. The cost of collecting taxes falls on two parties: the government,
which takes on administration costs and the taxpayer who bears the cost of
compliance (Wilkinson, 1992). The administration cost includes principally the
cost of running the tax authority; the largest being the salaries of all the
employees. Compliance costs, on the other hand, include time spent on tax affairs,
keeping records, filling in forms, money spent on professional advisers among
others by the taxpayer.
2.4.5 OTHER PRINCIPLES OF TAXATION
Nevertheless, www.BusinessDictionary.com (2011) has given additional
principles to guide a government in designing and implementing an equitable
taxation regime.
These include:-
Adequacy: taxes should be just-enough to generate revenue required for
provision of essential public services.
Broad Basing: taxes should be spread over as wide as possible section of the
population, or sectors of economy, to minimize the individual tax burden.
Compatibility: taxes should be coordinated to ensure tax neutrality and overall
objectives of good governance.
Earmarking: tax revenue from a specific source should be dedicated to a
specific purpose only when there is a direct cost-and-benefit link between the
tax source and the expenditure, such as use of motor fuel tax for road
maintenance.
Neutrality: taxes should not favour any one group or sector over another, and
should not be designed to interfere-with or influence individual decisions-
making.
Restricted exemptions: tax exemptions must only be for specific purposes
(such as to encourage investment) and for a limited period.
Simplicity: tax assessment and determination should be easy to understand by
an average taxpayer.
Livingstone et al., (1987) indicated that generally a good tax system may be
judged by the following criteria:-
i. Its effect on the supply and allocation of resources.
ii. Its effect on the distribution of income and employment.
iii. Its effect on the stability and growth of aggregate income and employment.
iv. Administrative efficiency and convenience to the taxpayer.
Unfortunately, a tax which is good in one direction is often poor in another, so that
in practice tax system tend to be a compromise between these economic and social
objectives, and incorporate a combination of various forms of taxation (ibid,
1987).
2.5 TAXATION FOR INVESTMENT AND DEVELOPMENT
Taxation is an integral part of countries‘ development policies, interwoven with
numerous other areas, from good governance and formalizing the economy, to
spurring growth through, for example, promoting small and medium sized
enterprises (SMEs) and stimulating export activities. Among other things,
taxation:
Provides governments with the funding required to build the infrastructure on
which economic development and growth are based;
Creates an environment in which business is conducted and wealth is created;
Shapes the way government activities are undertaken; and
Plays a central role in domestic resource mobilization.
Taxation provides a predictable and stable flow of revenue to finance development
objectives. In fact, the 2002 Monterrey Consensus recognized taxation‘s key role
in domestic resource mobilization, an acknowledgement sentiment echoed at the
2008 United Nations Doha conference on Financing for Development.
While this overview note considers issues of social development in Africa, it also
focuses on the tax policy challenges with regards to promoting a business and
investment friendly climate on the continent.
It therefore considers the following issues to be addressed to make tax work in
favour of investment and development:
Domestic resource mobilization and broadening the tax base;
Tax evasion;
Investment climate and enterprise development; and
Good Governance.
Finally, this note will highlight how the Organization for Economic Co-operation
and Development (OECD) can support African countries in tackling these
challenges.
2.5.1 CURRENT CHALLENGES FOR TAX POLICY IN AFRICA
The African context
African countries are facing a series of challenges when it comes to optimizing
taxation while aiming to reach development targets. Perhaps the most inherently
difficult challenge is how to find the optimal balance between a tax regime that is
business and investment friendly, while at the same time leveraging enough
revenue for public service delivery (which, in turn, makes economies more
attractive to investors).
After a period of flat growth between the early 1990s and early 2000s, total
government revenue as a share of GDP has steadily increased in most African
countries. Domestic revenue — defined as tax and non-tax public revenues
excluding grants — increased by almost four percentage points of GDP between
2002 and 2007, reaching an average of over 25% in 2007 for the whole of sub-
Saharan Africa. Excluding Nigeria and South Africa, government revenue as a
share of GDP rose even more in the continent, increasing from an average of
18.8% for 1997-2002 to 25.4% in 2007 (OECD, 2008).
However, a significant share of the increase in tax revenue in the region came
from natural resource taxes. This included income from production sharing,
royalties, and corporate income tax on oil and mining companies. Non-resource
related revenue increased by less than 1% of GDP over 25 years (Gupta, 2008).
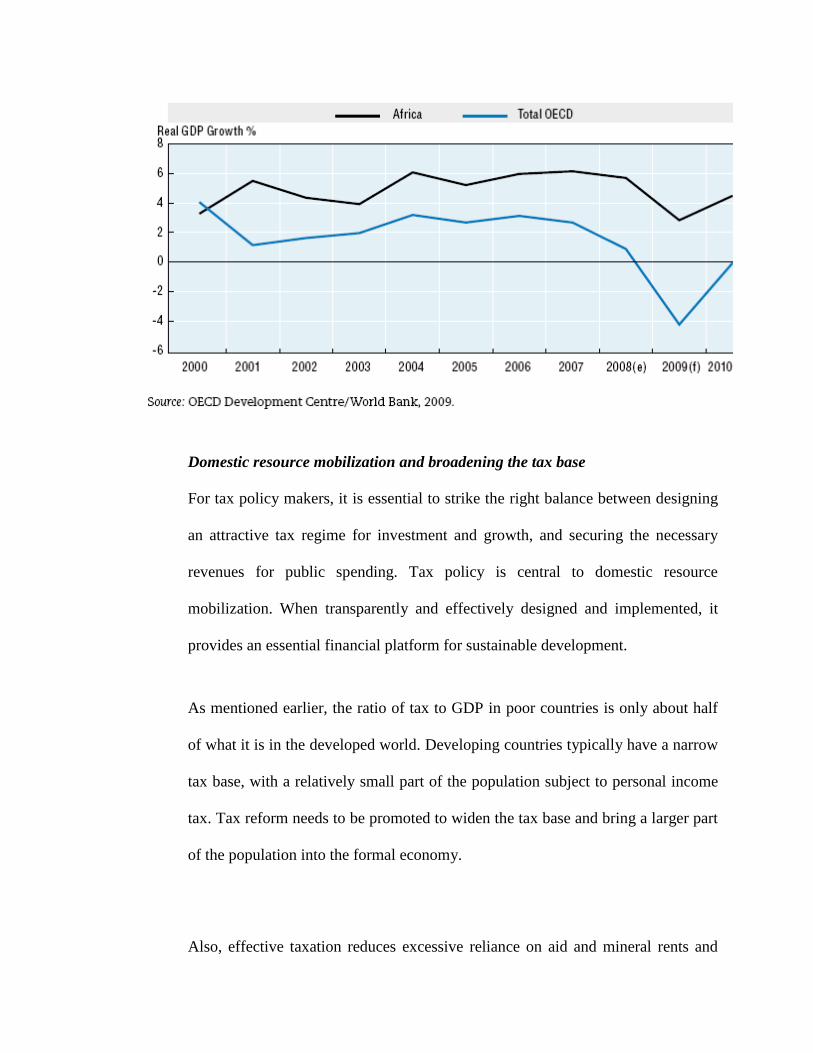
This becomes even more concerning when one considers the impact the crisis has
had on the continent, with economic growth in Africa expected to be only 2.8% in
2009, less than half of the 5.7% estimated for 2008 (Figure A), and an important
drop of export revenues, as well as a slowdown of investment in oil and mineral
production (OECD, 2009). Overall, when compared to the 36% of tax-to-GDP
ratio of the OECD countries (2006 un-weighted average) (OECD, 2006), it is
evident that African governments suffer from a large revenue gap.
Figure A: Real GDP Growth
Domestic resource mobilization and broadening the tax base
For tax policy makers, it is essential to strike the right balance between designing
an attractive tax regime for investment and growth, and securing the necessary
revenues for public spending. Tax policy is central to domestic resource
mobilization. When transparently and effectively designed and implemented, it
provides an essential financial platform for sustainable development.
As mentioned earlier, the ratio of tax to GDP in poor countries is only about half
of what it is in the developed world. Developing countries typically have a narrow
tax base, with a relatively small part of the population subject to personal income
tax. Tax reform needs to be promoted to widen the tax base and bring a larger part
of the population into the formal economy.
Also, effective taxation reduces excessive reliance on aid and mineral rents and
offers a path away from unsustainable revenue streams for many African
economies. One of the most pressing challenges facing the continent is to embark
on a path to free African countries from an over-dependence on external and
volatile capital inflows, such as foreign assistance. In order to do so, African
governments need to strengthen their capacities to mobilize domestic resources.
Because of its sustainability, domestic revenue should be one of the main sources
for fiscal space expansion, thereby reducing dependence on donor assistance
(OECD, 2009).
Furthermore, many African countries rely on tariffs for an important share of
government revenue. While opening up trade is expected to bolster long-term
economic growth, countries participating in trade negotiations, such as the Doha
Round and the Economic Partnership Agreements (EPAs), are required to cut their
tariffs and are thus likely to collect less revenue. Today, in some African
countries, up to 30% of non-resource tax revenue (4% of GDP) is raised through
tariffs and trade related taxes. Losing this source as a result of trade liberalization
is likely to have significant budgetary consequences (www.africa-pay-more-
attention-to-tax-imf.html, 2008).
As Figure B below illustrates, recent trends of decreases in revenues from trade
taxes could be indicative of such trade liberalization effects. This obviously
presents a major challenge to maintaining current revenue bases, let alone
increasing them. Alternative revenue sources need to be available before tariffs are
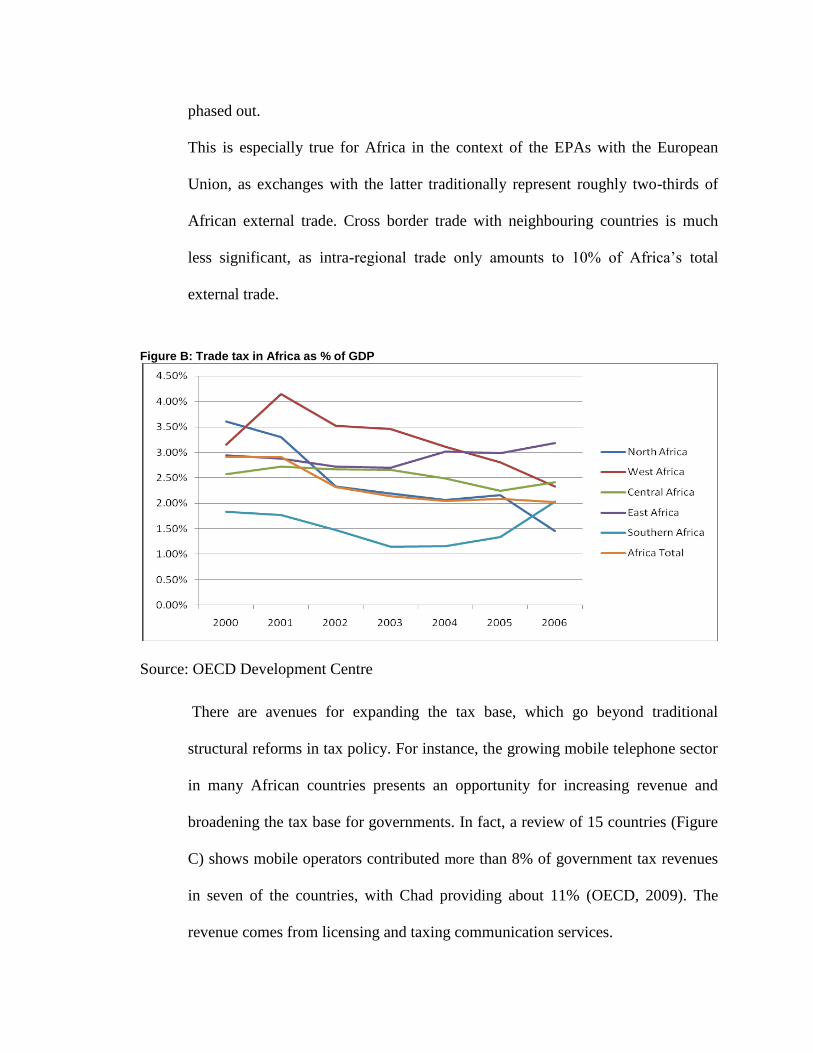
phased out.
This is especially true for Africa in the context of the EPAs with the European
Union, as exchanges with the latter traditionally represent roughly two-thirds of
African external trade. Cross border trade with neighbouring countries is much
less significant, as intra-regional trade only amounts to 10% of Africa‘s total
external trade.
Figure B: Trade tax in Africa as % of GDP
Source: OECD Development Centre
There are avenues for expanding the tax base, which go beyond traditional
structural reforms in tax policy. For instance, the growing mobile telephone sector
in many African countries presents an opportunity for increasing revenue and
broadening the tax base for governments. In fact, a review of 15 countries (Figure
C) shows mobile operators contributed more than 8% of government tax revenues
in seven of the countries, with Chad providing about 11% (OECD, 2009). The
revenue comes from licensing and taxing communication services.
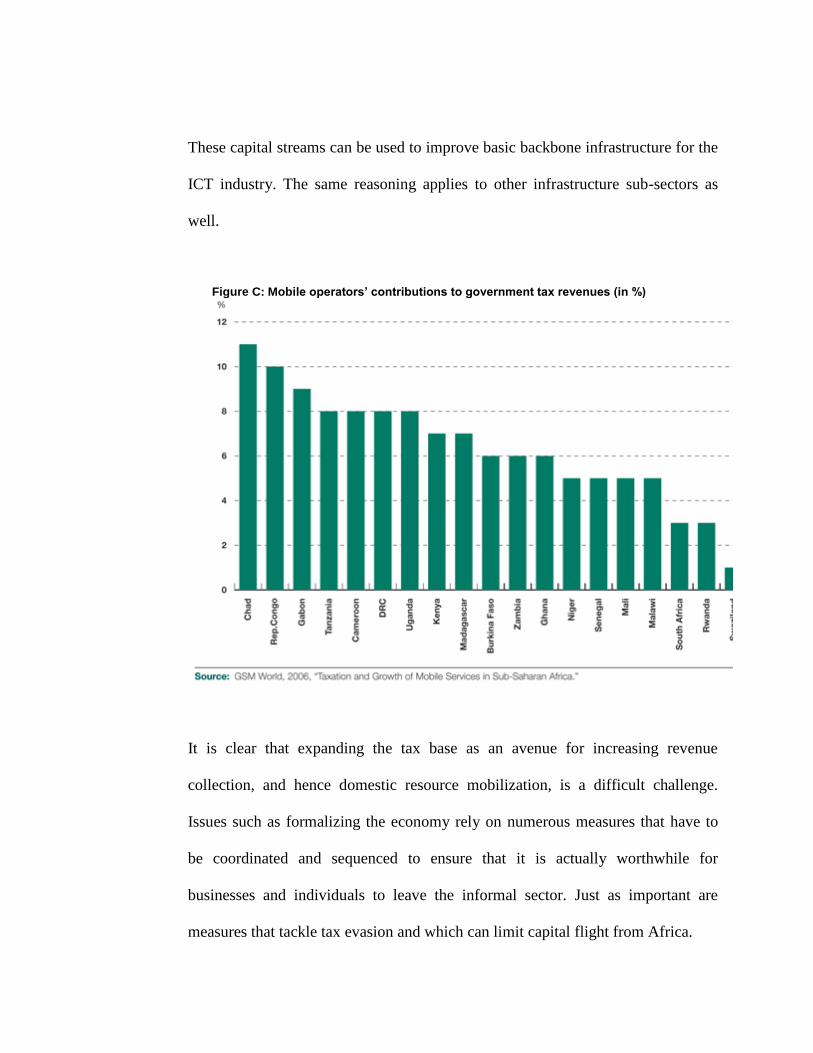
These capital streams can be used to improve basic backbone infrastructure for the
ICT industry. The same reasoning applies to other infrastructure sub-sectors as
well.
Figure C: Mobile operators’ contributions to government tax revenues (in %)
It is clear that expanding the tax base as an avenue for increasing revenue
collection, and hence domestic resource mobilization, is a difficult challenge.
Issues such as formalizing the economy rely on numerous measures that have to
be coordinated and sequenced to ensure that it is actually worthwhile for
businesses and individuals to leave the informal sector. Just as important are
measures that tackle tax evasion and which can limit capital flight from Africa.
2.6 TAX EVASION AND TAX AVOIDANCE.
Tax evasion may be defined as any action that results in the concealment of all or
part of a person‘s legitimate or illegal economic activities from the tax authorities
in order to escape or dodge the payment of tax. It is the willful attempt to
circumvent the tax laws through misrepresentation or deceit. In short, it is an
intentional and illegal avoidance of paying mandatory taxes to the government
(CATA Annual Conference, 2005). Tax evasion takes three forms, namely, non-
declaration of income, under-declaration of income and inflation of deductions
from income (Aryee, 2007).
In 2008, a US senate subcommittee issued a report highlighting that banks located
in tax havens cost US taxpayers some USD 100 billion a year in lost revenue. This
leakage occurred despite solid US laws, institutions and other mechanisms to help
control tax evasion. If such capital flight is occurring with regulatory frameworks
commonly perceived as sound, one can imagine how many more opportunities
exist for evasive practices in countries with weak regulatory and legal
environments.
Developing countries lose vital revenue through tax evasion and the siphoning of
money to tax havens. According to the World Bank, illicit flows of cash from
developing countries amount to between USD 500 - 800 billion a year. These are
funds that could otherwise have been used to fund development priorities.
Countering the loss of revenue caused by tax havens is a vital element of the
G20‘s and G8‘s global responses to the current economic crisis. Hundreds of
billions of dollars per year have left the African continent between 1991 and 2004.
These outflows are estimated at 7.6% of the annual GDP of the region and, in
effect, make African countries net creditors of donor countries. They also
undermine African countries‘ tax bases (Pretoria Communiqué).
Tax avoidance, on the other hand, is used to describe tax reductions achieved
through artificial but permissible arrangements of personal or business affairs. It
refers to the legitimate use of loopholes in the tax laws in order to minimize one‘s
tax burden. In short, tax avoidance is the legal planning to minimize one‘s tax
liability (CATA Annual Conference, 2005). Therefore, there is nothing illegal
about it and it is every person‘s right. Both tax evasion and avoidance result in loss
of national revenue and are therefore undesirable to tax administration.
2.7 DEFINITION OF INFORMAL SECTOR
Researchers who are concerned with the informal sector or economy face
difficulties in defining it. This is reflected in the variety of names used to identify
it – the shadow, hidden, black, underground, gray, clandestine, illegal, unreported,
non-cash and parallel economy (Feige, 1990; Thomas, 1992). Several definitions
have emerged some of which are as follows:
(a) All currently unregistered economic activities that contribute to the officially
calculated (or observed) Gross National Product (Feige, 1989).
(b) Market – based production of goods and services, whether legal or illegal,
which escapes detection in the official estimates of Gross Domestic Product
(Smith, 1994).
(c) Those economic activities and the income derived from them that circumvent
or otherwise escape government regulation, taxation or observation
(Schneider, 2005). It is important to note that the informal sector as
understood here does not include illegitimate activities such as smuggling,
drug dealing or armed robbery; those illegal activities may provide an
income to those who engage in them, but add little value to the society and
the economy (Fambon, 2006).
The informal sector acquired a proper definition based on production units, both in
conceptual and statistical terms only in January, 1993 during the 15th
International
Conference of Labour Statisticians (ICLS). According to the 15th
ICLS informal
sector may be broadly characterized as consisting of units engaged in the
production of goods or services with the primary objective of generating
employment and incomes to the persons concerned. These units typically operate
at a low level of organization, with little or no division between labour and capital
as factors of production and on a small scale. Labour relations-where they exist-
are based mostly on casual employment, kinship or personal and social relations
rather than contractual arrangements with formal guarantees (ICLS, 1993). For
this study, the researcher adopted Feige‘s definition as the working definition.
2.8 CHARACTERISTICS OF THE INFORMAL SECTOR
According to Amin (1989) the informal sector has basically four distinguishing
characteristics which have been grouped as follows:-
Enterprise
Characteristics of the activities in the informal sector (Enterprise)
Unregulated and competitive markets
Small scale operation with individual or family ownership
Ease of entry
Reliance on locally available resources
Family ownership of enterprise
Labour intensive and adapted technology
Absence of access to institutional credits and other similar supports.
Employment
Characteristics of the people engaged in the informal sector (Employment)
Absence of official protection and recognition
Non coverage by minimum wage legislation and social security system
Predominance of own-account and self-employment work
Absence of trade union organization
Low income and wages
Little job security
No fringe benefits from institutional sources.
Credit
Characteristics of the informal sector credit market (Credit)
Unregulated and non-stabilized
Easy accessibility
Loan availability in very small size and for short terms (periods)
Low administrative and procedural costs
Little or no collateral requirements
Flexible interest rates (from very high to no interest at all)
Highly flexible transactions and repayments tailored to individual needs
Habitat
Characteristics of the informal sector land and housing (Habitat)
Unauthorized use of vacant public or private land
Illegal subdivision and/or rental of land
Unauthorized construction of structures and buildings
Reliance on low cost and locally available scrap construction materials
Absence of restrictive standards and regulations
Reliance on family labour and artisanal techniques for construction
Non-availability of mortgage or any other subsidized finance
The characteristics mentioned above are explained as follows:-
2.8.1 CHARACTERISTICS OF ACTIVITIES IN THE INFORMAL
SECTOR (ENTERPRISE)
The economic activities taking place in the informal sector exhibit certain unique
features. These include:-
2.8.1.1 Small scale operation with individual or family ownership.
The typical informal sector enterprise is individually owned and operated,
generally for less than five years duration (Yankson, 1992). Family ownership
dominates the ownership of the informal sector businesses because family
provides cheap source of labour. Lack of trust on the part of individual does not
promote the formation of partnerships and joint ventures. Most often than not, the
size of such enterprises are determined by the capital invested and the number of
employees. The average number of employees may be four even though this
number may vary with the nature of operation- from sole proprietorship to
partnerships and family ventures and cooperatives.
2.8.1.2 Ease of entry
Setting a business in the informal sector is very easy since the capital requirement,
technology and regulatory requirements are very low and so any body at a point in
time can set up business in the informal sector. Capital intensity in this sector is
low- most of the entrepreneurs use labour intensive technology – with the targets
units having the most fixed capital per employee (ibid, 1992).
2.8.1.3 Reliance on locally available resources
The informal sector businesses lack the capacity to do off- shore acquisition of
resources be it material, financial or human since normally such business are small
in size. Hence the informal sector businesses tend to rely more on local resources.
These resources are acquired from various sources, some times new, second –
hand and or self constructed but rarely imported (Barwa, 1995).
2.8.1.4 Labour intensive and adopted technology
Yankson (1992) postulated that the operators of informal sector businesses mostly
lack adequate financial resources to import more advanced technology so the sector
heavily relies on labour for its production. The equipments used by the informal
sector entrepreneurs are mostly bought locally with subsequent improvements
made on those equipments. The level of technology employed in the informal
sector in Ghana was low and in poor condition.
2.8.1.5 Unregulated and competitive market
Not even the combine effort of the government and individuals is able to regulate
the activities of the informal sector properly. The cost of regulating the informal
sector will far exceed the benefits and in fact such an attempt will be a ―wild-
goose chase‖. More so, the market works on the premise of ―survival of the
fittest‖, due to the presence of many operators in the sector, the informal sectors‘
business environment is highly competitive as competitors make all attempts to
outdo one another for customers (Farrell et al., 2000).
2.8.2 CHARACTERISTICS OF PEOPLE ENGAGED IN THE INFORMAL
SECTOR (EMPLOYMENT)
Persons operating in the informal sector do exhibit certain characteristics which
either militate against their progress or favour them. These characteristics are
explained below.
2.8.2.1 Little or no job security
Employees in the informal sector can lose their jobs at any time at the will of their
employers. Employees cannot take any actions for such unfair dismissals as
usually there are no binding contracts. No compensation is usually paid for such
dismissals (ibid, 2000).
2.8.2.2 Absence of trade union organizations
The informal sector operators have wide range of activities which makes it
extremely difficult for the formation of trade union which is necessary for
protecting the interest of individual members. Again, most of informal sector
operators presume the formalization of activities of their operators may expose
them and eventually attract tax payment hence prefer to operate individually
instead of coming together under one umbrella in the name of trade union.
2.8.2.3 Absence of official protection and recognition
The informal sector operators do not enjoy protection from state machinery in the
form of legislations against unscrupulous fraudsters who may defraud such
entrepreneurs in the course of business dealings. Because the operators in the
informal sector do not want to be identified for fear of being taxed avoid being
recognized and hence do not enjoy the protection that may be available to them
from the state (ibid, 2000).
2.8.2.4 Low income and wages
Entrepreneurs get low return on their investment as a result of keen competition in
the sector. The people employed in the informal sector are generally paid low
wages due to the existence of excess labour supply and lack of skills that may
attract high wages (ibid, 2000).
2.8.2.5 Non coverage by minimum wages legislation and social security
Most employees in the informal sector are often paid below the national minimum
wages. The employers also fail to contribute to the social security and pension
scheme on behalf of the employees. These employees fail to report their
employers for fear of being sacked or out of total ignorance of the law. And as
such, these employers escape appropriate sanctions as their illegal activities are
hidden from the law enforcement agencies
(ibid, 2000).
2.8.2.6 Predominance of self – employment work
Most operators in the informal sector are mostly self employed who either work
alone or with the assistance of family members. According to Farrell et al., (2000),
there is no gainsaying the fact that operators in the informal sector are self
employed operating from their homes most often, with others using any available
public space. With a table and a chair one can easily start up own business with
family assistance.
2.8.3 CHARACTERISTICS OF THE INFORMAL SECTOR LAND AND
HOUSING (HABITAT)
These characteristics have to do with the use of land and housing by the informal
sector. These characteristics are considered below.
2.8.3.1 Unauthorized use of vacant public or private land
Informal sector operators usually function from clusters closer to cities, especially
those engaged in auto repairs and metal works. Barwa (1995) reiterated that in
developing countries kiosks and small containers owned by the informal sector
operators litter every conceivable nook and cranny in the cities and towns.
2.8.3.2 Unauthorized construction of structures and building
Informal sector operators tend to put up either kiosk or permanent structures on
any piece of land at their disposal either personally owned or rented. Informal
sector operators tend to put up houses on the land from where they operate their
businesses. They have no legal title to the land on which they construct such
structures. This in some cases has resulted in environmental disaster such as
‗Sodom and Gomorrah‘ in Accra (ibid).
2.8.4 CHARACTERISTICS OF THE INFORMAL SECTOR CREDIT
MARKETS (CREDIT)
2.8.4.1 Easy accessibility
Credit is an inevitable practice for success in the informal sector. Some if not
most of the informal sector operators thrive on giving credit to their clients.
Usually, informal sector goods are patronized by the low income earners group
and credit is an inevitable practice (ibid).
2.8.4.2 Little or no collateral requirement
Mostly it is the low income earners that patronize products in the informal sector
hence such individuals lack collateral. Also because credit granted is very small,
no collateral is demanded (ibid).
2.8.4.3 Low administrative and procedural cost
Comparatively in the informal sector credit is usually granted to people known to
the operators hence no need to assess the individuals being granted credit. This
makes administrative or procedural cost of credit low (ibid).
2.9 FACTORS THAT MOTIVATE TAX COMPLIANCE
In the standard economic model of taxpayer behaviour, the perceived quality of
government does not influence the level of taxes that are paid. The basic
behavioural assumption is that people are free riders: no one will voluntarily
contribute to the government unless the threat of punishment makes it sensible
(Allingham and Sandmo, 1972). But research has shown that the rate of
contribution to a public good is affected by factors such as citizen‘s trust in others
and perceptions of the trustworthiness of the government (Slemrod, 2003).
According to Scholz (1998) without trust there is little basis for social co-
operation and voluntary compliance with laws and regulations that could
potentially benefit everyone. Thus, without trust coercion provides a reasonable
guide for governance. Levi (1998) pointed out that citizens are likely to trust the
government only to the extent that they believe that it will act in their interests,
that its procedures are fair and reasonable, and that their trust of the state and
others is reciprocated. She stresses that government trustworthiness coupled with
the perception that others are doing their share, can induce people to become
‗contingent consenters‘ who co-operate even when their short – term interest
would make free – riding the individual‘s best option. Accordingly, citizens‘
willingness to pay taxes voluntarily rests on the government‘s capacity to provide
services and its demonstrated readiness to secure the compliance of the otherwise
non-compliant. From the above analysis it could be seen that the relationship
between a taxpayer and the government so far as tax compliance is concerned
involves at least three elements namely:
(a) Fiscal exchange
(b) Coercion
(c) Social Influences
2.9.1 FISCAL EXCHANGE
Compliance can be motivated by the presence of government expenditures.
Individuals may pay taxes because they value the goods provided by the
government, recognizing that their payments are necessary both to help finance the
goods and services and to make others contribute (Alm et al., 1992; Andreoni et
al., 1998; Cowell and Gordon, 1988). Hence, a taxpayer may be seen as
exchanging purchasing power in the market in return for government services
(Levi, 1988). Positive benefits may increase the probability that taxpayers will
comply voluntarily without coercion. Without material benefits, willingness to
pay becomes less assured. Although most taxpayers can not assess the exact value
of what they receive from government in return for taxes paid, they have general
impressions and attitudes concerning their own and others‘ terms of trade with the
government (Richupan, 1987). Taxpayers‘ behaviour is therefore affected by their
satisfaction or lack of satisfaction with the terms of trade. If the system is
perceived as unjust, tax evasion may be considered as an attempt to adjust the
terms of trade with government (Fjeldstad and Semboja, 2001). According to
Wintrobe (2001) as long as individuals (and firms) do not believe the government
is responsive to their wishes, even if it may be honest, they will attempt to evade
their taxes.
2.9.2 COERCION
According to the classical criminology theorists, crime is an expression of a
person‘s rational decision making process: before committing a crime, a person
would weigh the benefits of the crime against the cost of being apprehended.
Therefore, if punishments were stringent enough to outweigh the benefits of
crime, they would dissuade people from committing the crime in the first place
(Gaines and Miller, 2008).
In the same way, the classical tax evasion model assumes that the taxpayer‘s
behaviour is influenced by factors such as the tax rate that determines the benefits
of evasion and the probability of detection and penalties for fraud that determine
the costs (Allingham and Sandmo, 1972). This implies that, tax evasion like all
other crimes, if detection is likely and penalties are severe few people will evade
taxes. Therefore to ensure that people pay their taxes voluntarily there should be
effective coercion. According to Friedman (2003) we obey the rules when the
government does its job and ensure that the systems are in place to force us to
comply.
2.9.3 SOCIAL INFLUENCES
Sociologists and social psychologists have long stressed the importance of social
interaction in forming tastes and actions (Hessing et al., 1998). It is reasonable to
assume that human behaviour in the area of taxation is influenced by social
interactions much in the same way as other forms of behaviour (Snavely, 1990).
Compliance behaviour and attitudes towards the tax system may therefore be
affected by the behaviour of an individual‘s reference group such as relatives,
neighbours, and friends and political associations. Social norms can affect
compliance because individuals tend to seek the respect of others (Mc Adams,
1997). One of the most consistent findings in survey research in Western
countries about taxpayer attitudes and behaviour is that those who report
compliance believe that their peers and friends (and taxpayers in general) comply,
whereas those who report cheating believe that others cheat (Yankelovich et al.,
1984).
Also, enforcement and the behaviour of others affect taxpayer compliance.
Charles Rossotti, a former US Commissioner of IRS, once stated that the slide in
audits has raised concern that honesty could suffer as fears of policing declines. If
taxpayers begin to believe that others are cheating, the temptations to shave their
own tax burdens may become irresistible (Weisman, 2001). Rossotti‘s comment
recognizes that tax enforcement affects social behaviours and that these
behaviours can in turn affect taxpayers‘ compliance decisions. Prior research has
shown that individuals who know evading taxpayers are less likely to comply
themselves (Vogel 1974, Spicer and Lundstedt, 1976; Grasmick and Scott, 1982;
Scott and Grasmick, 1981). Likewise, the probability that a taxpayer will evade
increases when the taxpayer suspects that his acquaintances are evading (Westat,
Inc., 1980; Geeroms and Wilmots, 1985). It is against this background that
Terkper (2003) pointed out that if informal sector activities are ignored it would
lower compliance morale and increase the risk of generalized non-compliance.
Contrary, social relationships may also help to deter non-payment. Individuals
can be dissuaded from engaging in evasion out of fear of the social sanctions
incurred should their action be discovered and revealed publicly (Grasmick and
Green, 1980; Grasmick and Scott, 1982). More so, evidence from behavioural
science suggests that the greater the individual participation in decision making
process the greater the level of compliance (Lewis et al., 1995; Hessing et al.,
1992). This is partly so because participation implies some commitment to the
institution and such commitment in turn requires behaviour that is consistent in
words and actions. Thus, it is expected that compliance level will be higher when
taxpayers feel that they have a voice in the way their taxes will be spent.
Moreover, government trustworthiness tends to legitimize the public sector and
therefore impose some social norm to pay taxes. When government is perceived
to be trustworthy, citizens are more likely to comply with its demands in general.
As long as individuals (and firms) do not trust the government they will be
unwilling to pay their taxes (Wintrobe, 2001). Government trust worthiness is
linked to citizen‘s perceptions of the capacity of the government to make credible
commitments about the use of their taxes. In the study on citizens views on
taxation in local authorities in Tanzania most respondents said that they would be
willing to pay more taxes if public services were improved (Fjeldstad, 2004).
Further, Wintrobe (2001) claims that if individuals (and firms) believe that the tax
code is fair and is applied fairly, they will be more willing to pay their taxes.
Based on the literature review, one can conclude that indeed fiscal exchange,
coercion and social influences motivate people to pay taxes in general and this
research is an attempt to establish that the same is true with taxation of the
informal sector in Bolgatanga Municipality.
2.10 CHALLENGES IN TAXING THE INFORMAL SECTOR
There has been a growing interest in taxing the informal sector in most developing
countries for a number of reasons which include revenue needs; the phenomenal
size and growth of informal sector; the impact of tax compliance in the formal
sector; state legitimacy; demands from the informal sector and tax-accountability
(Aryee, 2007).
As a measure to expand the tax base to the informal sector, the Government of
Ghana has introduced several taxes to specifically target the informal sector
operators. These include the vehicle Income Tax (VIT) on public transport
operators, the Tax Stamp for collecting income tax from small traders and Flat
Rate Scheme for expanding the reach of the VAT (Prichard, 2009). This has
brought some improvement in the revenue yield but the overall collection from the
informal sector has remained small relative to other taxes such as PAYE and
Corporate tax. In 2007, out of the total collection of GH¢910.2m by the IRS, self-
employed contributed GH¢45.6m as compared to GH¢372.2m and GH¢418.7m
from PAYE and Corporate tax respectively (Revenews, 2008). The self-employed
made a record growth in revenue of about 45% against average of 20% over the
past four years. This great performance was attributed to effective monitoring of
withholding tax which contributed about 35% of the revenue (Revenews, 2009).
This means that the direct payments by the taxpayers themselves were nothing to
write home about.
Like any developing country, taxing the informal sector in Ghana is a herculean
task. This was acknowledged by the 2007 Budget Statement of Ghana when the
Minister of Finance and Economic Planning stated that ―… one of the major
challenges facing Ghana is how to broaden the tax net… the fact that the vast
majority of Ghanaians are in the informal private sector makes revenue generation
a daunting task‖ (Budget of Ghana, 2007). To enhance revenue collection and
bring a fairer distribution of the tax burden which is currently borne by those
employed in the formal sector, the Budget proposes that during 2007 ―the
government will develop and implement a system to assess and collect income tax
using the value of vehicles registered…because a significant percentage of vehicle
registrations are from informal sector operators most of whom are not taxpayers‖
(Budget of Ghana, 2007).
Basically, there are three major reasons why taxation of the informal sector has
been almost universally unsuccessful. The first is capacity constraints. Informal
sector operators are actively seeking to avoid taxation and even at the best of times
have limited capacity to keep high quality financial records for tax purposes
(Prichard, 2009).
Meanwhile tax administrations of many developing country governments do not
have the resources or the personnel capacity to implement, monitor, and enforce
tax laws (Stella, 1993; Kiser and Baver, 1994 cited by Joshi and Ayee, 2009).
According to Joshi and Ayee, the characteristic of the informal sector exacerbates
these problems. The informal economy is characterized by transience and
uncertainty. Cash transactions dominate. There is indifference to formal
accounting due to high levels of illiteracy and a shortage of affordable
accountancy services. In some areas of the informal economy such as
transportation or street vending the mobility of the operators makes it difficult to
enforce compliance. The large number of people engaged in the sector and the
relatively small amounts of tax payable pose an additional logistical problem for
collection. Thus, taxation based on formal systems of income calculation,
accounts, and payment options are not suited to the informal sector.
The second challenge relates to notions of equity. The vast majority of informal
sector operators have very low incomes, and this creates a strong argument for
near total exemption from taxation. On the other hand, many informal sector
operators have very substantial income and should rightly be asked to pay
significant income taxes. In the absence of effective record keeping, the need for
equity in the treatment of the low- income group almost certainly makes it more
difficult to target those with higher incomes (Prichard, 2009).
The final challenge is political. Several observers have suggested that taxing the
informal sector is politically problematic because the informal sector forms a
substantial vote bank for politicians (Cross, 1998 cited by Joshi and Ayee, 2009).
State officials and politicians turn a blind eye to activities in the informal sector in
order to retain their support base; simultaneously, organised informal sector
workers to pressurize government officials to reduce enforcement (Joshi and
Ayee, 2009). In fact, there are often implicit contracts made by politicians that
allow tax burdens to be low on informal activities in exchange for political support
(Tendler, 2002). This is what Tendler has termed the ―devil‘s deal‖.
―If you vote for me,…I won‘t collect taxes from you; I won‘t make you comply
with other tax, environmental or labour regulations; and I will keep the police and
inspectors from harassing you‖ (Tendler, 2002). This goes a long way to explain
the reasons why the smaller formal sector operators are often over burden with
taxes.
CHAPTER THREE
METHODOLOGY
3.1 INTRODUCTION
Basically this chapter deals with the research design, the population, sample and
sampling techniques, data collection procedure, the procedure for analyzing the
data collected and limitations to the data collection .
3.2 RESEARCH DESIGN
The research design includes an outline of what the researcher is writing on
including the hypotheses and their operational implications to the final analyses of
the data. This research adopted the case study strategy approach. Among the
various research designs, case studies are frequently regarded as using both
quantitative and qualitative research and a combination of both approaches
(Bryman, 2004). The researcher used both primary and secondary data sources,
which were considered to be more appropriate for this study.
3.3 THE POPULATION
The target population of this study was the informal sector as well as the staff of
IRS in the tax district of Bolgatanga Municipality. The informal sector operators
included hairdressers and beauticians, dressmakers and fashion designers, artisans,
food vendors, butchers, contractors and general traders. The total number of
businesses in the informal sector registered with the Registrar Generals‘
Department and had one time or the other filed tax returns in the tax district of
Bolgatanga Municipality and the staff strength of IRS at the time of the research,
that is, 2010, were six hundred and sixty-nine (669) and twenty seven (27)
respectively. Since it was highly impossible to use the whole population, a sample
of the above population was used for this study.
3.4 SAMPLE AND SAMPLING TECHNIQUES
Since the taxpayers were scattered all over the tax district and could not be
covered in the study, sampling techniques were mainly used to determine the
sample size. According to Punch (1998), one cannot study everyone, everywhere,
doing everything and so sampling decisions are required not only about which
people to interview or which events to observe, but also about settings and
processes.
In view of this, randomly selected taxpayers within the Bolgatanga Municipal tax
district were used for the study.
A sample size of seventy five (75) respondents was selected for the study. The
respondents consisted of seventy (70) taxpayers and five (5) tax officials. The
stratified and simple random sampling techniques were used to select the
respondents from the informal sector due to the heterogeneous nature of the
informal sector.
In the case of the respondents from IRS, purposive sampling technique was used.
All the five (5) tax officials were purposively selected from the operations
department since they deal directly with taxpayers so far as assessment and
collection of taxes are concerned.
The five (5) respondents were made up of three (3) senior and two (2) junior staff
members.
A number of both published and unpublished materials on taxpayers and taxation
in general from journals and articles as much as possible were used.
3.5 DATA SOURCES
The study made an extensive use of both primary and secondary sources of
information from the IRS and the selected taxpayers. The primary sources of data
include information that was gathered from the questionnaires that were
administered to the respondents. The advantage of using primary data is that, they
are more reliable since they come from the original sources and are collected
especially for the purpose of the study. The secondary sources of data included
annual reports, brochures and manuals.
3.6 DATA COLLECTION PROCEDURE AND TECHNIQUES
The study was largely based on primary data.Valuable information was collected
through questionnaire and direct interview. The questionnaire was structured with
open and closed- ended questions.
Most of the questions in the questionnaire were closed–ended questions. The
closed ended questions enabled the researcher to obtain the exact information
being sought for while the few open – ended questions were used to elicit
information on opinions, attitudes and beliefs of the respondents towards taxation
in the informal sector. Those who could neither read nor write were assisted to
complete the questionnaire.Other information was brought up by the respondents
themselves and the researcher took note of them.
3.7 DATA ANALYSIS
The raw data obtained from a study is useless unless it is transformed into
information for the purpose of decision making (Emory and Cooper, 1991). The
data analysis involves reducing the raw data into a manageable size, developing
summaries and applying statistical inferences. Consequently, the following steps
were taken to analyze the data for the study. The data was edited to detect and
correct, possible errors and omissions that were likely to occur, to ensure
consistency across respondents.
The data was then coded to enable the responses to be grouped into limited
number of categories. The Microsoft Excel software was used for this analysis.
The data was presented in tabular, graphical and narrative forms. In analyzing the
data, descriptive statistical tools such as bar graph, pie charts complemented with
mean and mode were used.
3.8 LIMITATIONS TO DATA COLLECTION
The major limitation of the study was that, due to ignorance and fear of being
taxed the respondents were not co-operative initially. However, they were made to
understand that the study was just meant for academic purpose and not to collect
information for the government for the purpose of increasing their taxes.
Besides, some of the respondents considered the exercise as a waste of time and
for that matter were not prepared to spend a few minutes of their precious time to
answer the questions. The research was also limited by financial constraints taking
cognizance of the extent of the scope of the study and period of investigation.
Another area of limitation to this study came from the inability of respondents to
complete and submit questionnaire on time for data to be analyzed. More so, it
must be accepted that the outcome of the study may not be generalized to all self-
employed businesses in the country since the outcome of the study might have
been influenced by the norms and traditions of the people, economic conditions
among others of Bolgatanga Municipality.
CHAPTER FOUR
DATA PRESENTATION, DISCUSSION AND ANALYSIS
4.1 INTRODUCTION
The chapter presents the data gathered from the field. The data were represented by
graphs, charts and tables. Data were also presented in relation to the literature review and
compared to the data collected from the field.
4.2 DEMOGRAPHIC CHARACTERISTICS OF RESPONDENTS
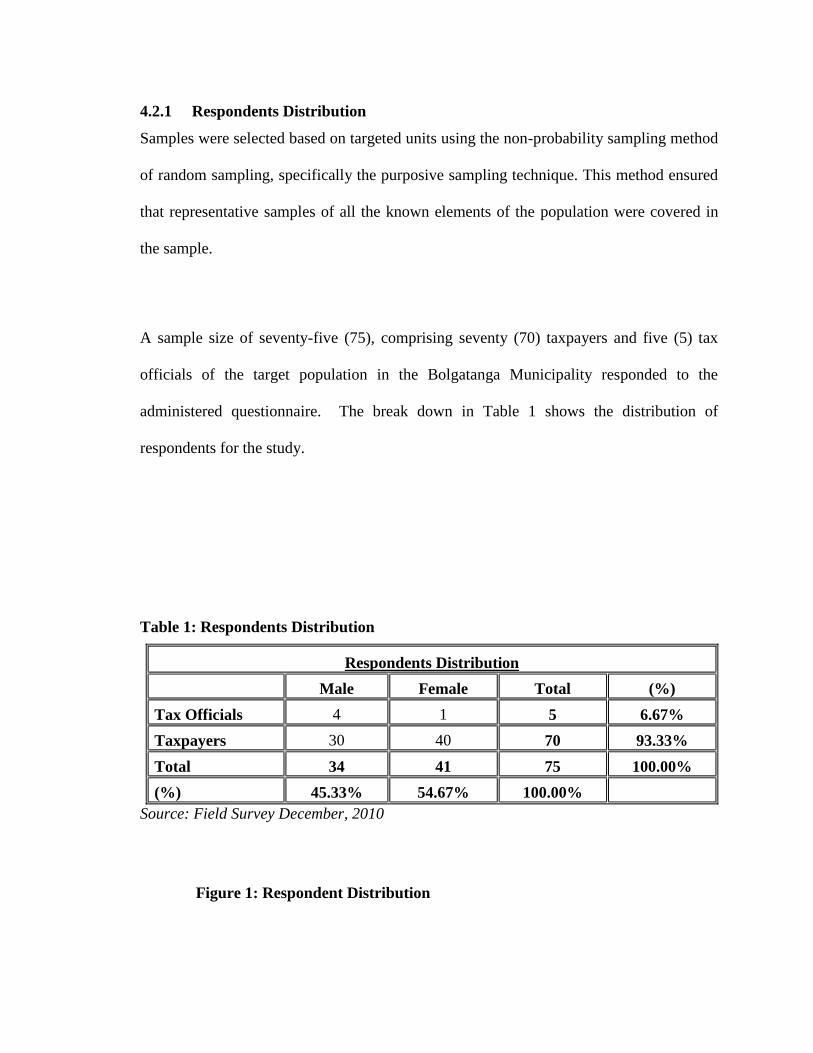
4.2.1 Respondents Distribution
Samples were selected based on targeted units using the non-probability sampling method
of random sampling, specifically the purposive sampling technique. This method ensured
that representative samples of all the known elements of the population were covered in
the sample.
A sample size of seventy-five (75), comprising seventy (70) taxpayers and five (5) tax
officials of the target population in the Bolgatanga Municipality responded to the
administered questionnaire. The break down in Table 1 shows the distribution of
respondents for the study.
Table 1: Respondents Distribution
Respondents Distribution
Male Female Total (%)
Tax Officials 4 1 5 6.67%
Taxpayers 30 40 70 93.33%
Total 34 41 75 100.00%
(%) 45.33% 54.67% 100.00%
Source: Field Survey December, 2010
Figure 1: Respondent Distribution
Source: Field Survey December, 2010
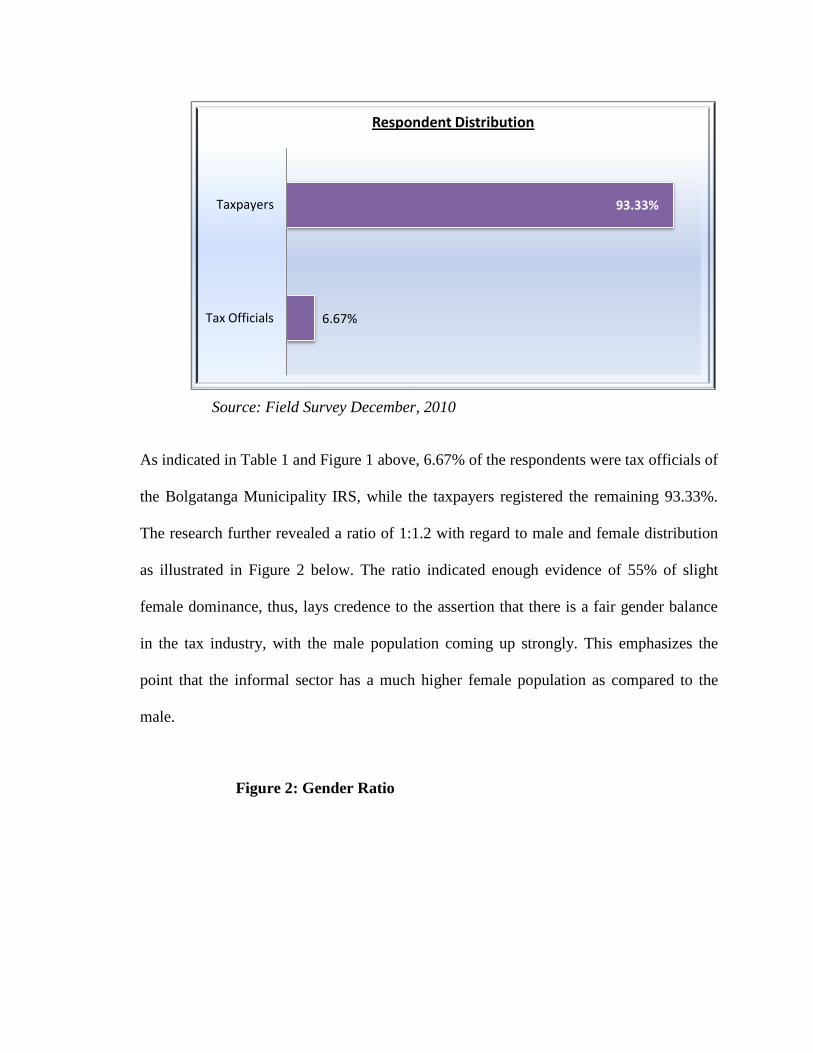
As indicated in Table 1 and Figure 1 above, 6.67% of the respondents were tax officials of
the Bolgatanga Municipality IRS, while the taxpayers registered the remaining 93.33%.
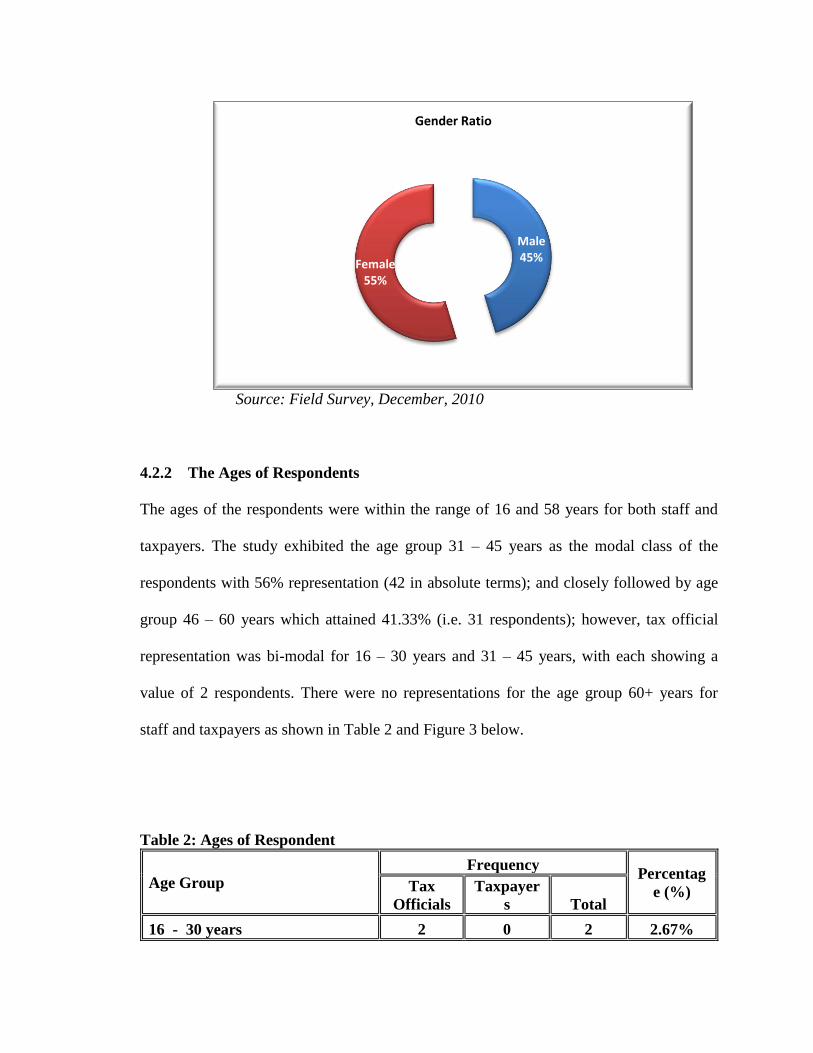
The research further revealed a ratio of 1:1.2 with regard to male and female distribution
as illustrated in Figure 2 below. The ratio indicated enough evidence of 55% of slight
female dominance, thus, lays credence to the assertion that there is a fair gender balance
in the tax industry, with the male population coming up strongly. This emphasizes the
point that the informal sector has a much higher female population as compared to the
male.
Figure 2: Gender Ratio
6.67%
93.33%
Tax Officials
Taxpayers
Respondent Distribution
Source: Field Survey, December, 2010
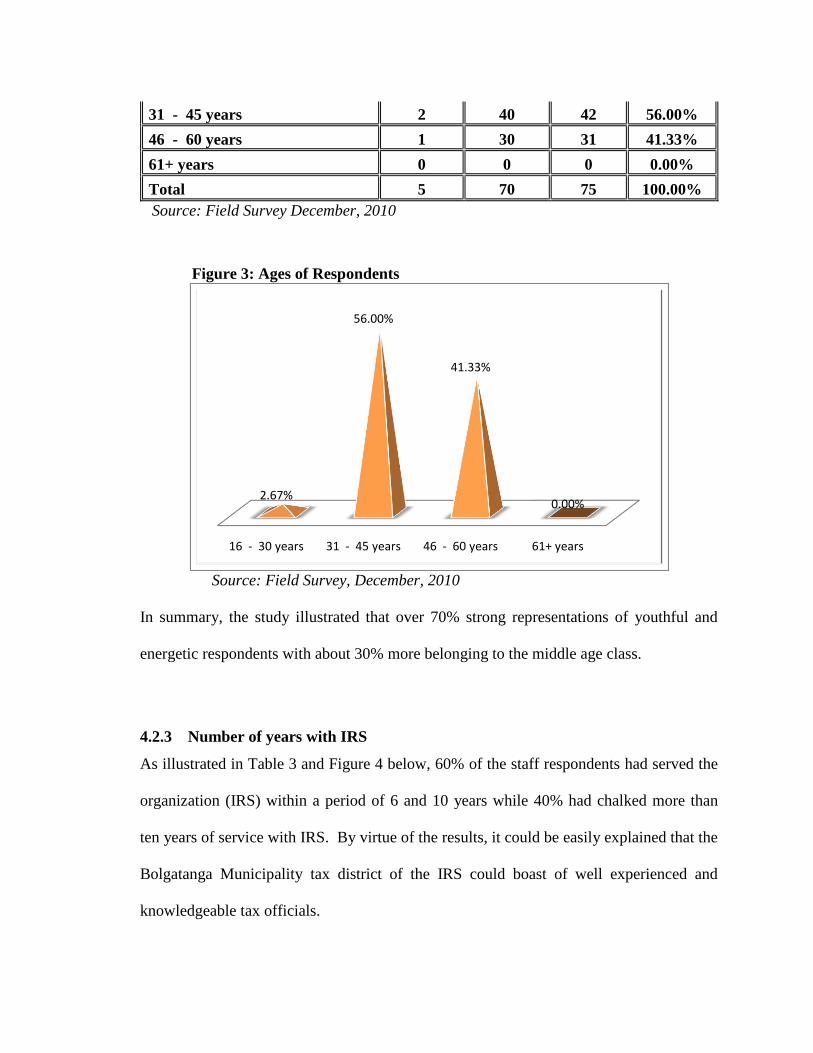
4.2.2 The Ages of Respondents
The ages of the respondents were within the range of 16 and 58 years for both staff and
taxpayers. The study exhibited the age group 31 – 45 years as the modal class of the
respondents with 56% representation (42 in absolute terms); and closely followed by age
group 46 – 60 years which attained 41.33% (i.e. 31 respondents); however, tax official
representation was bi-modal for 16 – 30 years and 31 – 45 years, with each showing a
value of 2 respondents. There were no representations for the age group 60+ years for
staff and taxpayers as shown in Table 2 and Figure 3 below.
Table 2: Ages of Respondent
Age Group
Frequency Percentag
e (%) Tax
Officials
Taxpayer
s Total
16 - 30 years 2 0 2 2.67%
Male45%
Female55%
Gender Ratio
31 - 45 years 2 40 42 56.00%
46 - 60 years 1 30 31 41.33%
61+ years 0 0 0 0.00%
Total 5 70 75 100.00%
Source: Field Survey December, 2010
Figure 3: Ages of Respondents
Source: Field Survey, December, 2010
In summary, the study illustrated that over 70% strong representations of youthful and
energetic respondents with about 30% more belonging to the middle age class.
4.2.3 Number of years with IRS
As illustrated in Table 3 and Figure 4 below, 60% of the staff respondents had served the
organization (IRS) within a period of 6 and 10 years while 40% had chalked more than
ten years of service with IRS. By virtue of the results, it could be easily explained that the
Bolgatanga Municipality tax district of the IRS could boast of well experienced and
knowledgeable tax officials.
16 - 30 years 31 - 45 years 46 - 60 years 61+ years
2.67%
56.00%
41.33%
0.00%
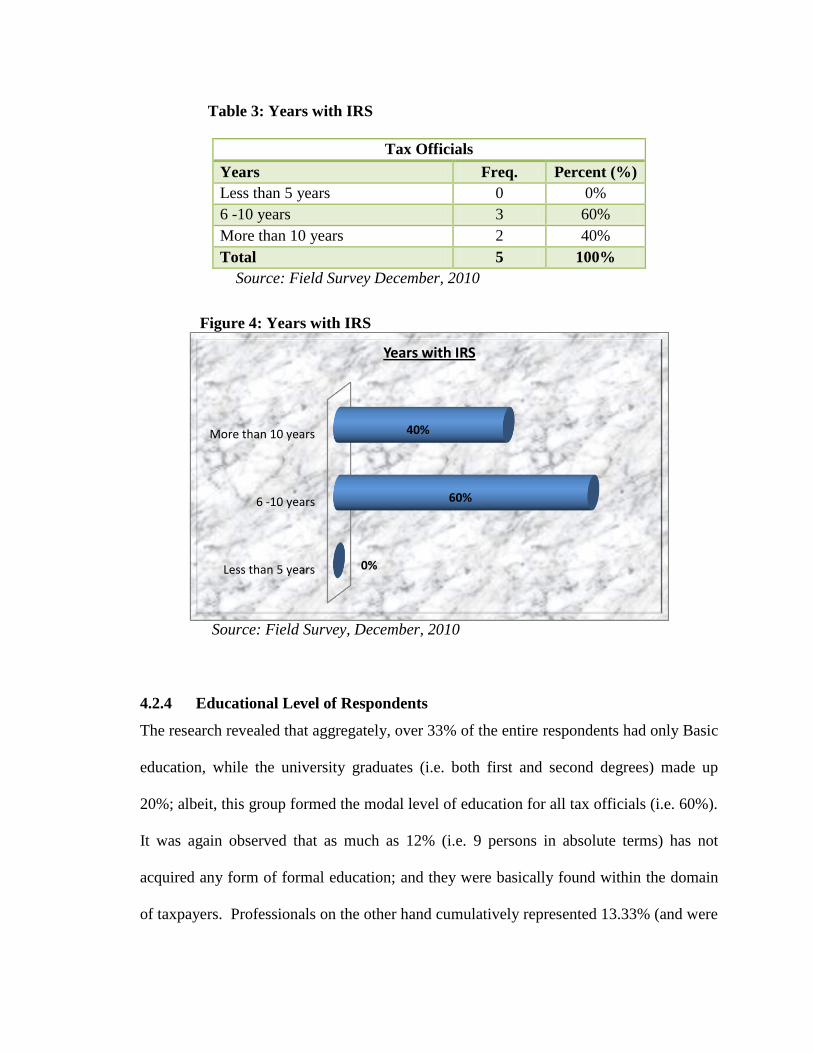
Table 3: Years with IRS
Tax Officials
Years Freq. Percent (%)
Less than 5 years 0 0%
6 -10 years 3 60%
More than 10 years 2 40%
Total 5 100%
Source: Field Survey December, 2010
Figure 4: Years with IRS
Source: Field Survey, December, 2010
4.2.4 Educational Level of Respondents
The research revealed that aggregately, over 33% of the entire respondents had only Basic
education, while the university graduates (i.e. both first and second degrees) made up
20%; albeit, this group formed the modal level of education for all tax officials (i.e. 60%).
It was again observed that as much as 12% (i.e. 9 persons in absolute terms) has not
acquired any form of formal education; and they were basically found within the domain
of taxpayers. Professionals on the other hand cumulatively represented 13.33% (and were
Less than 5 years
6 -10 years
More than 10 years
0%
60%
40%
Years with IRS
only found in taxpayers‘ domain).
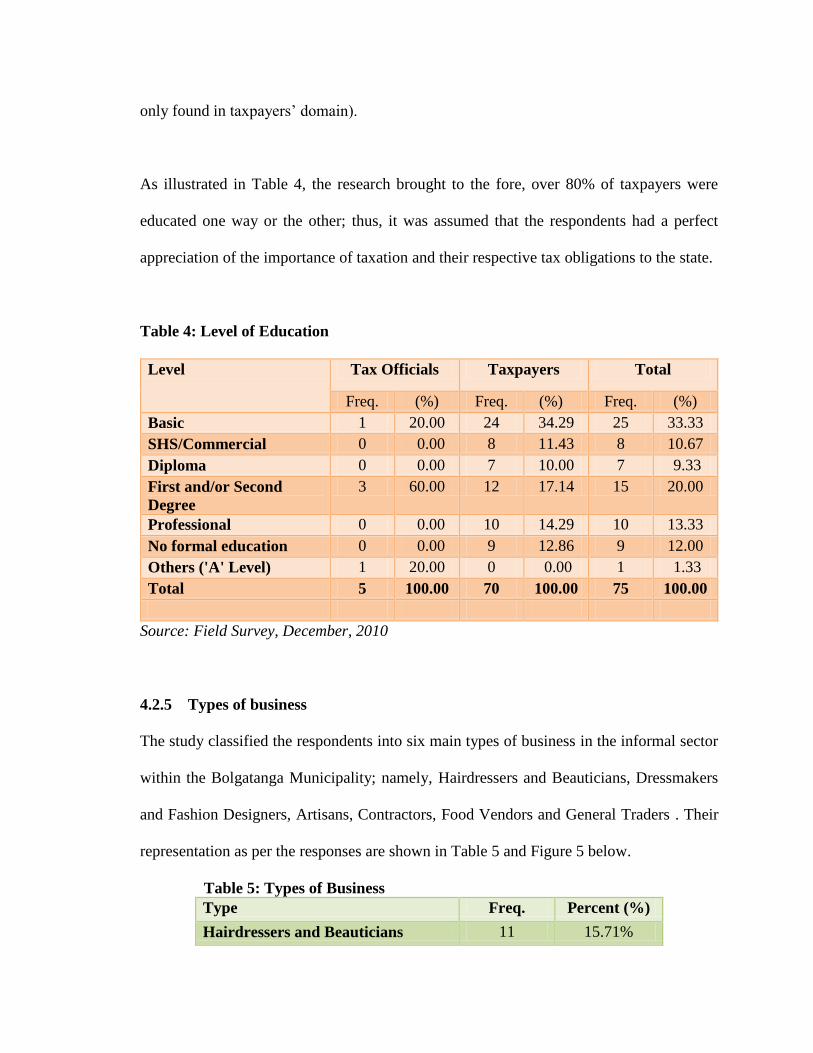
As illustrated in Table 4, the research brought to the fore, over 80% of taxpayers were
educated one way or the other; thus, it was assumed that the respondents had a perfect
appreciation of the importance of taxation and their respective tax obligations to the state.
Table 4: Level of Education
Level Tax Officials Taxpayers Total
Freq. (%) Freq. (%) Freq. (%)
Basic 1 20.00 24 34.29 25 33.33
SHS/Commercial 0 0.00 8 11.43 8 10.67
Diploma 0 0.00 7 10.00 7 9.33
First and/or Second
Degree
3 60.00 12 17.14 15 20.00
Professional 0 0.00 10 14.29 10 13.33
No formal education 0 0.00 9 12.86 9 12.00
Others ('A' Level) 1 20.00 0 0.00 1 1.33
Total 5 100.00 70 100.00 75 100.00
Source: Field Survey, December, 2010
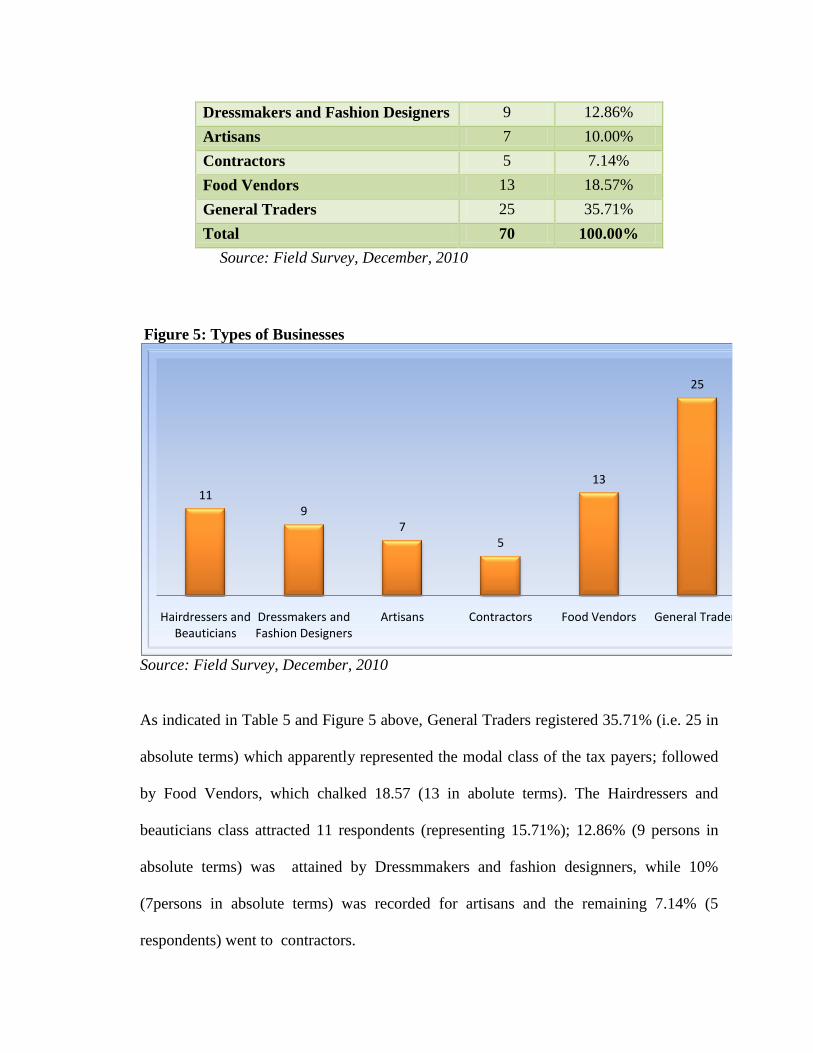
4.2.5 Types of business
The study classified the respondents into six main types of business in the informal sector
within the Bolgatanga Municipality; namely, Hairdressers and Beauticians, Dressmakers
and Fashion Designers, Artisans, Contractors, Food Vendors and General Traders . Their
representation as per the responses are shown in Table 5 and Figure 5 below.
Table 5: Types of Business
Type Freq. Percent (%)
Hairdressers and Beauticians 11 15.71%
Dressmakers and Fashion Designers 9 12.86%
Artisans 7 10.00%
Contractors 5 7.14%
Food Vendors 13 18.57%
General Traders 25 35.71%
Total 70 100.00%
Source: Field Survey, December, 2010
Figure 5: Types of Businesses
Source: Field Survey, December, 2010
As indicated in Table 5 and Figure 5 above, General Traders registered 35.71% (i.e. 25 in
absolute terms) which apparently represented the modal class of the tax payers; followed
by Food Vendors, which chalked 18.57 (13 in abolute terms). The Hairdressers and
beauticians class attracted 11 respondents (representing 15.71%); 12.86% (9 persons in
absolute terms) was attained by Dressmmakers and fashion designners, while 10%
(7persons in absolute terms) was recorded for artisans and the remaining 7.14% (5
respondents) went to contractors.
119
75
13
25
Hairdressers and Beauticians
Dressmakers and Fashion Designers
Artisans Contractors Food Vendors General Traders
In view of these findings, IRS could easily target the General traders, most of whom
operates on table tops and food venders, many of whom could be located at the permanent
locations they ply their trade while other are hawkers who are constantly in mobility. The
localised food venders could only be tracked when their wares are still on sale but leaves
their premises the moment their produce finishes.
Apart from the two classes of business mentioned earlier on, ‗Hairdressers and
beauticians‘ and Dressmakers and ‗Fashion Designers‘ are the next class of business
dominant in the municipality. The latter, just like the ‗Artisans‘ and ‗ contractors‘ could
be targeted by using the Associational strategy.
4.3 RESPONSES FROM TAX OFFICIALS
4.3.1 Factors affecting compliance level
4.3.1.1 Application of sanctions for not honouring tax obligation by tax payers
The study indicated as shown in Table 6 and diagramatically represented in Figure 6
below that on the issue of applying all the approved sanctions for not honouring tax
obligations by tax payers, 40% respondents of the tax officials of IRS responded in the
affirmative while as much as 60% dissented.
Table 6: Sanctions for non-payment of taxes
Freq. Percent (%)
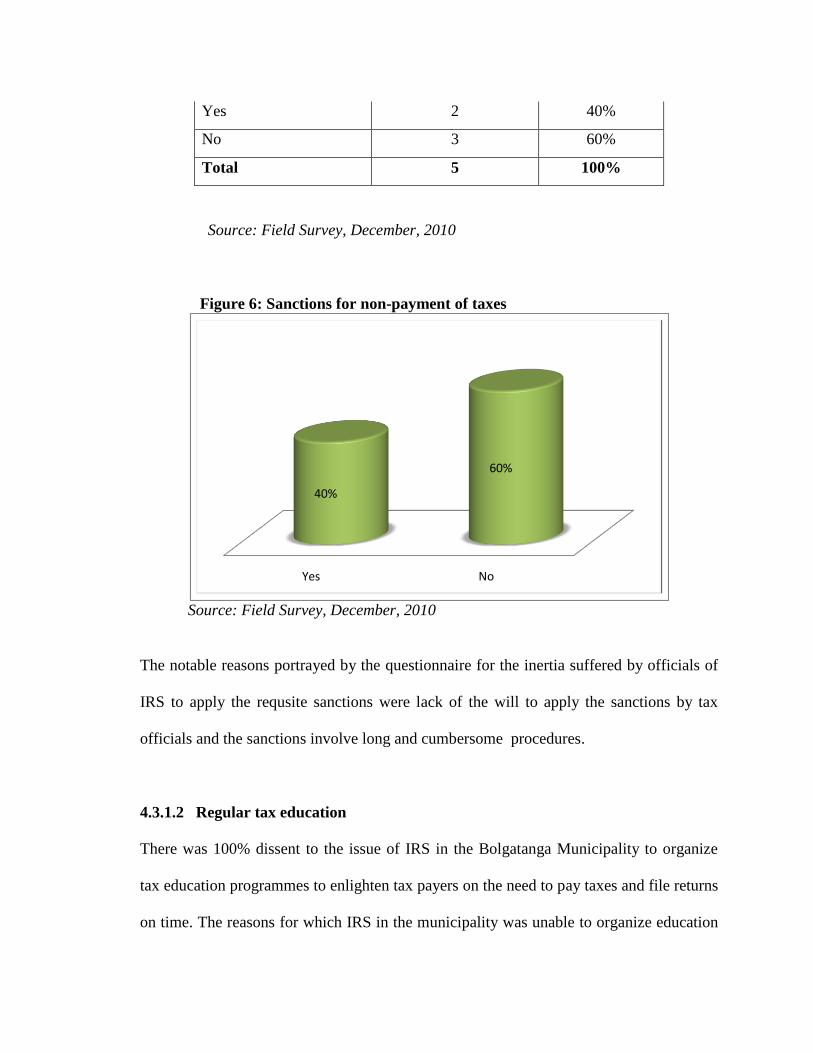
Yes 2 40%
No 3 60%
Total 5 100%
Source: Field Survey, December, 2010
Figure 6: Sanctions for non-payment of taxes
Source: Field Survey, December, 2010
The notable reasons portrayed by the questionnaire for the inertia suffered by officials of
IRS to apply the requsite sanctions were lack of the will to apply the sanctions by tax
officials and the sanctions involve long and cumbersome procedures.
4.3.1.2 Regular tax education
There was 100% dissent to the issue of IRS in the Bolgatanga Municipality to organize
tax education programmes to enlighten tax payers on the need to pay taxes and file returns
on time. The reasons for which IRS in the municipality was unable to organize education
Yes No
40%
60%
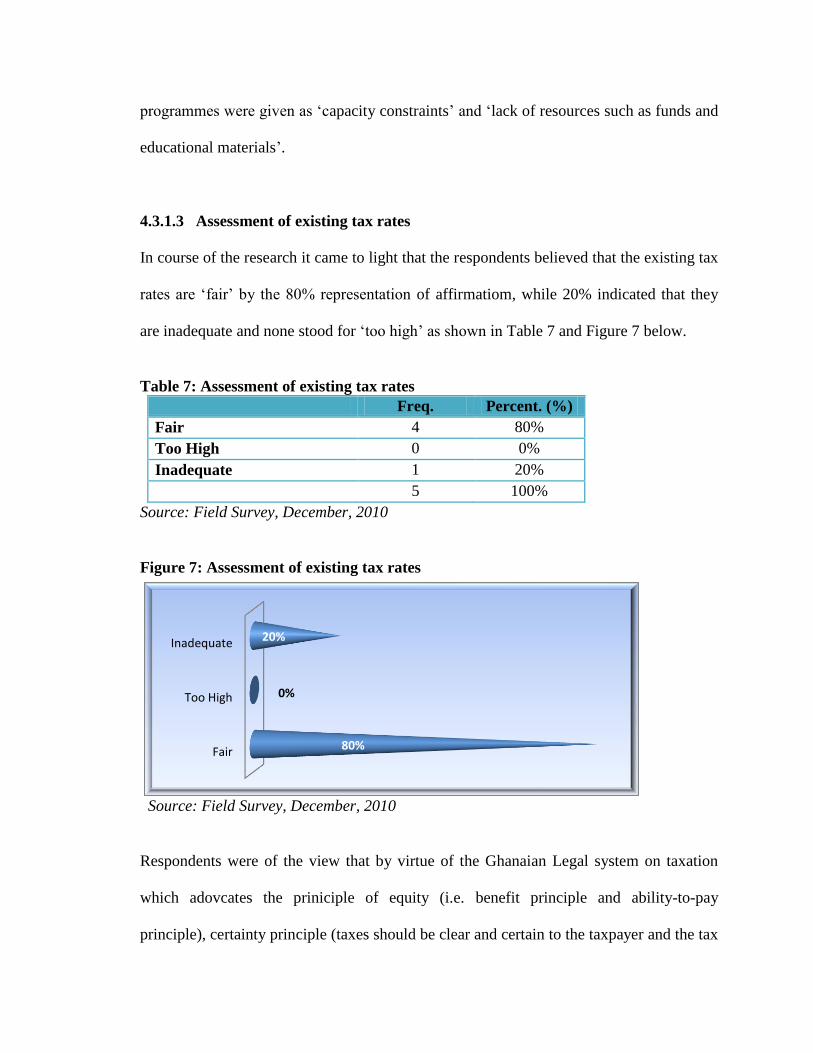
programmes were given as ‗capacity constraints‘ and ‗lack of resources such as funds and
educational materials‘.
4.3.1.3 Assessment of existing tax rates
In course of the research it came to light that the respondents believed that the existing tax
rates are ‗fair‘ by the 80% representation of affirmatiom, while 20% indicated that they
are inadequate and none stood for ‗too high‘ as shown in Table 7 and Figure 7 below.
Table 7: Assessment of existing tax rates
Freq. Percent. (%)
Fair 4 80%
Too High 0 0%
Inadequate 1 20%
5 100%
Source: Field Survey, December, 2010
Figure 7: Assessment of existing tax rates
Source: Field Survey, December, 2010
Respondents were of the view that by virtue of the Ghanaian Legal system on taxation
which adovcates the priniciple of equity (i.e. benefit principle and ability-to-pay
principle), certainty principle (taxes should be clear and certain to the taxpayer and the tax
Fair
Too High
Inadequate
80%
0%
20%
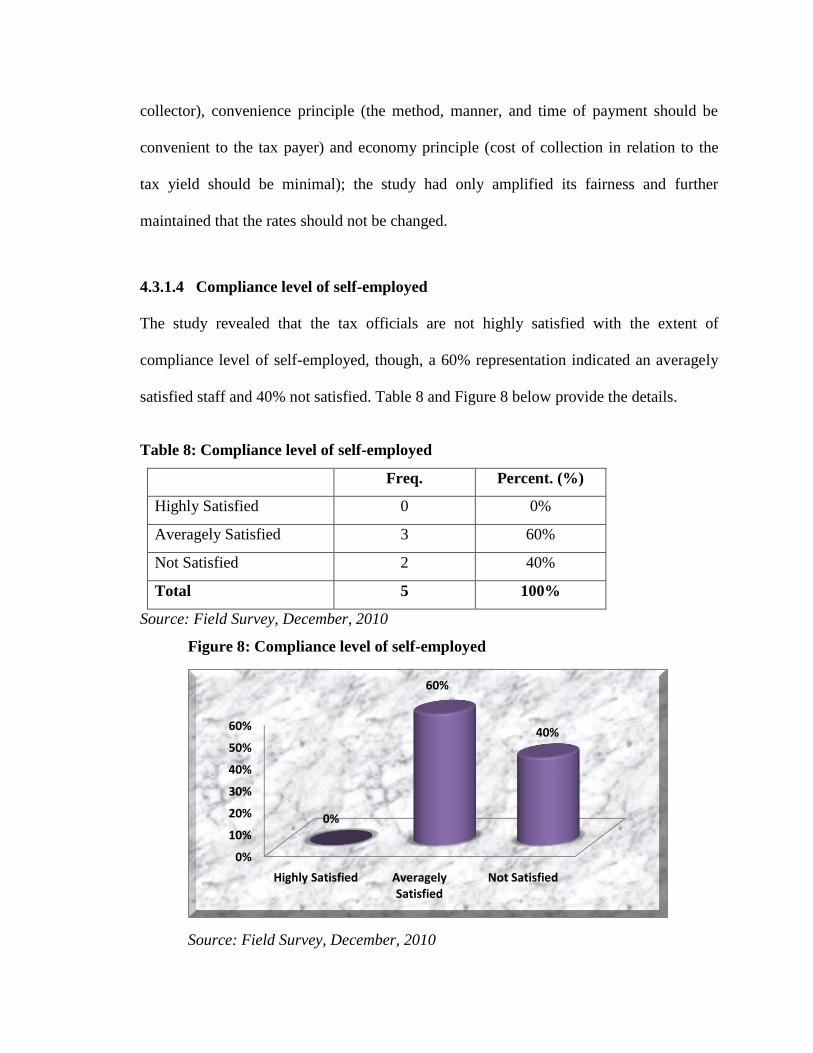
collector), convenience principle (the method, manner, and time of payment should be
convenient to the tax payer) and economy principle (cost of collection in relation to the
tax yield should be minimal); the study had only amplified its fairness and further
maintained that the rates should not be changed.
4.3.1.4 Compliance level of self-employed
The study revealed that the tax officials are not highly satisfied with the extent of
compliance level of self-employed, though, a 60% representation indicated an averagely
satisfied staff and 40% not satisfied. Table 8 and Figure 8 below provide the details.
Table 8: Compliance level of self-employed
Freq. Percent. (%)
Highly Satisfied 0 0%
Averagely Satisfied 3 60%
Not Satisfied 2 40%
Total 5 100%
Source: Field Survey, December, 2010
Figure 8: Compliance level of self-employed
Source: Field Survey, December, 2010
0%
10%
20%
30%
40%
50%
60%
Highly Satisfied Averagely Satisfied
Not Satisfied
0%
60%
40%
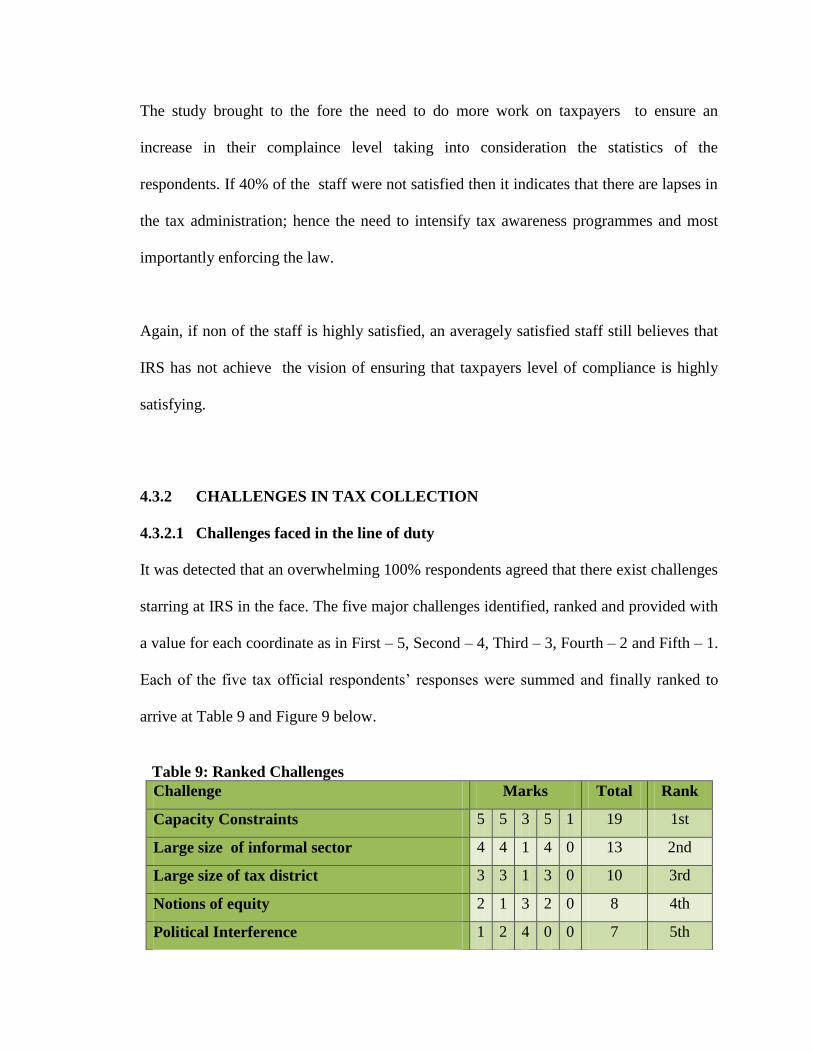
The study brought to the fore the need to do more work on taxpayers to ensure an
increase in their complaince level taking into consideration the statistics of the
respondents. If 40% of the staff were not satisfied then it indicates that there are lapses in
the tax administration; hence the need to intensify tax awareness programmes and most
importantly enforcing the law.
Again, if non of the staff is highly satisfied, an averagely satisfied staff still believes that
IRS has not achieve the vision of ensuring that taxpayers level of compliance is highly
satisfying.
4.3.2 CHALLENGES IN TAX COLLECTION
4.3.2.1 Challenges faced in the line of duty
It was detected that an overwhelming 100% respondents agreed that there exist challenges
starring at IRS in the face. The five major challenges identified, ranked and provided with
a value for each coordinate as in First – 5, Second – 4, Third – 3, Fourth – 2 and Fifth – 1.
Each of the five tax official respondents‘ responses were summed and finally ranked to
arrive at Table 9 and Figure 9 below.
Table 9: Ranked Challenges
Challenge Marks Total Rank
Capacity Constraints 5 5 3 5 1 19 1st
Large size of informal sector 4 4 1 4 0 13 2nd
Large size of tax district 3 3 1 3 0 10 3rd
Notions of equity 2 1 3 2 0 8 4th
Political Interference 1 2 4 0 0 7 5th
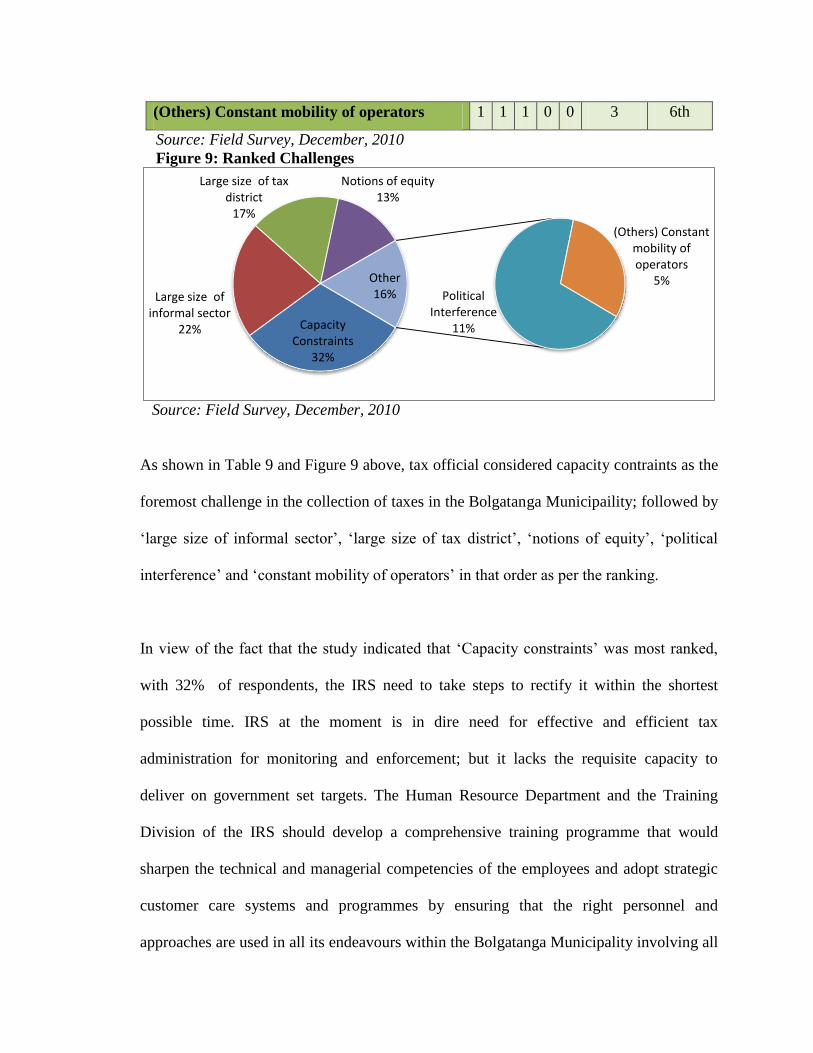
(Others) Constant mobility of operators 1 1 1 0 0 3 6th
Source: Field Survey, December, 2010
Figure 9: Ranked Challenges
Source: Field Survey, December, 2010
As shown in Table 9 and Figure 9 above, tax official considered capacity contraints as the
foremost challenge in the collection of taxes in the Bolgatanga Municipaility; followed by
‗large size of informal sector‘, ‗large size of tax district‘, ‗notions of equity‘, ‗political
interference‘ and ‗constant mobility of operators‘ in that order as per the ranking.
In view of the fact that the study indicated that ‗Capacity constraints‘ was most ranked,
with 32% of respondents, the IRS need to take steps to rectify it within the shortest
possible time. IRS at the moment is in dire need for effective and efficient tax
administration for monitoring and enforcement; but it lacks the requisite capacity to
deliver on government set targets. The Human Resource Department and the Training
Division of the IRS should develop a comprehensive training programme that would
sharpen the technical and managerial competencies of the employees and adopt strategic
customer care systems and programmes by ensuring that the right personnel and
approaches are used in all its endeavours within the Bolgatanga Municipality involving all
Capacity Constraints
32%
Large size of informal sector
22%
Large size of tax district
17%
Notions of equity13%
Political Interference
11%
(Others) Constant mobility of operators
5%Other16%
stakeholders.
The study portrayed that 22% of ‗large size of informal sector‘ was the next most
challenged factor in the services‘ operations, followed closely by the 17% ‗large size of
the tax district‘. The IRS could adopt a strategy of segmentation of the district for efficient
tax administration. Further prying revealed that IRS has already initiated what they term
Associational taxation meant to address some of this problem by using informal sector
associations as agents for income tax collection. The associations had intimate knowledge
of the activities of their members and could collect taxes without much additional effort.
The taxes were collected daily at first, and later weekly to reduce the high costs of
printing and monitoring daily receipts, making the payments small and affordable to most
members. It is only prudent for IRS to intensify this strategy by encouraging and
providing incentives to the associations.
In the area of political interferences, government officials and opposition members alike
need to be circumspect with their interferences into the activities of IRS. By virtue of
their positions; their interferences may lead to a shortfall in the collection of taxes in the
Bolgatanga Municipality.
4.3.2.2 Content with number of tax payers with books of accounts
The research revealed that 100% of the respondents were not content with the number of
taxpayers who keep books of accounts; books of accounts help a tax payer in the
determination of income for the purpose of tax.
4.3.2.3 Method of tax determinations from tax payers without proper books of
accounts or Submit accounts.
The study discovered that the only method used in the assessment of one‘s tax liability in
the absence of books of accounts was Net Worth Method (Living Expenses Method).
4.3.2.4 Tax payers file their returns annually with IRS
It came to light that not all taxpayers file their respective returns with the organization
annually. In the same vain tax officials encountered several difficulties with tax payers in
the process of filing returns. Notable among them were improper completion of returns;
late submission of returns; non submission of returns; tax payers not declaring the right
income; and inadequate information from tax payers.
4.3.2.5 Measures to check difficulty of filing returns and non submission of returns
The measures adopted by the tax officials to check the difficulties encountered by the
taxpayers in their course of filing returns and non submission of returns as revealed by the
research included: assistance from tax officials and auditors in the completion of tax
returns; imposition of penalties; and constants education on the need to file returns, the
legal implication for failure to file returns as well as the benefits of filing returns.
4.3.2.6 Challenges encountered with tax payers in the payment of taxes
The research revealed an overwhelming affirmation that tax officials encountered on daily
basis several challenges in tax collection. Notable among them were tax payers‘
complains of financial constraints due to poor performance of business and high tax rates.
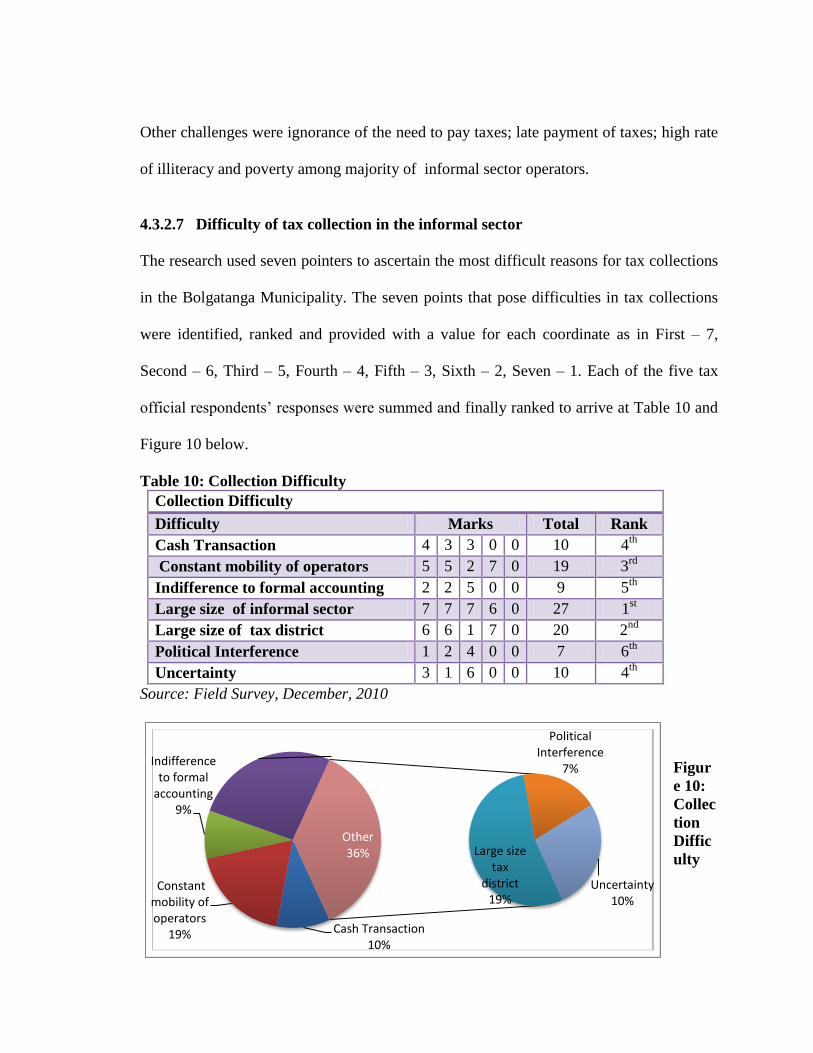
Other challenges were ignorance of the need to pay taxes; late payment of taxes; high rate
of illiteracy and poverty among majority of informal sector operators.
4.3.2.7 Difficulty of tax collection in the informal sector
The research used seven pointers to ascertain the most difficult reasons for tax collections
in the Bolgatanga Municipality. The seven points that pose difficulties in tax collections
were identified, ranked and provided with a value for each coordinate as in First – 7,
Second – 6, Third – 5, Fourth – 4, Fifth – 3, Sixth – 2, Seven – 1. Each of the five tax
official respondents‘ responses were summed and finally ranked to arrive at Table 10 and
Figure 10 below.
Table 10: Collection Difficulty
Collection Difficulty
Difficulty Marks Total Rank
Cash Transaction 4 3 3 0 0 10 4th
Constant mobility of operators 5 5 2 7 0 19 3rd
Indifference to formal accounting 2 2 5 0 0 9 5th
Large size of informal sector 7 7 7 6 0 27 1st
Large size of tax district 6 6 1 7 0 20 2nd
Political Interference 1 2 4 0 0 7 6th
Uncertainty 3 1 6 0 0 10 4th
Source: Field Survey, December, 2010
Figur
e 10:
Collec
tion
Diffic
ulty
Cash Transaction10%
Constant mobility of operators
19%
Indifference to formal
accounting9%
Large size of informal sector
26%
Large size tax
district19%
Political Interference
7%
Uncertainty10%
Other36%
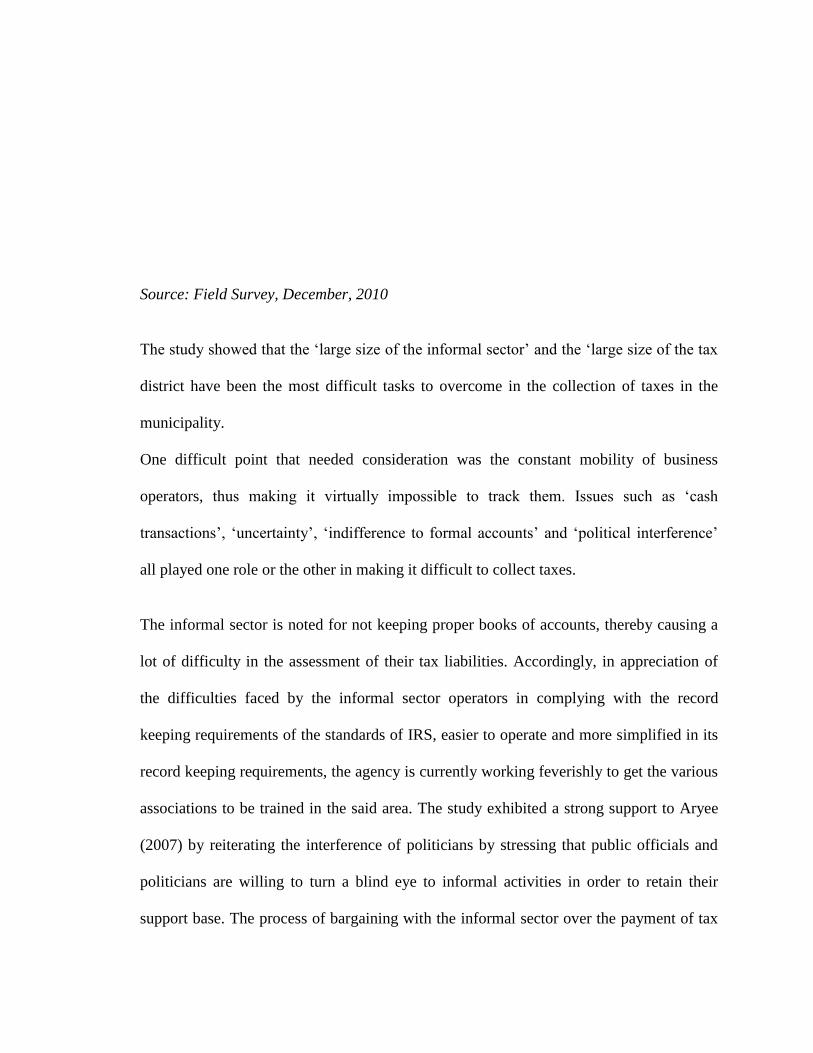
Source: Field Survey, December, 2010
The study showed that the ‗large size of the informal sector‘ and the ‗large size of the tax
district have been the most difficult tasks to overcome in the collection of taxes in the
municipality.
One difficult point that needed consideration was the constant mobility of business
operators, thus making it virtually impossible to track them. Issues such as ‗cash
transactions‘, ‗uncertainty‘, ‗indifference to formal accounts‘ and ‗political interference‘
all played one role or the other in making it difficult to collect taxes.
The informal sector is noted for not keeping proper books of accounts, thereby causing a
lot of difficulty in the assessment of their tax liabilities. Accordingly, in appreciation of
the difficulties faced by the informal sector operators in complying with the record
keeping requirements of the standards of IRS, easier to operate and more simplified in its
record keeping requirements, the agency is currently working feverishly to get the various
associations to be trained in the said area. The study exhibited a strong support to Aryee
(2007) by reiterating the interference of politicians by stressing that public officials and
politicians are willing to turn a blind eye to informal activities in order to retain their
support base. The process of bargaining with the informal sector over the payment of tax
is itself a gesture of concession and accommodative, which is fraught with political
overtures and undertones.
Again, looking at ‗cash transactions as a difficulty in tax collection official of IRS
interviewed explained that most business transactions in Ghana and for that matter
Bolgatanga are done in cash and even certain reputable organizations are skeptical to
accept cheques as mode of payments. The officials further explained that transaction of all
businesses in cash is one of the means by which a businessman can conceal taxable
income; hence, he is able not only to manipulate his records and turnover figures for tax
reduction purposes but he is also able to eliminate all third party information leading to
his purchases and sales.
4.4 RESPONSES FROM TAX PAYERS
4.4.1 Factors affecting compliance level
4.4.1.1 Tax Education by IRS
There was an overwhelming response of 98% that IRS does not organize tax education in
the Bolgatanga Municipality. Due to the capacity constraints in the area of comprehensive
Tax Programme and staff strength of IRS it did not come as a surprise when the
respondents emphasized the low outreach programme and enforcement of the law.
4.4.1.2 Anticipation of benefits from government
The research revealed that 79% of tax payers make good their tax obligation with the
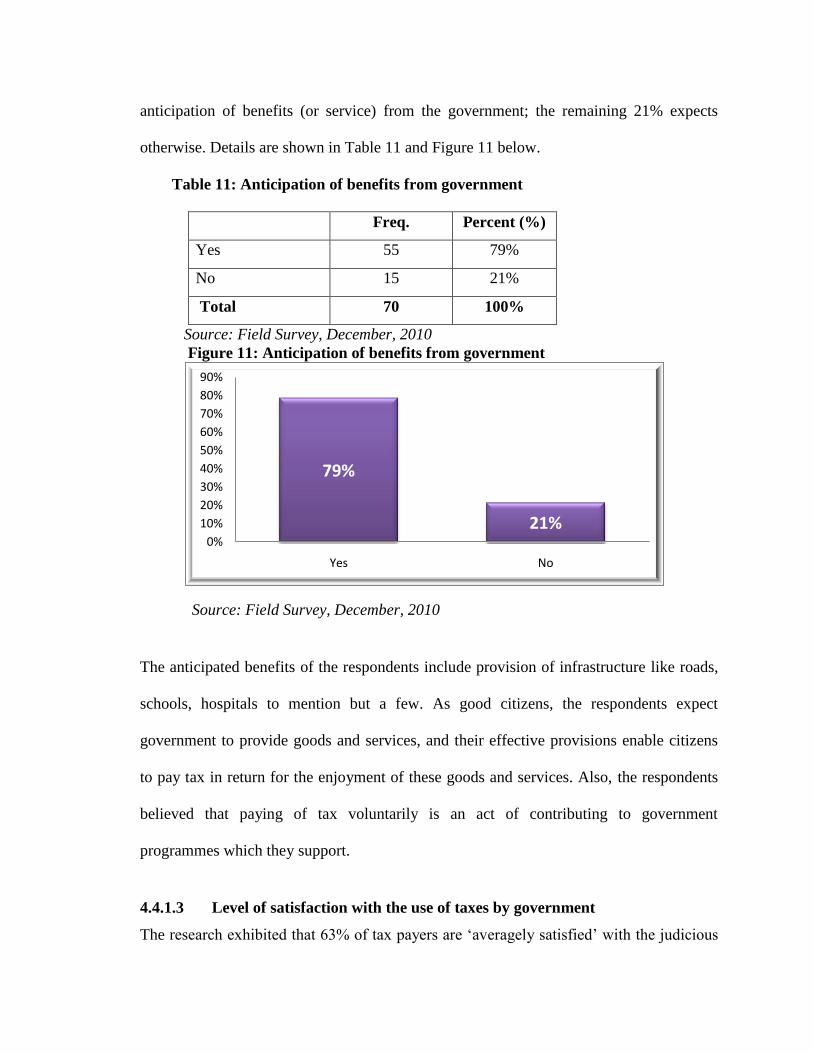
anticipation of benefits (or service) from the government; the remaining 21% expects
otherwise. Details are shown in Table 11 and Figure 11 below.
Table 11: Anticipation of benefits from government
Freq. Percent (%)
Yes 55 79%
No 15 21%
Total 70 100%
Source: Field Survey, December, 2010
Figure 11: Anticipation of benefits from government
Source: Field Survey, December, 2010
The anticipated benefits of the respondents include provision of infrastructure like roads,
schools, hospitals to mention but a few. As good citizens, the respondents expect
government to provide goods and services, and their effective provisions enable citizens
to pay tax in return for the enjoyment of these goods and services. Also, the respondents
believed that paying of tax voluntarily is an act of contributing to government
programmes which they support.
4.4.1.3 Level of satisfaction with the use of taxes by government
The research exhibited that 63% of tax payers are ‗averagely satisfied‘ with the judicious
79%
21%0%
10%
20%
30%
40%
50%
60%
70%
80%
90%
Yes No
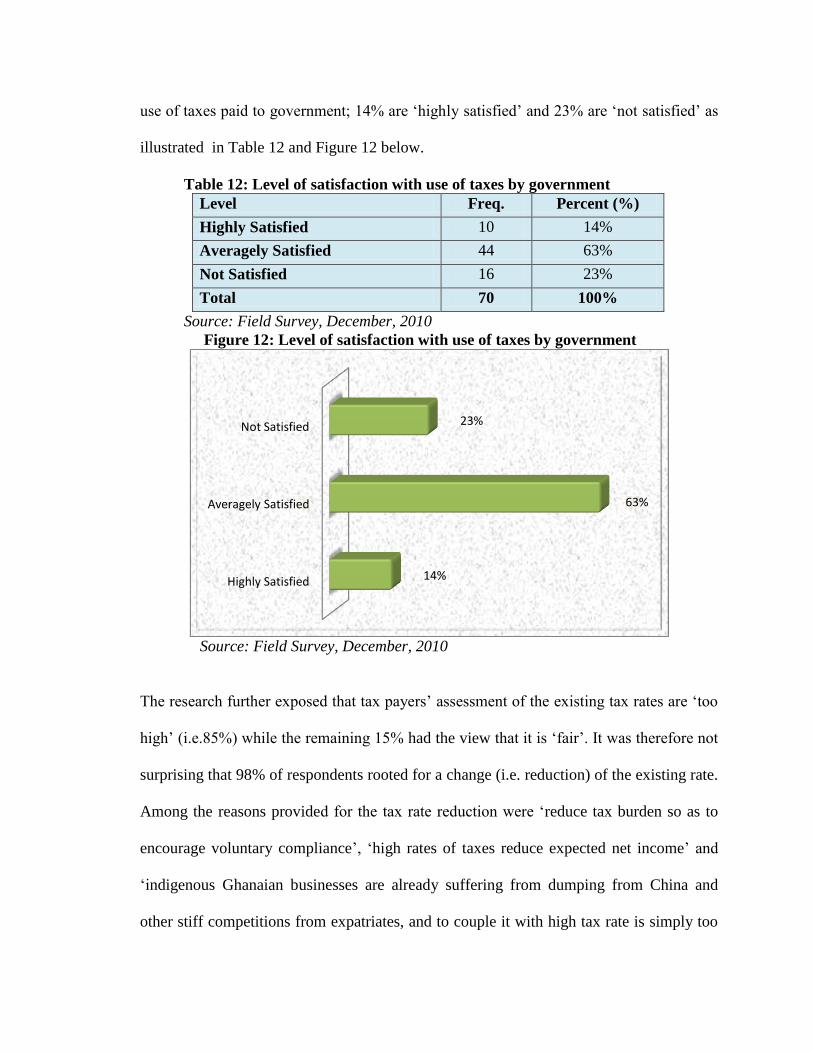
use of taxes paid to government; 14% are ‗highly satisfied‘ and 23% are ‗not satisfied‘ as
illustrated in Table 12 and Figure 12 below.
Table 12: Level of satisfaction with use of taxes by government
Level Freq. Percent (%)
Highly Satisfied 10 14%
Averagely Satisfied 44 63%
Not Satisfied 16 23%
Total 70 100%
Source: Field Survey, December, 2010
Figure 12: Level of satisfaction with use of taxes by government
Source: Field Survey, December, 2010
The research further exposed that tax payers‘ assessment of the existing tax rates are ‗too
high‘ (i.e.85%) while the remaining 15% had the view that it is ‗fair‘. It was therefore not
surprising that 98% of respondents rooted for a change (i.e. reduction) of the existing rate.
Among the reasons provided for the tax rate reduction were ‗reduce tax burden so as to
encourage voluntary compliance‘, ‗high rates of taxes reduce expected net income‘ and
‗indigenous Ghanaian businesses are already suffering from dumping from China and
other stiff competitions from expatriates, and to couple it with high tax rate is simply too
Highly Satisfied
Averagely Satisfied
Not Satisfied
14%
63%
23%
much‘. Again, respondents overwhelmingly (99%) affirmed to the fact that severe
punitive measures would help stem the tide of tax evasion. Notable among the punitive
measures suggested were closure of businesses, seizure of wares of hawkers and more
strict terms prosecution.
4.4.1.4 Reasons for tax evasion
The research showed that the four points provided as reasons for tax evasion were very
relevant; 41% chose ‗too high tax rates‘, 29% was registered for ‗knowing others are not
paying‘, ‗unfair application of tax laws‘ had 16%, and 14% maintained that ‗mistrust of
government for the use of tax revenue‘ were strongly affirmed. Also, a respondent
provided another reason as, ‗the tax net fails to catch all taxable ‗insects‘, while the few
complying ones are being pressurized and intimidated‘.
Furthermore, 99% of tax payers were of the view that social sanctions can deter people
from evading taxes because of public ridicules, and the remaining 1% obviously
dissenting.
4.4.1.5 Participation in decision making influences tax compliance
The study indicated by the 81% response that individuals‘ participation in decision
making process in their community serves as a major factor of influencing tax
compliance. However, 19% (i.e. 13 in absolute terms) did not share in that view. Table 13
and Figure 13 below illustrate the responses.
Table 13: Participation in decision making influences tax compliance
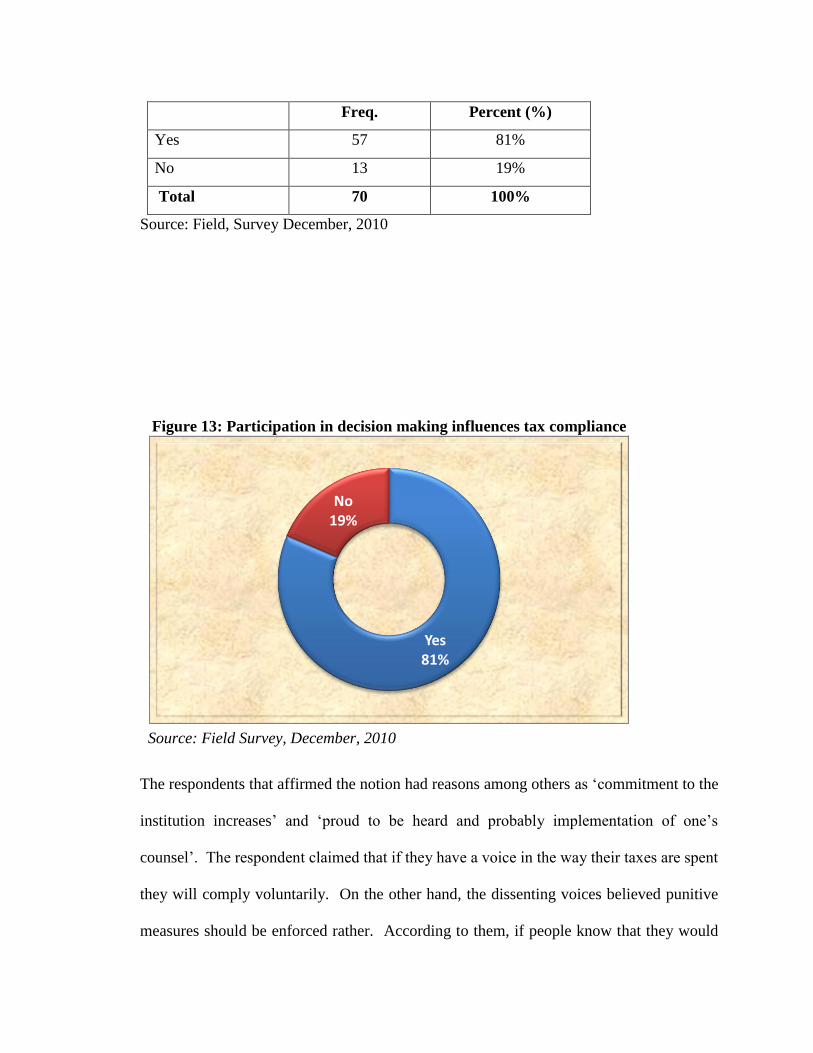
Freq. Percent (%)
Yes 57 81%
No 13 19%
Total 70 100%
Source: Field, Survey December, 2010
Figure 13: Participation in decision making influences tax compliance
Source: Field Survey, December, 2010
The respondents that affirmed the notion had reasons among others as ‗commitment to the
institution increases‘ and ‗proud to be heard and probably implementation of one‘s
counsel‘. The respondent claimed that if they have a voice in the way their taxes are spent
they will comply voluntarily. On the other hand, the dissenting voices believed punitive
measures should be enforced rather. According to them, if people know that they would
Yes81%
No19%
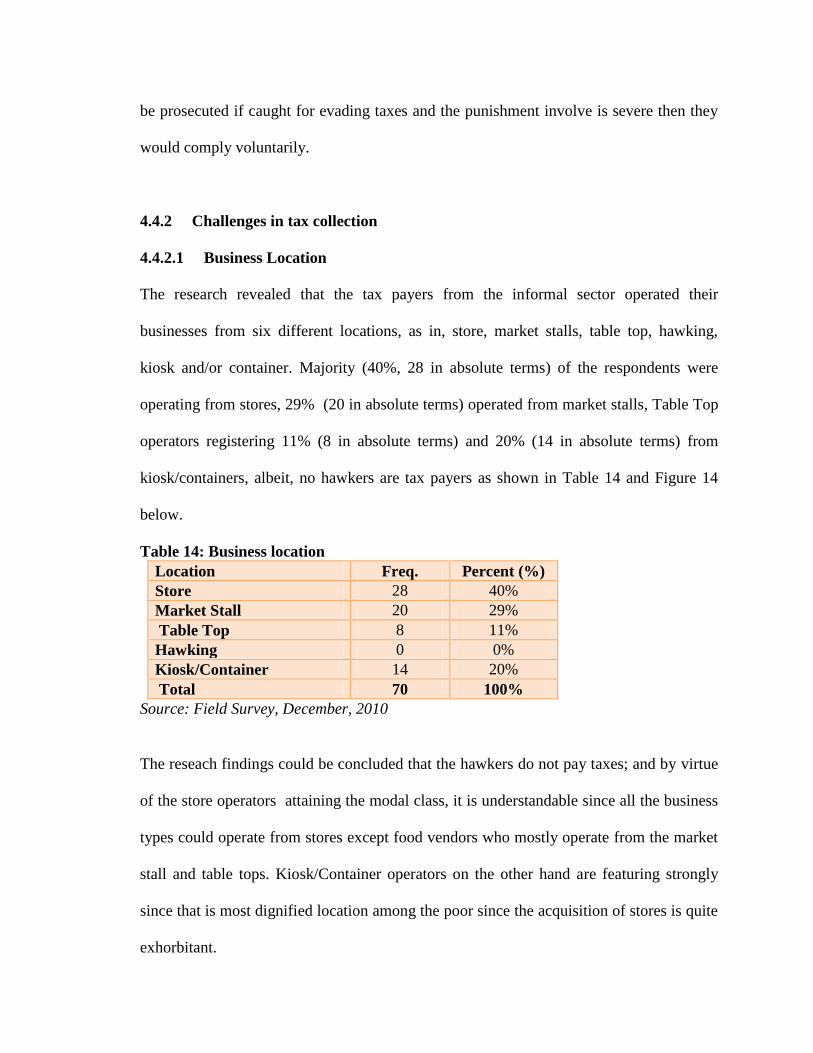
be prosecuted if caught for evading taxes and the punishment involve is severe then they
would comply voluntarily.
4.4.2 Challenges in tax collection
4.4.2.1 Business Location
The research revealed that the tax payers from the informal sector operated their
businesses from six different locations, as in, store, market stalls, table top, hawking,
kiosk and/or container. Majority (40%, 28 in absolute terms) of the respondents were
operating from stores, 29% (20 in absolute terms) operated from market stalls, Table Top
operators registering 11% (8 in absolute terms) and 20% (14 in absolute terms) from
kiosk/containers, albeit, no hawkers are tax payers as shown in Table 14 and Figure 14
below.
Table 14: Business location
Location Freq. Percent (%)
Store 28 40%
Market Stall 20 29%
Table Top 8 11%
Hawking 0 0%
Kiosk/Container 14 20%
Total 70 100%
Source: Field Survey, December, 2010
The reseach findings could be concluded that the hawkers do not pay taxes; and by virtue
of the store operators attaining the modal class, it is understandable since all the business
types could operate from stores except food vendors who mostly operate from the market
stall and table tops. Kiosk/Container operators on the other hand are featuring strongly
since that is most dignified location among the poor since the acquisition of stores is quite
exhorbitant.
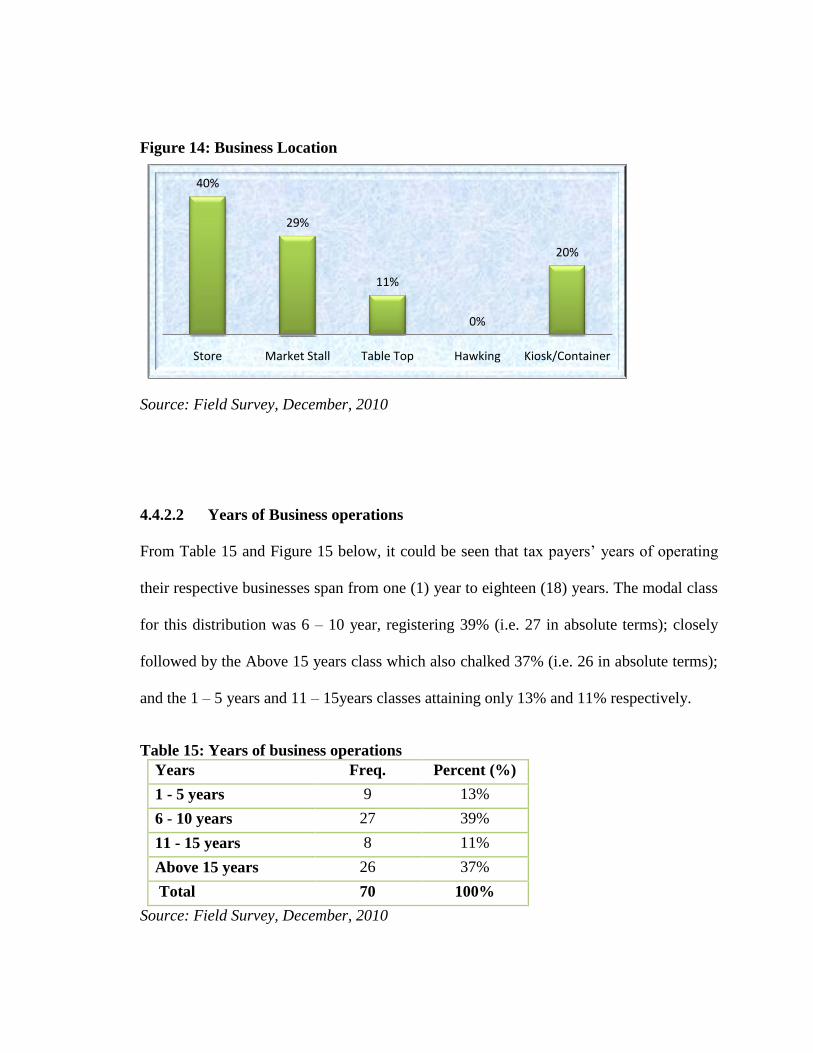
Figure 14: Business Location
Source: Field Survey, December, 2010
4.4.2.2 Years of Business operations
From Table 15 and Figure 15 below, it could be seen that tax payers‘ years of operating
their respective businesses span from one (1) year to eighteen (18) years. The modal class
for this distribution was 6 – 10 year, registering 39% (i.e. 27 in absolute terms); closely
followed by the Above 15 years class which also chalked 37% (i.e. 26 in absolute terms);
and the 1 – 5 years and 11 – 15years classes attaining only 13% and 11% respectively.
Table 15: Years of business operations
Years Freq. Percent (%)
1 - 5 years 9 13%
6 - 10 years 27 39%
11 - 15 years 8 11%
Above 15 years 26 37%
Total 70 100%
Source: Field Survey, December, 2010
40%
29%
11%
0%
20%
Store Market Stall Table Top Hawking Kiosk/Container
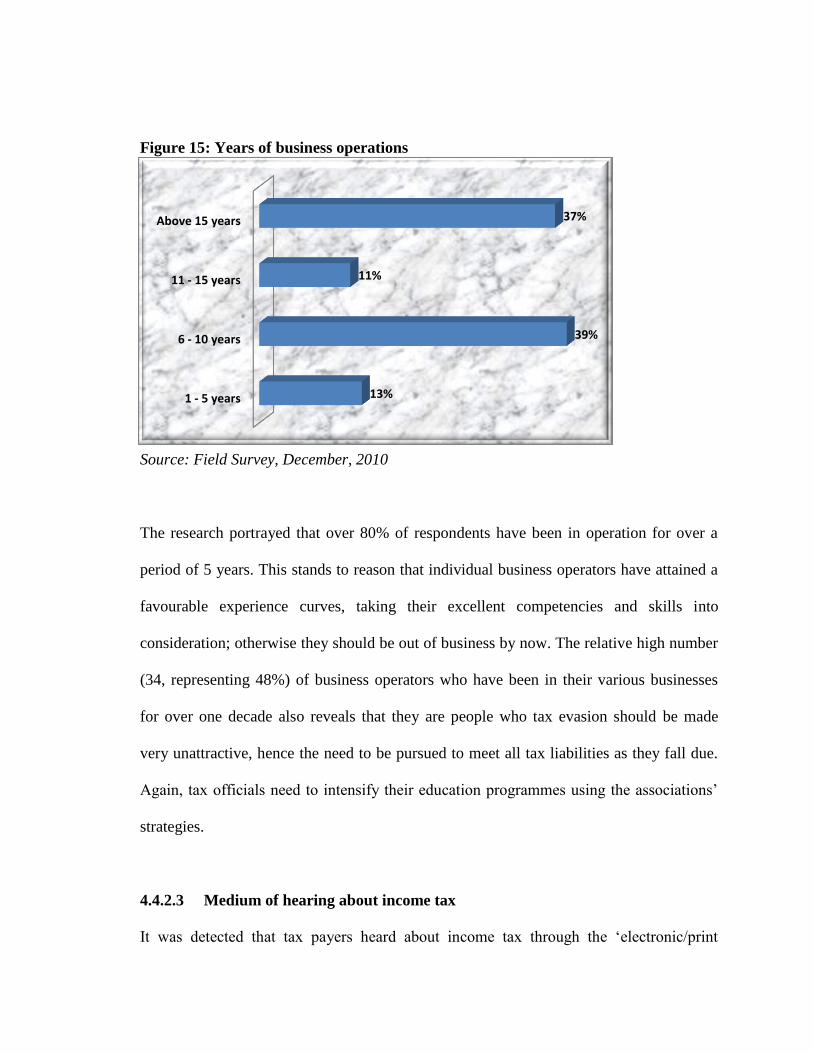
Figure 15: Years of business operations
Source: Field Survey, December, 2010
The research portrayed that over 80% of respondents have been in operation for over a
period of 5 years. This stands to reason that individual business operators have attained a
favourable experience curves, taking their excellent competencies and skills into
consideration; otherwise they should be out of business by now. The relative high number
(34, representing 48%) of business operators who have been in their various businesses
for over one decade also reveals that they are people who tax evasion should be made
very unattractive, hence the need to be pursued to meet all tax liabilities as they fall due.
Again, tax officials need to intensify their education programmes using the associations‘
strategies.
4.4.2.3 Medium of hearing about income tax
It was detected that tax payers heard about income tax through the ‗electronic/print
1 - 5 years
6 - 10 years
11 - 15 years
Above 15 years
13%
39%
11%
37%
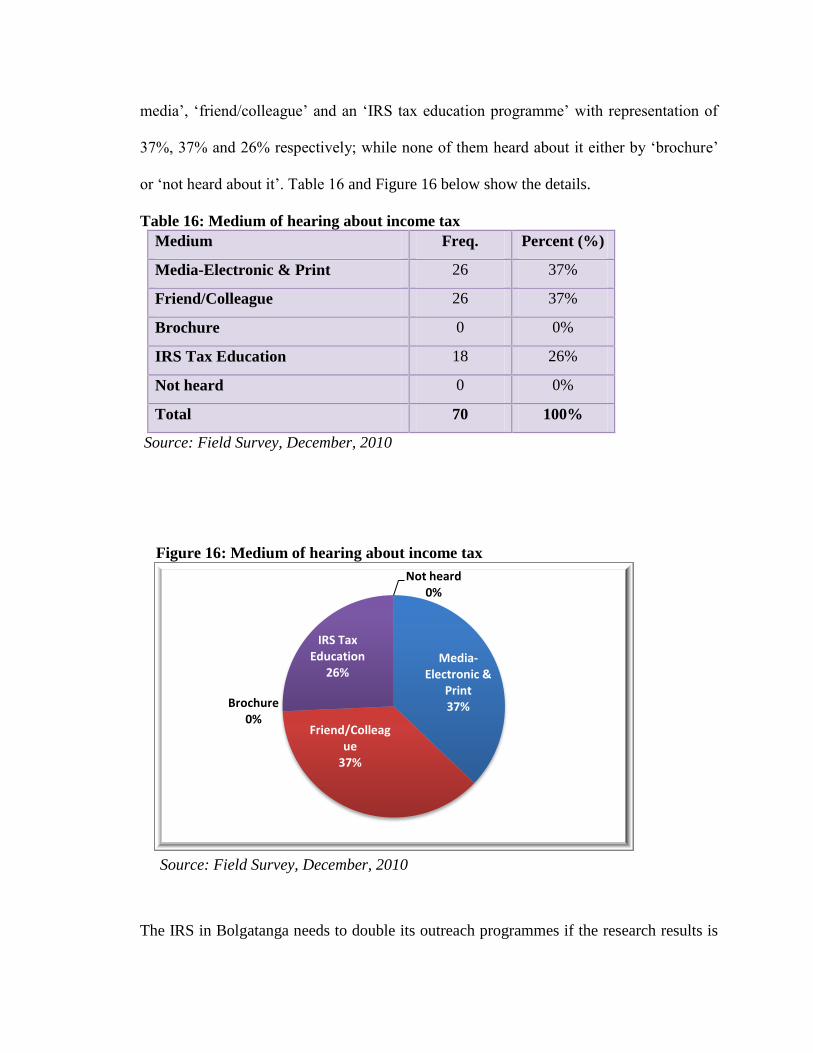
media‘, ‗friend/colleague‘ and an ‗IRS tax education programme‘ with representation of
37%, 37% and 26% respectively; while none of them heard about it either by ‗brochure‘
or ‗not heard about it‘. Table 16 and Figure 16 below show the details.
Table 16: Medium of hearing about income tax
Medium Freq. Percent (%)
Media-Electronic & Print 26 37%
Friend/Colleague 26 37%
Brochure 0 0%
IRS Tax Education 18 26%
Not heard 0 0%
Total 70 100%
Source: Field Survey, December, 2010
Figure 16: Medium of hearing about income tax
Source: Field Survey, December, 2010
The IRS in Bolgatanga needs to double its outreach programmes if the research results is
Media-Electronic &
Print37%
Friend/Colleague
37%
Brochure0%
IRS Tax Education
26%
Not heard0%
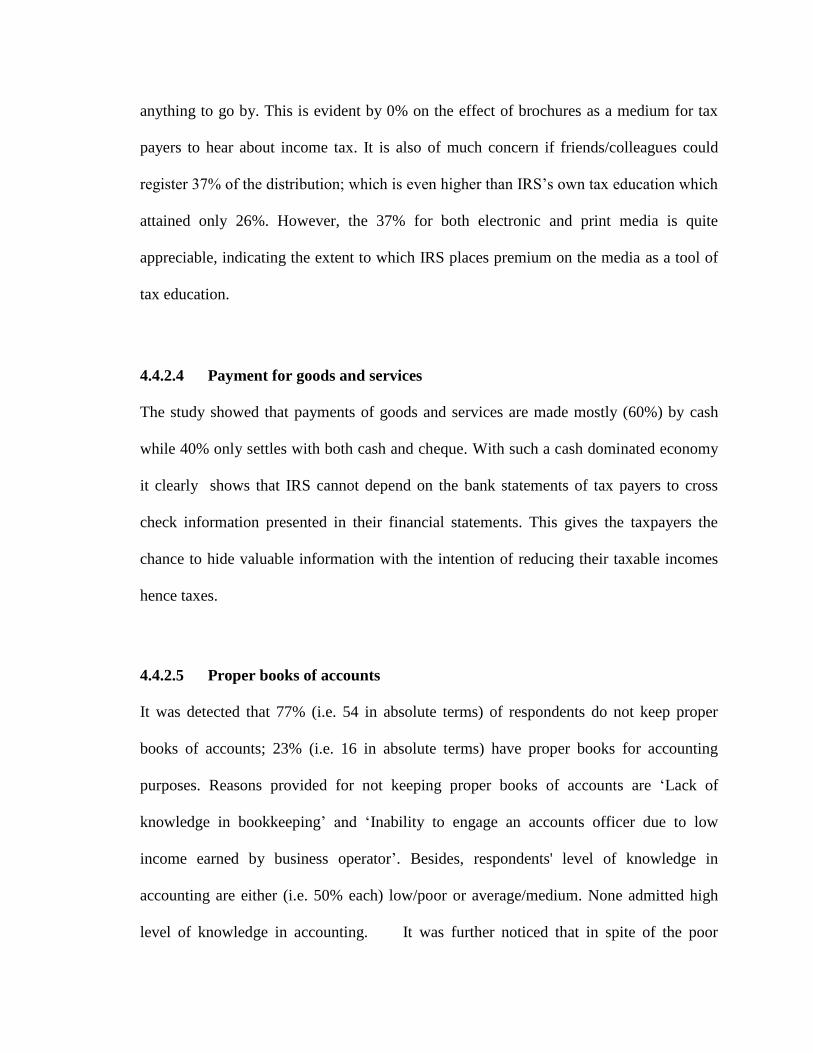
anything to go by. This is evident by 0% on the effect of brochures as a medium for tax
payers to hear about income tax. It is also of much concern if friends/colleagues could
register 37% of the distribution; which is even higher than IRS‘s own tax education which
attained only 26%. However, the 37% for both electronic and print media is quite
appreciable, indicating the extent to which IRS places premium on the media as a tool of
tax education.
4.4.2.4 Payment for goods and services
The study showed that payments of goods and services are made mostly (60%) by cash
while 40% only settles with both cash and cheque. With such a cash dominated economy
it clearly shows that IRS cannot depend on the bank statements of tax payers to cross
check information presented in their financial statements. This gives the taxpayers the
chance to hide valuable information with the intention of reducing their taxable incomes
hence taxes.
4.4.2.5 Proper books of accounts
It was detected that 77% (i.e. 54 in absolute terms) of respondents do not keep proper
books of accounts; 23% (i.e. 16 in absolute terms) have proper books for accounting
purposes. Reasons provided for not keeping proper books of accounts are ‗Lack of
knowledge in bookkeeping‘ and ‗Inability to engage an accounts officer due to low
income earned by business operator‘. Besides, respondents' level of knowledge in
accounting are either (i.e. 50% each) low/poor or average/medium. None admitted high
level of knowledge in accounting. It was further noticed that in spite of the poor
knowledge in proper accounting, 90% of respondents are not engaging the services of an
accountant with the reason that they simply could not afford the ‗high service fees‘
charged by these professionals.
4.4.2.6 Filing of returns
It was discovered that 64% (45 in absolute terms) of respondents do not regularly file
returns at IRS. Reasons provided were ‗Lack of bookkeeping and accounting knowledge‘
and ‗Cumbersome procedure of filing (i.e. difficulty in filling/completing forms)‘.
4.5 SUGGESTIONS TO IMPROVE TAX ADMINISTRATION
The respondents provided suggestions with the intent of improving tax collection in the
informal sector in the tax district of Bolgatanga. Among the suggestions were regular and
intensive field operations. Tax officials are expected to seek to increase contact with the
Trade and Business Associations especially in the informal sector within the Bolgatanga
Municipality through frequent meetings to identify and address policy, operation and
other related issues for the improvement of their understanding of tax procedures.
Secondly, as an added advantage to the above point, there should be regular and sustained
monitoring by tax officials.
Thirdly, more tax officials should be employed to augment the staff strength of
Bolgatanga IRS, since the large tax district and the large size of the informal sector have
always been the bane of IRS to cover many potential taxpayers. Fourthly, it is important
that tax officials are provided with the requisite logistics for efficient and effective
discharge of their duties. Finally, IRS should ensure that tax education programmes are
sustainable and cost effective.
CHAPTER FIVE
SUMMARY, CONCLUSIONS AND RECOMMENDATIONS
5.1 INTRODUCTION.
This chapter presents the summary of the research findings, conclusion drawn from the
study and recommendations.
5.2 SUMMARY OF FINDINGS.
The aim of this research was to find out the causes of tax non compliance behaviour in
the informal sector and besides, explore further the challenges in taxing the informal
sector in Bolgatanga Municipality; with specific research objectives being: to find out
why non compliance of income tax is high in the informal sector; to identify the
challenges that militate against effective revenue mobilization by IRS from the informal
sector.
The following summaries are presented based on the findings in chapter four of this study.
Application of sanctions for not honouring tax obligation by tax payers
It was found out that the I R S in Bolgatanga Municipality do not apply all the approved
sanctions for not honouring tax obligations by tax payers .This was affirmed by 60% of
the respondents from the I R S .The reasons given were lack of the will to apply the
sanctions on the part of the tax officials and besides, the sanctions involve long and
cumbersome procedures.
Regular tax education
There was 100% affirmations that owing to capacity constraints and lack of resources the
I R S in the municipality do not organize tax education programmes regularly to educate
the public and for that matter the tax payers on the need to pay taxes and file returns on
time. This was also confirmed by the tax payers with 98% responses.
Lack of regular tax education programmes to a large extent contributed to non submission
and incomplete filling of returns as well as nonpayment of taxes as indicated by the tax
officials.
Anticipation of benefits and the level of satisfaction with the use of taxes by
government.
The research showed that while 79% of the respondents pay their taxes in anticipation of
benefits such as provision of infrastructure like schools, hospitals, roads to mention but a
few , 21% expects otherwise. Besides, the study showed that 63%, 14% and 23% were
averagely satisfied, highly satisfied and not satisfied respectively with the use of tax
revenue by the government.
Again, the research revealed that while 15% of the respondents from the informal sector
viewed the existing tax rates for the individual tax payers as fair, 85% were of the view
that they were not fair and therefore called for a reduction in the current tax rates.
Further, it came to light that 99% of the respondents were of the view that severe punitive
measures could dissuade people from evading taxes and suggested punitive measures such
as closure of businesses of defaulters, seizure of wares of hawkers and more strict terms
prosecution as means of curbing tax evasion in the municipality.
Reasons for tax evasion
The four points provided as reasons for tax evasion were strongly affirmed with the
following percentages: too high tax rates‘, 41%; knowing others are not paying, 29%;
unfair application of tax rates, 16%; and mistrust of government for the use of tax rates,
14%. Besides, a respondent provided additional reason for tax evasion as, ‗the tax net fails
to catch all taxable ‗insects‘, while the few complying ones are being pressurized and
intimidated‘.
Participation in decision making influences tax compliance
The study further revealed by 81% that participation in decision making process serves as
a major factor of influencing compliance level with the reasons that it increases ones
commitment to the institution and besides, makes one proud to be heard and probably
implementing ones counsel.
Challenges in Tax collection
The research showed that there exist challenges starring at IRS in the face; and tax
offcials considered ‗capacity contraints‘ as the most challenged factor in tax collection in
the Bolgatanga Municipaility; followed by ‗Large size of informal sector‘, ‗large size of
tax district‘, ‗notions of equity‘, ‗political interference‘ and ‗constant mobility of
operators‘ in that order as per the ranking.
Tax payers file their returns annually with IRS
The research revealed that not all taxpayers file their respective returns with the
organization annually. In the same vain tax officials encountered several difficulties with
tax payers in filing returns .These included improper completion or filling of returns, late
submission of returns, non submission of returns and ignorance of the benefits of filing
returns, tax payers not declaring the right income and inadequate information from tax
payers.
Challenges encountered with tax payers in the payment of taxes
The research revealed an overwhelming affirmation that tax officials encountered on daily
basis several challenges in tax collection. Notable among them were tax payers complains
of financial constraints due to poor performance of business and high tax rates, tax payers
ignorance of income tax, high rate of illiteracy and poverty among majority of tax payers
in the informal sector and late payment of taxes.
Difficulty of taxe collection in the informal sector
The study showed that the ‗large size of the informal sector‘ and the ‗large size of the tax
district have been the most difficult tasks to overcome in the collection of taxes in the
municipality. One other difficult point that needed consideration was the constant
mobility of business operators, thus making it virtually impossible to track them. Issues
such as‗cash transactions‘, ‗uncertainty‘, ‗indifference to formal accounts‘ and ‗political
interference‘ all played one role or the other in making it difficult to collect taxes.
Proper books of accounts
It was detected that 77% (i.e. 54 in absolute terms) of respondents do not keep proper
books of accounts; 23% (i.e. 16 in absolute terms) have proper books for accounting
purposes. It was further noticed that in spite of the poor knowledge in proper accounting,
90% of the respondents were not engaging the services of accountants with the reason that
they simply could not afford the ‗high service fees‘ charged by these professionals.
5.3 CONCLUSION
The research revealed that there was lack of tax education in the municipality, majority of
the tax payers were either averagely satisfied or not satisfied with the use of tax revenue
by the government and the greater percentage of people pay their taxes in anticipation of
benefits from government. Also, the IRS were not applying the approved sanctions for
failure to pay taxes, the tax net failed to catch all taxable ‗insects‘ and besides,
participation in decision making process and social sanctions increase compliance level.
In conclusion, taxing the informal sector depends on a combination of approaches and
mechanisms. Tax collection is an important governance challenge that depends on a
compliance culture, the values and norms of a society, its history and above all the
capacity of the government to deliver. The potential for taxing the informal sector
depends upon a) the degree of pressure on governments to increase revenues and b) the
existence of collective actors in the informal sector having institutionalized channels for
negotiation with the state (Stella 1993 cited by Aryee, (2007)). Above all, there must be a
different way of thinking politically about taxation of the informal sector that could lead
to a substantial new research agenda. In other words, to make inroads into the difficult
problem of taxation of the informal sector we need to think differently about the issue.
Maximizing voluntary compliance is therefore a must which must be taken seriously by
any reform or new research agenda.
5.4 RECOMMENDATIONS
In view of the findings of the research the following were recommended:
Intensive and Regular Monitoring
Officials of IRS should undertake regular and intensive field operations by ensuring
regular monitoring of the operatives within the informal tax net. Secret personnel or spies
should be engaged to download verifiable information about all tax evaders for rewards.
Furthermore, tax payers should be encouraged to make use of the cheque system. This
will enable IRS to cross check informations provided in the financial statements of
taxpayers using their bank statements.
Capacity Building
More tax officials should be employed to augment the staff strength of Bolgatanga IRS.
Also, training and re-training of tax official in modern trends of tax assessment is key.
Therefore tax official should be well equiped in the area of tax education programmes.
Again,as an interim measure to solve the shortage of staff problem the I RS should use the
leaders of identifiable groups such as Hairdressers and Beauticians Association,Butchers
Association,Dressmakers and Tailers Association and so on to collect taxes from their
members.
Logistical Support
Tax officials should be provided with the requisite logistics for efficient and effective
discharge of their duties. The tax system should be computerised to bring efficiency in the
tax administration and a reduction in the cost of tax collection in the district in terms of
time and personnel to be employed.
Regular Tax Education and Advertisement
There should be regular tax education for the general public using both the electronic and
print media. Billboards should be mounted at vantage points in the district to educate the
public about the importance of taxation. The IRS should organize seminars to teach tax
payers basic bookkeeping principles.This will enable them submit accounts for fair
assessments.
Effective Customer Relations
Maintainance of very good customer relations is key; thus, tax collectors should apply
marketing, human resource strategies and a high sense of diplomacy to convince and
encourage tax payers to make good their respective tax liabilities. However, when the
need arises the rules and regulations governing tax compliance must be applied. Again,
tax net should be widened further so as to capture much more lower income earners.
Also, involving the tax payers and the general public in decision making processes so far
as taxation is concerned will be of great help since it will ensure commitment.
Prudent utilization of Tax Revenue
Governments should be seen to be using revenue accrued from taxation prudently without
misappropriation and misapplication; and governments should be accountable and
transparent. By so doing the people will have confidence and trust in the government.
Regular Review of Tax Administration
Research should be conducted on personal developments such as - buildings of complex
nature by individuals, types of cars people use and general life-style. A database should be
built on taxpayers and potential ones.
Motivation of Tax Officials
The tax officers should be effectively motivated at various levels like – high salary, high
end of service benefit, end of year bonus, housing and car loans payable in at least 10
years period.
Reward System
A reward system should be initiated whereby the best small tax payers at the district
levels would be awarded annually as in the case of farmers, teachers, health workers
among others. This will serve as incentive for tax compliance among the small taxpayers.
Collaborations
The IRS should collaborate with other institutions, for example, the assemblies to get
information on potential tax payers since no person can operate business without license
from the assemblies.
REFERENCES
Adom, D. (2000). Resource Mobilisation for Economic Development: The Role of Tax
Administration. Paper presented to Ad Hoc Expert Group Meeting on
Strategies for Improving Resource Mobilization in Developing Countries and
Countrieswith Economies in Transition. Montreal October, 2 – 6.
Allingham, M. G., and Sandmo, A. (1972). ‗Income Tax Evasion: A Theoretical
Analysis‘. Journal of Public Economics, (Nov. 1):323-338.
Alm, J., Jackson, B., and Mckee, M. (1992). Deterrance and Beyond: Toward a
Knider, Gentler IRS. In Slemrod (ed.) Why People Pay Taxes. Tax
Compliance and Tax Enforcement. Ann Arbor: The University of Michigan
Press.
Amin, A.T. M. N. (1989). Handbook on Urban Informal Sector. Bangkok:
Asian Institute of Technology.
Andreoni, J., Erard, B., and Feinstein, J. (1998). ‗Tax Compliance‘. Journal of
Economic Literature,XXXXVI: 818-860.
Ayee, J. R.A. (2007). Building Tax Compliance Through Reciprocity with
Government. Paper presented to the Foreign Investment Advisory Service
(FIAS) of the World Bank Group Regional Conference on the theme
―Enterprise Formalization in Africa‖ Alisa Hotel, Accra, January, 10 – 11.
Barwa, S.D. (1995).Structural Adjustment Programmes and the Urban Informal Sector
in Ghana, Issues in Development, Discussion Paper 3. Development and
Technical Co-operation Department, ILO, Geneva.
Bird, R. M. (1992). Tax Policy and Economic Development. Baltimore: John Hopkins
Press.
Bannock G., Baxter, R.E., and Davis, E. (1998). The Penguin Dictionary of
Economics (6th
ed.) London: The penguin Group.
Bryman, A. (2004). Social Research Methods (2nd
edition). Oxford: Oxford
University Press.
Budget of Ghana (2007). The Budget Statement and Economic Policy of the
Government of Ghana for 2007 Financial Year, Presented to Parliament on
Thursday, 16th
November, 2006 by Kwadwo Baah – Wiredu, MP., Minister of
Finance and Economic Planning, Accra: Assembly Press, Ghana Publishing
Corporation.
Cowell, F. and Gordon, J. (1988) ‗Unwillingness to pay. Tax Evasion and Public
Goods Provision‘. Journal of Public Economics, 36: 305-321.
Drine, I. (2009). ―Informal Sector and Domestic Resource Mobilization‖. Paper
presented to Development Finance Network (DEFiNE) Meeting on
Domestic Resource Mobilisation for Development Policy Solutions in Times
of Crisis, Paris, France, September, 24.
Edgar, T and Sandler, D. (2005). Materials on Canadian Income Tax. Toronto:
Thompson Canada Ltd.
Emory, C. W. and Cooper, D.R. (1991). Business Research Methods (4th
edition).
Boston, MA: Irvin.
Fambon, S. (2006). ―Taxation in Developing Countries: Case Study of Cameroon‖.
Research Paper No. 2006/02. Helsinki: World Institute for Development
Economics Research.
Farrell, G., Roman, J., and Mathew, F. (2000). ―Conceptualizing the Shadow
Economy‖. Journal of International Affairs, Vol. 53, No. 2: 393
Feige, E. L. (1990). ―Defining and Estimating Underground and Informal Economies:
The New Institutional Economics Approach: World Development, 18 No.
7: 989 – 1002.
Feige, E. L. (1989). The Underground Economies. Tax Evasion and Information
Distribution. Cambridge, New York: Cambridge University Press.
Fifteenth International Conference of Labour Statisticians (1993). Resolution
Concerning Statistics of the Employment in the Informal Sector, January.
Fjeldstad O – H. (2004). To Pay or Not to Pay? Citizens‘ Views on Taxation in Local
Authorities in Tanzania. CMI Working Papers, WP 2004: 8. Norway:
Chr. Michelsen Institute.
Fjeldstad, O – H. and Semboja, J. (2001). ‗Why People Pay Taxes. The Case of the
Developing Levy in Tanzania‘. World Development, 29 (12): 2059-2074.
Friedman, S. (2003). ―Sending Them a Message: Culture, Tax Collection and
Governance in South Africa‖. Policy: Issues and Actors, Vol. 16, No. 3
(June):1-17.
Gaines, L.K. and Miller, R.L.R. (2008) . Criminal Justice In Action. The Core
(5th
ed.) California USA: Wadsworth Publishing.
Gberegbe, F. B. (2007). Tax Administration in Nigeria: Concepts and Practice.
Nigeria: Fredsbary Printers and Publishers.
Geeroms, H. and Wilmots, H. (1985). An Empirical Model of Tax Evasion and Tax
Avoidance. Public Finance 40 (2): 190-209.
Ghana News Agency (GNA) (2006). Business News of Friday, September, 29.
Ghana News Agency (GNA) (2009) April, 3.
Ghana Trade Union Congress (2004). Incomes in Ghana,Policy Discussion Paper,
May, 19.
Grasmick, H. and Green, D. E. (1980). ‗Legal Punishment, Social Disapproval and
Internalization as Inhibitors of Illegal Behaviour‘. Journal of Criminal Law
and Criminology, 71 (3):325-335
Grasmick, H and Scott, W. (1982). Tax Evasion and Mechanisms of Social Control: A
Comparison with Grand and Petty Theft. Journal of Economic Psychology 2
(3):213-230.
Gupta, A.S. (2007). Determinants of Tax Revenue Efforts in Developing Countries,
IMF Working Paper WP/07/184 July.
Hardwick, P., Khan, B., and Langmead, J. (1994). An Introducation to Modern
Economics. United Kingdom: Longman Group Ltd.
Hessing, D.J., Elfers, H. and Weigel, R. (1988). ‗Tax Evasion Research: Measurement
Strategies and Theoritical Model‘. In van Raaij, W.F., van Veldhoven, G.M.
and Warneryd, K.E (eds.) Handbook of Economic Psychology.
Boston/London: Kluwer Academic Publishers: 516-537.
Hessing, D.J., Elfers, H., Robben, H., and Webley, P. (1992). ‗Does Deterrance Deter?
Measuring the Effect of Deterrance on Tax Compliance in Field Studies and
Experiment Studies‘. In Slemrod, J. (ed.) Why People Pay Taxes. Tax
Compliance and Tax Enforcement. Ann Arbor: The University of Michigan
Press:291-305.
Joshi, A. and Ayee, J. (2009). ―Taxing for the state? Politics, Revenue and the
Informal Sector in Ghana‖. Institute of Development Studies Bulletin, Vol.
33 lssue 3.
Report on ongoing research on Taxation of the Informal Passenger Transportation
Sector in Ghana.
Levi, M. (1988). Of Rule and Revenue. Los Angeles/London: University of
California Press.
Levi, M. (1998). ‗A State of Trust‘. In Braithwaite, V. and Levi, M. (eds.) Trust and
Governance. New York: Russel Sage Foundation:77-101.
Lewis, A., Webley, P., and Furnham, A. (1995). The New Economic Mind. The Social
Psychology of Economic Behaviour. London/New York: Harvester
Wheatsheaf.
Livingstone,L., Teriba, O., and Diejomaoh, V. P. (1987). Economics for West Africa
(2nd
ed.) London: Heinemann Educational Books Limited.
McAdams, R. (1997). The Origin, Development, and Regulation of Norins. Michigan
Law Review 96 (2)338-433.
OECD, Development Financing in Africa, from Monterrey to Doha, 2008
OECD Policy Brief, Measuring the pulse of Africa in times of crisis in Africa, May
2009.
OECD tax database, 2006,
Osei, R.D. and Quartey, P. (2005). ‗Tax Reforms in Ghana‘. WIDER Research Paper
No. 2005/66. Geneva: UNU – WIDER.
Prichard, W. (2009). Taxation and Development in Ghana: Finance, Equity, and
Accountability, Spain: Graficas Caro.
Punch, K. F. (1998). Introduction to Social Research: Quantitative and Qualitative
Approaches. Amazon. Com.
Revenews (2008). House Journal of the Internal Revenue Service No. 18: 4
Revenews (2009). House Journal of the Internal Revenue Service No. 18 (June):12.
Richupan, S. (1987). Determinants of Income Tax Evasion. Role of Tax Rates, Shape
of Tax Schedules and other Factors. In Gandhi (ed.) Supply – Side Tax
Policy: Its Relevance to Developing Countries. Washington, DC:
International Monetary Fund:140-174.
Schneider, F. (2005). Shadow Economies of 145 Countries all over the World: What
Do we Really Know? Working Paper No. 4. Durham, UK: Durham
University.
Scholz, J.T. (1998). ‗Trust, Taxes and Compliance‘. In Levi, M. and Braithwaite, V.
(eds.) Trust and Governance. New York: Russel Sage Foundation:135-166.
Scott, W. and Grasmick, H. (1981). Deterrance and Income Tax Cheating. Journal of
Applied Behavioural Science 17 (3):395-408.
Shihata, I.F.I. (1991). ‗ Promotion of Foreign Direct Investment – A General Account
with Particular Reference to the Role of the World Bank Group‘. ICSID
Review Foreign Investment Law Journal 6 (2):484-486.
Slavin, S.L. (1999). Macroeconomics (5th
ed.) The United States of America: the
McGraw- Hill Companies, Inc.
Slemrod, J. (2003). ‗Trust in Public Finance‘. In Cnossen, S. and Sinn, H – W (eds.)
Public Finance and Public Policy in the New Century. Cambridge, Mass.:
MIT Press:49-88.
Smith, P. (1994). ―Assessing the Size of the Underground Economy: The Canadian
Statistical Perspectives‖. Canadian Economic Observer, 7(5):16 – 33.
Snavely, K. (1990). ‗Government Policies to Reduce Tax Evasion: Coerced Behaviour
versus Services and Values Development‘. Policy Sciences, 23 (1):57-72.
Spicer, M. and Lundstedt, S. (1976). Understanding Tax Evasion. Public
Finance 31 (2): 295-305.
Strafford, A. D. and LoCascio, C.H (1995). Introduction to Economics. New York:
Glencoe/McGraw-Hill.
Tendler, J. (2002). Small Firms, the Informal Sector and the Devil‘s Deal. IDS
Bulletin, Vol. 33, No.3:99.
Terkper, S. E. (2003). ―Managing Small and Medium – Size Taxpayers in Developing
Economies‖. Tax Notes International January, 13.
Thomas, J. J. (1992). Informal Economic Activity. Ann Arbor: University of Michigan
Press.
Twenty Sixth Commonwealth Association of Tax Administrators (CATA) Annual
Conference (2005). Ohawa, Canada, August 28- September, 2.
Vogel, J. (1974). Taxation and Public Opinion in Sweden: An Interpretation of Recent
Survey Data. National Tax Journal 27 (4): 499 – 513.
Weisman, J. (2001). IRS Audit at Record Low: Officials Cite Decade-long Staff
Decrease, Old Computers, Law Defending Taxpayers. USA Today
(February 16): A1.
Westat, Inc. (1980). Individual Income Tax Compliance Factor Study: Qualitative
Research Results. Rockville, MD: Westat.
Wilkinson, M (1992). Taxation. London: Macmillan Press Ltd.
Wintrobe, R. (2001). Tax Evasion and Trust. UWO Department of Economics
Working Papers 200111. University of Western Ontario, Department of
Economics.
Witt, M and Lautenbacher, U. (2003). Institutional Strengthening of the Tax System in
Ghana, Germany: GTZ Gmbh.
Yadav, N. (2009). Informal Sector: Definitions and its Implications for Growth. CUTS
Briefing Paper, India: CUTS Centre for International Trade Economics and
Environment, September.
Yankelovich, Skelly and White, Inc. (1984). Taxpayer Attitudes Study: Final Report.
Public Opinion Survey prepared for the Infernal Revenue Service.
Washington, DC: Internal Revenue Service, U. S. Department of the Treasury.
Yankson, P.W.K. (1992). Employment in the Urban Informal Sector in Ghana.
ILO/JASPA, Addis Ababa.
Zee, H. H. (2005). Personal Income Tax Reform: Concepts, Issues and Comparative
Country Developments. Working Paper, WP/05/87. Washington DC.
IMF Fiscal Affairs Department.
http://www.africapartnershipforum.org/dataoecd/63/17/41656352.pdf
http://www.BusinessDictionary.com/2011
http://www.africa-pay-more-attention-to-tax-info.html,2008
http://imf.org/external/pubs/ft/fandd/2008/09/gupta.htm
http://www.oecd.org/dataoecd/20/50/42656057.pdf http://www.oecd.org/document/60/0,3343,en_2649_34533_1942460_1_1_1_1,00.html#trs
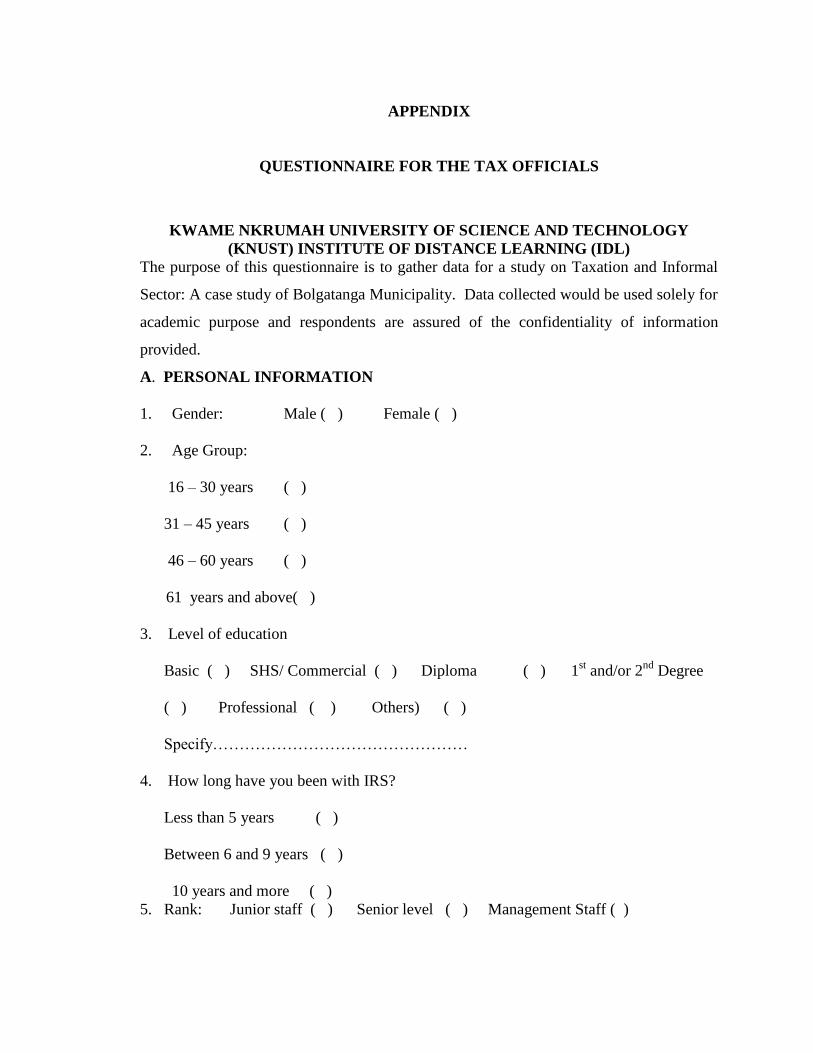
APPENDIX
QUESTIONNAIRE FOR THE TAX OFFICIALS
KWAME NKRUMAH UNIVERSITY OF SCIENCE AND TECHNOLOGY
(KNUST) INSTITUTE OF DISTANCE LEARNING (IDL)
The purpose of this questionnaire is to gather data for a study on Taxation and Informal
Sector: A case study of Bolgatanga Municipality. Data collected would be used solely for
academic purpose and respondents are assured of the confidentiality of information
provided.
A. PERSONAL INFORMATION
1. Gender: Male ( ) Female ( )
2. Age Group:
16 – 30 years ( )
31 – 45 years ( )
46 – 60 years ( )
61 years and above( )
3. Level of education
Basic ( ) SHS/ Commercial ( ) Diploma ( ) 1st and/or 2
nd Degree
( ) Professional ( ) Others) ( )
Specify…………………………………………
4. How long have you been with IRS?
Less than 5 years ( )
Between 6 and 9 years ( )
10 years and more ( )
5. Rank: Junior staff ( ) Senior level ( ) Management Staff ( )
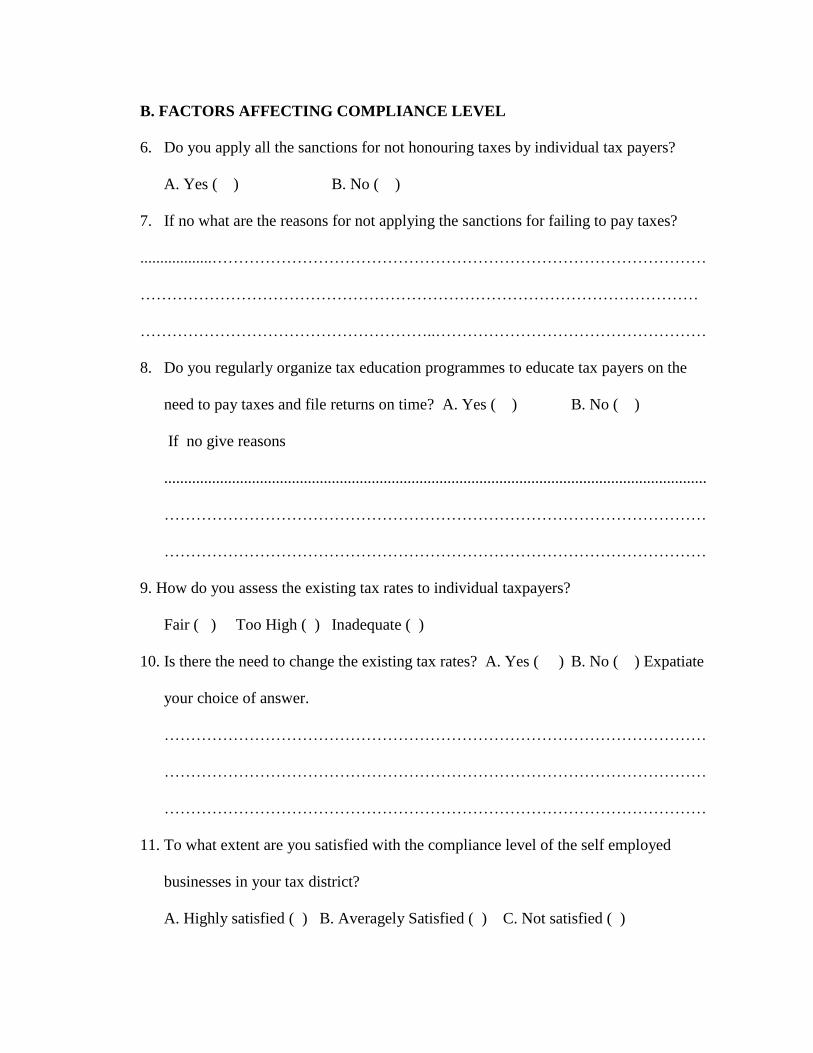
B. FACTORS AFFECTING COMPLIANCE LEVEL
6. Do you apply all the sanctions for not honouring taxes by individual tax payers?
A. Yes ( ) B. No ( )
7. If no what are the reasons for not applying the sanctions for failing to pay taxes?
..................…………………………………………………………………………………
……………………………………………………………………………………………
………………………………………………..……………………………………………
8. Do you regularly organize tax education programmes to educate tax payers on the
need to pay taxes and file returns on time? A. Yes ( ) B. No ( )
If no give reasons
........................................................................................................................................
…………………………………………………………………………………………
…………………………………………………………………………………………
9. How do you assess the existing tax rates to individual taxpayers?
Fair ( ) Too High ( ) Inadequate ( )
10. Is there the need to change the existing tax rates? A. Yes ( ) B. No ( ) Expatiate
your choice of answer.
…………………………………………………………………………………………
…………………………………………………………………………………………
…………………………………………………………………………………………
11. To what extent are you satisfied with the compliance level of the self employed
businesses in your tax district?
A. Highly satisfied ( ) B. Averagely Satisfied ( ) C. Not satisfied ( )
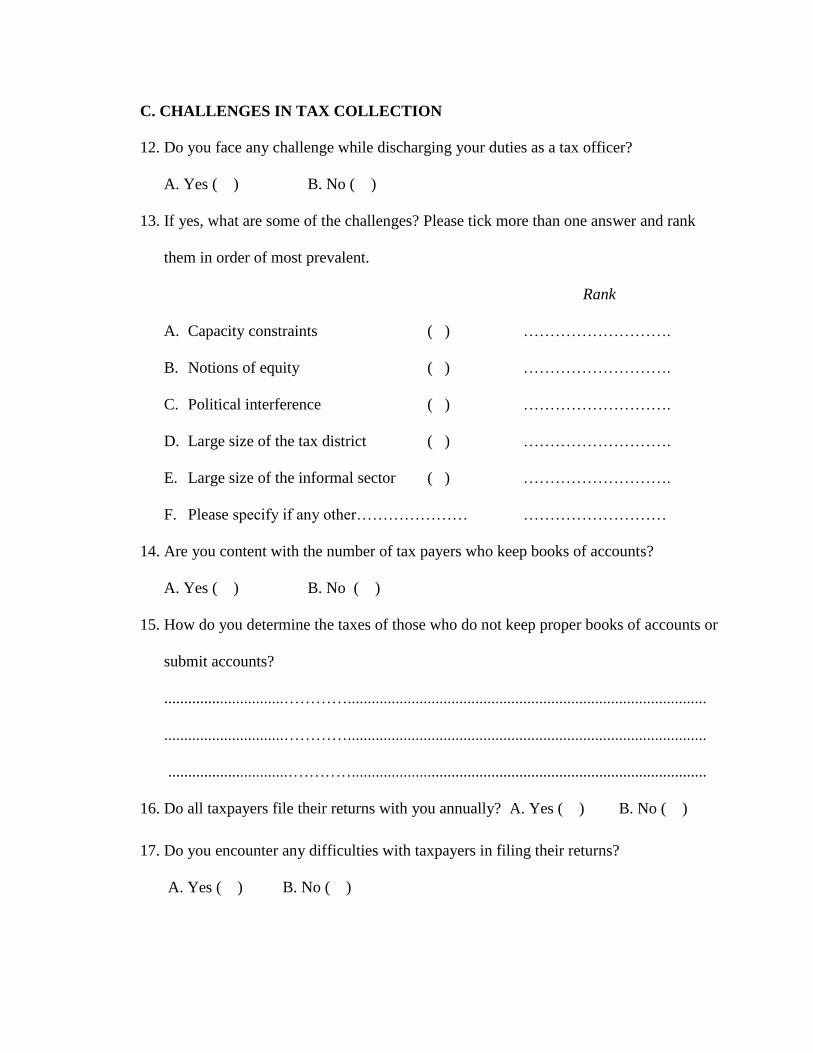
C. CHALLENGES IN TAX COLLECTION
12. Do you face any challenge while discharging your duties as a tax officer?
A. Yes ( ) B. No ( )
13. If yes, what are some of the challenges? Please tick more than one answer and rank
them in order of most prevalent.
Rank
A. Capacity constraints ( ) ……………………….
B. Notions of equity ( ) ……………………….
C. Political interference ( ) ……………………….
D. Large size of the tax district ( ) ……………………….
E. Large size of the informal sector ( ) ……………………….
F. Please specify if any other………………… ………………………
14. Are you content with the number of tax payers who keep books of accounts?
A. Yes ( ) B. No ( )
15. How do you determine the taxes of those who do not keep proper books of accounts or
submit accounts?
..............................…………..........................................................................................
..............................…………..........................................................................................
..............................………….........................................................................................
16. Do all taxpayers file their returns with you annually? A. Yes ( ) B. No ( )
17. Do you encounter any difficulties with taxpayers in filing their returns?
A. Yes ( ) B. No ( )
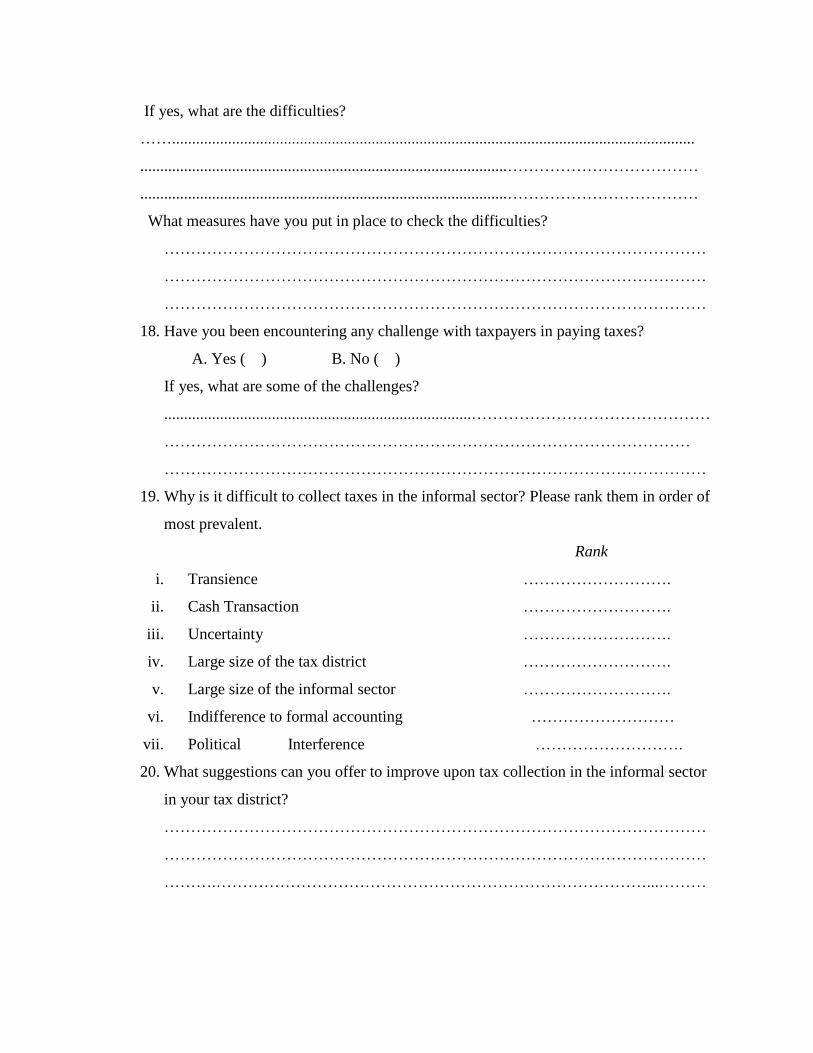
If yes, what are the difficulties?
……...................................................................................................................................
............................................................................................………………………………
............................................................................................………………………………
What measures have you put in place to check the difficulties?
…………………………………………………………………………………………
…………………………………………………………………………………………
…………………………………………………………………………………………
18. Have you been encountering any challenge with taxpayers in paying taxes?
A. Yes ( ) B. No ( )
If yes, what are some of the challenges?
.............................................................................………………………………………
………………………………………………………………………………………
…………………………………………………………………………………………
19. Why is it difficult to collect taxes in the informal sector? Please rank them in order of
most prevalent.
Rank
i. Transience ……………………….
ii. Cash Transaction ……………………….
iii. Uncertainty ……………………….
iv. Large size of the tax district ……………………….
v. Large size of the informal sector ……………………….
vi. Indifference to formal accounting ………………………
vii. Political Interference ……………………….
20. What suggestions can you offer to improve upon tax collection in the informal sector
in your tax district?
…………………………………………………………………………………………
…………………………………………………………………………………………
……….………………………………………………………………………...………
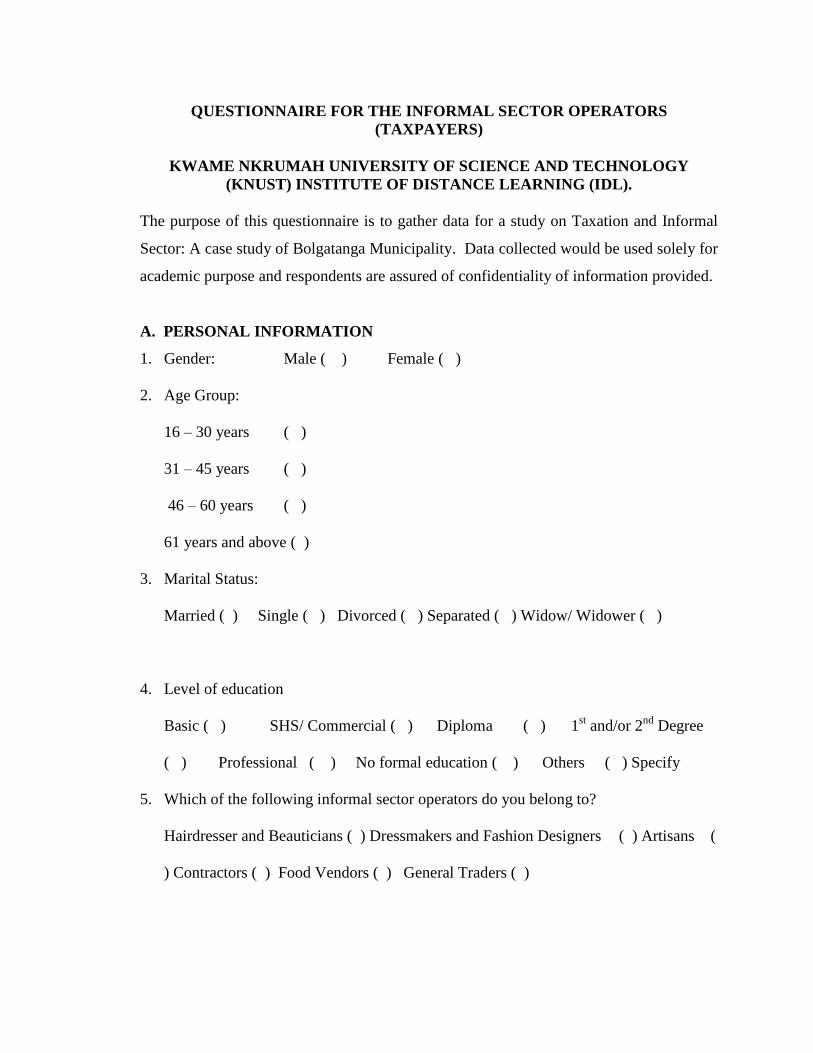
QUESTIONNAIRE FOR THE INFORMAL SECTOR OPERATORS
(TAXPAYERS)
KWAME NKRUMAH UNIVERSITY OF SCIENCE AND TECHNOLOGY
(KNUST) INSTITUTE OF DISTANCE LEARNING (IDL).
The purpose of this questionnaire is to gather data for a study on Taxation and Informal
Sector: A case study of Bolgatanga Municipality. Data collected would be used solely for
academic purpose and respondents are assured of confidentiality of information provided.
A. PERSONAL INFORMATION
1. Gender: Male ( ) Female ( )
2. Age Group:
16 – 30 years ( )
31 – 45 years ( )
46 – 60 years ( )
61 years and above ( )
3. Marital Status:
Married ( ) Single ( ) Divorced ( ) Separated ( ) Widow/ Widower ( )
4. Level of education
Basic ( ) SHS/ Commercial ( ) Diploma ( ) 1st and/or 2
nd Degree
( ) Professional ( ) No formal education ( ) Others ( ) Specify
5. Which of the following informal sector operators do you belong to?
Hairdresser and Beauticians ( ) Dressmakers and Fashion Designers ( ) Artisans (
) Contractors ( ) Food Vendors ( ) General Traders ( )
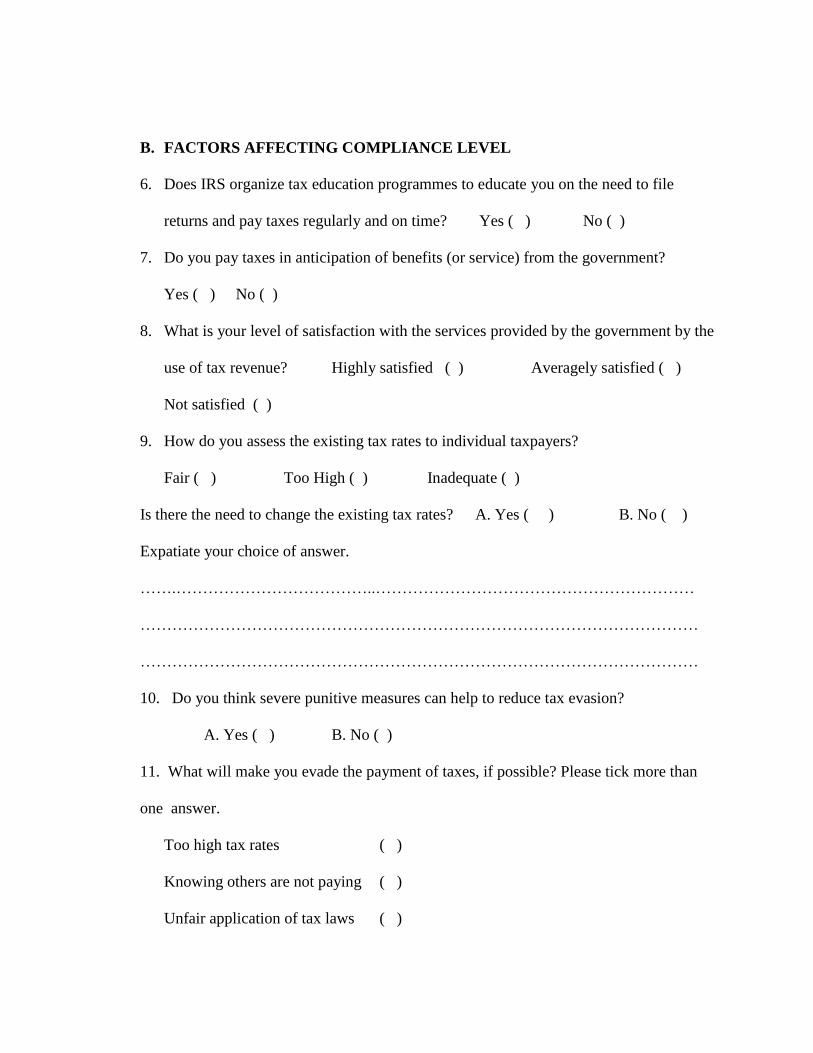
B. FACTORS AFFECTING COMPLIANCE LEVEL
6. Does IRS organize tax education programmes to educate you on the need to file
returns and pay taxes regularly and on time? Yes ( ) No ( )
7. Do you pay taxes in anticipation of benefits (or service) from the government?
Yes ( ) No ( )
8. What is your level of satisfaction with the services provided by the government by the
use of tax revenue? Highly satisfied ( ) Averagely satisfied ( )
Not satisfied ( )
9. How do you assess the existing tax rates to individual taxpayers?
Fair ( ) Too High ( ) Inadequate ( )
Is there the need to change the existing tax rates? A. Yes ( ) B. No ( )
Expatiate your choice of answer.
…….………………………………..……………………………………………………
……………………………………………………………………………………………
……………………………………………………………………………………………
10. Do you think severe punitive measures can help to reduce tax evasion?
A. Yes ( ) B. No ( )
11. What will make you evade the payment of taxes, if possible? Please tick more than
one answer.
Too high tax rates ( )
Knowing others are not paying ( )
Unfair application of tax laws ( )
Mistrust of government for the use of tax revenue ( )
Please, specify if others
……….………………………………………………………………………………...
…………………………………………………………………………………………
……….………………………………………………………………………………...
12. Do you think social sanctions can deter people from evading the payment of taxes?
A. Yes ( ) B. No ( )
13. Do you think individuals‘ participation in decision making process can influence their
level of tax compliance? A. Yes ( ) B. No ( )
Explain your answer
……….………………………………………………………………………………..
…………………………………………………………………………………………
…………………………………………………………………………………………
C. CHALLENGES IN TAX COLLECTION
14. Where do you operate your business from?
Store ( ) Market stall ( ) Table Top ( ) Hawking ( ) Kiosk/Container
( ) Others, specify………………………….
15. How long have you been in your current business?
1 – 5 years ( ) 6 – 10 years ( ) 11 – 15 years ( ) Above 15 years ( )
16. Where did you hear about income tax?
Media (Radio, TV & newspaper) ( )
Friend/Colleague ( )
Brochures ( )
Tax education program by IRS ( )
Have not heard about income tax ( )
17. What is the mode of payment for your goods or services?
Cash ( ) Cheque ( ) Both ( )
18. Do you keep proper records or books for accounting purposes?
A. Yes ( ) B. No ( )
If No, explain
……….………………………………………………………………………………..
…………………………………………………………………………………………
…………………………………………………………………………………………
19. What is your level of knowledge in accounting?
A. Low/Poor ( )
B. Average/Medium ( )
C. High/Very good ( )
20.If low, do you engage the services of an accountant? Yes ( ) No ( )
If no, what is the reason? High service fees ( ) Lack of accountants ( )
Nneed ( )
21. Do you file returns including accounts regularly with IRS?
Yes ( ) No ( )
If No, explain
………………………………………………………………………………
………………………………………………………………………………
………………………………………………………………………………
22. What suggestions can you offer to improve upon tax collection
system?....................................................................................................................
…………………………………………………………………………………….
…………………………………………………………………………………….


![The ILO and the informal sector: an institutional history · on the informal sector¨] [IOE Seminar on the informal sector] ILC debat on "The Dilemma of the Informal Sector" ICLS](https://img.pdfslide.net/doc/110x75/5cb8488988c993af7a8b66d0/the-ilo-and-the-informal-sector-an-institutional-history-on-the-informal-sector.jpg)