Embed Size (px)
Citation preview

“Informal” taxation in Sierra Leone
Samuel Jibao, Wilson Prichard, &
Vanessa van den Boogaard
8 December 2014 ICTD Annual Meeting
Arusha

(1) Background: “Informal” or “real” taxation

(2) Research methods
• Survey of 1129 taxpayers
• In-depth interviews • Focus group discussions


(3) What does the average taxpayer pay in a year?
4.27 taxes
USD 132.64

All taxes
Formal taxes to state actors
Informal taxes to state actors
Informal taxes to chiefs
Informal taxes to non-state actors

“Formal” state taxes
Income tax
Sales tax
Business taxes
Market fees
Local (poll) tax
Property tax
User fees
Other state taxes
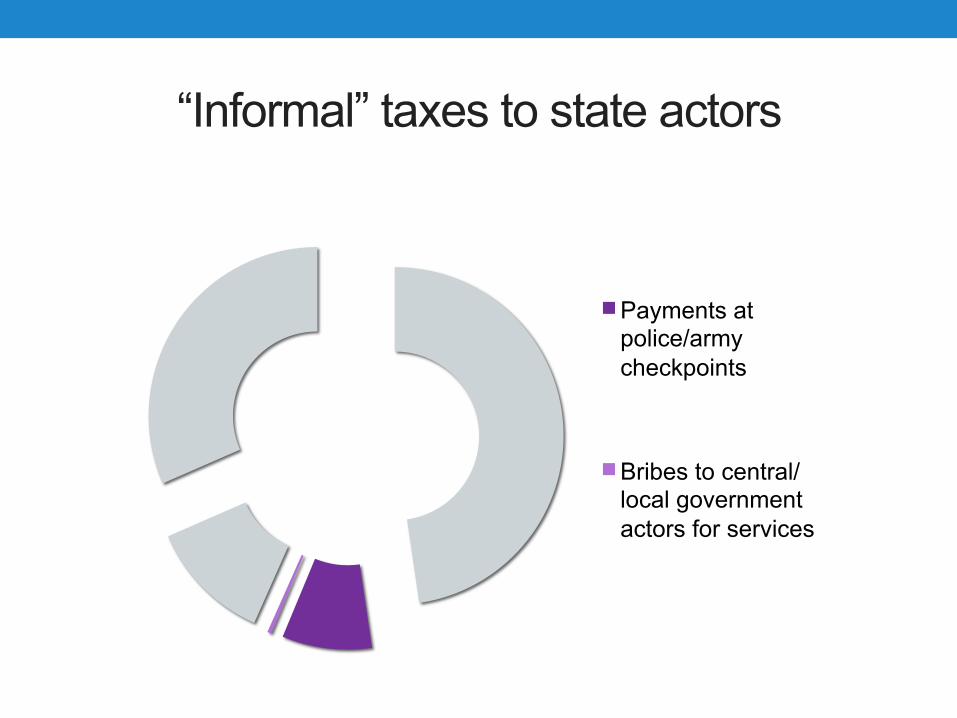
“Informal” taxes to state actors
Payments at police/army checkpoints
Bribes to central/local government actors for services

“Informal” taxes to chiefs
Taxes to chief
Labour payments to chief

Taxes to other non-state actors
Payments to secret societies
Payments to trade/market associations
Payments to religious organizations
Informal user fees to doctors/teachers
Payments to INGOs/CBOs
Community development taxes
Payments to non-state security actors

Impact on taxpayers
0%
25%
50%
75%
100%
Mean proportion of taxpayers that:
Took out a loan in the last year in order to pay a tax
Decided not to engage in a particular economic activity in the least year becauses the taxes were too burdensome

(4) Taxpayer perceptions

Fairness
0%
25%
50%
75%
100%
Central govt taxes (N=154)
Local govt taxes
(N=1492)
Local govt user fees (N=621)
Informal state taxes
(N=266)
Chiefdom taxes
(N=576)
Non-state taxes
(N=980)
By tax type, mean proportion of respondents believing that:
The tax rate is fair
The tax is fairly applied and collected

Fairness
0%
25%
50%
75%
100%
Prop
ortio
n of
taxp
ayer
s
Perceived likely outcomes for non-payment, by tax type
Verbal harassment
Physical harassment
Imprisonment/detainment

Transparency
0%
25%
50%
75%
100%
Central govt taxes
(N=154)
Local govt taxes
(N=1492)
Local govt user fees (N=621)
Informal state taxes
(N=266)
Chiefdom taxes
(N=183)
Non-state taxes
(N=1673)
By tax type, mean proportion of respondents reporting that:
They understand how the tax rate is set
It is easy to find out how revenues from this tax are used

Accountability
0%
20%
40%
60%
80%
100%
Central government
taxes (N=140)
Local government
taxes (N=1436)
Local government
user fees (N=556)
Informal state taxes
(N=257)
Chiefdom taxes
(N=558)
Non-state taxes
(N=1618)
Mean proportion of taxpayers believing that the taxing actor uses tax revenues to benefit the community most, some or
none of the time
Most of the time
Some of the time
None of the time

Accountability
0%
25%
50%
75%
100%
Central government
Disrict government
Chiefdom
Mean proportion of taxpayers believing that the respective level of government would be likely to:
Misuse tax revenues
Steal money intended for a development project

Fiscal exchange
0%
25%
50%
75%
100%
Central govt taxes
(N=147)
Local govt taxes
(N=1461)
Local govt user fees (N=52)
Informal state taxes
(N=256)
Chiefdom taxes
(N=571)
Non-state taxes
(N=1643)
What is the primary good/service you get in return for making this payment?
A specific service/good in the community
Security
Financing salaries & general activites of organization, but not specific services
Avoidance of harassment/stress/hassle
No service

(6) Areas for further research
• Formal and informal taxation & the power of chiefs
• Informal taxation & legacies of conflict

Thank you! Merci beaucoup!
Asante sana!