Embed Size (px)
Citation preview
TAXI NAVIGATION A Runway Safety System
Boerner, Lauren E. {University of Missouri Undergraduate}
Martz, Paige S. {University of Missouri Undergraduate}
Walker, Laura A. {University of Missouri Undergraduate}
Sun, Carlos {PhD, University of Missouri Engineering Advisor}
Executive Summary
Runway safety is vital in airport operations across the world. The Federal Aviation
Administration (FAA) takes great measures to ensure safety and to reduce the frequency of
runway incursions and excursions. To assist in this process, a taxi navigation system (TNav) has
been designed to aid pilots and ground traffic control navigating from the runway to terminals
and vice versa.
TNav uses GPS, transponders, and receivers to locate and display moving aircraft and vehicles
on a handheld, touch screen tablet. The system is easy to operate and includes many functions
that can raise pilot situational awareness. Pilots can choose whether or not to display departing or
arriving aircraft, vehicles, construction zones, hot spots, buildings, and hand drawn routes. TNav
is directed toward larger airports, but can be used at virtually any airport in the world. After
researching existing systems and speaking with many subject matter experts, including airport
commissioners, commercial pilots, air traffic controllers, and airport engineers, TNav has grown
into a practical and cost effective system. After initial release, TNav will use software updates to
continually improve and decrease the risk of obsolescence. In the future, this product may even
be integrated into cockpits.
TNav increases pilot awareness while providing an easy-to-use interface that allows pilots to
navigate through the taxiway. This technology can decrease the burden on the ground traffic
controllers and increase a pilot’s ease of mind. The following report includes a background of
this topic, a detailed technical description of this product, safety risk assessment, cost analysis,
and other FAA requirements.
Table of Contents Problem Statement and Background .................................................................................... 1
Summary of Literature ............................................................................................................. 3
Expert Interactions .................................................................................................................. 11
Problem Solving Approach ................................................................................................... 14
Description of Technical Aspects ...................................................................................... 15
Safety Risk Assessment ......................................................................................................... 24
Projected Impacts ................................................................................................................... 28
Appendices ................................................................................................................................ 31
A) Contact Information .. . . . . . . . . . . . . . . . . . . . . . . . . . . . . . . . . . . . . . . . . . . . . . . . . . . . . . . . . . . . . . . . . . . . . . . . . . . 31
B) University of Missouri Description .. . . . . . . . . . . . . . . . . . . . . . . . . . . . . . . . . . . . . . . . . . . . . . . . . . . . . . 32
C) Non-University Partner Description .. . . . . . . . . . . . . . . . . . . . . . . . . . . . . . . . . . . . . . . . . . . . . . . . . . . . . 33
D) Sign-off Form ... . . . . . . . . . . . . . . . . . . . . . . . . . . . . . . . . . . . . . . . . . . . . . . . . . . . . . . . . . . . . . . . . . . . . . . . . . . . . . . . . . . 34
E) Evaluation of Educational Experience .. . . . . . . . . . . . . . . . . . . . . . . . . . . . . . . . . . . . . . . . . . . . . . . . . . 35
F) Reference List . . . . . . . . . . . . . . . . . . . . . . . . . . . . . . . . . . . . . . . . . . . . . . . . . . . . . . . . . . . . . . . . . . . . . . . . . . . . . . . . . . . . . 39
1 | FAA University Design Competition, TNav, University of Missouri
Problem Statement and Background
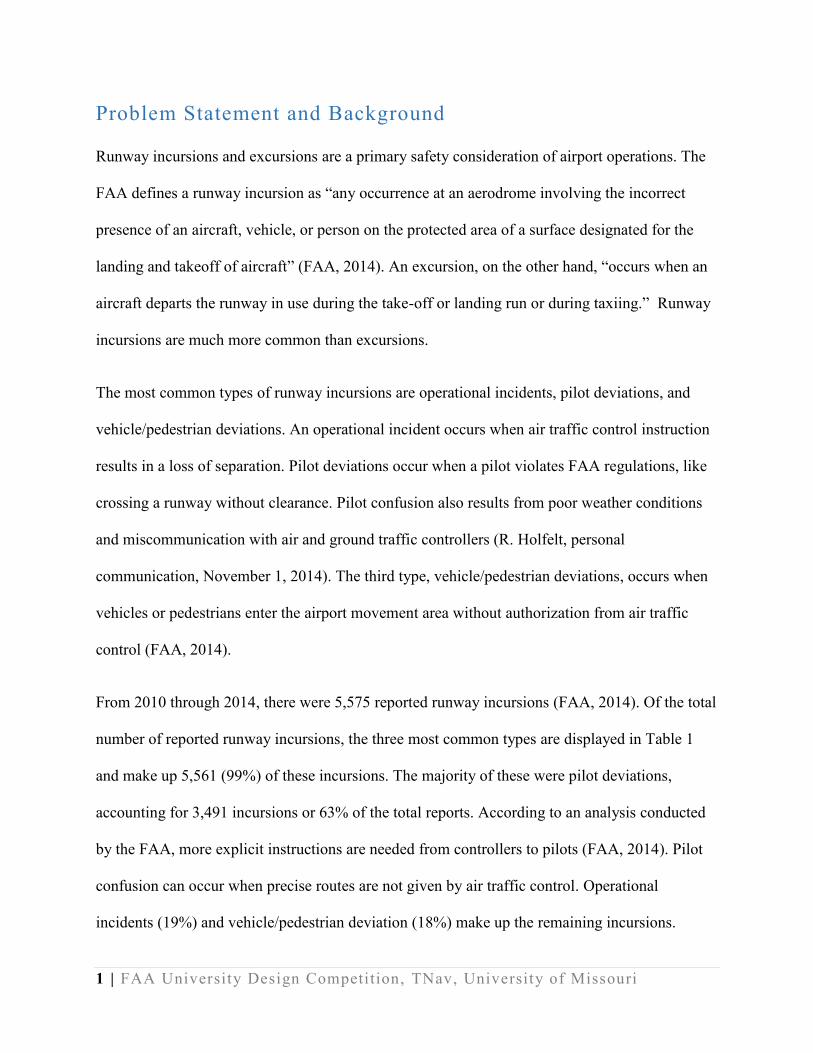
Runway incursions and excursions are a primary safety consideration of airport operations. The
FAA defines a runway incursion as “any occurrence at an aerodrome involving the incorrect
presence of an aircraft, vehicle, or person on the protected area of a surface designated for the
landing and takeoff of aircraft” (FAA, 2014). An excursion, on the other hand, “occurs when an
aircraft departs the runway in use during the take-off or landing run or during taxiing.” Runway
incursions are much more common than excursions.
The most common types of runway incursions are operational incidents, pilot deviations, and
vehicle/pedestrian deviations. An operational incident occurs when air traffic control instruction
results in a loss of separation. Pilot deviations occur when a pilot violates FAA regulations, like
crossing a runway without clearance. Pilot confusion also results from poor weather conditions
and miscommunication with air and ground traffic controllers (R. Holfelt, personal
communication, November 1, 2014). The third type, vehicle/pedestrian deviations, occurs when
vehicles or pedestrians enter the airport movement area without authorization from air traffic
control (FAA, 2014).
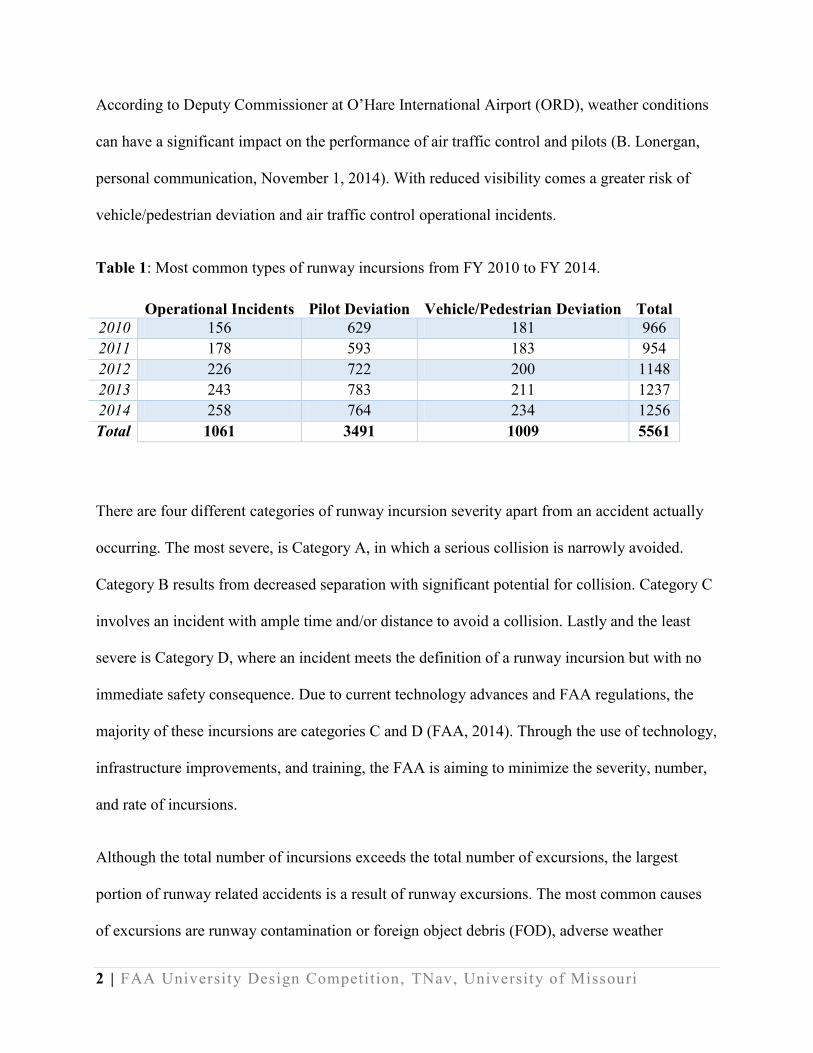
From 2010 through 2014, there were 5,575 reported runway incursions (FAA, 2014). Of the total
number of reported runway incursions, the three most common types are displayed in Table 1
and make up 5,561 (99%) of these incursions. The majority of these were pilot deviations,
accounting for 3,491 incursions or 63% of the total reports. According to an analysis conducted
by the FAA, more explicit instructions are needed from controllers to pilots (FAA, 2014). Pilot
confusion can occur when precise routes are not given by air traffic control. Operational
incidents (19%) and vehicle/pedestrian deviation (18%) make up the remaining incursions.
2 | FAA University Design Competition, TNav, University of Missouri
According to Deputy Commissioner at O’Hare International Airport (ORD), weather conditions
can have a significant impact on the performance of air traffic control and pilots (B. Lonergan,
personal communication, November 1, 2014). With reduced visibility comes a greater risk of
vehicle/pedestrian deviation and air traffic control operational incidents.
Table 1: Most common types of runway incursions from FY 2010 to FY 2014.
Operational Incidents Pilot Deviation Vehicle/Pedestrian Deviation Total
2010 156 629 181 966
2011 178 593 183 954
2012 226 722 200 1148
2013 243 783 211 1237
2014 258 764 234 1256
Total 1061 3491 1009 5561
There are four different categories of runway incursion severity apart from an accident actually
occurring. The most severe, is Category A, in which a serious collision is narrowly avoided.
Category B results from decreased separation with significant potential for collision. Category C
involves an incident with ample time and/or distance to avoid a collision. Lastly and the least
severe is Category D, where an incident meets the definition of a runway incursion but with no
immediate safety consequence. Due to current technology advances and FAA regulations, the
majority of these incursions are categories C and D (FAA, 2014). Through the use of technology,
infrastructure improvements, and training, the FAA is aiming to minimize the severity, number,
and rate of incursions.
Although the total number of incursions exceeds the total number of excursions, the largest
portion of runway related accidents is a result of runway excursions. The most common causes
of excursions are runway contamination or foreign object debris (FOD), adverse weather
3 | FAA University Design Competition, TNav, University of Missouri
conditions, mechanical failure, pilot error, and unstable approaches. Excursions are more
challenging to avoid but can be handled through adequate preparation from airport operations.
For this reason, TNav is designed to aid pilots and air traffic control with incursions. However,
certain functions of TNav are directed toward mitigating excursions such as those caused by
weather conditions and unstable approaches.
It can be quite difficult for pilots to navigate through the airfield, especially at large airports.
TNav is designed to improve the pilot’s situational awareness by locating all aircraft and vehicles
on the airfield while giving the opportunity to create an easy-to-follow route on the taxiway.
These tools give pilots their location relative to others, as well as the capability to avoid route
confusion; therefore, reducing the number of incursions and excursions.
Summary of Literature
Systems including SafeNav, Smart Runway, Airport Navigation System, Jeppesen Mobile Flight
Deck, Aerobahn Surface Management System, and Taxi have been developed by companies to
improve pilot awareness and increase vehicle safety on runways and in the air. The following
sections will provide an overview of the systems and explain how TNav compares to each
system.
Garmin – SafeNav
The Garmin SafeNav (2008) is a GPS and alert system that aids support vehicles at airports to
avoid runway incursions. The system contains diagrams of almost 1,000 United States airports
and contains real-time vehicle tracking with auditory and visual alarms that give a warning when
4 | FAA University Design Competition, TNav, University of Missouri
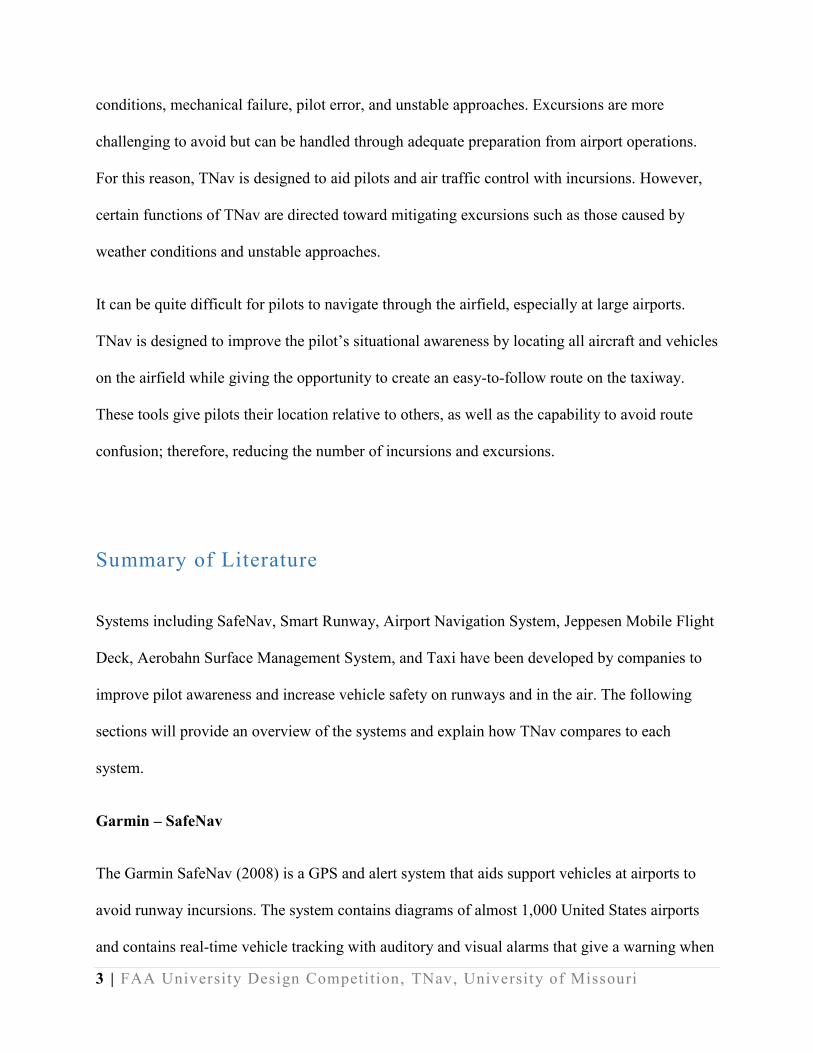
a runway incursion might occur. Drivers may input waypoints into the 4.3 inch wide touch
screen to show locations of higher risk. The SafeNav also includes turn-by-turn navigation that
can direct a driver around the airfield. Figure 1 shows the navigation screen on the Garmin
SafeNav, displaying a runway and nearby taxiways. Even though this device has turn-by-turn
navigation, it is designed for support vehicles and its main objective is to prevent runway
incursions. In contrast, the main focus of TNav is providing real-time locations of other aircrafts
and vehicles as well as displaying the current location of a pilot’s aircraft on the runway.
Figure 1: Garmin SafeNav displaying runways, taxiways, and current location.
Honeywell – SmartRunway
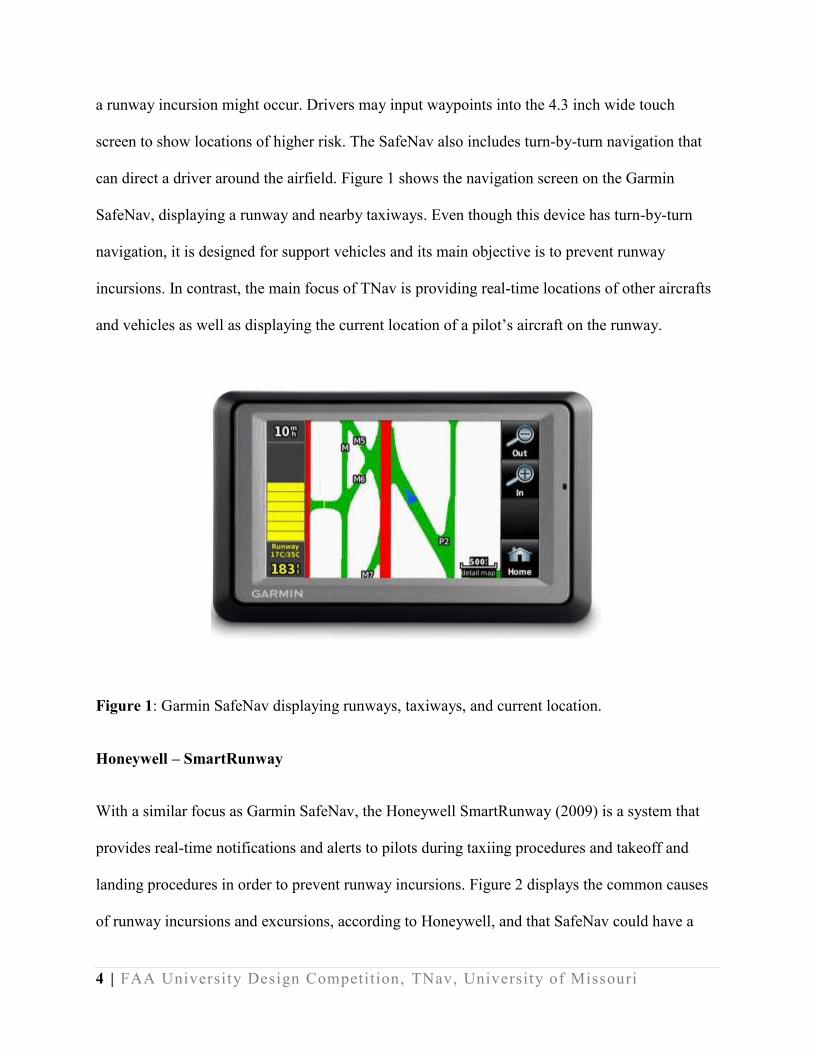
With a similar focus as Garmin SafeNav, the Honeywell SmartRunway (2009) is a system that
provides real-time notifications and alerts to pilots during taxiing procedures and takeoff and
landing procedures in order to prevent runway incursions. Figure 2 displays the common causes
of runway incursions and excursions, according to Honeywell, and that SafeNav could have a
5 | FAA University Design Competition, TNav, University of Missouri
direct impact to 94% of the incursions. The system utilizes Honeywell’s terrain and runway
database which is stated to have been used for over 800 million flight hours, although no
supporting evidence is given. Additionally, it can be used with electronic flight bag (EFB)
solutions, which may be used to improve operational performance by offering more advanced
information, increasing safety, and providing more accurate performance calculations (Boeing.
2014). It can alert flight crews to information such as distance remaining on runway during
takeoff, runway approach, and taxiway takeoffs. The system is different from TNav in that it
does not provide real-time locations of other moving objects to the flight crew.
Figure 2: Common causes of runway incursions and excursions.
Onboard Airport Navigation System
Thales Onboard Airport Navigation System (OANS) provides flight crews with real-time
awareness during airport surface maneuvers (Thales Group, 2011). OANS is promoted both as a
stand-alone unit, similar to TNav, in addition to a unit that can be integrated into the existing
6 | FAA University Design Competition, TNav, University of Missouri
cockpit layout. This system promotes safety and efficiency by providing pilots with the
necessary information to taxi between a gate and a runway. It provides aircraft positions using an
Airport Mapping Database (AMDB) through interactive, geo-referenced maps. OANS’s benefits
include runway incursion prevention, increased situational awareness, and flight crew confidence
during airport surface maneuvers. TNav improves upon existing systems such as OANS by
adding weather capabilities for handling inclement weather conditions.
NextGen
NextGen is a wide-ranged plan to update the national air transportation system (FAA, 2014).
One of the benefits is to prevent collision in the air and on airfields. As a part of this prevention,
Automatic Dependent Surveillance Broadcast, a system that uses GPS satellite signals to provide
information to air traffic controllers and pilots, will be equipped on all air traffic control and
airplane systems. The system will allow pilots to see real-time displays of air traffic. System
Wide Information Management (SWIM) will also increase safety by providing an infrastructure
to allow information to be centralized across the NextGen air transportation operations. The
information at a single airport or within a single control tower can be accessed by other entities
within the network, such as pilots and other airports.
The benefits of NextGen include reduced weather impacts, collaborative air traffic management
due to SWIM, and higher density airports due to real-time displays of air traffic. Despite these
benefits, NextGen only affects in-air operations with little support to flight crews on the ground.
TNav can work within the NextGen framework to add navigation and increased safety benefits
on the ground.
Jeppesen Mobile Flight Deck
7 | FAA University Design Competition, TNav, University of Missouri
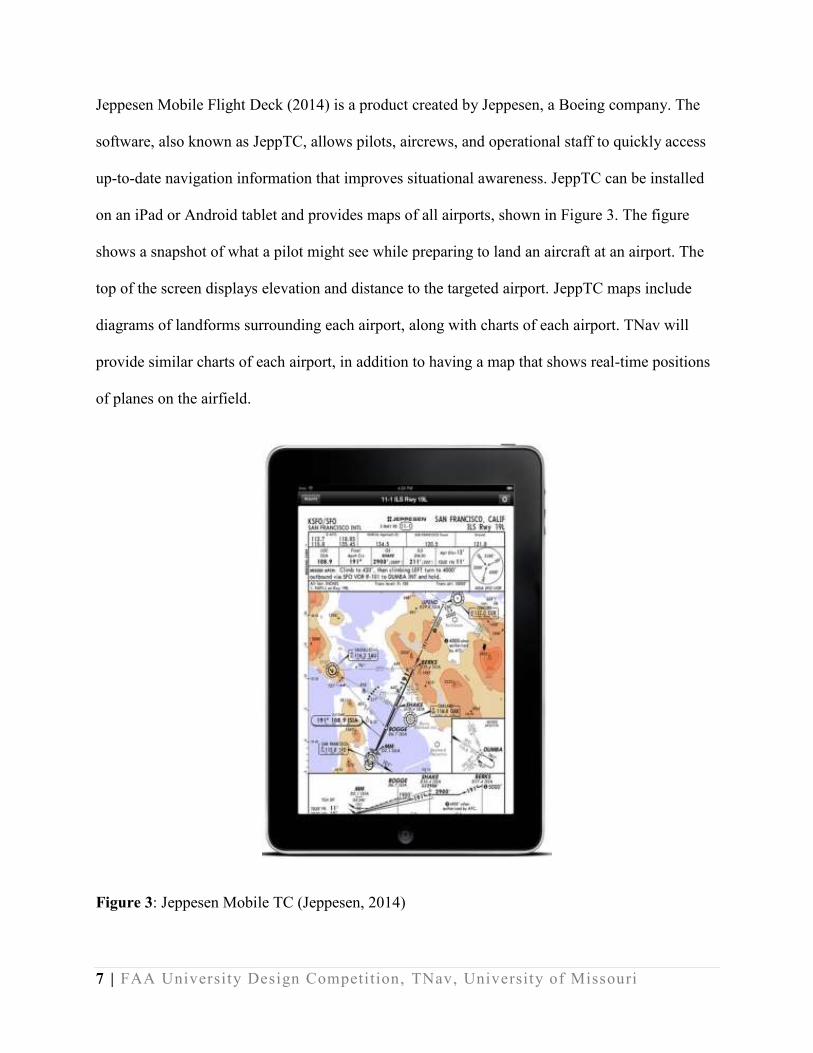
Jeppesen Mobile Flight Deck (2014) is a product created by Jeppesen, a Boeing company. The
software, also known as JeppTC, allows pilots, aircrews, and operational staff to quickly access
up-to-date navigation information that improves situational awareness. JeppTC can be installed
on an iPad or Android tablet and provides maps of all airports, shown in Figure 3. The figure
shows a snapshot of what a pilot might see while preparing to land an aircraft at an airport. The
top of the screen displays elevation and distance to the targeted airport. JeppTC maps include
diagrams of landforms surrounding each airport, along with charts of each airport. TNav will
provide similar charts of each airport, in addition to having a map that shows real-time positions
of planes on the airfield.
Figure 3: Jeppesen Mobile TC (Jeppesen, 2014)
8 | FAA University Design Competition, TNav, University of Missouri
Aerobahn Surface Management System
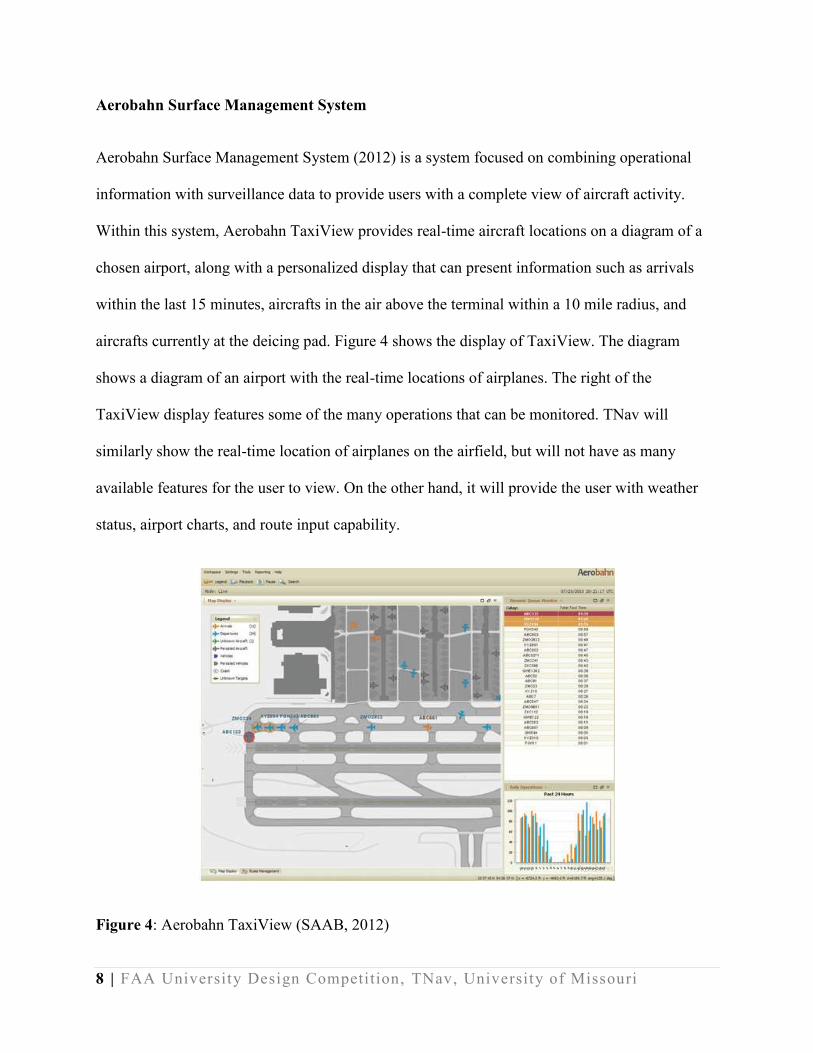
Aerobahn Surface Management System (2012) is a system focused on combining operational
information with surveillance data to provide users with a complete view of aircraft activity.
Within this system, Aerobahn TaxiView provides real-time aircraft locations on a diagram of a
chosen airport, along with a personalized display that can present information such as arrivals
within the last 15 minutes, aircrafts in the air above the terminal within a 10 mile radius, and
aircrafts currently at the deicing pad. Figure 4 shows the display of TaxiView. The diagram
shows a diagram of an airport with the real-time locations of airplanes. The right of the
TaxiView display features some of the many operations that can be monitored. TNav will
similarly show the real-time location of airplanes on the airfield, but will not have as many
available features for the user to view. On the other hand, it will provide the user with weather
status, airport charts, and route input capability.
Figure 4: Aerobahn TaxiView (SAAB, 2012)
9 | FAA University Design Competition, TNav, University of Missouri
iTaxi
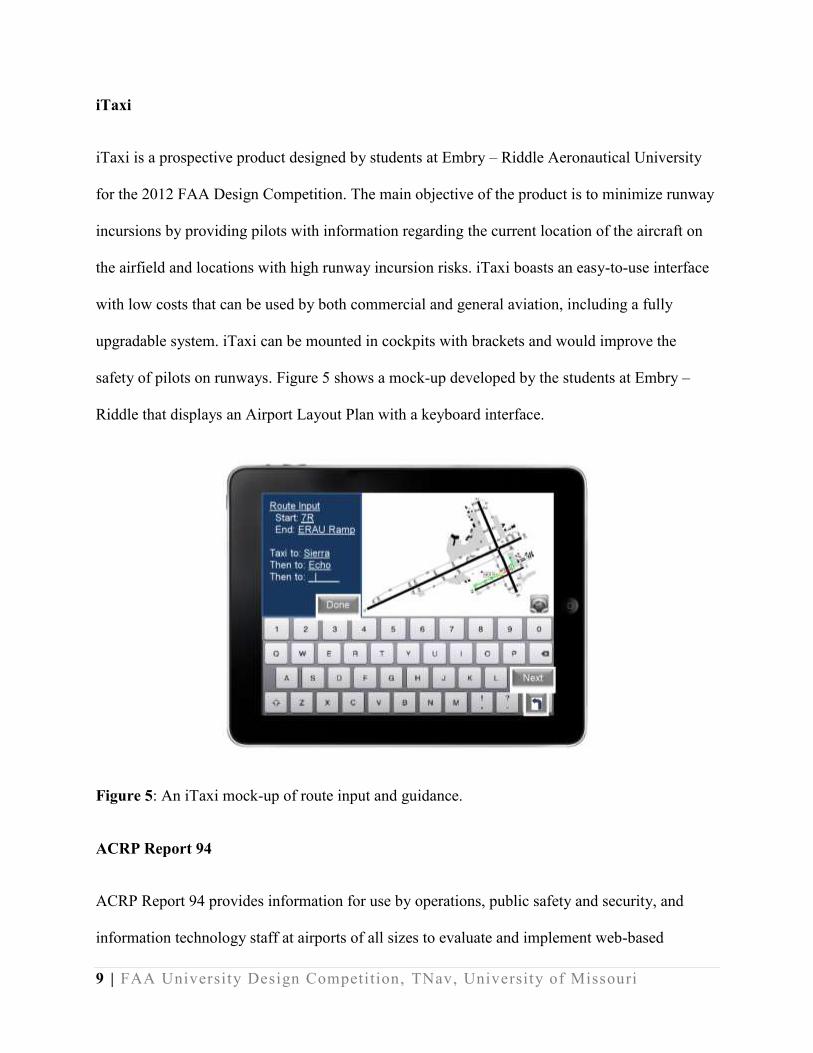
iTaxi is a prospective product designed by students at Embry – Riddle Aeronautical University
for the 2012 FAA Design Competition. The main objective of the product is to minimize runway
incursions by providing pilots with information regarding the current location of the aircraft on
the airfield and locations with high runway incursion risks. iTaxi boasts an easy-to-use interface
with low costs that can be used by both commercial and general aviation, including a fully
upgradable system. iTaxi can be mounted in cockpits with brackets and would improve the
safety of pilots on runways. Figure 5 shows a mock-up developed by the students at Embry –
Riddle that displays an Airport Layout Plan with a keyboard interface.
Figure 5: An iTaxi mock-up of route input and guidance.
ACRP Report 94
ACRP Report 94 provides information for use by operations, public safety and security, and
information technology staff at airports of all sizes to evaluate and implement web-based
10 | FAA University Design Competition, TNav, University of Missouri
collaboration tools that provide a common operating picture for both day-to-day operations and
full emergency response management (IEM et al, 2013). Like TNav, ACRP Report 94 discusses
Web-Based Emergency Management Collaboration Tools (WBEMCT), a set of tools that
collects a large amount of information to facilitate airport operations. ACRP Report 94 uses the
web to gather this information, while TNav uses Global Positioning Systems (GPS) and
Geographic Information Systems (GIS) to do so. The report also has the applicability for other
operations such as weather events, diversions, and security incidents. WBEMCT does not
provide software for this specific purpose, but does create a foundation that can be used for a
ground-based navigation system.
WBEMCT has a common operating picture, or dashboard, that displays scenes, locations, and
events during day-to-day operations and emergency responses. This dashboard integrates data
from GIS, cameras, sensors, and wireless devices. Airport managers can use the dashboard to
update airfield maintenance items, track the effects of inclement weather, view an incident on the
runway, and much more. The ACRP Report 94 includes a “Requirements Matrix” that specifies
software capabilities, map display features, weather, networking, and many more functions of the
introductory system (IEM et al, 2013). There are two enhanced feature levels of a WBEMCT.
Level 1 includes the unique airport dashboard with emergency management integration while
Level 2 includes GIS maps, GPS tracking for vehicles, GPS/transponder tracking for aircraft,
social media tools, and many more features.
TNav will follow a system similar to a Level 2 WBEMCT. It will collect information from GIS
maps and GPS to form a ground-based navigation system useful for pilots. Pilots can also use
this system to communicate with ground traffic control for direction or emergencies. ACRP
11 | FAA University Design Competition, TNav, University of Missouri
Report 94 includes specifications in the “Requirements Matrix” of the WBEMCT that is useful
for TNav (IEM et al, 2013).
Expert Interactions
In order to gain insights into the use of navigation systems in daily operations at airports from
the point of view of pilots and operations staff, experts were interviewed in person at the
Chicago O’Hare International Airport, at the University of Missouri Airport Engineering guest
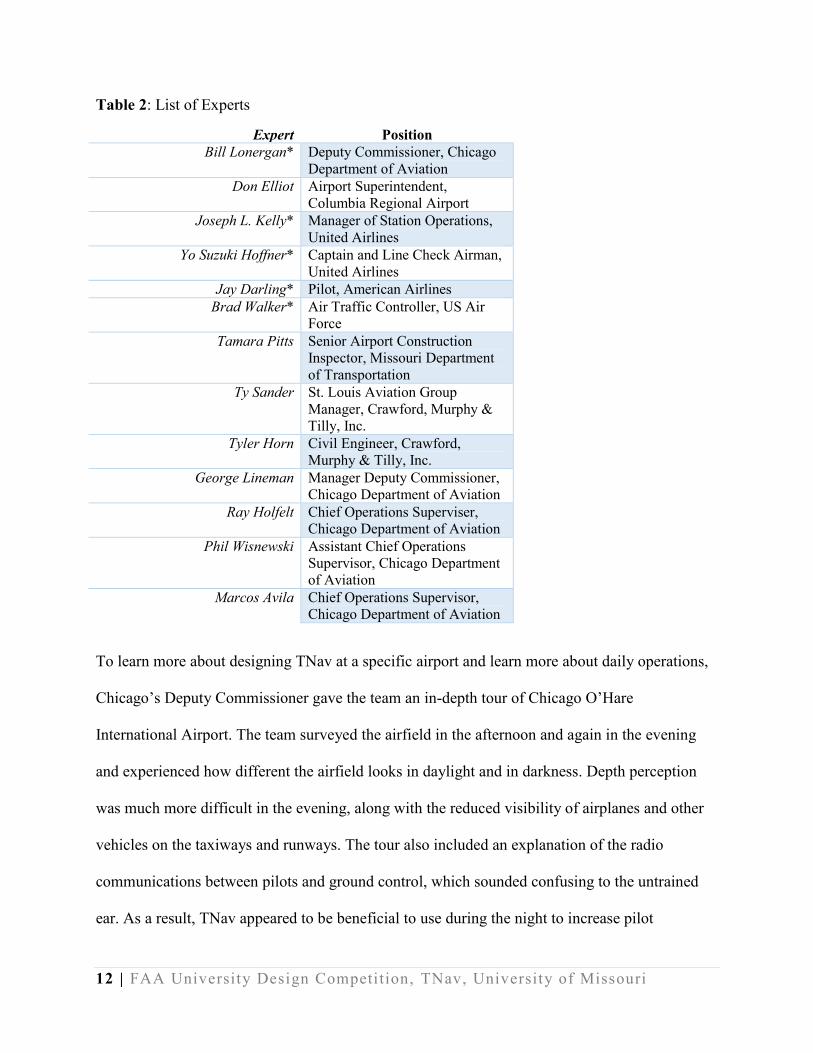
lectures, during airport tours, and through telephone conferences. Table 2 shows a list of 13
experts that were contacted about questions related to designing TNav. In the table, the experts
with asterisks by their names were talked to in great detail.
The team scheduled a conference call with five experts working in the Chicago Department of
Aviation. The experts expressed that were too many variables with the initial TNav design, like
weather, snow removal, rubble, and the configuration of runways, to create a turn-by-turn
navigation system. From this discussion, the team changed TNav from a turn-by-turn navigation
device to providing maps with real-time locations of all aircrafts on the airfield. The TNav
device would supplement the directions of ground control by allowing pilots to draw taxiing
routes on the map.
12 | FAA University Design Competition, TNav, University of Missouri
Table 2: List of Experts
Expert Position
Bill Lonergan* Deputy Commissioner, Chicago
Department of Aviation
Don Elliot Airport Superintendent,
Columbia Regional Airport
Joseph L. Kelly* Manager of Station Operations,
United Airlines
Yo Suzuki Hoffner* Captain and Line Check Airman,
United Airlines
Jay Darling* Pilot, American Airlines
Brad Walker* Air Traffic Controller, US Air
Force
Tamara Pitts Senior Airport Construction
Inspector, Missouri Department
of Transportation
Ty Sander St. Louis Aviation Group
Manager, Crawford, Murphy &
Tilly, Inc.
Tyler Horn Civil Engineer, Crawford,
Murphy & Tilly, Inc.
George Lineman Manager Deputy Commissioner,
Chicago Department of Aviation
Ray Holfelt Chief Operations Superviser,
Chicago Department of Aviation
Phil Wisnewski Assistant Chief Operations
Supervisor, Chicago Department
of Aviation
Marcos Avila Chief Operations Supervisor,
Chicago Department of Aviation
To learn more about designing TNav at a specific airport and learn more about daily operations,
Chicago’s Deputy Commissioner gave the team an in-depth tour of Chicago O’Hare
International Airport. The team surveyed the airfield in the afternoon and again in the evening
and experienced how different the airfield looks in daylight and in darkness. Depth perception
was much more difficult in the evening, along with the reduced visibility of airplanes and other
vehicles on the taxiways and runways. The tour also included an explanation of the radio
communications between pilots and ground control, which sounded confusing to the untrained
ear. As a result, TNav appeared to be beneficial to use during the night to increase pilot
13 | FAA University Design Competition, TNav, University of Missouri
awareness of nearby airplanes and vehicles. O’Hare officials also confirmed TNav could be used
to plot the taxiing path ground control relays to pilots.
The Manager of Station Operations for United Airlines introduced the team to Aerobahn and
discussed how United Airlines station operations personnel used Aerobahn to locate airplanes on
the airfield. The program was also used to track the number of airplanes landing and taking off.
The team learned that in order to keep an airport running efficiently, it is important to ensure that
just as many planes take off as planes that land.
Through the interview with an American Airlines pilot, the team learned about JeppTC and how
pilots could use the iPad app to draw the taxi route between runway and gate given by ground
control. The pilot felt that a turn-by-turn navigation system would not be feasible, since pilots
should be aware of their surroundings and should not rely on a program for directions.
The captain and line check airman for United Airlines, agreed with the American Airlines pilot
regarding the interest in a turn-by-turn navigation system. He felt that the simple use of visual
awareness should not be replaced. The captain also described how non-native pilots to the US
had trouble understanding directions given by ground control because of a language barrier. The
team decided TNav would provide foreign pilots with a chart to help them visualize the layout of
the taxiways and runways.
An air traffic controller, an airport inspector, and airport design engineers were asked about the
feasibility of TNav and necessary technological components, and helped to evolve TNav’s
design. Specifically, the air traffic controller answered questions about transponders and
receivers, along with suggesting the initial TNav idea.
14 | FAA University Design Competition, TNav, University of Missouri
The team also toured Columbia Regional Airport (COU) which allowed the team to gain insights
into the operations of a smaller primary airport. COU’s superintendent expressed that TNav
could be useful to pilots using smaller airports, because it would show the real-time location and
information at the airport to aid in pilot decision making. The team gained insights about the
operations of a smaller airport in comparison to a much larger airport. With only two runways
and relatively few daily commercial enplanements, COU’s ground control have more time to
direct pilots to the appointed gate.
Interactions with experts changed the TNav’s design such as eliminating turn-by-turn navigation,
and provided information on the comparison of small and large airports, and the daily operations
of airports. Experts felt that turn-by-turn navigation was not viable in operating an airplane when
visual awareness was the most important way to maintain safety. Airport operators were in
agreement with this for larger airports because there were too many variables, such as weather,
debris, and runway configurations, that could reduce the effectiveness of turn-by-turn navigation.
While larger airports have more changing variables and more design complexity, the team
determined that TNav would be a more viable option for larger airports because of the larger
number of runways and taxiways in addition to the rapid directions given by ground control.
Based on the expert interactions, the team also determined that TNav would be effective in
aiding pilots during times of low visibility.
Problem Solving Approach
Initially, TNav was designed to operate as a GPS navigation system that gave pilots specific
routes and turn-by-turn directions between the gate and runway in order to reduce the need for
15 | FAA University Design Competition, TNav, University of Missouri
constant ground control communications. Experts at smaller airports thought this idea was
viable; however, a discussion with airport operation experts at Chicago O’Hare International
Airport revealed too many variables are involved in airport operations for a set path to be reliable
(B. Lonergan, personal communication, November 1, 2014). An improved design integrates the
capabilities of programs like Jeppesen and Aerobahn. To service users at both small and large
airports, TNav also functions as a system that allows pilots to easily draw and input routes on the
map from traffic control.
After researching existing systems, TNav’s design is most useful to pilots operating on a tablet as
opposed to integration directly in the cockpit. A touch screen tablet will allow easier utilization
of maps and locations of planes during movement on the ground. Pilots can choose to view the
full airport or zoom-in to see specific areas of the airport with different layers selected. Pilots can
view all or certain layers on the display as needed during movement. Furthermore, a tablet will
allow pilots to view the maps and charts in the plane or terminal. United Airlines captain pointed
out that many pilots view the destination airport or weather conditions around the planned route
ahead of time (Y. S. Hoffner, personal communication, November 1, 2014).
Description of Technical Aspects
TNav is targeted towards general aviation and commercial pilots, principally to be used at larger
airports. The product will allow pilots to view their location on the airfield as well as the location
of other planes and vehicles. Taxiways and runways are labeled and indicated with different
colors on the map, making it easier for pilots to follow the directions given by ground control.
16 | FAA University Design Competition, TNav, University of Missouri
TNav contains a receiver and decoder to receive the location information from all airplane
transponders within a 10 mile radius. A 10 mile radius covers the size of most airports and is a
size limitation by the hardware chosen (B. Walker, personal communication, November 11,
2014). Displaying a larger radius would require more expensive hardware. A receiver is designed
to pick up the location signals emitted from transponders installed in airplanes. The decoder will
then convert the information collected by the receiver and transmit it to the software program
that will place the information in a format that can be accessed by the overlying program. While
the transponders are used to locate other aircraft and vehicles, GPS is used to place these points
on a map, as well as the pilot’s own location. Additionally, TNav is Wi-Fi capable from the
aircraft for current weather conditions and map updates.
The system’s hardware is designed to be reasonably sized and user friendly. TNav uses a tablet
PC containing a capacitive touch screen with a 10” screen size and a ¼” frame. A tablet is useful
for pilots to view the charts on the aircraft and inside of the terminal waiting to board the plane.
The size of the tablet is slightly smaller than a notebook and will fit in most bags a pilot will
carry on the plane. The size and touch screen make viewing the maps convenient without
compromising any details of airport charts or the GPS. Many pilots already use tablets to view
airport charts and understand how to use touch screen devices.
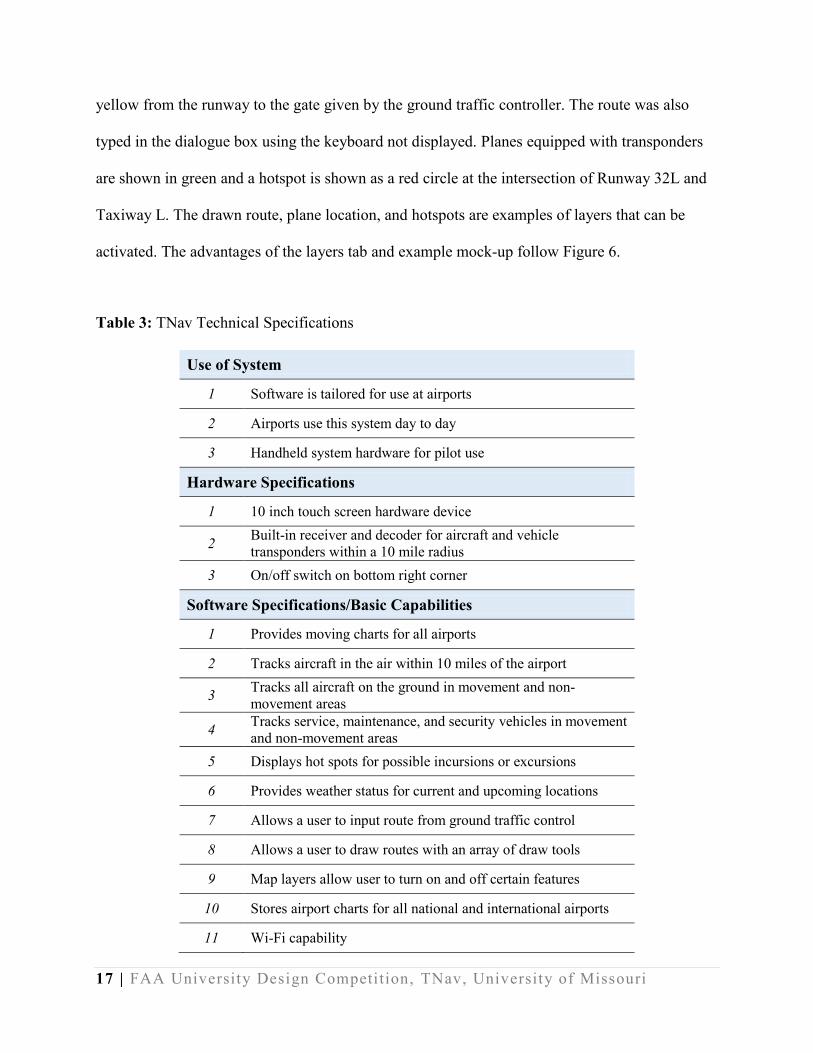
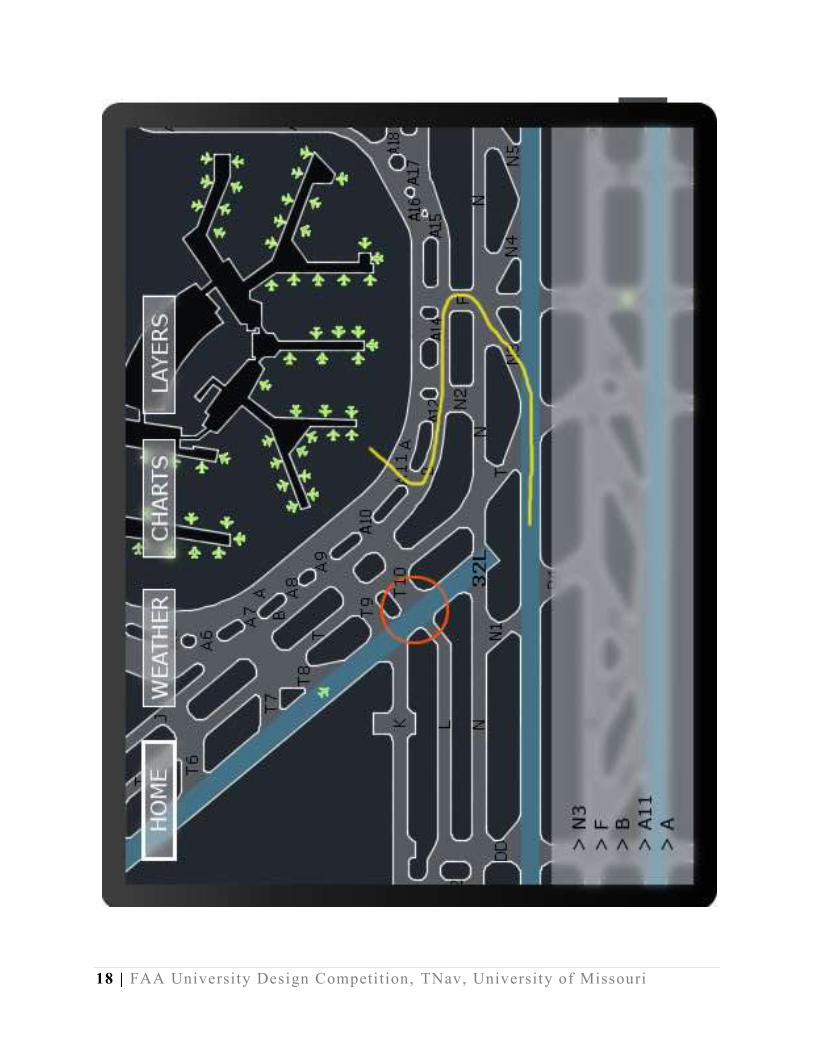
Table 3 displays the technical aspects of TNav’s hardware and software. There is a small on/off
switch on the bottom right corner as specified in Table 3. TNav does not have sound capabilities,
and therefore does not have an earphone jack or speakers. Built within the hardware is a GPS
system and a receiver. Figure 6 shows a life size mock-up of the hardware displaying the home
screen with specific layers activated. The submenus for weather, charts, and layers are accessed
via the buttons at the top. In this example, the pilot has chosen to draw the route shown in
17 | FAA University Design Competition, TNav, University of Missouri
yellow from the runway to the gate given by the ground traffic controller. The route was also
typed in the dialogue box using the keyboard not displayed. Planes equipped with transponders
are shown in green and a hotspot is shown as a red circle at the intersection of Runway 32L and
Taxiway L. The drawn route, plane location, and hotspots are examples of layers that can be
activated. The advantages of the layers tab and example mock-up follow Figure 6.
Table 3: TNav Technical Specifications
Use of System
1 Software is tailored for use at airports
2 Airports use this system day to day
3 Handheld system hardware for pilot use
Hardware Specifications
1 10 inch touch screen hardware device
2 Built-in receiver and decoder for aircraft and vehicle
transponders within a 10 mile radius
3 On/off switch on bottom right corner
Software Specifications/Basic Capabilities
1 Provides moving charts for all airports
2 Tracks aircraft in the air within 10 miles of the airport
3 Tracks all aircraft on the ground in movement and non-
movement areas
4 Tracks service, maintenance, and security vehicles in movement
and non-movement areas
5 Displays hot spots for possible incursions or excursions
6 Provides weather status for current and upcoming locations
7 Allows a user to input route from ground traffic control
8 Allows a user to draw routes with an array of draw tools
9 Map layers allow user to turn on and off certain features
10 Stores airport charts for all national and international airports
11 Wi-Fi capability
18 | FAA University Design Competition, TNav, University of Missouri
19 | FAA University Design Competition, TNav, University of Missouri
Figure 6: Life-size mockup of TNav hardware, displaying the input screen and drawn route.
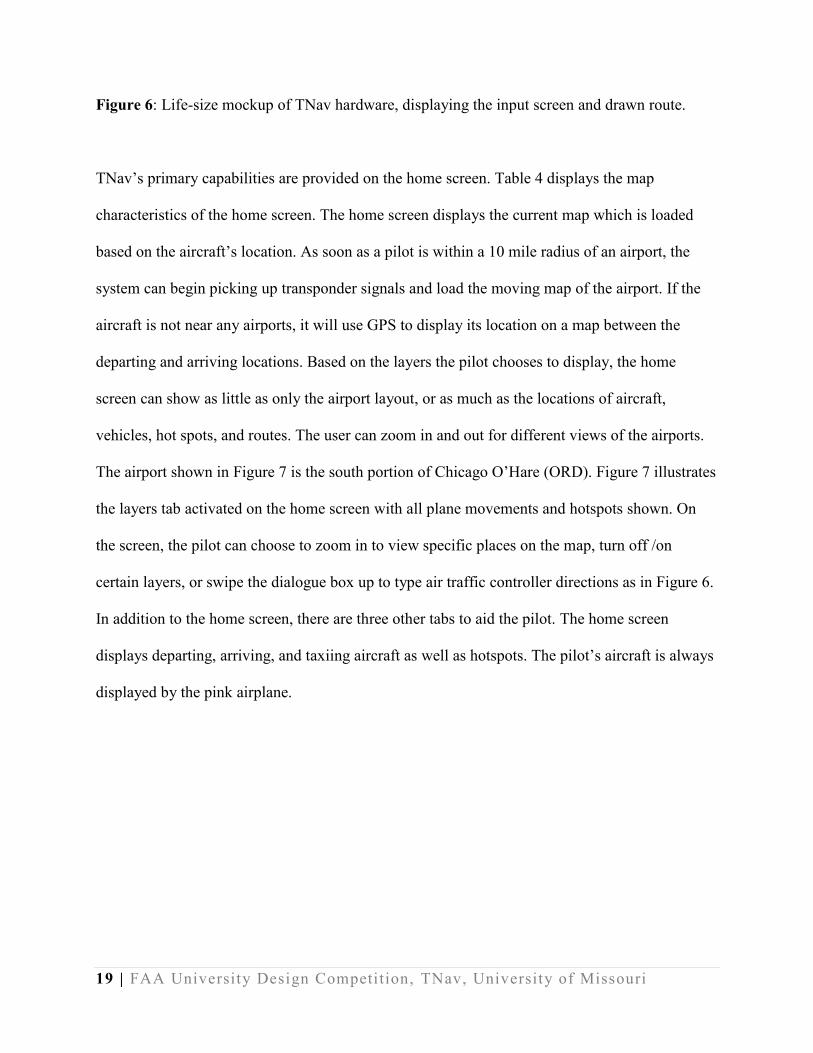
TNav’s primary capabilities are provided on the home screen. Table 4 displays the map
characteristics of the home screen. The home screen displays the current map which is loaded
based on the aircraft’s location. As soon as a pilot is within a 10 mile radius of an airport, the
system can begin picking up transponder signals and load the moving map of the airport. If the
aircraft is not near any airports, it will use GPS to display its location on a map between the
departing and arriving locations. Based on the layers the pilot chooses to display, the home
screen can show as little as only the airport layout, or as much as the locations of aircraft,
vehicles, hot spots, and routes. The user can zoom in and out for different views of the airports.
The airport shown in Figure 7 is the south portion of Chicago O’Hare (ORD). Figure 7 illustrates
the layers tab activated on the home screen with all plane movements and hotspots shown. On
the screen, the pilot can choose to zoom in to view specific places on the map, turn off /on
certain layers, or swipe the dialogue box up to type air traffic controller directions as in Figure 6.
In addition to the home screen, there are three other tabs to aid the pilot. The home screen
displays departing, arriving, and taxiing aircraft as well as hotspots. The pilot’s aircraft is always
displayed by the pink airplane.
20 | FAA University Design Competition, TNav, University of Missouri
Figure 7: Home screen with layers tab activated.
The top of the screen displays the tabs used to navigate from the home screen to weather, charts,
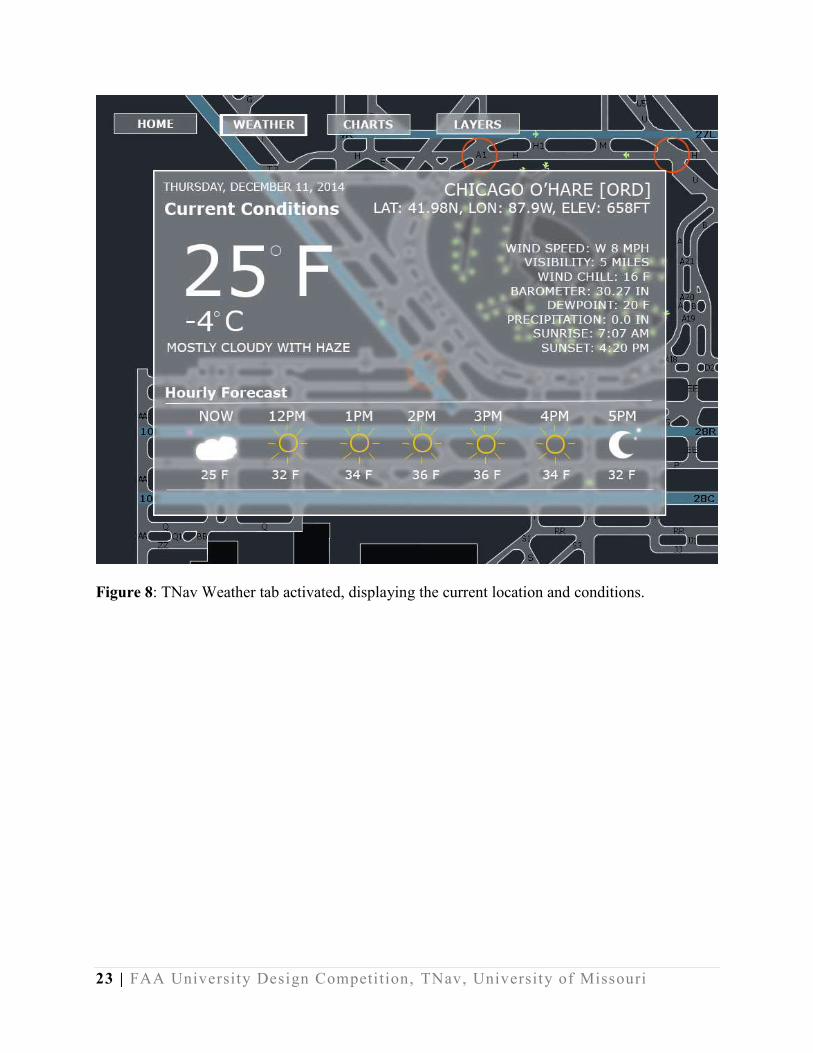
and layers. Table 4 also displays the characteristics for these tabs. The weather tab displays the
current weather conditions at the airport, including weather forecast, temperature, chance of rain,
and wind. The user can also search for weather conditions from other airports using Wi-Fi
capability. Figure 8 shows the weather tab activated. Current conditions are displayed in the
largest font for easier viewing. The user can swipe to the right over the hourly forecast bar to see
up to 24 hourly forecasts. The right side of the screen displays the current airport and IATA
code, geographic coordinates, elevation, and other weather information useful to the pilot. The
21 | FAA University Design Competition, TNav, University of Missouri
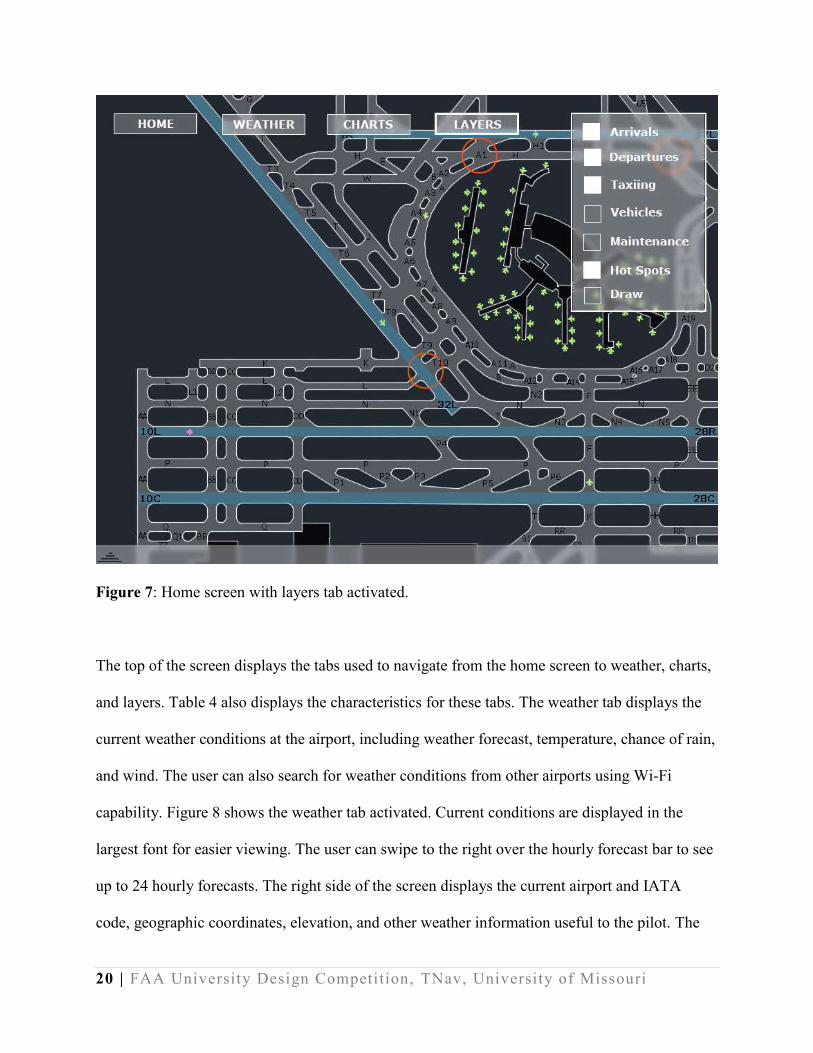
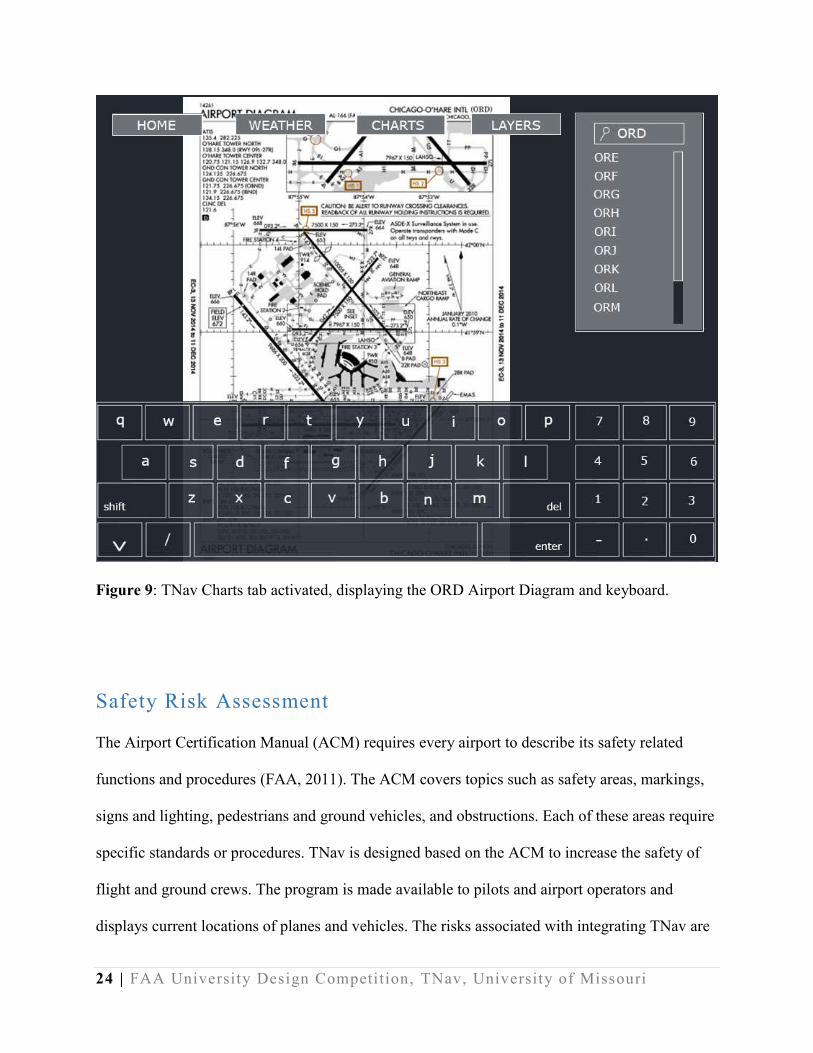
chart tab allows the user to search for standard airport charts anywhere in the world. This feature
does not require GPS or receivers; it simply loads airport charts already stored in the device.
Figure 9 displays the activated chart tab. Once the charts tab is selected, a keyboard and search
bar pop up as shown in Figure 9. A standard keyboard was simplified since only certain keys are
needed to search for airports or type in directions in the dialogue box. The search can be initiated
by typing all or part of the IATA code or typing the full name of the airport. The airport chart
selected can also be zoomed in to view certain areas of the airport. The layers tab pulls up a side
bar from which the user can select or deselect specific layers on the home screen. Within the
layers tab, there are seven layers specified in Table 4. The user can hide this tab to view the
airport on the full screen, but still have the layers activated. At the bottom of the screen, the user
can swipe up to display the route box where pilots can input routes given by ground traffic
control.
Table 4: TNav Tab Characteristics
Map Display/Home Screen
1 Displays airport layout (no layers) including signage and gates
2 Two finger zoom in/out
3 Center on double-tap
4 Displays layers specified in the layers tab
5 Allows pilots to copy down routes easily with full keyboard
6 Displays input route from pilot and ground traffic control
Weather
1 Displays current location weather conditions
2 Provides temperature, chance of rain, and wind
direction/intensity
3 Provides future hourly conditions at current location
22 | FAA University Design Competition, TNav, University of Missouri
4 Allows user to search for conditions at other airports
Charts
1 Stored airport charts for pilots to use when not at that location
2 Touch screen keyboard for searching
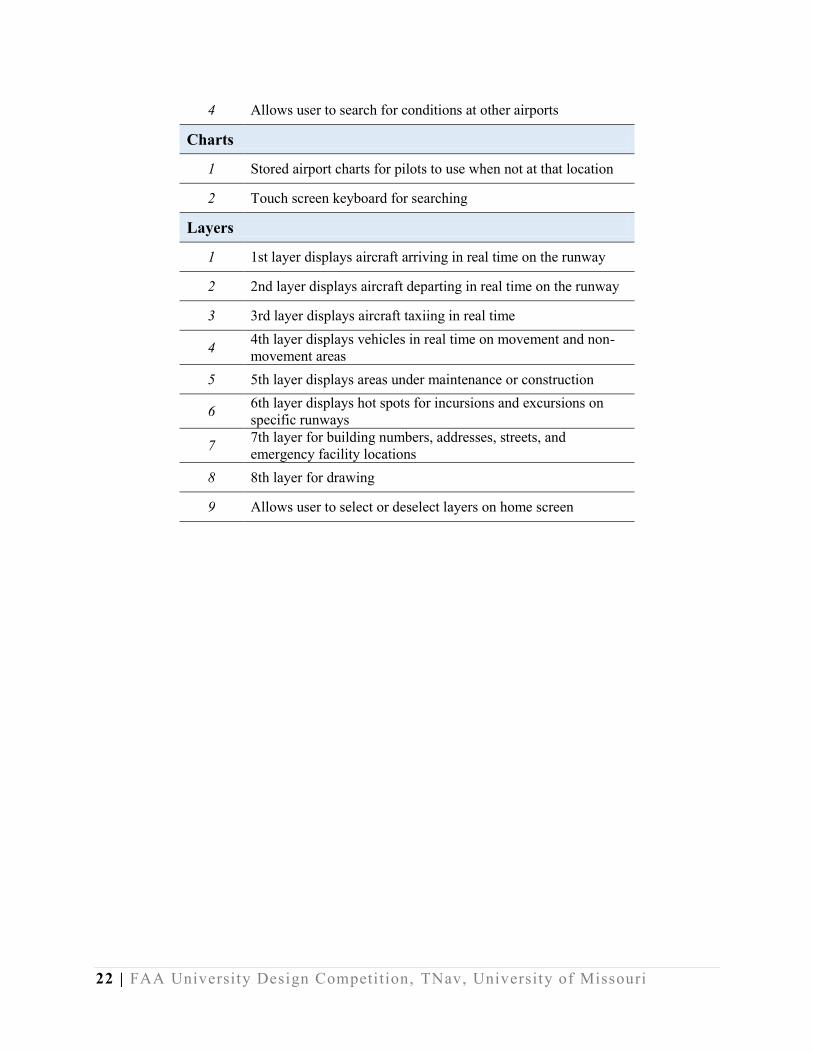
Layers
1 1st layer displays aircraft arriving in real time on the runway
2 2nd layer displays aircraft departing in real time on the runway
3 3rd layer displays aircraft taxiing in real time
4 4th layer displays vehicles in real time on movement and non-
movement areas
5 5th layer displays areas under maintenance or construction
6 6th layer displays hot spots for incursions and excursions on
specific runways
7 7th layer for building numbers, addresses, streets, and
emergency facility locations
8 8th layer for drawing
9 Allows user to select or deselect layers on home screen
23 | FAA University Design Competition, TNav, University of Missouri
Figure 8: TNav Weather tab activated, displaying the current location and conditions.
24 | FAA University Design Competition, TNav, University of Missouri
Figure 9: TNav Charts tab activated, displaying the ORD Airport Diagram and keyboard.
Safety Risk Assessment
The Airport Certification Manual (ACM) requires every airport to describe its safety related
functions and procedures (FAA, 2011). The ACM covers topics such as safety areas, markings,
signs and lighting, pedestrians and ground vehicles, and obstructions. Each of these areas require
specific standards or procedures. TNav is designed based on the ACM to increase the safety of
flight and ground crews. The program is made available to pilots and airport operators and
displays current locations of planes and vehicles. The risks associated with integrating TNav are
25 | FAA University Design Competition, TNav, University of Missouri
analyzed using the five steps of the Safety Risk Management (SRM) section found in both the
ACM and FAA Safety Management System Manual (SMS).
TNav is evaluated using the SRM to uncover safety risks. Evaluations are based on issues related
to the TNav user interface and problems that surfaced in other similar programs currently
available. These hazards are listed in order of decreasing severity beginning with human errors
such as incorrect data entry, lack of situation awareness, inaccurate or dated maps, hardware
malfunction, poor GPS signal, transponder malfunction, and power loss, being the least severe.
In general, most hazards are related to human error during operations or to technical challenges.
Identifying and assessing hazards and determining the likelihood of these hazards aids in
avoiding accidents.
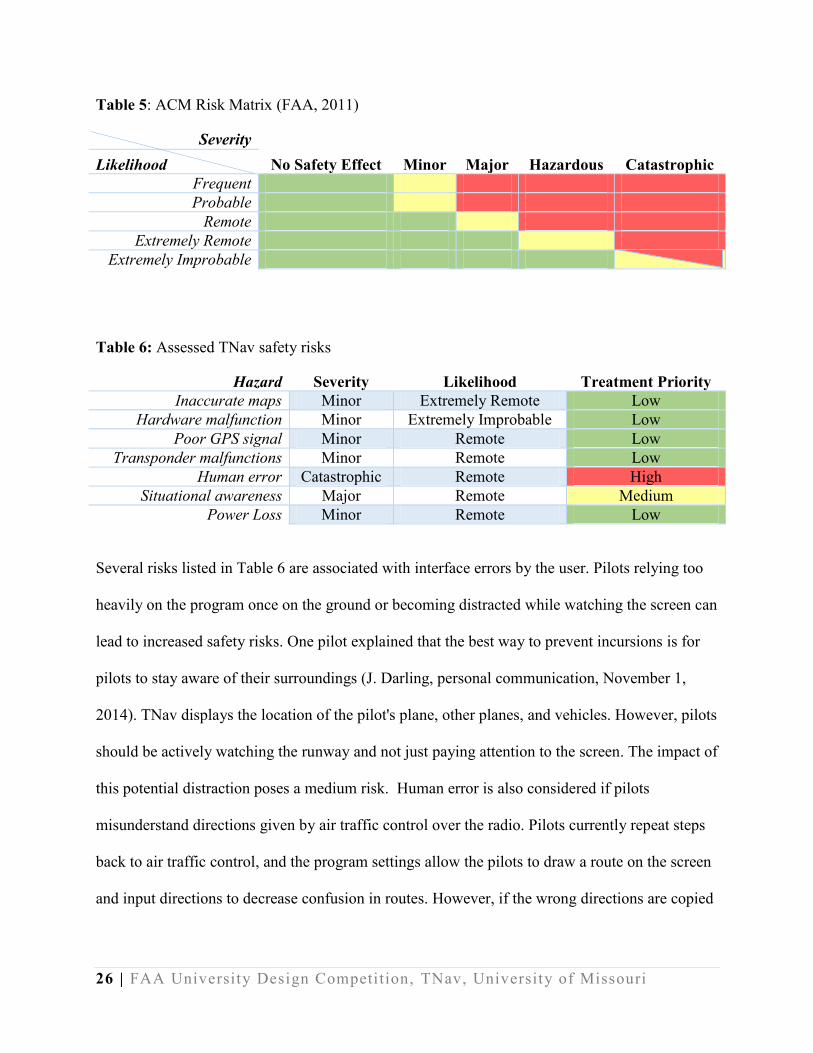
In relation to hazards, risk is the impact of hazards, so risk assessment is the process of
identifying hazards and evaluating the risk associated with the hazard. Table 5 displays the risk
matrix that prioritizes the treatment of risks. The table is divided by severity and likelihood.
Severity is listed across the top where occurrences can either have no safety effect, minor, major,
hazardous, or catastrophic effect on operations. The probability of a risk occurring is measured
down the side of the table from frequent to extremely improbable. The area shown in green is
defined as a low risk occurrence. Yellow is medium risk, while red is high risk. Table 6 lists the
hazards matched with the severity and likelihood according to the risk matrix.
26 | FAA University Design Competition, TNav, University of Missouri
Table 5: ACM Risk Matrix (FAA, 2011)
Severity
No Safety Effect Minor Major Hazardous Catastrophic Likelihood
Frequent
Probable
Remote
Extremely Remote
Extremely Improbable
Table 6: Assessed TNav safety risks
Hazard Severity Likelihood Treatment Priority
Inaccurate maps Minor Extremely Remote Low
Hardware malfunction Minor Extremely Improbable Low
Poor GPS signal Minor Remote Low
Transponder malfunctions Minor Remote Low
Human error Catastrophic Remote High
Situational awareness Major Remote Medium
Power Loss Minor Remote Low
Several risks listed in Table 6 are associated with interface errors by the user. Pilots relying too
heavily on the program once on the ground or becoming distracted while watching the screen can
lead to increased safety risks. One pilot explained that the best way to prevent incursions is for
pilots to stay aware of their surroundings (J. Darling, personal communication, November 1,
2014). TNav displays the location of the pilot's plane, other planes, and vehicles. However, pilots
should be actively watching the runway and not just paying attention to the screen. The impact of
this potential distraction poses a medium risk. Human error is also considered if pilots
misunderstand directions given by air traffic control over the radio. Pilots currently repeat steps
back to air traffic control, and the program settings allow the pilots to draw a route on the screen
and input directions to decrease confusion in routes. However, if the wrong directions are copied
27 | FAA University Design Competition, TNav, University of Missouri
down by the pilot, then this puts the pilot under high risk. Unfamiliarity with program functions
and human errors impact the safety of TNav in ground navigation.
Safety risks due to technology used in planes, such as GPS or software, account for the
remaining hazards. Pilots use maps and data layers to aid navigation from the runway to the gate.
If the maps are inaccurate, then directions given by air traffic control may lead to confusion and
possibly wrong turns, increasing the risk of an incursion or excursion. Inaccurate maps are a low
risk, especially if the software is continuously updated. Additionally, malfunctioning hardware
and software can cause difficulty in retrieving maps from the data base and might distract the
pilot while operating the airplane. Likewise, glitches in transponders may result in failure to
detect aircraft in close proximity or show false points on the display. Finally, if a plane loses
power or cannot find a GPS signal, TNav becomes limited until both are restored. At this point
pilots can only rely on markings and signs, lighting, and orders given by ground traffic control.
Safety risks as a result of technological errors pose less of a risk since the probability is smaller
compared to human error. It should be emphasized that TNav is a supplemental system, and even
if it is not operational; pilots can still rely on mandatory procedures and communications with
ground traffic control.
The safe operation of TNav relies on the ability of pilots to interact with the interface quickly
and effectively. The increased efficiency in human and interface interactions can help mitigate
the hazards described previously. Many pilots already use iPads to view maps in-flight, so the
transition to the TNav interface will be familiar. Additionally, pilots will be shown briefly on the
screen a notice at power up to maintain attention to the environment outside of the cockpit. An
alert will also appear when the maps need to be updated. These notices will improve situational
awareness and remind users to update maps.
28 | FAA University Design Competition, TNav, University of Missouri
Projected Impacts
TNav improves the efficiency and safety of the airport system by providing real-time airplane
locations on airport maps from all over the world. The product enhances pilot awareness of
airfield environments, increasing safety. Also, by allowing pilots to view and draw on a map of
an airfield, following taxiing directions from ground control becomes easier. Thus airport
efficiency is increased by minimizing the time aircrafts spend on the runway and taxiways.
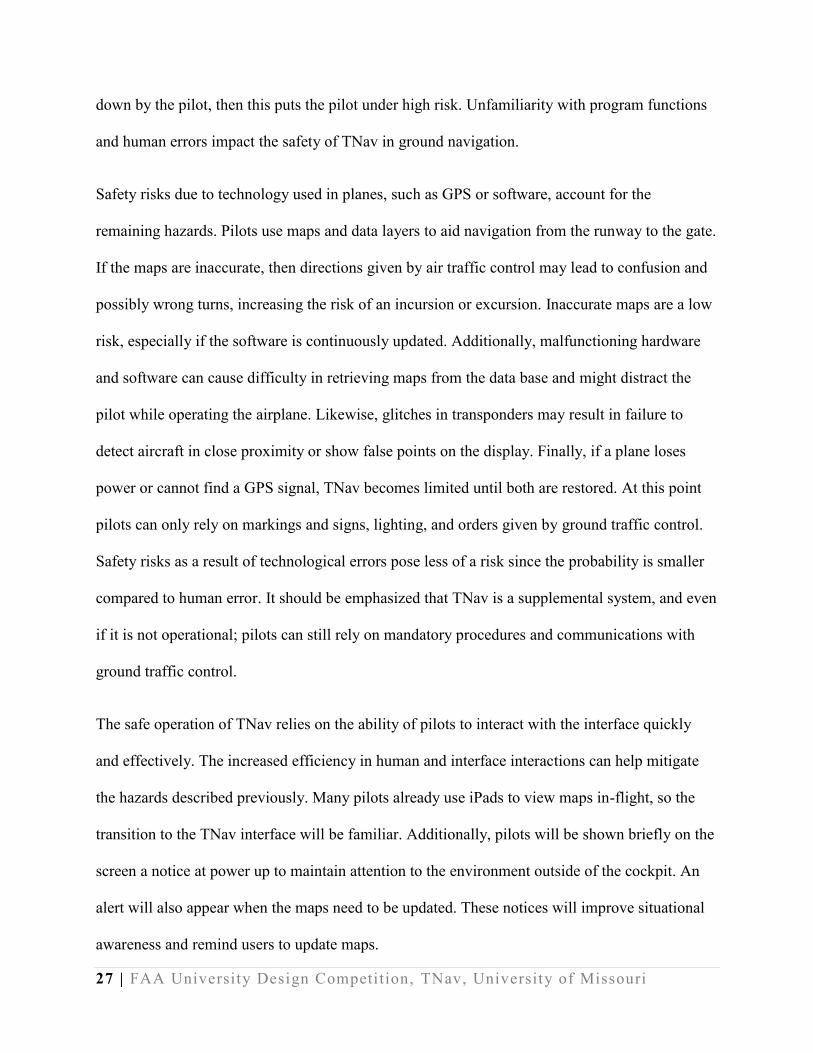
A portion of the design efficiency includes a cost benefit analysis conducted to document the
feasibility of TNav. The components comprising the product include a receiver, a decoder, and a
computer similar to an iPad or Android tablet. Similar to Jeppesen products, there will be an
annual subscription to use the maps and charts, along with an initial unit cost. Table 7 contains
the unit price of the components. An iPad has a unit price of $399 compared to the Android
tablet of $350. The average cost of the two products is a price of $375. The receiver is $75
(Jetvision, 2014).
Table 7: Unit sale price of components (Apple. 2013) (Samsung, 2014).
Item Cost Specifications
Apple iPad Air $399 16GB, 9.4in x 6.6in
Samsung Galaxy
tablet $349.99 16GB, 10.1in
TNav version of
iPad/tablet $375
Receiver $75
Jeppesen annual
subscription
$299 Full USA Charts
$1452 World Wide Charts
First Year
Total $750 Full USA Charts
$1900 World Wide Charts
2nd
Year and Later
Total $300 Full USA Charts
$1450 World Wide Charts
29 | FAA University Design Competition, TNav, University of Missouri
The cost estimate for TNav charts and software technology stems from JeppesonTC and
Aerobahn. An annual international subscription for JeppesonTC is approximately $4,000 per
pilot (personal communication, November 1, 2014). With a crew of 10,000 pilots, costs are
approximately $40M per year for the American Airlines fleet. Aerobahn, on the other hand, is a
software system used by very few airports and does not require subscription.
Based on Jeppesen’s annual fees, a similar subscription fee was established of $300 for use of
US charts and $1450 for use of worldwide charts. Because Jeppesen’s world-wide annual
subscription fee was unavailable, this fee was extrapolated by calculating the percent decrease in
price between the USA paper charts and worldwide paper charts. Furthermore, TNav is compiled
of off-the-shelf hardware components that make assembly faster and remove any additional costs
that could be incurred from specialized parts. Additionally, the graphical interface is standard
since it is used by companies including Apple or Android. The value was calculated to be $1452
per year.
TNav’s unit and subscription costs are low at only $300 annually after the first year. The
interface of TNav is simple for pilots to learn and makes taxiing around airfields safer with the
ability to draw taxi paths on a real-time position map. With the new integration of real-time
positioning and taxiing available, TNav is poised to expand and become a regularly used
standard in airplane cockpits.
The FAA can aid in the expansion of TNav by informing pilots of the new technology. Research
can also be performed to validate the effectiveness of TNav in improving alertness and safety.
Through the research, studies could be performed on pilots by using a flight simulator. The
control group would consist of the standard method pilots use to navigate the taxiways and
30 | FAA University Design Competition, TNav, University of Missouri
runways. The other group would consist of pilots using TNav to assist in runway and taxiway
navigation.
While TNav has been described mostly in relation to commercial aviation, the product will be
made available to general aviation, as well. With a relatively low annual subscription fee, TNav
offers valuable tools to all pilots, such as real-time locations of all aircraft and vehicles on the
airfield, weather conditions, and access to airport charts either in the USA or in the whole world.
Furthermore, TNav promotes safety, efficiency, and situational awareness, making purchase of
the product a simple one: the cost of TNav is much less than the cost of an accident resulting
from pilot confusion.

31 | FAA University Design Competition, TNav, University of Missouri
Appendices
A) Contact Information
Team Members:
Lauren E. Boerner
Civil Engineering Undergraduate
University of Missouri
726 Oak Meadows Court
Ballwin, MO 63021
Phone: 636.288.7251
Email: [email protected]
Paige S. Martz
Civil Engineering Undergraduate
University of Missouri
5301 W 65th
Place
Prairie Village, KS 66202
Phone: 913.952.2663
Email: [email protected]
Laura A. Walker
Civil Engineering Undergraduate
University of Missouri
221 NW 361st Road
Warrensburg, MO 65201
Phone: 910.728.6810
Email: [email protected]
Advisors:
Dr. Carlos Sun
Civil & Environmental Engineering Associate Professor
University of Missouri
E2505 Lafferre Hall
Columbia, MO 65211
Phone: 573.884.6330
Email: [email protected]

32 | FAA University Design Competition, TNav, University of Missouri
B) University of Missouri Description
The University of Missouri was founded in 1839 in Columbia, MO., as the first public university
west of the Mississippi River and the first state university in Thomas Jefferson’s Louisiana
Purchase territory. Today, MU is a $2.1 billion enterprise and an important investment for the
state and nation. Mizzou is both the state land-grant and the flagship university of the University
of Missouri system. It is a member of the American Association of Universities, an association
of 63 leading public and private research universities in the United States and Canada. Mizzou is
classified by the Carnegie Foundation at the highest level for doctorate-granting universities.
There are six faculty members in the University of Missouri’s transportation engineering
program that lead the way in transportation program and research. The advisor for this project,
Dr. Carlos Sun, previously designed aircraft information systems as an employee of Airshow Inc.
(now Rockwell/Collins).
Students participating in the 2014-2015 FAA University Design Competition for Addressing
Airport Needs are enrolled in Mizzou’s CV_ENG 4120/7120: Airport Engineering. Topics
covered in this class include: Airport Design (AC150/5300-13), Airport Master Plans
(AC150/5070-6a), Airport Capacity (AC150/5060-5), Airport Planning (AC150/5090-3C),
Airport Terminal Planning (AC150/5360-13), Airport Pavement Design and Evaluation
(AC150/5320-6d), Airport Certification (AC150/5210-22), Runway Length (AC5325-4A),
Safety Management Systems (AC150/5200-37), and the Safety Management Systems Manual.

33 | FAA University Design Competition, TNav, University of Missouri
C) Non-University Partner Description
There are no Non-University partners associated with this design project.

34 | FAA University Design Competition, TNav, University of Missouri
D) Sign-off Form
FAA Design Competition for Universities
Design Submission Form (Appendix D)
Note: This form should be included as Appendix D in the submitted PDF of the design package.
The original with signatures must be sent along with the required print copy of the design.
University of Missouri (MIZZOU)
List other partnering universities if appropriate
Design Developed by: Individual Student Student Team
If Individual Student
Name
Permanent Mailing Address
Permanent Phone Number Email
If Student Team:
Student Team Lead Lauren Boerner
Permanent Mailing Address 726 Oak Meadows Court, Ballwin, MO 63021
Permanent Phone Number 636-288-7251 Email [email protected]
Competition Design Challenge Addressed:
Runway Safety/Runway Incursions/Runway Excursions
I certify that I served as the Faculty Advisor for the work presented in this Design submission and that the
work was done by the student participant(s).
Signed Date April 15, 2015
Name Carlos Sun
University/College University of Missouri
Department(s) Civil & Environmental Engineering
Street Address E2509 Lafferre Hall
City Columbia State Missouri Zip Code 65211
Telephone 573-884-6330 Fax 573-882-4784
X
35 | FAA University Design Competition, TNav, University of Missouri
E) Evaluation of Educational Experience
Student Experiences
The FAA University Design Competition challenged the team to consider innovative approaches
related to airport challenges. The competition focused on design solutions addressing topics in
areas such as: Airport Operation and Maintenance, Runway Safety/Runway Incursions/ Runway
Excursions, Airport Environmental Interactions, and Airport Management and Planning. By
choosing Runway Safety as the issue for the project, the team gained a strong appreciation for
airport operations, piloting aircrafts, and engineering systems.
Through expert interaction, the team had a meaningful learning experience. By visiting one of
America’s busiest airports, Chicago O’Hare International Airport, team members were given a
tour of the runway, air traffic control towers, and aircraft cockpits. The team also had the
pleasure of interviewing two commercial pilots that provided excellent feedback on the design
project. The participation by the airport industry through expert interaction was extremely useful
and appropriate for this project, as it led the way to a very innovative and useful system.
When undertaking the competition, the team overcame several challenges. The first was
developing a system that would be useful for pilots and air traffic controllers. The design initially
started as a GPS navigation system loaded with pre-programmed routes and turn-by-turn
directions, similar to an automobile GPS system. After speaking with employees and pilots from
larger airports, the hypothesis evolved into an airport map displaying locations of other moving
objects on the airfield. This was due to the variability of changing conditions that could occur on
the runway and taxiway. Operators and pilots at smaller airports loved the first idea, but it was
36 | FAA University Design Competition, TNav, University of Missouri
not practical for those at large airports. It was difficult to make everyone happy with a system
that could incorporate the needs of pilots at large and small airports. This project also challenged
team members’ developmental creativity and AutoCAD/Photoshop skills in creating the TNav
screen mockups.
Each of the team members were interested in achieving an emphasis in transportation
engineering before the commencement of the Airport Engineering class offered at the University
of Missouri. However, after completing a report for the FAA University Design Competition and
completing the Airport Engineering course, two of the team members found a new, more focused
interest in airport side of civil engineering. The team learned about airport operations and the
amount of work it takes to make things run smoothly and safely. With this in mind, the team
members gained additional experience that not all engineers have the opportunity to acquire.
Faculty Experience
1. Describe the value of the educational experience for your student(s) participating in this
competition submission.
The FAA design competition provided several valuable educational experiences for
students. First, the competition allowed students to put into practice the various FAA
advisory circulars (AC) that were covered in the airport engineering class. For example, each
team had to develop a safety risk management plan according to AC 150/5200-37 for their
proposal. Second, the competition gave students the opportunity to discover the world of
airport engineering in more detail and, perhaps, opened the eyes of several students to the
possibility of a career in airport engineering. Over the years, I have seen several of my
students pursue airport engineering as a career after participating in this competition. In
37 | FAA University Design Competition, TNav, University of Missouri
addition, this experience also provided some general benefits that goes beyond airport
engineering. It was an excellent activity for teaching about proposal writing, and it was also
an excellent design experience.
2. Was the learning experience appropriate to the course level or context in which the
competition was undertaken?
The flexibility allowed in this competition was very helpful for matching the
competition to the needs of different levels of students. Thus teams composes of graduate
students and undergraduate students both benefited for the experience.
3. What challenges did the students face and overcome?
The major challenge most students faced was time. They were asked to complete the
majority of the proposal in a single semester while being introduced to the fundamental
concepts of airport engineering. Thus they were just starting to learn about airfield design,
airport layout, terminal design, capacity, planning, airfield pavements, and financing, while
completing their design proposals.
Another challenge for some of the teams was the availability of data. The experience
varied greatly among teams depending on the type of data. Sometimes the FAA contacts
listed on the competition website were very helpful in quickly connecting students to the
required resources. But other times, students had to work hard to track down the appropriate
personnel that could assist them. Again, the limited time did not work in students’ favor.
4. Would you use this competition as an educational vehicle in the future? Why or why
not?
Yes. I have used this competition as part of my airport engineering class, and I intend
to do so in the future.

38 | FAA University Design Competition, TNav, University of Missouri
5. Are there changes to the competition that you would suggest for future years?
In general, the competition is very well-designed. One suggestion is to provide a list
of databases and a description of the meta data and how the databases could be accessed.
This would prevent some students teams from going on a wild goose chase and having to
change their topics mid-stream due to lack of data.
39 | FAA University Design Competition, TNav, University of Missouri
F) Reference List
Apple Inc. (2013). Compare iPad models. Retrieved on December 10, 2014 on Apple website,
https://www.apple.com/ipad/compare/
Boeing. (n.d.). The Boeing Edge - Electronic Flight Bag Solutions. Retrieved October 2, 2014
from Boeing Commercial Aviation website, http://www.boeing.com/boeing/comm
ercial/aviationservices/information-services/real-time-operations/efb.page
Federal Aviation Administration. (2011). Airport Certification Manual. Atlanta, Georgia: U.S.
Department of Transportation, Federal Aviation Administration.
Federal Aviation Administration. (2014) Safety Management System Manual. Washington, DC:
Air Traffic Organization and U.S Department of Transportation, Federal Aviation
Administration.
Federal Aviation Administration (2014). NextGen Implementation Plan. Retrieved from
https://www.faa.gov/nextgen/library/media/NextGen_Implementation_Plan_2014.pdf
Federal Aviation Administration. (2014). Satellite Navigation – Global Positioning System
(GPS). Retrieved December 8, 2014 from FAA website, http://www.faa.gov/abou
t/office_org/headquarters_offices/ato/service_units/techops/navservices/gnss/gps/
Federal Aviation Administration. (2009). Runway Safety: Runway Incursions. Retrieved on
December 10, 2014 from http://www.faa.gov/airports/runway_safety/news/runwa
y_incursions/
Federal Aviation Administration. (2014). Fact Sheet – Runway Safety. Retrieved on December
10, 2014 from http://www.faa.gov/news/fact_sheets/news_story.cfm?newsId=10166
40 | FAA University Design Competition, TNav, University of Missouri
Garmin. (n.d.). SafeNav oowered by Garmin. Retrieved October 2, 2014 from Garmin website,
https://buy.garmin.com/shop/shop.do?pID=85237
Garvin, J., Gray, A., Gribbins, C., Jaworski, J., Jimenez, C., Juhel, A. et al. (2012). iTAXI – total
runway awareness. Retrieved from http://emerald.ts.odu.edu/Apps/FAAUDC
A.nsf/Embry-Riddle%20Aeronautical%20University.pdf?OpenFileResource
Honeywell. (2009). Honeywell SmartRunway and SmartLanding: Reducing the risk of runway
incursions and excursions. Retrieved Honneywell website from, http://www.honeyw
ellrunwaysafety.com/images/RunwaySafety_INTB_FINAL.pdf
IEM, Smith-Woolwine Associates, Inc., Kim Kenville Consulting, Newton and Associates, Inc.,
& Kimley-Horn and Associates, Inc. (2013). Integrating web-based emergency
management collaboration tools into airport operations – A primer (ACRP Report 94).
Retrieved from Transportation Research Board website: http://onlinepubs.trb.o
rg/onlinepubs/acrp/acrp_rpt_094.pdf
Jeppesen, (2014). Jeppesen Mobile TC. Retrieved December 8, 2014 from Jeppesen website.
http://ww1.jeppesen.com/documents/support/mobile/mobile-tc/Mobile-TC-iOS-and-
Android-FactSheet-GA.pdf
Jetvision. (2014). Mini ADSB & SDR. Retrieved on December 10, 2014 on Jetvision website,
http://miniadsb.web99.de/
SAAB. (2012). Aerobahn Surface Management System. Retrieved December 8, 2014 from
SAAB Sensis website. http://www.saabsensis.com/wp-content/uploads/2012/09/Aer
obahn-LR-6-12.pdf
Samsung (2014). Samsung Galaxy Tabs. Retrieved on December 10, 2014 on Samsung website,
http://www.samsung.com/us/mobile/galaxy-tab/all-products

41 | FAA University Design Competition, TNav, University of Missouri
Thales Group. (n.d.). Onboard airport navigation system. Retrieved October 2, 2014 from Thales
website, http://www.thalesgroup.com/Portfolio/Aerospace/Aerospace_Product_OANS
/?pid=1568