Embed Size (px)
Citation preview
TBA/MTBE/Ethanol Remediation Seminar
NATIONAL GROUND WATER ASSOCIATION
Petroleum Hydrocarbons and Organic Chemicals in Ground Water
Houston, Texas November 2006
Ellen Moyer, Ph.D., P.E. Principal
Greenvironment, LLC Montgomery, MA
Richard Sloan President
Chickadee Remediation Co. Houston, TX
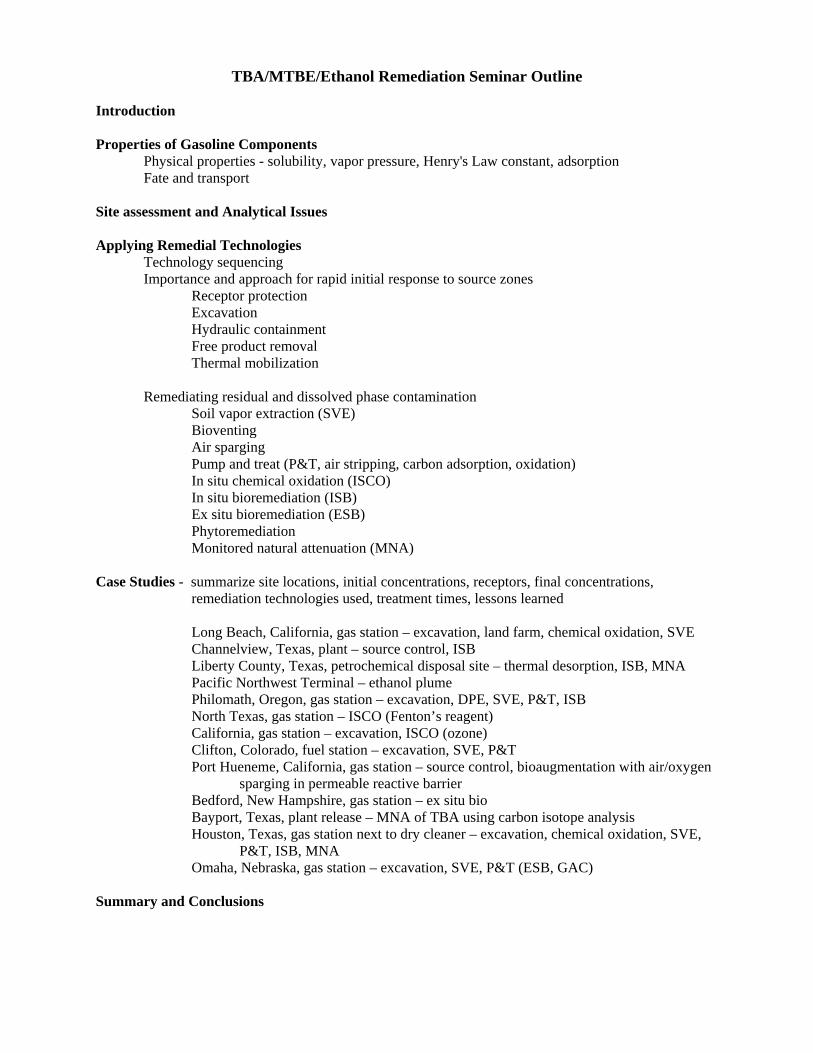
TBA/MTBE/Ethanol Remediation Seminar Outline Introduction
Properties of Gasoline Components
Physical properties - solubility, vapor pressure, Henry's Law constant, adsorption Fate and transport
Site assessment and Analytical Issues Applying Remedial Technologies Technology sequencing Importance and approach for rapid initial response to source zones Receptor protection
Excavation Hydraulic containment
Free product removal Thermal mobilization
Remediating residual and dissolved phase contamination Soil vapor extraction (SVE)
Bioventing Air sparging
Pump and treat (P&T, air stripping, carbon adsorption, oxidation) In situ chemical oxidation (ISCO)
In situ bioremediation (ISB) Ex situ bioremediation (ESB) Phytoremediation Monitored natural attenuation (MNA) Case Studies - summarize site locations, initial concentrations, receptors, final concentrations,
remediation technologies used, treatment times, lessons learned
Long Beach, California, gas station – excavation, land farm, chemical oxidation, SVE Channelview, Texas, plant – source control, ISB Liberty County, Texas, petrochemical disposal site – thermal desorption, ISB, MNA Pacific Northwest Terminal – ethanol plume Philomath, Oregon, gas station – excavation, DPE, SVE, P&T, ISB North Texas, gas station – ISCO (Fenton’s reagent) California, gas station – excavation, ISCO (ozone) Clifton, Colorado, fuel station – excavation, SVE, P&T Port Hueneme, California, gas station – source control, bioaugmentation with air/oxygen sparging in permeable reactive barrier Bedford, New Hampshire, gas station – ex situ bio Bayport, Texas, plant release – MNA of TBA using carbon isotope analysis Houston, Texas, gas station next to dry cleaner – excavation, chemical oxidation, SVE,
P&T, ISB, MNA Omaha, Nebraska, gas station – excavation, SVE, P&T (ESB, GAC)
Summary and Conclusions
TBA/MTBE/Ethanol Remediation Seminar Abstract
Ellen Moyer, Ph.D., P.E., Principal, Greenvironment, LLC, Montgomery, MA ([email protected])
Richard Sloan, Chickadee Remediation Company, Houston, TX ([email protected])
This seminar reviews physical, chemical, and biodegradation characteristics of the fuel oxygenates tert
butyl alcohol (TBA), methyl tert butyl ether (MTBE), and ethanol. Consideration of these characteristics leading to
the optimization of remedial technologies employed at affected groundwater sites is evaluated and illustrated
through a number of case studies. Optimal remedial strategies take advantage of the characteristics of TBA, MTBE,
ethanol, and gasoline hydrocarbons such as benzene, toluene, ethylbenzene, and xylenes that may be present.
Remedial strategies often consist of a sequence of actions starting with receptor protection and source control,
followed by remediation of residual and dissolved contamination, and ending with natural attenuation.
TBA is often found in association with MTBE. Three potential sources of TBA are: 1) as a fuel oxygenate
in its own right (although currently not in wide use); 2) as co-product present at low percent levels in commercial
MTBE; and 3) as an intermediate product of MTBE biodegradation and chemical oxidation. In addition, it can be an
artifact created during certain water sample preservation and analytical procedures.
TBA and MTBE differ from gasoline hydrocarbons in several physical characteristics, being relatively
more soluble and less adsorptive. MTBE also has a higher vapor pressure, and TBA has a lower Henry’s Law
constant, than gasoline hydrocarbons. These physical attributes influence the selection and optimization of remedial
options for residual and dissolved constituents.
Like TBA and MTBE, ethanol is more soluble and less adsorptive than gasoline hydrocarbons. In addition,
it is more rapidly biodegraded than TBA, MTBE, and gasoline hydrocarbons, under both aerobic and anaerobic
conditions. Preferential ethanol biodegradation can deplete electron acceptors in the subsurface, resulting in longer
plumes of other gasoline constituents than would be the case if ethanol were not present.
Biodegradation of TBA and MTBE by naturally occurring bacteria has been demonstrated at many sites.
Several pure cultures of microorganisms have been demonstrated to degrade these constituents aerobically to carbon
dioxide and water. There is also evidence of TBA and MTBE mineralization by mixed cultures in aerobic/anaerobic
environments. In the field, increasing the dissolved oxygen concentration increases aerobic biodegradation rates in a
strong dose-response relationship. Biodegradation has also been demonstrated with other electron acceptors
including nitrate, iron, sulfate and carbon dioxide. Biodegradation is an important mechanism for natural attenuation
of TBA, MTBE, and ethanol.
The seminar will explore the selection and execution of current and emerging technologies for the
remediation of gasoline components, including residual and dissolved TBA, MTBE, and ethanol. Commonly used
technologies include: soil vapor extraction; bioventing; air sparging; in situ ground water bioremediation; ex situ
groundwater bioremediation; pump and treat; in situ chemical oxidation; and monitored natural attenuation.
TBA and ethanol have moderate vapor pressures typical of other gasoline constituents, while MTBE has a
higher vapor pressure. Consequently, soil vapor extraction is very effective for removing these chemicals from the
unsaturated zone (soil conditions permitting), where catalytic oxidation or thermal oxidation can be used to treat
higher concentrations of these constituents aboveground (along with other gasoline constituents). Granular activated
carbon (GAC) can be used for aboveground treatment of lower concentrations of MTBE. GAC is not typically the
optimal technology for treating TBA or ethanol because of their low tendency to adsorb. Biofilters can be used to
treat MTBE, TBA, and ethanol.
Air sparging is less effective at removing TBA, MTBE, and ethanol dissolved in water than it is for higher
Henry's Law constant constituents, like benzene. However, when higher air to water ratios are used, sparging can be
effective. TBA and ethanol are treated by biodegradation enhanced by the oxygenation that occurs as a result of air
sparging, whereas MTBE is treated by both biodegradation and stripping processes.
High water solubility and low tendency to adsorb make these three constituents very amenable to
groundwater extraction. Recovered groundwater can be treated aboveground by ex situ bioremediation or advanced
oxidation processes. Additional options in the case of MTBE include carbon or resin adsorption, or air stripping
followed by carbon adsorption or catalytic oxidation of the vapor phase. Air stripping of MTBE requires higher air
to water ratios than for gasoline hydrocarbons.
A number of case studies will be presented that illustrate the effect of physical and biodegradation
characteristics on remediation technology selection. Every site is different, with its own set of characteristics and
challenges. Regardless of the composition of gasoline, rapid source control is critical to minimize environmental
impact and to reduce overall remediation cost Optimal strategies take advantage of site characteristics as well as
the specific characteristics of TBA, MTBE, and ethanol for cost-effective, timely, and environmentally sound
remediation of these chemicals.
Biographies of Presenters
Ellen Moyer, Ph.D., P.E, Principal of Greenvironment, LLC, is a recognized expert in the assessment and
remediation of fuel oxygenates contamination. She has an M.S. in Environmental Engineering and a Ph.D. in Civil
Engineering. She has presented numerous seminars on assessment and remediation of fuel oxygenates and other
VOCs and was the lead editor of an MTBE Remediation Handbook, now in its second printing. Dr. Moyer has
managed all phases of assessment and remediation work, and her numerous projects have employed a wide range of
in situ and ex situ remediation technologies at diverse sites with organic and inorganic contaminants.
Richard Sloan is President of Chickadee Remediation Co., whose primary business is to remediate contaminated soil
and groundwater to the extent necessary to protect public health and the environment and acquire the long-term site
environmental liability. Sloan has developed and implemented timely, cost-effective and environmentally-sound
remediation plans for numerous Superfund, RCRA, and other sites with affected soils and groundwater. He has
successfully established community/agency/company/contractor partnerships to focus the project efforts on common
goals and apply a broad-based technical approach for each site. Sloan is also President of Chickadee Mining Co.,
which uses environmentally-sensitive procedures and equipment for precious metals mining.
1
1
Ellen Moyer, Ph.D., P.E.Principal
Greenvironment, LLC, Montgomery, MA
Richard SloanPresident
Chickadee Remediation Co., Houston, TX
National Ground Water AssociationPetroleum Hydrocarbons and
Organic Chemicals in Groundwater
Houston, TexasNovember 2006
TBA/MTBE/Ethanol Remediation Seminar
2
Objectives of the Workshop
Participants will understand:
Process for addressing releases
Fate and transport characteristics
Current and emerging remedial technologies
Selection and sequencing of remediation technologies
The overall manageability of gasoline release impacts
2
3
Outline of Workshop
Introduction Physical properties, fate and transport
Site assessment and analytical issues
Applying remedial technologies
Case studies of remediation
Conclusion and summary
4
Beyond the Scope
Health effects and toxicology
Benefits of oxygenates to air quality
Gasoline formulation and performance
Specific regulatory requirements
Leak detection systems
3
5
Gasoline Release Management Program
1. Status of potential pathways
2. Receptor protection
3. Source identification and control
4. Nature and extent of soil, groundwater, and vapor impacts
5. Physical characteristics of the subsurface
6. Properties of the chemicals present in the soils and groundwater
7. Develop/implement the appropriate technology sequence
6
Gasoline Release Management Program
Design, Construction, and Operation
Health, safety, and quality take priority
Use standard sized pumps, meters, valves, controls, instruments, etc.
Allow for "easy" changes and modifications in response to progress results
Field fit most of mechanical and electrical
Realistic cost and schedule
Commit the necessary resources
4
7
Bucks Co./Montgomery Co. Reviewed eight service stations in detail
All had leaking underground storage tanks
Operating issues: accurate inventory control, consistently negative inventory
Shallow bedrock (varying depths)
Groundwater in unconsolidated sediments is the critical zone
MTBE and BTEX tended to co-exist in the impacted groundwater
Numerous active water supply wells accelerated MTBE and BTEX migration
8
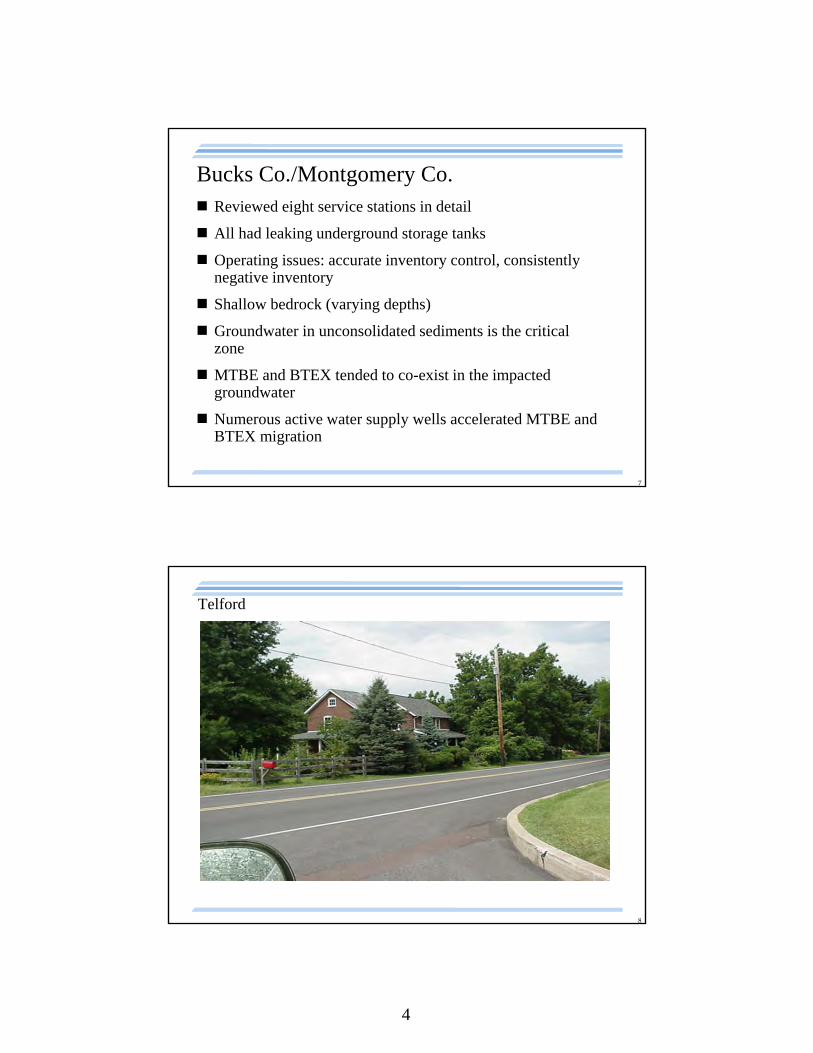
Telford
5
9
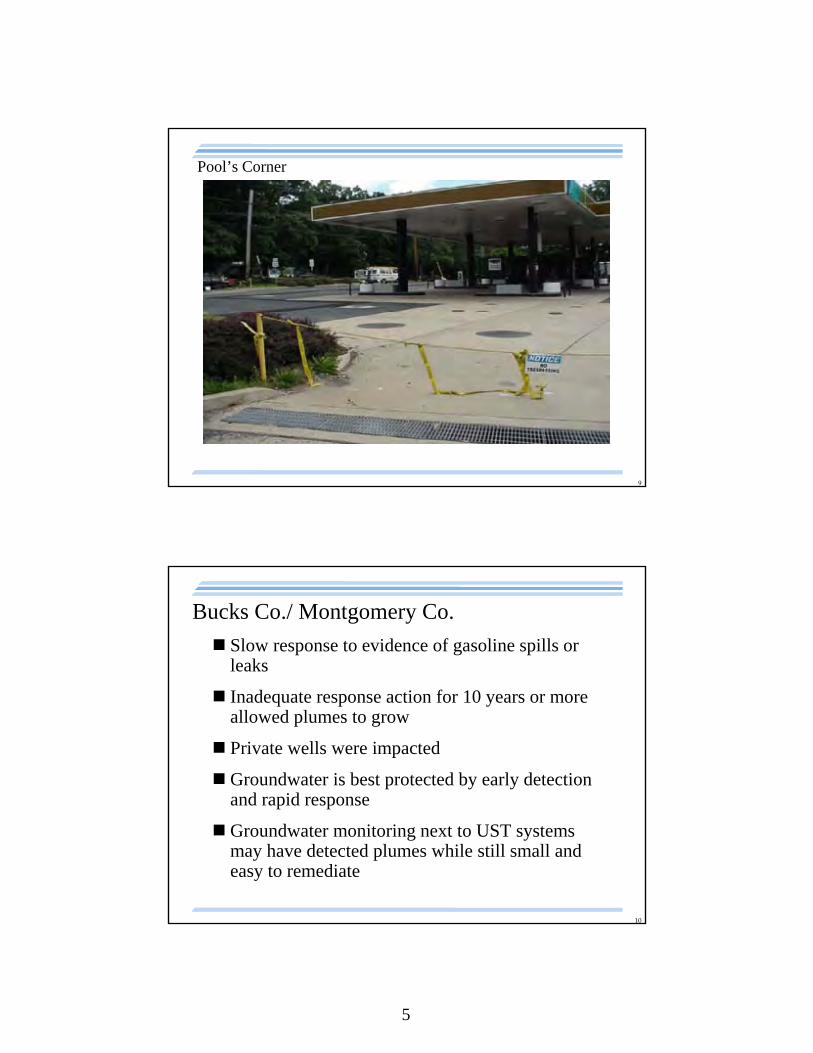
Pool’s Corner
10
Bucks Co./ Montgomery Co.
Slow response to evidence of gasoline spills or leaks
Inadequate response action for 10 years or more allowed plumes to grow
Private wells were impacted
Groundwater is best protected by early detection and rapid response
Groundwater monitoring next to UST systems may have detected plumes while still small and easy to remediate
6
11
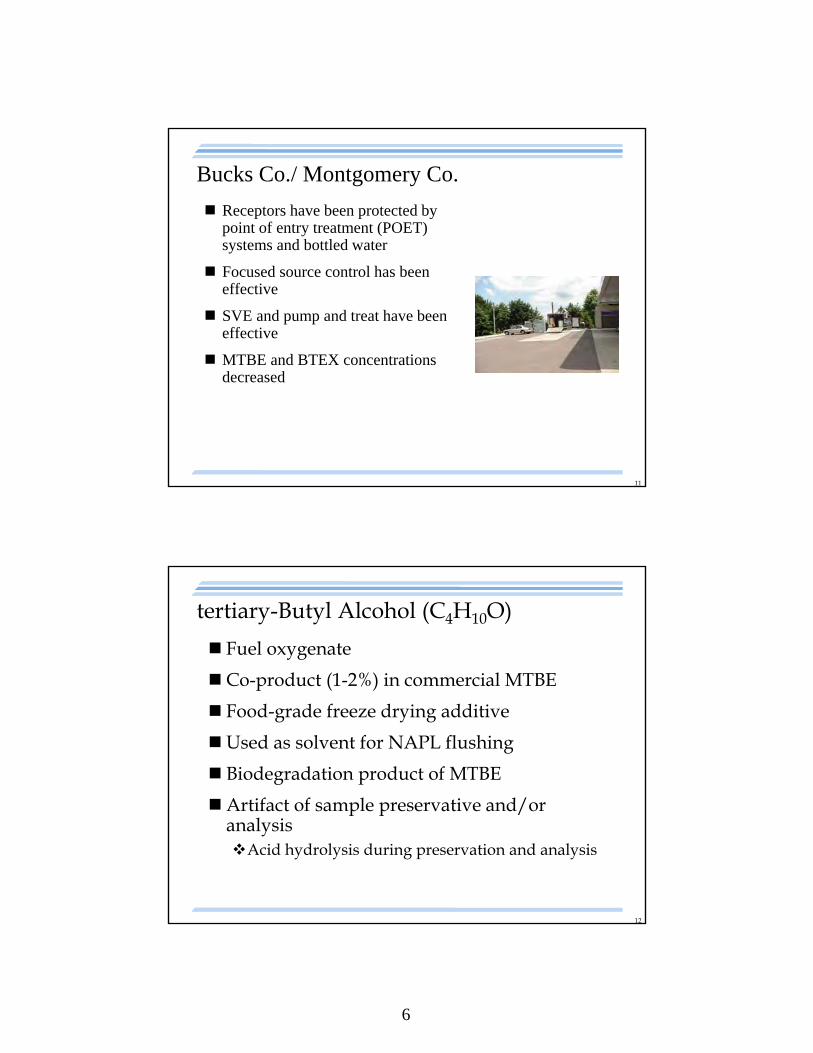
Bucks Co./ Montgomery Co.
Receptors have been protected by point of entry treatment (POET) systems and bottled water
Focused source control has been effective
SVE and pump and treat have been effective
MTBE and BTEX concentrations decreased
12
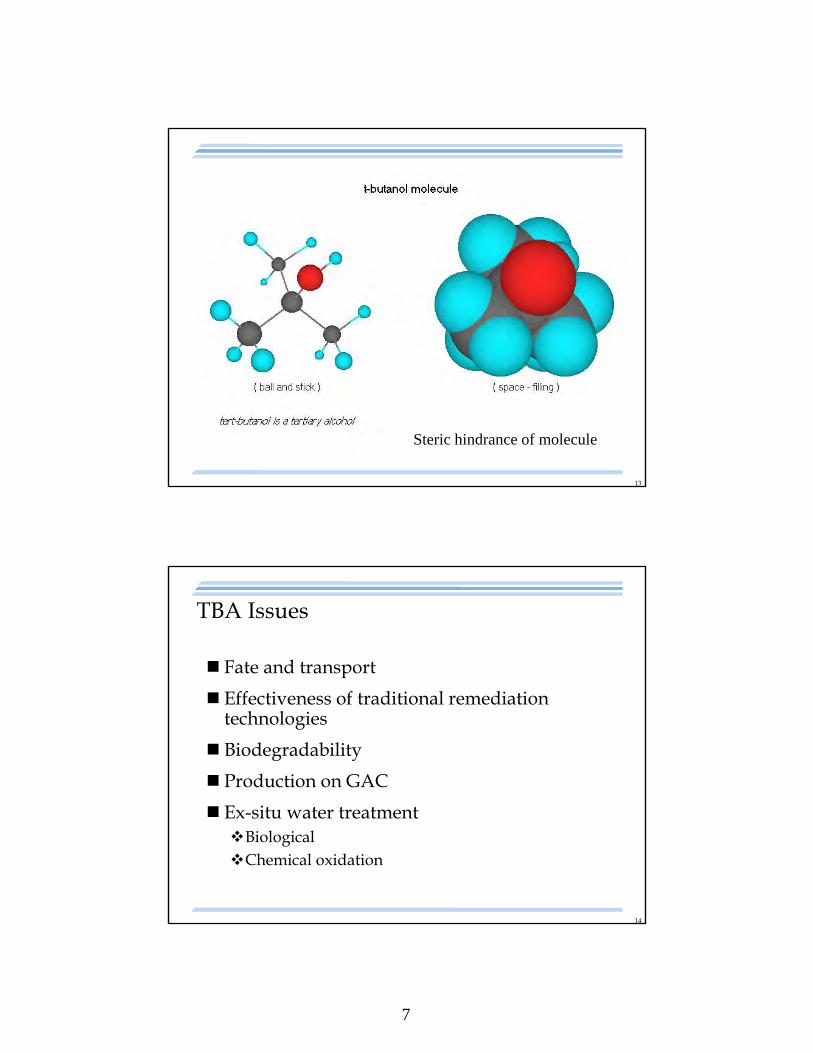
tertiary-Butyl Alcohol (C4H10O)
Fuel oxygenate
Co-product (1-2%) in commercial MTBE
Food-grade freeze drying additive
Used as solvent for NAPL flushing
Biodegradation product of MTBE
Artifact of sample preservative and/or analysisAcid hydrolysis during preservation and analysis
7
13
Steric hindrance of molecule
14
TBA Issues
Fate and transport
Effectiveness of traditional remediation technologies
Biodegradability
Production on GAC
Ex-situ water treatmentBiologicalChemical oxidation
8
15
(Tertiary Butyl Alcohol) (Tert-Butanol) (2-methyl, 2-propanol)Extremely volatile, flammable liquidCamphor-like odor at >73 ppm in airAlcohol-like taste at >5 ppm in waterEye and skin irritationDoes not bioaccumulateAvoid prolonged inhalation exposureAvoid dermal contact and direct ingestionRat toxicology: LC50>14,100 ppm, LD50>2,700 mg/kgAquatic toxicity: LC50 and EC50 >5,500 ppmNot a known human carcinogen or reproductive toxin
Material Safety Data Sheet - TBA
16
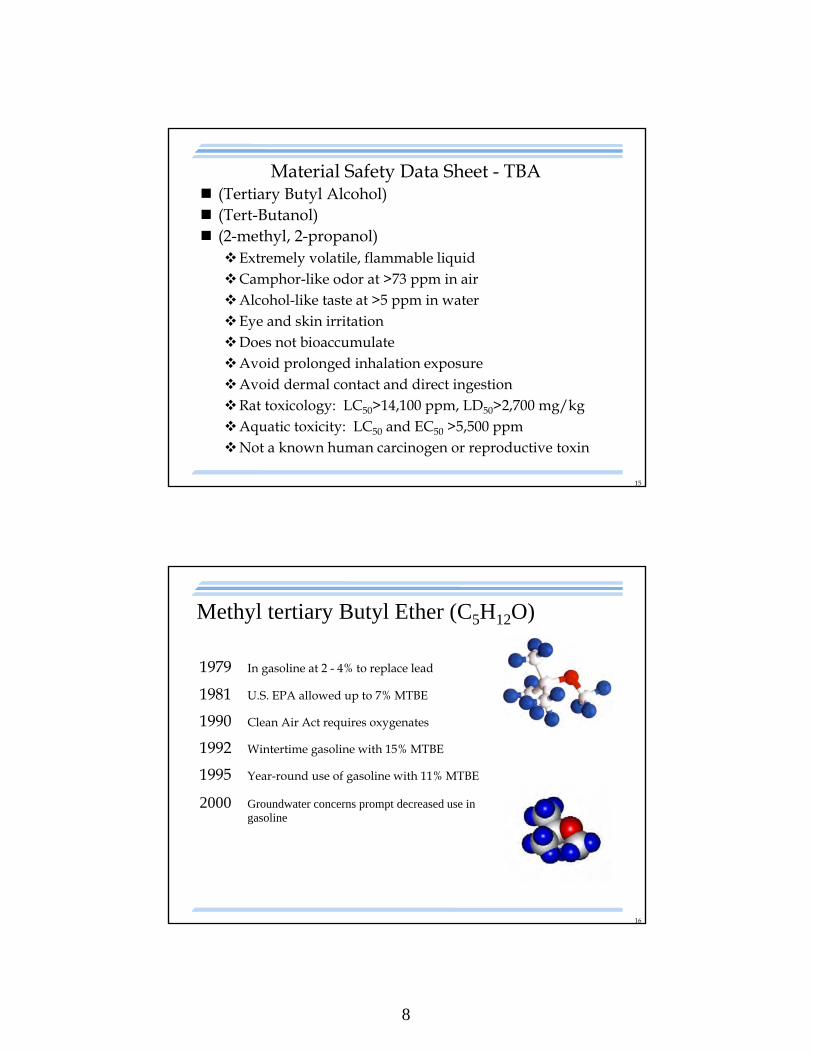
Methyl tertiary Butyl Ether (C5H12O)
1979 In gasoline at 2 - 4% to replace lead
1981 U.S. EPA allowed up to 7% MTBE
1990 Clean Air Act requires oxygenates
1992 Wintertime gasoline with 15% MTBE
1995 Year-round use of gasoline with 11% MTBE
2000 Groundwater concerns prompt decreased use ingasoline
9
17
(Methyl Tertiary Butyl Ether) (Butyl Methyl Ether)Extremely volatile, flammable liquidTurpentine-like odor at >0.05 ppm in airTurpentine-like taste at >0.05 ppm in waterEye and skin irritationDoes not bioaccumulateAvoid prolonged inhalation exposureAvoid dermal contact and direct ingestionRat toxicology: LC50>23,000 ppm, LD50>4,000 mg/kgAquatic toxicity: LC50>1,000 ppmNot a known human carcinogen or reproductive toxin
Material Safety Data Sheet - MTBE
18
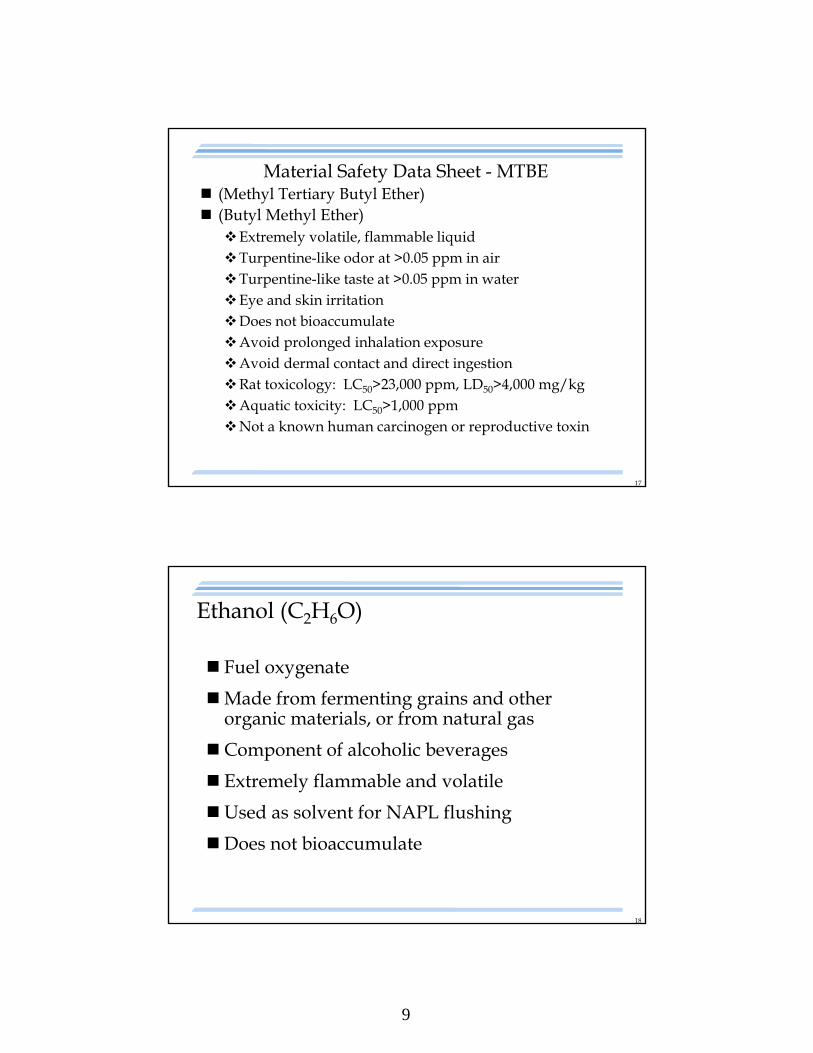
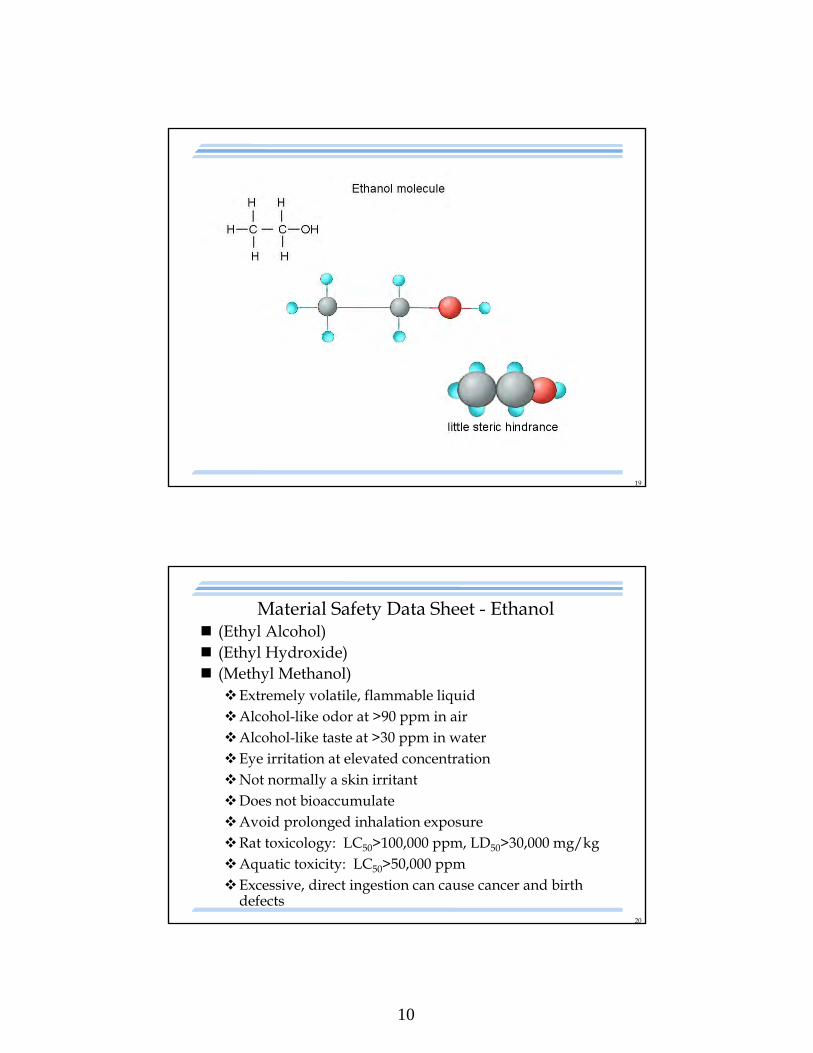
Ethanol (C2H6O)
Fuel oxygenate
Made from fermenting grains and other organic materials, or from natural gas
Component of alcoholic beverages
Extremely flammable and volatile
Used as solvent for NAPL flushing
Does not bioaccumulate
10
19
20
(Ethyl Alcohol) (Ethyl Hydroxide) (Methyl Methanol)Extremely volatile, flammable liquidAlcohol-like odor at >90 ppm in airAlcohol-like taste at >30 ppm in waterEye irritation at elevated concentrationNot normally a skin irritantDoes not bioaccumulateAvoid prolonged inhalation exposureRat toxicology: LC50>100,000 ppm, LD50>30,000 mg/kgAquatic toxicity: LC50>50,000 ppmExcessive, direct ingestion can cause cancer and birth
defects
Material Safety Data Sheet - Ethanol
11
21
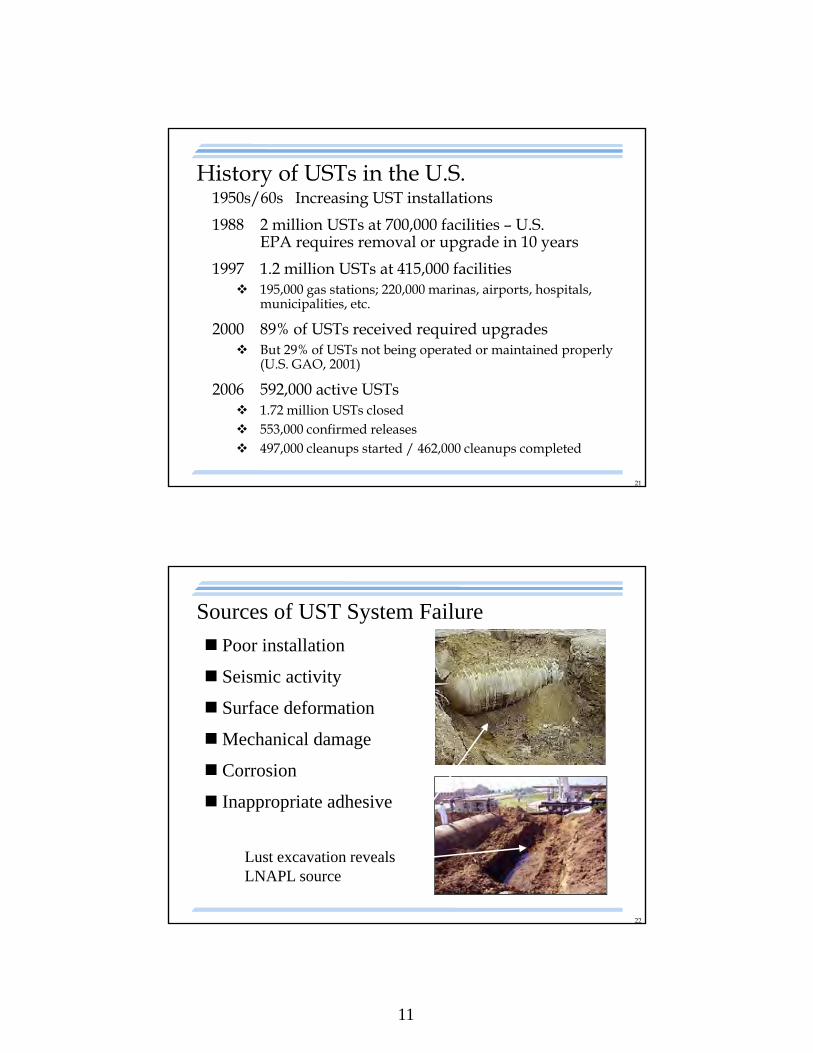
History of USTs in the U.S.1950s/60s Increasing UST installations
1988 2 million USTs at 700,000 facilities – U.S. EPA requires removal or upgrade in 10 years
1997 1.2 million USTs at 415,000 facilities 195,000 gas stations; 220,000 marinas, airports, hospitals,
municipalities, etc.
2000 89% of USTs received required upgrades But 29% of USTs not being operated or maintained properly
(U.S. GAO, 2001)
2006 592,000 active USTs 1.72 million USTs closed 553,000 confirmed releases 497,000 cleanups started / 462,000 cleanups completed
22
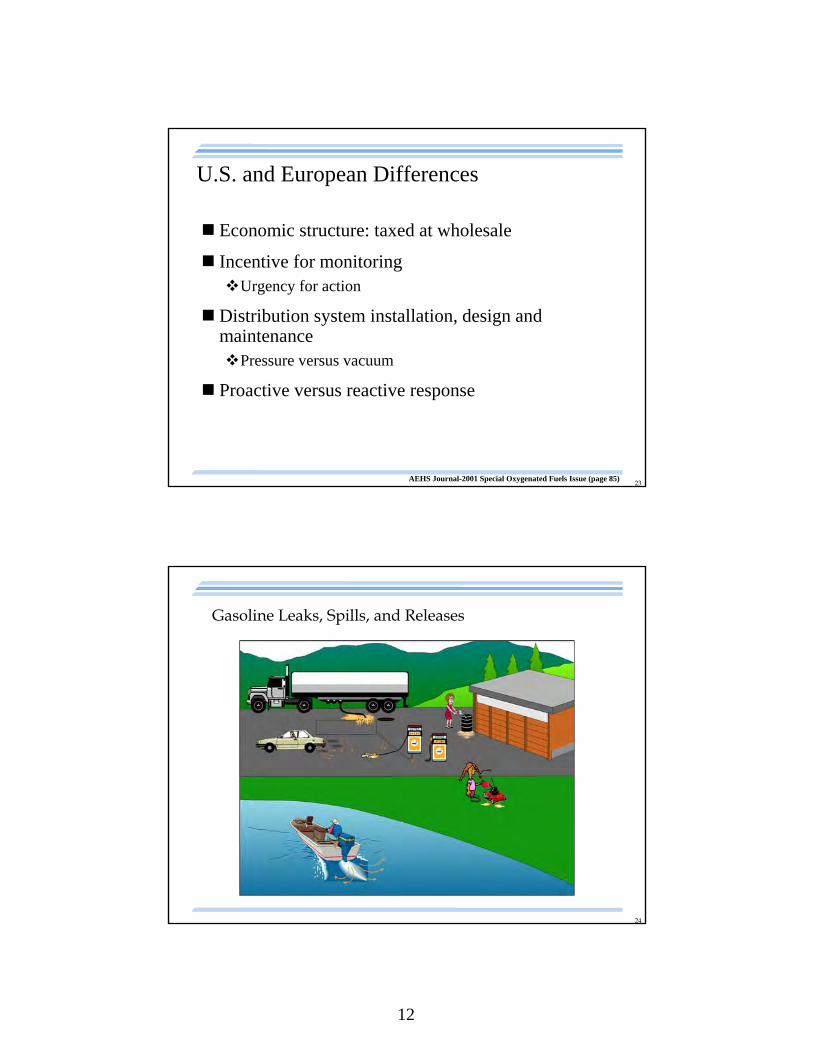
Sources of UST System Failure
Poor installation
Seismic activity
Surface deformation
Mechanical damage
Corrosion
Inappropriate adhesive
Lust excavation reveals LNAPL source
12
23
U.S. and European Differences
Economic structure: taxed at wholesale
Incentive for monitoring Urgency for action
Distribution system installation, design and maintenancePressure versus vacuum
Proactive versus reactive response
AEHS Journal-2001 Special Oxygenated Fuels Issue (page 85)
24
Gasoline Leaks, Spills, and Releases
13
25
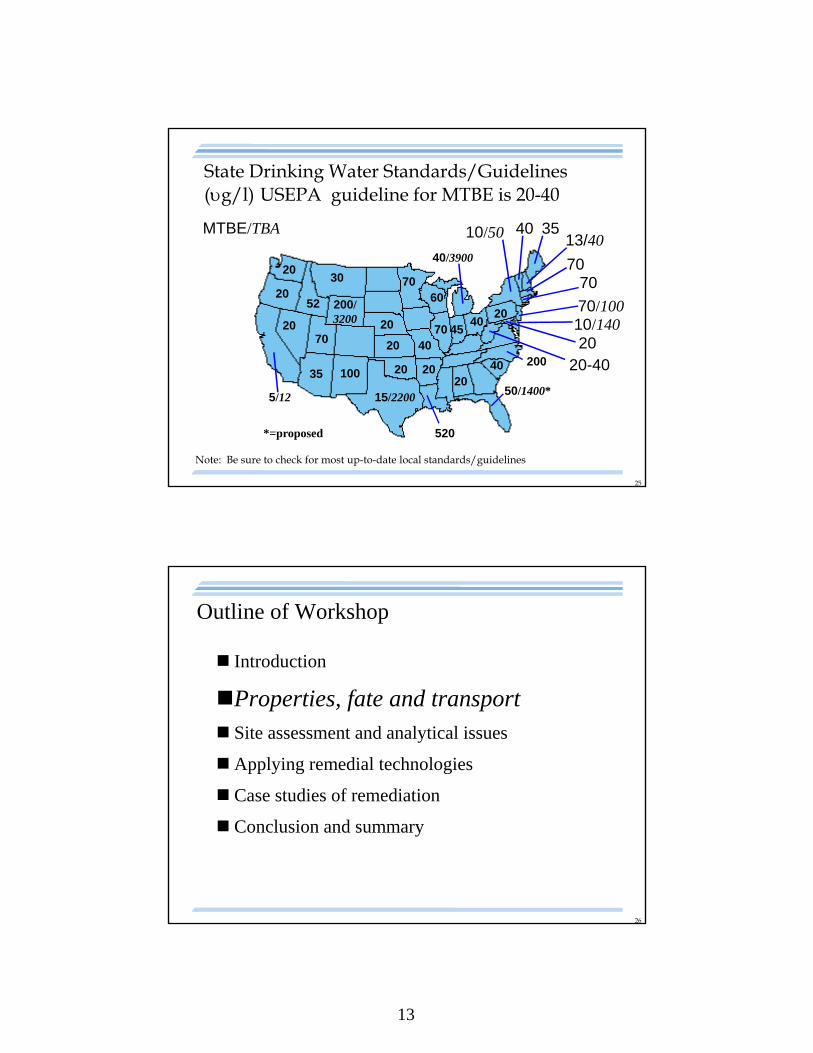
State Drinking Water Standards/Guidelines(g/l) USEPA guideline for MTBE is 20-40
70
10/140
35
70
13/40
70/10060
10/50
30
5/12
40
20
20200/320020
20
15/2200
20
40
40
520
2050/1400*
200
2040
4570
40/3900 70
20
MTBE/TBA
*=proposed
52
70
35 100
20
20-4020
Note: Be sure to check for most up-to-date local standards/guidelines
26
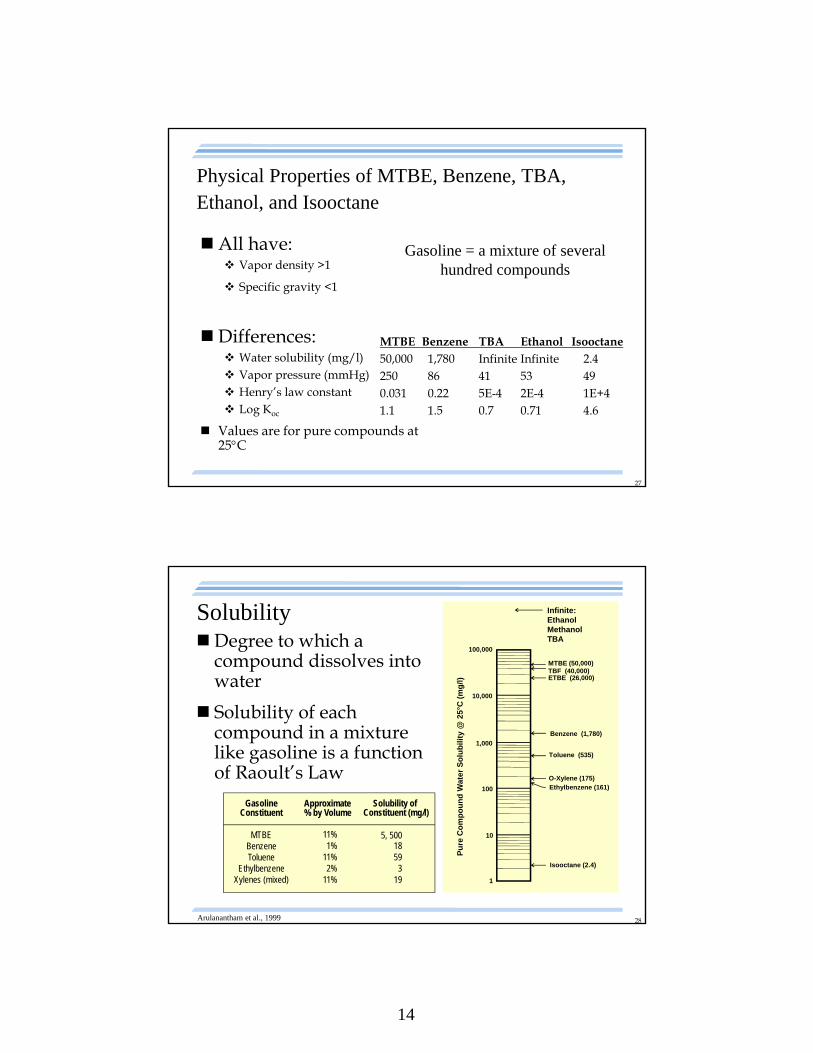
Outline of Workshop
Introduction
Properties, fate and transport Site assessment and analytical issues
Applying remedial technologies
Case studies of remediation
Conclusion and summary
14
27
Physical Properties of MTBE, Benzene, TBA, Ethanol, and Isooctane
All have: Vapor density >1
Specific gravity <1
Differences: Water solubility (mg/l) Vapor pressure (mmHg) Henry’s law constant Log Koc
Values are for pure compounds at 25C
MTBE Benzene TBA Ethanol Isooctane50,000 1,780 Infinite Infinite 2.4250 86 41 53 490.031 0.22 5E-4 2E-4 1E+41.1 1.5 0.7 0.71 4.6
Gasoline = a mixture of several hundred compounds
28
GasolineConstituent
MTBEBenzeneToluene
EthylbenzeneXylenes (mixed)
Approximate% by Volume
11%1%
11%2%
11%
5, 50018593
19
Solubility ofConstituent (mg/l)
SolubilityDegree to which a
compound dissolves into water
Solubility of each compound in a mixture like gasoline is a function of Raoult’s Law
Arulanantham et al., 1999
MTBE (50,000)TBF (40,000)ETBE (26,000)
Benzene (1,780)
Toluene (535)
O-Xylene (175)Ethylbenzene (161)
Isooctane (2.4)
100,000
10,000
1,000
100
10
1
Pu
re C
om
po
un
d W
ate
r S
olu
bili
ty @
25°
C (
mg
/l)
Infinite:EthanolMethanolTBA
15
29
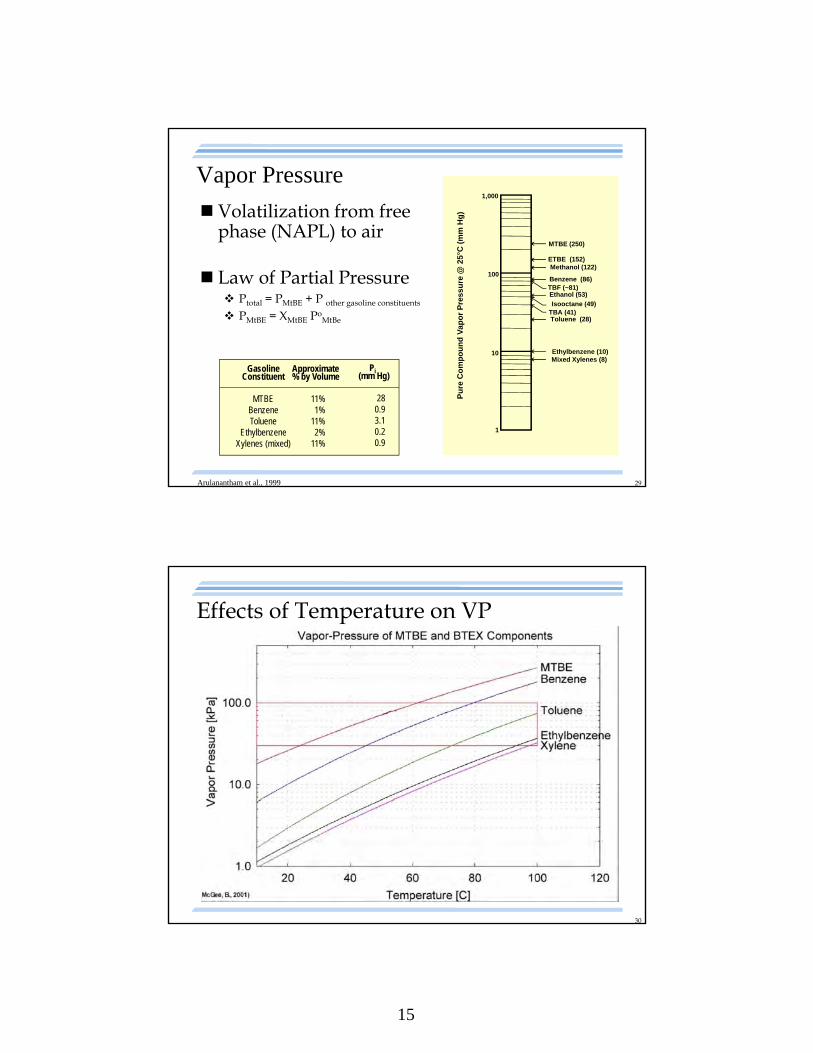
Vapor Pressure
Volatilization from free phase (NAPL) to air
Law of Partial Pressure Ptotal = PMtBE + P other gasoline constituents
PMtBE = XMtBE PoMtBe
Pi(mm Hg)
28 0.93.10.20.9
GasolineConstituent
MTBEBenzeneToluene
EthylbenzeneXylenes (mixed)
Approximate% by Volume
11%1%
11%2%
11%
Arulanantham et al., 1999
MTBE (250)
ETBE (152)
Benzene (86)
Toluene (28)TBA (41)
Ethylbenzene (10)
Isooctane (49)
1,000
100
10
1
Pu
re C
om
po
un
d V
ap
or
Pre
ssu
re @
25°
C (
mm
Hg
)
Methanol (122)
TBF (~81)Ethanol (53)
Mixed Xylenes (8)
30
Effects of Temperature on VP
16
31
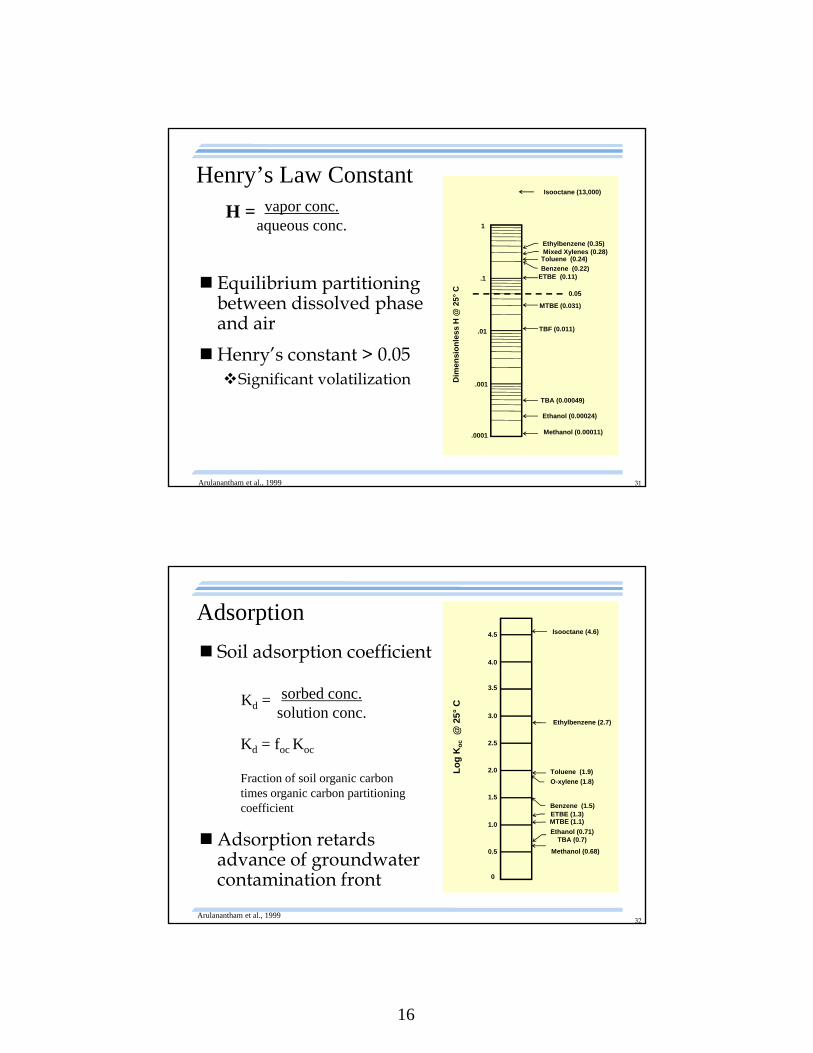
vapor conc.aqueous conc.
H =
Henry’s Law Constant
Equilibrium partitioning between dissolved phase and air
Henry’s constant > 0.05Significant volatilization
Arulanantham et al., 1999
MTBE (0.031)
ETBE (0.11)Benzene (0.22)
Toluene (0.24)
Ethylbenzene (0.35)
1
.1
.001
.0001
Dim
en
sio
nle
ss
H @
25
°C
Methanol (0.00011)
TBF (0.011)
Ethanol (0.00024)
Mixed Xylenes (0.28)
.01
TBA (0.00049)
Isooctane (13,000)
0.05
32
Soil adsorption coefficient
Adsorption retardsadvance of groundwater contamination front
Kd = foc Koc
Fraction of soil organic carbon times organic carbon partitioning coefficient
Kd =
Adsorption
Arulanantham et al., 1999
MTBE (1.1)
Benzene (1.5)
O-xylene (1.8)
Ethylbenzene (2.7)
4.5
Lo
g K
oc
@ 2
5°C
Methanol (0.68)
Ethanol (0.71)TBA (0.7)
ETBE (1.3)
Isooctane (4.6)
4.0
3.5
3.0
2.5
2.0
1.5
1.0
0.5
0
Toluene (1.9)
sorbed conc.solution conc.
17
33
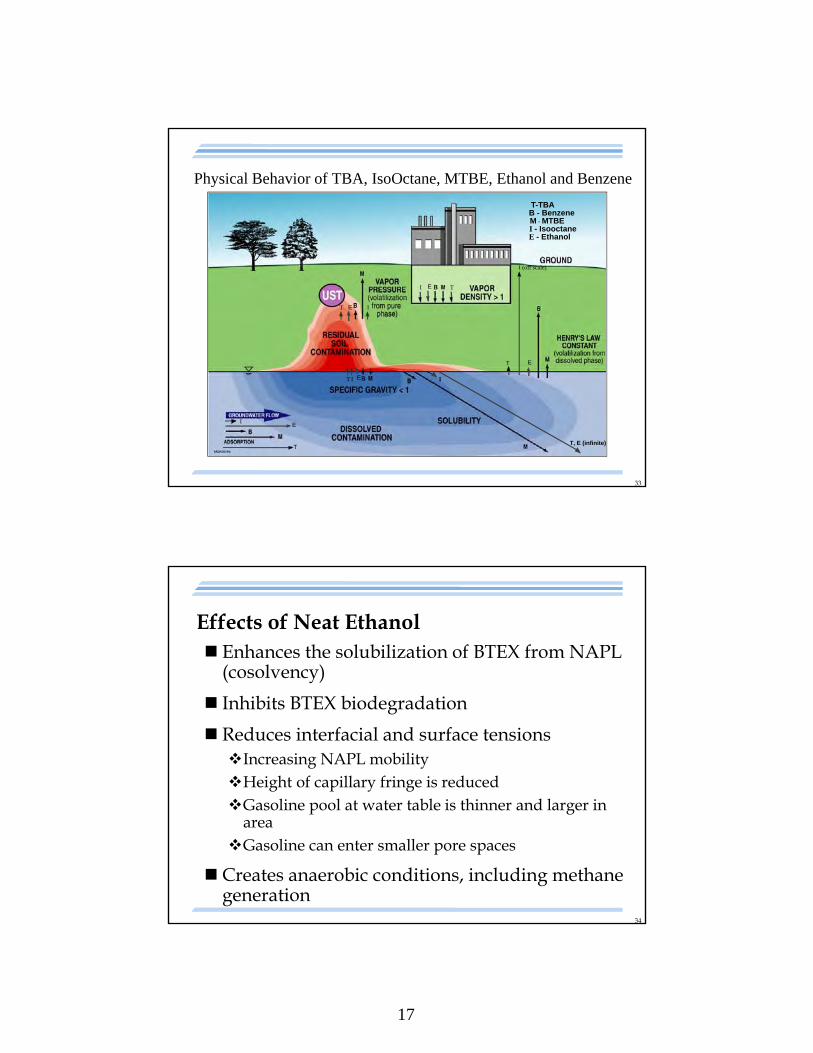
Physical Behavior of TBA, IsoOctane, MTBE, Ethanol and Benzene
E
E
E
T-TBAB - BenzeneM - MTBE
E
E I
I (off scale)
I - Isooctane
I
I
I
I
T
T
E - Ethanol
T
T, E (infinite)
T
T
34
Effects of Neat Ethanol Enhances the solubilization of BTEX from NAPL
(cosolvency)
Inhibits BTEX biodegradation
Reduces interfacial and surface tensionsIncreasing NAPL mobilityHeight of capillary fringe is reducedGasoline pool at water table is thinner and larger in
areaGasoline can enter smaller pore spaces
Creates anaerobic conditions, including methane generation
18
35
Solubility – Water, Hydrocarbons, Ethanol
Standard gasoline and water are immiscible
Ethanol is completely miscible with both gasoline and water at all concentrations
When ethanol is present with both water and gasolineEthanol partitions into waterAs a result, the water is more soluble in gasoline
and gasoline hydrocarbons are more soluble in the water
» Can lead to longer BTEX plumes
36
Solubility – Water, Hydrocarbons, Ethanol
When a lot of ethanol is present (>70%)Gasoline and water become completely miscible
with each other and all 3 merge into a single phase
When less ethanol – gasoline, and water+ethanolCan happen with 0.5% water by mass and 10%
ethanol by volume – separation to two phases» Ethanol is added at terminals, not at refineries
19
37
Outline of Workshop
Introduction
Properties, fate and transport
Site assessment and analytical issues Applying remedial technologies
Case studies of remediation
Conclusion and summary
38
Site Assessments Surface and subsurface definitionIterative process, data dependentHydrogeology controls transportEvaluate all:
» Media of concern» Relevant receptors » Contaminants
ToolsConventionalEmerging technologies
20
39
Impact of Surface Features on Subsurface Distribution of LNAPL & Dissolved Phase
Natural/man-made recharge barriersTight clays, paving, buildings
Natural/man-made recharge enhancementsLosing streams and riversLakes and pondsManmade surge basins, storm water basinsConduits connecting aquifer zones
» Buildings, foundations, basements» Wells
40
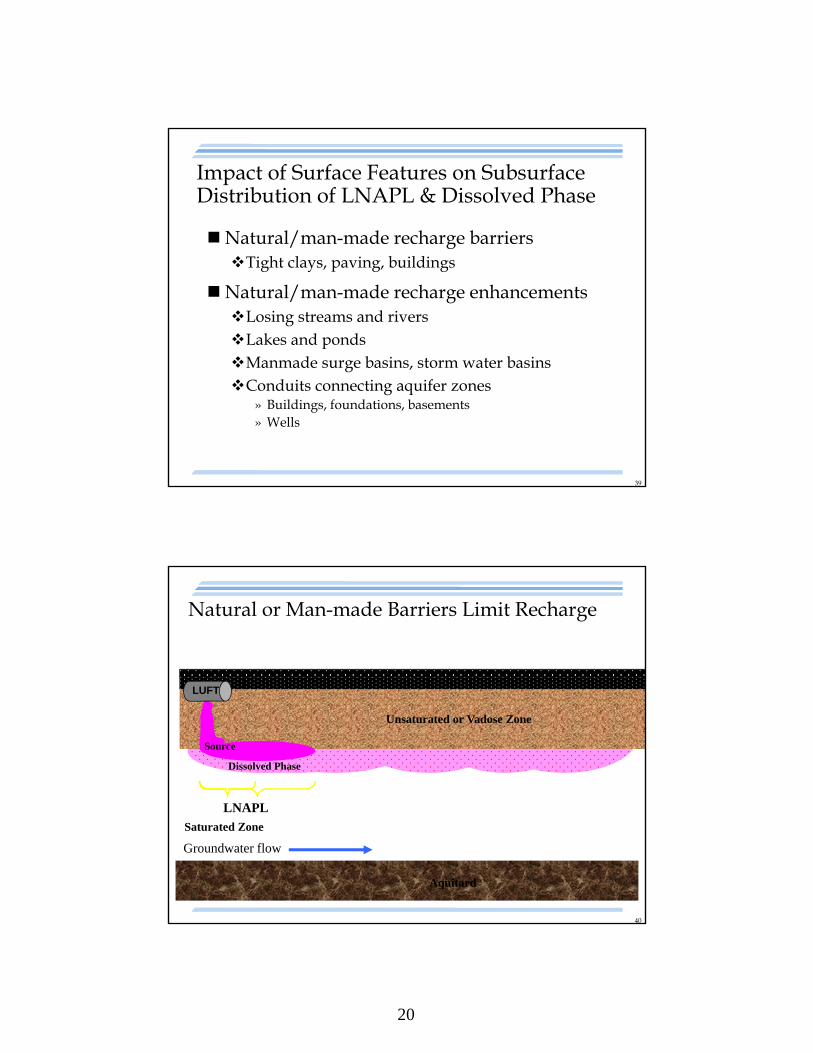
Natural or Man-made Barriers Limit Recharge
Groundwater flow
Dissolved Phase
Source
LUFT
LNAPL
Unsaturated or Vadose Zone
Aquitard
Saturated Zone
21
41
Natural or Man-made Enhanced Recharge
Groundwater flow
Dissolved Phase
Source
LUFT
LNAPL
Unsaturated or Vadose Zone
Aquitard
Saturated Zone
42
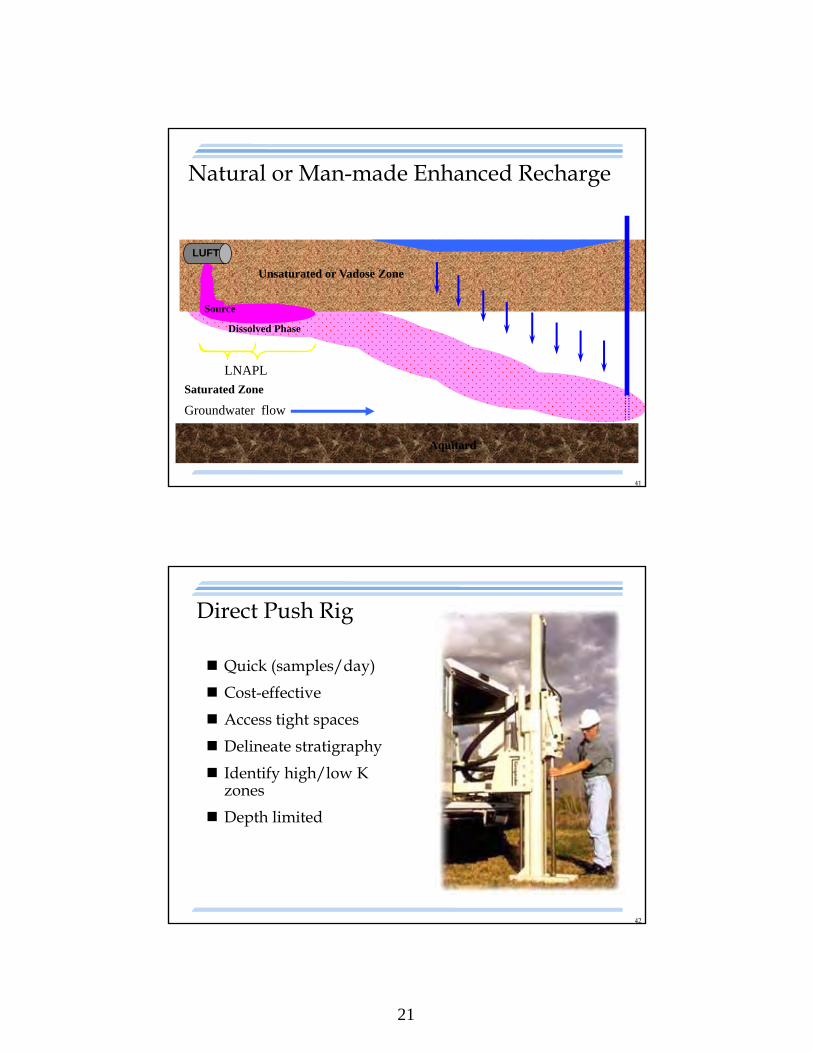
Direct Push Rig
Quick (samples/day)
Cost-effective
Access tight spaces
Delineate stratigraphy
Identify high/low K zones
Depth limited
22
43http://www.flut.com/sys_1.htm
Installation of 15 Port Sampling System
44
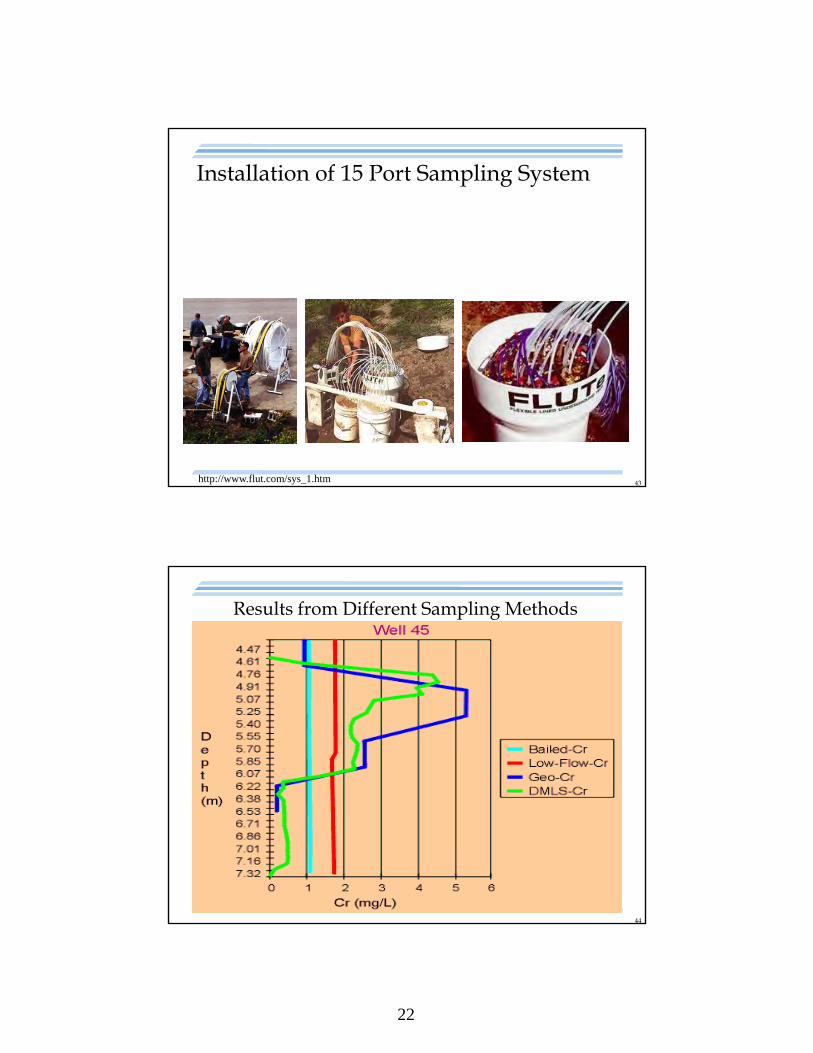
Results from Different Sampling Methods
23
45
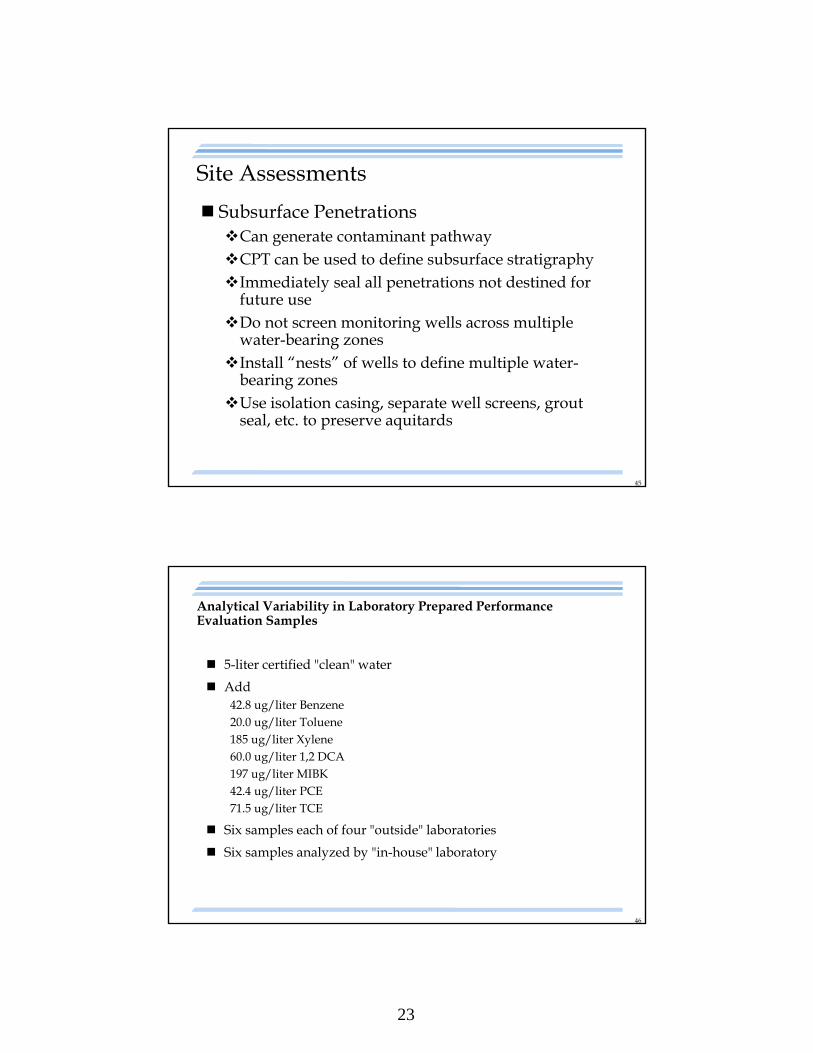
Site Assessments
Subsurface PenetrationsCan generate contaminant pathwayCPT can be used to define subsurface stratigraphy Immediately seal all penetrations not destined for
future useDo not screen monitoring wells across multiple
water-bearing zonesInstall “nests” of wells to define multiple water-
bearing zonesUse isolation casing, separate well screens, grout
seal, etc. to preserve aquitards
46
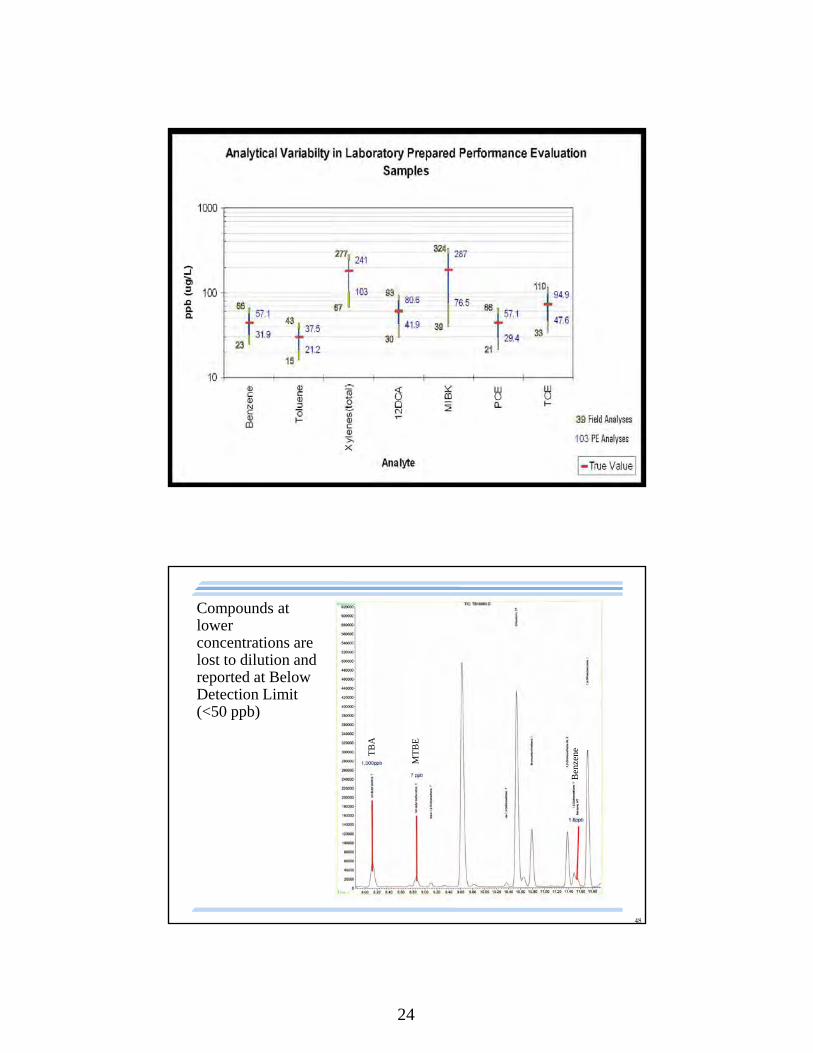
Analytical Variability in Laboratory Prepared Performance Evaluation Samples
5-liter certified "clean" water
Add42.8 ug/liter Benzene20.0 ug/liter Toluene185 ug/liter Xylene60.0 ug/liter 1,2 DCA197 ug/liter MIBK42.4 ug/liter PCE71.5 ug/liter TCE
Six samples each of four "outside" laboratories
Six samples analyzed by "in-house" laboratory
24
47
48
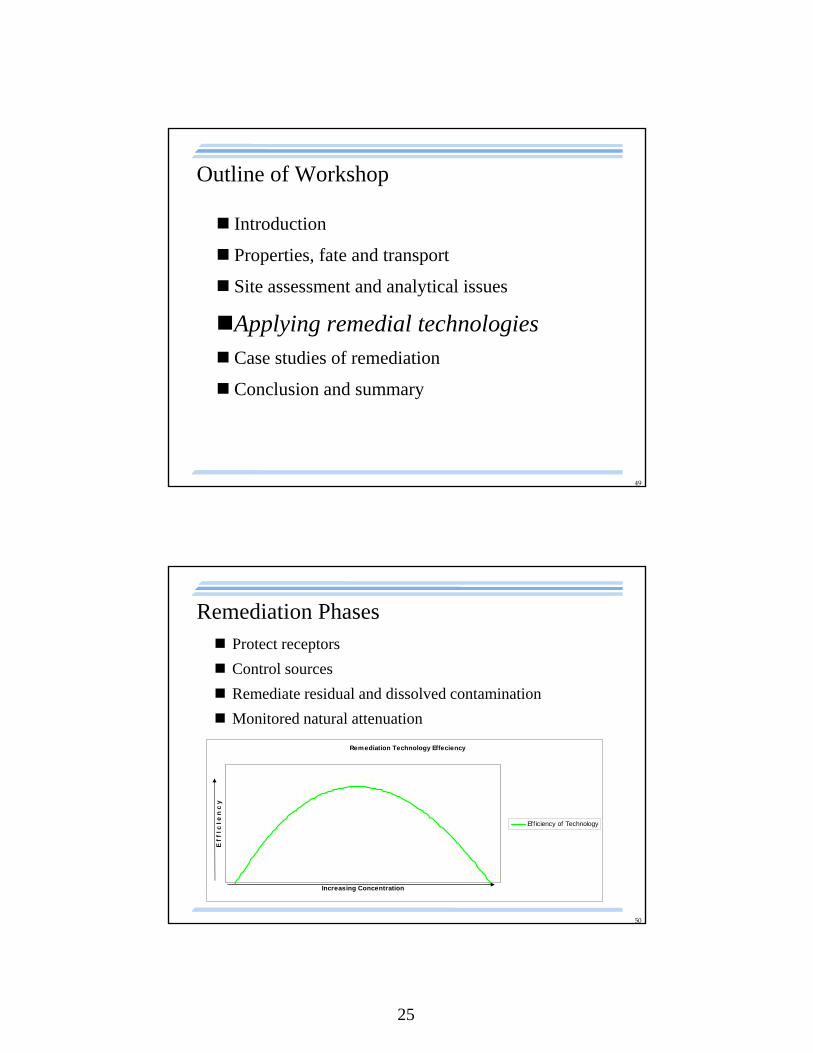
Compounds at lower concentrations are lost to dilution and reported at Below Detection Limit(<50 ppb)
TB
A
MT
BE
Ben
zene
25
49
Outline of Workshop
Introduction
Properties, fate and transport
Site assessment and analytical issues
Applying remedial technologies Case studies of remediation
Conclusion and summary
50
Remediation Phases Protect receptors
Control sources
Remediate residual and dissolved contamination
Monitored natural attenuation
Remediation Technology Effeciency
Increasing Concentration
E f
f I
c I e
n c
y
Efficiency of Technology
26
51
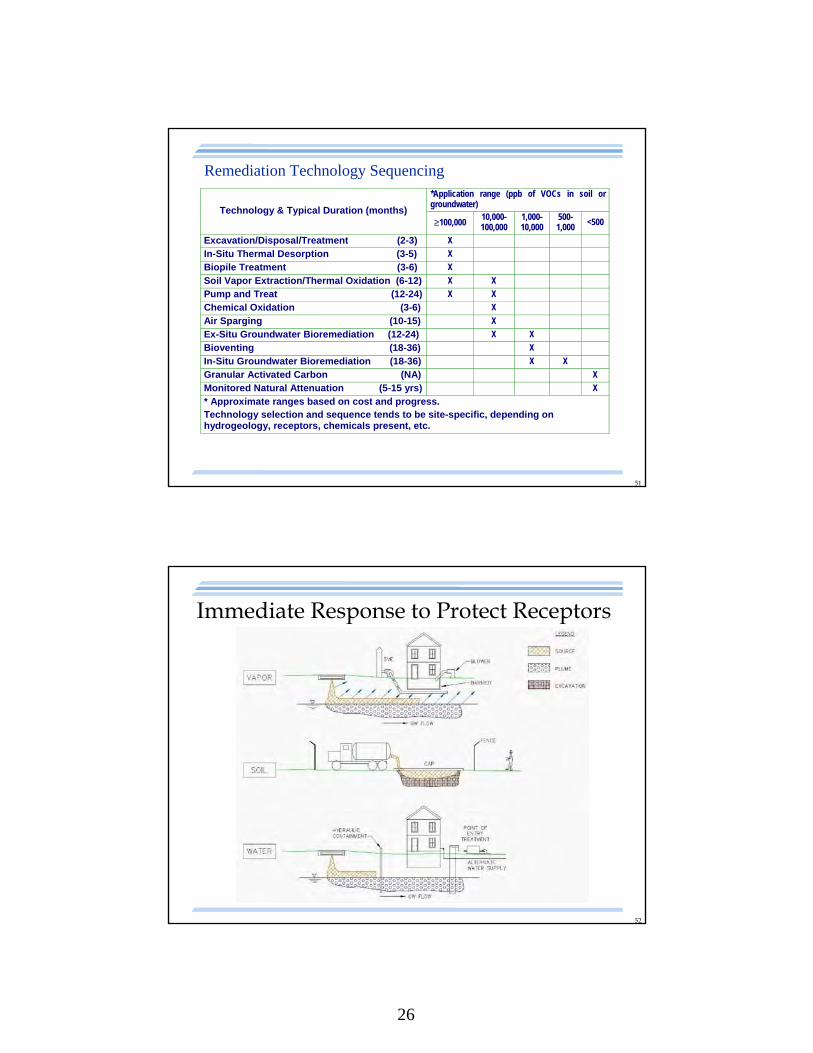
Remediation Technology Sequencing*Application range (ppb of VOCs in soil or groundwater)
Technology & Typical Duration (months) 100,000
10,000-100,000
1,000-10,000
500-1,000 <500
Excavation/Disposal/Treatment (2-3) X
In-Situ Thermal Desorption (3-5) X
Biopile Treatment (3-6) X
Soil Vapor Extraction/Thermal Oxidation (6-12) X X
Pump and Treat (12-24) X X
Chemical Oxidation (3-6) X
Air Sparging (10-15) X
Ex-Situ Groundwater Bioremediation (12-24) X X
Bioventing (18-36) X
In-Situ Groundwater Bioremediation (18-36) X X
Granular Activated Carbon (NA) X
Monitored Natural Attenuation (5-15 yrs) X
* Approximate ranges based on cost and progress. Technology selection and sequence tends to be site-specific, depending on hydrogeology, receptors, chemicals present, etc.
52
Immediate Response to Protect Receptors
27
53
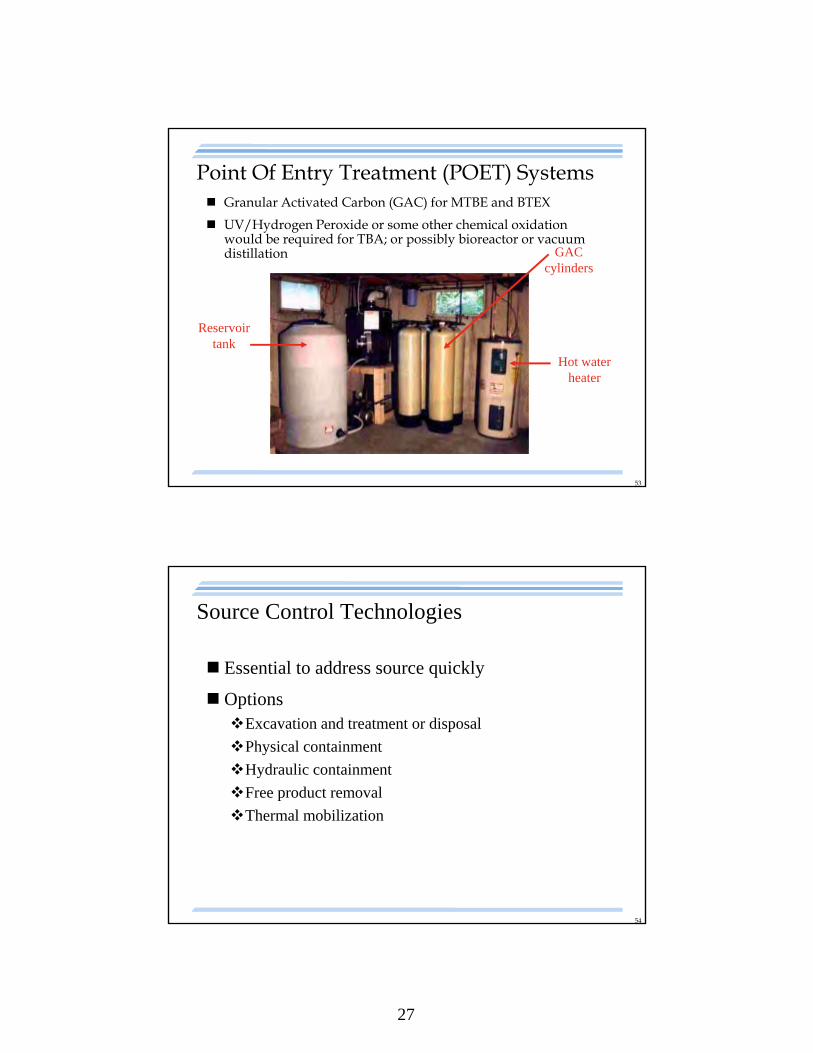
Point Of Entry Treatment (POET) Systems Granular Activated Carbon (GAC) for MTBE and BTEX
UV/Hydrogen Peroxide or some other chemical oxidation would be required for TBA; or possibly bioreactor or vacuum distillation
Hot water heater
GAC cylinders
Reservoir tank
54
Source Control Technologies
Essential to address source quickly
OptionsExcavation and treatment or disposal
Physical containment
Hydraulic containment
Free product removal
Thermal mobilization
28
55
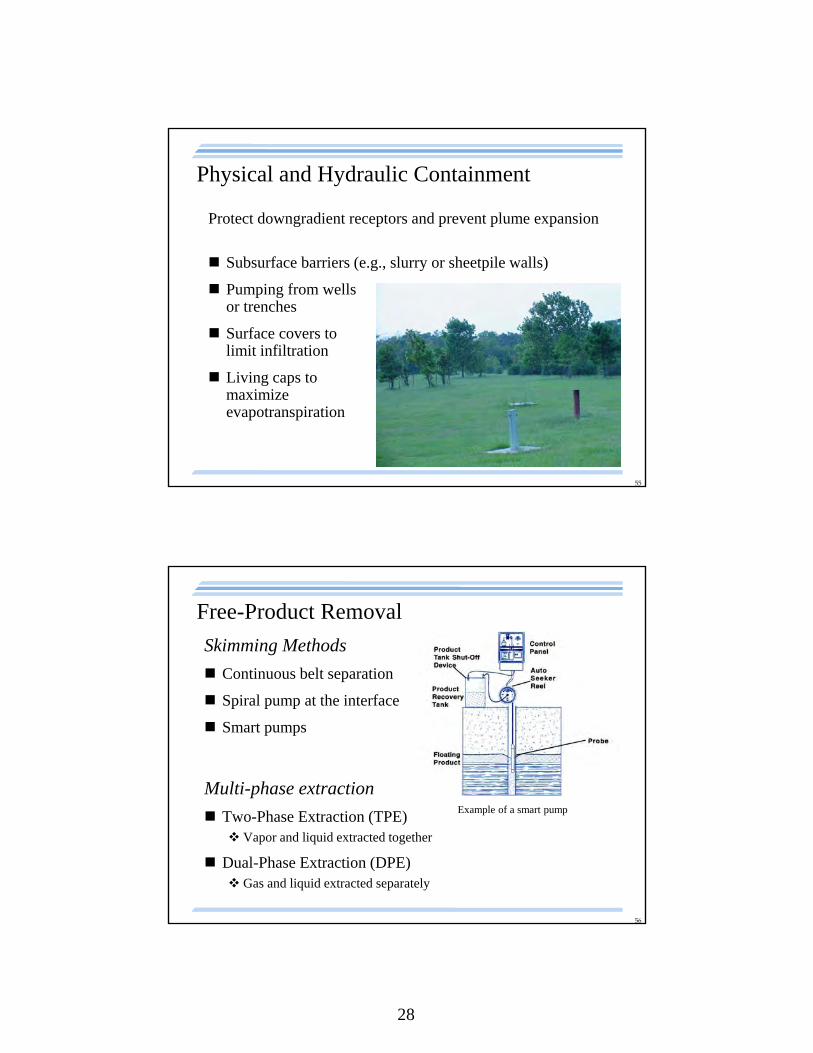
Physical and Hydraulic Containment
Protect downgradient receptors and prevent plume expansion
Subsurface barriers (e.g., slurry or sheetpile walls)
Pumping from wells or trenches
Surface covers to limit infiltration
Living caps to maximize evapotranspiration
56
Free-Product Removal
Skimming Methods
Continuous belt separation
Spiral pump at the interface
Smart pumps
Multi-phase extraction
Two-Phase Extraction (TPE) Vapor and liquid extracted together
Dual-Phase Extraction (DPE) Gas and liquid extracted separately
Example of a smart pump
29
57
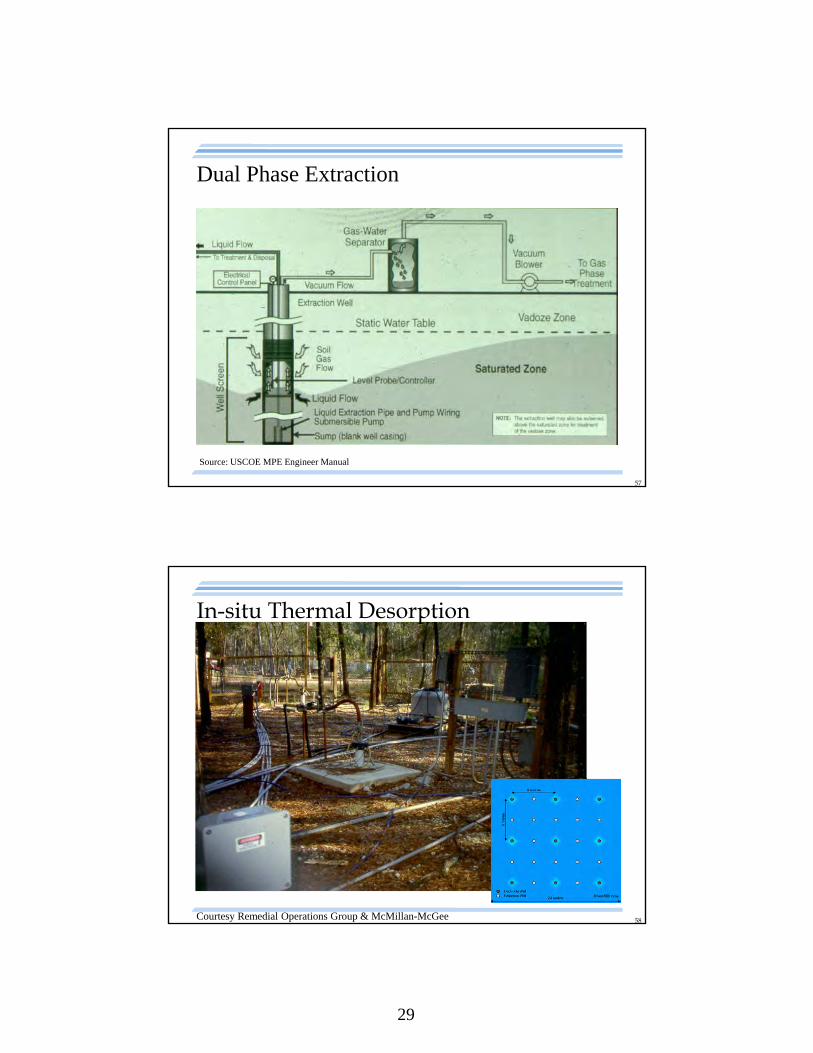
Dual Phase Extraction
Source: USCOE MPE Engineer Manual
58
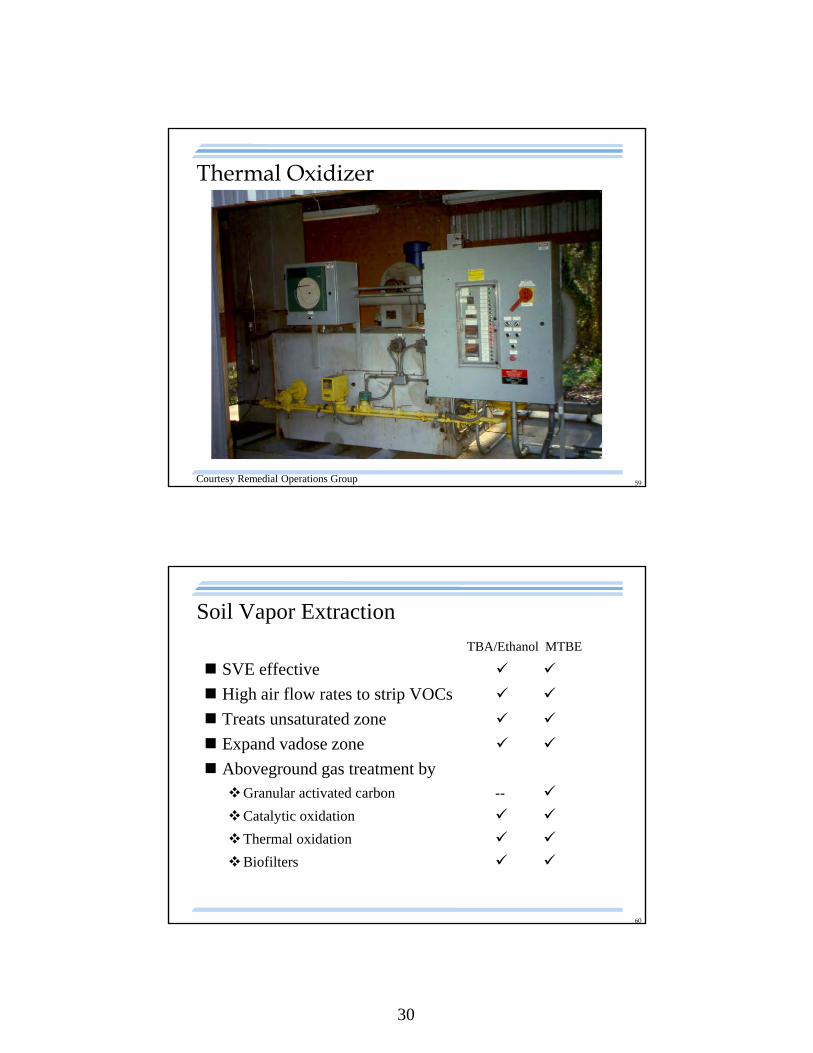
In-situ Thermal Desorption
Courtesy Remedial Operations Group & McMillan-McGee
30
59
Thermal Oxidizer
Courtesy Remedial Operations Group
60
Soil Vapor Extraction
TBA/Ethanol MTBE
SVE effective
High air flow rates to strip VOCs
Treats unsaturated zone
Expand vadose zone
Aboveground gas treatment byGranular activated carbon --
Catalytic oxidation
Thermal oxidation
Biofilters
31
61
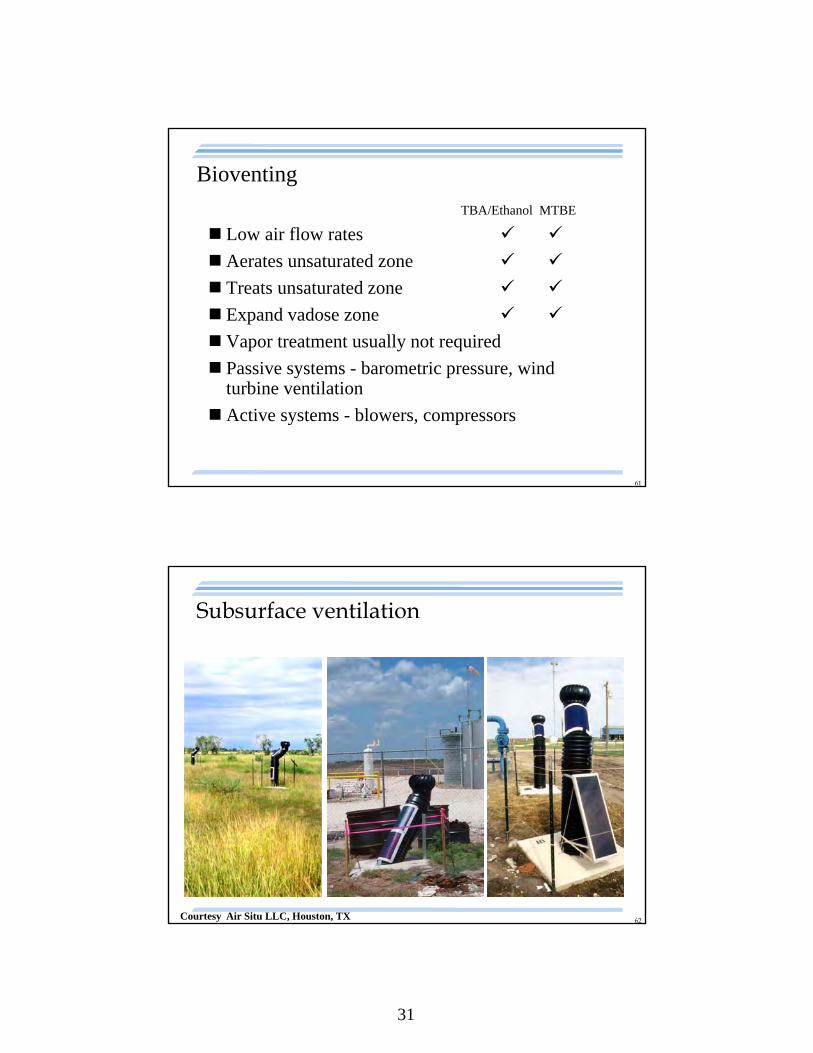
Bioventing
TBA/Ethanol MTBE
Low air flow rates
Aerates unsaturated zone
Treats unsaturated zone
Expand vadose zone
Vapor treatment usually not required
Passive systems - barometric pressure, wind turbine ventilation
Active systems - blowers, compressors
62
Subsurface ventilation
Courtesy Air Situ LLC, Houston, TX
32
63
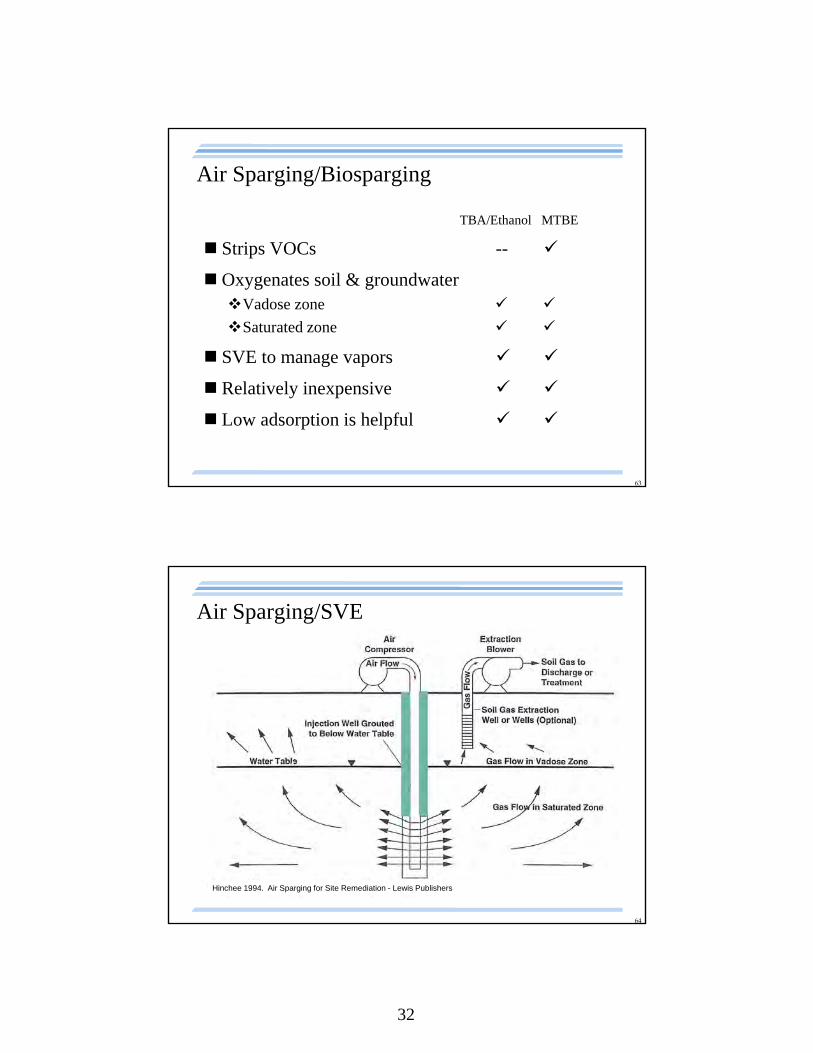
Air Sparging/Biosparging
TBA/Ethanol MTBE
Strips VOCs --
Oxygenates soil & groundwaterVadose zone
Saturated zone
SVE to manage vapors
Relatively inexpensive
Low adsorption is helpful
64
Air Sparging/SVE
Hinchee 1994. Air Sparging for Site Remediation - Lewis Publishers
33
65
Groundwater Pump and TreatTBA/Ethanol MTBE
Soluble
Non-adsorptive
Pump and treat very effective
Aboveground water treated by:Granular activated carbon --
Air stripping -- » Vapor treatment required
POTW - with pretreat if necessary
Bioreactor
Advanced oxidation processes » e.g. ozone, UV, UV/peroxide
66
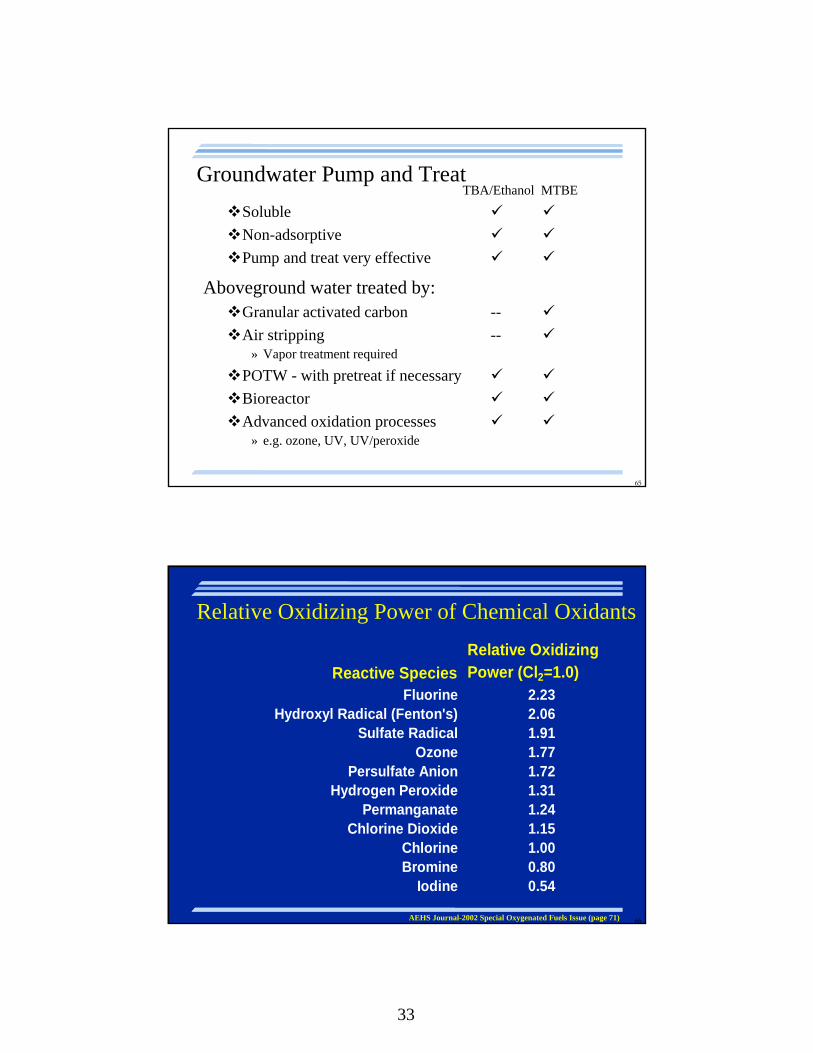
Relative Oxidizing Power of Chemical Oxidants
AEHS Journal-2002 Special Oxygenated Fuels Issue (page 71)
Relative Oxidizing
Reactive Species Power (Cl2=1.0)Fluorine 2.23
Hydroxyl Radical (Fenton's) 2.06Sulfate Radical 1.91
Ozone 1.77Persulfate Anion 1.72
Hydrogen Peroxide 1.31Permanganate 1.24
Chlorine Dioxide 1.15Chlorine 1.00Bromine 0.80
Iodine 0.54
34
67
In Situ Chemical Oxidation Treatment Considerations
TBA/Ethanol MTBE
Non-target organics/inorganics
Choice of oxidant is site-specific
Impact of treatment zone pH
Distribution of oxidant
Residual oxidation state In-situ bioremediation
68
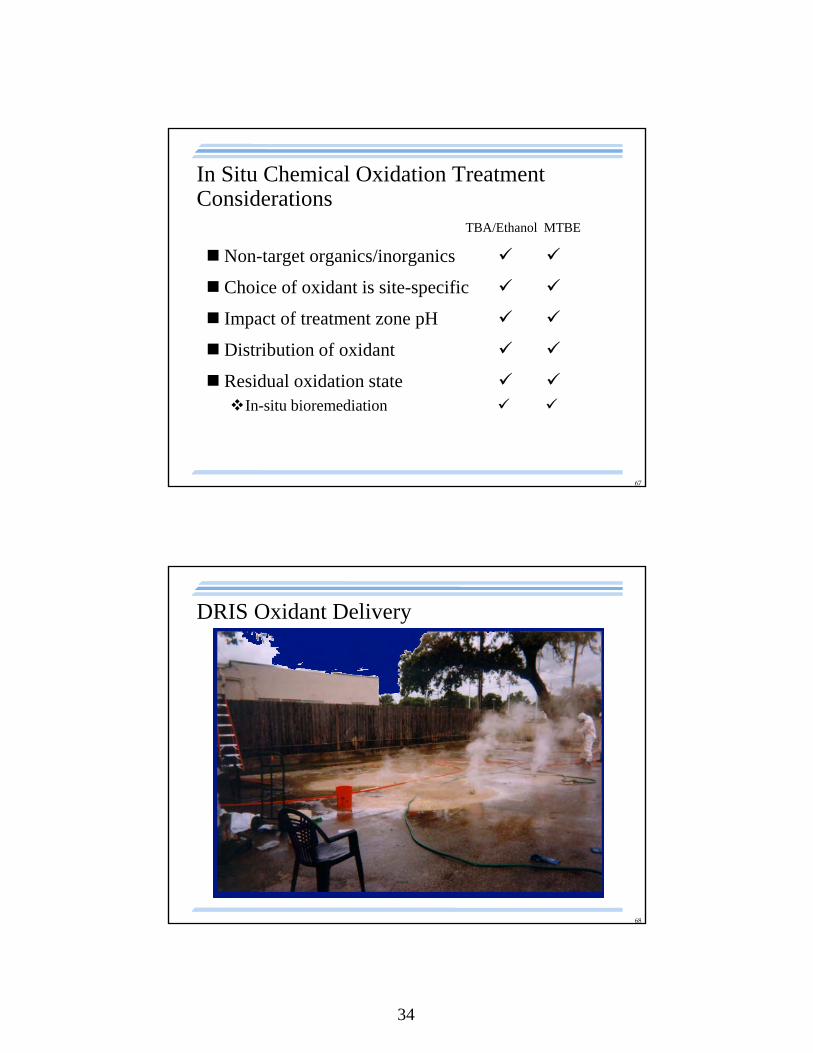
DRIS Oxidant Delivery
35
69
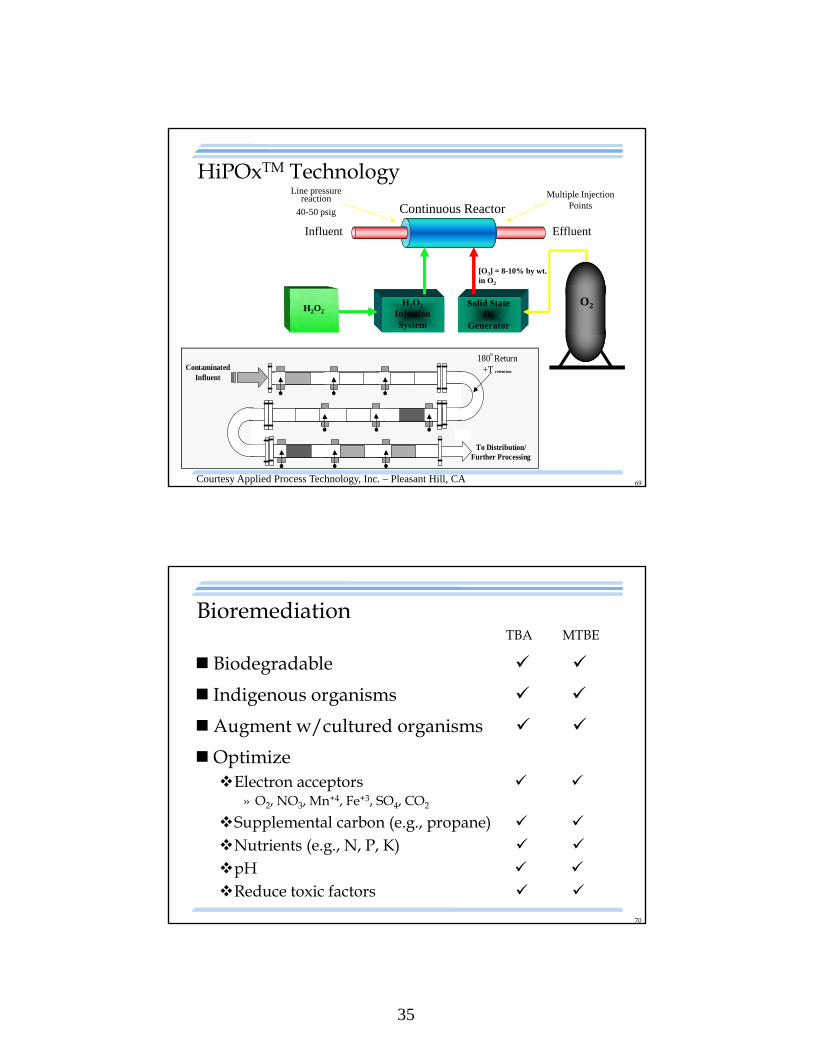
HiPOxTM Technology
O2H2O2
Continuous Reactor
Solid State O3
Generator
H2O2
Injection System
Influent Effluent
Line pressure reaction
40-50 psig
Multiple Injection Points
[O3] = 8-10% by wt. in O2
180o Return
+T retent ion
To Distribution/Further Processing
ContaminatedInfluent
Courtesy Applied Process Technology, Inc. – Pleasant Hill, CA
70
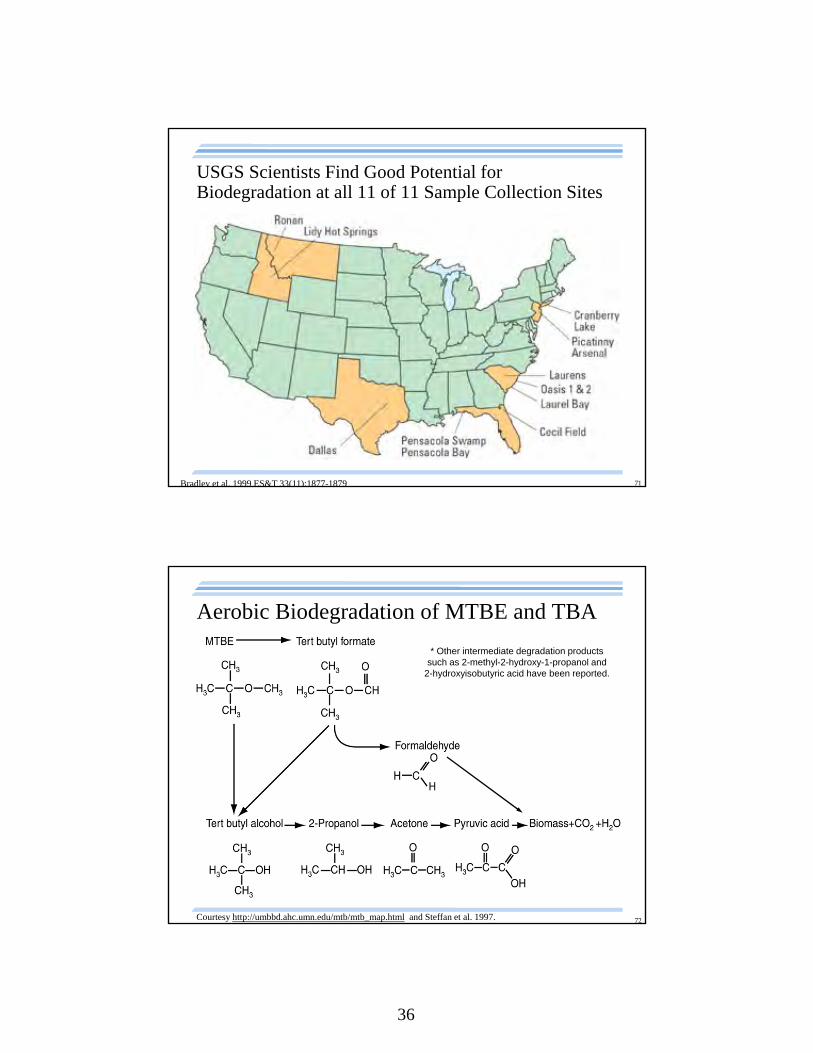
BioremediationTBA MTBE
Biodegradable
Indigenous organisms
Augment w/cultured organisms
OptimizeElectron acceptors
» O2, NO3, Mn+4, Fe+3, SO4, CO2
Supplemental carbon (e.g., propane)
Nutrients (e.g., N, P, K)
pH
Reduce toxic factors
36
71
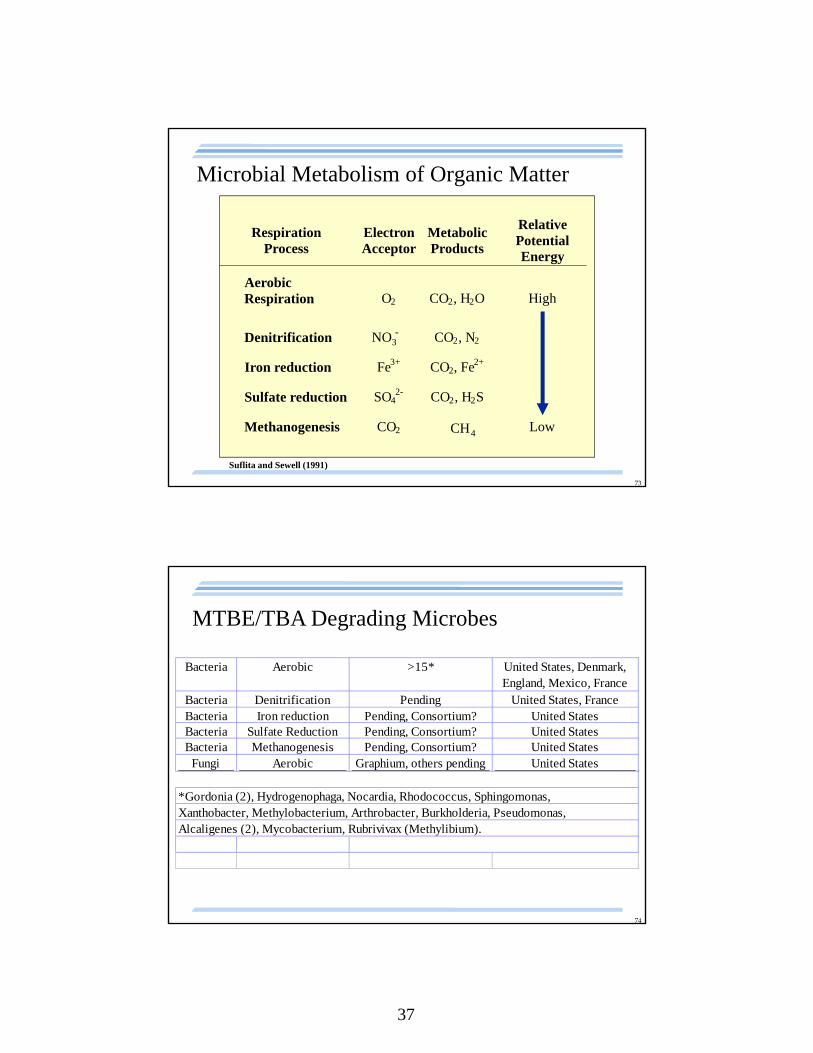
USGS Scientists Find Good Potential for Biodegradation at all 11 of 11 Sample Collection Sites
Bradley et al. 1999 ES&T 33(11):1877-1879
72
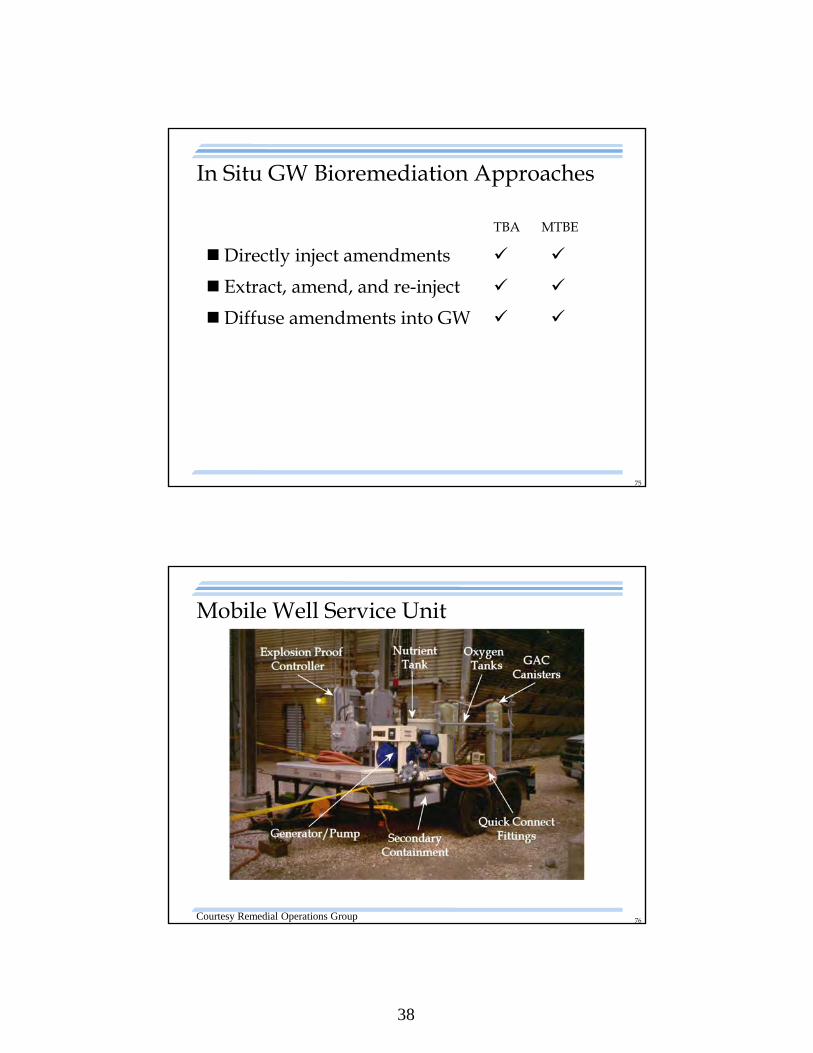
Aerobic Biodegradation of MTBE and TBA
Courtesy http://umbbd.ahc.umn.edu/mtb/mtb_map.html and Steffan et al. 1997.
* Other intermediate degradation products such as 2-methyl-2-hydroxy-1-propanol and
2-hydroxyisobutyric acid have been reported.
37
73
RespirationProcess
ElectronAcceptor
MetabolicProducts
RelativePotentialEnergy
AerobicRespiration O2 CO2, H2O High
Denitrification NO3- CO2, N2
Iron reduction Fe3+ CO2, Fe2+
Sulfate reduction SO42- CO2, H2S
Methanogenesis CO2 CH4 Low
Suflita and Sewell (1991)
Microbial Metabolism of Organic Matter
74
Bacteria Aerobic >15* United States, Denmark, England, Mexico, France
Bacteria Denitrification Pending United States, FranceBacteria Iron reduction Pending, Consortium? United StatesBacteria Sulfate Reduction Pending, Consortium? United StatesBacteria Methanogenesis Pending, Consortium? United States
Fungi Aerobic Graphium, others pending United States
*Gordonia (2), Hydrogenophaga, Nocardia, Rhodococcus, Sphingomonas, Xanthobacter, Methylobacterium, Arthrobacter, Burkholderia, Pseudomonas, Alcaligenes (2), Mycobacterium, Rubrivivax (Methylibium).
MTBE/TBA Degrading Microbes
38
75
In Situ GW Bioremediation Approaches
TBA MTBE
Directly inject amendments
Extract, amend, and re-inject
Diffuse amendments into GW
76
Mobile Well Service Unit
Courtesy Remedial Operations Group
39
77
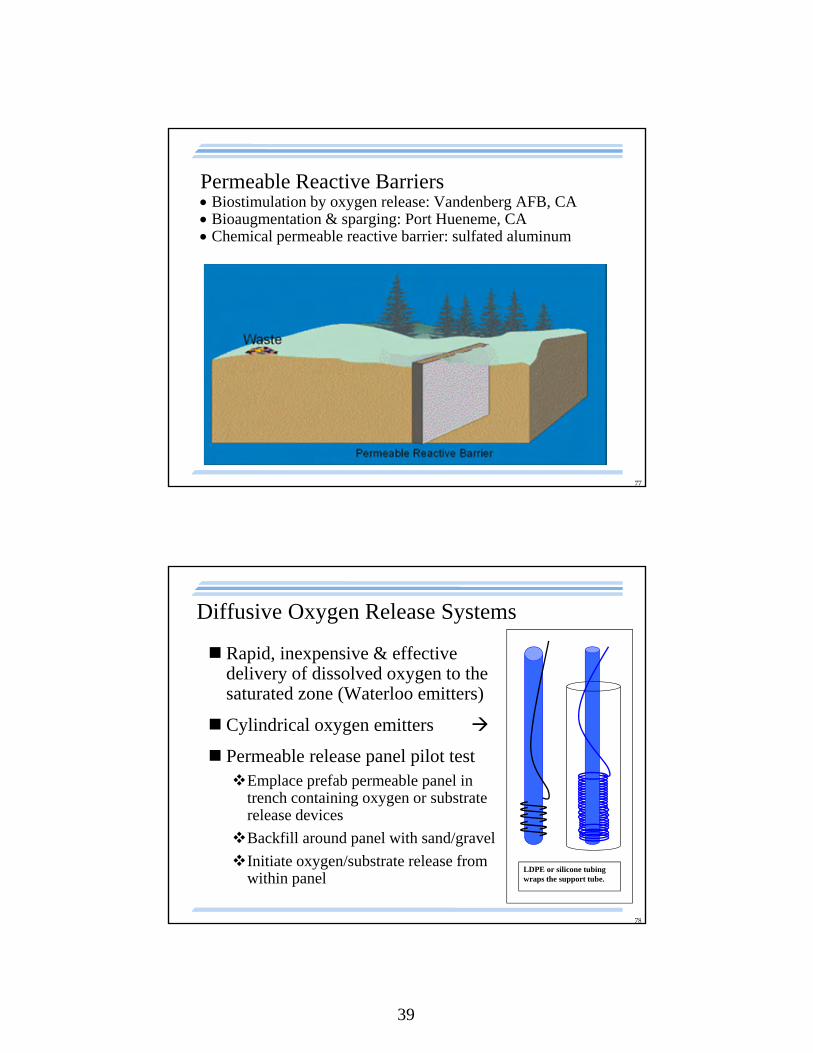
Permeable Reactive Barriers Biostimulation by oxygen release: Vandenberg AFB, CA Bioaugmentation & sparging: Port Hueneme, CA Chemical permeable reactive barrier: sulfated aluminum
78
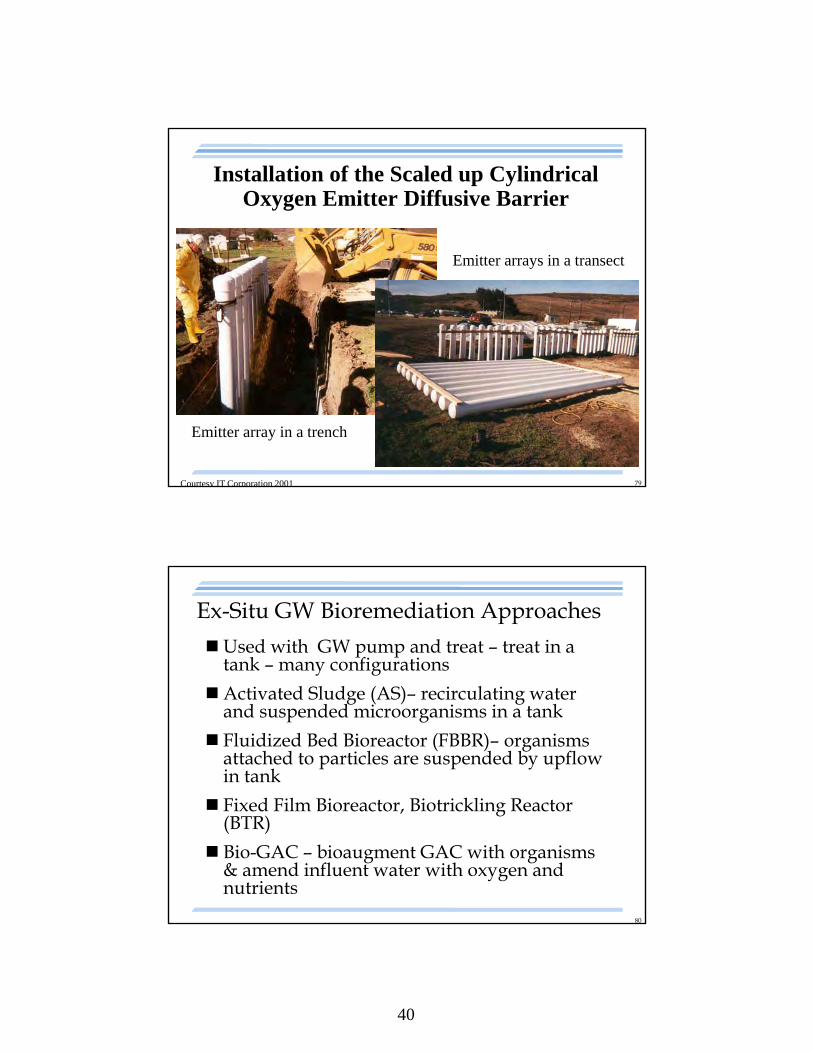
Diffusive Oxygen Release Systems
Rapid, inexpensive & effective delivery of dissolved oxygen to the saturated zone (Waterloo emitters)
Cylindrical oxygen emitters
Permeable release panel pilot testEmplace prefab permeable panel in
trench containing oxygen or substrate release devices
Backfill around panel with sand/gravel
Initiate oxygen/substrate release from within panel
LDPE or silicone tubing wraps the support tube.
40
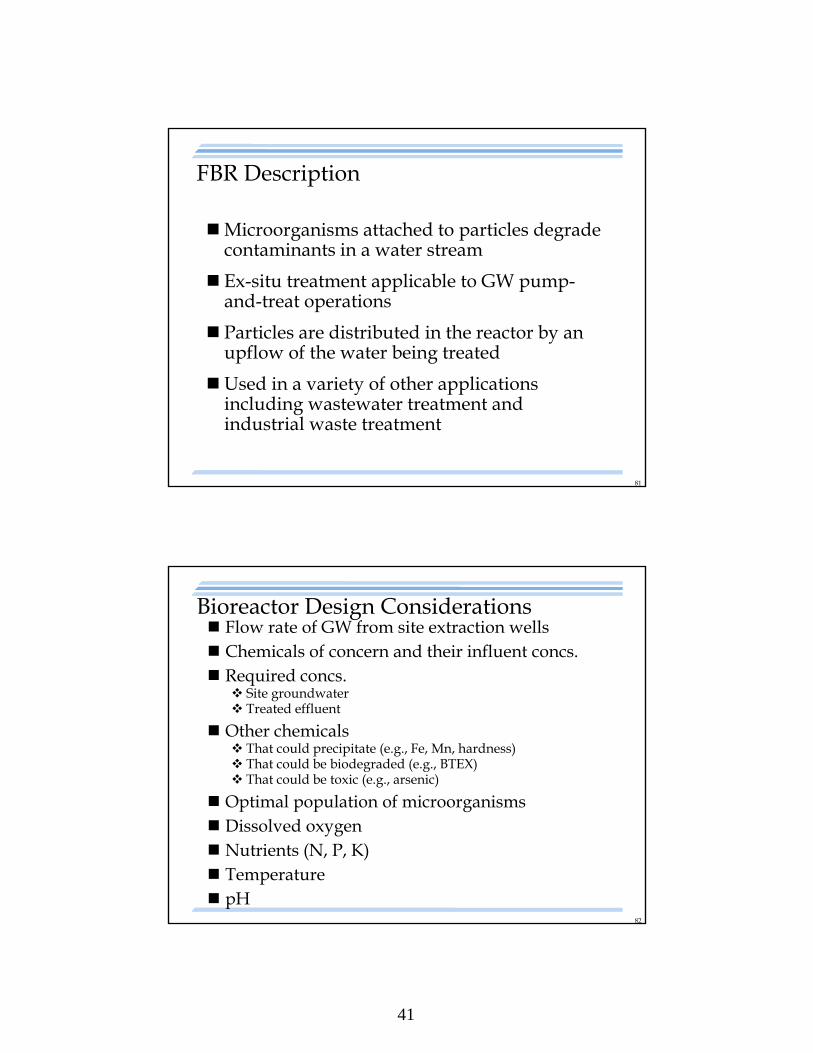
79
Installation of the Scaled up Cylindrical Oxygen Emitter Diffusive Barrier
Emitter arrays in a transect
Emitter array in a trench
Courtesy IT Corporation 2001
80
Ex-Situ GW Bioremediation Approaches
Used with GW pump and treat – treat in a tank – many configurations
Activated Sludge (AS)– recirculating water and suspended microorganisms in a tank
Fluidized Bed Bioreactor (FBBR)– organisms attached to particles are suspended by upflow in tank
Fixed Film Bioreactor, Biotrickling Reactor (BTR)
Bio-GAC – bioaugment GAC with organisms & amend influent water with oxygen and nutrients
41
81
FBR Description
Microorganisms attached to particles degrade contaminants in a water stream
Ex-situ treatment applicable to GW pump-and-treat operations
Particles are distributed in the reactor by an upflow of the water being treated
Used in a variety of other applications including wastewater treatment and industrial waste treatment
82
Bioreactor Design Considerations Flow rate of GW from site extraction wells Chemicals of concern and their influent concs. Required concs.
Site groundwater Treated effluent
Other chemicals That could precipitate (e.g., Fe, Mn, hardness) That could be biodegraded (e.g., BTEX) That could be toxic (e.g., arsenic)
Optimal population of microorganisms Dissolved oxygen Nutrients (N, P, K) Temperature pH
42
83
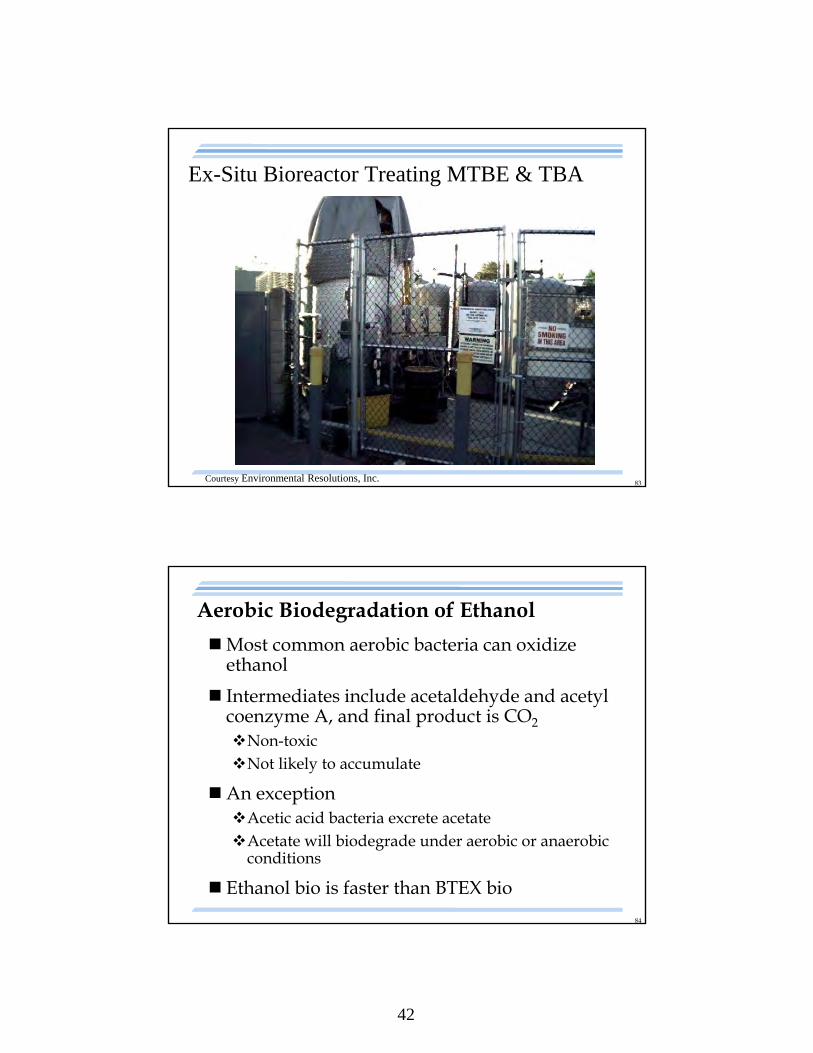
Ex-Situ Bioreactor Treating MTBE & TBA
Courtesy Environmental Resolutions, Inc.
84
Aerobic Biodegradation of Ethanol
Most common aerobic bacteria can oxidize ethanol
Intermediates include acetaldehyde and acetyl coenzyme A, and final product is CO2
Non-toxicNot likely to accumulate
An exceptionAcetic acid bacteria excrete acetateAcetate will biodegrade under aerobic or anaerobic
conditions
Ethanol bio is faster than BTEX bio
43
85
Anaerobic Biodegradation of EthanolMost ethanol field sites will be anaerobic
(having run out of oxygen by aerobic bio)
Microorganisms that can ferment ethanol are ubiquitous
Ethanol is a common intermediate between organic matter and non-toxic products such as acetate, CO2, CH4, H2 gas
Three stages of fermentation1 – produces organic acids, alcohols, H2, CO2
2 – produces acetate, H2, CO2
3 – produces CO2, CH4
Ethanol bio is faster than BTEX bio
86
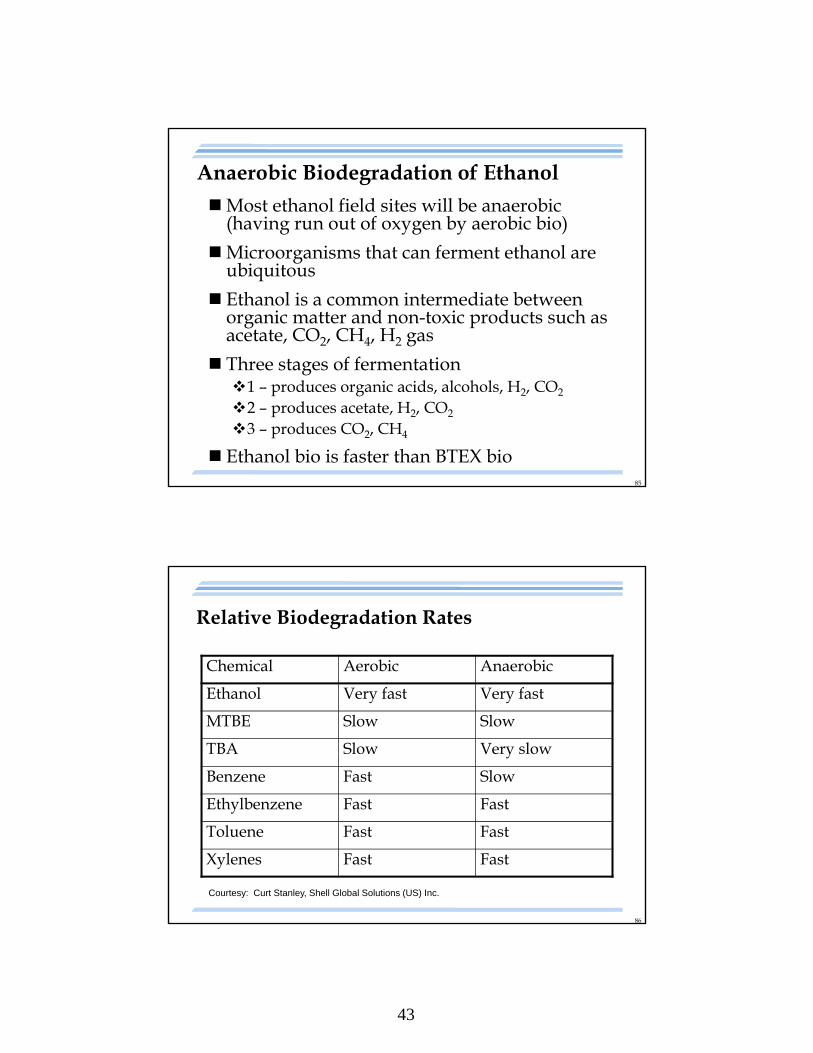
Relative Biodegradation Rates
Chemical Aerobic Anaerobic
Ethanol Very fast Very fast
MTBE Slow Slow
TBA Slow Very slow
Benzene Fast Slow
Ethylbenzene Fast Fast
Toluene Fast Fast
Xylenes Fast Fast
Courtesy: Curt Stanley, Shell Global Solutions (US) Inc.
44
87
Gasoline with 10% Ethanol Ethanol should not directly inhibit BTEX
biodegradation
Ethanol degraders depleting electron acceptors will reduce their availability to BTEX degradersCan lead to longer BTEX plumes
» Particularly benzene plumes
Reportedly can cause dehydration of clays, producing microfractures within the clay
Concern about ethanol degrader biomass possibly clogging aquifer and/or well screens?
88
Relative Plume Lengths
Modeling efforts – 10% ethanol predicted to increase benzene plume lengths by:17-34% (Malcolm Pirnie, 1998)100% (McNab et al., 1999)10-150% (Molson et al., 2002)
Ruiz-Aguilar et al. (2003) study of:217 sites in Iowa (without ethanol)29 sites in Kansas (10% ethanol by volume)Benzene plumes longer if ethanol present
» Iowa mean 193’ Kansas mean 263’» Iowa median 156’ Kansas median 263’
Toluene plumes were not significantly longer
45
89
Vandenberg AFB Field Experiment
Side by side releases for ~9 months of GW amended with:1-3 mg/l each of benzene, toluene, and o-xylene 1-3 mg/l each of benzene, toluene, and o-xylene,
and 500 mg/l ethanol
Into a sulfate-reducing aquifer20–160 mg/l sulfate; mean value 96 mg/l
Mackay et al., ES&T, 2006
90
Vandenberg Results
Ethanol was rapidly degraded Detected at only one well 0.5 m downgradient of injection wells
Biodegradation of ethanol Led to “plume” of sulfate-depleted water that was transported
downgradient Created methanogenic/acetogenic conditions
Acetate and propionate Apparent intermediates of ethanol biodegradation Migrated further and were thus biodegraded more slowly than
ethanol
BTX degradation in No Ethanol Lane did not significantly alter sulfate concentrations
Mackay et al., ES&T, 2006
46
91
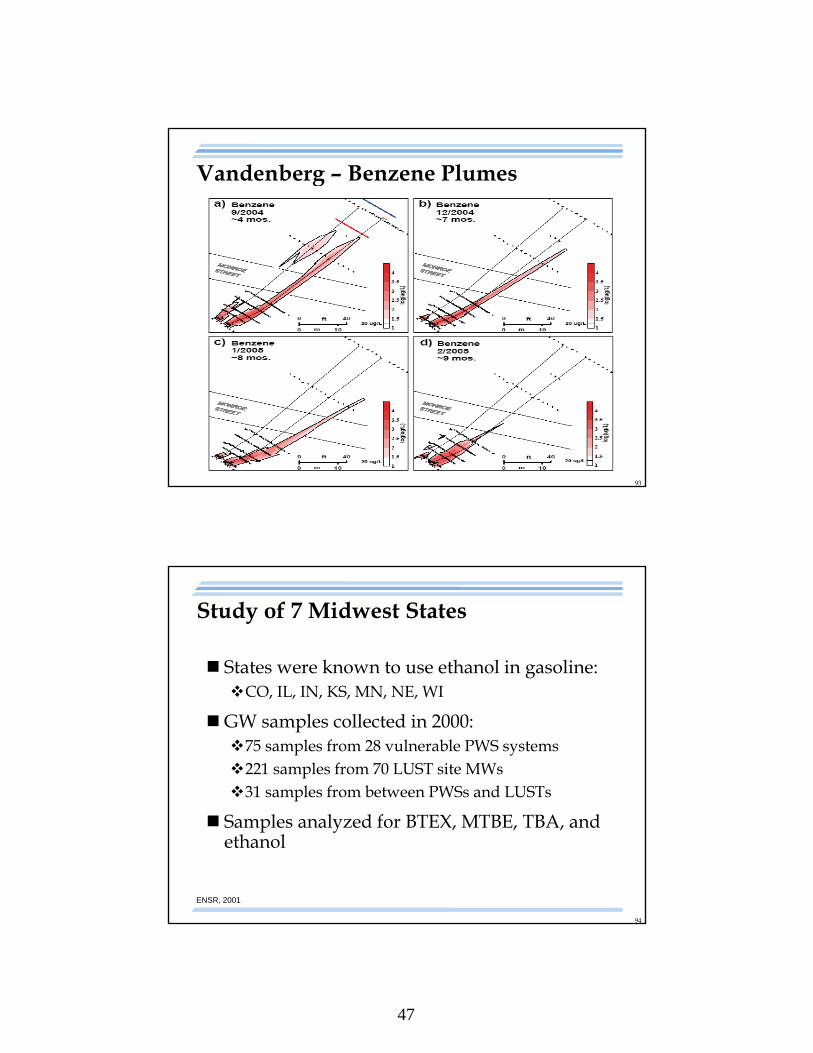
Vandenberg Results
Initially, both BTX plumes extended same distance
Later: Plumes in No Ethanol Lane retracted significantly Plumes in With Ethanol Lane retracted
» More slowly» Not as far
Conclusion: Biodegradation of ethanol can reduce rates of in situ biodegradation of aromatic fuel components in the subsurface Under transient conditions Under near steady-state conditions
Mackay et al., ES&T, 2006
92
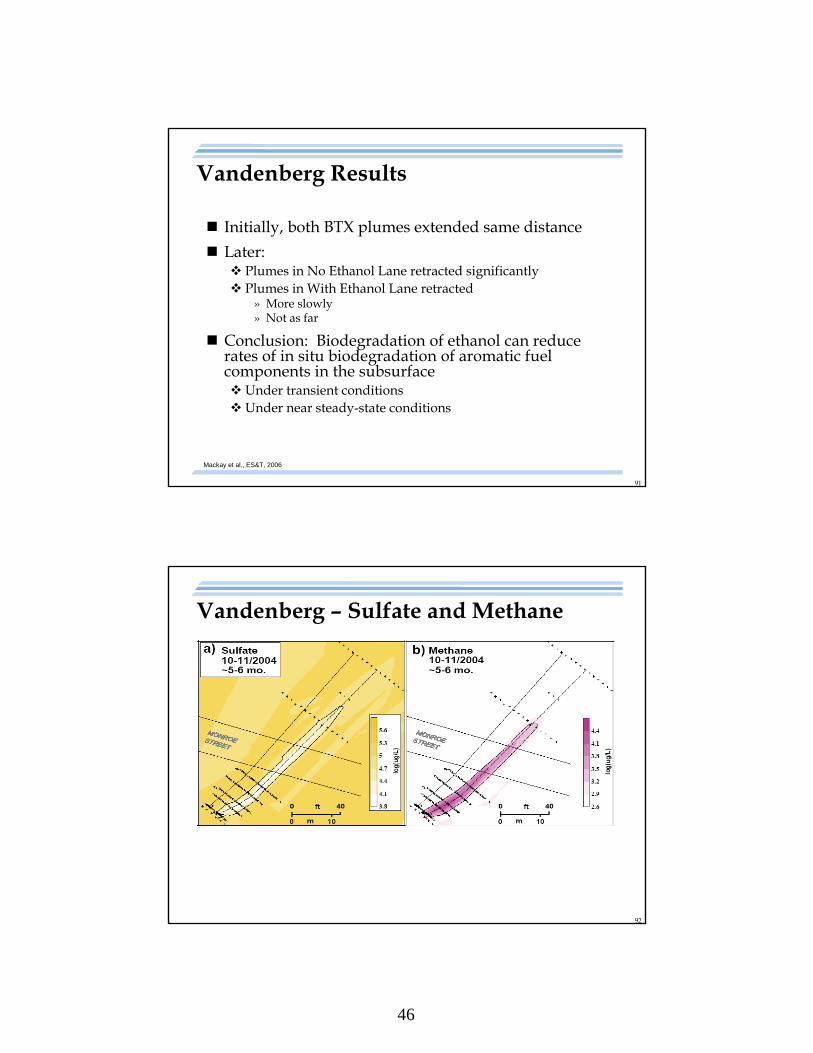
Vandenberg – Sulfate and Methane
47
93
Vandenberg – Benzene Plumes
94
Study of 7 Midwest States
States were known to use ethanol in gasoline:CO, IL, IN, KS, MN, NE, WI
GW samples collected in 2000:75 samples from 28 vulnerable PWS systems221 samples from 70 LUST site MWs31 samples from between PWSs and LUSTs
Samples analyzed for BTEX, MTBE, TBA, and ethanol
ENSR, 2001
48
95
Study of 7 Midwest States
PWS Results:Only 2 samples exceeded regulatory criteria
» Well in NE: 19 ug/l benzene (no other compounds)» Well in NE: 170 ug/l benzene (no other compounds)
Only several other detects» 1 detect of benzene at 3 ug/l» 5 detects of MTBE at 5 ug/l or less
No TBA, ethanol, TEX detected in any samples
ENSR, 2001
96
Study of 7 Midwest States
LUST Site Results:BTEX at 90% of sitesMTBE at 70% of sitesTBA at ~50% of sitesEthanol only in 2 samples from 2 separate sites
» 650 and 130J ug/l
Most releases were 5-10 years old, or more
ENSR, 2001
49
97
Study of 7 Midwest States
Results for Samples between LUSTs and PWSs:Only BTEX detected; no MTBE, TBA, or ethanolGasoline constituents generally not detected more
than 100-200 feet from LUSTsHighest concentrations close to LUSTsLimited extent of impact from LUSTs
ENSR, 2001
98
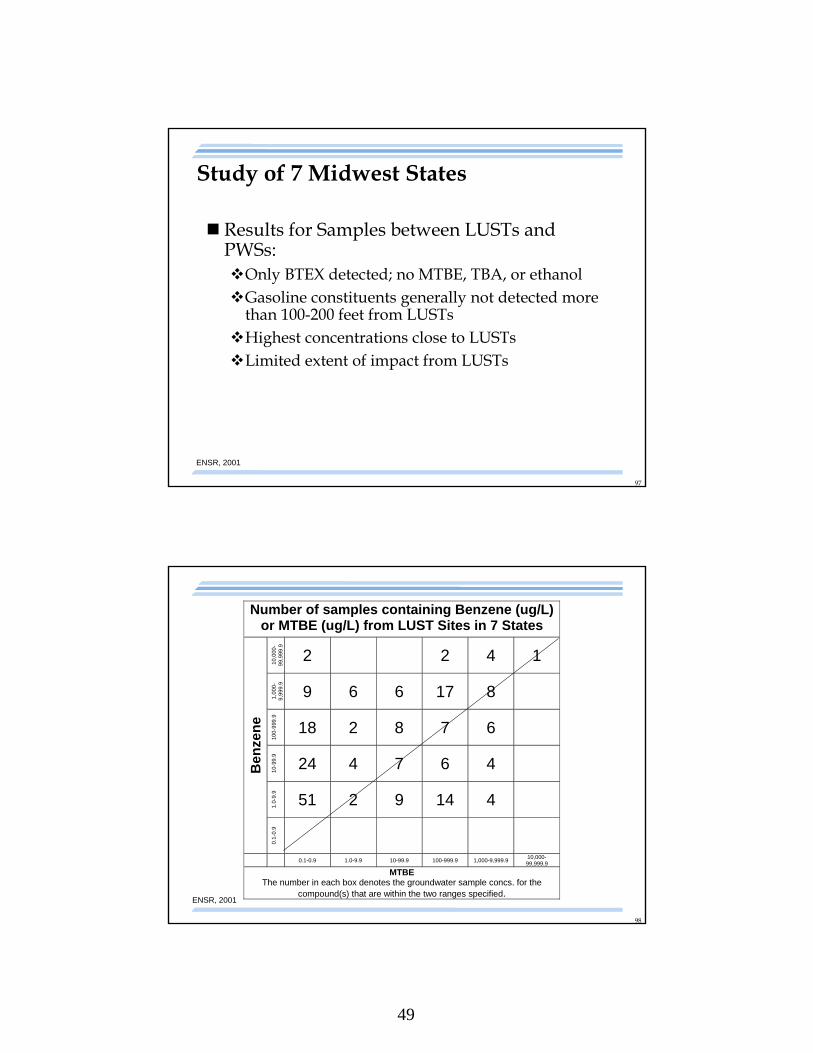
Number of samples containing Benzene (ug/L) or MTBE (ug/L) from LUST Sites in 7 States
10
,000
-9
9,9
99.9
2 2 4 1
1,0
00-
9,9
99.
9
9 6 6 17 8
10
0-9
99.9
18 2 8 7 6
10-
99.9
24 4 7 6 4
1.0
-9.9
51 2 9 14 4
Ben
zen
e 0
.1-0
.9
0.1-0.9 1.0-9.9 10-99.9 100-999.9 1,000-9,999.9 10,000-99,999.9
MTBE The number in each box denotes the groundwater sample concs. for the
compound(s) that are within the two ranges specified.
ENSR, 2001
50
99
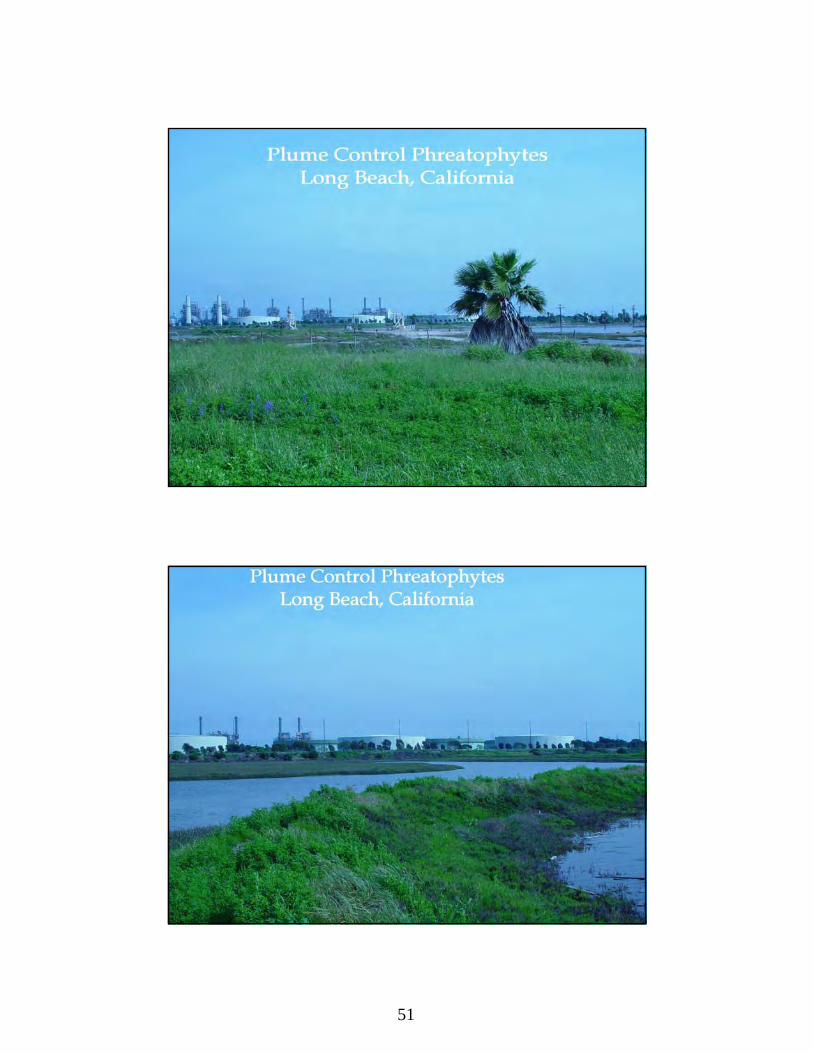
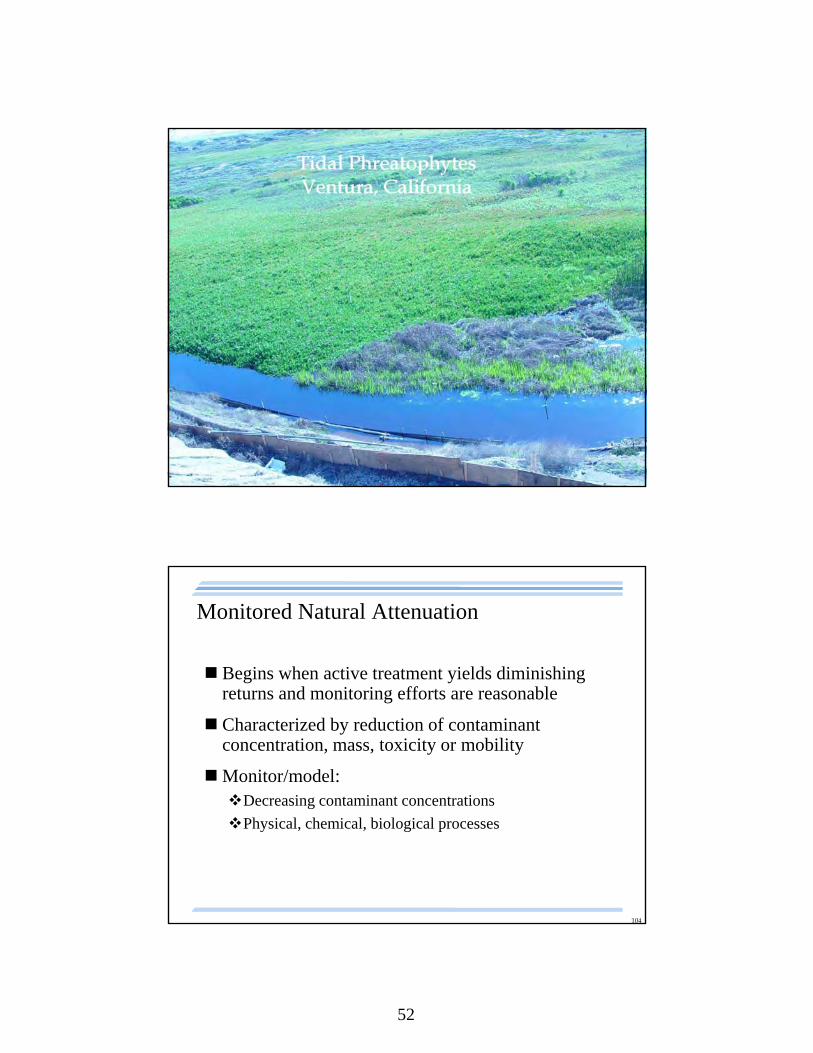
PhytoremediationTBA/Ethanol MTBE
Gradient control/evapotranspiration
Rhizosphere biodegradation
Native species perform best Low maintenance conditions
Plant selection influenced by water balance Model transpiration rate, stand density
Irrigation often required to establish stand Deep watering stimulates deep roots
Water/soil quality affects establishment Salt concentration, pH
100
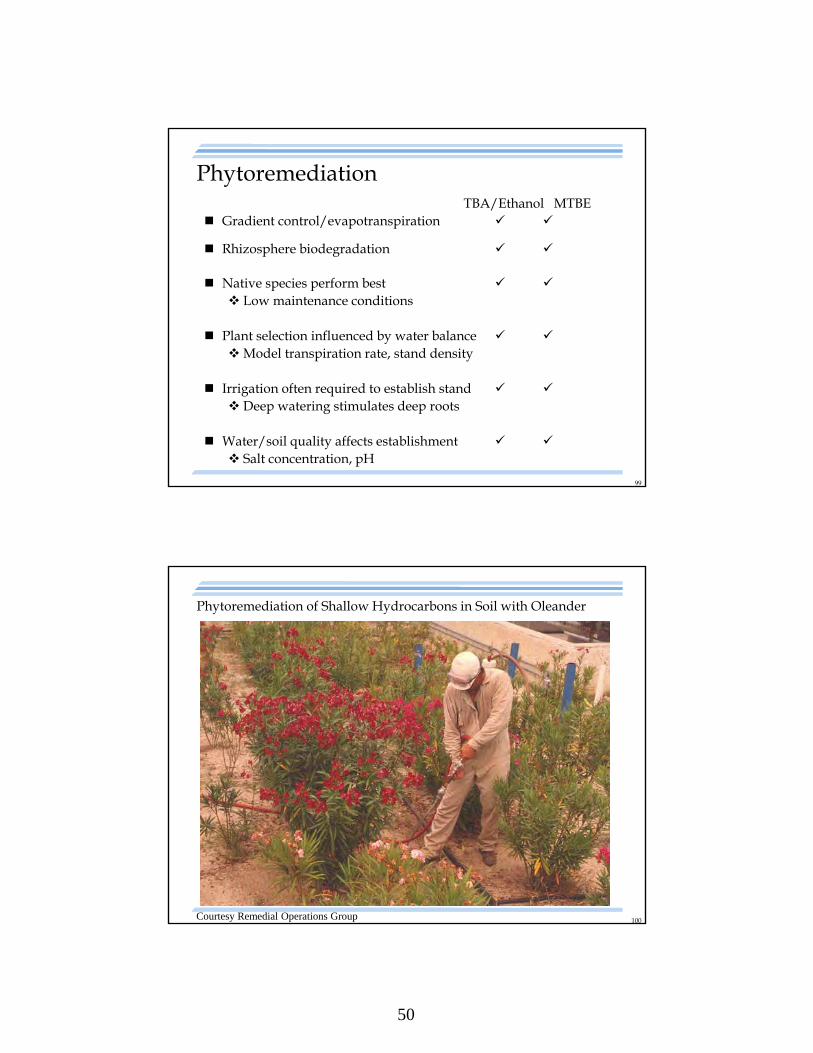
Phytoremediation of Shallow Hydrocarbons in Soil with Oleander
Courtesy Remedial Operations Group
51
101
102
52
103
104
Monitored Natural Attenuation
Begins when active treatment yields diminishing returns and monitoring efforts are reasonable
Characterized by reduction of contaminant concentration, mass, toxicity or mobility
Monitor/model:Decreasing contaminant concentrations
Physical, chemical, biological processes
53
105
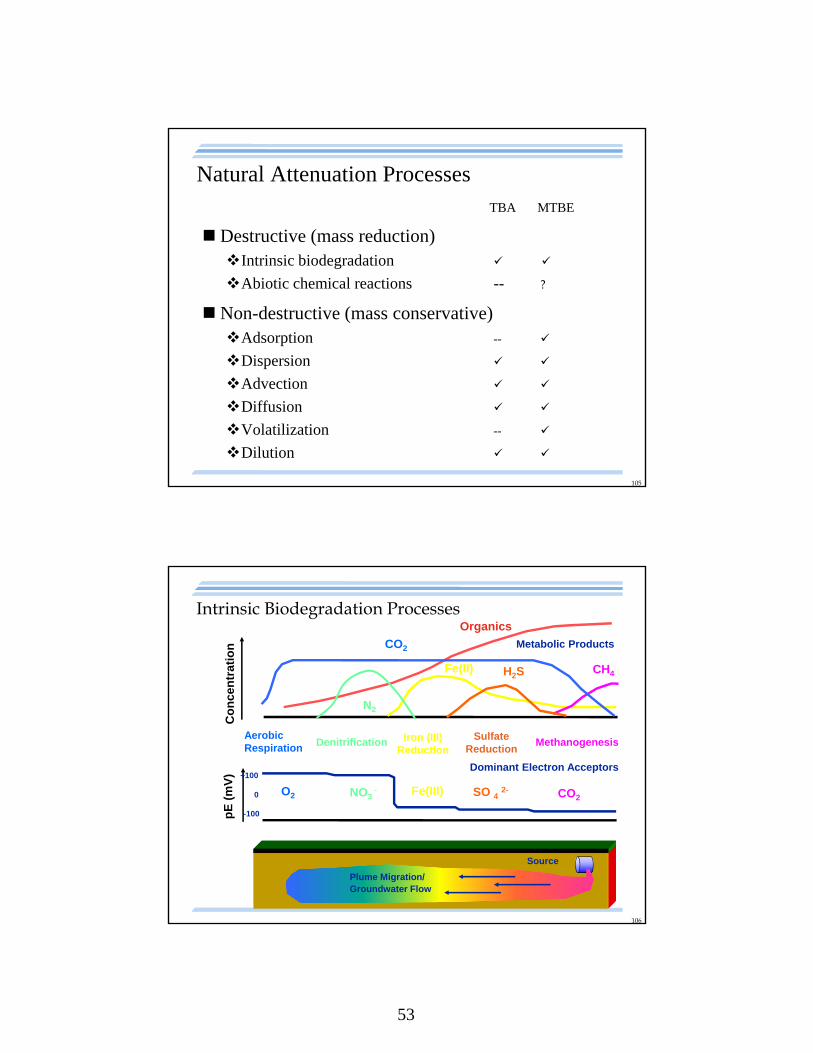
Natural Attenuation ProcessesTBA MTBE
Destructive (mass reduction) Intrinsic biodegradation
Abiotic chemical reactions -- ?
Non-destructive (mass conservative)Adsorption --
Dispersion
Advection
Diffusion
Volatilization --
Dilution
106
Intrinsic Biodegradation Processes
Co
nce
ntr
atio
n Metabolic Products
Dominant Electron Acceptors
N2
Fe(II)
CO2
CH4
Organics
H2S
Aerobic Respiration Denitrification Iron (III)
ReductionSulfate
ReductionMethanogenesis
Fe(III)O2 NO3- SO 4 2- CO2
pE
(m
V) +100
-100
0
Source
Plume Migration/Groundwater Flow
54
107
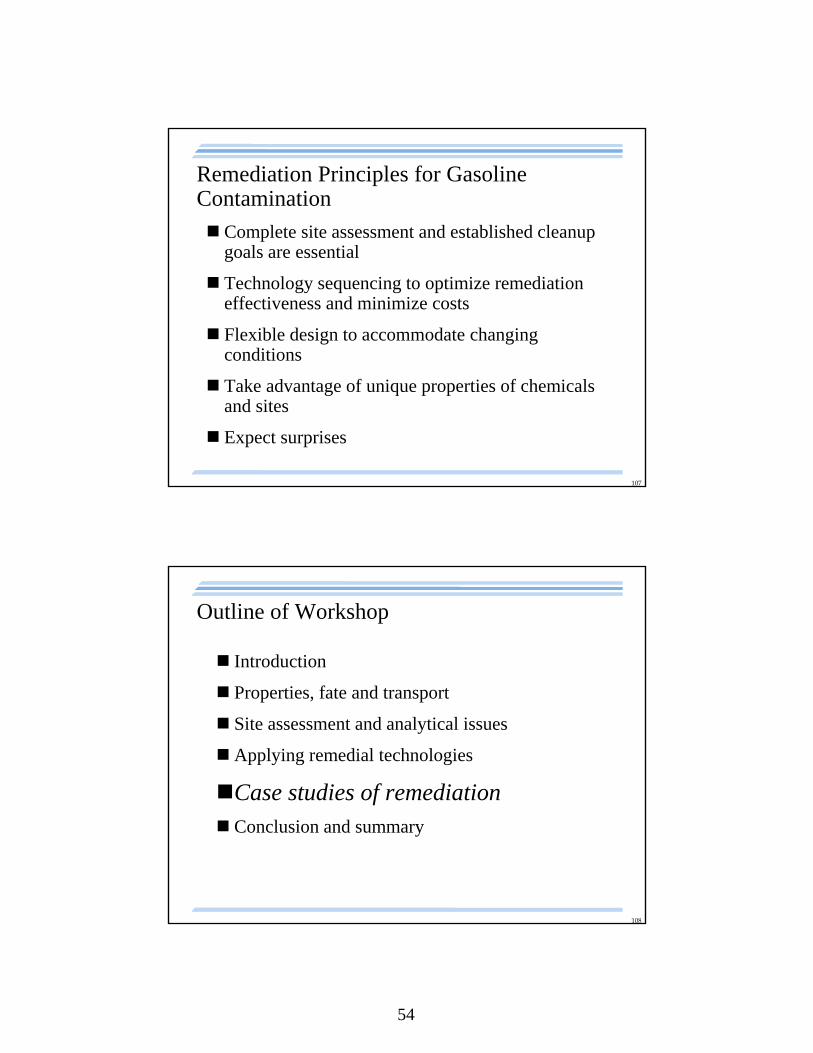
Remediation Principles for Gasoline Contamination
Complete site assessment and established cleanup goals are essential
Technology sequencing to optimize remediation effectiveness and minimize costs
Flexible design to accommodate changing conditions
Take advantage of unique properties of chemicals and sites
Expect surprises
108
Outline of Workshop
Introduction
Properties, fate and transport
Site assessment and analytical issues
Applying remedial technologies
Case studies of remediation Conclusion and summary
55
109
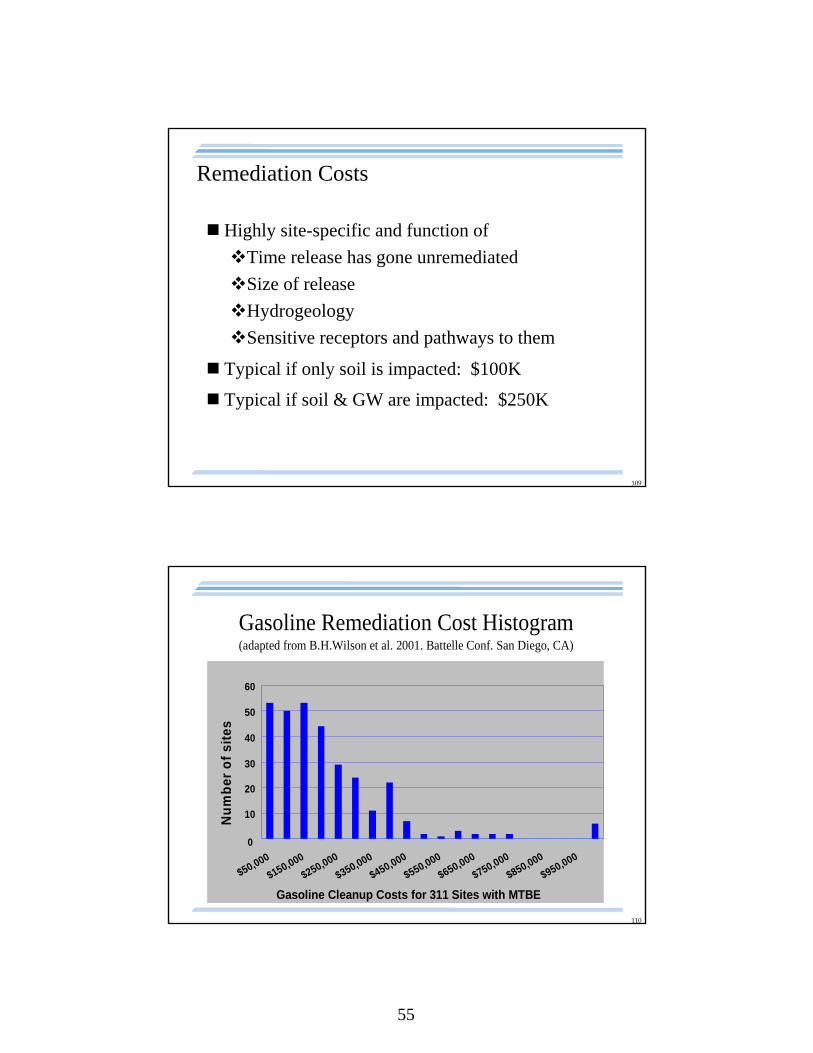
Remediation Costs
Highly site-specific and function of
Time release has gone unremediated
Size of release
Hydrogeology
Sensitive receptors and pathways to them
Typical if only soil is impacted: $100K
Typical if soil & GW are impacted: $250K
110
0
10
20
30
40
50
60
$50,000
$150,000
$250,000
$350,000
$450,000
$550,000
$650,000
$750,000
$850,000
$950,000
Gasoline Cleanup Costs for 311 Sites with MTBE
Nu
mb
er o
f si
tes
Gasoline Remediation Cost Histogram(adapted from B.H.Wilson et al. 2001. Battelle Conf. San Diego, CA)
56
111
$0
$100,000
$200,000
$300,000
$400,000
$500,000
$600,000
$700,000
2004
AS
TS
WM
O
US
Ts
(35)
815
Sites
Clu
-In (90
)
Kan
sas
(124
)
Mai
ne
(106
)
Ver
mont (1
014)
Wat
er S
upply
(43
)
Ser
vice
Sta
tion S
ites
(224
9)
Q1
Minimum
Median
Mean
Maximum
Q3
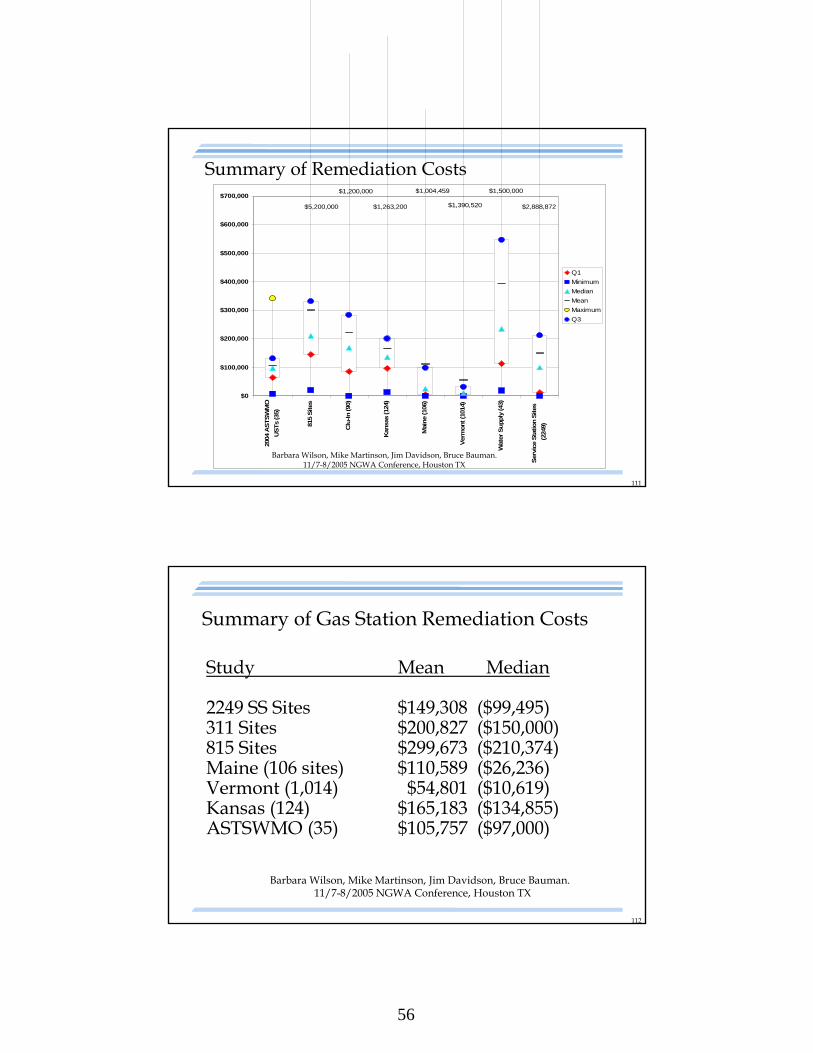
$5,200,000
$1,200,000
$1,263,200
$1,004,459
$1,390,520
$1,500,000
$2,888,872
Barbara Wilson, Mike Martinson, Jim Davidson, Bruce Bauman. 11/7-8/2005 NGWA Conference, Houston TX
Summary of Remediation Costs
112
Summary of Gas Station Remediation Costs
Study Mean Median
2249 SS Sites $149,308 ($99,495)311 Sites $200,827 ($150,000)815 Sites $299,673 ($210,374)Maine (106 sites) $110,589 ($26,236)Vermont (1,014) $54,801 ($10,619)Kansas (124) $165,183 ($134,855)ASTSWMO (35) $105,757 ($97,000)
Barbara Wilson, Mike Martinson, Jim Davidson, Bruce Bauman. 11/7-8/2005 NGWA Conference, Houston TX
57
113
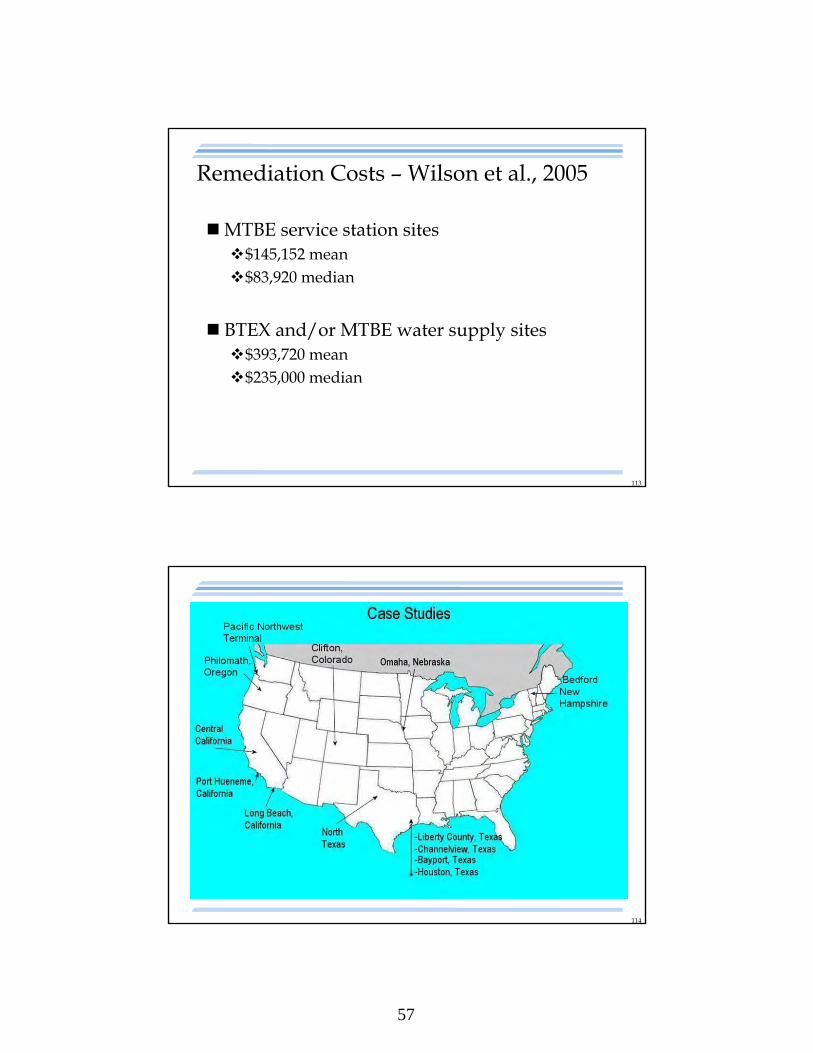
Remediation Costs – Wilson et al., 2005
MTBE service station sites$145,152 mean$83,920 median
BTEX and/or MTBE water supply sites$393,720 mean$235,000 median
114
58
115
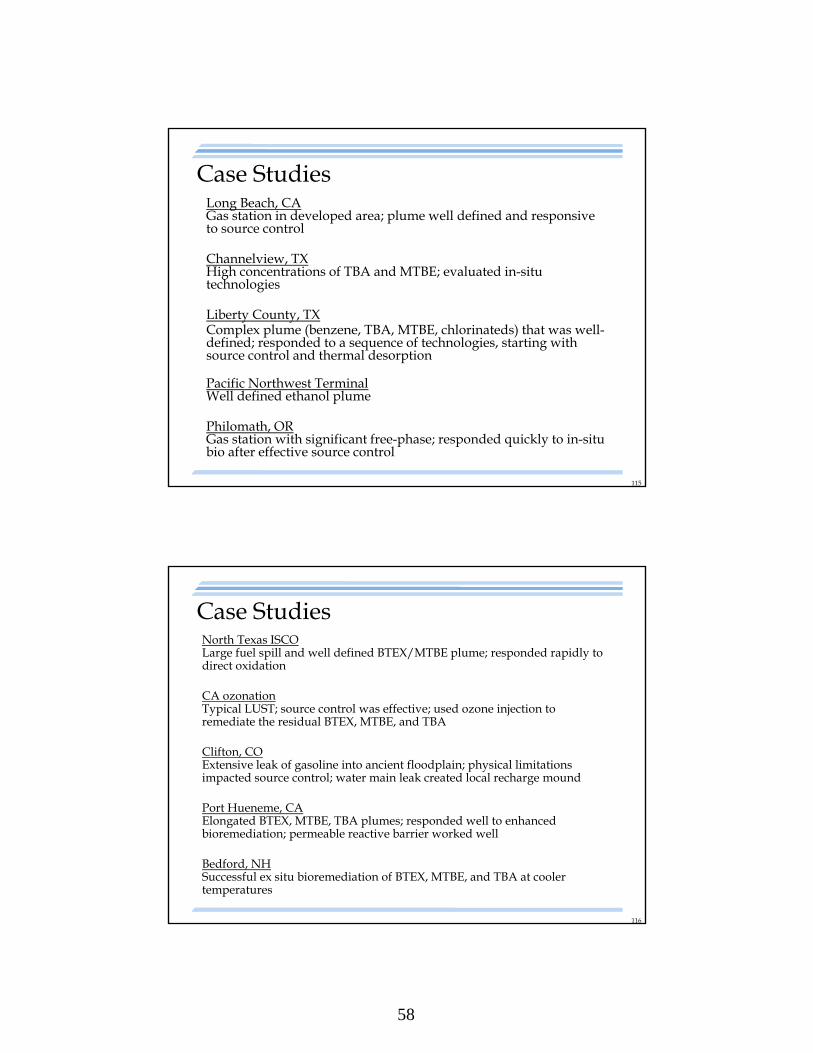
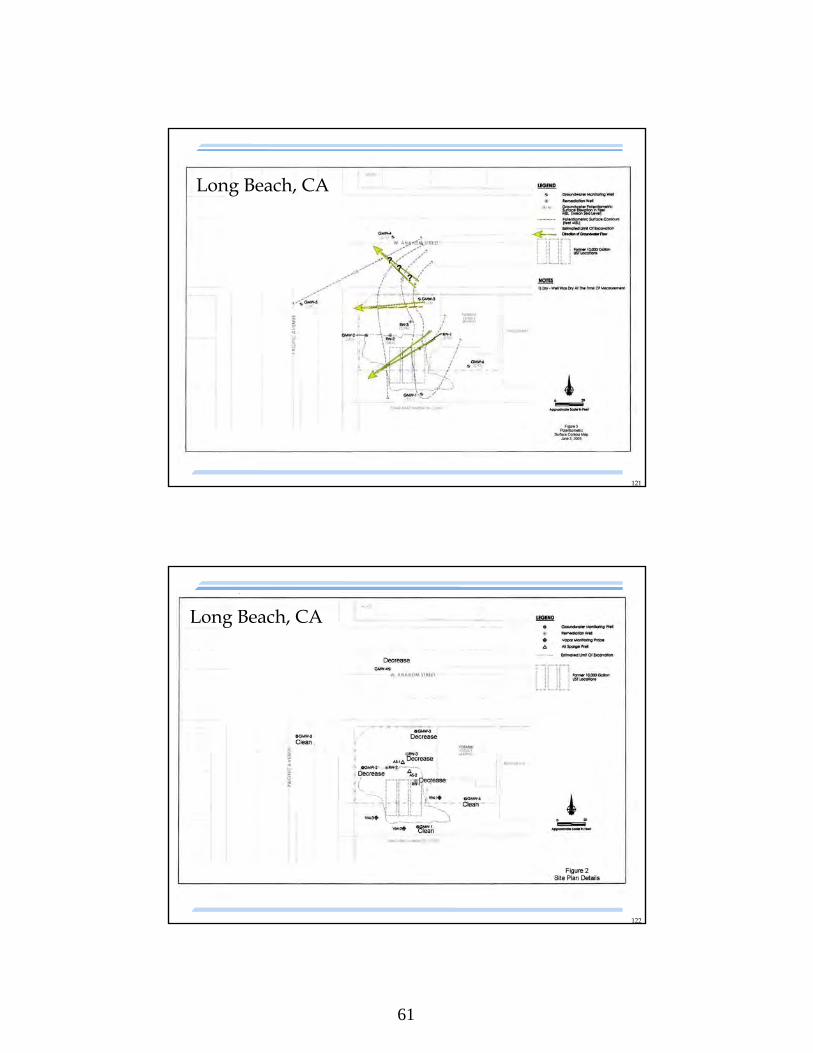
Case StudiesLong Beach, CAGas station in developed area; plume well defined and responsive to source control
Channelview, TXHigh concentrations of TBA and MTBE; evaluated in-situ technologies
Liberty County, TXComplex plume (benzene, TBA, MTBE, chlorinateds) that was well-defined; responded to a sequence of technologies, starting with source control and thermal desorption
Pacific Northwest TerminalWell defined ethanol plume
Philomath, ORGas station with significant free-phase; responded quickly to in-situ bio after effective source control
116
Case StudiesNorth Texas ISCOLarge fuel spill and well defined BTEX/MTBE plume; responded rapidly to direct oxidation
CA ozonationTypical LUST; source control was effective; used ozone injection to remediate the residual BTEX, MTBE, and TBA
Clifton, COExtensive leak of gasoline into ancient floodplain; physical limitations impacted source control; water main leak created local recharge mound
Port Hueneme, CAElongated BTEX, MTBE, TBA plumes; responded well to enhanced bioremediation; permeable reactive barrier worked well
Bedford, NHSuccessful ex situ bioremediation of BTEX, MTBE, and TBA at cooler temperatures
59
117
Case Studies
Bayport, TXElevated levels of TBA in shallow groundwater; source control was effective; confirm biological component of TBA natural attenuation
Westheimer and Shepherd, TXGas station and dry cleaner plumes co-mingled; effective source control was critical; pump and treat with in-situ bioremediation
Omaha, NEThree LUSTs: BTEX, TBA, and MTBE plumes are well defined; responded rapidly to pump and treat and circulating in-situ bio
118
Long Beach, CA: Description
Abandoned gas station on 0.6 acre corner lot
Tanks may have leaked 500 gallons of gasoline (1980-1995)
Three leaking tanks removed
60 yd3 soil with free-phase to landfarm
Commercial use area being upgraded
No at-risk receptors
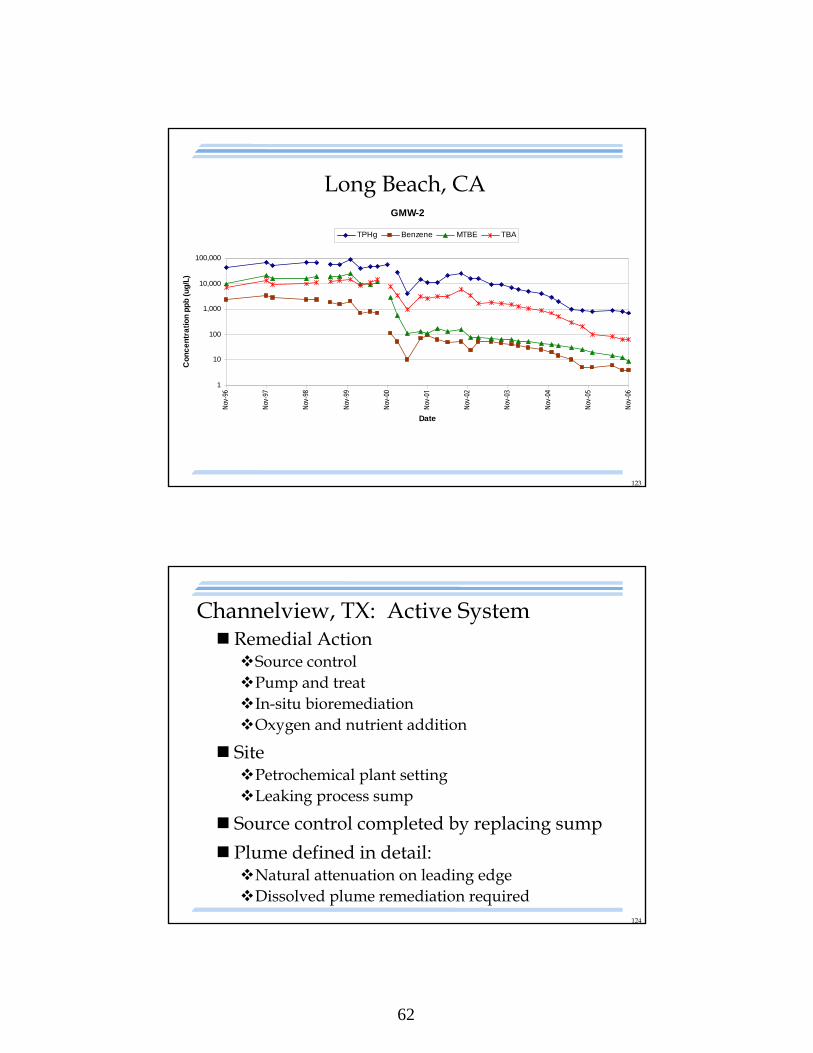
Groundwater plume well defined, 12 years of monitoring
Groundwater impacted to about 30' bgs
BTEX, MTBE, TBA are the chemicals of concern
60
119
Long Beach, CA: Remediation
Remove tanks and soils with free-phase
Backfill tank area with clean soils amended with 5 lbs. KMnO4 per ton
Soil vapor extraction Three 6" diameter wells Screened from 5' to 20' bgs Extract 10 CFM per wellOperate for 9 months Treat vapor with GAC
120
Long Beach,
CA
61
121
Long Beach, CALong Beach, CA
122
Long Beach, CALong Beach, CA
62
123
Long Beach, CAGMW-2
1
10
100
1,000
10,000
100,000
Nov
-96
Nov
-97
Nov
-98
Nov
-99
Nov
-00
Nov
-01
Nov
-02
Nov
-03
Nov
-04
Nov
-05
Nov
-06
Date
Co
nc
en
tra
tio
n p
pb
(u
g/L
)
TPHg Benzene MTBE TBA
124
Remedial ActionSource controlPump and treatIn-situ bioremediationOxygen and nutrient addition
SitePetrochemical plant settingLeaking process sump
Source control completed by replacing sump
Plume defined in detail:Natural attenuation on leading edgeDissolved plume remediation required
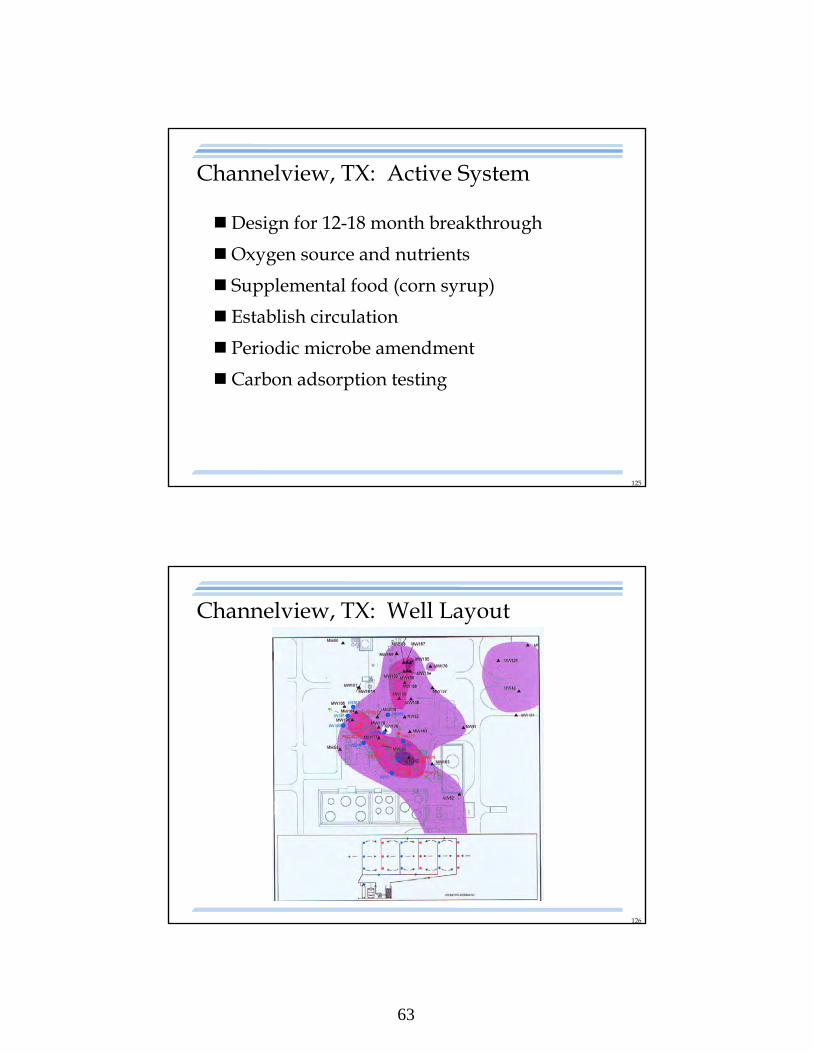
Channelview, TX: Active System
63
125
Design for 12-18 month breakthrough
Oxygen source and nutrients
Supplemental food (corn syrup)
Establish circulation
Periodic microbe amendment
Carbon adsorption testing
Channelview, TX: Active System
126
Channelview, TX: Well Layout
64
127
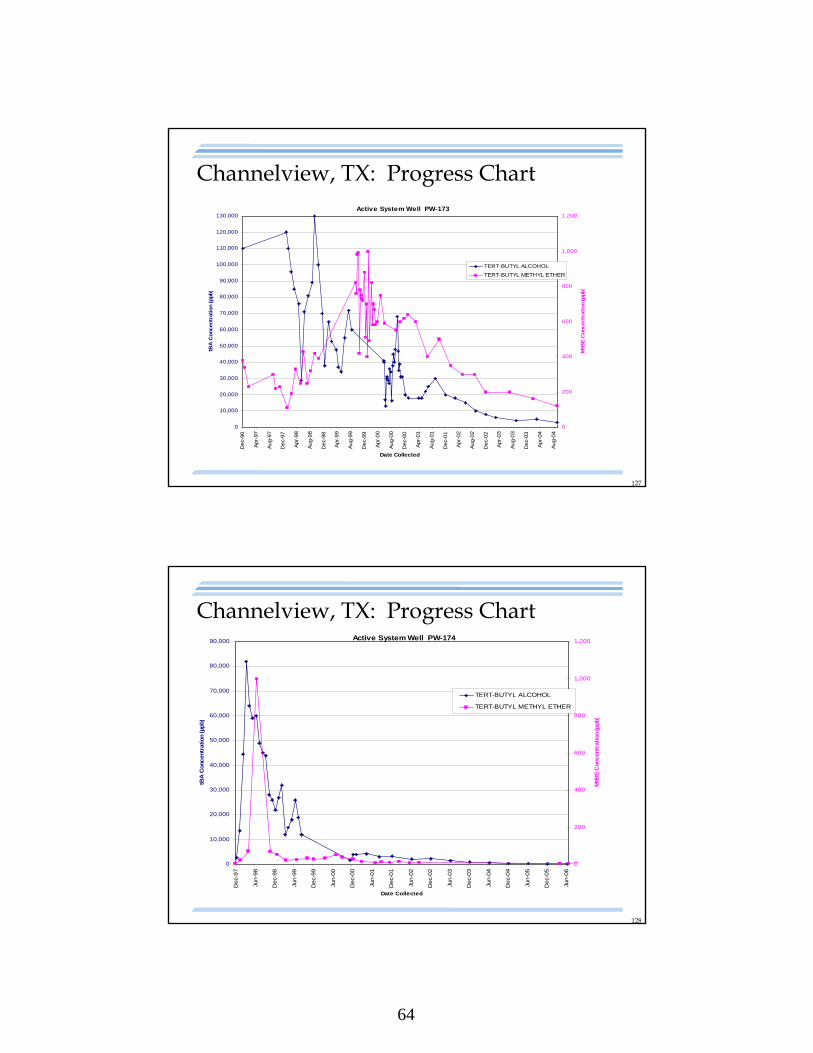
Channelview, TX: Progress ChartActive System Well PW-173
0
10,000
20,000
30,000
40,000
50,000
60,000
70,000
80,000
90,000
100,000
110,000
120,000
130,000
Dec-
96
Apr-
97
Aug-9
7
Dec-
97
Apr-
98
Aug-9
8
Dec-
98
Apr-
99
Aug-9
9
Dec-
99
Apr-
00
Aug-0
0
Dec-
00
Apr-
01
Aug-0
1
Dec-
01
Apr-
02
Aug-0
2
Dec-
02
Apr-
03
Aug-0
3
Dec-
03
Apr-
04
Aug-0
4
Date Collected
tBA
Concentr
ation (ppb)
0
200
400
600
800
1,000
1,200
MtB
E C
oncentr
ation (ppb)
TERT-BUTYL ALCOHOL
TERT-BUTYL METHYL ETHER
128
Active System Well PW-174
0
10,000
20,000
30,000
40,000
50,000
60,000
70,000
80,000
90,000
Dec-
97
Jun-9
8
Dec-
98
Jun-9
9
Dec-
99
Jun-0
0
Dec-
00
Jun-0
1
Dec-
01
Jun-0
2
Dec-
02
Jun-0
3
Dec-
03
Jun-0
4
Dec-
04
Jun-0
5
Dec-
05
Jun-0
6
Date Collected
tBA
Concentr
ation (ppb)
0
200
400
600
800
1,000
1,200
D F A J A O D F A J A O D F A J A O
MtB
E C
oncentr
ation (ppb)
TERT-BUTYL ALCOHOL
TERT-BUTYL METHYL ETHER
Channelview, TX: Progress Chart
65
129
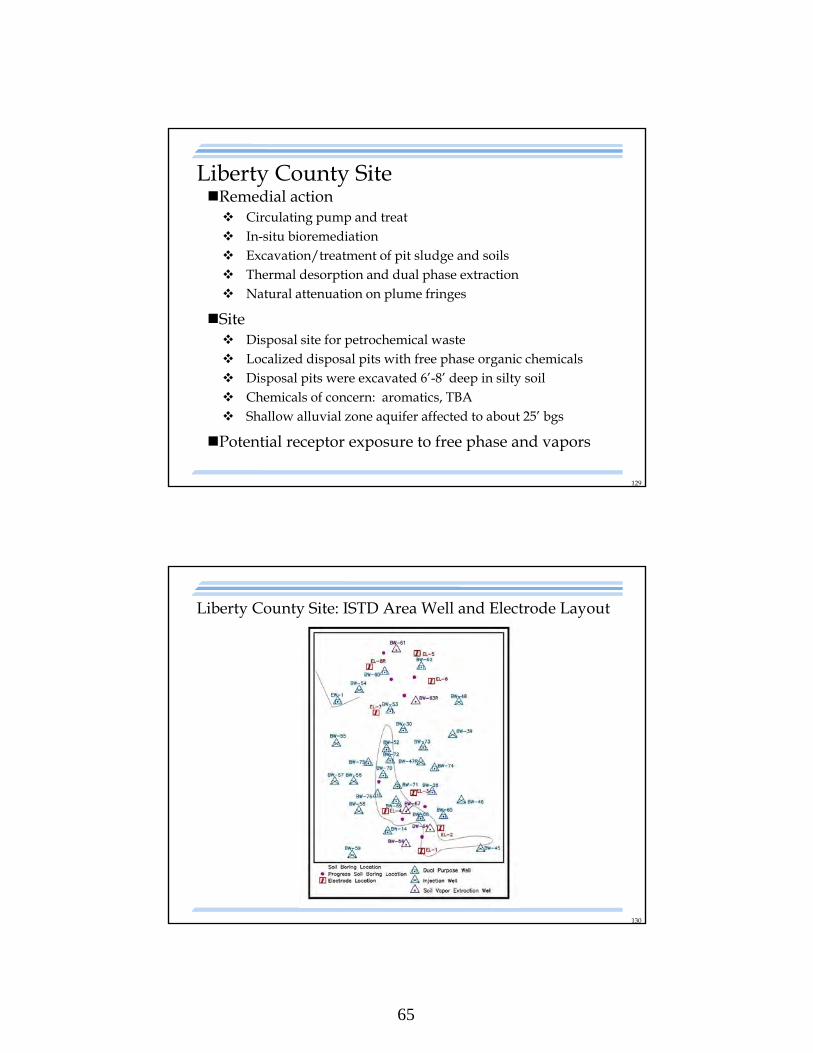
Liberty County SiteRemedial action Circulating pump and treat In-situ bioremediation Excavation/treatment of pit sludge and soils Thermal desorption and dual phase extraction Natural attenuation on plume fringes
Site Disposal site for petrochemical waste Localized disposal pits with free phase organic chemicals Disposal pits were excavated 6’-8’ deep in silty soil Chemicals of concern: aromatics, TBA Shallow alluvial zone aquifer affected to about 25’ bgs
Potential receptor exposure to free phase and vapors
130
Liberty County Site: ISTD Area Well and Electrode Layout
66
131
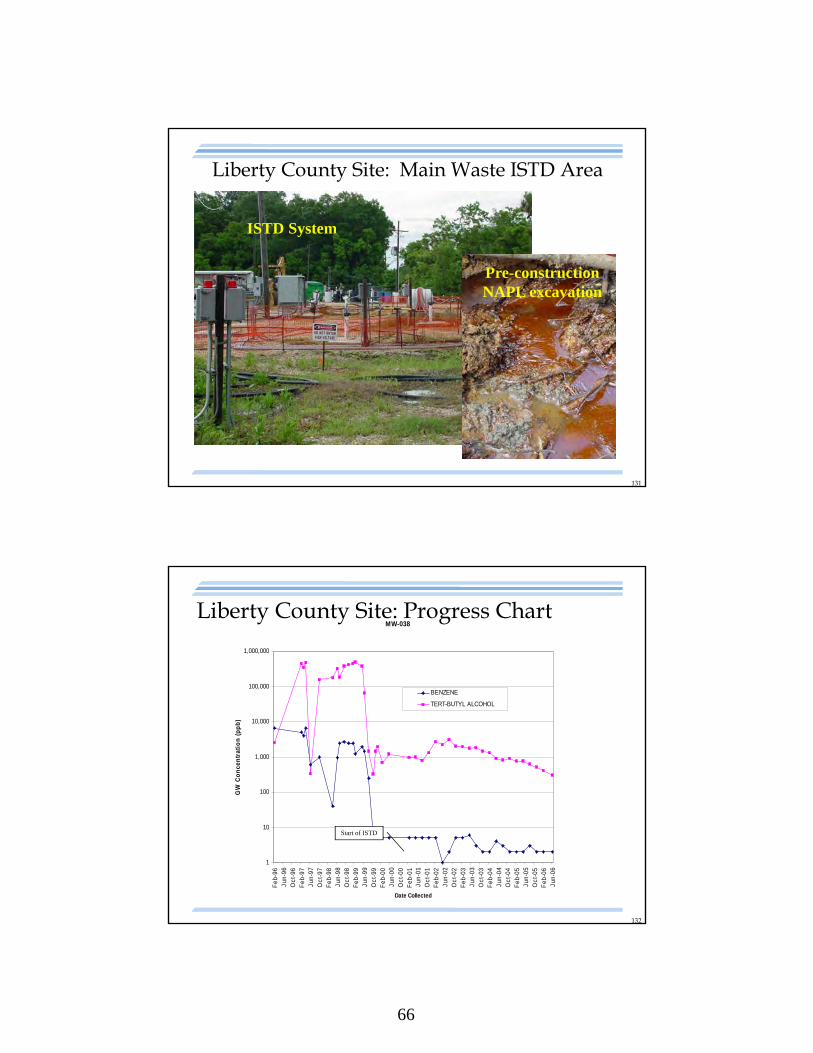
Liberty County Site: Main Waste ISTD Area
Pre-construction NAPL excavation
ISTD System
132
MW-038
1
10
100
1,000
10,000
100,000
1,000,000
Feb
-96
Jun-
96O
ct-9
6F
eb-9
7Ju
n-97
Oct
-97
Feb
-98
Jun-
98O
ct-9
8F
eb-9
9Ju
n-99
Oct
-99
Feb
-00
Jun-
00O
ct-0
0F
eb-0
1Ju
n-01
Oct
-01
Feb
-02
Jun-
02O
ct-0
2F
eb-0
3Ju
n-03
Oct
-03
Feb
-04
Jun-
04O
ct-0
4F
eb-0
5Ju
n-05
Oct
-05
Feb
-06
Jun-
06
Date Collected
GW
Co
nce
ntr
atio
n (
pp
b)
BENZENE
TERT-BUTYL ALCOHOL
Start of ISTD
Liberty County Site: Progress Chart
67
133
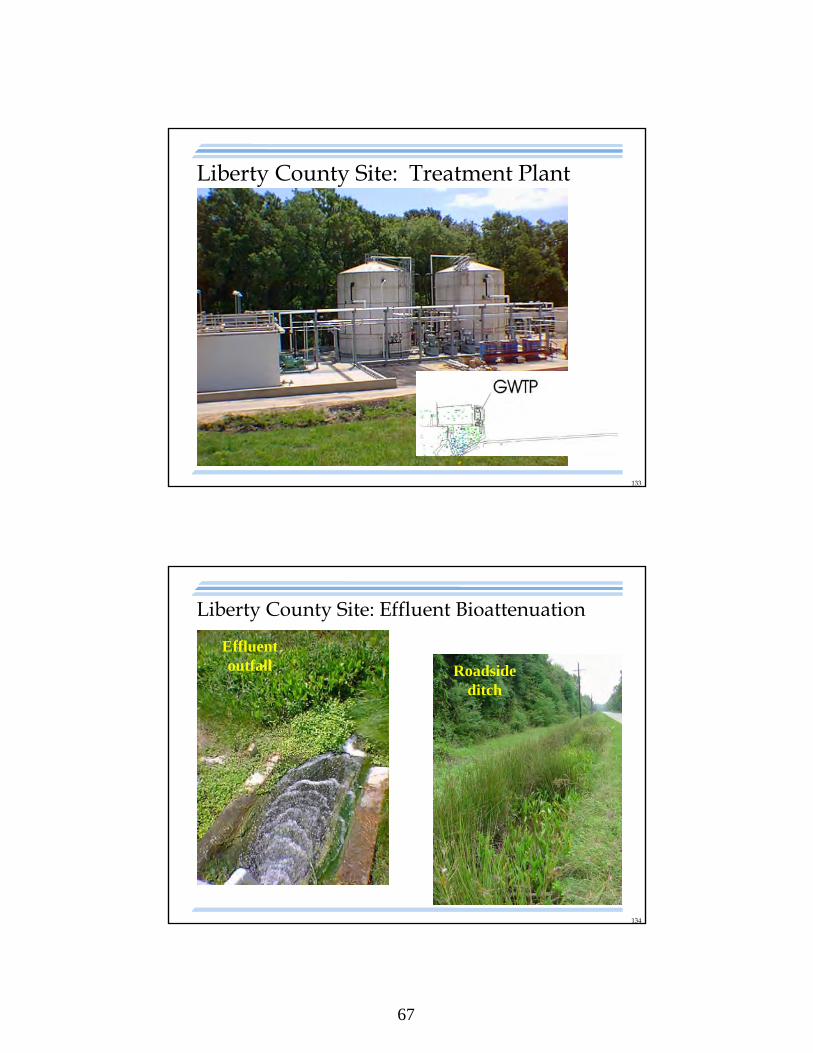
Liberty County Site: Treatment Plant
134
Liberty County Site: Effluent Bioattenuation
Effluent outfall Roadside
ditch
68
135
Pacific NW Terminal – Ethanol
19,000 gallons of neat ethanol released 3/99 from an AST
Release was in area of pre-existing dissolved hydrocarbon plume
Ethanol affected both NAPL and dissolved hydrocarbons
Buscheck et al., 2001
136
Pacific NW Terminal – Site Setting
Between 0 and 30 feet of fill (sand, silty sand) – primary zone for hydrocarbons
Under fill to 50 feet bgs is alluvium (clayey silt with sand and organics)
Basalt at 50 feet
GW in fill and alluvium flows eastDTW = 2-14 feetdh/dx = 0.01Kfill = 35 feet/dayVGWin fill ~ 1 foot/day
Buscheck et al., 2001
69
137
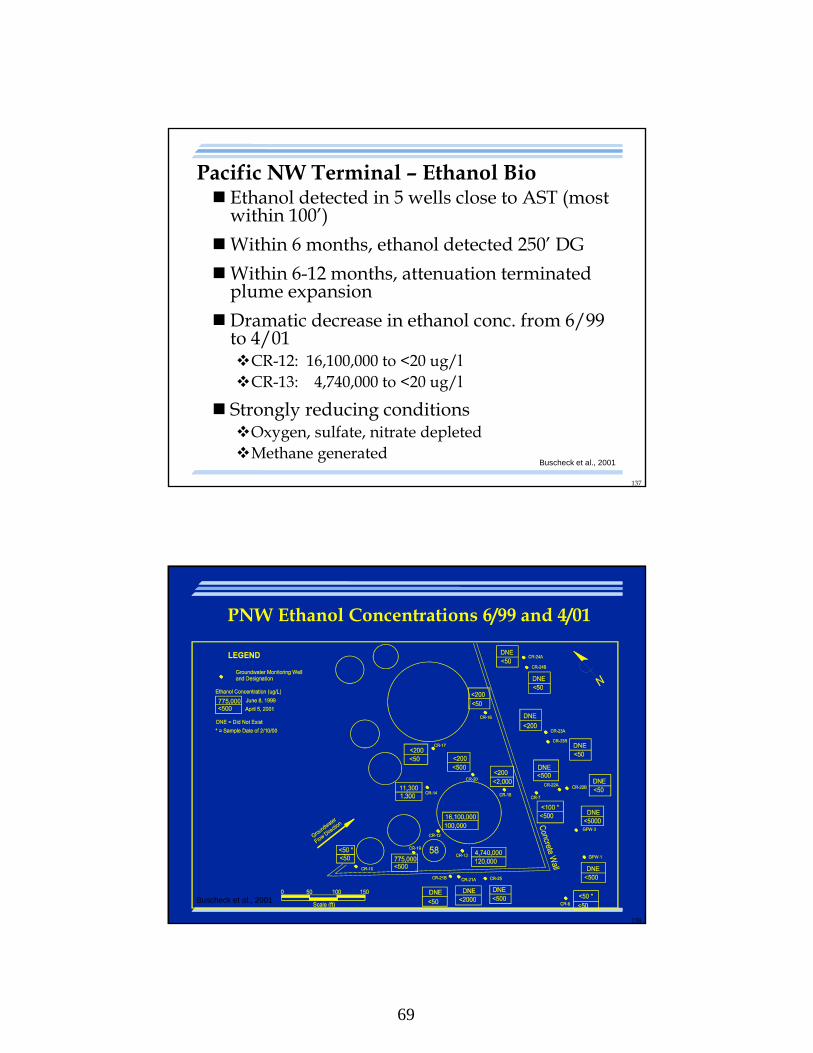
Pacific NW Terminal – Ethanol Bio Ethanol detected in 5 wells close to AST (most
within 100’)
Within 6 months, ethanol detected 250’ DG
Within 6-12 months, attenuation terminated plume expansion
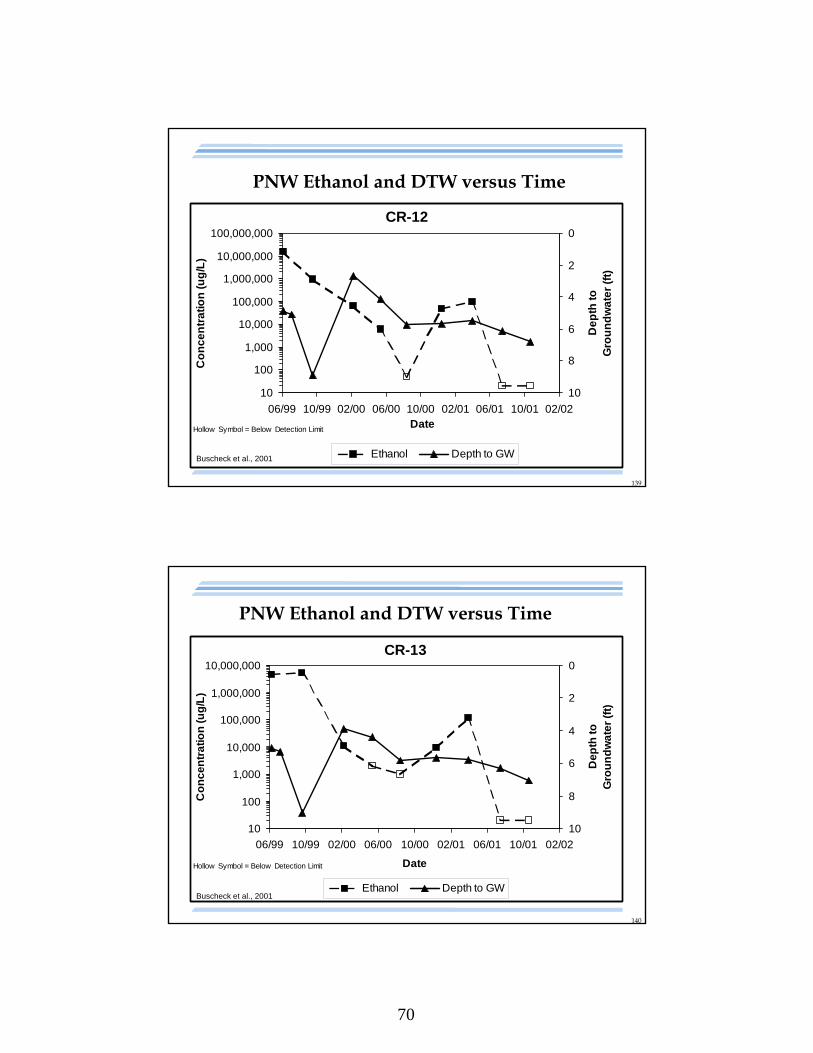
Dramatic decrease in ethanol conc. from 6/99 to 4/01CR-12: 16,100,000 to <20 ug/lCR-13: 4,740,000 to <20 ug/l
Strongly reducing conditionsOxygen, sulfate, nitrate depletedMethane generated
Buscheck et al., 2001
138
PNW Ethanol Concentrations 6/99 and 4/01
Buscheck et al., 2001
70
139
CR-12
10
100
1,000
10,000
100,000
1,000,000
10,000,000
100,000,000
06/99 10/99 02/00 06/00 10/00 02/01 06/01 10/01 02/02Date
Co
nc
en
tra
tio
n (u
g/L
)
0
2
4
6
8
10
De
pth
to
G
rou
nd
wa
ter
(ft)
Ethanol Depth to GW
Hollow Symbol = Below Detection Limit
PNW Ethanol and DTW versus Time
Buscheck et al., 2001
140
CR-13
10
100
1,000
10,000
100,000
1,000,000
10,000,000
06/99 10/99 02/00 06/00 10/00 02/01 06/01 10/01 02/02
Date
Co
nc
entr
atio
n (u
g/L
)
0
2
4
6
8
10
Dep
th t
o
Gro
un
dw
ate
r (f
t)
Ethanol Depth to GW
Hollow Symbol = Below Detection Limit
PNW Ethanol and DTW versus Time
Buscheck et al., 2001
71
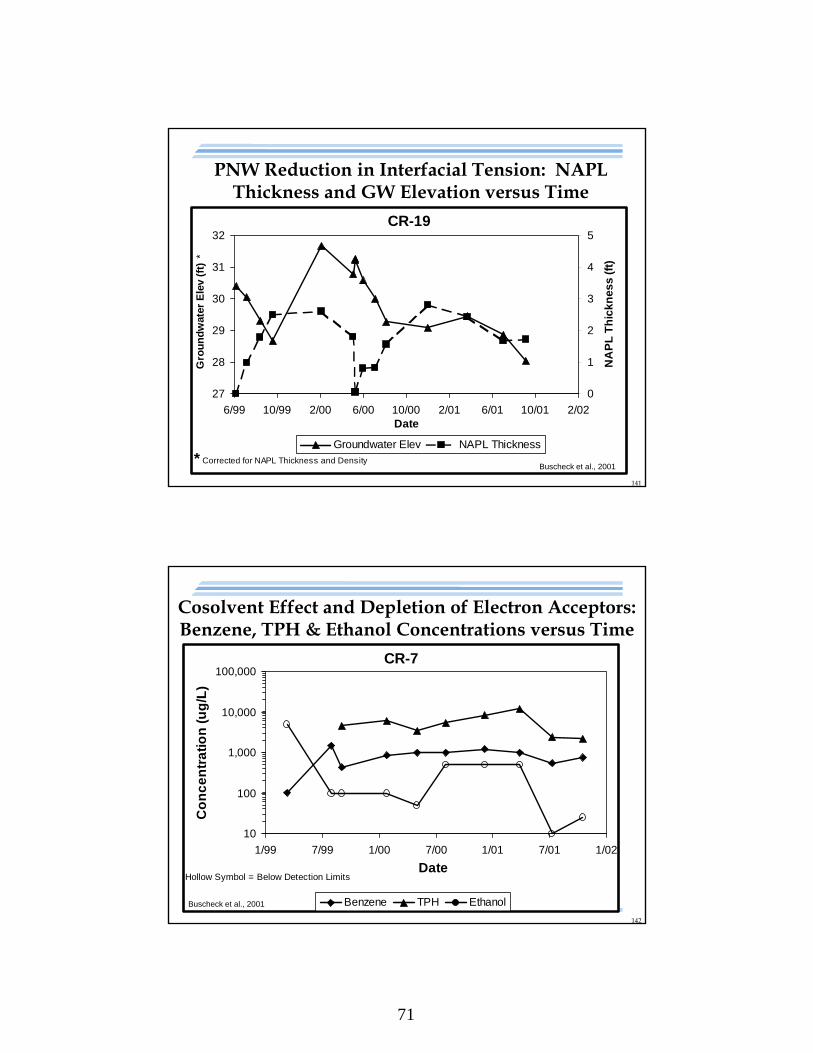
141
CR-19
27
28
29
30
31
32
6/99 10/99 2/00 6/00 10/00 2/01 6/01 10/01 2/02Date
Gro
un
dw
ater
Ele
v (f
t) *
0
1
2
3
4
5
NA
PL
Th
ick
ne
ss
(ft
)
Groundwater Elev NAPL Thickness* Corrected for NAPL Thickness and Density
PNW Reduction in Interfacial Tension: NAPL Thickness and GW Elevation versus Time
Buscheck et al., 2001
142
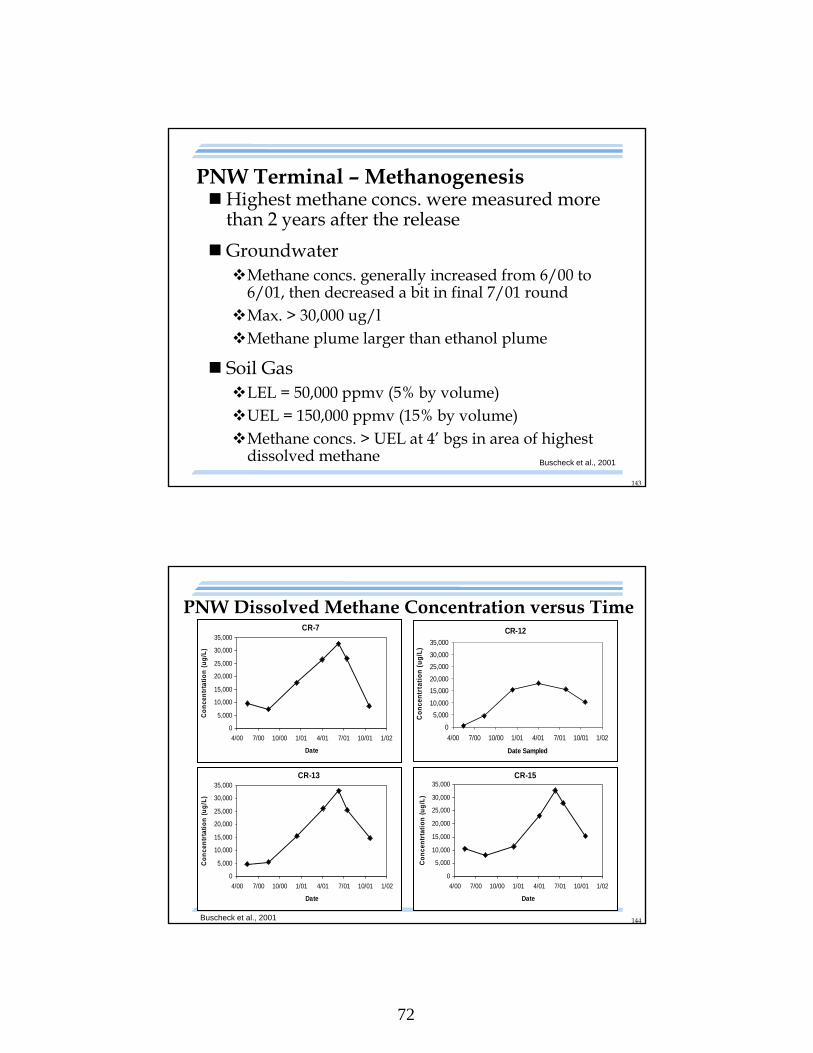
CR-7
10
100
1,000
10,000
100,000
1/99 7/99 1/00 7/00 1/01 7/01 1/02
Date
Co
nc
en
tra
tio
n (
ug
/L)
Benzene TPH Ethanol
Hollow Symbol = Below Detection Limits
Cosolvent Effect and Depletion of Electron Acceptors: Benzene, TPH & Ethanol Concentrations versus Time
Buscheck et al., 2001
72
143
PNW Terminal – MethanogenesisHighest methane concs. were measured more
than 2 years after the release
GroundwaterMethane concs. generally increased from 6/00 to
6/01, then decreased a bit in final 7/01 roundMax. > 30,000 ug/lMethane plume larger than ethanol plume
Soil GasLEL = 50,000 ppmv (5% by volume)UEL = 150,000 ppmv (15% by volume)Methane concs. > UEL at 4’ bgs in area of highest
dissolved methane Buscheck et al., 2001
144
PNW Dissolved Methane Concentration versus TimeCR-7
0
5,000
10,000
15,000
20,000
25,000
30,000
35,000
4/00 7/00 10/00 1/01 4/01 7/01 10/01 1/02
Date
Co
nce
ntr
tati
on
(u
g/L
)
CR-13
0
5,000
10,000
15,000
20,000
25,000
30,000
35,000
4/00 7/00 10/00 1/01 4/01 7/01 10/01 1/02
Date
Co
nce
ntr
tati
on
(u
g/L
)
CR-15
0
5,000
10,000
15,000
20,000
25,000
30,000
35,000
4/00 7/00 10/00 1/01 4/01 7/01 10/01 1/02
Date
Co
nce
ntr
tati
on
(u
g/L
)
CR-12
0
5,000
10,000
15,000
20,000
25,000
30,000
35,000
4/00 7/00 10/00 1/01 4/01 7/01 10/01 1/02
Date Sampled
Co
nce
ntr
tati
on
(u
g/L
)
Buscheck et al., 2001
73
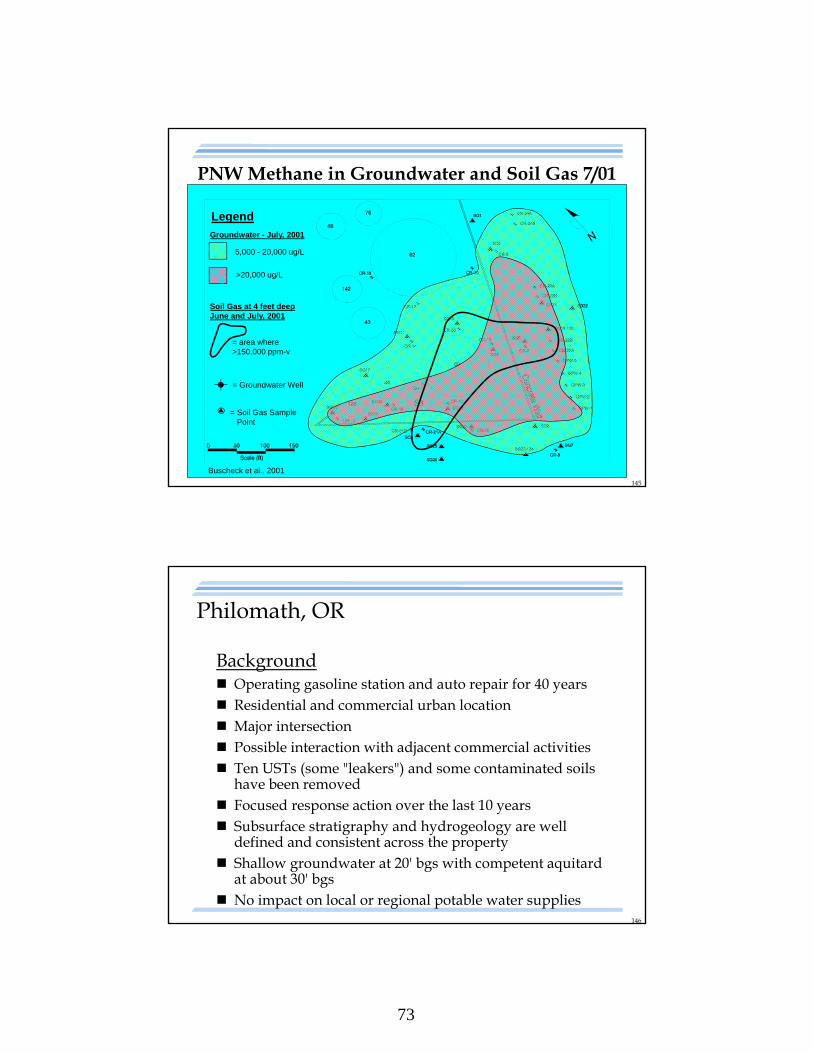
145
Legend
5,000 - 20,000 ug/L
>20,000 ug/L
Groundwater - July, 2001
Soil Gas at 4 feet deepJune and July, 2001
= area where >150,000 ppm-v
= Groundwater Well
= Soil Gas SamplePoint
PNW Methane in Groundwater and Soil Gas 7/01
Buscheck et al., 2001
146
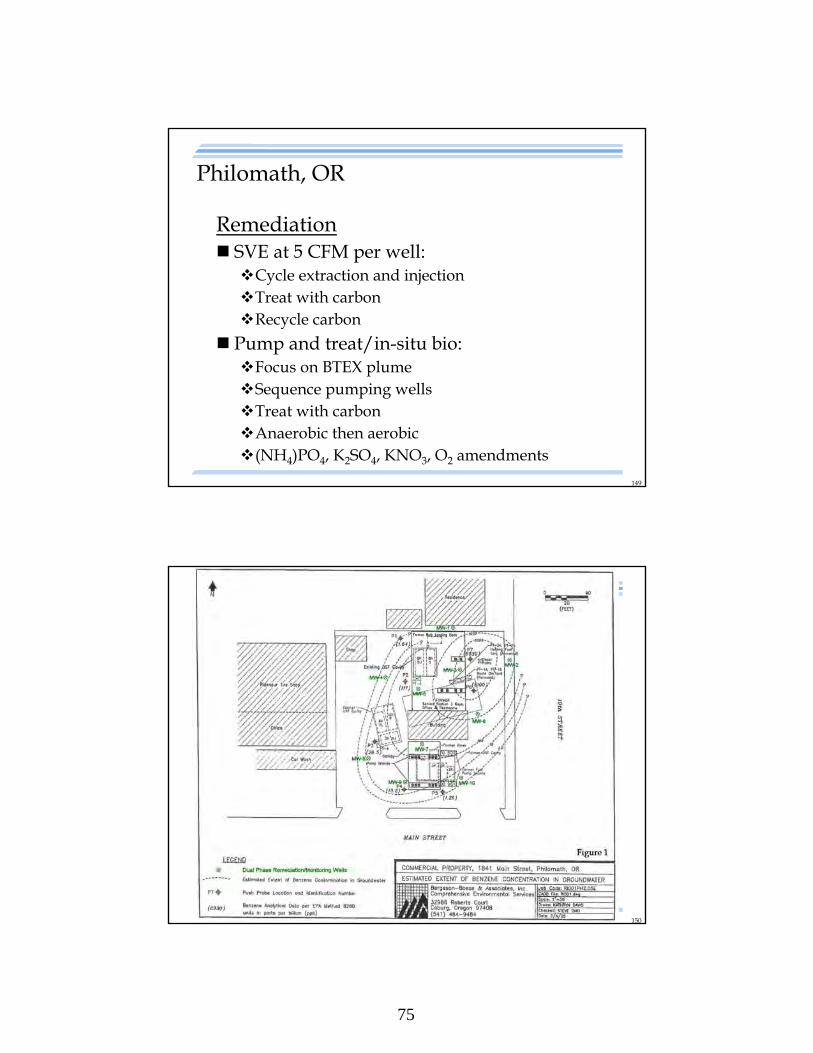
Philomath, OR
Background Operating gasoline station and auto repair for 40 years Residential and commercial urban location Major intersection Possible interaction with adjacent commercial activities Ten USTs (some "leakers") and some contaminated soils
have been removed Focused response action over the last 10 years Subsurface stratigraphy and hydrogeology are well
defined and consistent across the property Shallow groundwater at 20' bgs with competent aquitard
at about 30' bgs No impact on local or regional potable water supplies
74
147
Philomath, OR
Environmental Issues Shallow soils have been contaminated at several
locations
Residual free-phase gasoline in soils acting as groundwater contamination sources
BTEX and chlorinated solvents are the chemicals of concern
December, 1999, DEQ "No Further Action" letter was premature and unrealistic
Underground piping was source of leaks
Casual storage/handling of degreasers for 20-30 years
148
Philomath, OR
Remediation Expand soil/source definition Define extent of shallow groundwater plume(s) Remove, decontaminate, and salvage all buried
piping Reopen the 10 former UST areas and remove
contaminated soils: Visible free-phase Ship offsite KMnO4 with backfill
Install 10 dual-phase remediation/monitoring wells: 6" diameter x 25' deep Screen 15' bgs to 25' bgs
75
149
Philomath, OR
Remediation SVE at 5 CFM per well:Cycle extraction and injectionTreat with carbonRecycle carbon
Pump and treat/in-situ bio:Focus on BTEX plumeSequence pumping wellsTreat with carbonAnaerobic then aerobic(NH4)PO4, K2SO4, KNO3, O2 amendments
150
76
151
Philomath, OR
Costs Soil borings 8,000 Trenches 6,000 Wells 36,000 Excavation, handling, backfill 12,000 Disposal (soil) 10,000 Piping removal 12,000 Concrete, blacktop repair 9,000 Chemicals 30,000 Supplies 15,000 Recycle (carbon) 12,000 Analytical 22,000 Technical support labor 18,000 Supervision 30,000
Total 220,000
152
Philomath, OR
Schedule Assessment 2 months Source control 1 month Construction 6 weeks SVE 8 months Pump and treat/in-situ bioAnaerobic 12 monthsAerobic 15 months
Monitor 10 years
77
153
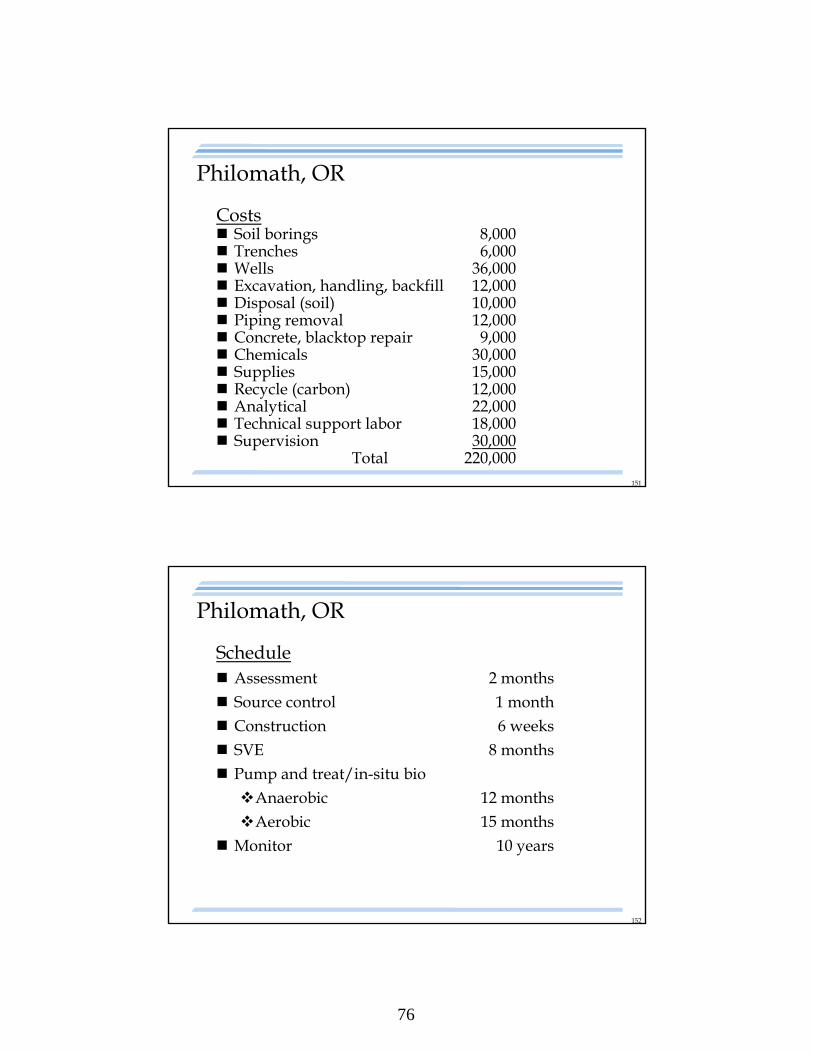
North Texas Gas Station Remedial actionIn-situ chemical oxidation
Site Operating, urban, north Texas service stationLow-permeability native soils, dry most of the yearTankhold area backfilled with sand/gravel
» Retains infiltrated rain at 3-6 ft bgs
Release and response Product lines disconnected for construction
» During heavy rain, water displaced 7,052 gal of gasoline into tankhold area
Recovered ~62,000 gal free & dissolved phaseCourtesy URS Corporation, Houston, TX AEHS Journal-Special Oxygenated Fuels Issue, 2001(page 71); 2002(page 70)
154
North Texas Gas Station: Site Plan View
Courtesy URS Corporation, Houston, TX
78
155
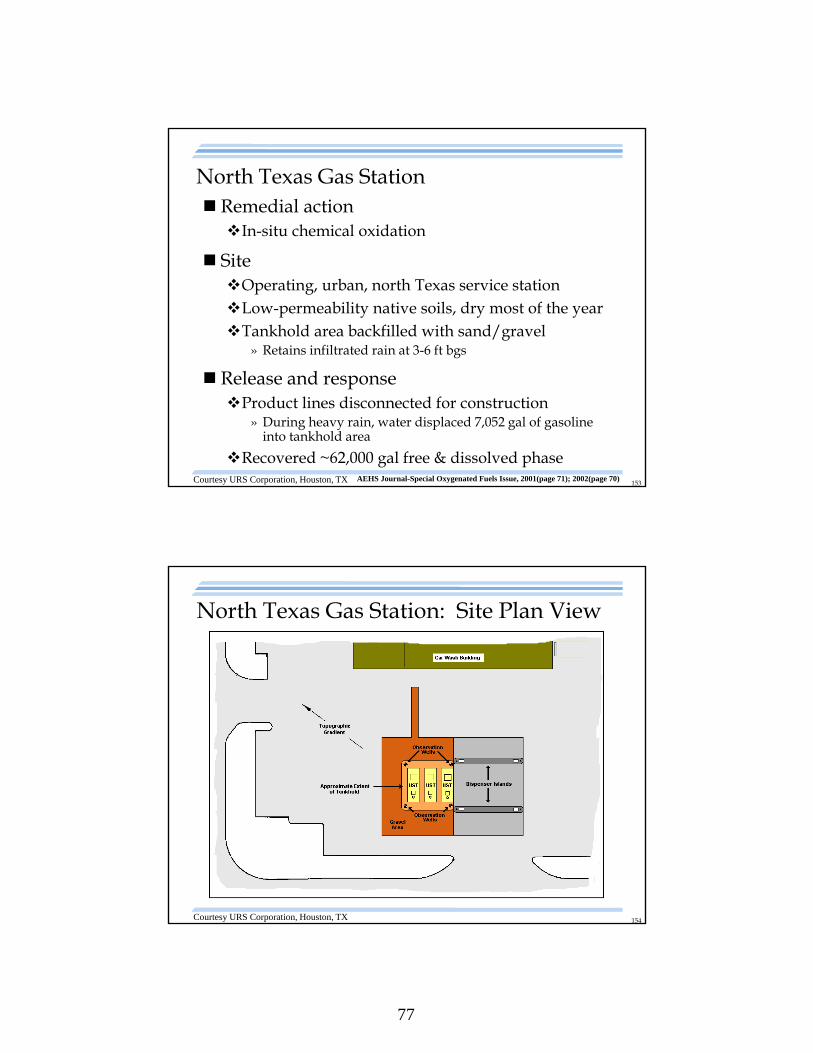
North Texas Gas Station: Cost Comparison of Gasoline Remediation Technologies
Remediation SamplingMgt. &
OversightReporting Total
Pump & Treat1 48-120 $130-1753 $12 4 $8 $5 $155-200
ORC®2 36-48 $130-1495 $10 $10 $5 $155-174
Chemical Oxidation
14 140 $10 $15 $5 $170
5 Includes one injection per year for three years.
Approximate Costs (x 1,000)Remediation Technology
Duration (months)
3 Pump and dispose of tankhold hydrocarbon-affected groundwater 20 times.
1 Pump & Treat would likely require a long-term effort and expenses. Overall costs are approximate due to unknown duration.2 Oxygen Release Compound mediated in situ biostimulation
4 Includes ten groundwater-monitoring events.
Courtesy URS Corporation, Houston, TX
156
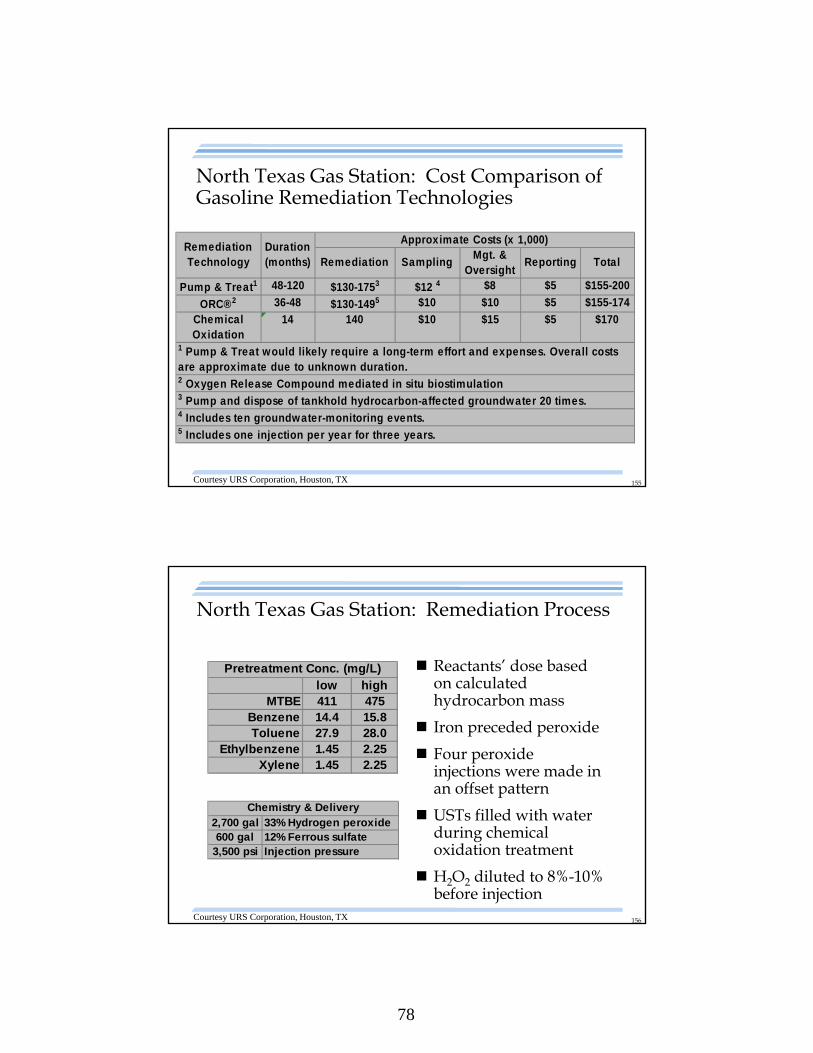
North Texas Gas Station: Remediation Process
Reactants’ dose based on calculated hydrocarbon mass
Iron preceded peroxide
Four peroxide injections were made in an offset pattern
USTs filled with water during chemical oxidation treatment
H2O2 diluted to 8%-10% before injection
low highMTBE 411 475
Benzene 14.4 15.8Toluene 27.9 28.0
Ethylbenzene 1.45 2.25Xylene 1.45 2.25
Pretreatment Conc. (mg/L)
2,700 gal 33% Hydrogen peroxide600 gal 12% Ferrous sulfate
3,500 psi Injection pressure
Chemistry & Delivery
Courtesy URS Corporation, Houston, TX
79
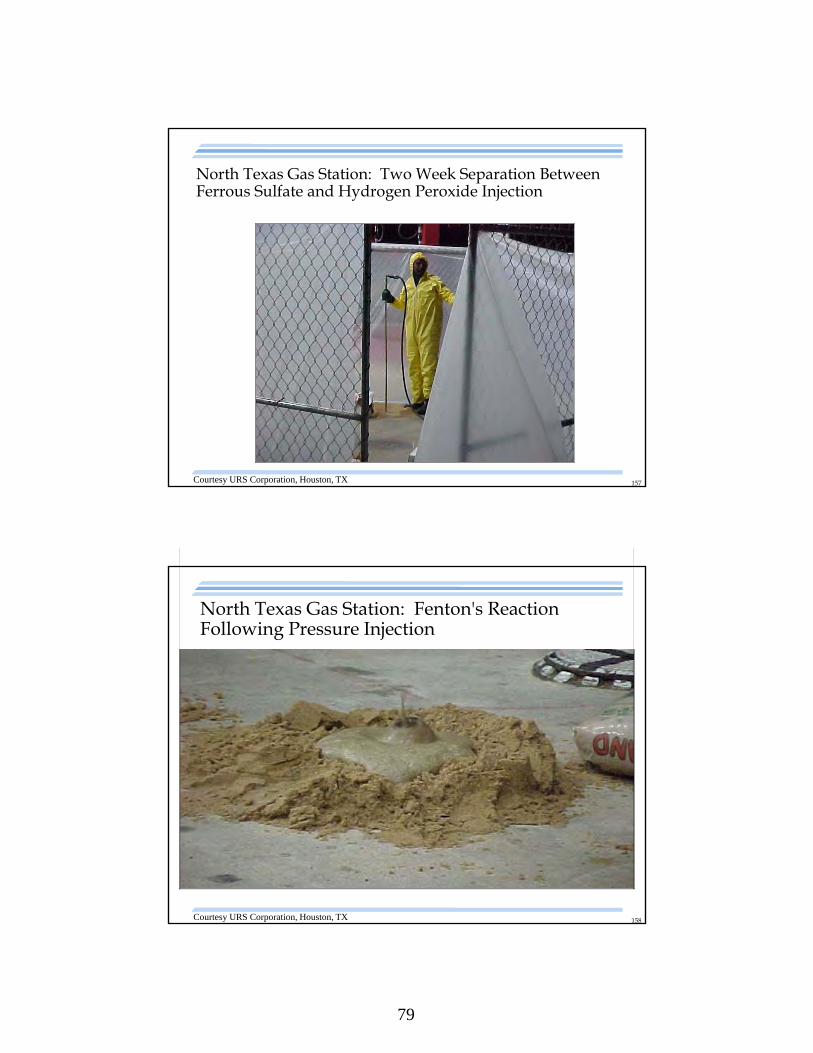
157
North Texas Gas Station: Two Week Separation Between Ferrous Sulfate and Hydrogen Peroxide Injection
Courtesy URS Corporation, Houston, TX
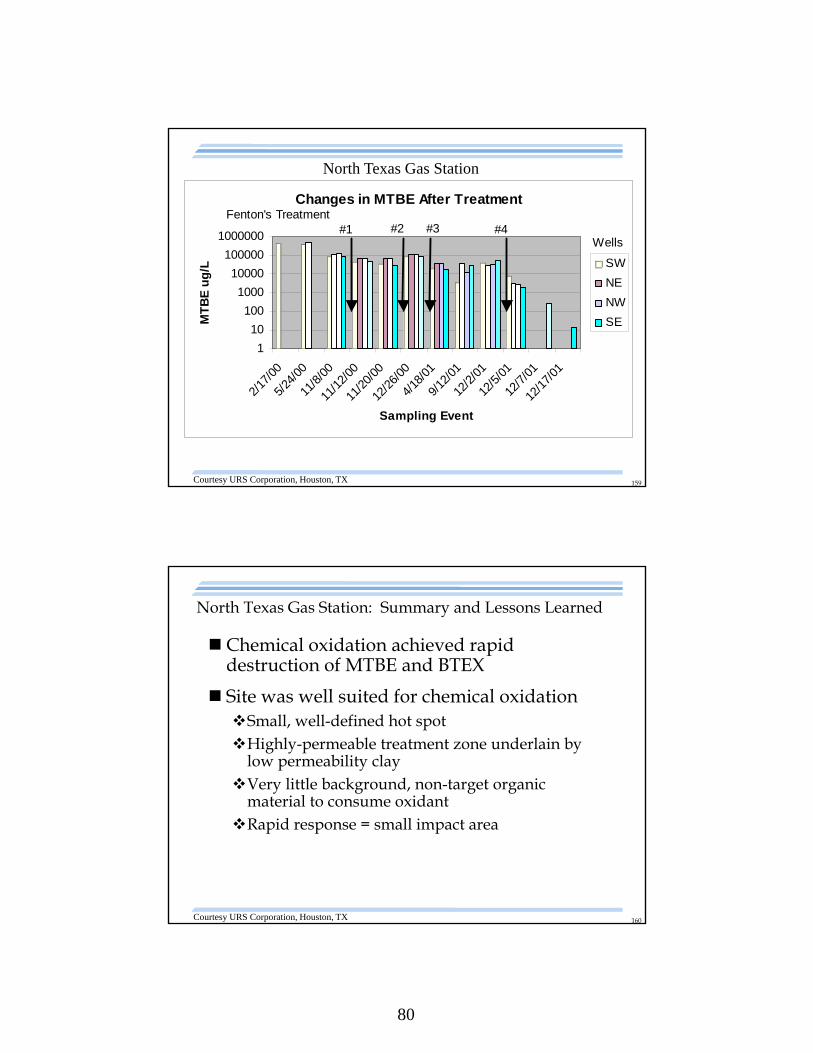
158
North Texas Gas Station: Fenton's Reaction Following Pressure Injection
Courtesy URS Corporation, Houston, TX
80
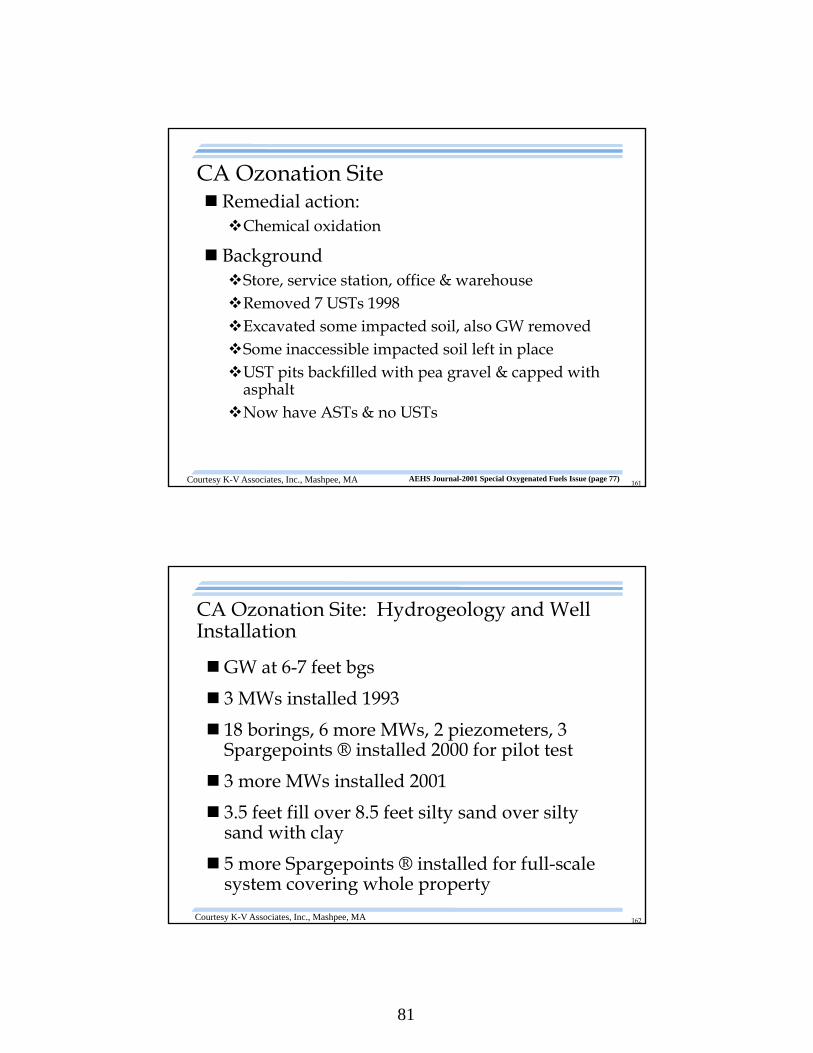
159
Changes in MTBE After Treatment
1
10
100
1000
10000
100000
1000000
2/17
/00
5/24
/00
11/8
/00
11/1
2/00
11/2
0/00
12/2
6/00
4/18
/01
9/12
/01
12/2
/01
12/5
/01
12/7
/01
12/1
7/01
Sampling Event
MT
BE
ug
/L SW
NE
NW
SE
#1 #2 #3 #4Fenton's Treatment
Wells
Courtesy URS Corporation, Houston, TX
North Texas Gas Station
160
North Texas Gas Station: Summary and Lessons Learned
Chemical oxidation achieved rapid destruction of MTBE and BTEX
Site was well suited for chemical oxidationSmall, well-defined hot spotHighly-permeable treatment zone underlain by
low permeability clayVery little background, non-target organic
material to consume oxidantRapid response = small impact area
Courtesy URS Corporation, Houston, TX
81
161
CA Ozonation Site Remedial action: Chemical oxidation
BackgroundStore, service station, office & warehouse Removed 7 USTs 1998Excavated some impacted soil, also GW removedSome inaccessible impacted soil left in place UST pits backfilled with pea gravel & capped with
asphaltNow have ASTs & no USTs
Courtesy K-V Associates, Inc., Mashpee, MA AEHS Journal-2001 Special Oxygenated Fuels Issue (page 77)
162
CA Ozonation Site: Hydrogeology and Well Installation
GW at 6-7 feet bgs
3 MWs installed 1993
18 borings, 6 more MWs, 2 piezometers, 3 Spargepoints ® installed 2000 for pilot test
3 more MWs installed 2001
3.5 feet fill over 8.5 feet silty sand over silty sand with clay
5 more Spargepoints ® installed for full-scale system covering whole property
Courtesy K-V Associates, Inc., Mashpee, MA
82
163
CA Site: Pilot Test Wells and Radius of Influence
EXPLANATION
Groundwater monitoring well
Piezometer
Ozone sparge well
0 40
N
Groundwater FlowDirection
MacDonald’sRestaurant
MW-3
MW-2 MW-7
MW-5
MW-1SP-3SP-2SP-1
MW-8
Union Pacific Railroad
Warehouse
Ab
ove
gro
un
dS
tora
ge
Tan
ks
TP-1MW-6
TP-2
Courtesy K-V Associates, Inc., Mashpee, MA
164
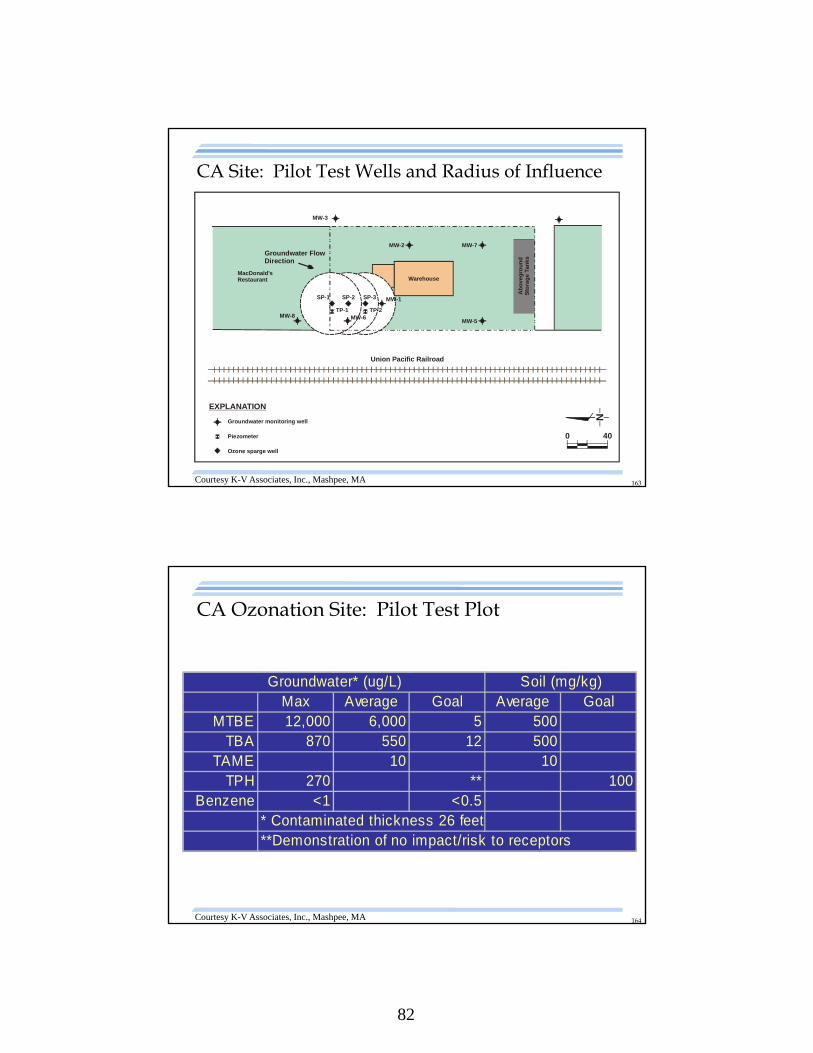
CA Ozonation Site: Pilot Test Plot
Courtesy K-V Associates, Inc., Mashpee, MA
Max Average Goal Average GoalMTBE 12,000 6,000 5 500
TBA 870 550 12 500TAME 10 10
TPH 270 ** 100Benzene <1 <0.5
* Contaminated thickness 26 feet**Demonstration of no impact/risk to receptors
Soil (mg/kg)Groundwater* (ug/L)
83
165
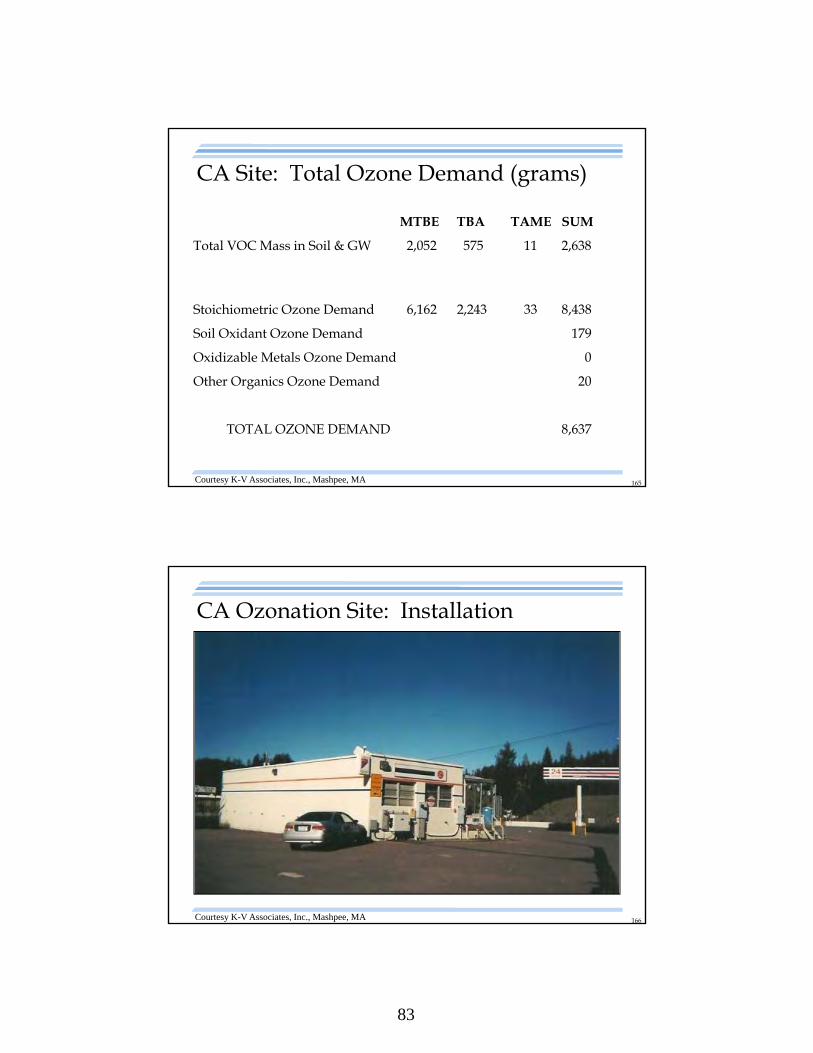
CA Site: Total Ozone Demand (grams)
MTBE TBA TAME SUM
Total VOC Mass in Soil & GW 2,052 575 11 2,638
Stoichiometric Ozone Demand 6,162 2,243 33 8,438
Soil Oxidant Ozone Demand 179
Oxidizable Metals Ozone Demand 0
Other Organics Ozone Demand 20
TOTAL OZONE DEMAND 8,637
Courtesy K-V Associates, Inc., Mashpee, MA
166
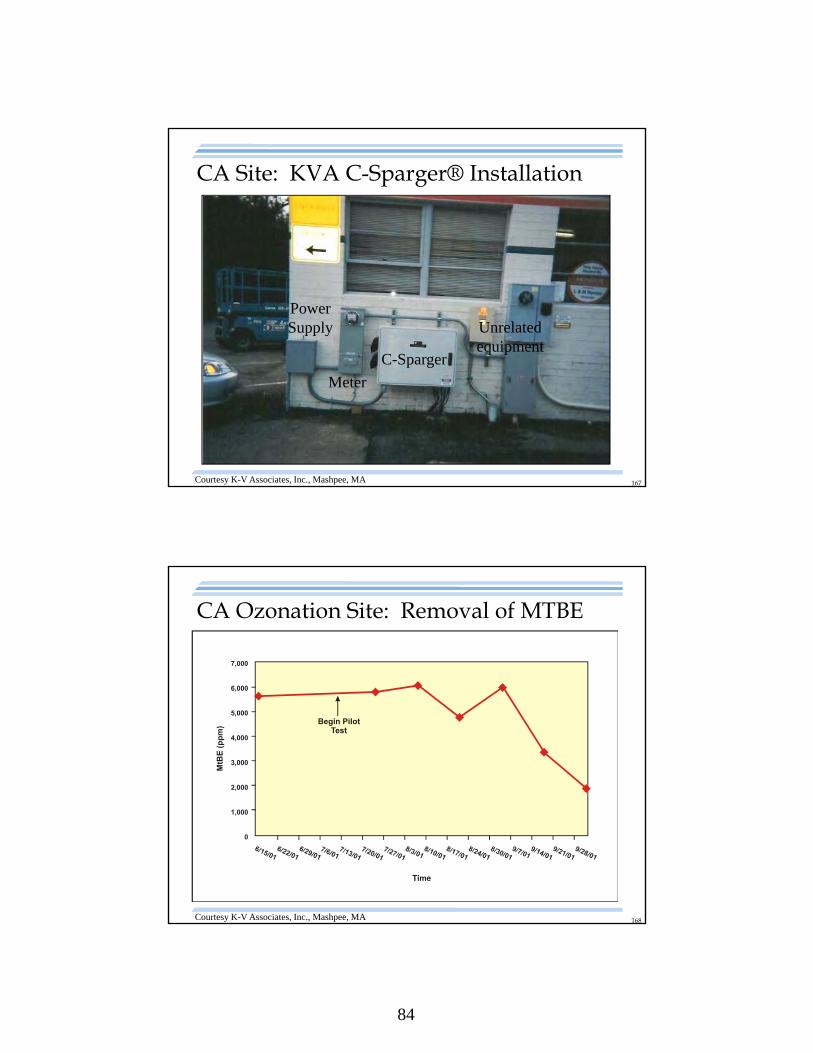
CA Ozonation Site: Installation
Courtesy K-V Associates, Inc., Mashpee, MA
84
167
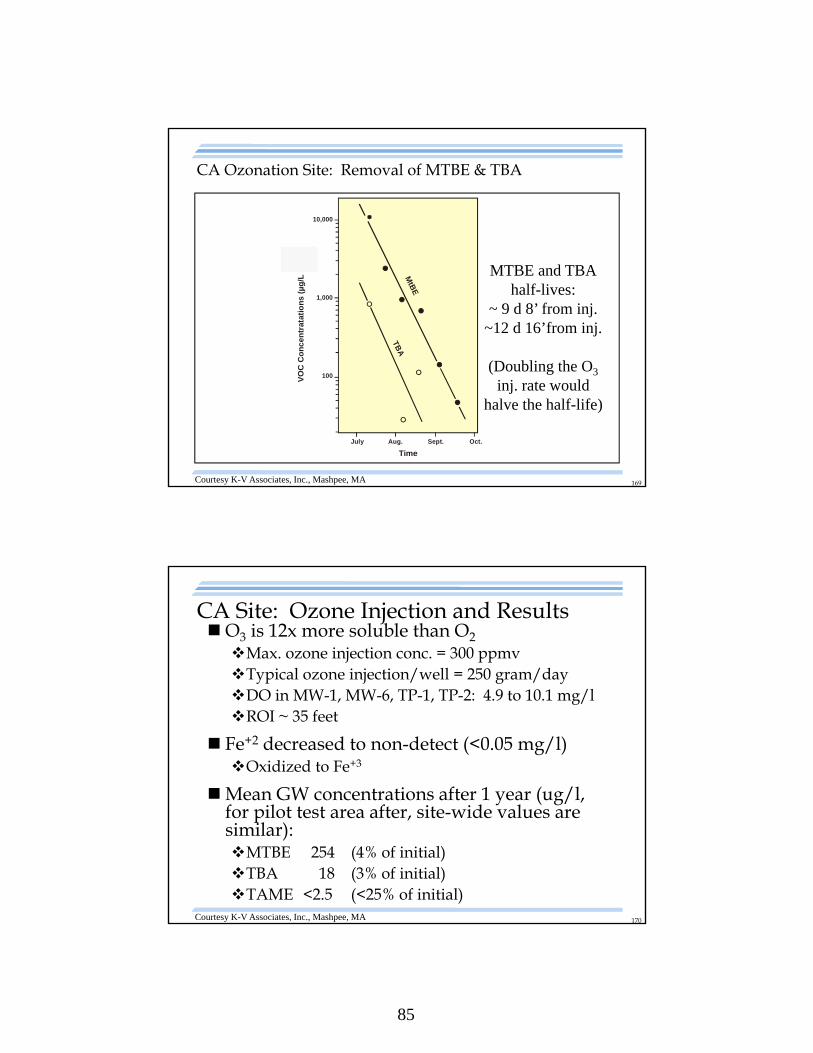
CA Site: KVA C-Sparger® Installation
C-Sparger
PowerSupply
Meter
Unrelated equipment
Courtesy K-V Associates, Inc., Mashpee, MA
168
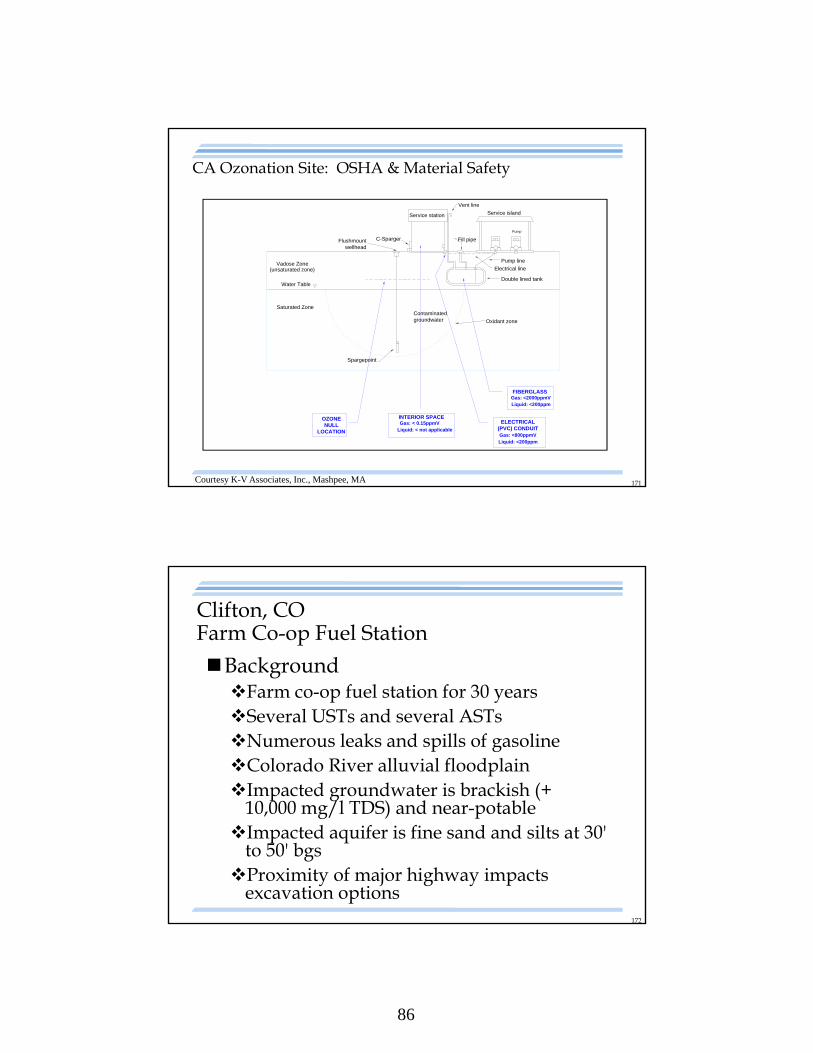
CA Ozonation Site: Removal of MTBE
Courtesy K-V Associates, Inc., Mashpee, MA
85
169
MtB
E
VO
C C
on
cen
trat
atio
ns
(g
/L -
pp
m)
µ
10,000
1,000
100
July Aug. Sept. Oct.
TBA
Time
CA Ozonation Site: Removal of MTBE & TBA
MTBE and TBAhalf-lives:
~ 9 d 8’ from inj.~12 d 16’from inj.
(Doubling the O3
inj. rate wouldhalve the half-life)
Courtesy K-V Associates, Inc., Mashpee, MA
170
CA Site: Ozone Injection and ResultsO3 is 12x more soluble than O2Max. ozone injection conc. = 300 ppmvTypical ozone injection/well = 250 gram/dayDO in MW-1, MW-6, TP-1, TP-2: 4.9 to 10.1 mg/lROI ~ 35 feet
Fe+2 decreased to non-detect (<0.05 mg/l)Oxidized to Fe+3
Mean GW concentrations after 1 year (ug/l, for pilot test area after, site-wide values are similar):MTBE 254 (4% of initial)TBA 18 (3% of initial)TAME <2.5 (<25% of initial)
Courtesy K-V Associates, Inc., Mashpee, MA
86
171
Service station Service island
Vent line
Fill pipeC-SpargerFlushmount wellhead
Spargepoint
Pump
Pump line
Electrical line
Contaminated groundwater
Double lined tank
Vadose Zone(unsaturated zone)
Water Table
Saturated Zone
FIBERGLASSGas: <2000ppmVLiquid: <200ppm
ELECTRICAL(PVC) CONDUITGas: <800ppmVLiquid: <200ppm
OZONE NULL
LOCATION
Oxidant zone
Gas: < 0.15ppmVLiquid: < not applicable
INTERIOR SPACE
CA Ozonation Site: OSHA & Material Safety
Courtesy K-V Associates, Inc., Mashpee, MA
172
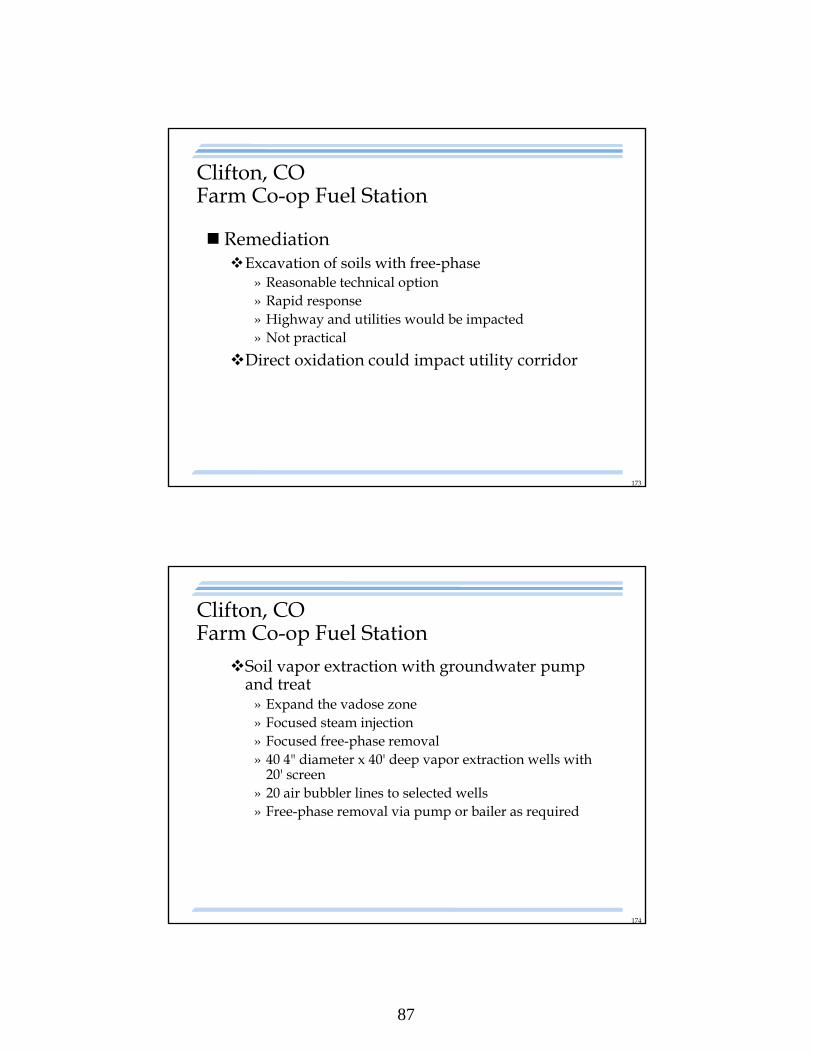
Clifton, COFarm Co-op Fuel Station
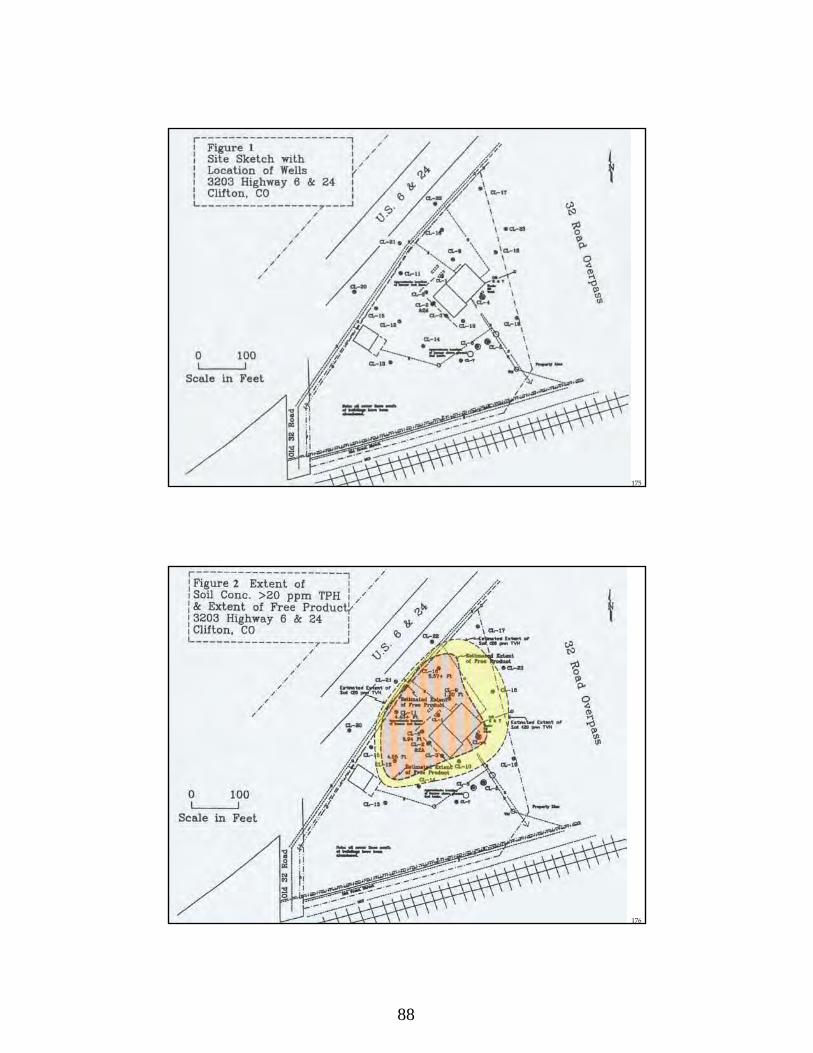
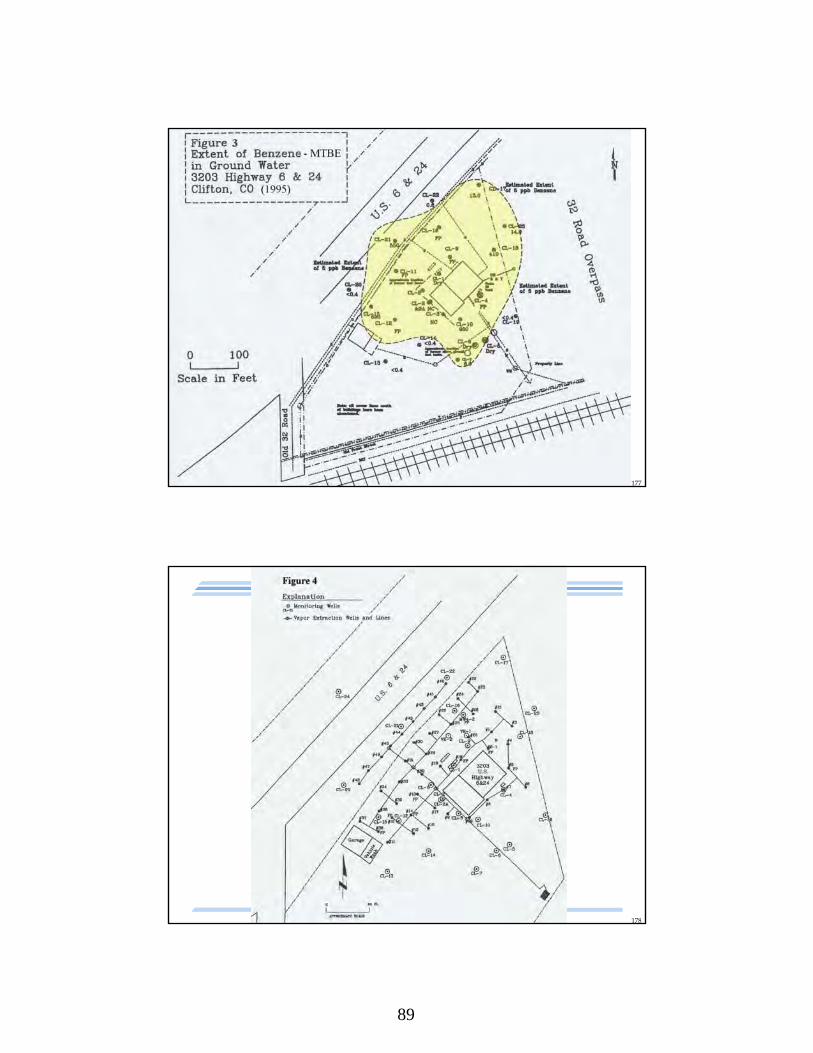
BackgroundFarm co-op fuel station for 30 yearsSeveral USTs and several ASTsNumerous leaks and spills of gasolineColorado River alluvial floodplainImpacted groundwater is brackish (+
10,000 mg/l TDS) and near-potableImpacted aquifer is fine sand and silts at 30'
to 50' bgsProximity of major highway impacts
excavation options
87
173
Clifton, COFarm Co-op Fuel Station
RemediationExcavation of soils with free-phase
» Reasonable technical option» Rapid response» Highway and utilities would be impacted» Not practical
Direct oxidation could impact utility corridor
174
Clifton, COFarm Co-op Fuel Station
Soil vapor extraction with groundwater pump and treat
» Expand the vadose zone» Focused steam injection» Focused free-phase removal» 40 4" diameter x 40' deep vapor extraction wells with
20' screen» 20 air bubbler lines to selected wells» Free-phase removal via pump or bailer as required
88
175
176
89
177
178
90
179
180
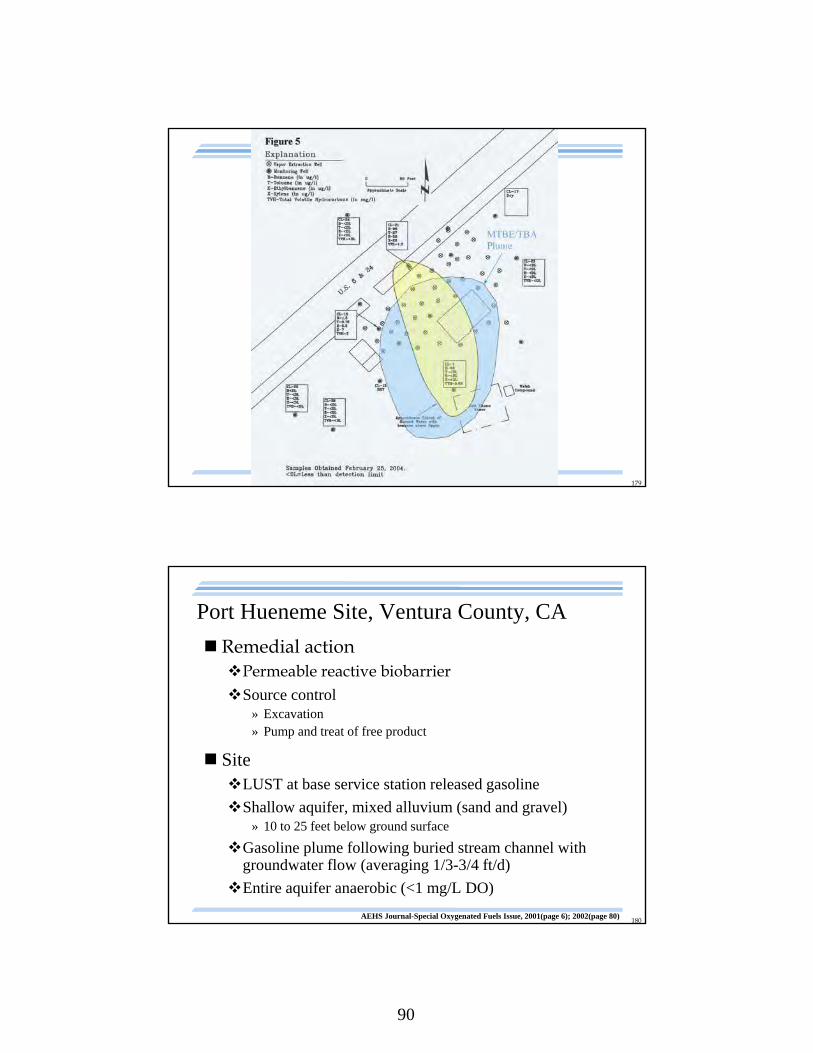
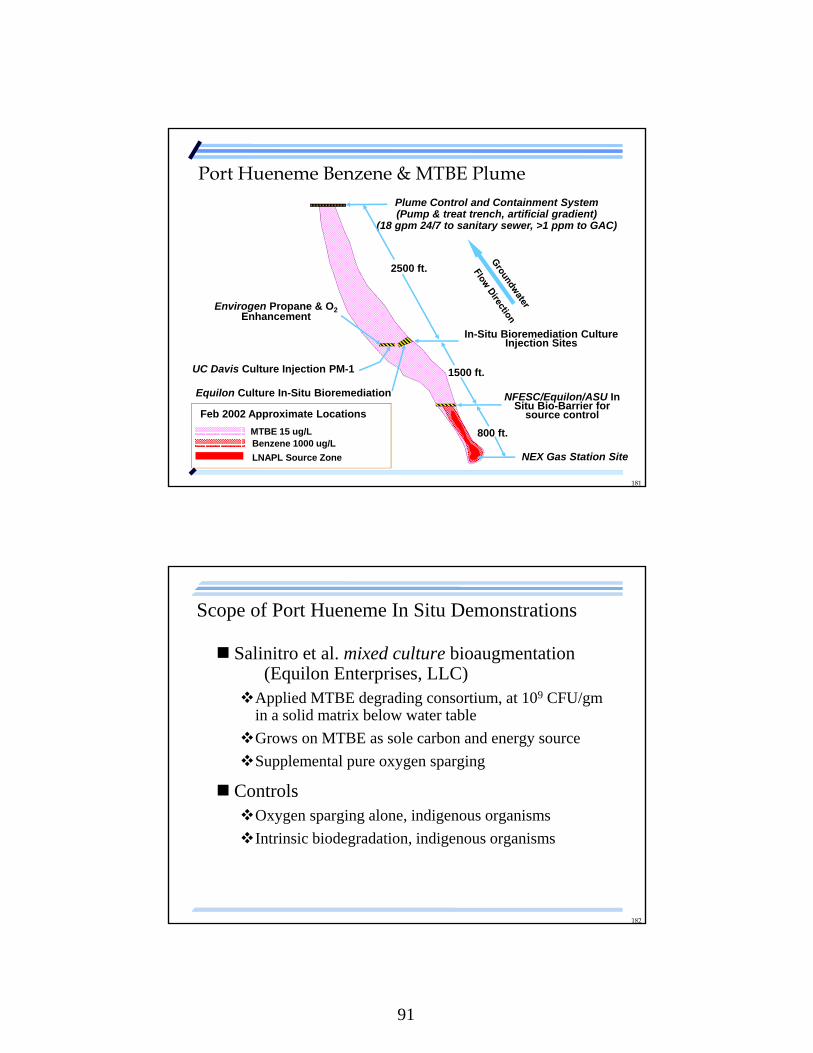
Port Hueneme Site, Ventura County, CA
Remedial actionPermeable reactive biobarrierSource control
» Excavation» Pump and treat of free product
SiteLUST at base service station released gasoline
Shallow aquifer, mixed alluvium (sand and gravel)» 10 to 25 feet below ground surface
Gasoline plume following buried stream channel with groundwater flow (averaging 1/3-3/4 ft/d)
Entire aquifer anaerobic (<1 mg/L DO)
AEHS Journal-Special Oxygenated Fuels Issue, 2001(page 6); 2002(page 80)
91
181
UC Davis Culture Injection PM-1
Equilon Culture In-Situ Bioremediation NFESC/Equilon/ASU In Situ Bio-Barrier for
source control
NEX Gas Station Site
Envirogen Propane & O2Enhancement
Plume Control and Containment System(Pump & treat trench, artificial gradient)
(18 gpm 24/7 to sanitary sewer, >1 ppm to GAC)
Port Hueneme Benzene & MTBE Plume
MTBE 15 ug/L
Feb 2002 Approximate Locations
LNAPL Source Zone
In-Situ Bioremediation Culture Injection Sites
2500 ft.
1500 ft.
800 ft.Benzene 1000 ug/L
182
Scope of Port Hueneme In Situ Demonstrations
Salinitro et al. mixed culture bioaugmentation(Equilon Enterprises, LLC)
Applied MTBE degrading consortium, at 109 CFU/gm in a solid matrix below water table
Grows on MTBE as sole carbon and energy source
Supplemental pure oxygen sparging
ControlsOxygen sparging alone, indigenous organisms
Intrinsic biodegradation, indigenous organisms
92
183
Scope of Port Hueneme In Situ Demonstrations
Scow et al. pure culture bioaugmentation (UC Davis)Degrades MTBE as sole carbon and energy source
Rapid growth on toluene or ethanol
Intermittent oxygen sparging at two depths
Genetic markers track organism distribution
ControlsOxygen sparging alone
Air sparging alone
184
Courtesy H20 R2 Consultants
Port Hueneme Pilot Test Installation
93
185
Port Hueneme: Bioaugmentation Results
Salinitro (mixed culture)Natural attenuation rate (t 1/2 = 693 days)
Oxygen sparging rate (t 1/2 = 99 days)
Bioaugmentation rate (t 1/2 = 18 days)
Scow (PM-1 pure culture)MTBE conc. reduced from 6 ppm to < 50 ppb
» bioaugmented test plot » control (air/oxygen sparge) plots,
TBA was not found
186
Port Hueneme: Pilot Study Conclusions
Indigenous microorganisms capable of degrading MTBE are stimulated by oxygen or aerationMicrobes are more widespread than previously thought
Bioaugmentation as a biobarrier transectIncreases in situ degradation rate
Decreases MTBE half-life in the field
94
187
Port Hueneme: Scaled-up Biobarrier
Winner of 2001 NGWA Outstanding Project in Ground
Water Remediation Award
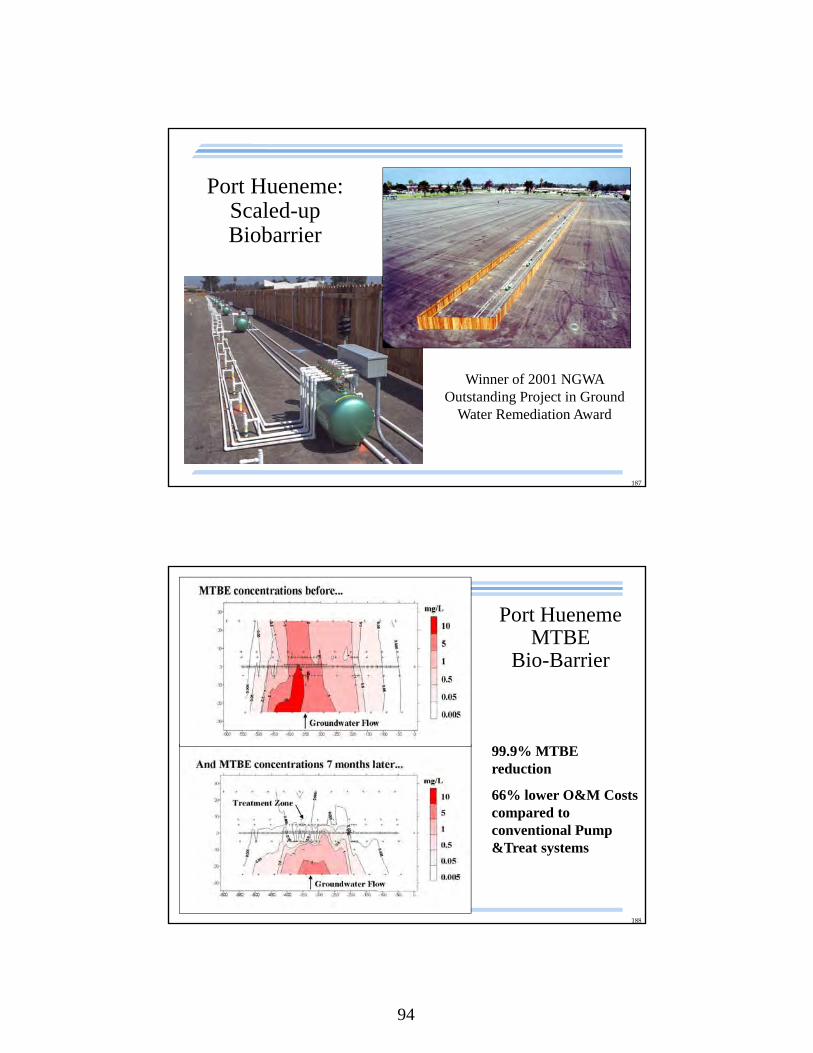
188
Port Hueneme MTBE
Bio-Barrier
99.9% MTBE reduction
66% lower O&M Costs compared to conventional Pump &Treat systems
95
189
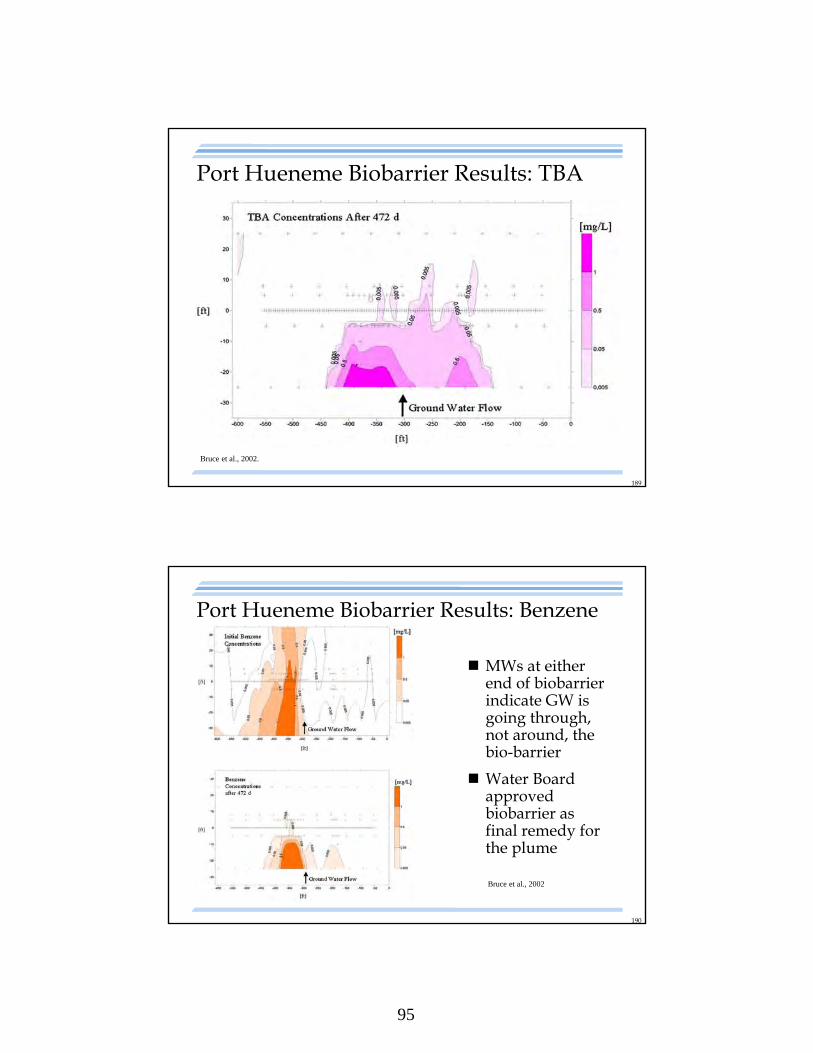
Port Hueneme Biobarrier Results: TBA
Bruce et al., 2002.
190
Port Hueneme Biobarrier Results: Benzene
MWs at either end of biobarrier indicate GW is going through, not around, the bio-barrier
Water Board approved biobarrier as final remedy for the plume
Bruce et al., 2002
96
191
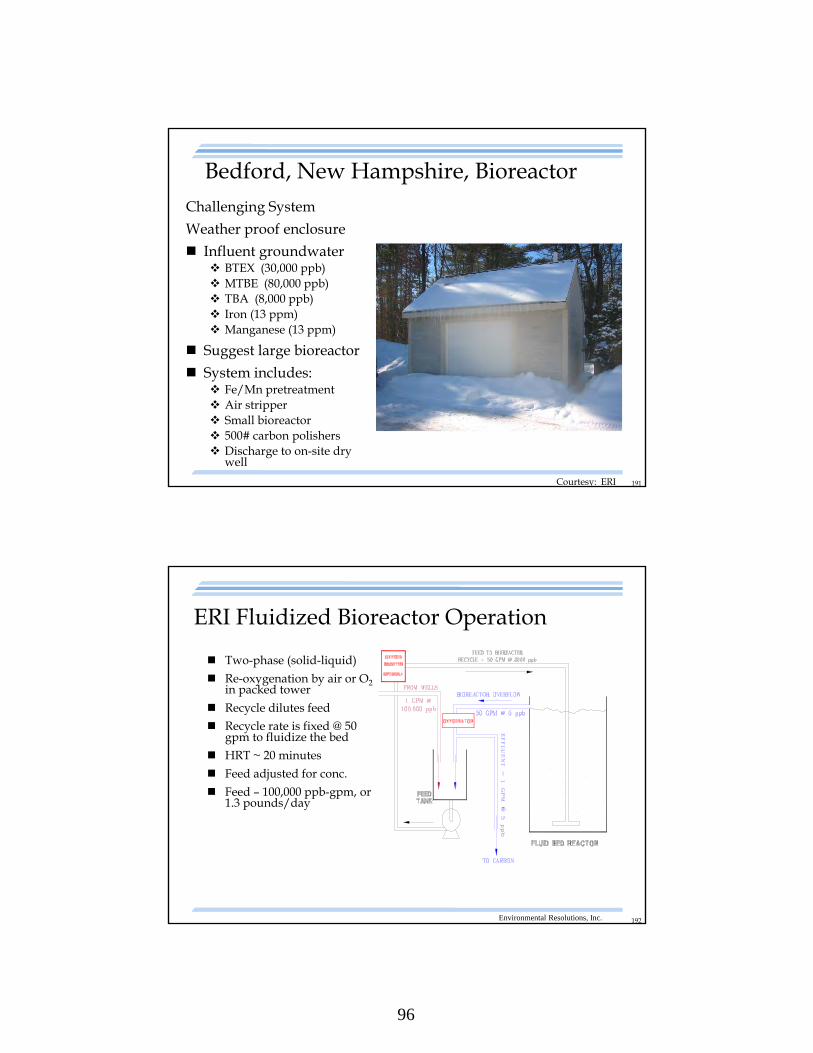
Bedford, New Hampshire, BioreactorChallenging System
Weather proof enclosure
Influent groundwater BTEX (30,000 ppb) MTBE (80,000 ppb) TBA (8,000 ppb) Iron (13 ppm) Manganese (13 ppm)
Suggest large bioreactor
System includes: Fe/Mn pretreatment Air stripper Small bioreactor 500# carbon polishers Discharge to on-site dry
well
Courtesy: ERI
192
ERI Fluidized Bioreactor Operation
Two-phase (solid-liquid)
Re-oxygenation by air or O2 in packed tower
Recycle dilutes feed
Recycle rate is fixed @ 50 gpm to fluidize the bed
HRT ~ 20 minutes
Feed adjusted for conc.
Feed – 100,000 ppb-gpm, or 1.3 pounds/day
Environmental Resolutions, Inc.
97
193
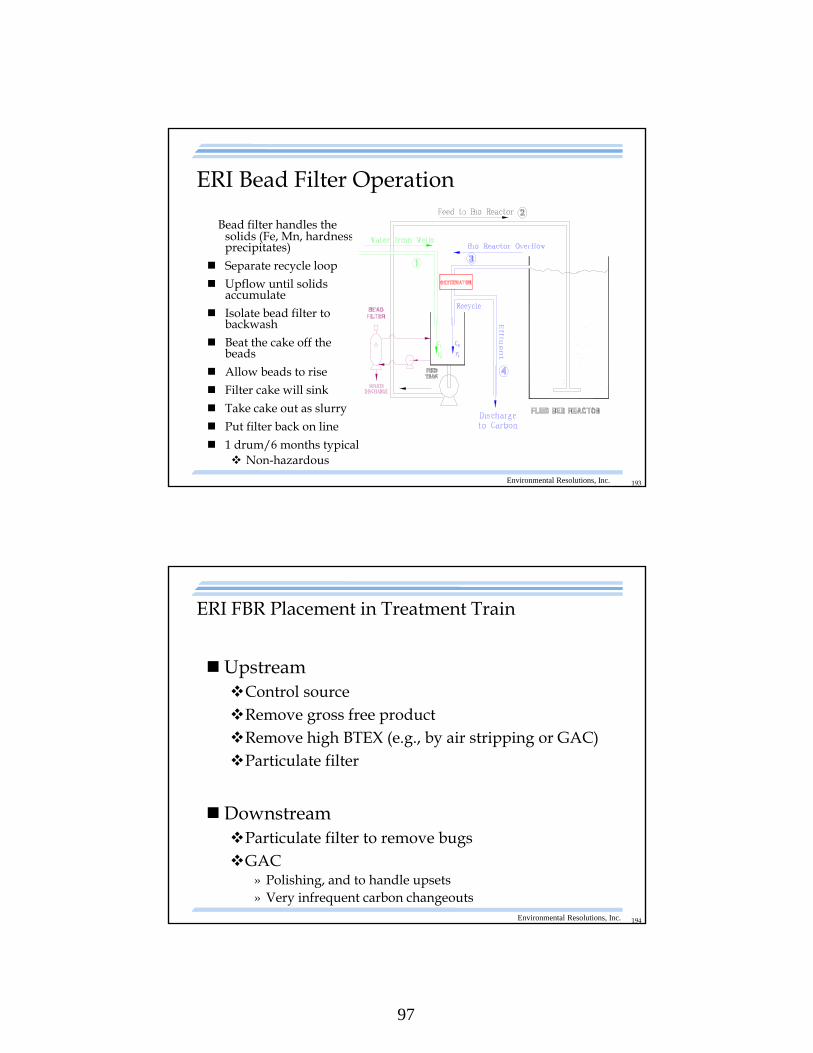
ERI Bead Filter Operation
Bead filter handles the solids (Fe, Mn, hardness precipitates)
Separate recycle loop
Upflow until solids accumulate
Isolate bead filter to backwash
Beat the cake off the beads
Allow beads to rise
Filter cake will sink
Take cake out as slurry
Put filter back on line
1 drum/6 months typical Non-hazardous
Environmental Resolutions, Inc.
194
ERI FBR Placement in Treatment Train
UpstreamControl sourceRemove gross free productRemove high BTEX (e.g., by air stripping or GAC)Particulate filter
DownstreamParticulate filter to remove bugsGAC
» Polishing, and to handle upsets» Very infrequent carbon changeouts
Environmental Resolutions, Inc.
98
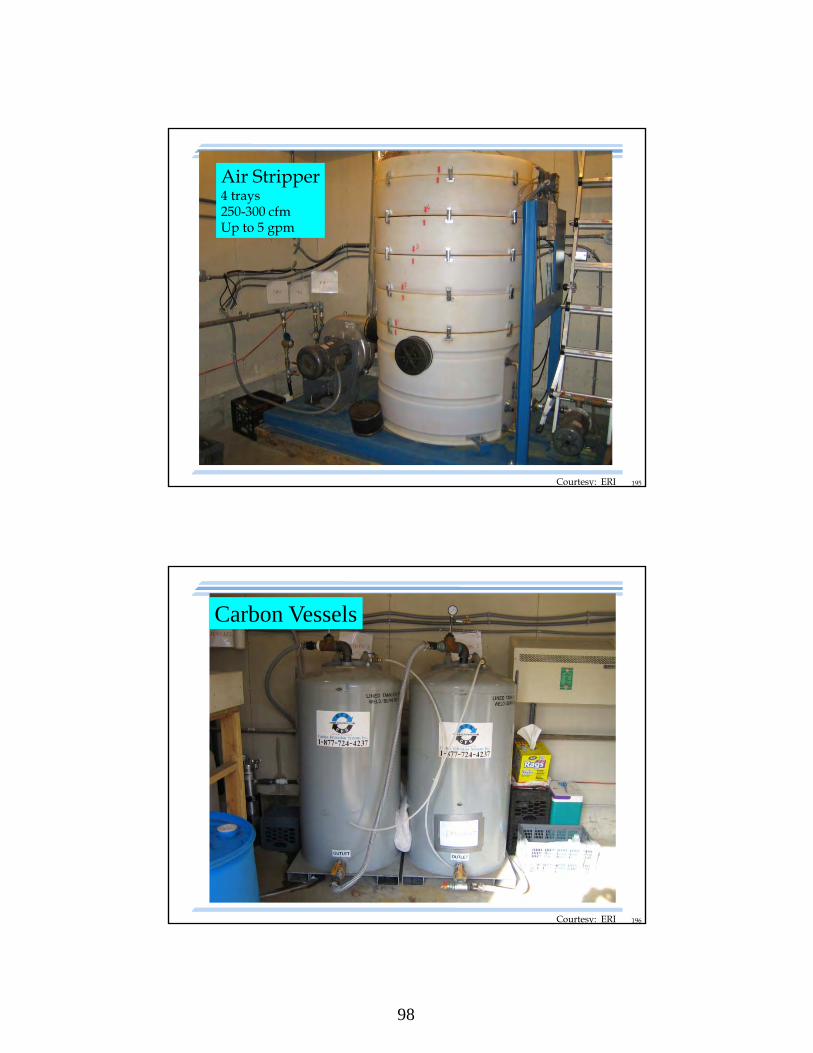
195Courtesy: ERI
Air Stripper4 trays250-300 cfmUp to 5 gpm
196
Carbon Vessels
Courtesy: ERI
99
197
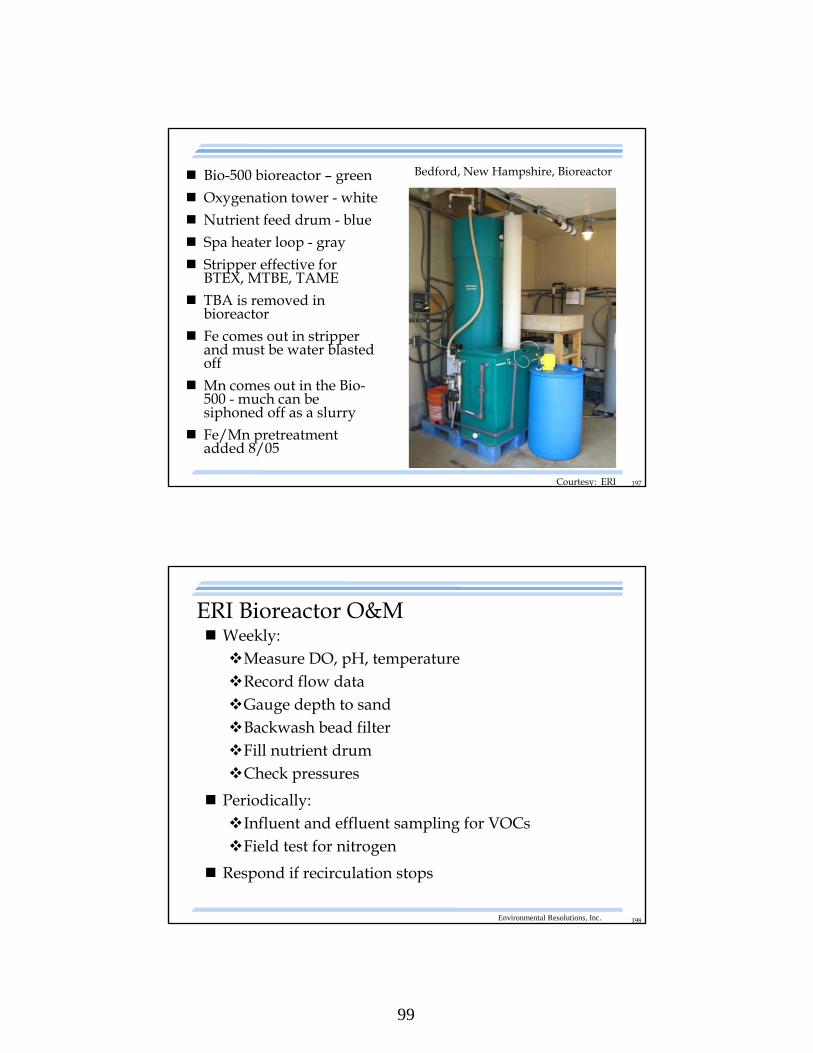
Bio-500 bioreactor – green
Oxygenation tower - white
Nutrient feed drum - blue
Spa heater loop - gray
Stripper effective for BTEX, MTBE, TAME
TBA is removed in bioreactor
Fe comes out in stripper and must be water blasted off
Mn comes out in the Bio-500 - much can be siphoned off as a slurry
Fe/Mn pretreatment added 8/05
Courtesy: ERI
Bedford, New Hampshire, Bioreactor
198
ERI Bioreactor O&M Weekly: Measure DO, pH, temperatureRecord flow dataGauge depth to sandBackwash bead filterFill nutrient drumCheck pressures
Periodically:Influent and effluent sampling for VOCsField test for nitrogen
Respond if recirculation stops
Environmental Resolutions, Inc.
100
199
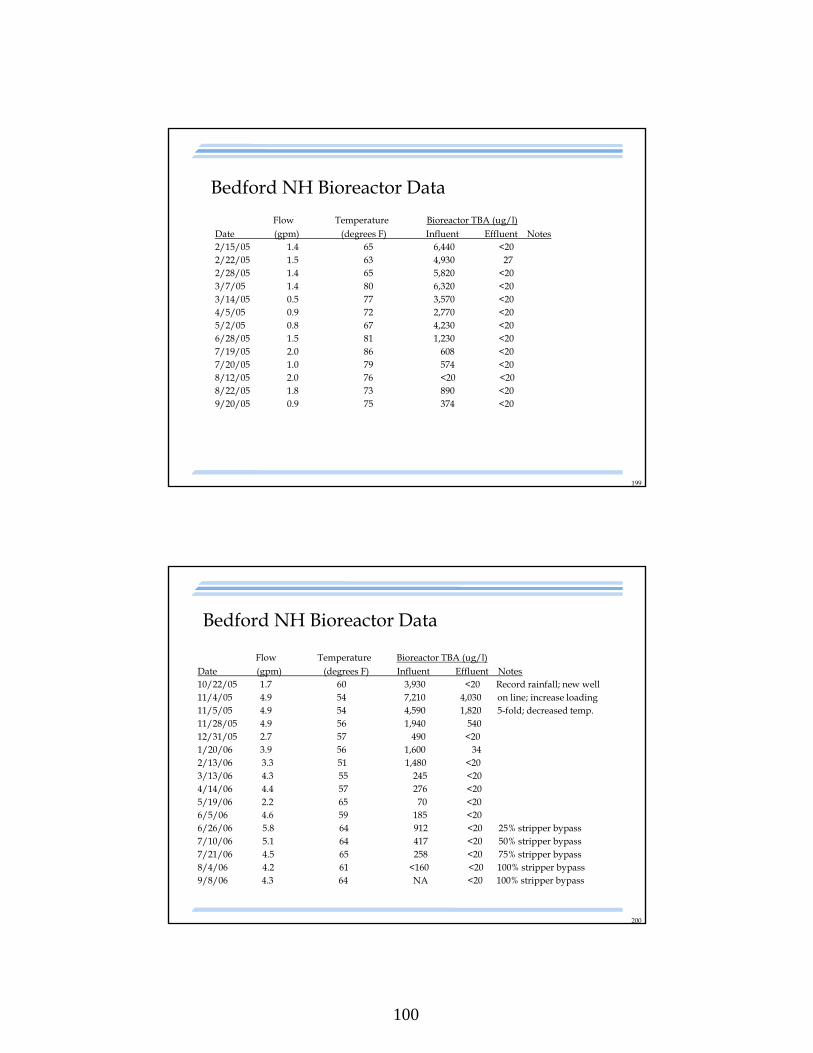
Bedford NH Bioreactor Data
Flow Temperature Bioreactor TBA (ug/l)Date (gpm) (degrees F) Influent Effluent Notes2/15/05 1.4 65 6,440 <20 2/22/05 1.5 63 4,930 27 2/28/05 1.4 65 5,820 <20 3/7/05 1.4 80 6,320 <20 3/14/05 0.5 77 3,570 <20 4/5/05 0.9 72 2,770 <205/2/05 0.8 67 4,230 <206/28/05 1.5 81 1,230 <20 7/19/05 2.0 86 608 <207/20/05 1.0 79 574 <208/12/05 2.0 76 <20 <208/22/05 1.8 73 890 <209/20/05 0.9 75 374 <20
200
Bedford NH Bioreactor Data
Flow Temperature Bioreactor TBA (ug/l)Date (gpm) (degrees F) Influent Effluent Notes10/22/05 1.7 60 3,930 <20 Record rainfall; new well11/4/05 4.9 54 7,210 4,030 on line; increase loading11/5/05 4.9 54 4,590 1,820 5-fold; decreased temp.11/28/05 4.9 56 1,940 54012/31/05 2.7 57 490 <201/20/06 3.9 56 1,600 342/13/06 3.3 51 1,480 <203/13/06 4.3 55 245 <204/14/06 4.4 57 276 <205/19/06 2.2 65 70 <206/5/06 4.6 59 185 <206/26/06 5.8 64 912 <20 25% stripper bypass7/10/06 5.1 64 417 <20 50% stripper bypass7/21/06 4.5 65 258 <20 75% stripper bypass8/4/06 4.2 61 <160 <20 100% stripper bypass9/8/06 4.3 64 NA <20 100% stripper bypass
101
201
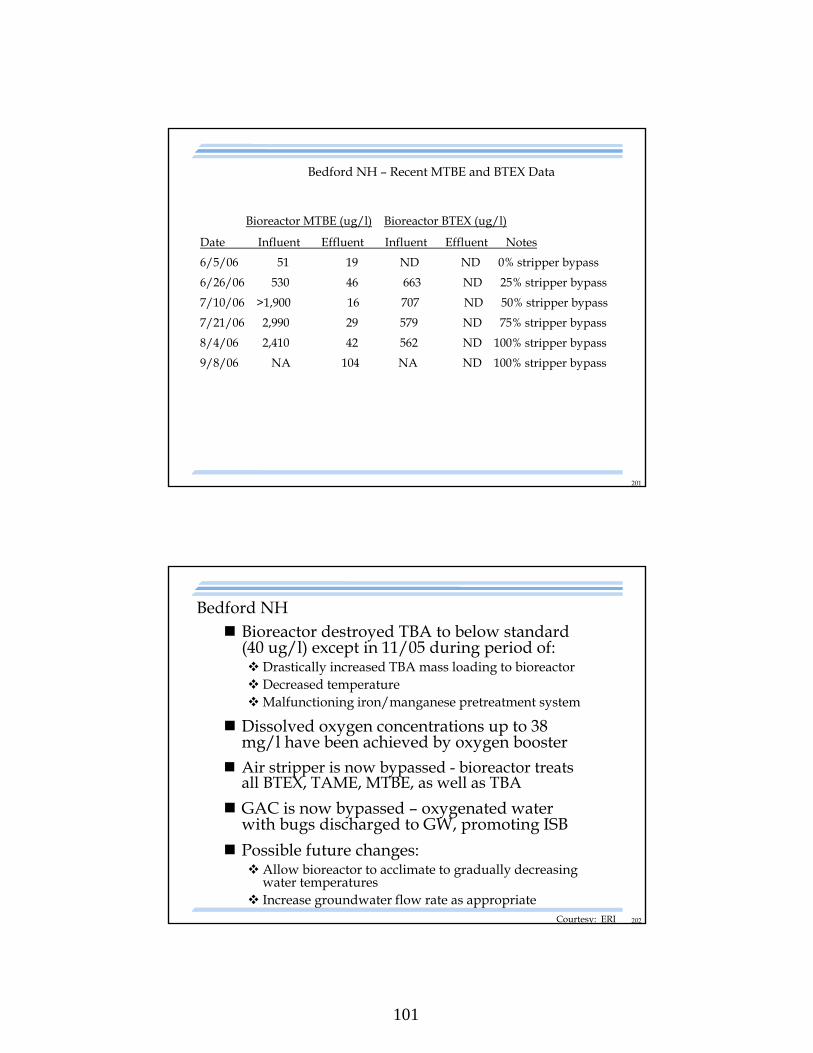
Bedford NH – Recent MTBE and BTEX Data
Bioreactor MTBE (ug/l) Bioreactor BTEX (ug/l)
Date Influent Effluent Influent Effluent Notes
6/5/06 51 19 ND ND 0% stripper bypass
6/26/06 530 46 663 ND 25% stripper bypass
7/10/06 >1,900 16 707 ND 50% stripper bypass
7/21/06 2,990 29 579 ND 75% stripper bypass
8/4/06 2,410 42 562 ND 100% stripper bypass
9/8/06 NA 104 NA ND 100% stripper bypass
202
Bedford NH Bioreactor destroyed TBA to below standard
(40 ug/l) except in 11/05 during period of: Drastically increased TBA mass loading to bioreactor Decreased temperatureMalfunctioning iron/manganese pretreatment system
Dissolved oxygen concentrations up to 38 mg/l have been achieved by oxygen booster
Air stripper is now bypassed - bioreactor treats all BTEX, TAME, MTBE, as well as TBA
GAC is now bypassed – oxygenated water with bugs discharged to GW, promoting ISB
Possible future changes: Allow bioreactor to acclimate to gradually decreasing
water temperatures Increase groundwater flow rate as appropriate
Courtesy: ERI
102
203
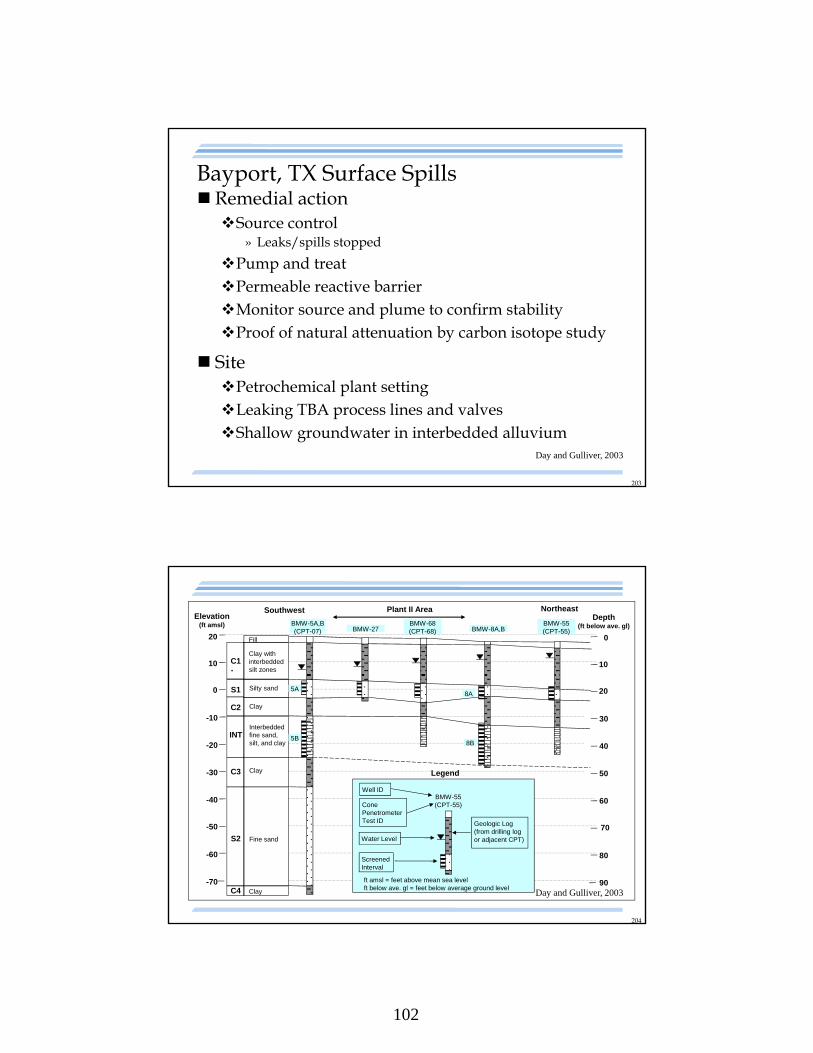
Remedial actionSource control
» Leaks/spills stopped
Pump and treatPermeable reactive barrierMonitor source and plume to confirm stabilityProof of natural attenuation by carbon isotope study
SitePetrochemical plant settingLeaking TBA process lines and valvesShallow groundwater in interbedded alluvium
Bayport, TX Surface Spills
Day and Gulliver, 2003
204
Elevation (ft amsl)
10
20
0
-10
-20
-30
-40
-50
-60
-70
C1
S1
S2
INT
C2
C3
C4
Clay with interbedded silt zones
Clay
Clay
Silty sand
Interbedded fine sand, silt, and clay
Fine sand
Clay
Fill
BMW-27BMW-68(CPT-68) BMW-8A,B
BMW-55(CPT-55)
BMW-5A,B(CPT-07)
Southwest NortheastPlant II Area
10
0
20
30
40
50
60
70
80
90
Depth (ft below ave. gl)
5A
5B
8A
8B
BMW-55(CPT-55)
Legend
Well ID
Water Level
Screened Interval
Geologic Log(from drilling log or adjacent CPT)
Cone PenetrometerTest ID
ft amsl = feet above mean sea levelft below ave. gl = feet below average ground level
Day and Gulliver, 2003
103
205
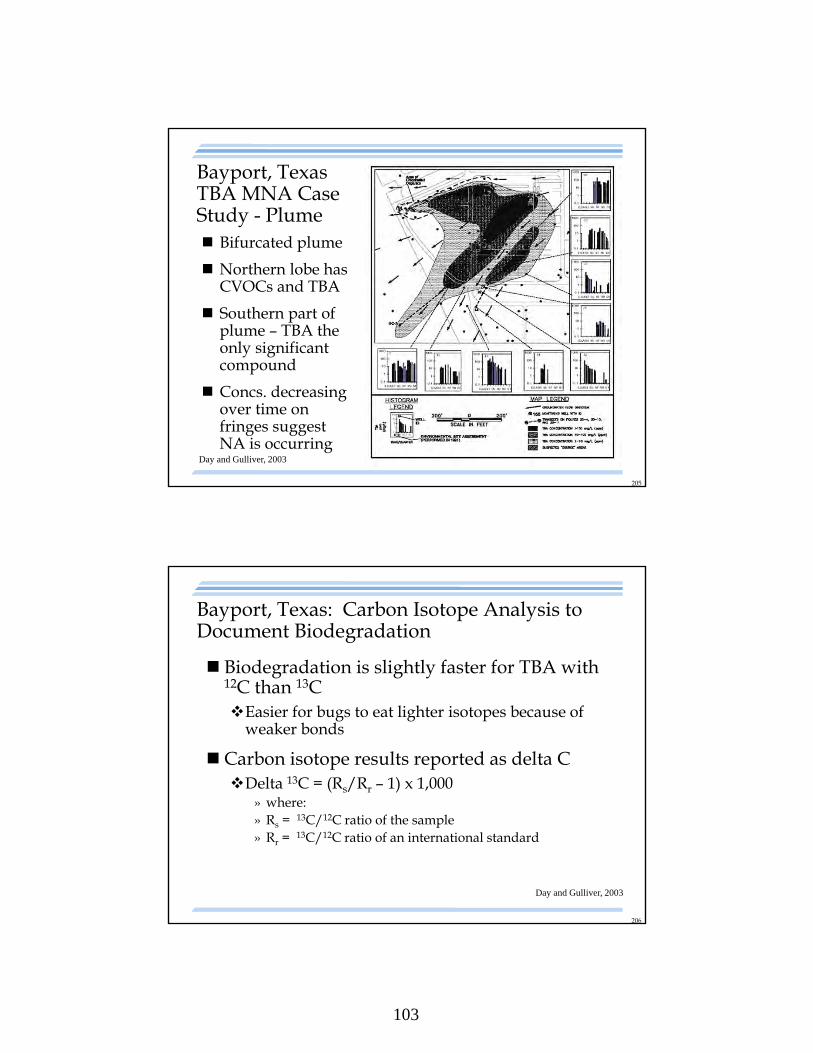
Bayport, Texas TBA MNA Case Study - Plume Bifurcated plume
Northern lobe has CVOCs and TBA
Southern part of plume – TBA the only significant compound
Concs. decreasing over time on fringes suggest NA is occurring
Day and Gulliver, 2003
206
Bayport, Texas: Carbon Isotope Analysis to Document Biodegradation
Biodegradation is slightly faster for TBA with 12C than 13C Easier for bugs to eat lighter isotopes because of
weaker bonds
Carbon isotope results reported as delta C Delta 13C = (Rs/Rr – 1) x 1,000
» where:» Rs = 13C/12C ratio of the sample » Rr = 13C/12C ratio of an international standard
Day and Gulliver, 2003
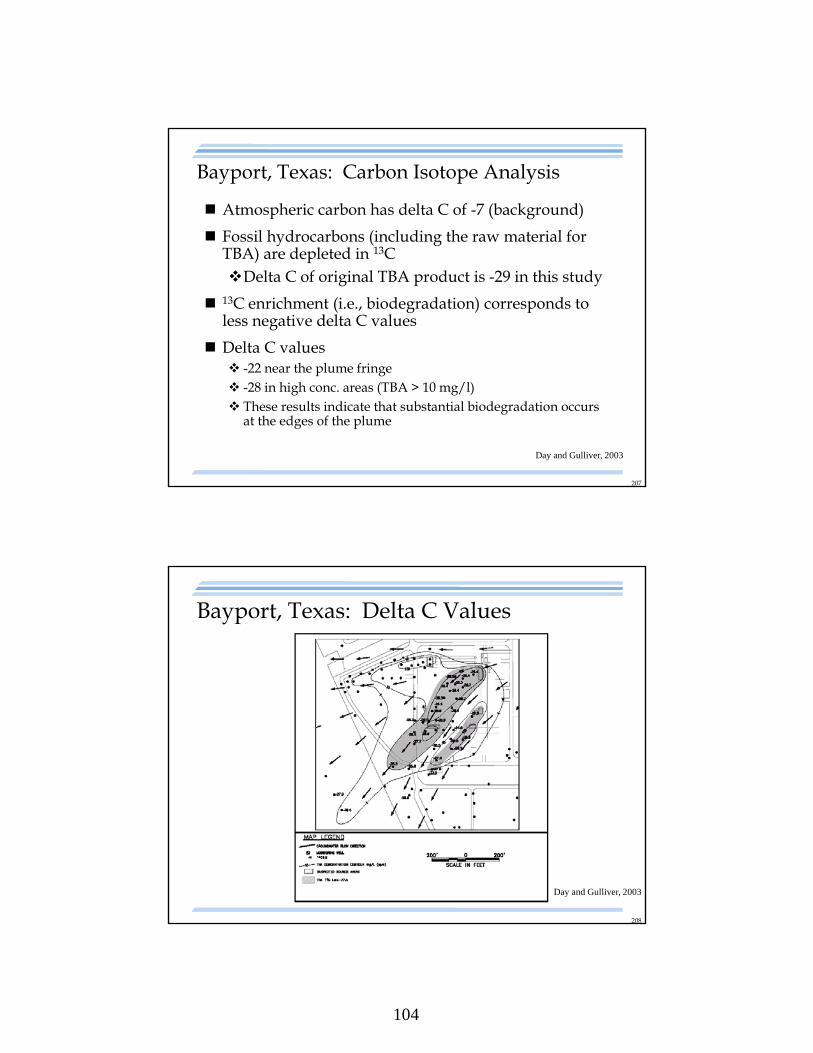
104
207
Bayport, Texas: Carbon Isotope Analysis
Atmospheric carbon has delta C of -7 (background)
Fossil hydrocarbons (including the raw material for TBA) are depleted in 13CDelta C of original TBA product is -29 in this study
13C enrichment (i.e., biodegradation) corresponds to less negative delta C values
Delta C values -22 near the plume fringe -28 in high conc. areas (TBA > 10 mg/l) These results indicate that substantial biodegradation occurs
at the edges of the plume
Day and Gulliver, 2003
208
Bayport, Texas: Delta C Values
Day and Gulliver, 2003
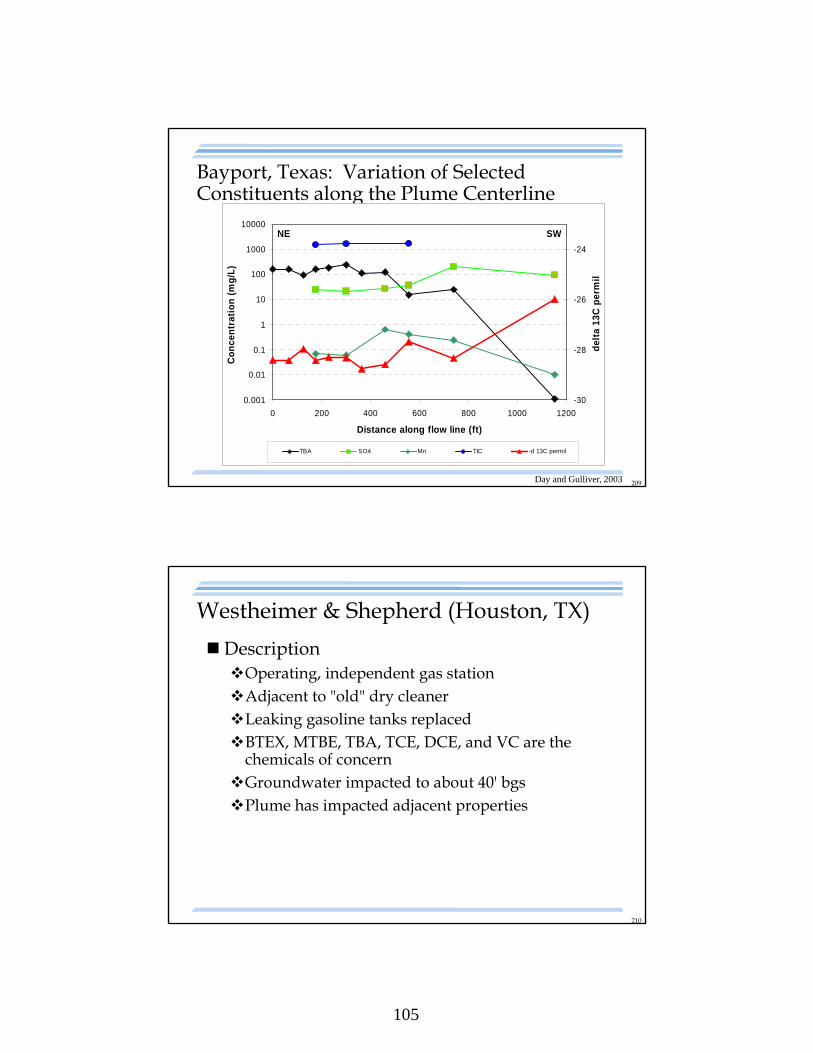
105
209
Bayport, Texas: Variation of Selected Constituents along the Plume Centerline
0.001
0.01
0.1
1
10
100
1000
10000
0 200 400 600 800 1000 1200
Distance along flow line (ft)
Co
nce
ntr
atio
n (
mg
/L)
-30
-28
-26
-24
del
ta 1
3C p
erm
il
TBA SO4 Mn TIC -d 13C permil
NE SW
Day and Gulliver, 2003
210
Westheimer & Shepherd (Houston, TX)
DescriptionOperating, independent gas stationAdjacent to "old" dry cleanerLeaking gasoline tanks replacedBTEX, MTBE, TBA, TCE, DCE, and VC are the
chemicals of concernGroundwater impacted to about 40' bgsPlume has impacted adjacent properties
106
211
Westheimer & Shepherd (Houston, TX)
RemediationRemove tanks and soils with free-phaseReplace boiler and dry cleaning machineSecondary containment for "new" dry cleaning
machineBackfill tank area with clean soils and 5 lbs KMnO4
per tonSoil vapor extraction
» Six 6" diameter dual-phase extraction wells» Screened from 15' bgs to 35' bgs» Extract 20 CFM per well» Incinerate vapor for 1st 4 months, then GAC for 8 months
212
Westheimer & Shepherd (Houston, TX)
Remediation (continued) Groundwater pump and treat
» Six 6" diameter dual-phase extraction wells» Pump 0.5 to 1.0 gpm per well» Treat groundwater with UV/ozone (1st 6 months)» Treat groundwater with GAC (months 7-18)» Discharge to POTW
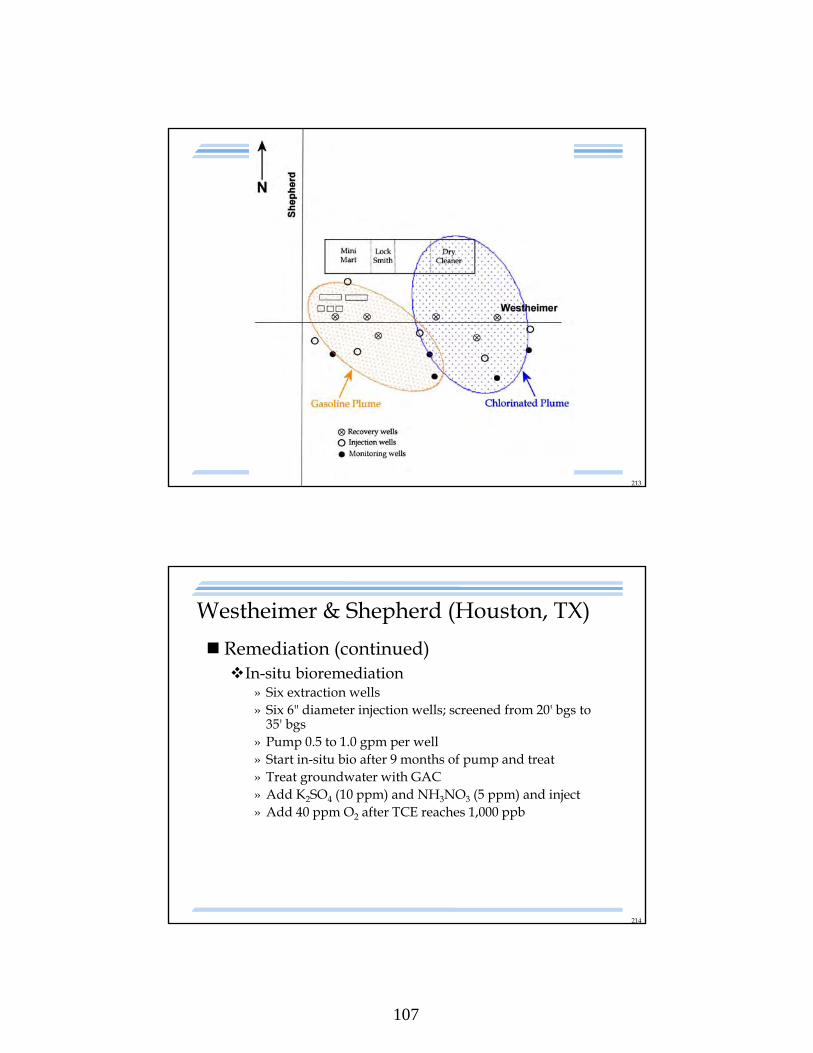
107
213
214
Westheimer & Shepherd (Houston, TX)
Remediation (continued)In-situ bioremediation
» Six extraction wells» Six 6" diameter injection wells; screened from 20' bgs to
35' bgs» Pump 0.5 to 1.0 gpm per well» Start in-situ bio after 9 months of pump and treat» Treat groundwater with GAC» Add K2SO4 (10 ppm) and NH3NO3 (5 ppm) and inject» Add 40 ppm O2 after TCE reaches 1,000 ppb
108
215
Westheimer & Shepherd (Houston, TX)
Remediation (continued) Monitored natural attenuation
» 10-year data base» 4-year MNA» Steady decrease» No at-risk receptors
216
Westheimer & Shepherd (Houston, TX)
Results/CommentsSignificant impact on adjacent propertiesConstruction excavation the only riskCooperation/access required from adjacent
property ownersPresence of TCE delayed use of aerobic
bioremediationChlorinated with the BTEX, TBA, and MTBE in the
plumes complicated the remediation sequenceTBA "stalled" until converted to aerobic in-situ
bioremediation
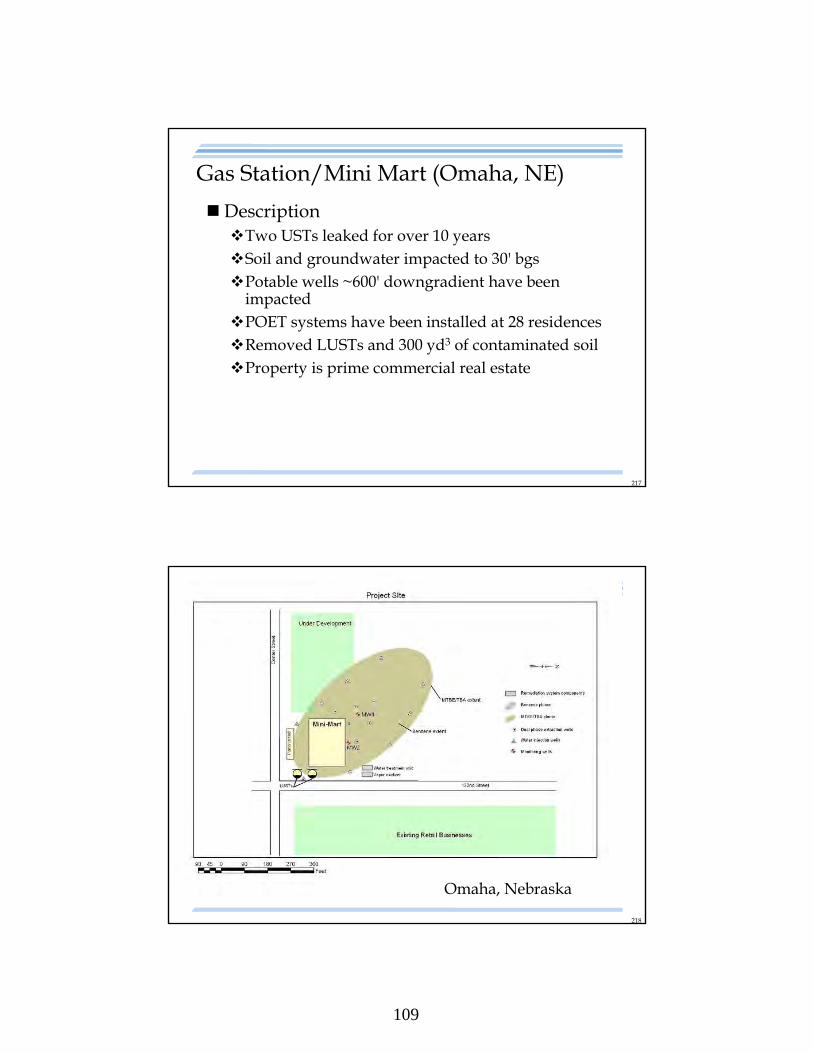
109
217
Gas Station/Mini Mart (Omaha, NE)
DescriptionTwo USTs leaked for over 10 yearsSoil and groundwater impacted to 30' bgsPotable wells ~600' downgradient have been
impactedPOET systems have been installed at 28 residencesRemoved LUSTs and 300 yd3 of contaminated soilProperty is prime commercial real estate
218
Omaha, Nebraska
110
219
Gas Station/Mini Mart (Omaha, NE)
AssessmentTwo phases of soil borings and monitoring wellsFree-phase gasoline in vadose zone soils and in
groundwater100' x 700' dissolved plume in 1st water-bearing
zone (20' bgs to 30' bgs)Uniform hydrogeology across the affected areaSource control has been effective
220
Gas Station/Mini Mart (Omaha, NE)
RemediationSoil vapor extraction, thermal oxidation, and
pump and treat» Free-phase zones» High concentration dissolved zones
200 scfm from six 6" diameter extraction wellsTreat vapor with thermal oxidizer for 4 months;
then treat with GAC
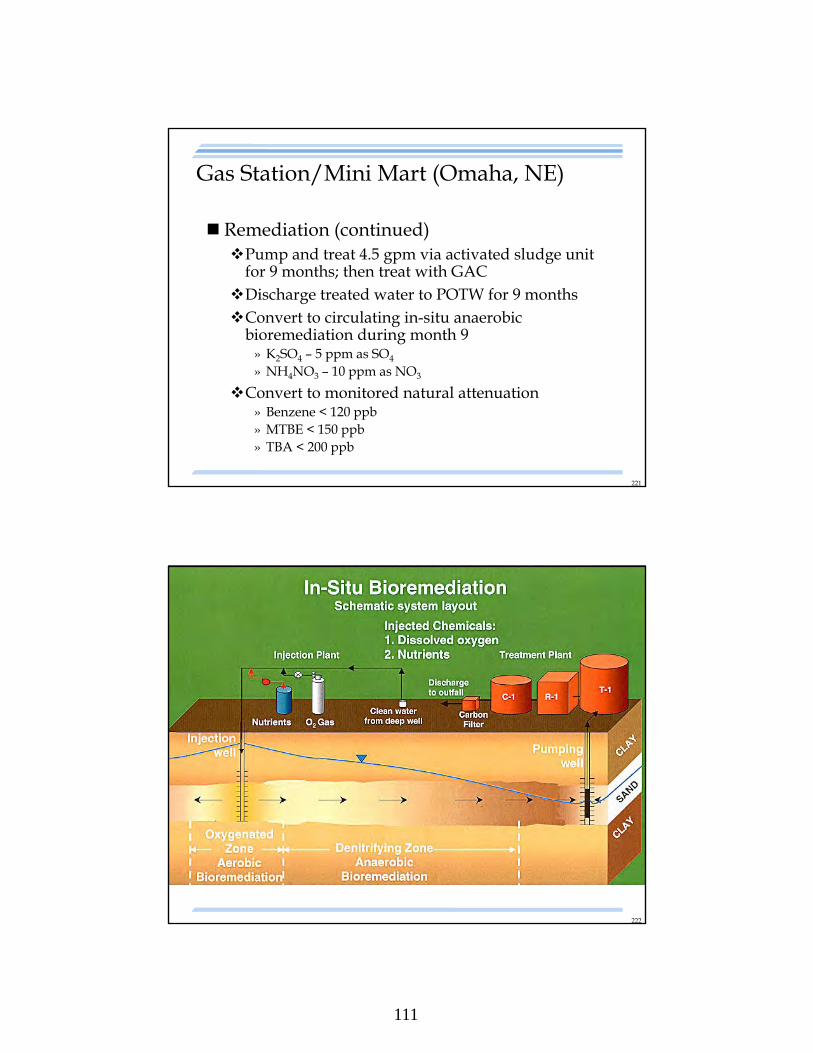
111
221
Gas Station/Mini Mart (Omaha, NE)
Remediation (continued)Pump and treat 4.5 gpm via activated sludge unit
for 9 months; then treat with GACDischarge treated water to POTW for 9 monthsConvert to circulating in-situ anaerobic
bioremediation during month 9» K2SO4 – 5 ppm as SO4
» NH4NO3 – 10 ppm as NO3
Convert to monitored natural attenuation» Benzene < 120 ppb» MTBE < 150 ppb» TBA < 200 ppb
222
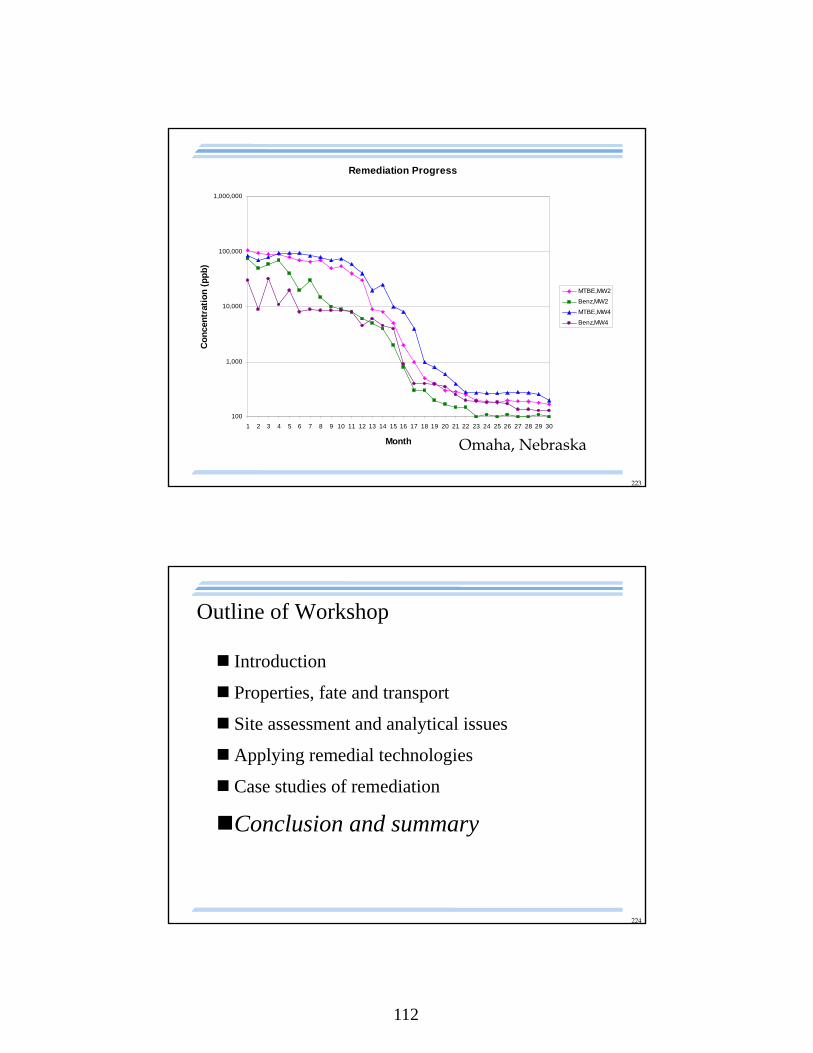
112
223
Omaha, Nebraska
Remediation Progress
100
1,000
10,000
100,000
1,000,000
1 2 3 4 5 6 7 8 9 10 11 12 13 14 15 16 17 18 19 20 21 22 23 24 25 26 27 28 29 30
Month
Co
nce
ntr
atio
n (
pp
b)
MTBE,MW2
Benz,MW2
MTBE,MW4
Benz,MW4
224
Outline of Workshop
Introduction
Properties, fate and transport
Site assessment and analytical issues
Applying remedial technologies
Case studies of remediation
Conclusion and summary
113
225
MTBE and TBA impacted groundwater has been successfully remediated using proven technology
Active remediation of ethanol is rare – biodegrades quickly
The presence of TBA with MTBE and BTEX can complicate the response
The presence of ethanol can result in longer plumes of other constituents
Many plume length studies indicate TBA, MTBE, ethanol, and BTEX plume dimensions are very site-specific
TBA and MTBE, due to higher solubility and lower adsorption, will tend to be on the leading edge of plumes
TBA/MTBE/Ethanol Remediation Summary
226
Ethanol, due to fast biodegradation, will tend to have smaller plume (even though soluble and non-adsorptive)
All chemicals dissolved in groundwater move with groundwater flow and respond to recharge and drawdown
Spilled or leaked gasoline - with or without TBA, MTBE, or ethanol - is a threat to groundwater
Cost-effective technologies have been developed that focus on TBA and MTBE
Microorganisms at many sites regularly degrade MTBE and TBA, but not as readily as ethanol
TBA/MTBE/Ethanol Remediation Summary
114
227
TBA/MTBE/Ethanol Remediation Summary
Field experience confirms the widespread existence of natural MTBE, TBA, and ethanol degraders
Natural attenuation has been demonstrated for TBA, MTBE, and ethanol
TBA and MTBE in spilled gasoline often increase the remediation duration and cost; few data exist for ethanol impacts
Remediation costs are site-specific and are largely determined by the duration of the gasoline leak, the adequacy of source control, local groundwater use, and hydrogeological conditions
228
Design Issues that Drive the Process
Receptor protection
Physical characteristics influence remediation of gasoline constituents:Solubility
Vapor pressure
Henry’s Law constant
Adsorption
Site specific conditionsHydrogeology
Migration pathways
Utilities, access and other features
115
229
TBA/MTBE/EthanolRemediation Seminar
Thank you for joining us!
Ellen Moyer, Ph.D., [email protected]
Richard [email protected]