Embed Size (px)
Citation preview
TD Securities London Energy Conference January 2018
Forward-looking Information This presentation contains forward-looking statements. When used in this presentation, the words “will”, “intend”, “plan”, ”potential”, “generate”, "grow", “deliver”, “can”, “continue”, “drive”, “anticipate”, “target”, “come”, “create”, “position”, “achieve”, “seek”, “propose”,
“forecast”, “estimate”, “expect”, “solution”, “outlook”, “assumes” and similar expressions, as they relate to AltaGas or any affiliate of AltaGas (including AltaGas or an affiliate of AltaGas following completion of the WGL Transaction), are intended to identify forward-
looking statements. In particular, this presentation contains forward-looking statements with respect to, among others things, business objectives; strategies; expected returns; expected growth (including growth in normalized EBITDA, normalized funds from
operations, dividends, payout ratios, customers, rate base and the components thereof) and sources of growth; capital spending; cash flow and sources of funds; results of operations; performance; expectations regarding growth and development projects and
other opportunities (including expected EBITDA contributions, capital expenditures, facility design specifications, cost, location and location benefits, ownership, operatorship, ability to expand, retrofit, double capacity, contracting capability, construction expertise,
progress of construction; development timelines; capacity; connection capability to infrastructure; transmission options; options for producers; access to markets; potential end markets; sale and purchase of LPG; export capability; sources of supply; tolling
arrangements; shipping costs; and timeline and targets and expected dates of construction completion; final investment decision; in-service and on-stream), expectations of Ridley Island Propane Export Terminal being Canada’s first west coast propane terminal
and potential for first mover competitive advantages; expectations regarding Astomos’ propane shipments; ability to capture market share and propane processing capacity; expectations on future market prices; access to capital markets; liquidity; target ratios
(including normalized FFO to debt and net debt to EBITDA), increase in gas production and demand for infrastructure in the Montney region; expectations regarding supply and demand for propane; sources of supply and WCSB exports and surpluses; expectations
for the longevity and reliability of infrastructure assets; the quantity and competiveness of pricing; barriers of entry for new gas generation and value of existing infrastructure; development of solar and battery projects and other renewable projects; potential energy
storage opportunities; expected system betterment-related capital expenditures; the timing, scale, and importance of medium-term midstream projects and the RIPET; the commitment to maintaining a balanced long term mix across three business lines; natural gas
pipeline replacement and refurbishment programs; cost, scale, and timing of the Marquette Connector Pipeline and WGL’s Marcellus pipelines; the stability and predictability of dividends and the sources of funds therefor; expectations regarding volumes and
throughput; competitiveness of WCSB gas; AltaGas’ view with respect to the California power market; sources of future supply and opportunities that may become available for existing AltaGas facilities; commodity exposure; frac spread exposure; hedging
exposure; foreign exchange; demand for propane; expectations regarding operating facilities; expected dates of regulatory approvals, licenses and permits; expected impacts of the US tax reform; and other expected financial results. In particular this presentation
also contains forward looking statements with respect to the combination of AltaGas and WGL and related performance, including, without limitation: the transformative nature of the WGL Transaction; the portfolio of assets of the combined entity; total enterprise
value; nature, number, value and timing of growth and investment opportunities available to AltaGas; the quality and growth potential of the assets; the strategic focus of the business; the combined customers, rate base and customer and rate base growth; growth
on an absolute dollar and per share basis; strength of earnings including, without limitation, EPS, EBITDA, EBIT and contributors and components thereof; annual dividend growth rate, payout ratios, and dividend yield; the ability of the combined entity to target
higher growth markets, high growth franchise areas, and other growth markets; the liquidity of the combined entity and its ability to maintain an investment grade credit rating; balance sheet strength; improved credit metrics and target credit metrics (including in
respect of FFO/debt and net debt/EBITDA); the leveraging of respective core competencies and strategies; the ability to deliver high quality service at reasonable rates; the fact that closing of the WGL transaction is conditioned on certain events occurring; the
geographical and industry diversification of the business; the stability of cash flows and of AltaGas’ business; the growth potential available to AltaGas in clean energy, natural gas generation and retail energy services; the significance and growth potential and
expectations for growth in the Montney and Marcellus/Utica; export opportunities; expectations regarding WGL's midstream investments; intentions for further investment; expectations for normalized EBITDA allocation geographically, by business segments and the
other components thereof; expected timing and capex for certain AltaGas and WGL projects and expected capital investment by business segment; future growth financing strategies; sources of financing and cash flow; long-term target business mix; access to
capital; anticipated completion of the WGL Transaction, including certain terms and conditions thereof and the anticipated completion and timing thereof; execution of permanent financing plans, including the consideration and value of potential asset sales and
future offerings; and the timing and receipt of all necessary regulatory approvals. Information and statements contained in this presentation that are not historical facts may be forward-looking statements.
These statements involve known and unknown risks, uncertainties and other factors that may cause actual results or events to differ materially from those anticipated in such forward-looking statements. Such statements reflect AltaGas’ current views with respect
to future events based on certain material factors and assumptions and are subject to certain risks and uncertainties, including, without limitation, changes in market competition, governmental or regulatory developments, changes in political environment, changes
in tax legislation, general economic conditions, capital resources and liquidity risk, market risk, commodity price, foreign exchange and interest rate risk, operational risk, volume declines, weather, construction, counterparty risk, environmental risk, regulatory risk,
labour relations, any event, change or other circumstance that could give rise to termination of the merger agreement in respect of the WGL Transaction, the inability to complete the WGL Transaction due to the failure to satisfy conditions to completion, including
that a governmental entity may prohibit, delay or refuse to grant approval for the consummation of the WGL Transaction, uncertainty regarding the length of time required to complete the WGL Transaction, the anticipated benefits of the WGL Transaction may not
materialize or may not occur within the time periods anticipated by AltaGas, impact of significant demands placed on AltaGas and WGL as a result of the WGL Transaction, failure by AltaGas to repay the bridge financing facility, potential unavailability of the bridge
financing facility and/or alternate sources of funding that would be used to replace the bridge financing facility, including asset sales on desirable terms, lack of control by AltaGas of WGL and its subsidiaries prior to the closing of the WGL Transaction, impact of
acquisition-related expenses, accuracy and completeness of WGL’s publicly disclosed information, increased indebtedness of AltaGas after the closing of the WGL Transaction, including the possibility of downgrade of AltaGas’ credit ratings, historical and pro forma
combined financial information may not be representative of future performance, potential undisclosed liabilities of WGL, ability to retain key personnel of WGL following the WGL Transaction, risks associated with the loss of key personnel, risks relating to
unanticipated costs of integration in connection with the WGL Transaction, including operating costs, customer loss or business disruption, changes in customer energy usage, and other factors set out in AltaGas’ continuous disclosure documents. Many factors
could cause AltaGas’ or any of its business segments’ actual results, performance or achievements to vary from those described in this presentation including, without limitation, those listed above as well as the assumptions upon which they are based proving
incorrect. These factors should not be construed as exhaustive. Should one or more of these risks or uncertainties materialize, or should assumptions underlying forward-looking statements prove incorrect, actual results may vary materially from those described in
this presentation as intended, planned, anticipated, believed, sought, proposed, forecasted, estimated or expected, and such forward-looking statements included in this presentation herein should not be unduly relied upon. These statements speak only as of the
date of this presentation. AltaGas does not intend, and does not assume any obligation, to update these forward-looking statements except as required by law. The forward-looking statements contained in this presentation are expressly qualified by this cautionary
statement.
Financial outlook information contained in this presentation about prospective financial performance, financial position or cash flows is based on assumptions about future events, including, without limitation, economic conditions and proposed courses of action,
based on management’s assessment of the relevant information currently available. Readers are advised to refer to AltaGas’ news release regarding the acquisition of WGL for a further description of the assumptions underpinning the financial outlook information
contained in this presentation relating to the combination of AltaGas and WGL. Readers are cautioned that such financial outlook information contained in this presentation should not be used for purposes other than for which it is disclosed herein.
In this presentation we use certain supplementary measures, including Normalized EBITDA, Normalized Funds from Operations (“FFO”), AFFO and net debt that do not have any standardized meaning as prescribed under U.S. generally accepted accounting
principles (“GAAP”) and, therefore, are considered non-GAAP measures. AltaGas’ method of calculating these non-GAAP measures may differ from the methods used by other issuers. Readers are advised to refer to AltaGas’ Management’s Discussion and
Analysis (“MD&A”) as at and for the nine months ended September 30, 2017 for a description of the manner in which AltaGas calculates such non-GAAP measures and for a reconciliation to the nearest GAAP financial measure. In this presentation we also use the
Non-GAAP measure “Earnings Before Interest and Taxes (EBIT)”, which is disclosed in respect of WGL’s business segments only. As described in WGL's annual report on Form 10-K filed with the SEC, WGL considers EBIT to be a performance measure that
includes operating income, other income (expense), earnings from unconsolidated affiliates and is reduced by amounts attributable to non-controlling interests. EBIT is used in assessing the results of each segment's operations.
Readers are also cautioned that these non-GAAP measures should not be considered as alternatives to other measures of financial performance calculated in accordance with GAAP. Additional information relating to AltaGas can be found on its website at
www.altagas.ca. The continuous disclosure materials of AltaGas, including its annual and interim MD&A and Consolidated Financial Statements, Annual Information Form, Information Circular, material change reports and press releases, are also available through
AltaGas’ website or directly through the SEDAR system at www.sedar.com and provide more information on risks and uncertainties associated with forward-looking statements.
Unless otherwise stated, dollar amounts in this presentation are in Canadian dollars.
This presentation does not constitute an offer or solicitation in any jurisdiction or to any person or entity. No representations or warranties, express or implied, have been made as to the accuracy or completeness of the information in this presentation and this
presentation should not be relied on in connection with, or act as any inducement in relation to, an investment decision.
2
3
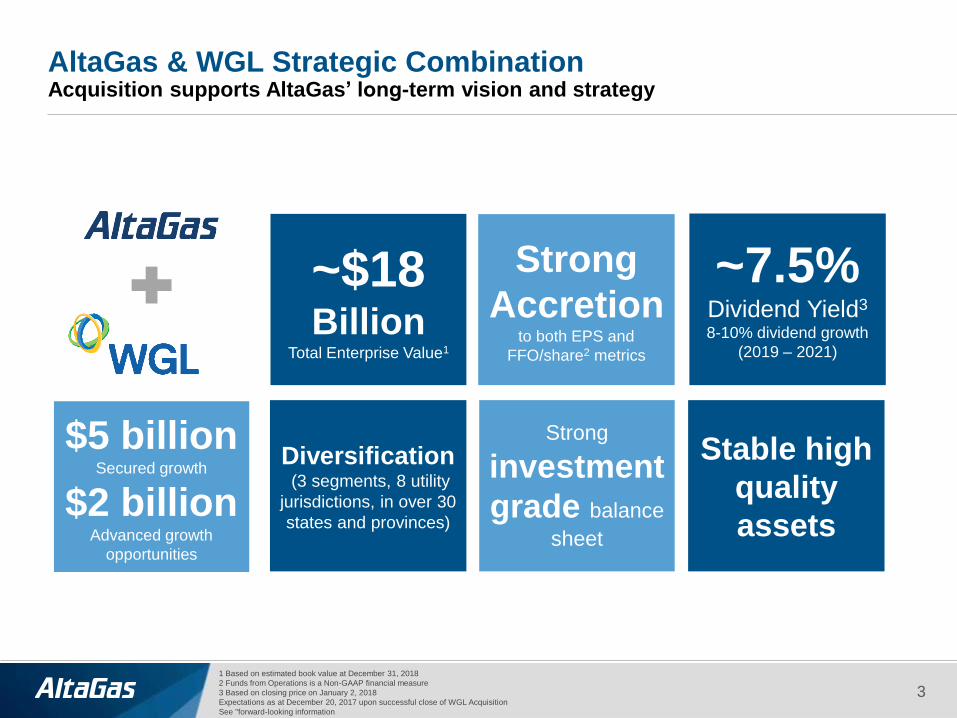
AltaGas & WGL Strategic Combination Acquisition supports AltaGas’ long-term vision and strategy
1 Based on estimated book value at December 31, 2018
2 Funds from Operations is a Non-GAAP financial measure
3 Based on closing price on January 2, 2018
Expectations as at December 20, 2017 upon successful close of WGL Acquisition
See "forward-looking information
Strong
Accretion to both EPS and
FFO/share2 metrics
Diversification (3 segments, 8 utility
jurisdictions, in over 30
states and provinces)
Stable high
quality
assets
~$18 Billion
Total Enterprise Value1
~7.5% Dividend Yield3
8-10% dividend growth
(2019 – 2021)
$5 billion Secured growth
$2 billion Advanced growth
opportunities
Strong
investment
grade balance
sheet
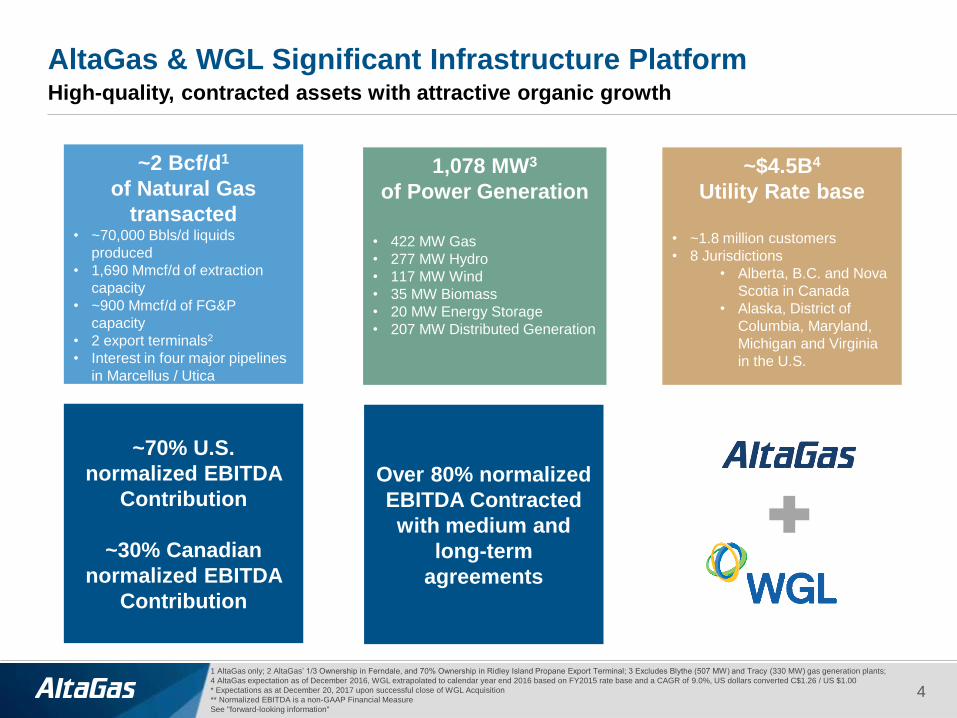
AltaGas & WGL Significant Infrastructure Platform High-quality, contracted assets with attractive organic growth
1 AltaGas only; 2 AltaGas’ 1/3 Ownership in Ferndale, and 70% Ownership in Ridley Island Propane Export Terminal; 3 Excludes Blythe (507 MW) and Tracy (330 MW) gas generation plants;
4 AltaGas expectation as of December 2016, WGL extrapolated to calendar year end 2016 based on FY2015 rate base and a CAGR of 9.0%, US dollars converted C$1.26 / US $1.00
* Expectations as at December 20, 2017 upon successful close of WGL Acquisition
** Normalized EBITDA is a non-GAAP Financial Measure
See "forward-looking information"
~$4.5B4
Utility Rate base
• ~1.8 million customers
• 8 Jurisdictions
• Alberta, B.C. and Nova
Scotia in Canada
• Alaska, District of
Columbia, Maryland,
Michigan and Virginia
in the U.S.
1,078 MW3
of Power Generation
• 422 MW Gas
• 277 MW Hydro
• 117 MW Wind
• 35 MW Biomass
• 20 MW Energy Storage
• 207 MW Distributed Generation
~2 Bcf/d1
of Natural Gas
transacted • ~70,000 Bbls/d liquids
produced
• 1,690 Mmcf/d of extraction
capacity
• ~900 Mmcf/d of FG&P
capacity
• 2 export terminals2
• Interest in four major pipelines
in Marcellus / Utica
4
~70% U.S.
normalized EBITDA
Contribution
~30% Canadian
normalized EBITDA
Contribution
Over 80% normalized
EBITDA Contracted
with medium and
long-term
agreements

Leading North American Diversified Energy Company Premier footprint in Canada and the U.S.
1 Expectations as at December 2017, FX Rate of C$1.26/US$1, AltaGas standalone,
2 Expectations as at December 20, 2017, upon successful close of WGL Acquisition. Excludes Blythe (507 MW) and Tracy (330 MW) gas generation plants. FX Rate of C$1.26/US$1
Normalized EBITDA is a non-GAAP measure.
See "forward-looking information"
All three business segments
will have a premier footprint
in both Canada and the U.S.
5
Segment normalized EBITDA1 (2018F)
Gas
~30%
Utilities
~35%
Power
~35%
Balanced Long-Term
Target Business Mix
Power
Utility
Midstream
Regulated Cash Flow
PPA /
Contract
Cash
Flow
Fee /
Take-or-
Pay Cash
Flow
Segment normalized EBITDA2 (2019F)
Utilities
~50%
Power
~20%
Gas
~30%

WGL Overview
Utility Power Retail Midstream
2017A EBIT
(%)1
Natural gas regulated utility
serving 1.2 million customers with
a rate base of ~C$2.5 billion2,3
Serves three, high growth and
economically strong jurisdictions:
Washington D.C., Maryland and
Virginia
WGL is a leading diversified U.S. energy company
Seen as a preferred source of clean and efficient energy
solutions that produce value for customers, investors and
communities
Disciplined capital allocation strategy focused on
infrastructure investments with numerous near-term
opportunities
Strong balance sheet and credit ratings (Moody’s/S&P/ Fitch)
WGL Holdings: (A3/A/A-)
Washington Gas: (A1/A/A)
Stable earnings underpinned by
contracts with a majority from
investment grade
counterparties
Ownership stakes in four major
midstream projects
Expected to be the fastest
growing segment through 2020
Provides retail gas and electricity
to ~230,000 customers in
Washington D.C., Maryland,
Virginia, Delaware and
Pennsylvania
Volatility mitigated through five
year secured supply
arrangement with Shell4
Integrated service offering
supporting other business lines
Owns distributed generation
assets including solar, and
natural gas fuel cells
The commercial segment is
comprised of two businesses:
− Distributed generation
− Energy efficiency
1 As of September 30, 2017, excludes other activities and eliminations; 2 WGL figures converted C$1.26 / US $1.00
3 WGL rate base extrapolated to calendar year end 2016 based on FY2015 rate base and a CAGR of 9.0%; 4 As per WGL FY2017A Form 10-K
5 WGL Standalone based on May 2016 Investor Presentation
See "forward-looking information" 6
Utility 67%
Midstream 10%
Commercial 10%
Retail 13%
Utility 60%
Midstream 15%
Commercial 15%
Retail 10%
EBIT Contribution By Segment5
2017A 2020E
-
5
10
15
20
25
30
35
40
45
50
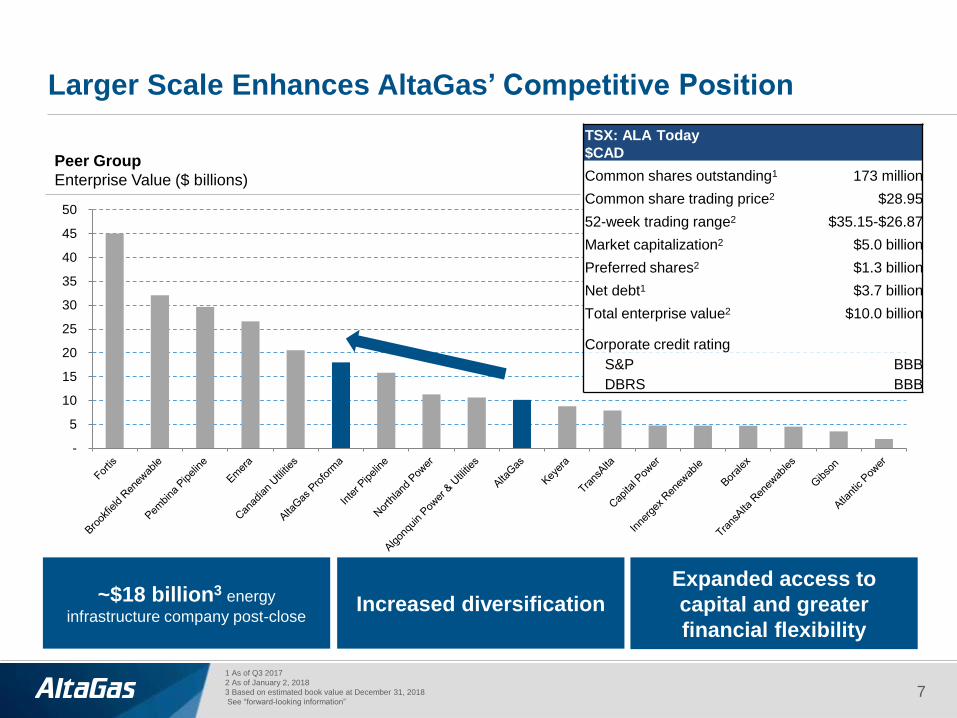
Larger Scale Enhances AltaGas’ Competitive Position
7
1 As of Q3 2017
2 As of January 2, 2018
3 Based on estimated book value at December 31, 2018
See “forward-looking information”
Peer Group
Enterprise Value ($ billions)
Increased diversification ~$18 billion3 energy
infrastructure company post-close
Expanded access to
capital and greater
financial flexibility
TSX: ALA Today
$CAD
Common shares outstanding1 173 million
Common share trading price2 $28.95
52-week trading range2 $35.15-$26.87
Market capitalization2 $5.0 billion
Preferred shares2 $1.3 billion
Net debt1 $3.7 billion
Total enterprise value2 $10.0 billion
Corporate credit rating
S&P BBB
DBRS BBB
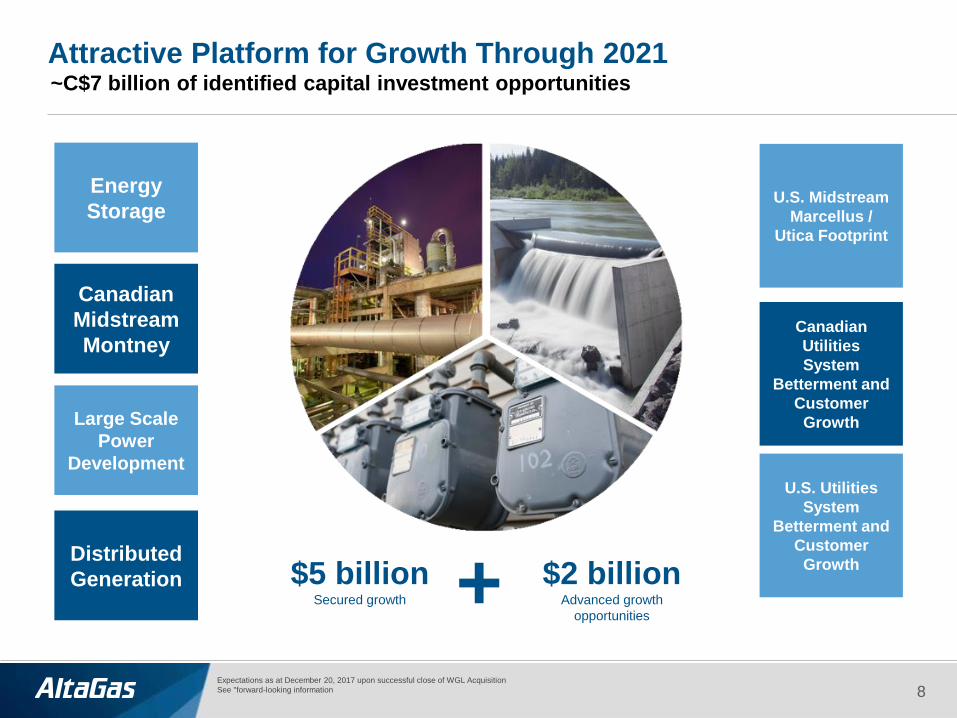
Energy
Storage
Attractive Platform for Growth Through 2021
Distributed
Generation
U.S. Midstream
Marcellus /
Utica Footprint
Expectations as at December 20, 2017 upon successful close of WGL Acquisition
See "forward-looking information
Canadian
Utilities
System
Betterment and
Customer
Growth
Canadian
Midstream
Montney
Large Scale
Power
Development
8
U.S. Utilities
System
Betterment and
Customer
Growth
+ $2 billion Advanced growth
opportunities
$5 billion Secured growth
~C$7 billion of identified capital investment opportunities
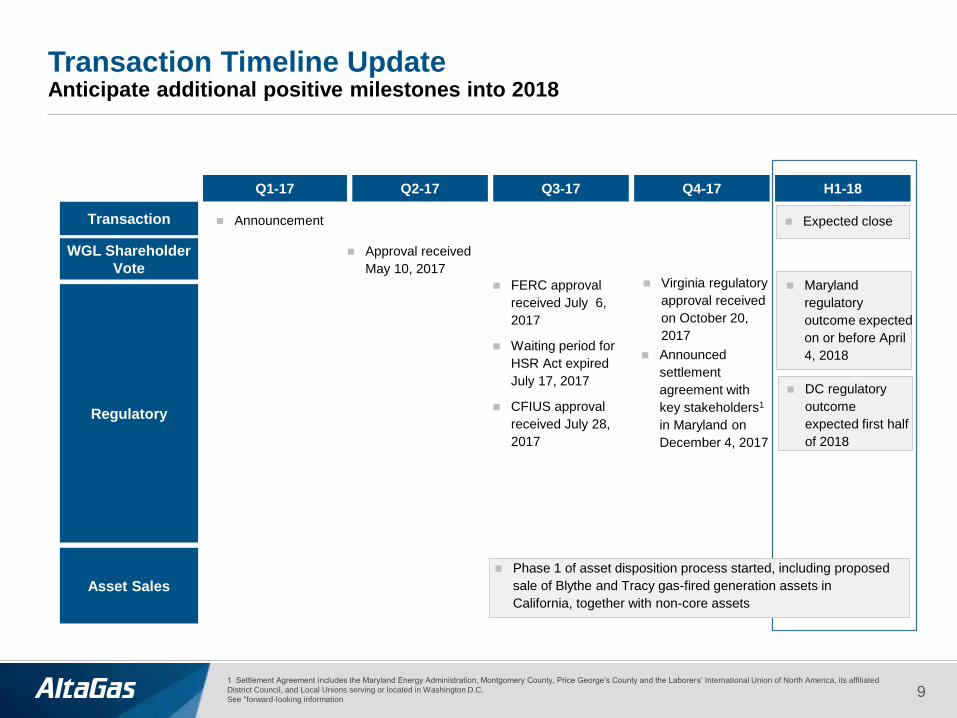
Virginia regulatory
approval received
on October 20,
2017
Transaction Timeline Update Anticipate additional positive milestones into 2018
9
Q1-17 Q2-17 Q3-17 Q4-17 H1-18
Announcement Expected close
FERC approval
received July 6,
2017
Waiting period for
HSR Act expired
July 17, 2017
CFIUS approval
received July 28,
2017
WGL Shareholder
Vote
Transaction
Regulatory
Approval received
May 10, 2017
Asset Sales
Phase 1 of asset disposition process started, including proposed
sale of Blythe and Tracy gas-fired generation assets in
California, together with non-core assets
1 Settlement Agreement includes the Maryland Energy Administration, Montgomery County, Price George’s County and the Laborers’ International Union of North America, its affiliated
District Council, and Local Unions serving or located in Washington D.C.
See "forward-looking information
Maryland
regulatory
outcome expected
on or before April
4, 2018
DC regulatory
outcome
expected first half
of 2018
Announced
settlement
agreement with
key stakeholders1
in Maryland on
December 4, 2017

Key Takeaways
Near-term catalysts
Expectations as at December 20, 2017
See "forward-looking information"
10
Q1/Q2 2018
Regulatory outcome for MD expected on or before April 4, 2018
Regulatory outcome for DC expected in 1H 2018
Debt/Hybrid Financing
Various asset sale initiatives
Potential new Gas and Power development initiatives
Further asset sales for a total of up to $2B to coincide with WGL regulatory approvals
Commitment to maintaining balanced long-term mix across 3 business lines
2018 - 2020
New battery storage and solar projects
New Midstream projects including Townsend 2B, and North Pine (train 2)
Completion of Ridley Island Propane Export Terminal (Q1 2019)
Medium-term catalysts (12 – 24 Months)
1 AltaGas has 1/3 interest in Ferndale facility. 2 NEB – Energy Market Assessment. 3 U.S. Energy Information Administration. 4 Source: Dominion Energy
Expectations as at December 20, 2017 upon successful close of WGL Acquisition
See "forward-looking information"
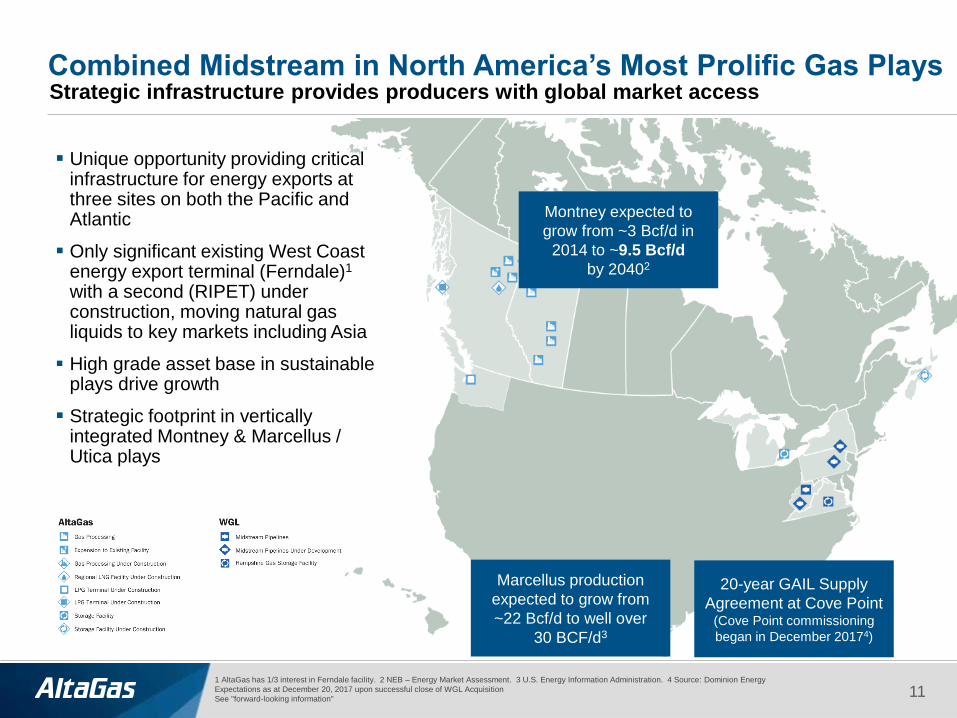
Combined Midstream in North America’s Most Prolific Gas Plays
Unique opportunity providing critical infrastructure for energy exports at three sites on both the Pacific and Atlantic
Only significant existing West Coast energy export terminal (Ferndale)1 with a second (RIPET) under construction, moving natural gas liquids to key markets including Asia
High grade asset base in sustainable plays drive growth
Strategic footprint in vertically integrated Montney & Marcellus / Utica plays
Montney expected to
grow from ~3 Bcf/d in
2014 to ~9.5 Bcf/d
by 20402
20-year GAIL Supply
Agreement at Cove Point (Cove Point commissioning
began in December 20174)
11
Marcellus production
expected to grow from
~22 Bcf/d to well over
30 BCF/d3
Strategic infrastructure provides producers with global market access
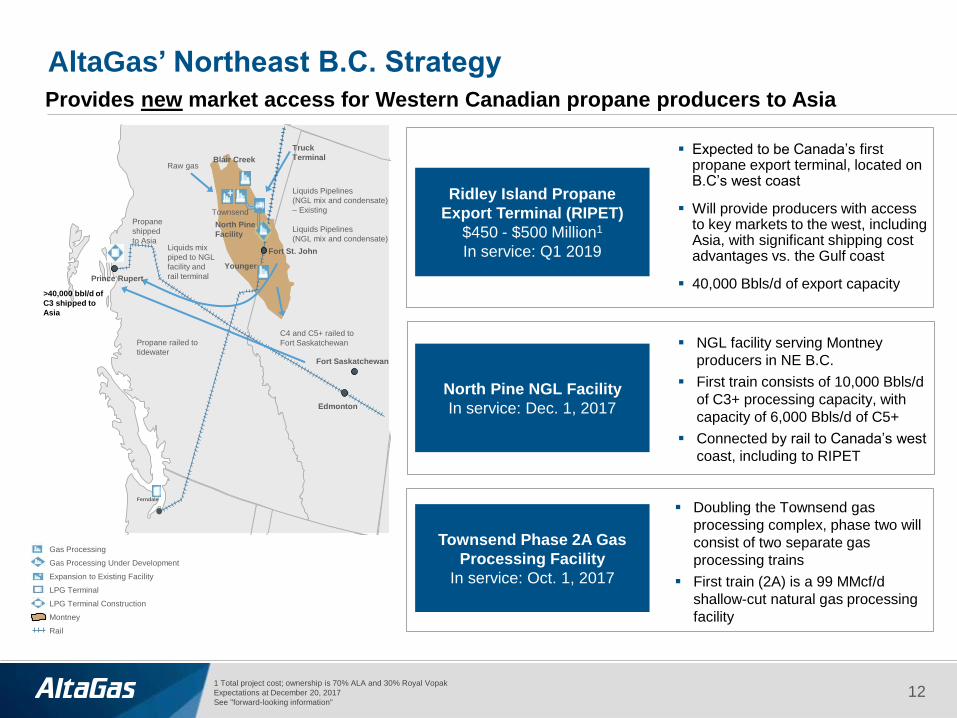
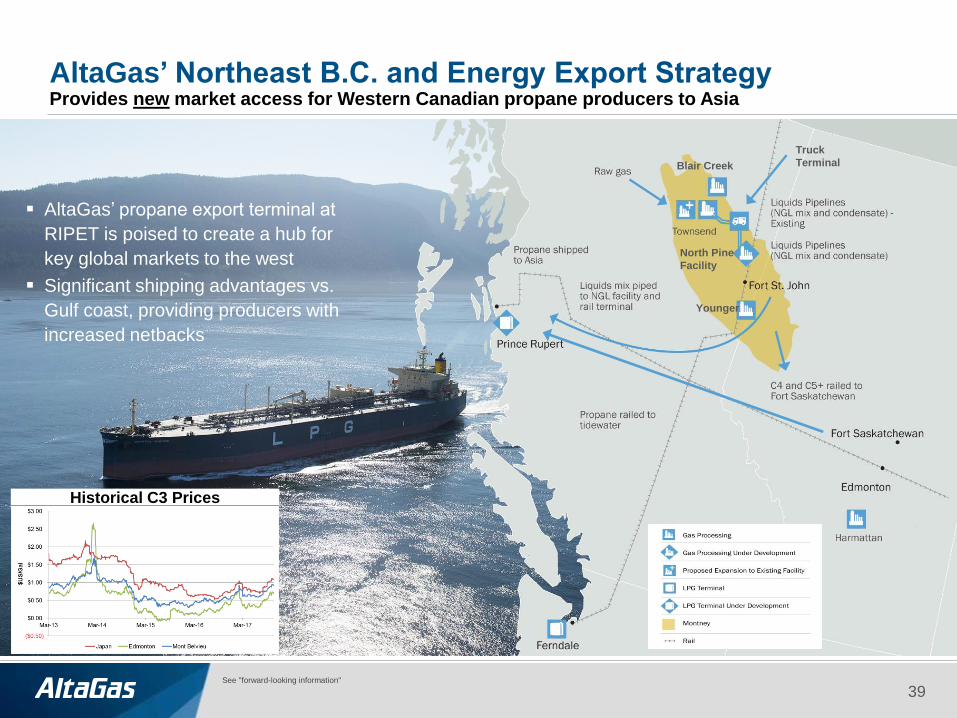
AltaGas’ Northeast B.C. Strategy
Ridley Island Propane
Export Terminal (RIPET)
$450 - $500 Million1
In service: Q1 2019
North Pine NGL Facility
In service: Dec. 1, 2017
Townsend Phase 2A Gas
Processing Facility
In service: Oct. 1, 2017
Expected to be Canada’s first propane export terminal, located on B.C’s west coast
Will provide producers with access to key markets to the west, including Asia, with significant shipping cost advantages vs. the Gulf coast
40,000 Bbls/d of export capacity
NGL facility serving Montney
producers in NE B.C.
First train consists of 10,000 Bbls/d
of C3+ processing capacity, with
capacity of 6,000 Bbls/d of C5+
Connected by rail to Canada’s west
coast, including to RIPET
Doubling the Townsend gas
processing complex, phase two will
consist of two separate gas
processing trains
First train (2A) is a 99 MMcf/d
shallow-cut natural gas processing
facility
1 Total project cost; ownership is 70% ALA and 30% Royal Vopak
Expectations at December 20, 2017
See "forward-looking information"
Gas Processing
Gas Processing Under Development
Expansion to Existing Facility
LPG Terminal
LPG Terminal Construction
Montney
Rail
>40,000 bbl/d of
C3 shipped to
Asia
Blair Creek
North Pine
Facility
Younger
Truck
Terminal Raw gas
Liquids Pipelines
(NGL mix and condensate)
– Existing
Liquids Pipelines
(NGL mix and condensate)
Fort St. John
Prince Rupert
Liquids mix
piped to NGL
facility and
rail terminal
Propane railed to
tidewater
Edmonton
Fort Saskatchewan
C4 and C5+ railed to
Fort Saskatchewan
Ferndale
Propane
shipped
to Asia
Townsend
12
Provides new market access for Western Canadian propane producers to Asia
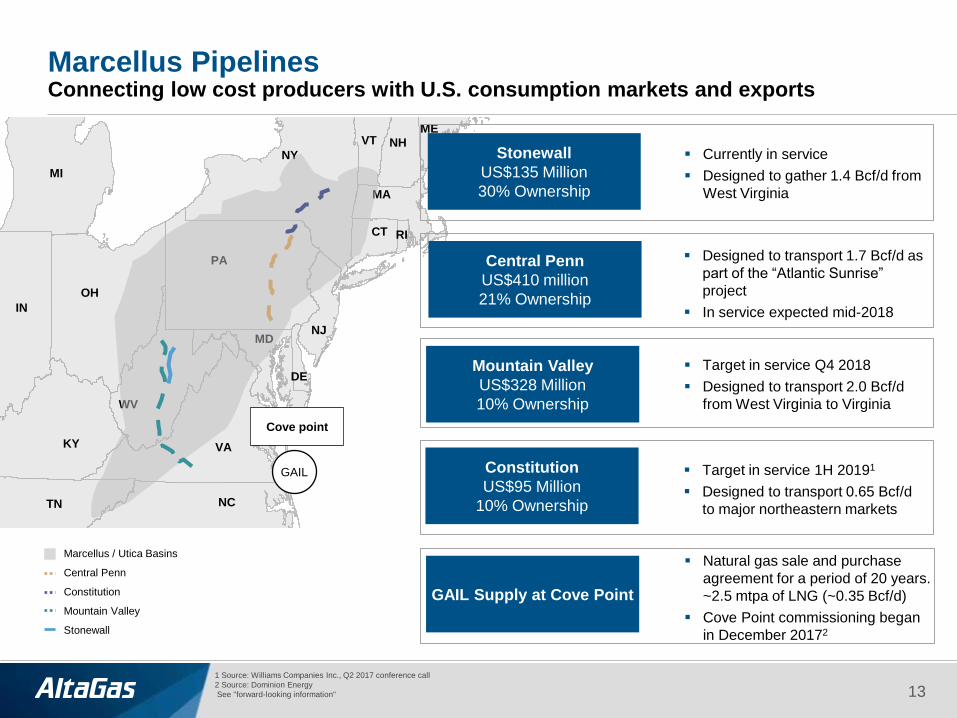
Marcellus Pipelines Connecting low cost producers with U.S. consumption markets and exports
Mountain Valley
US$328 Million
10% Ownership
Currently in service
Designed to gather 1.4 Bcf/d from
West Virginia
Target in service Q4 2018
Designed to transport 2.0 Bcf/d
from West Virginia to Virginia
1 Source: Williams Companies Inc., Q2 2017 conference call
2 Source: Dominion Energy
See "forward-looking information" 13
Constitution
US$95 Million
10% Ownership
Designed to transport 1.7 Bcf/d as
part of the “Atlantic Sunrise”
project
In service expected mid-2018
Target in service 1H 20191
Designed to transport 0.65 Bcf/d
to major northeastern markets
Marcellus / Utica Basins
Central Penn
Constitution
Mountain Valley
Stonewall
NH
CT
ME
MA
RI
MD
PA
VT
NY
NJ
OH
IN
DE
KY
MI
NC TN
VA
WV
Cove point
GAIL
Stonewall
US$135 Million
30% Ownership
Central Penn
US$410 million
21% Ownership
GAIL Supply at Cove Point
Natural gas sale and purchase
agreement for a period of 20 years.
~2.5 mtpa of LNG (~0.35 Bcf/d)
Cove Point commissioning began
in December 20172
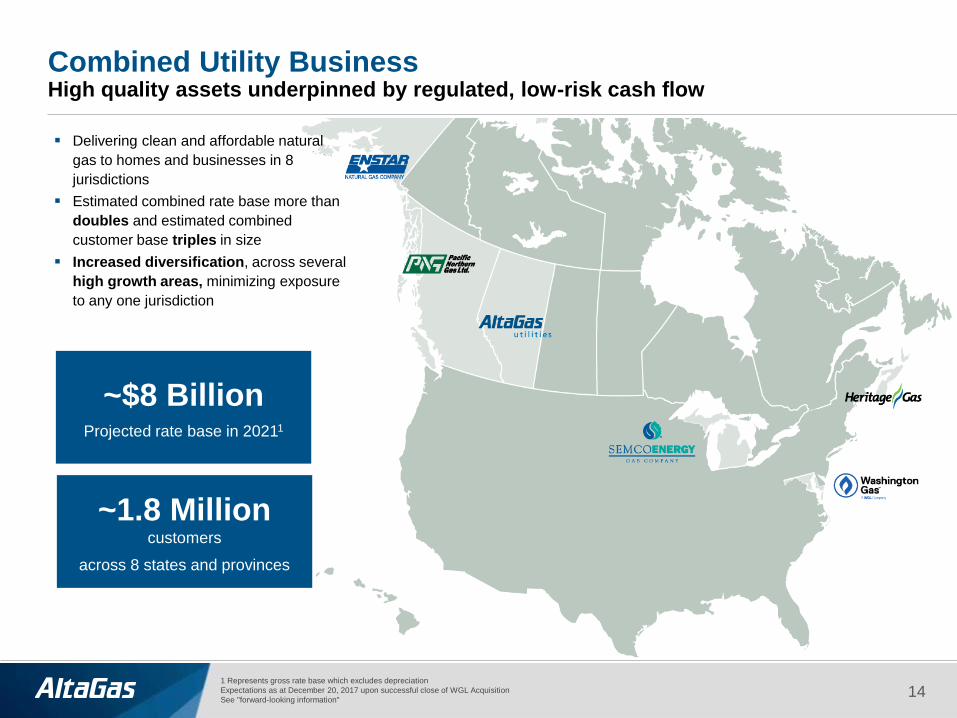
Combined Utility Business High quality assets underpinned by regulated, low-risk cash flow
1 Represents gross rate base which excludes depreciation
Expectations as at December 20, 2017 upon successful close of WGL Acquisition
See "forward-looking information"
Delivering clean and affordable natural
gas to homes and businesses in 8
jurisdictions
Estimated combined rate base more than
doubles and estimated combined
customer base triples in size
Increased diversification, across several
high growth areas, minimizing exposure
to any one jurisdiction
~$8 Billion Projected rate base in 20211
14
~1.8 Million customers
across 8 states and provinces

~$4.5bn
$2.8bn
$0.9bn ~$8.0bn
FY2016 WGL utilitycapex to
2021
AltaGas utilitycapex to
2021
Grosscombined rate
base 2021
AltaGas WGL
New business Replacements
Other utility
Customer Growth and Accelerated Replacements Drive Growth
15
High near-term growth
Expected near-term growth driven by
customer additions, accelerated
replacement programs and general
system betterment capital
expenditures
Increased diversification into high
growth areas such as Washington
(6th largest regional economy in the
U.S., among the highest median
household incomes in the U.S.)
1 AltaGas expectation as of December 2016
2 WGL extrapolated to calendar year end 2016 based on FY2015 rate base and a CAGR of 9.0%
3 WGL figures converted to Canadian C$1.26 / US $1.00
4 WGL Management estimates
5 Gross rate base excludes depreciation
See "forward-looking information"
3,4
1,2,3
5
Projected Rate Base Growth
(C$ billions)
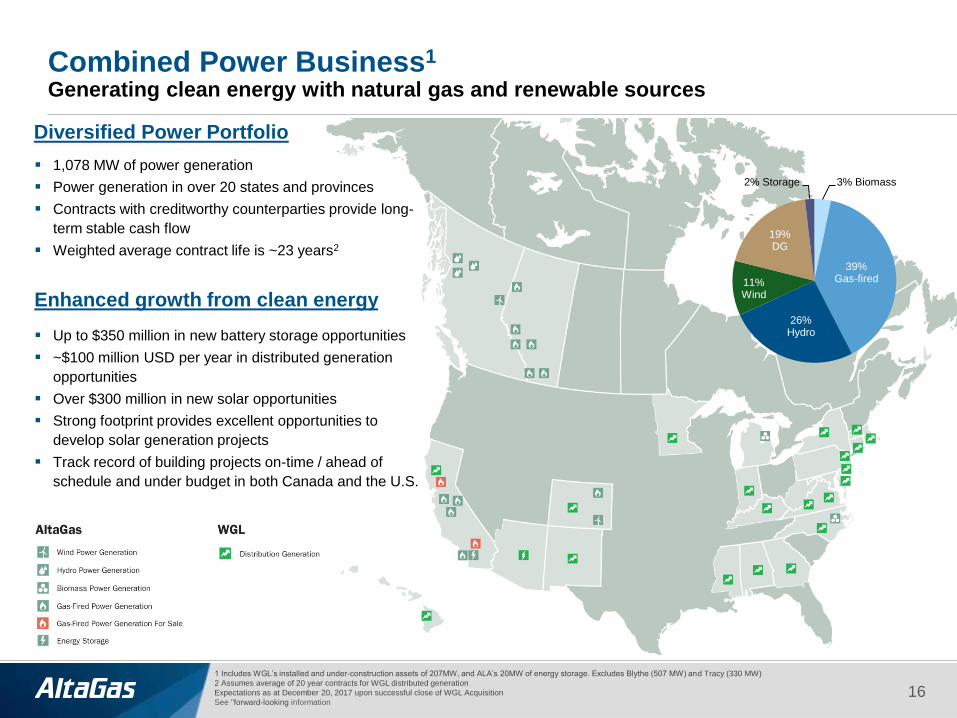
Combined Power Business1 Generating clean energy with natural gas and renewable sources
16
1,078 MW of power generation
Power generation in over 20 states and provinces
Contracts with creditworthy counterparties provide long-
term stable cash flow
Weighted average contract life is ~23 years2
Enhanced growth from clean energy
Up to $350 million in new battery storage opportunities
~$100 million USD per year in distributed generation
opportunities
Over $300 million in new solar opportunities
Strong footprint provides excellent opportunities to
develop solar generation projects
Track record of building projects on-time / ahead of
schedule and under budget in both Canada and the U.S.
1 Includes WGL’s installed and under-construction assets of 207MW, and ALA’s 20MW of energy storage. Excludes Blythe (507 MW) and Tracy (330 MW)
2 Assumes average of 20 year contracts for WGL distributed generation
Expectations as at December 20, 2017 upon successful close of WGL Acquisition
See "forward-looking information
Diversified Power Portfolio
3% Biomass
39% Gas-fired
26% Hydro
11% Wind
19% DG
2% Storage
Governing Financial Principles Delivering growth and security
1 FFO is a non-GAAP financial measure
2 ALA standalone
See "forward-looking information"
Dividend Sustainability
Strong Counterparty
Creditworthiness Overall
Managed Commodity Exposure
Manageable Targeted
Financing Requirements
Strong Stable Investment Grade
Balance Sheet
Target Expected Returns
50 - 60% FFO1 payout ratio
Expect over 90% of 2019 dividends to be underpinned by
Regulated Utilities and Northwest Hydro Facilities
Enhancing returns on existing assets
Specified targets for growth projects
BBB credit rating
Flexible financing plan to support growth using both
growing internally generated cash flow and external
financing (as required)
~85% or greater of contracted EBITDA
> 85% of exposure with investment grade counterparties2
Principles Targets
1
2
3
4
5
6
17
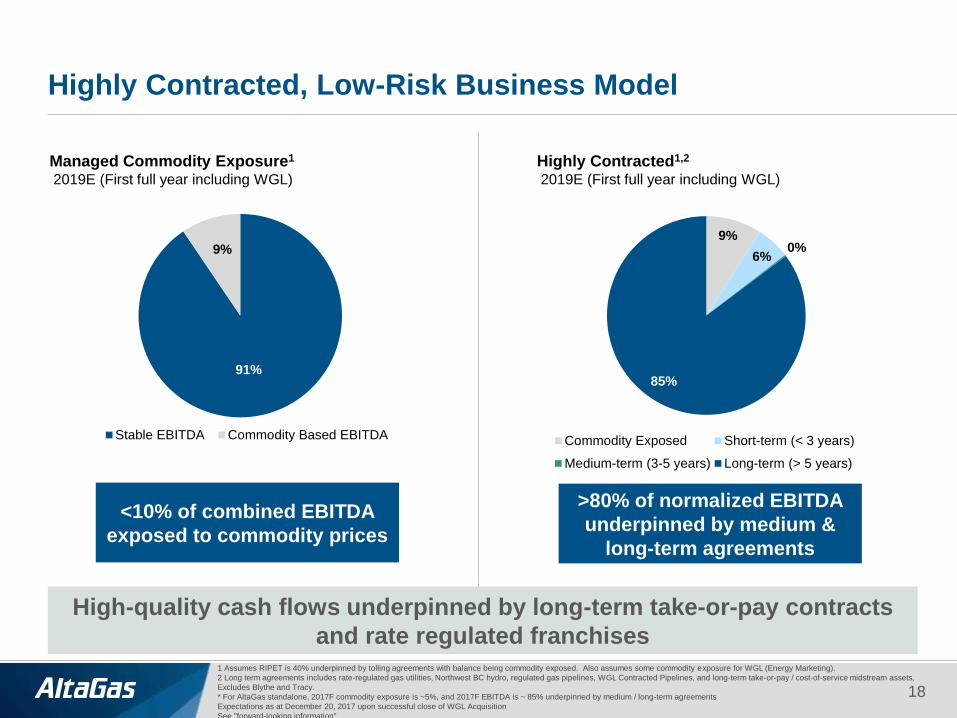
91%
9%
Stable EBITDA Commodity Based EBITDA
Highly Contracted, Low-Risk Business Model
18
1 Assumes RIPET is 40% underpinned by tolling agreements with balance being commodity exposed. Also assumes some commodity exposure for WGL (Energy Marketing).
2 Long term agreements includes rate-regulated gas utilities, Northwest BC hydro, regulated gas pipelines, WGL Contracted Pipelines, and long-term take-or-pay / cost-of-service midstream assets,
Excludes Blythe and Tracy.
* For AltaGas standalone, 2017F commodity exposure is ~5%, and 2017F EBITDA is ~ 85% underpinned by medium / long-term agreements
Expectations as at December 20, 2017 upon successful close of WGL Acquisition
See "forward-looking information"
Managed Commodity Exposure1
2019E (First full year including WGL)
Highly Contracted1,2
2019E (First full year including WGL)
High-quality cash flows underpinned by long-term take-or-pay contracts
and rate regulated franchises
<10% of combined EBITDA
exposed to commodity prices
>80% of normalized EBITDA
underpinned by medium &
long-term agreements
9%
6% 0%
85%
Commodity Exposed Short-term (< 3 years)
Medium-term (3-5 years) Long-term (> 5 years)
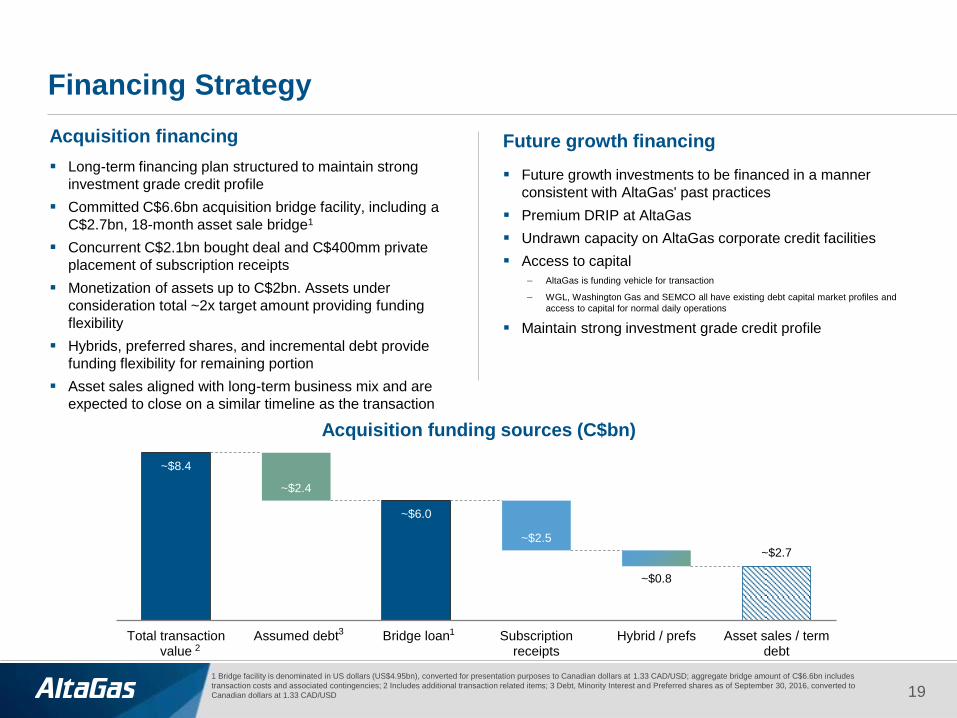
~$8.4
~$6.0
~$2.7
~$2.4
~$2.5
~$0.8
Total transactionvalue
Assumed debt Bridge loan Subscriptionreceipts
Hybrid / prefs Asset sales / termdebt
Acquisition funding sources (C$bn)
Financing Strategy
19
Acquisition financing
Long-term financing plan structured to maintain strong
investment grade credit profile
Committed C$6.6bn acquisition bridge facility, including a
C$2.7bn, 18-month asset sale bridge1
Concurrent C$2.1bn bought deal and C$400mm private
placement of subscription receipts
Monetization of assets up to C$2bn. Assets under
consideration total ~2x target amount providing funding
flexibility
Hybrids, preferred shares, and incremental debt provide
funding flexibility for remaining portion
Asset sales aligned with long-term business mix and are
expected to close on a similar timeline as the transaction
Future growth financing
Future growth investments to be financed in a manner
consistent with AltaGas' past practices
Premium DRIP at AltaGas
Undrawn capacity on AltaGas corporate credit facilities
Access to capital
– AltaGas is funding vehicle for transaction
– WGL, Washington Gas and SEMCO all have existing debt capital market profiles and
access to capital for normal daily operations
Maintain strong investment grade credit profile
3
1 Bridge facility is denominated in US dollars (US$4.95bn), converted for presentation purposes to Canadian dollars at 1.33 CAD/USD; aggregate bridge amount of C$6.6bn includes
transaction costs and associated contingencies; 2 Includes additional transaction related items; 3 Debt, Minority Interest and Preferred shares as of September 30, 2016, converted to
Canadian dollars at 1.33 CAD/USD
2
1

Strong Investment Grade Credit Rating Prudent deal financing enhances balance sheet strength over the long-term
20
2016 2019
Net Debt/EBITDA
4.5x
Combined larger platform and
financing plan reinforce a path to
improved credit metrics and a
strong investment grade balance
sheet
Focus on stable cash flows
2016 2019
FFO1/Debt
1 FFO is a non-GAAP financial measure
See "forward-looking information"
Credit Metric Target
FFO / Debt ≥ 15%
Net Debt / EBITDA ≤ 4.5x
~15% Target
Target
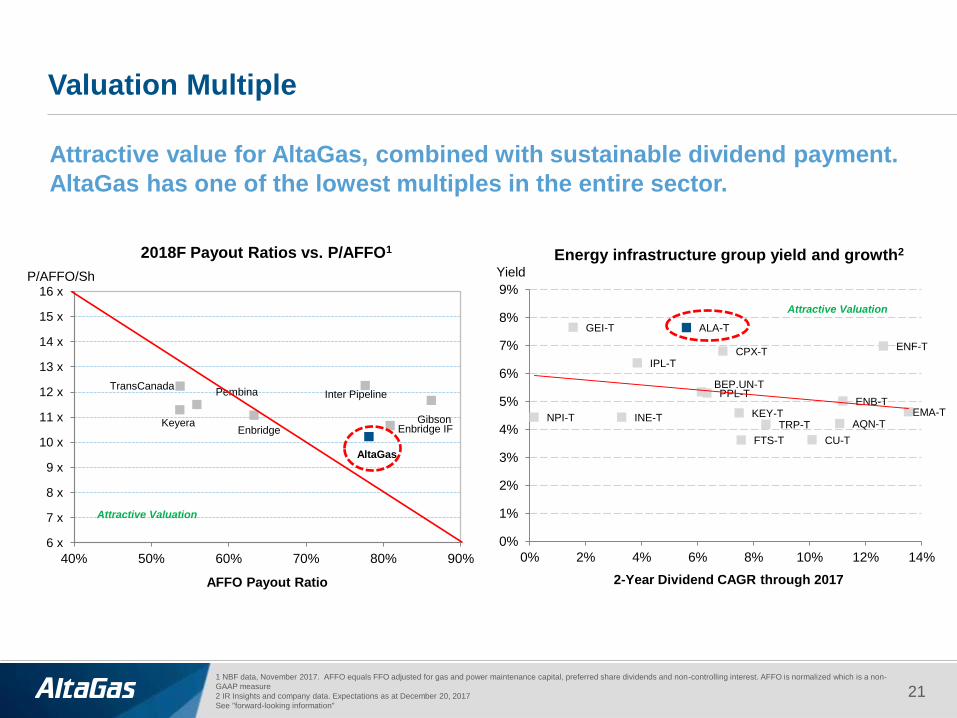
AltaGas
Enbridge Enbridge IF Gibson
Inter Pipeline
Keyera
Pembina TransCanada
6 x
7 x
8 x
9 x
10 x
11 x
12 x
13 x
14 x
15 x
16 x
40% 50% 60% 70% 80% 90%
P/AFFO/Sh
AFFO Payout Ratio
2018F Payout Ratios vs. P/AFFO1
ENB-T
ENF-T
GEI-T
IPL-T
KEY-T
PPL-T
TRP-T
ALA-T
CPX-T
BEP.UN-T
NPI-T INE-T
CU-T FTS-T
EMA-T AQN-T
0%
1%
2%
3%
4%
5%
6%
7%
8%
9%
0% 2% 4% 6% 8% 10% 12% 14%
Valuation Multiple
Attractive value for AltaGas, combined with sustainable dividend payment.
AltaGas has one of the lowest multiples in the entire sector.
Energy infrastructure group yield and growth2
2-Year Dividend CAGR through 2017
1 NBF data, November 2017. AFFO equals FFO adjusted for gas and power maintenance capital, preferred share dividends and non-controlling interest. AFFO is normalized which is a non-
GAAP measure
2 IR Insights and company data. Expectations as at December 20, 2017
See "forward-looking information"
Yield
Attractive Valuation
21
Attractive Valuation

Appendix
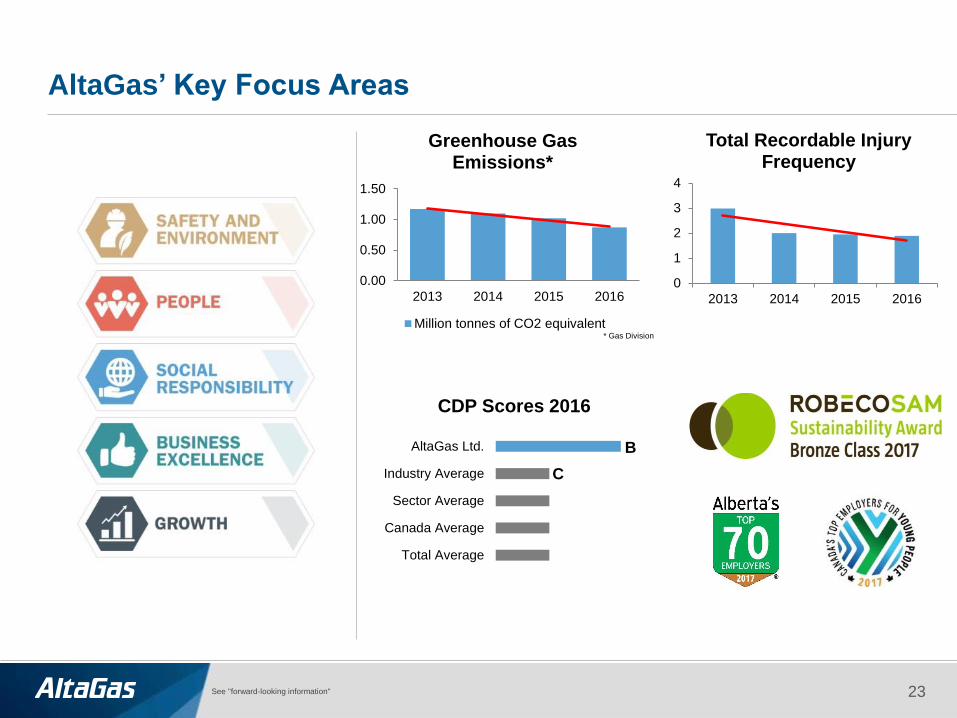
AltaGas’ Key Focus Areas
0.00
0.50
1.00
1.50
2013 2014 2015 2016
Greenhouse Gas Emissions*
Million tonnes of CO2 equivalent* Gas Division
0
1
2
3
4
2013 2014 2015 2016
Total Recordable Injury Frequency
Total Average
Canada Average
Sector Average
Industry Average
AltaGas Ltd.
CDP Scores 2016
B
C
See "forward-looking information" 23
0
200
400
600
800
2010 2011 2012 2013 2014 2015 2016 2017F
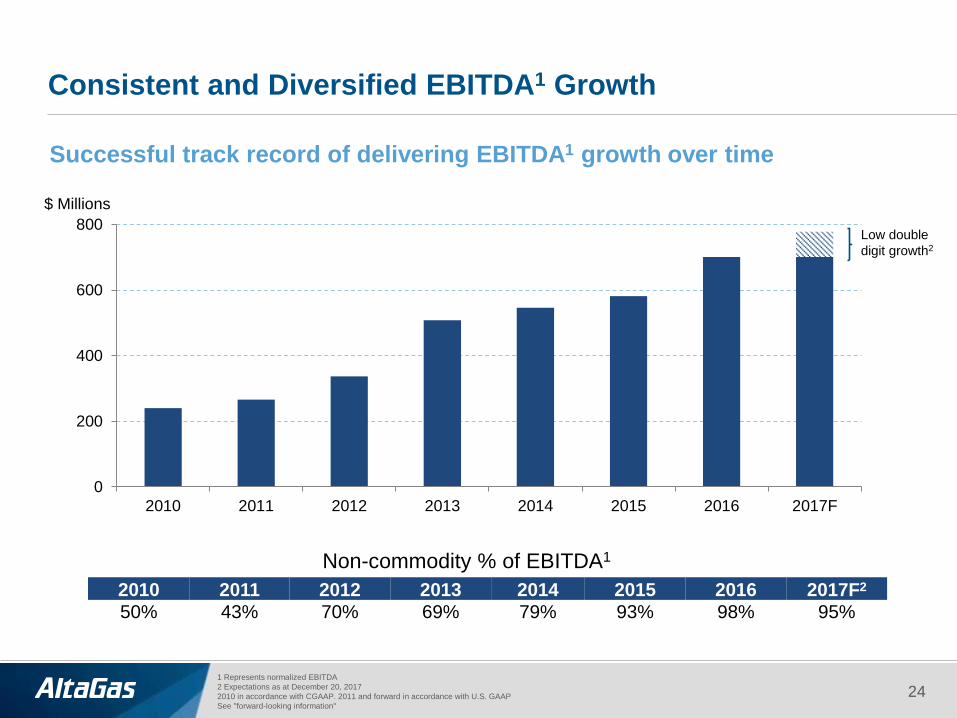
$ Millions
Consistent and Diversified EBITDA1 Growth
Successful track record of delivering EBITDA1 growth over time
2010 2011 2012 2013 2014 2015 2016 2017F2
50% 43% 70% 69% 79% 93% 98% 95%
Non-commodity % of EBITDA1
1 Represents normalized EBITDA
2 Expectations as at December 20, 2017
2010 in accordance with CGAAP. 2011 and forward in accordance with U.S. GAAP
See "forward-looking information"
Low double
digit growth2
24

Contracted EBITDA1
1 Represents normalized EBITDA
2 Expectations as at December 20, 2017, ALA standalone
2010 in accordance with CGAAP. 2017F in accordance with U.S. GAAP
See "forward-looking information"
4%
34%
13%
29%
20%
Substantial increase in long-term contracted and
Regulated Gas Distribution EBITDA
2010
Cost-of-service
Provides for recovery of operating costs and a capital
charge, generally are not subject to commodity risk
Average contract length of ~15 years
47%
14%
27%
Fixed / Take-or-pay
No volume or commodity price exposure
Average contract length of ~18 years
Frac Spread
Volume and price exposure
Approximately 77% of exposure is hedged in 2018
Breakdown of Midstream EBITDA1
Fee-for-service
Provides for a fee per unit of production sold or
service provided, generally are not subject to
commodity risk
12%
Contracted PPA
Midstream fee for service/TOP/cost of service
Utilities/Regulated gas distribution
Alberta power
Frac Spread
25
~35%
~22%
~8%
~35%
2018F2
$2.2
$4.4
~$6.6
26
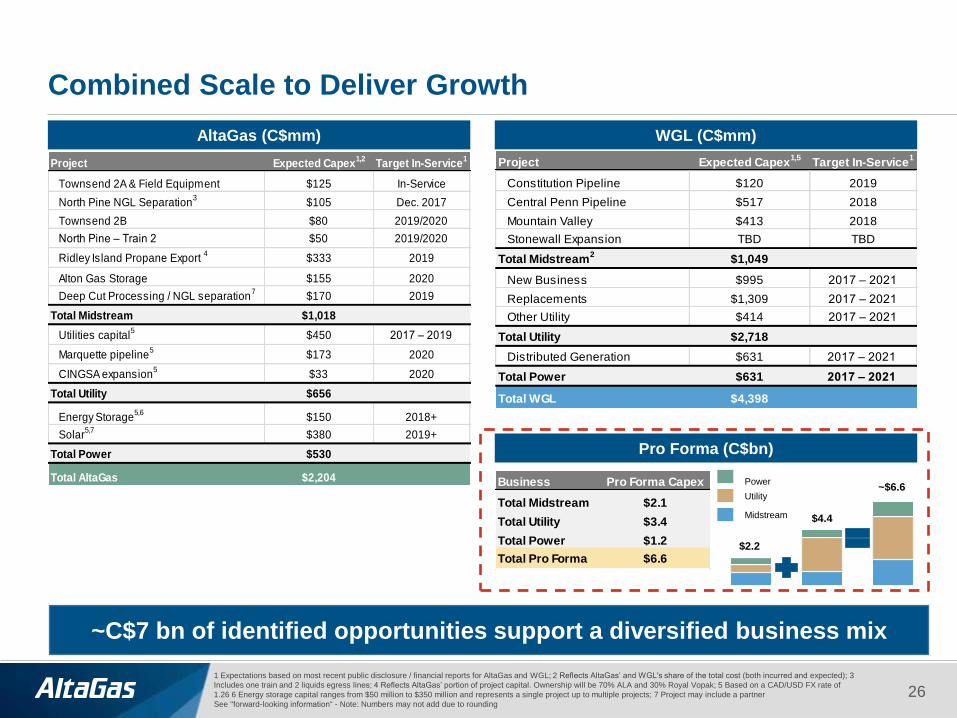
Combined Scale to Deliver Growth
~C$7 bn of identified opportunities support a diversified business mix
AltaGas (C$mm) WGL (C$mm)
Pro Forma (C$bn)
Power
Utility
Midstream
1 Expectations based on most recent public disclosure / financial reports for AltaGas and WGL; 2 Reflects AltaGas’ and WGL's share of the total cost (both incurred and expected); 3
Includes one train and 2 liquids egress lines; 4 Reflects AltaGas’ portion of project capital. Ownership will be 70% ALA and 30% Royal Vopak; 5 Based on a CAD/USD FX rate of
1.26 6 Energy storage capital ranges from $50 million to $350 million and represents a single project up to multiple projects; 7 Project may include a partner
See "forward-looking information“ - Note: Numbers may not add due to rounding
Project Expected Capex1,5
Target In-Service1
Constitution Pipeline $120 2019
Central Penn Pipeline $517 2018
Mountain Valley $413 2018
Stonewall Expansion TBD TBD
Total Midstream2
$1,049
New Business $995 2017 – 2021
Replacements $1,309 2017 – 2021
Other Utility $414 2017 – 2021
Total Utility $2,718
Distributed Generation $631 2017 – 2021
Total Power $631 2017 – 2021
Total WGL $4,398
Business Pro Forma Capex
Total Midstream $2.1
Total Utility $3.4
Total Power $1.2
Total Pro Forma $6.6
Project Expected Capex1,2
Target In-Service1
Townsend 2A & Field Equipment $125 In-Service
North Pine NGL Separation3
$105 Dec. 2017
Townsend 2B $80 2019/2020
North Pine – Train 2 $50 2019/2020
Ridley Island Propane Export 4
$333 2019
Alton Gas Storage $155 2020
Deep Cut Processing / NGL separation7
$170 2019
Total Midstream $1,018
Utilities capital5
$450 2017 – 2019
Marquette pipeline5
$173 2020
CINGSA expansion5
$33 2020
Total Utility $656
Energy Storage5,6
$150 2018+
Solar5,7
$380 2019+
Total Power $530
Total AltaGas $2,204

Sound Financial Position
1 Expectations as at December 20, 2017
See "forward-looking information"
Executed financing history1
Covenants
0%
10%
20%
30%
40%
50%
60%
70%
80%
2011 2012 2013 2014 2015 2016
Debt-to-Capitalization
0 x
1 x
2 x
3 x
4 x
5 x
6 x
2011 2012 2013 2014 2015 2016
EBITDA-to-interest expense
Covenants:
No less
than 2.5 x
27
0
500
1,000
1,500
2,000
2,500
2011 2012 2013 2014 2015 2016 2017
$ Millions
Common Equity Preferred Equity Debt Free Cash Flow DRIP
14%
45%
41%
Balanced capital structure
(September 30, 2017)
Preferred Common Net Debt
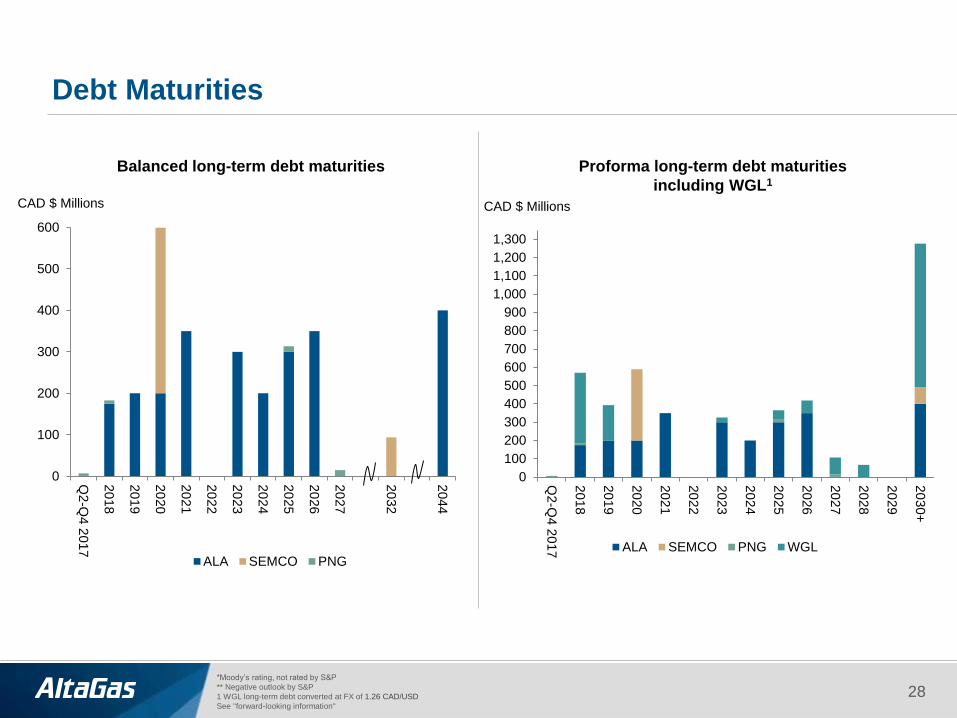
Debt Maturities
*Moody’s rating, not rated by S&P
** Negative outlook by S&P
1 WGL long-term debt converted at FX of 1.26 CAD/USD
See "forward-looking information"
Balanced long-term debt maturities Proforma long-term debt maturities
including WGL1
CAD $ Millions
0
100
200
300
400
500
600
Q2-Q
4 2
017
20
18
20
19
20
20
20
21
20
22
20
23
20
24
20
25
20
26
20
27
20
32
20
44
ALA SEMCO PNG
28
CAD $ Millions
0
100
200
300
400
500
600
700
800
900
1,000
1,100
1,200
1,300
Q2-Q
4 2
017
20
18
20
19
20
20
20
21
20
22
20
23
20
24
20
25
20
26
20
27
20
28
20
29
20
30+
ALA SEMCO PNG WGL

0%
20%
40%
60%
80%
100%
Dividend payout as a % of 2018F AFFO3
$1.32 $1.38 $1.44 $1.53 $1.77
$1.98 $2.10 $2.19
2010 2011 2012 2013 2014 2015 2016 2017E
Delivering Growth and Security
1 2010 in accordance with CGAAP. 2011 and forward in accordance with U.S. GAAP
2 Dividends paid as a percentage of FFO.
3 NBF data, November 2017. AFFO equals FFO adjusted for gas and power maintenance capital, preferred share dividends and non-controlling interest. FFO and AFFO are normalized
which is a non-GAAP measure
See "forward-looking information"
Dividend growth
Dividend payout1,2
Average
Payout ratio balances company growth and investor return and positions
ALA for further dividend growth
29
8%
CAGR
49% 51% 46%
42% 45%
55% 57% ~60%
2010 2011 2012 2013 2014 2015 2016 2017E
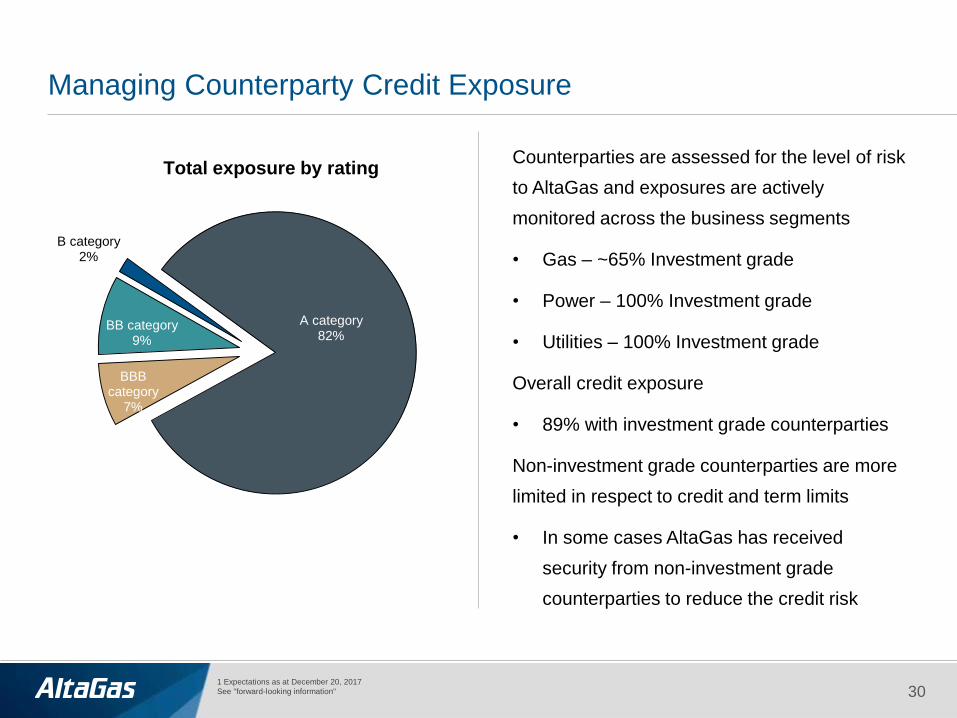
Managing Counterparty Credit Exposure
30
Counterparties are assessed for the level of risk
to AltaGas and exposures are actively
monitored across the business segments
• Gas – ~65% Investment grade
• Power – 100% Investment grade
• Utilities – 100% Investment grade
Overall credit exposure
• 89% with investment grade counterparties
Non-investment grade counterparties are more
limited in respect to credit and term limits
• In some cases AltaGas has received
security from non-investment grade
counterparties to reduce the credit risk
A category 82%
BBB category
7%
BB category 9%
B category 2%
Total exposure by rating
1 Expectations as at December 20, 2017
See "forward-looking information"
U.S. Tax Reform
31
Major impacts of the U.S. tax reform on AltaGas are:
• Corporate tax rate reduction from 35% to 21%
• Decrease in tax expense is:
• Positive impact to earnings for non-regulated
businesses
• Slight negative impact (non-material) to
EBITDA and FFO for regulated businesses
• When cash taxable, impact will be neutral to
FFO for regulated businesses
• Vast majority of U.S. utilities expected to make
rate adjustments this year to reflect the lower
tax rate
• Regulated deferred tax liability revaluation paid
back over remaining useful live of assets
See "forward-looking information"
Gas
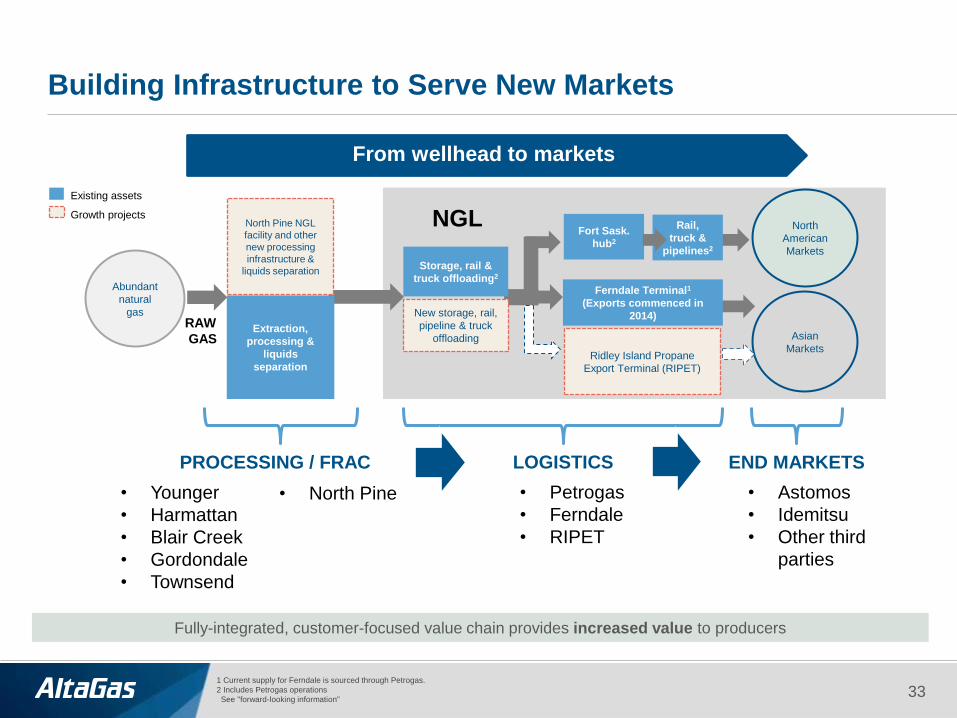
Building Infrastructure to Serve New Markets
1 Current supply for Ferndale is sourced through Petrogas.
2 Includes Petrogas operations
See "forward-looking information"
Ridley Island Propane
Export Terminal (RIPET)
New storage, rail,
pipeline & truck
offloading Extraction,
processing &
liquids
separation
Rail,
truck &
pipelines2
RAW
GAS
NGL Fort Sask.
hub2
North Pine NGL
facility and other
new processing
infrastructure &
liquids separation
Ferndale Terminal1
(Exports commenced in
2014)
From wellhead to markets
North
American
Markets
Asian
Markets
Storage, rail &
truck offloading2
Abundant
natural
gas
Existing assets
Growth projects
• Petrogas
• Ferndale
• RIPET
LOGISTICS
• Astomos
• Idemitsu
• Other third
parties
END MARKETS
• Younger
• Harmattan
• Blair Creek
• Gordondale
• Townsend
PROCESSING / FRAC
• North Pine
Fully-integrated, customer-focused value chain provides increased value to producers
33
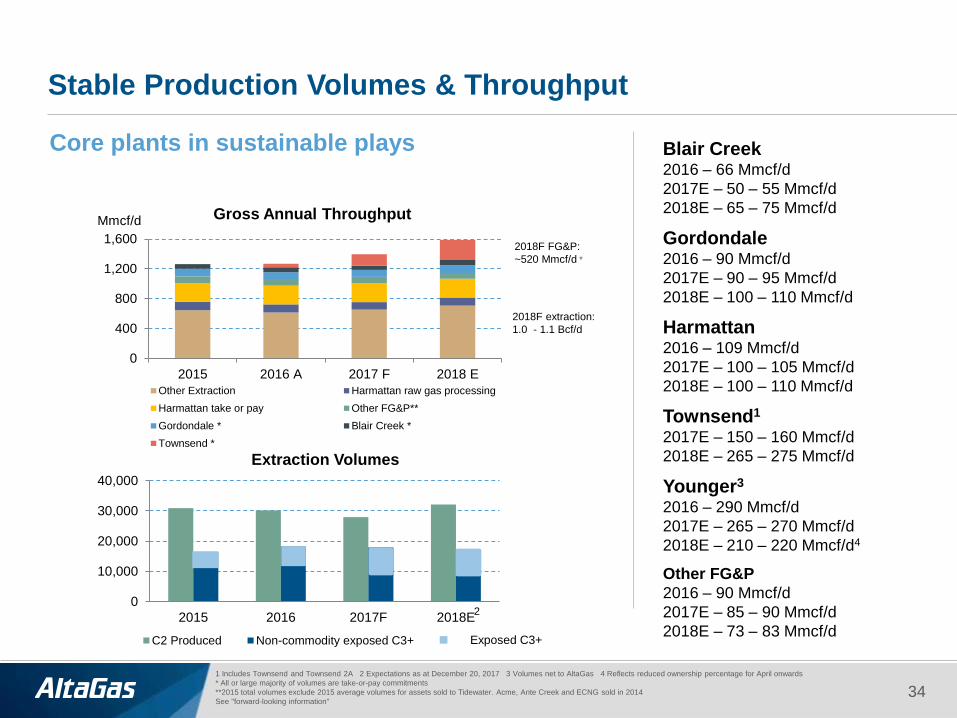
0
10,000
20,000
30,000
40,000
2015 2016 2017F 2018E
Extraction Volumes
C2 Produced Non-commodity exposed C3+
Stable Production Volumes & Throughput
Blair Creek 2016 – 66 Mmcf/d
2017E – 50 – 55 Mmcf/d
2018E – 65 – 75 Mmcf/d
Gordondale 2016 – 90 Mmcf/d
2017E – 90 – 95 Mmcf/d
2018E – 100 – 110 Mmcf/d
Harmattan 2016 – 109 Mmcf/d
2017E – 100 – 105 Mmcf/d
2018E – 100 – 110 Mmcf/d
Townsend1 2017E – 150 – 160 Mmcf/d
2018E – 265 – 275 Mmcf/d
Younger3
2016 – 290 Mmcf/d
2017E – 265 – 270 Mmcf/d
2018E – 210 – 220 Mmcf/d4
Other FG&P
2016 – 90 Mmcf/d
2017E – 85 – 90 Mmcf/d
2018E – 73 – 83 Mmcf/d
2018F FG&P:
~520 Mmcf/d *
2018F extraction:
1.0 - 1.1 Bcf/d
1 Includes Townsend and Townsend 2A 2 Expectations as at December 20, 2017 3 Volumes net to AltaGas 4 Reflects reduced ownership percentage for April onwards
* All or large majority of volumes are take-or-pay commitments
**2015 total volumes exclude 2015 average volumes for assets sold to Tidewater. Acme, Ante Creek and ECNG sold in 2014
See "forward-looking information"
Mmcf/d
Core plants in sustainable plays
34
Exposed C3+
2
0
400
800
1,200
1,600
2015 2016 A 2017 F 2018 E
Gross Annual Throughput
Other Extraction Harmattan raw gas processing
Harmattan take or pay Other FG&P**
Gordondale * Blair Creek *
Townsend *

$0.00
$0.50
$1.00
$1.50
$2.00
$2.50
PE
Y
AA
V
TO
U
RIC
E
EQ
T
SW
N
BIR
CO
G
BN
P
PN
E
PM
T
AR
X
CR
RR
C
SR
X
CK
E
BX
E
AR
VII
KE
L
CQ
E
PO
U
EC
A
NV
A
CH
K
Competitive Canadian Production1,2
Producers Series2
USD/Mcfe
$0.00
$0.50
$1.00
$1.50
$2.00
$2.50
VII
PE
Y
NV
A
CR
AR
X
TO
U
KE
L
AA
V
BIR
EC
A
SR
X
CO
G
BN
P
DE
E
RIC
E
EQ
T
CH
K
RR
C
CQ
E
SW
N
PN
E
PM
T
AR
BX
E
Unhedged Cash Flow Margin $/Mcfe (incl. taxes)1
Avg. CDN producer cash flow margin5
USD/Mcfe
Montney Competitive at Current Prices
1 Peters report October, 2017
2 BMO data, October 2017
3 Painted Pony October 30, 2017 Investor Presentation, Based on a CAD/USD FX rate of 1.26
4 Cash costs including transportation, operating costs, G&A and interest expense
5 Unhedged cash flow (net of royalties)
6 J.P. Morgan / JPM Energy Research May 31, 2017
Map Source: Peters report
See "forward-looking information"
Painted Pony field cash cost estimated at ~$1.10 USD/Mcfe3
35
Painted Pony cash margin
estimated at ~$1.00 USD/Mcfe3
Canadian Producers Marcellus Producers
Marcellus Producers
Avg. CDN producer cash cost
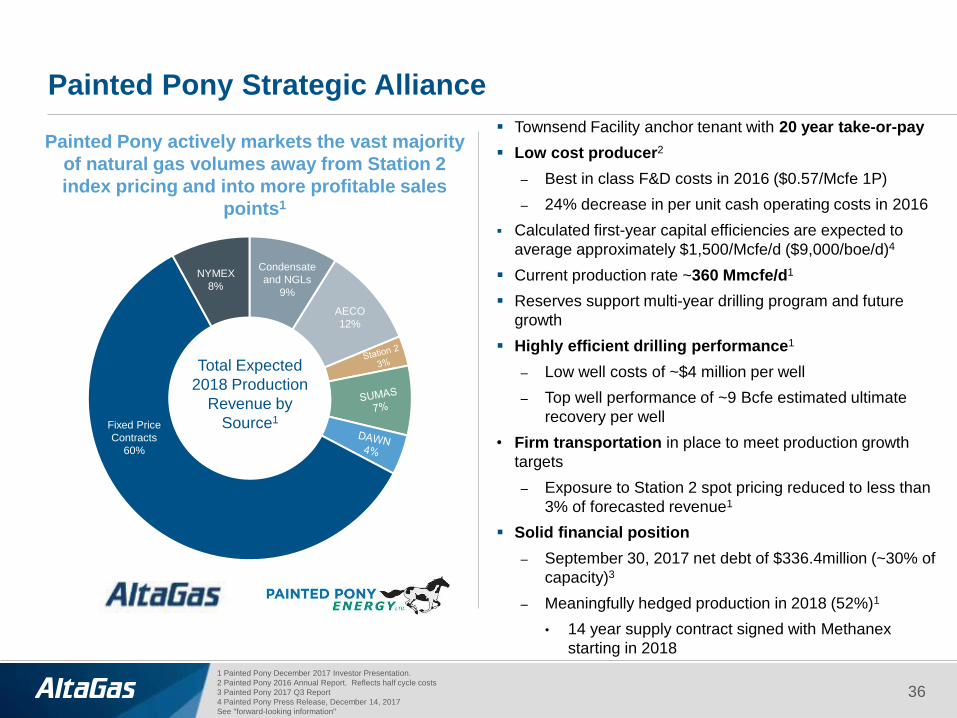
Painted Pony Strategic Alliance
Painted Pony actively markets the vast majority
of natural gas volumes away from Station 2
index pricing and into more profitable sales
points1
Townsend Facility anchor tenant with 20 year take-or-pay
Low cost producer2
– Best in class F&D costs in 2016 ($0.57/Mcfe 1P)
– 24% decrease in per unit cash operating costs in 2016
Calculated first-year capital efficiencies are expected to
average approximately $1,500/Mcfe/d ($9,000/boe/d)4
Current production rate ~360 Mmcfe/d1
Reserves support multi-year drilling program and future
growth
Highly efficient drilling performance1
– Low well costs of ~$4 million per well
– Top well performance of ~9 Bcfe estimated ultimate
recovery per well
• Firm transportation in place to meet production growth
targets
– Exposure to Station 2 spot pricing reduced to less than
3% of forecasted revenue1
Solid financial position
– September 30, 2017 net debt of $336.4million (~30% of
capacity)3
– Meaningfully hedged production in 2018 (52%)1
• 14 year supply contract signed with Methanex
starting in 2018
1 Painted Pony December 2017 Investor Presentation.
2 Painted Pony 2016 Annual Report. Reflects half cycle costs
3 Painted Pony 2017 Q3 Report
4 Painted Pony Press Release, December 14, 2017
See "forward-looking information"
36
Fixed Price
Contracts
60%
AECO
12%
NYMEX
8%
Condensate
and NGLs
9%
Total Expected
2018 Production
Revenue by
Source1
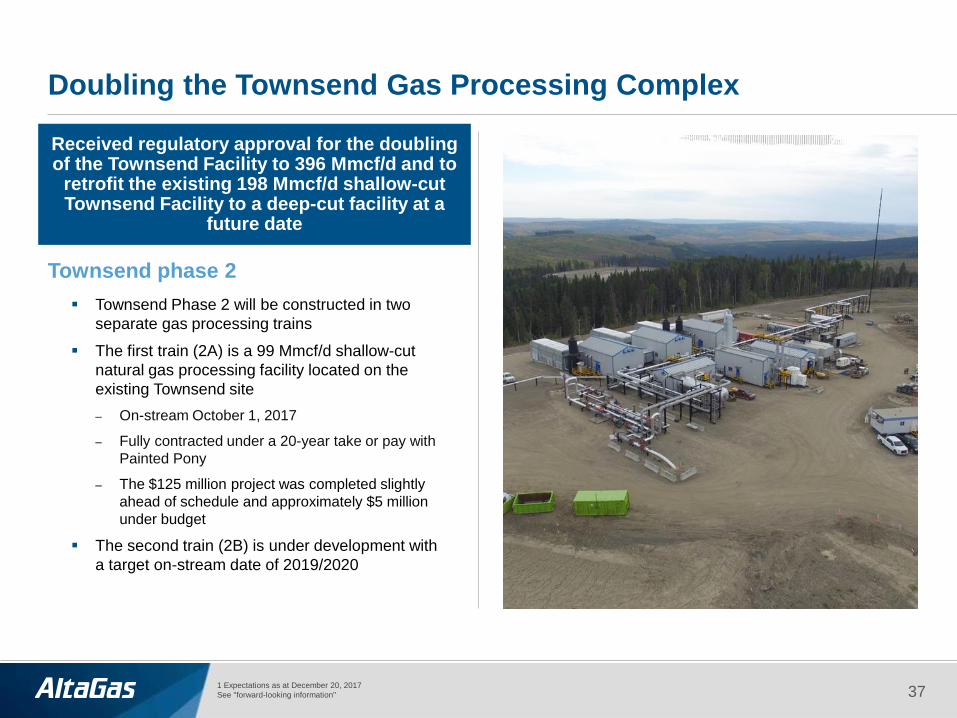
Doubling the Townsend Gas Processing Complex
37
Received regulatory approval for the doubling of the Townsend Facility to 396 Mmcf/d and to
retrofit the existing 198 Mmcf/d shallow-cut Townsend Facility to a deep-cut facility at a
future date
1 Expectations as at December 20, 2017
See "forward-looking information"
Townsend Phase 2 will be constructed in two
separate gas processing trains
The first train (2A) is a 99 Mmcf/d shallow-cut
natural gas processing facility located on the
existing Townsend site
– On-stream October 1, 2017
– Fully contracted under a 20-year take or pay with
Painted Pony
– The $125 million project was completed slightly
ahead of schedule and approximately $5 million
under budget
The second train (2B) is under development with
a target on-stream date of 2019/2020
Townsend phase 2

North Pine NGL Separation Facility to Serve Montney Producers
38
NGL facility to serve Montney producers in northeast
British Columbia, near Fort St. John
On-stream December 1, 2017
First train capable of producing up to 10,000 Bbls/d of
C3+ processing capacity, with capacity of 6,000
Bbls/d of C5+
Two NGL supply pipelines will be constructed
connecting the existing Alaska Highway truck terminal
to the facility
Well connected by rail to Canada’s west coast
including the Ridley Island Propane Export Terminal
Backstopped by long-term supply agreements with
Painted Pony for a portion of total capacity
Expect further supply agreements with other
producers
The $120 million project was completed ahead of
schedule and approximately $15 million under budget
Permitting in place for a second NGL separation train
capable of processing up to 10,000 Bbls/d of propane
plus NGL mix. Construction expected to follow after
the completion of the first train, subject to sufficient
commercial support from area producers
1 Includes first train and two liquids supply lines
2 Expectations as at December 20, 2017
See "forward-looking information"
AltaGas’ Northeast B.C. and Energy Export Strategy Provides new market access for Western Canadian propane producers to Asia
AltaGas’ propane export terminal at
RIPET is poised to create a hub for
key global markets to the west
Significant shipping advantages vs.
Gulf coast, providing producers with
increased netbacks
Blair Creek
North Pine
Facility
Younger
Truck
Terminal
See "forward-looking information"
39
Historical C3 Prices
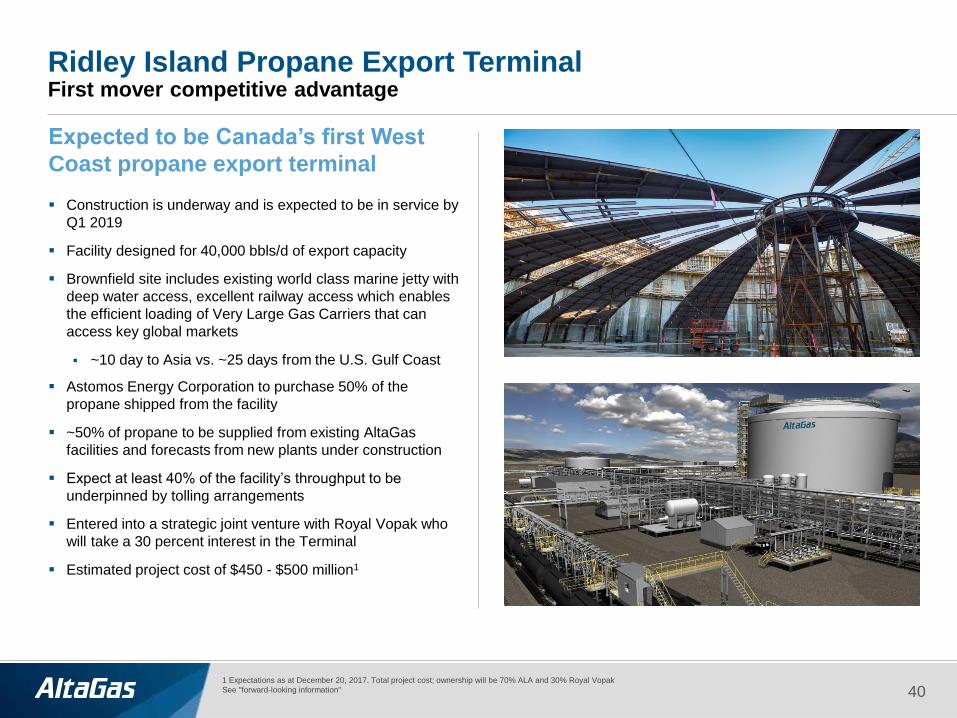
Ridley Island Propane Export Terminal First mover competitive advantage
1 Expectations as at December 20, 2017. Total project cost; ownership will be 70% ALA and 30% Royal Vopak
See "forward-looking information"
Expected to be Canada’s first West
Coast propane export terminal Construction is underway and is expected to be in service by
Q1 2019
Facility designed for 40,000 bbls/d of export capacity
Brownfield site includes existing world class marine jetty with
deep water access, excellent railway access which enables
the efficient loading of Very Large Gas Carriers that can
access key global markets
~10 day to Asia vs. ~25 days from the U.S. Gulf Coast
Astomos Energy Corporation to purchase 50% of the
propane shipped from the facility
~50% of propane to be supplied from existing AltaGas
facilities and forecasts from new plants under construction
Expect at least 40% of the facility’s throughput to be
underpinned by tolling arrangements
Entered into a strategic joint venture with Royal Vopak who
will take a 30 percent interest in the Terminal
Estimated project cost of $450 - $500 million1
40
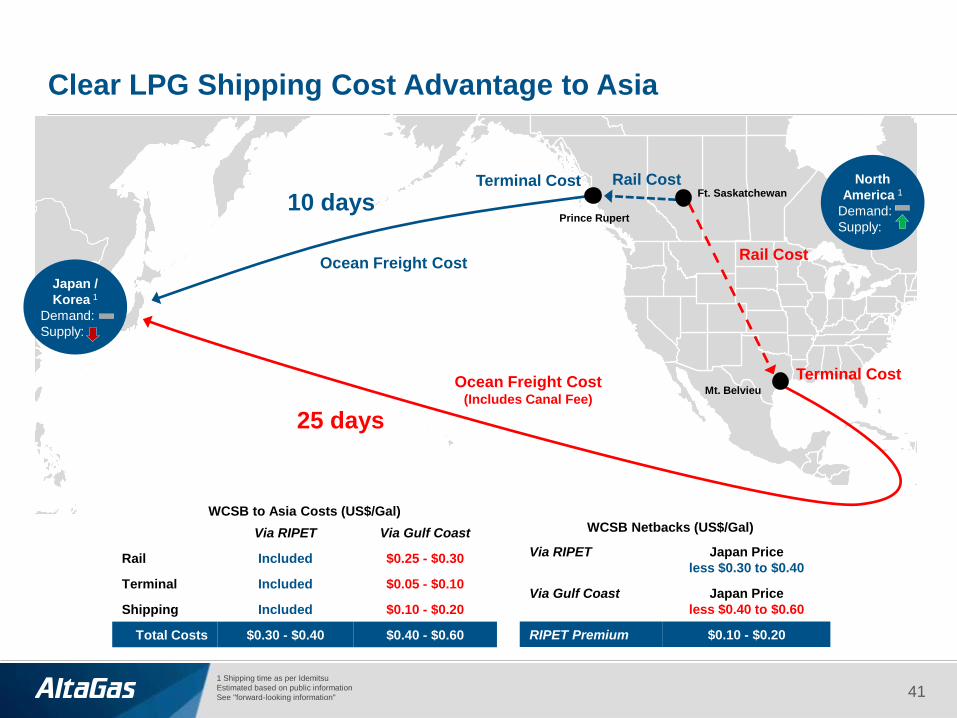
Clear LPG Shipping Cost Advantage to Asia
Prince Rupert
Ft. Saskatchewan
Mt. Belvieu
Rail Cost
Via RIPET Via Gulf Coast
Rail Included $0.25 - $0.30
Terminal Included $0.05 - $0.10
Shipping Included $0.10 - $0.20
Total Costs $0.30 - $0.40 $0.40 - $0.60
WCSB to Asia Costs (US$/Gal)
Via RIPET Japan Price
less $0.30 to $0.40
Via Gulf Coast Japan Price
less $0.40 to $0.60
RIPET Premium $0.10 - $0.20
WCSB Netbacks (US$/Gal)
25 days
10 days
Terminal Cost Ocean Freight Cost
(Includes Canal Fee)
Rail Cost Terminal Cost
Ocean Freight Cost
Japan /
Korea 1
Demand:
Supply:
North
America 1
Demand:
Supply:
1 Shipping time as per Idemitsu
Estimated based on public information
See "forward-looking information"
41
Utilities
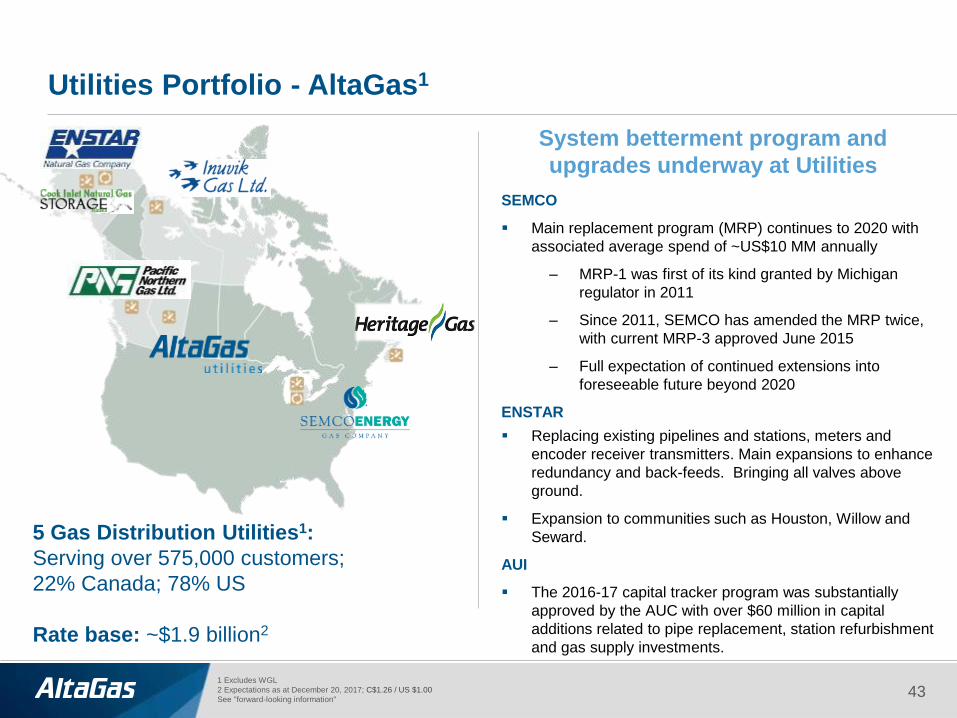
System betterment program and
upgrades underway at Utilities
Utilities Portfolio - AltaGas1
1 Excludes WGL
2 Expectations as at December 20, 2017; C$1.26 / US $1.00
See "forward-looking information"
5 Gas Distribution Utilities1:
Serving over 575,000 customers;
22% Canada; 78% US
Rate base: ~$1.9 billion2
SEMCO
Main replacement program (MRP) continues to 2020 with
associated average spend of ~US$10 MM annually
– MRP-1 was first of its kind granted by Michigan
regulator in 2011
– Since 2011, SEMCO has amended the MRP twice,
with current MRP-3 approved June 2015
– Full expectation of continued extensions into
foreseeable future beyond 2020
ENSTAR
Replacing existing pipelines and stations, meters and
encoder receiver transmitters. Main expansions to enhance
redundancy and back-feeds. Bringing all valves above
ground.
Expansion to communities such as Houston, Willow and
Seward.
AUI
The 2016-17 capital tracker program was substantially
approved by the AUC with over $60 million in capital
additions related to pipe replacement, station refurbishment
and gas supply investments.
43

Michigan Growth Opportunity
Proposed pipeline that will connect the Great
Lakes Gas Transmission pipeline to the Northern
Gas pipeline in Marquette, Michigan Approximately 42 miles mainly with 20” diameter pipe
Provides needed redundancy and additional supply
options to SEMCO’s ~35,000 customers in its
service territory in Michigan’s Western Upper
Peninsula. It will also provide additional natural
gas capacity to Michigan’s Upper Peninsula to
allow for growth
Cost is estimated at ~US$130 - $140 million.
Recovery on MCP is expected to be through a
general base rate case
Received approval of Act 9 application from the
Michigan Public Service Commission in August
2017 to construct, own and operate the project.
Preliminary route surveys and investigations began
in September 2017, engineering and property
acquisitions in 2018, and construction in 2019
MCP is expected to be in service in mid-2020
Marquette Connector Pipeline (MCP)
Expectations as at December 20, 2017
See "forward-looking information“
44

Supportive Regulatory Environment for Regulated Gas Utilities
Utility Location
Allowed
ROE and
Equity
Thickness
Regulatory
British
Columbia
9.40%1
45%
Rate case filed in November 2017 for 2018 and 2019
Protected from weather related volatility through revenue stabilization adjustment
account
Alberta 8.50%
41%
Operate under Performance-Based Regulation, 2013-2017 current term. Next
generation PBR (2018 – 2022) under review; expects decision in February 2018.
Generic cost of capital proceeding underway; hearing scheduled to take place in
March 2018
Cost recovery and return on rate base through revenue per customer formula
Additional recovery and return on rate base through capital tracker program
Nova Scotia 11%
45%
No regulatory lag; earn immediately on invested capital
Customer Retention Program approved in September 2016 results in a decrease in
distribution rates for primarily commercial customers
Michigan 10.35%
49%
Use of projected test year for rate cases with 12 month limit to issue a rate order,
eliminates/reduces regulatory lag
Recovery of invested capital through the Main Replacement Program surcharge has
reduced the need for frequent rate cases
Last rate case filing completed in 2010; next case to be filed in 2019
In August 2017, received approval from the Michigan Public Service Commission for
the Act 9 application for the Marquette Connector Pipeline
Alaska 11.88%
51.80%
Final order approving $5.8 million rate increase (including $5 million interim rates
previously included in rates) issued on September 22. Final rates effective
November 1, 2017.
Alaska 12.55%
50.00% Rate case filing in April 2018.
1 Approximate average between PNG and PNG NE
See "forward-looking information"
45
Washington Gas Regulatory Environment
Utility Location Regulatory
Virginia Rate case was filed in June 2016 with a stipulation issued in April 2017; final Commission
approval issued June 30 approving stipulation for $34 million annual revenue increase
Expedited rate cases anticipated in 2019 and 2020
Maryland Rate case to be filed in 2018
New 5 year plan for accelerated replacement to be filed in 2018 for the 2019 – 2024 period
Washington
D.C.
Last rate case was filed in February 2016 with final rates approved in March 2017
Rate case to be submitted in 2020
New 5 year plan for accelerated replacement to be filed in 2019 for the 2020 – 2025 period
See "forward-looking information"
46
Power
Northwest B.C. Hydro – Stable Long-Term Financial Returns
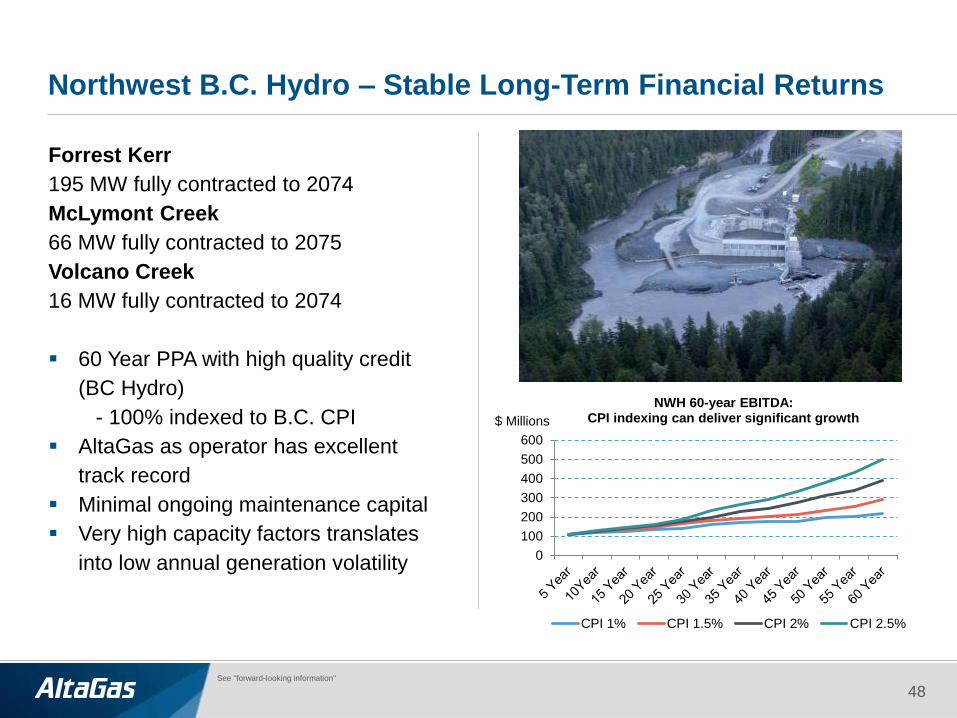
Forrest Kerr
195 MW fully contracted to 2074
McLymont Creek
66 MW fully contracted to 2075
Volcano Creek
16 MW fully contracted to 2074
60 Year PPA with high quality credit
(BC Hydro)
- 100% indexed to B.C. CPI
AltaGas as operator has excellent
track record
Minimal ongoing maintenance capital
Very high capacity factors translates
into low annual generation volatility 0
100
200
300
400
500
600
NWH 60-year EBITDA: CPI indexing can deliver significant growth
CPI 1% CPI 1.5% CPI 2% CPI 2.5%
$ Millions
See "forward-looking information"
48
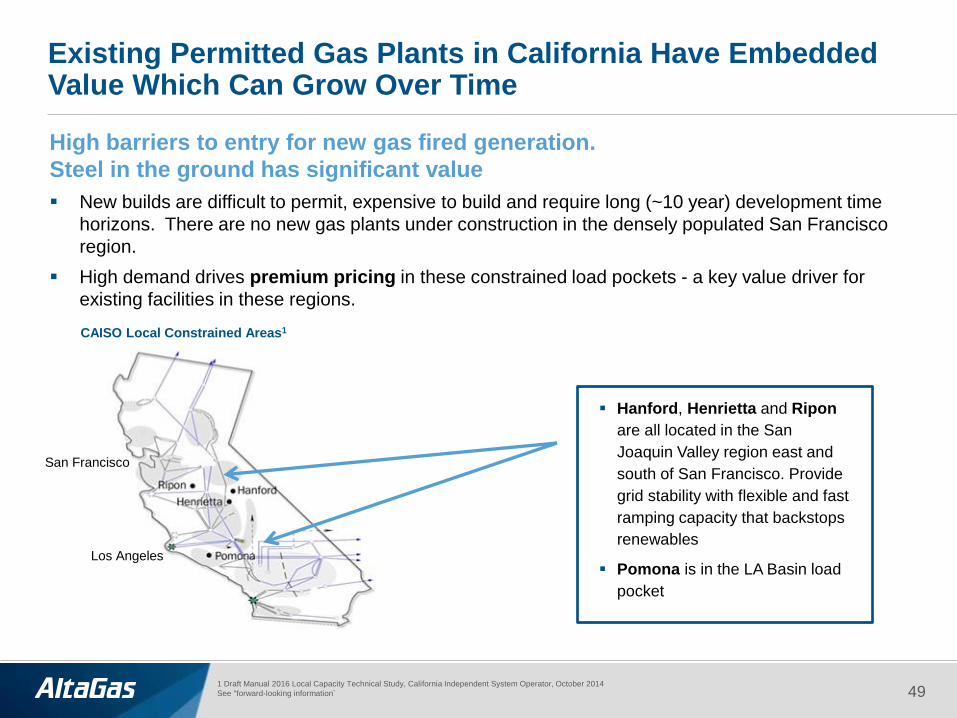
1 Draft Manual 2016 Local Capacity Technical Study, California Independent System Operator, October 2014
See "forward-looking information"
Existing Permitted Gas Plants in California Have Embedded Value Which Can Grow Over Time
High barriers to entry for new gas fired generation.
Steel in the ground has significant value
New builds are difficult to permit, expensive to build and require long (~10 year) development time
horizons. There are no new gas plants under construction in the densely populated San Francisco
region.
High demand drives premium pricing in these constrained load pockets - a key value driver for
existing facilities in these regions.
Hanford, Henrietta and Ripon
are all located in the San
Joaquin Valley region east and
south of San Francisco. Provide
grid stability with flexible and fast
ramping capacity that backstops
renewables
Pomona is in the LA Basin load
CAISO Local Constrained Areas1
Los Angeles
San Francisco
49

Energy Storage
50
Pomona Energy Storage
• 10 year Energy Storage Agreement (ESA) with
Southern California Edison (SCE) for 20 MW energy
storage at Pomona facility
• Resource adequacy capacity for four hour period,
equivalent of 80 MWh of energy discharging capacity
• Commercial operations date: December 31, 2016
Other Battery Storage Opportunities
• California’s three largest utilities were mandated to
procure 1,325 MW by 2020
• ~400 MWs are left to be procured by 2020
• SCE, PG&E, and SDG&E to explore up to a combined
500 MW of additional distributed energy storage
• SCE to procure another 20 MW and LADWP to study
100 MW of cost effective energy storage resulting from
Aliso Canyon Gas Storage integrity
• Additional ‘Preferred Resources’ RFPs are expected in
2018 that will include energy storage
• AltaGas will continue to leverage its existing sites and
infrastructure as well as look for greenfield
development opportunities
As at December 20, 2017
See "forward-looking information"
Renewable Integration & Flexibility
• California legislators continue to move towards reducing
fossil fuel reliance which creates new energy storage
procurement opportunities
• CPUC is including energy storage in their resource
planning to aid the integration of renewables
• Net load will need to be met by a combination of flexible
resources, imports/exports, and curtailments
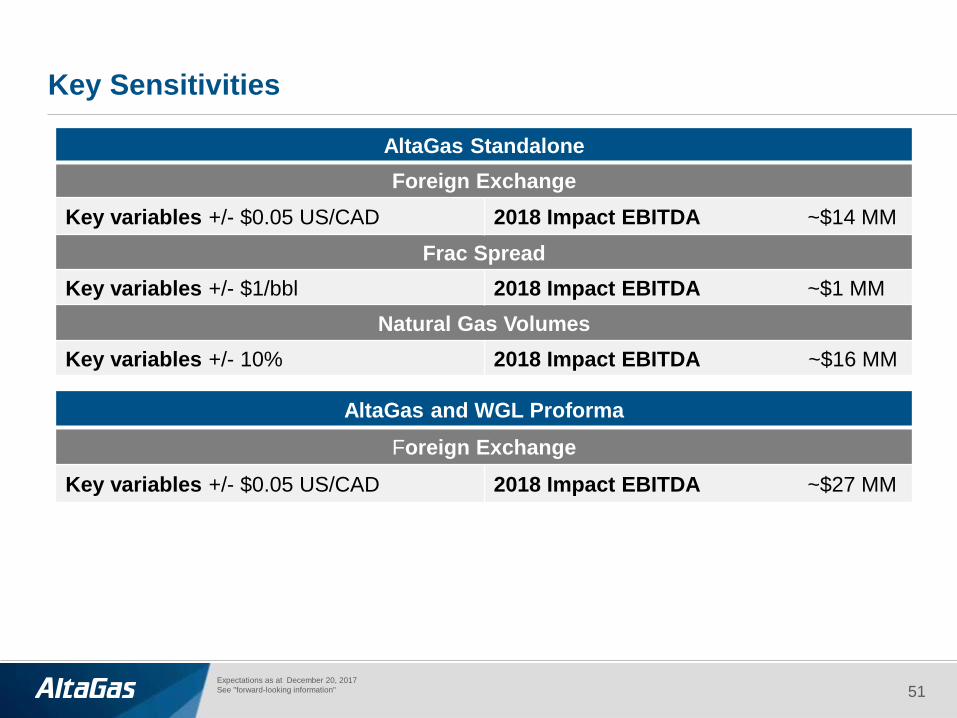
Key Sensitivities
AltaGas Standalone
Foreign Exchange
Key variables +/- $0.05 US/CAD 2018 Impact EBITDA ~$14 MM
Frac Spread
Key variables +/- $1/bbl 2018 Impact EBITDA ~$1 MM
Natural Gas Volumes
Key variables +/- 10% 2018 Impact EBITDA ~$16 MM
Expectations as at December 20, 2017
See "forward-looking information"
51
AltaGas and WGL Proforma
Foreign Exchange
Key variables +/- $0.05 US/CAD 2018 Impact EBITDA ~$27 MM