Embed Size (px)
Citation preview
Teaching Basic Marketing Accountability using Spreadsheets: An Exploratory Perspective
Gopala Ganesh, Ph.D. Department of Marketing
College of Business Administration University of North Texas
P.O. Box 311396 Denton, TX 76203-1396
and
Audhesh K Paswan, Ph.D. (Contact author)
Department of Marketing College of Business Administration
University of North Texas P.O. Box 311396
Denton, TX 76203-1396 Tel: 940-565-3121 Fax: 940-565-3837
e-mail: [email protected]
Revised on
July 30, 2007
For
Journal of Business Research Special Issues on Advances in Spreadsheet and Database Training
Teaching Basic Marketing Accountability using Spreadsheets: An Exploratory Perspective
Abstract
Extant literature suggests that a key problem with marketing is a lack of accountability and a possible way of improving the situation is to use spreadsheets to inculcate marketing accountability among future marketing executives. This study attempts to enhance our understanding of how to impart spreadsheet skills and encourage an accountability mind set among undergraduate marketing students by focusing on a course called Marketing and Money. Assessment data indicate that the course, which captures the spirit of the behavioral model of learning, does in fact enhance student’s spreadsheet skill in a consistent manner. In addition, the analysis suggests that in order to increase student’s self efficacy, instructors ought to try to make the course perceptually more useful rather than try to reduce its difficulty.
1
Teaching Basic Marketing Accountability using Spreadsheets: An Exploratory Perspective
“Marketing accountability has emerged as a subject of interest in both practitioner and
academic marketing literature..” (Baker and Holt 2004, p 557). The idea is to incorporate finance
and accounting concepts into marketing decisions, i.e., making marketing more measurable.
Although importance of the marketing - finance interface has been acknowledged in the past (cf.
Moorman and Rust 1999), of late it has gained increased momentum (Baker and Holt 2004).
This was highlighted by articles in a special edition of Journal of Business Research edited by
Zinkhan and Verbrugge (2000a). Different authors have focused on different aspects of the
interface, e.g., advertising expenditure and earnings (Graham and Frankenburger 2000);
marketing and bottom line (Ambler 2000a, 2000b; Shaw and Mazur 1997); and marketing and
shareholders interest (Doyle 2000; Kumar et al. 2000; and McDonald et al. 2000). Zinkhan and
Verbrugge (2000b) lament the lack of research attention given to marketing’s relationship with
firm performance or shareholder value. Seth and Sisodia (2002) suggest that a fundamental
problem with marketing is a lack of accountability. Others argue that one reason for the minimal
presence of marketing in the boardroom is that marketers have failed to demonstrate a definitive
linkage between marketing activities, costs, and shareholder value (Ambler 2003; Doyle 2000;
and Simms 2003). Baker and Holt (2004) identify several constituents, e.g., educators,
academics, consultants, and practitioners, who may have contributed to this lack of
accountability, and suggest an activity based approach to effective knowledge transfer. These
studies have more than emphasized the importance of infusing financial accountability into the
marketing profession.
So how do we infuse accountability into marketing education? Educators such as
Dembeck and Stout (1997) and Lilien et al. (1998) have advocated the use of spreadsheet based
2
decision models into marketing classes. They argue that such use of spreadsheet based decision
models enhance managerial decision making by enhancing consistency, decision options, group
decision making, and mental models (Lilien et al. 1998). However, despite the fact that
spreadsheets have been around and their usage in decision making is also not new (cf. Black et
al. 2005; Dembeck and Stout 1997; Hwarng 2001; Lilien et al. 1998; Palocksay and Markham
2002; Sosin et al. 2004; Yi and Davis 2003), very few have focused on use of spreadsheet to
enhance marketing decision making or introducing accountability into the marketing function, in
general. The spreadsheet based Marketing Engineering course by Lilien and Rangaswamy
(Lilien et al. 1998) is targeted at the graduate students and focuses on more strategic marketing
decisions. The current manuscript addresses a gap by focusing on a course that is targeted at the
undergraduate students. The course uses spreadsheets in the context of marketing decisions and
develops an accountability mindset among undergraduate marketing students. It is specifically
designed for undergraduate students because they are often hired at the operational level and
would most likely benefit from focus, objectivity and structure in learning the basics of
managerial decision making. We believe that this is accomplished, in part, by the use of
spreadsheets.
This paper starts out by examining the extant literature that have focused on the use of
spreadsheet in an education and training context, and explores some of the theories that help
develop a model of learning. This is followed by a narrative of the course context where
spreadsheets are used and an explanation of assessment data collected over multiple semesters.
Because of the descriptive nature of this study, no hypotheses are proposed. Instead, we simply
provide details of the course, which uses Excel Spreadsheets, as a basis for imparting marketing
accountability mindset among marketing students. Next is a description of how the course
3
outcomes were assessed along with descriptive statistics to illustrate whether the course achieved
its goals. In addition, correlation analyses are used to assess the relationships between different
aspects of course outcomes. Finally, a discussion of the results, limitations and implications is
presented.
Extant Literature: Spreadsheet in Business Education
Several authors have approached the use of spreadsheets in decision making from a very
diverse perspective (cf. Black et al. 2005; Dembeck and Stout 1997; Hwarng 2001; Grossman
2006; Lilien et al. 1998; Markham and Palocksay 2006; Palocksay and Markham 2002; Sosin et
al. 2004; Yi and Davis 2003). Sosin et al. (2004) examine the use of technology (including
spreadsheets) in economics education. They found that the relationship between use of
technology and student performance is not very clear. They suggest that it is not relevant to ask
“whether to use or not use technology, but what technology to use in what manner” (Sosin et al.
2004, p 257). Yi and Davis (2003) develop and validate an observational learning model of
computer software training and skill acquisition, which is discussed later in detail. Palocsay and
Markham (2002) describe a course that uses spreadsheet in teaching decision support systems to
IT students. Markham and Palocksay (2006) detail the use of spreadsheet in scenario analysis in
a classroom. Hwarng (2001) employs a simulation in his course that uses the spreadsheet as a
platform to teach student the nuances of simulation models. Grossman (2006) describes the
process of spreadsheet engineering in a management science course. These examples illustrate
the extensive use of spreadsheet for teaching and training purposes, primarily in OR/MS,
decision sciences and MIS areas, with a focus on teaching the intricacies of the spreadsheet.
4
Few of the extant studies have focused on use of spreadsheets to strengthen
accountability in marketing functions. Lilien et al. (1998) advocate the use of spreadsheet-based
models to make marketing decisions and have incorporated these in their ‘marketing
engineering’ course package. They argue that without this shift in decision making approach,
managers are limited to conceptual marketing and may suffer from responsibility bias and under-
representation of measurable outcome variables. Spreadsheet based decision models provide
focus and objectivity in managerial decision making, at the operational as well as strategic levels.
Dembeck and Stout (1997) demonstrate that managers in a multinational firm can use
spreadsheet software to arrive at an optimal solution to marketing problems such as what to
produce and its mix. They suggest that “Decision analysis facilitated with a computerized
spreadsheet can help financial managers sift through complex business opportunities and choose
the most appropriate ones given their organization’s objective(s)..” (p. 33). Black et al. (2005)
demonstrate the usefulness of using Microsoft Excel in developing online survey instruments,
and conclude that “Excel provides a useful, flexible, and easy to use Internet survey design
program” (p 70). Thomas (2000) critiques extant financial reporting methods and suggests
alternate performance measures. McDonald (2005) provides a conceptual framework for
bringing clarity to measuring marketing effectiveness.
Learning Models for Computer Skill Development:
Yi and Davis (2003) state that industry in US spends about $57 billion annually on formal
training with enhancing computer skills as the most often cited content. Hence, the effectiveness
of these training programs is extremely crucial. Yi and Davis (2003) take a detailed look at
various learning models – e.g., traditional lecture based model of learning (Bolt et al. 2001;
5
Compeau and Higgins 1995a; Johnson and Marakas 2000; Simon et al. 1996; and Simon and
Werner 1996), computer-aided learning model (Gist et al. 1988, 1989), and self-study oriented
model (Simon et al. 1996; Simon and Werner 1996), and based on their review of extant
literature conclude that the behavioral model of learning results in better training outcomes than
other models. They also contend that although various training methods relying on different
learning models are used by industry, the pros and cons of these approaches are not well
understood. Detailed discussions of training techniques and behavioral models of learning have
been provided by studies such as Donovan and Radosevich (1999); Kozlowski et al. (2001); May
and Kahnweiler (2000); and Salas and Cannon-Bowers (2001).
The underlying theoretical rationale for behavioral model of learning comes from social
cognition theory (Bandura 1986) which essentially suggests that people learn by first watching
someone else perform a target behavior and then reenacting it. The stages in this observational
learning processes include attention, retention (cognitive registration), production (overt action to
produce desired response), and motivation (favorable consequences of production leads to repeat
performance). Yi and Davis (2003) use this social cognitive theoretical framework to develop a
comprehensive model for the observational learning process and then test it empirically. They
found that the observational learning process had a significant influence on both declarative
knowledge and post-training self-efficacy, which, together with task performance constitutes the
three most commonly used outcome variables (Colquitt et al. 2000). Yi and Davis (2003)
expanded task performance into immediate and delayed task performance. Declarative
knowledge captures a person’s initial cognitive representation of the task, and knowledge about
facts and things. It can be measured either by verbal specification of task objectives or by
questions designed to assess a student’s understanding of the key concepts (Yi and Davis 2003).
6
Self-efficacy has been defined as “one’s perceived performance capabilities for specific activity”
(Kraiger et al. 1993, p. 320). Yi and Davis (2003) use post-training self-efficacy in their study.
While self-efficacy and declarative knowledge capture the cognitive part of the training outcome,
task performance captures the behavioral aspects. Extant studies have found a positive
relationship between these three outcome variables (see the meta-analysis studies by Colquitt et
al. 2000; Locke and Latham 1990; and Stajkovic and Luthans 1998; and Yi and Davis 2003 for a
more recent empirical study).
Another relevant theoretical framework often used to explain the adoption of technology
is Technology Adoption Model – TAM (cf. Davis 1986; 1989; 1993; Davis, Bagozzi, and
Warshaw 1989; Venkatesh and Davis 1996) and it is based on the theory of reasoned action
(Ajzen and Fishbein 1980; Fishbein and Ajzen 1975). The TAM framework is relevant because
spreadsheet and its usage in decision making are seen as something that involves math and
technology by business students in general and marketing students in particular and hence are
approached with some fear and apprehension (Grossman 2006; Jordan et al. 1997; Papageorgiou
1996). Grossman (2006) also states that knowledge and use of spreadsheet for serious work is
not easy.
TAM model (cf. Davis 1986; 1989; 1993; Davis, Bagozzi, and Warshaw 1989;
Venkatesh and Davis 1996) includes two variables – perceived ease of use and perceived
usefulness as determinants of behavioral intention and subsequent actual use. Venkatesh and
Davis (1996) suggest that direct hands-on experience by users enhances system specific ease of
use perception. In addition, both Davis (1989) and Venkatesh and Davis (1996) suggest that
perceived ease of use is similar to self efficacy.
7
Finally, consumer psychology literature under the rubric of means-end-chain or
hierarchy of goals (Gutman 1982; Gutman 1997) suggests that beyond the task level
determinants such as ease of use and usefulness, people are driven towards action by higher level
goals and outcomes. Gutman (1997) proposes three levels of goals – action goals that are linked
to the act itself, outcome goals associated with immediate effects of the action, and the highest
level goals or consequences including the indirect effects of the outcome. Since its inception, the
means-end-chain has been used to explain consumer behavior in varied context such as
perception of soft drinks (Gutman 1997); US President (Bagozzi and Dabholkar (2000), Food
retailing (Devlin, Birtwistle, and Macedo (2003); service employees (Pieters, Bottschen and
Thelen 1998); and higher education (Gutman and Miaoulis 2003). This means-end-chain model
has been investigated in a higher education context, resulting in the finding that it could be used
to develop service positioning strategies (Gutman and Miaoulis 2003). These studies suggest that
some of the outcome goals associated with education include competence (a direct outcome of
the act itself) as well as higher order consequences such as success in life, jobs, and interviews.
In our study, the design of the course and the pedagogical tools used allow the students to use the
spreadsheets in marketing context. The case-let-based hands-on approach organized by modules
that increasingly get more involved and/or difficult and the manageable smaller set activities to
be completed in each block help students acquire direct experience. With this, students find it
easy to use spreadsheets in marketing decisions and develop a sense of competence. They come
to realize that use of such tools in marketing decisions puts them on a firmer ground than if they
made these decisions based on gut-feeling and intuition. Repetition of this process during the
semester helps them see that it is not that difficult. Success in solving the spreadsheet problems
8
along with frequent feedback helps the students see the usefulness of the tool in marketing
decision making and realize that it may be a good skill for their future.
Relying on these studies, we use perceived ease of use (or post use self efficacy) with
different spreadsheet-intensive modules and perceived usefulness of the content knowledge
covered in these to assess whether the pedagogy adopted in the course achieves its objectives,
We believe that the perceived ease of use and usefulness of the various spreadsheet modules will
make students see their benefits and hopefully encourage them to make more use of the
spreadsheet in making marketing decision in future – either in other classes or in their work
environment. In addition, we also looked at the students’ perception of outcome benefits (i.e.,
task specific competence and success in life and jobs) resulting from the application of
spreadsheet knowledge in marketing decisions.
These form the theoretical basis for the discussion of the context for this study, which is a
course that relies on spreadsheets to impart data based decision making skills and an
accountability mindset among undergraduate marketing students. In the next section, we present
the details of the course.
Study Context: Spreadsheets in marketing decision making
The study context is a course called Marketing and Money (henceforth referred to as M
and M) taught at a major comprehensive American university in the Southwest. M and M is a
required course for undergraduate Marketing students. It is scheduled to be taken immediately
after the Marketing Principles course, but before advanced marketing courses and electives. M
and M is intended to reinforce the content knowledge gained in basic accounting and
mathematics classes and incorporate this knowledge within the context of marketing decisions to
9
develop an accountability mind set among marketing students. Students typically come to this
class having completed the mandatory sophomore-level MIS and Decision science classes that
initially expose most of them to spreadsheets. M and M takes this further by relying heavily on
Excel spreadsheets for computation of some of the commonly used marketing metrics,
The M and M course consists of 12 modules through which content knowledge is
introduced and reinforced. Ten of these are concept modules and two are “How To” modules.
The ten concept modules focus (M01) Percentages and Weighted Average, (M02) Balance Sheet
and Income Statement, (M03) Channel Markups, (M04) Contribution and Breakeven, (M05)
Product, (M06) Promotion, (M07) Price, (M08) Distribution, (M09) Net Present Value, and
(M10) Decision under uncertainty. These concept modules are all structured alike: explanation of
concepts interspersed with as well as followed by several one page case-lets from a collection of
nearly 200 marketing math oriented case-lets, problems and teaching notes obtained from several
colleagues at other universities. Some new case-lets were also specifically written for this class
by the professor. All case-lets obtained from other sources were revised to fit to one page,
updated (year, focal product etc.) and appended with specific questions intended to take the
student towards the final answer, step-by-step. In a typical semester only about 50 of these case-
lets are used. This allows easy customization of the course from semester to semester. Therefore,
there is no text book for this apparently rather unique undergraduate course.
In a typical module, while the earlier case-lets are manually solved, step-by-step, only the
broad steps needed for the solution are provided for the later ones. During the semester, students
are afforded the opportunity to solve many of both types of case-lets using Professor-provided
highly structured Excel spreadsheets. They can access the Professor’s own Adobe Excel solution,
but not the formulae behind the correct solution. This approach is intended to (1) give students
10
hands-on knowledge about how to use spreadsheets to solve marketing related problems
described in the ten concept modules, and (2) reinforce their knowledge by going through the
detailed computational process that involves first entering the case-let information in the Excel
input cells, then figuring out the formulae for computing the answers in the Excel output cells.
We would like to point out that the Excel templates that accompany many a marketing or other
textbook have the formulae already in place. Therefore, the student has very little incentive and
in our experience, very little clue about “how the correct answer was obtained” in these
spreadsheet templates. In contrast, in the M and M Professor-provided spreadsheets, the students
receive help in organizing and presenting the case-let data, but are forced to write their own
formulae to come up with the correct answers. In addition, this format allows multiple levels of
challenge, as desired by the Professor: students could be given the Excel solutions (in PDF
format) and the formulae; solutions, but not the formulae (as implemented for the concept
modules and assignments based on those); and neither the solution nor the formulae (as
implemented for the “How To” modules and assignments based on those).
The “How To” modules are quite different from the concept modules. In the first “How
To” (M-How to-01) students learn to develop a detailed Excel spreadsheet for a practice case-let
on paper from scratch, as opposed to using the Professor’s spreadsheet. They then solve their
own spreadsheet and come up with the answers to the case-let. The second “How To” module
(M-How to-02) requires students to create a Power Point presentation from their own just
completed M-How to-01 Excel spreadsheet.
During the semester, student skills and knowledge base are assessed through 5 graded
assignments, each worth 10% of the semester grade (accounting for 50% of the semester grade).
Three of the graded assignments, typically one every month, involve solving 5 mini-case-lets
11
each from the currently scheduled concept modules, using the Professor’s Excel worksheets, as
explained above. The fourth graded assignment, a comprehensive case called CC1, involves
students creating their own Excel workbook for a brand new case-let, after completing M-How
to-01 and practice case-lets therein. Here, the Professor does not provide the solution (Excel or
PDF file), but simply provides the bottom line answer to the case-let as “clues” The fifth and last
graded assignment, CC2, involves creating the Power point presentation for the CC1 case-let
using the just completed Excel spreadsheet from M-How to-01, again after going through the
practice case-lets in M-How to-02.
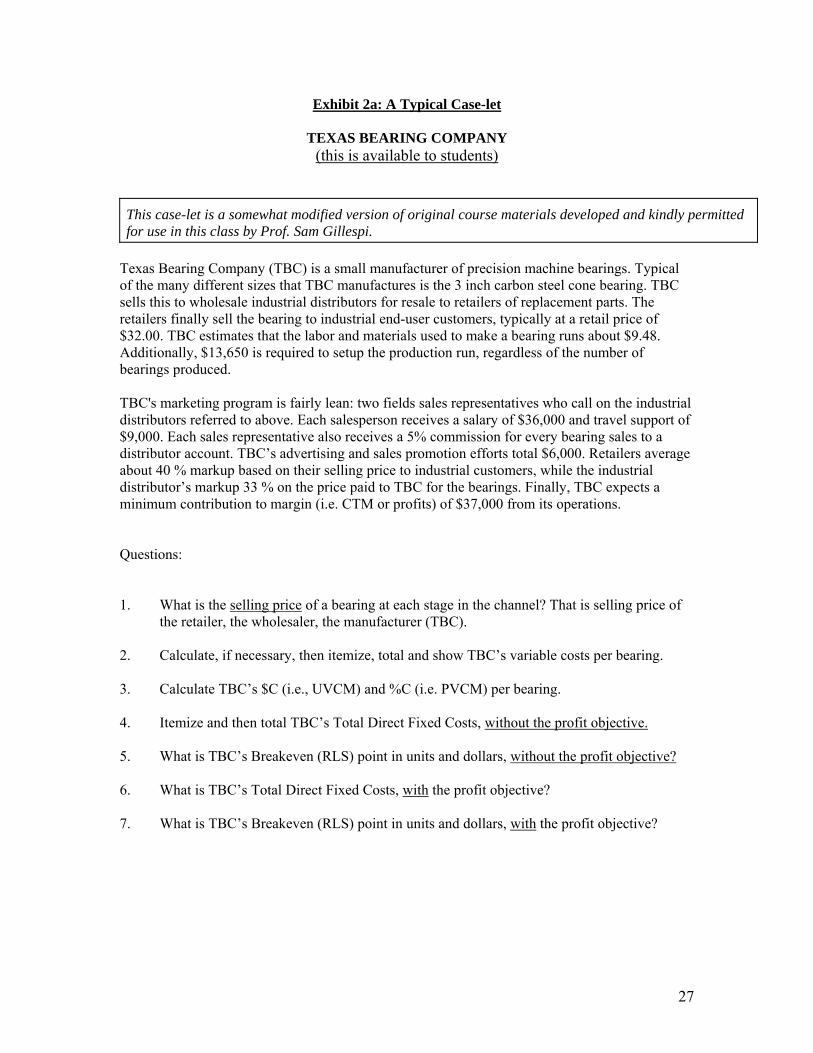
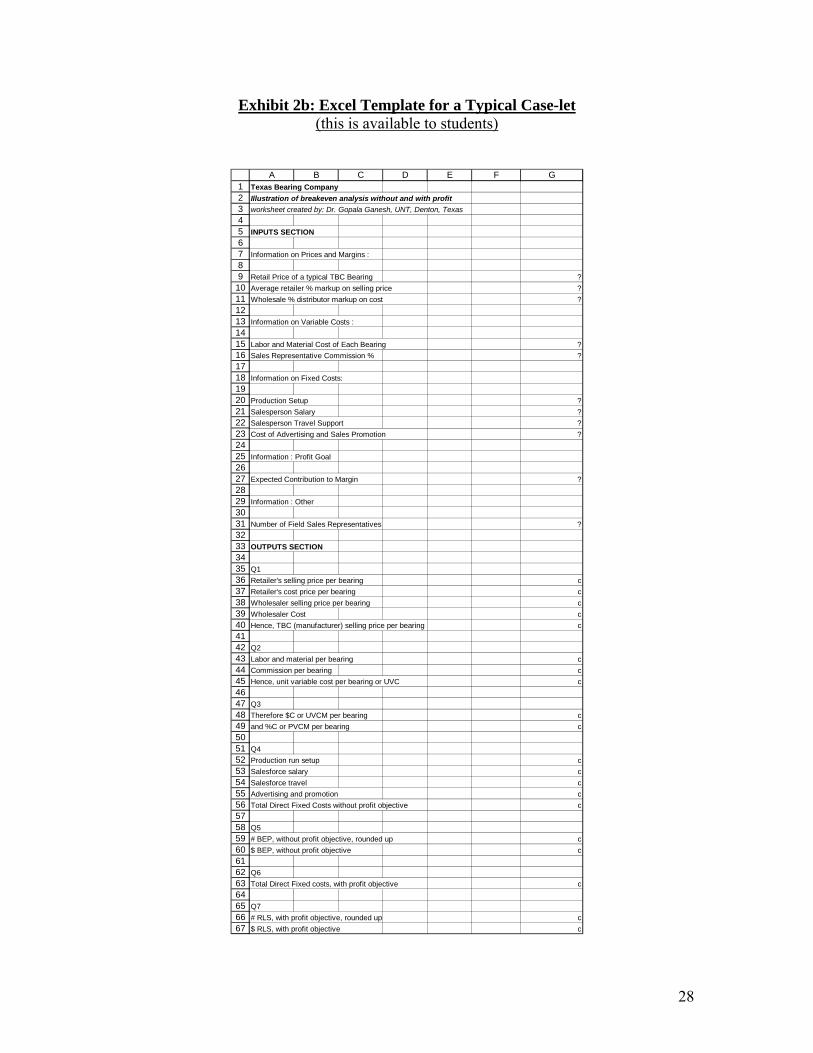
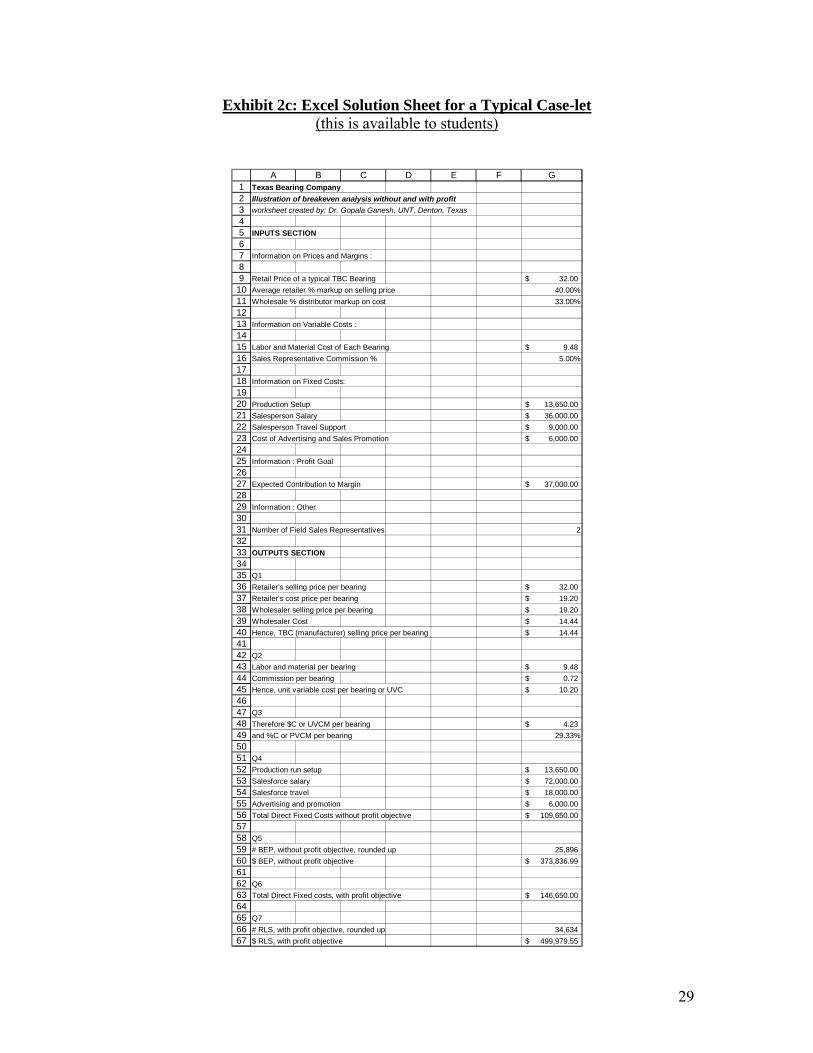
Exhibit 1 provides a description of the ten content modules and the two “How to”
modules. Exhibit 2a illustrates a typical mini-case-let, while 2b is its Excel template, in which
the ?s in the Inputs section are to be replaced by raw data from the case-let and the Cs in the
Outputs section are to be replaced by student-supplied formulae for obtaining the correct
answers. Exhibit 2c is the Professor’s PDF solution that is available to students, while Exhibit 2d
is the Professor’s formula sheet in PDF again, which is NOT provided to the students.
A mid term examination (20%) and a final examination (30%), both closed-book
(formula sheet is provided) and multiple choice, account for the other half of the semester grade.
The mid term exam consists of 25 questions to be completed in 80 minutes, while the final exam
doubles the number of questions to 50, but increases the time available to only 120 minutes. The
exam questions are designed to test application rather than memory recall. Each question is a
micro-case involving a marketing decision situation and the question typically asks students how
they would approach the problem and provides 5 answer choices. The exam questions are mostly
non-quantitative, emphasizing recognizing the correct approach to the situation, as opposed to
number crunching.
12
Course Assessment:
While the typical college-mandated student evaluation has been implemented, more
specific feedback is obtained using an end of the semester questionnaire measuring students’
perceived ease of use and self-efficacy (Davis 1989; Kraiger et al. 1993; Venkatesh and Davis
1996; Yi and Davis 2003). The perceived ease of use is measured through self reported difficulty
associated with various assignments and concepts taught in the course, on a ten point semantic
differential scale of 1 (Not at all difficult) to 10 (Very difficult). Perceived usefulness is also
measured likewise on a scale of 1 (Very low) to 10 (Very high). Perceived outcome benefit is
measured by asking students to assess their own competence on various outcome variables and
its relevance to their future life and jobs using eight questions (A01, A02, and A04 through
A09), again on a 1 (Strongly disagree) to 10 (Strongly agree) scale.
Because of the descriptive nature of this investigation, we primarily report descriptive
statistics with some associative indicators such as correlations to get a feel for the relationships
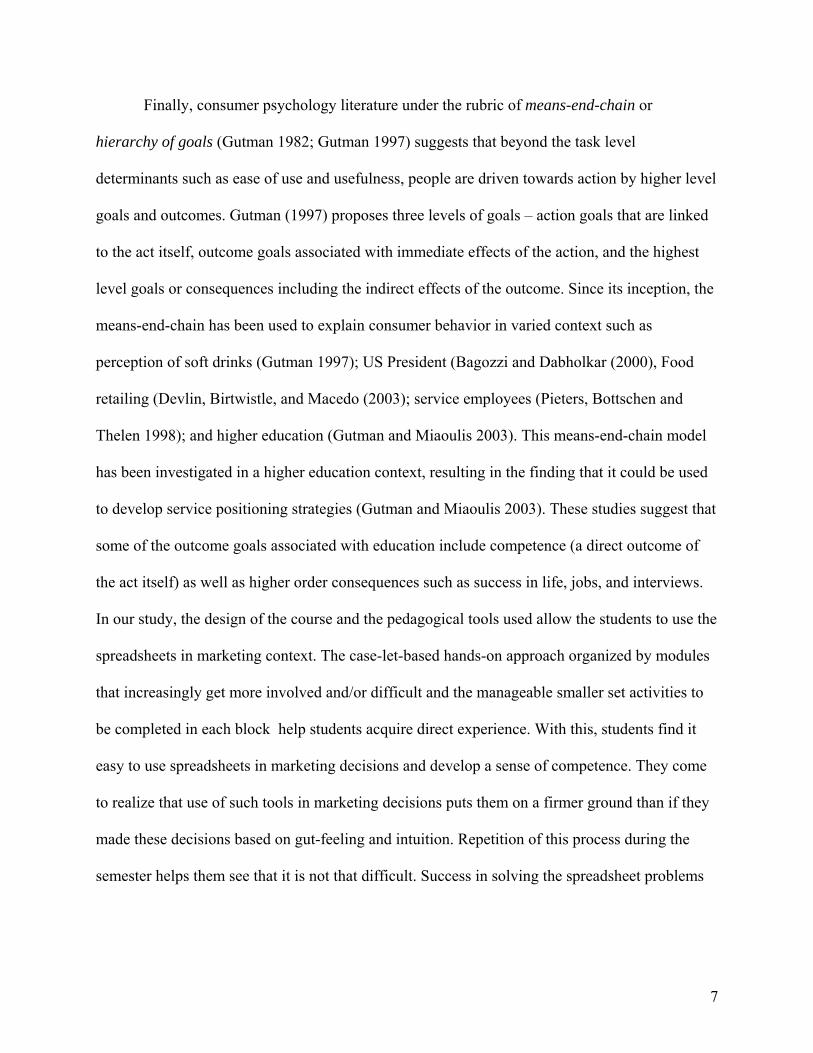
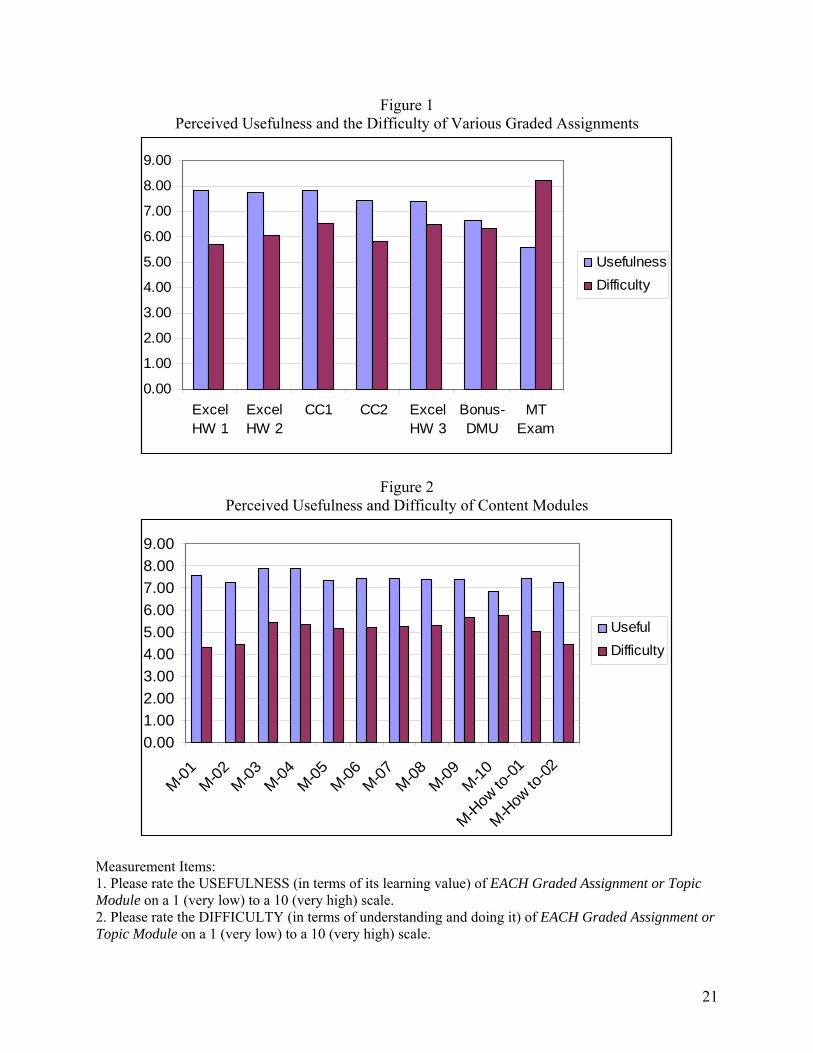
between various measures. Figure 1 presents a graph of descriptive statistics of the perceived
usefulness and difficulty of various graded assignments. The chart indicates a congruent pattern
between students’ perceived usefulness and difficulty on various assignments with usefulness
scores being slightly higher than the difficulty scores, except in the case-let of the bonus
assignment and the Mid-term Exam. However, the correlations between them is low (highest R2
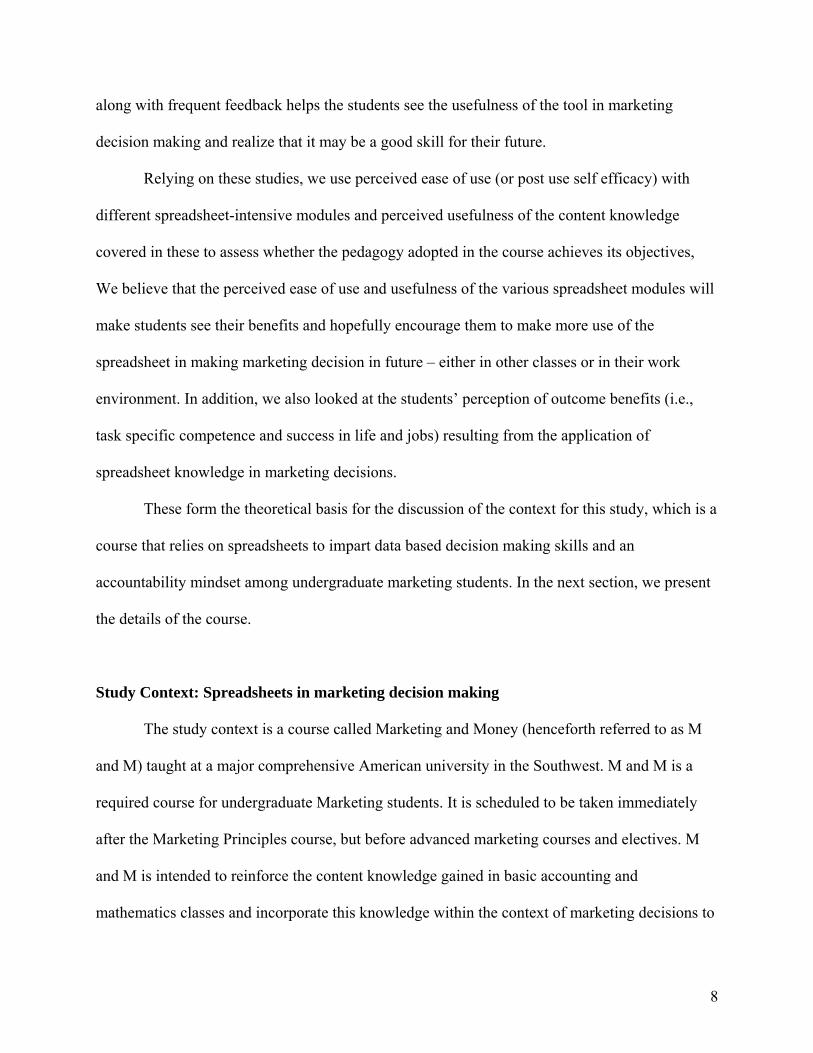
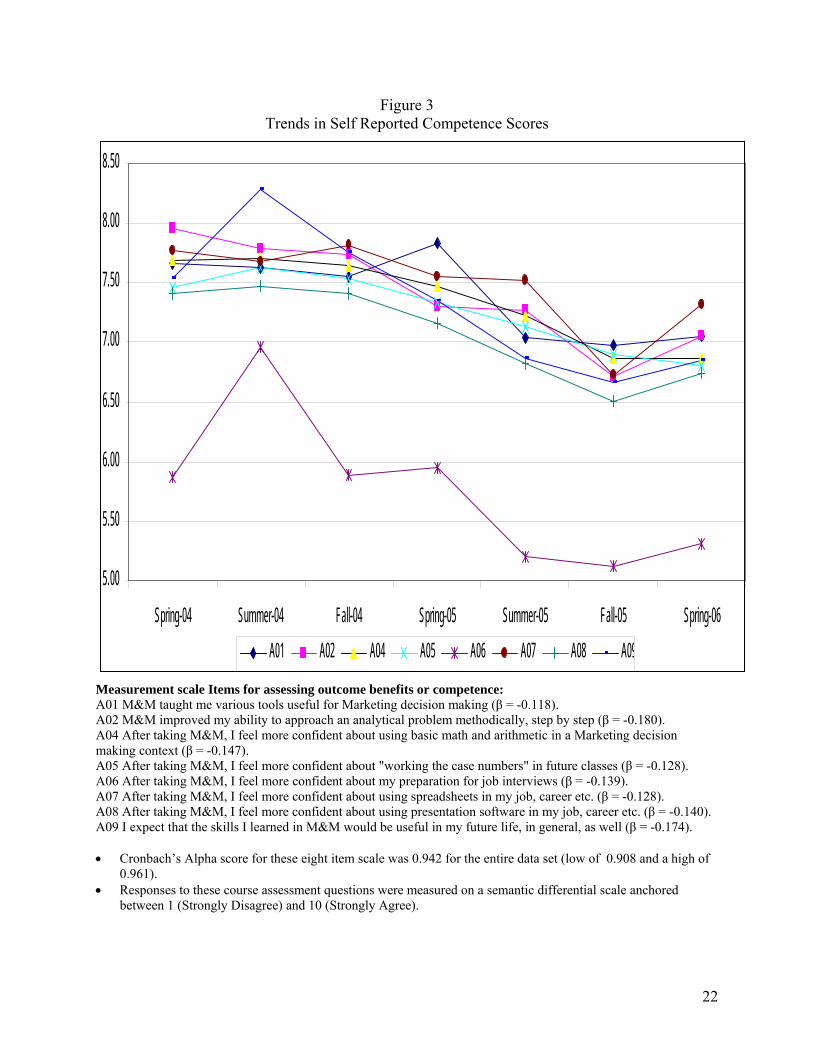
is 0.0324 for CC1). Figure 2 presents a graph of descriptive statistics of the perceived usefulness
and difficulty of various concept and ‘How to’ modules. One again the pattern for perceived
usefulness and difficulty seems to be congruent for all the modules but the correlations are very
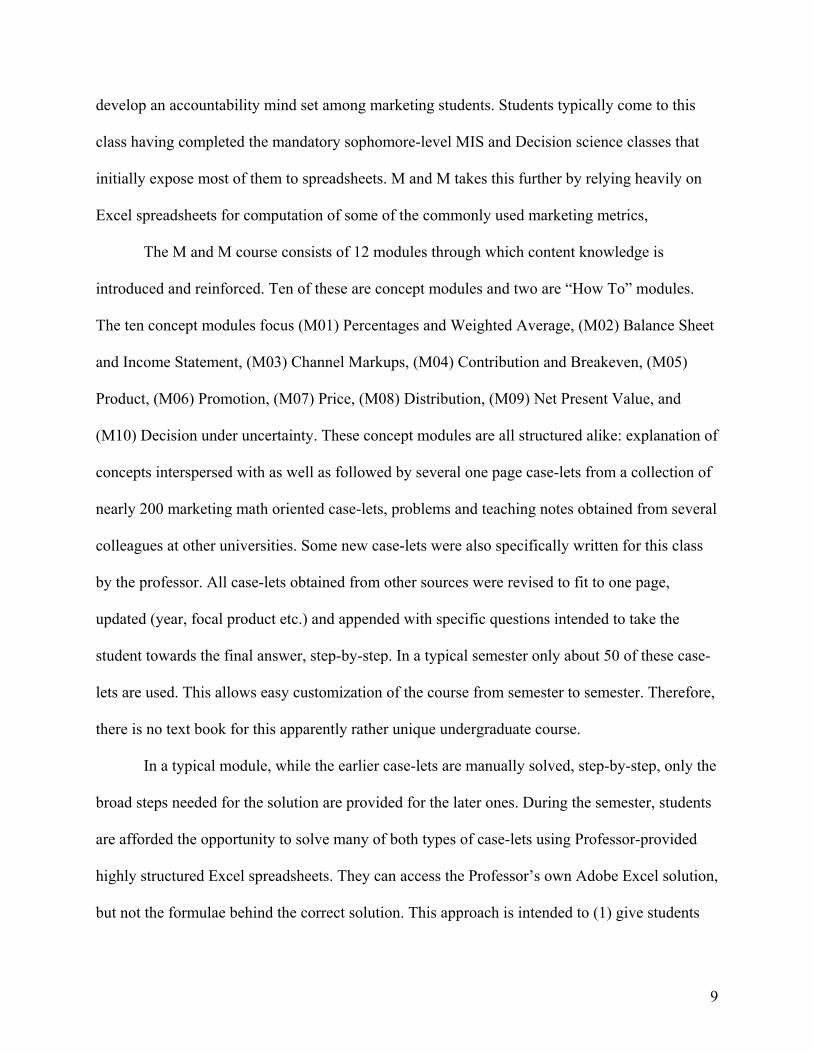
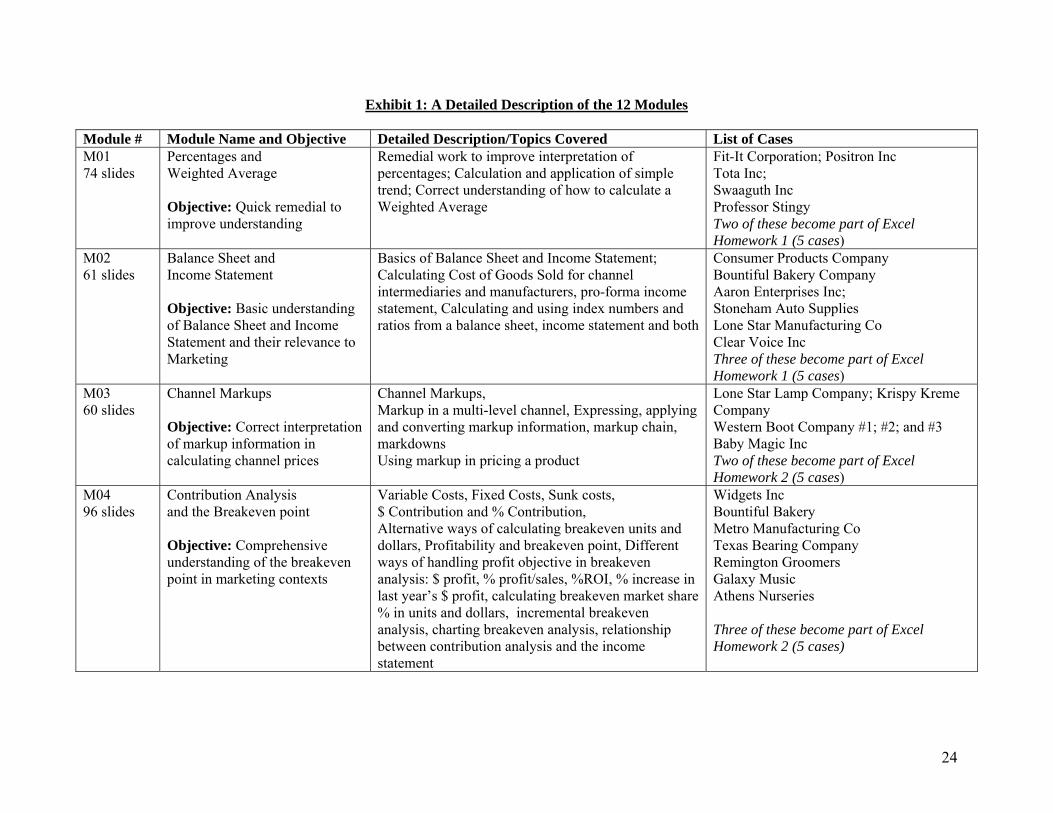
low (highest R2 is 0.0342 for M-How to-01). Figure 3 presents a trend analysis of self reported
13
scales (A01, A02, and A04 through A09) measuring competencies gained due to the M and M
course across different terms (starting Spring 2004 through Spring 2006). All measures of self
assessed competencies exhibit similar trends for their means and generally range between 6.5
and 8.25 on a 0-10 scale. The Cronbach’s Alpha score for these eight questions was 0.942. In
addition, except for A06 (After taking M&M, I feel more confident about my preparation for job
interviews) other measures of competence (A01, A02, A04, A05, A07, A08, and A09) were very
tightly clustered. This may be because ‘more confidence’ could be resulting from improved self-
confidence concerning the use of the spreadsheet and may not be directly related to competence.
Finally, we checked for association using correlation coefficients between the composite
score for competence (i.e., outcome benefit) as well as perceived difficulty, and usefulness, first
for the assignments (Table 1) and then for the concept modules (Table 2.) We are not using
multiple regression because prediction is not the objective of this study. We are also not
interested in finding which of the assignments or concept modules influence the self assessed
competence the most. We are merely interested in finding out whether the self-assessment of
competence is associated with usefulness and difficulty. The figures in Table 1 and Table 2
suggest an association between the self assessed competence (strong and significant correlation
coefficients) and the student’s perceived usefulness of different assignments as well as various
concept modules. In comparison, the relationship between competence and student’s perceived
difficulty of different assignments as well as various concept modules are almost non-existent
(mostly non-significant).
14
Discussion:
The Marketing and Money course has strong links to the behavioral model of learning
(cf. Bandura 1986; Donovan and Radosevich 1999; Kozlowski et al. 2001; May and Kahnweiler
2000; and Salas and Cannon-Bowers 2001) – i.e., people learn by first watching someone else
perform a target behavior and then reenacting it. Every concept taught in the M and M course is
first demonstrated by the instructor. This is first observed and then re-enacted by the students.
Afterwards, there is substantial reinforcement in the forms of various assignments. The case-lets
used in the concept modules and assignments are designed to represent marketing decision
making situations. This seems to enhance the students self efficacy despite the associated
difficulty. In fact, our analyses indicate that as the perception of usefulness associated with
various assignments increase, the student’s self perception of competence or outcome benefits
also increases. However, perceived difficulty seems to have little impact on competence
These findings are interesting for the future of spreadsheet and data-based decision
making within the marketing context. In order for marketing to become a force in the board
room, it needs to demonstrate greater accountability, especially financial and quantitative
accountability (Baker and Holt 2004; Ambler 2003; Doyle 2000; and Simms 2003). Courses like
M and M, therefore, become crucial for inculcating such an orientation among future managers,
i.e., our current students. Some of the students may indeed be a bit scared of anything
quantitative and may find assignments and concepts that lean towards quantitative skills a bit too
difficult. However, if the usefulness of such assignments and concepts are apparent, then
students may be able to at least partially overcome their phobia, resulting in higher levels of
competence or self –efficacy. The behavioral model of learning (Bandura 1986) offers some
guidance as to how one could enhance learning (Yi and Davis 2003), especially when it involves
15
using databases and spreadsheets to make marketing decisions. The process outlined in the M
and M course could form a basis for successful future educational and training programs that
inculcate an accountability mind set among marketing and other managers using a spreadsheet
platform. This would be really valuable for the industry since the process used in the M and M
course is theoretically rooted and seems to work. Our study also indicates that it is possible to
inculcate an accountability mind set among marketing students and managers using the
spreadsheet as a platform and the behavioral model of learning may be a way of making such
training and education programs more effective. The findings suggest that the key is to make the
assignments and concept modules relevant and useful, and not compromise on the rigor or the
difficulty associated with them.
Limitation and Implications:
The main limitation is that this investigation is not based on an experiment. We did not
investigate the effect of a controlled manipulation on student learning. We simply describe a
course that relies on spreadsheet to impart a marketing accountability mindset and report the
analysis of routinely collected student feedback data. The course content, its implementation and
the feedback instrument have all continuously evolved since 1999 and were not custom created
for this study. Self efficacy is captured by a single item measure of ease or difficulty of use
[based on assertion by both Davis (1989) and Venkatesh and Davis (1996) that perceived ease of
use is similar to self efficacy]. Therefore, what we have presented here are correlational findings
rather than cause and effect relationships. We advocate using established multi-scale measure
(e.g., Compeau, D. R. and C. A. Higgins 1995; Ramalingam et al. 2004 and 1998) in future
research efforts. We did not measure the level of the students’ marketing metric skills before the
16
course and did not investigate the change in these as a result of taking M and M. It is also
acknowledged that the ultimate benefit of any knowledge is accrued in the long term, what we
call “post-training self efficacy” in the paper. We have very little idea of how M and M has
benefited students in the long run, their careers etc, except via limited feedback from the handful
of very positive anecdotal letters. We were somewhat constrained by the fact that the M and M
course is part of the marketing program curriculum and hence does not lend itself easily to
rigorous experimental manipulations and control. Hence it was not possible for us to associate
the performance in exams and assignments with the assessment instrument. We also did not
employ an external measure of competence or efficacy. However, despite these shortcomings,
we believe that this investigation provides a description of a process-based training framework
for imparting spreadsheet skills that would inculcate a marketing accountability mindset among
marketing students. We also believe that the resultant descriptive statistics and the correlation
analysis provide valuable insight into the effectiveness of the spreadsheet based course and an
important finding: usefulness is a key determining factor of effectiveness.
We hope that this investigation forms the impetus for future, more detailed research
efforts that investigate how to inculcate marketing accountability using spreadsheet and data
based analysis platforms. There is a need to incorporate some of the well known learning models
and theories to develop a contingency perspective of imparting spreadsheet-based skills. It is
imperative that we continue to investigate this phenomenon and expand our knowledge base on
how to improve such training and education programs. Otherwise, we would continue to waste a
significant portion of the billions of dollars spent on computer based training (Yi and Davis
2003) as well as risk an opportunity lost due to marketing not making its full contribution due to
a lack of accountability mindset (Baker and Holt 2004).
17
Reference Ajzen, I. and M. Fishbein (1980), Understanding Attitudes and Predicting Social Behavior, Englewood Cliff, NJ: Prentice Hall. Ambler, T. (2000a), “Marketing Metrics,” Business Strategy Review, 11 (2), 59-66. Ambler, T. (2000b), Marketing and the Bottom Line: The New Metrics of Corporate Wealth, Financial times/Prentice Hall, London. Ambler, T. (2003), “Are you a Wimp or a Warrior?” Marketing, 23 October, 22-23. Bagozzi, Richard P. and Pratibha A. Dabholkar (2000), “Discursive Psychology: An Alternative Conceptual Foundation to Means-End Chain Theory,” Psychology and Marketing, 17 (7), 535-586. Baker, Susan, and Sue Holt (2004), “Making Marketers Accountable: A Failure of Marketing Education?” Marketing Intelligence and Planning, 22 (5), 557-567. Bandura, A. (1986), Social Foundations of Thought and Action: A Social Cognition Theory, Prentice-Hall, Englewood Cliffs, NJ. Black, Iain R., Alejandra Efron, Christina Ioannou, and John M. Rose (2005), “Designing and Implementing Internet Questionnaires Using Microsoft Excel,” Australian Marketing Journal, 13 (2), 61-72. Bolt, M. A., L. N. Killough, H. C. Koh (2001), “Testing the Interaction Effects of Task Complexity in Computer Training using the Social Cognitive Model,” Decision Science, 32, 1-20. Colquitt, J. A., J. A. LePine, R. A. Noe (2000), “Toward an Integrative Theory of Training Motivation: A Meta-Analytic Path Analysis of 20 Years of research,” Journal of Applied Psychology, 85, 678-707. Compeau, D. R. and C. A. Higgins (1995), “Application of Social Cognitive Theory to Training for Computer Skills,” Information System Research, 6, 118-143. Davis, F. D. (1989), “Perceived Usefulness, Perceived Ease of Use, and User Acceptance of Information Technology,” MIS Quarterly, 13, 319-340. Davis, F. D. (1993), “User Acceptance of Information technology: System Characteristics, User Perceptions and Behavioral Impacts,” International Journal of Man-Machine Studies, 38, 475-487. Davis, F. D., R. P. Bagozzi, and P.R. Warshaw (1989), “User Acceptance of Computer technology: A Comparison of two Theoretical Models,” Management Science, 35, 982-1003. Dembeck, Jennifer L. and David E. Stout (1997), “Using a Spreadsheet to Solve a Multinational Marketing Problem,” Management Accounting, 78 (7), 33-39. Devlin, Derek, Grete Birtwistle, and Norma Macedo (2003), “Food Retail Positioning Strategy: A Means-End Chain Analysis,” British Food Journal, 105 (9), 653-670.
18
Donovan, J. J. and D. J. Radosevich (1999), “A Meta-Analytic Review of the Distribution of Practice Effect: Now you See It, Now you Don’t,” Journal of Applied Psychology, 84, 795-805. Doyle, P. (2000), “Valuing Marketing’s Contribution,” European Management Journal, 18 (3), 233-245. Fishbein, M. and I. Ajzen, (1975), Belief, Attitude, Intention and Behavior: An Introduction to Theory and Research, Reading, MA: Addison-Wesley. Gist, M. E., B Rosen, and C. Schwoerer (1988), “The Influence of Training Methods and Trainee Age on the Acquisition of Computer Skills,” Personnel Psychology, 41, 255-265. Gist, M. E., C. Schwoerer, and B Rosen, (1989), “Effects of Alternative Training Methods on Self-Efficacy and Performance in Computer Software Training,” Journal of Applied Psychology, 74, 884-891. Graham, R. C and K. D. Frankenburger (2000), “The Contribution of Changes in Advertising Expenditure to Earnings and Market Values,” Journal of Business Research, 50 (2), 149-156. Grossman, Thomas A. (2006), “Integrating Spreadsheet Engineering in a Management Science Course: A Hierarchical Approach,” INFORMS: Transactions on Education, 7 (1), 1-30. Gutman, Jonathan (1982), “A Means-End Chain Model Based on Consumer Categorization Processes,” Journal of Marketing, 46, 60-72. Gutman, Jonathan (1997), “Means-End Chains as Goal Hierarchies,” Psychology and Marketing, 14 (6), 545-560. Gutman, Jonathan and George Miaoulis (2003), “Communicating a Quality Position in Service Delivery: An Application in Higher Education,” Managing Service Quality, 13 (2), 105-111. Hwarng, H. Brian (2001), “A Modern Simulation Course for Business Students,” Interface, 31 (3), 66-75. Johnson, R. D. and G. M. Marakas (2000), “The Role of Behavior Modeling in Computer Skill Acquisition – Toward Refinement of the Model,” Information System Research, 11, 402-417. Jordan, E., L. Lasdon, M. Lenard, J. Moore, S. Powell, and T. Willemain, (1997), “OR/MS and MBAs,” OR/MS Today, 24 (1), 36-41. Kozlowski, S. W. J, S. M. Gully, K. G. Brown, E. Salas, E. M. Smith, E. R. Nason (2001), “Effects of Training Goals and Goal Orientation on Multidimensional Training Outcomes and performance Adaptability,” Organization Behavior Human Decision Process, 85, 1-31. Kraiger, K., J. K. Ford, and E. Salas (1993), “Application of Cognitive, skill-based, and Affective Theories of Learning Outcomes to New Methods of Training Evaluation,” Journal of Applied Psychology, 78, 311-328. Kumar, V., S. N. Ramaswami, R. K. Srivastava (2000), “A Model to Explain Shareholder Returns: Marketing Implications,” Journal of Business Research, 50 (2), 157-168. Locke, E. A. and G. P. Latham (1990), A Theory of Goal Setting and Task Performance, Prentice-Hall, Englewood Cliffs, NJ.

19
Lilien, Gary L., Arvind Rangaswamy, and Timothy Matanovich (1998), “The Age of Marketing Engineering,” Marketing Management, 7 (1), 48-50. Markham, Ina S. and Susan W. Palocksay. (2006), “Scenario Analysis in Spreadsheets with Excel’s Scenarion Tool,” INFORMS: Transactions on Education, 6 (2), 1-12. May, G. L. and W. M. Kahnweiler (2000), “The Effect of Mastery Practice Design on Learning and Transfer in Behavior Modeling Training,” Personnel Psychology, 53, 353-373. McDonald, M., R. Shaw, and C. White (2000), “Light into Marketing’s Black Hole,” Marketing Business. McDonald, M. (2006), “Let us Drop, Once and for all, the Nonsense about Marketing Return on Investment,” Journal of Medical Marketing, 5 (3), 256-280. Moorman, Christine and Ronald Rust (1999), “The Role of Marketing,” Journal of Marketing, 63 (Special Issue), 180-197. Palocksay, Susan W. and Ina S. Markham (2002), Teaching Spreadsheet-Based Decision Support Systems with Visual Basic for Applications,” Information Technology, Learning, and Performance Journal, 20 (1), 27-35. Papageorgiou, J. C. (1996), “Are we Promoting OR/MS to Our Future Clients?” International Journal of Operations and Quantitative Management, 2 (3), 231-238. Pieters, Rik, Günther Bottschen and Eva Thelen (1998), “Customer Desire Expectations about Service Employees: An Analysis of Hierarchical Relations,” Psychology and Marketing, 15 (8), 755-773. Ramalingam V. and Wiedenbeck S. (1998), “Development and validation of scores on a computer programming self-efficacy scale and group analyses of novice programmer self-efficacy,” Journal of Educational Computing Research, 19 (4), 365--379. Ramalingam, V., D. Labelle, and Wiedenbeck S. (2004), “Self Efficacy and Mental Models in Learning to Program,” Proceedings of the 9th annual SIGCSE conference on Innovation and technology in computer science education, June 28-30, 171-175. Salas, E. and J. A. Cannon-Bowers (2001), “The Science of Training: A Decade of progress,” Annual Review of Psychology, 52, 471-499. Shaw, R. and L. Mazur (1997), “Marketing Accountability: Improving Business Performance,” FT Management Report, FT Retail and Consumer Publishing, London. Seth, J. N., and R. S. Sisodia (2002), Marketing Productivity, Issues and Analysis,” Journal of Business Research, 55, 349-362. Simms, J. (2003), “How to Drive Business Success…and Your Own career,” Marketing, 18 September, 22-23. Simon, S., V. Grover, J. Teng, K. Whitecomb (1996), “The relationship of Information System Training Methods and Cognitive Ability to End-User Satisfaction, Comprehension, and Skill Transfer: A Longitudinal Field Study,” Information System Research, 7, 466-490.

20
Simon, S. and J. Werner (1996), “Computer Training Through Behavior Modeling, Self-Paced and Instructional approach: A Field Experiment,” Journal of Applied Psychology, 81, 648-659. Sosin, Kim, Betty J. Blecha, Rajshree Agarwal, Robin L. Bartlett, and Joseph I. Daniel (2004), “Efficiency in the Use of Technology in Economic Education: Some Preliminary Results,” The American Economics Review, 94 (2), 253-258. Stajkovic, A. D. and F. Luthans (1998), “Self-Efficacy and Work-Related Performance: A Meta Analysis,” Psychological Bulletin, 124, 240-261. Thomas, Michael J. (2000), “Marketing Performance Measurement: Directions for Development,” Journal of Targeting, Measurement and Analysis for marketing, 9 (1), 70-91. Venkatesh, Viswanath and Fred D. Davis (1996), “A Model of the Antecedents of Perceived Ease of Use: Development and Test,” Decision Science, 27 (3), 451-481. Yi, Mun Y., and Fred D. Davis (2003), “Developing and Validating an Observational Learning Model of Computer Software Training and Skill Acquisition,” Information Systems Research, 14 (2), 146-169. Zinkhan, G. M. and J. A. Verbrugge (2000a), “Introduction to the Special Issue on the Marketing/Finance Interface,” Journal of Business Research, 50 (2), 139-142. Zinkhan, G. M. and J. A. Verbrugge (2000b), “The Marketing and Finance Interface: Two Divergent and Complimentary Views of the Firm,” Journal of Business Research, 50 (2), 143-148.
21
Figure 1 Perceived Usefulness and the Difficulty of Various Graded Assignments
0.00
1.00
2.00
3.00
4.00
5.00
6.00
7.00
8.00
9.00
ExcelHW 1
ExcelHW 2
CC1 CC2 ExcelHW 3
Bonus-DMU
MTExam
UsefulnessDifficulty
Figure 2 Perceived Usefulness and Difficulty of Content Modules
0.001.002.003.004.005.006.007.008.009.00
M-01
M-02
M-03
M-04
M-05
M-06
M-07
M-08
M-09
M-10
M-H
ow to
-01
M-H
ow to
-02
UsefulDifficulty
Measurement Items: 1. Please rate the USEFULNESS (in terms of its learning value) of EACH Graded Assignment or Topic Module on a 1 (very low) to a 10 (very high) scale. 2. Please rate the DIFFICULTY (in terms of understanding and doing it) of EACH Graded Assignment or Topic Module on a 1 (very low) to a 10 (very high) scale.
22
Figure 3 Trends in Self Reported Competence Scores
5.00
5.50
6.00
6.50
7.00
7.50
8.00
8.50
Spring-04 Summer-04 Fall-04 Spring-05 Summer-05 Fall-05 Spring-06A01 A02 A04 A05 A06 A07 A08 A09
Measurement scale Items for assessing outcome benefits or competence: A01 M&M taught me various tools useful for Marketing decision making (β = -0.118). A02 M&M improved my ability to approach an analytical problem methodically, step by step (β = -0.180). A04 After taking M&M, I feel more confident about using basic math and arithmetic in a Marketing decision making context (β = -0.147). A05 After taking M&M, I feel more confident about "working the case numbers" in future classes (β = -0.128). A06 After taking M&M, I feel more confident about my preparation for job interviews (β = -0.139). A07 After taking M&M, I feel more confident about using spreadsheets in my job, career etc. (β = -0.128). A08 After taking M&M, I feel more confident about using presentation software in my job, career etc. (β = -0.140). A09 I expect that the skills I learned in M&M would be useful in my future life, in general, as well (β = -0.174). • Cronbach’s Alpha score for these eight item scale was 0.942 for the entire data set (low of 0.908 and a high of
0.961). • Responses to these course assessment questions were measured on a semantic differential scale anchored
between 1 (Strongly Disagree) and 10 (Strongly Agree).

23
Table 1 Correlations between Self Reported Competence Scores and Usefulness and Difficulty Associated with Various Assignments
R Mean SD N R Mean SD N competence 1.00 7.12 1.93 624 competence 1.00 7.12 1.93 624q09 “Usefulness: Excel HW 1” 0.51 7.84 1.94 617 Q14d “Difficulty: Excel HW 1” 0.16 5.72 2.36 215q13 “Usefulness: Excel HW 2” 0.55 7.75 1.95 611 Q14h “Difficulty: Excel HW 2” 0.12 6.04 2.05 214q11 “Usefulness: CC1” 0.51 7.83 2.05 609 Q14f “Difficulty: CC1” 0.13 6.52 2.18 212q12 “Usefulness: CC2” 0.43 7.43 2.26 609 Q14g “Difficulty: CC2” 0.04 5.83 2.56 213Q13a Usefulness: Excel HW 3 0.54 7.38 2.17 115 q14h1 “Difficulty: Excel HW 3” 0.14 6.46 2.11 114q14 “Usefulness: Module 12 (Bonus): DMU” 0.40 6.66 2.59 403 Q14i “Difficulty: Module 12 (Bonus): DMU” 0.08 6.34 2.41 137Q14a “Usefulness: MT Exam” 0.44 5.56 2.61 214 Q14j “Difficulty: MT Exam” 0.14 8.21 2.09 210
Correlation Coefficient figures in bold are not significant at p<0.0.
Table 2 Correlations between Self Reported Competence Scores and Usefulness and Difficulty Associated with 12 Course Content Modules
Variables R Mean SD N Variables R Mean SD N competence 1.00 7.12 1.93 624 competence 1.00 7.12 1.93 624q25 “Usefulness: Module 01” 0.47 7.55 2.07 616 q39 “Difficulty: Module 01” 0.00 4.31 2.42 617q26 “Usefulness: Module 02” 0.48 7.26 2.15 590 q40 “Difficulty: Module 02” -0.02 4.44 2.31 594q27 “Usefulness: Module 03” 0.57 7.90 2.05 615 q41 “Difficulty: Module 03” 0.03 5.47 2.29 618q28 “Usefulness: Module 04” 0.58 7.88 1.93 615 q42 “Difficulty: Module 04” -0.01 5.34 2.26 617q31 “Usefulness: Module 05” 0.54 7.36 1.96 614 q45 “Difficulty: Module 05” 0.03 5.15 2.14 612q32 “Usefulness: Module 06” 0.56 7.44 1.91 614 q46 “Difficulty: Module 06” 0.03 5.20 2.11 612q33 “Usefulness: Module 07” 0.56 7.44 1.95 613 q47 “Difficulty: Module 07” 0.01 5.27 2.17 610q34 “Usefulness: Module 08” 0.56 7.42 1.96 615 q48 “Difficulty: Module 08” 0.02 5.32 2.18 610q35 “Usefulness: Module 09” 0.54 7.40 2.10 611 q49 “Difficulty: Module 09” -0.01 5.65 2.24 607q36 “Usefulness: Module 10” 0.47 6.87 2.32 474 q50 “Difficulty: Module 10” 0.03 5.77 2.39 481q29 “Usefulness: Module-How to-01” 0.53 7.45 2.26 613 q43 “Difficulty: Module-How to-01” 0.08 5.04 2.52 615q30 “Usefulness: Module-How to-02” 0.45 7.23 2.36 614 q44 “Difficulty: Module-How to-02” 0.08 4.44 2.52 613
Correlation Coefficient figures in bold are not significant at p<0.0.
24
Exhibit 1: A Detailed Description of the 12 Modules
Module # Module Name and Objective Detailed Description/Topics Covered List of Cases M01 74 slides
Percentages and Weighted Average Objective: Quick remedial to improve understanding
Remedial work to improve interpretation of percentages; Calculation and application of simple trend; Correct understanding of how to calculate a Weighted Average
Fit-It Corporation; Positron Inc Tota Inc; Swaaguth Inc Professor Stingy Two of these become part of Excel Homework 1 (5 cases)
M02 61 slides
Balance Sheet and Income Statement Objective: Basic understanding of Balance Sheet and Income Statement and their relevance to Marketing
Basics of Balance Sheet and Income Statement; Calculating Cost of Goods Sold for channel intermediaries and manufacturers, pro-forma income statement, Calculating and using index numbers and ratios from a balance sheet, income statement and both
Consumer Products Company Bountiful Bakery Company Aaron Enterprises Inc; Stoneham Auto Supplies Lone Star Manufacturing Co Clear Voice Inc Three of these become part of Excel Homework 1 (5 cases)
M03 60 slides
Channel Markups Objective: Correct interpretation of markup information in calculating channel prices
Channel Markups, Markup in a multi-level channel, Expressing, applying and converting markup information, markup chain, markdowns Using markup in pricing a product
Lone Star Lamp Company; Krispy Kreme Company Western Boot Company #1; #2; and #3 Baby Magic Inc Two of these become part of Excel Homework 2 (5 cases)
M04 96 slides
Contribution Analysis and the Breakeven point Objective: Comprehensive understanding of the breakeven point in marketing contexts
Variable Costs, Fixed Costs, Sunk costs, $ Contribution and % Contribution, Alternative ways of calculating breakeven units and dollars, Profitability and breakeven point, Different ways of handling profit objective in breakeven analysis: $ profit, % profit/sales, %ROI, % increase in last year’s $ profit, calculating breakeven market share % in units and dollars, incremental breakeven analysis, charting breakeven analysis, relationship between contribution analysis and the income statement
Widgets Inc Bountiful Bakery Metro Manufacturing Co Texas Bearing Company Remington Groomers Galaxy Music Athens Nurseries Three of these become part of Excel Homework 2 (5 cases)

25
Exhibit 1: A Detailed Description of the 12 Modules (Continue..)
Module # Module Name and Objective Detailed Description/Topics Covered List of Cases M05: Product Objective: Learn analyses typically encountered and necessary in introducing a new product
Breakeven, incremental breakeven, profitability Analysis and scenario analysis for alternative assumptions for a new product, Cannibalization analysis
Alamo Manufacturing Co Apfel’s I-Tunes; Wipra Inc Great Lakes Inc Hannibal Inc.; Turfex Inc One of these becomes part of Excel Homework 3
M05M06 65 slides
M06: Promotion Objective: Learn analyses typically encountered in promoting a product
Breakeven, incremental breakeven and profitability analysis in the context of promotional choices, Cannibalization in promotion
Texas Diversified Electronics; Pegasus Inc; Texas Grills Inc; Major League Baseball India; BFV-10 Valves; Finn Fones Inc; Baja Foods inc; Gulf States Petroleum Co; La Siesta Inns One of these becomes part of Excel Homework 3 (5 cases)
M07: Price Objective: Learn analyses typically encountered and necessary in pricing a product
Pricing a product, Markup pricing, Target pricing, perceived value pricing Elasticity of demand
Lone Star lamp Co; Printo Printers John and Jim Bagel Shop Shaaka For Life One of these becomes part of Excel Homework 3 (5 cases)
M07M08 60 slides
M08: Place Objective: Learn analyses typically encountered and necessary in planning a channel of distribution or changing an existing channel of distribution
Placing products: choosing among alternative new channels of distribution by calculating and comparing the distribution costs of each and/or by comparing these to present costs.
Palatial Tiles Inc This becomes part of Excel Homework 3 (5 cases)
M09 62 slides
Net Present Value Objective: Basic understanding of the NPV concept in marketing contexts
Simple Interest vs. Compound Interest, Present and Future Value, Net Present Value, Cost of Capital, Payback Period, IRR
Project A vs. Project B Project X vs. Project Y Project M vs. Project N Widgets Inc; GGK Corporation One of these becomes part of Excel Homework 3 (5 cases)

26
Exhibit 1: A Detailed Description of the 12 Modules (Continue..)
Module # Module Name and Objective Detailed Description/Topics Covered List of Cases M10 66 slides
Decision Making under Uncertainty Objective: Basic understanding of how to handle uncertainty in marketing contexts
The Environment of Decision Making, Alternatives vs. Uncertainties, Decision Trees and Probability Tables, Simplifying Decision Trees, value of Perfect Information, Value of Imperfect Information
Tasty Bites Inc. This module was optional and the TBI case could be completed for bonus points
M-How to-01 54 slides
Designing an Excel Workbook Objective: Prepare a workbook from scratch for a case on paper
Design the Inputs section, Outputs section, then solve the workbook, format the cells, format for printing, and print the numeric as well as formula worksheets to look very professional. Also, learn how to print the completed worksheets to Adobe PDF.
South Texas Seafood Company Gulf Coast Publishing Company plus Graded Assignment: Comprehensive Case 1
M-How to-02 55 slides
Designing a PowerPoint presentation Objective: Prepare a presentation from scratch for a case that has been already solved using Excel
Create the basic chart shapes in the completed CC1.xls, import them into PowerPoint, add all bells and whistles, print handouts of the slides without and with the fancy background. Also, learn how to print the completed presentation to Adobe PDF.
South Texas Seafood Company Gulf Coast Publishing Company plus Graded Assignment: Comprehensive Case 2
27
Exhibit 2a: A Typical Case-let
TEXAS BEARING COMPANY (this is available to students)
This case-let is a somewhat modified version of original course materials developed and kindly permitted for use in this class by Prof. Sam Gillespi.
Texas Bearing Company (TBC) is a small manufacturer of precision machine bearings. Typical of the many different sizes that TBC manufactures is the 3 inch carbon steel cone bearing. TBC sells this to wholesale industrial distributors for resale to retailers of replacement parts. The retailers finally sell the bearing to industrial end-user customers, typically at a retail price of $32.00. TBC estimates that the labor and materials used to make a bearing runs about $9.48. Additionally, $13,650 is required to setup the production run, regardless of the number of bearings produced. TBC's marketing program is fairly lean: two fields sales representatives who call on the industrial distributors referred to above. Each salesperson receives a salary of $36,000 and travel support of $9,000. Each sales representative also receives a 5% commission for every bearing sales to a distributor account. TBC’s advertising and sales promotion efforts total $6,000. Retailers average about 40 % markup based on their selling price to industrial customers, while the industrial distributor’s markup 33 % on the price paid to TBC for the bearings. Finally, TBC expects a minimum contribution to margin (i.e. CTM or profits) of $37,000 from its operations. Questions: 1. What is the selling price of a bearing at each stage in the channel? That is selling price of
the retailer, the wholesaler, the manufacturer (TBC). 2. Calculate, if necessary, then itemize, total and show TBC’s variable costs per bearing. 3. Calculate TBC’s $C (i.e., UVCM) and %C (i.e. PVCM) per bearing. 4. Itemize and then total TBC’s Total Direct Fixed Costs, without the profit objective. 5. What is TBC’s Breakeven (RLS) point in units and dollars, without the profit objective? 6. What is TBC’s Total Direct Fixed Costs, with the profit objective? 7. What is TBC’s Breakeven (RLS) point in units and dollars, with the profit objective?
28
Exhibit 2b: Excel Template for a Typical Case-let (this is available to students)
123456789
10111213141516171819202122232425262728293031323334353637383940414243444546474849505152535455565758596061626364656667
A B C D E F GTexas Bearing CompanyIllustration of breakeven analysis without and with profitworksheet created by: Dr. Gopala Ganesh, UNT, Denton, Texas
INPUTS SECTION
Information on Prices and Margins :
Retail Price of a typical TBC Bearing ?Average retailer % markup on selling price ?Wholesale % distributor markup on cost ?
Information on Variable Costs :
Labor and Material Cost of Each Bearing ?Sales Representative Commission % ?
Information on Fixed Costs:
Production Setup ?Salesperson Salary ?Salesperson Travel Support ?Cost of Advertising and Sales Promotion ?
Information : Profit Goal
Expected Contribution to Margin ?
Information : Other
Number of Field Sales Representatives ?
OUTPUTS SECTION
Q1Retailer's selling price per bearing cRetailer's cost price per bearing cWholesaler selling price per bearing cWholesaler Cost cHence, TBC (manufacturer) selling price per bearing c
Q2Labor and material per bearing cCommission per bearing cHence, unit variable cost per bearing or UVC c
Q3Therefore $C or UVCM per bearing cand %C or PVCM per bearing c
Q4Production run setup cSalesforce salary cSalesforce travel cAdvertising and promotion cTotal Direct Fixed Costs without profit objective c
Q5# BEP, without profit objective, rounded up c$ BEP, without profit objective c
Q6Total Direct Fixed costs, with profit objective c
Q7# RLS, with profit objective, rounded up c$ RLS, with profit objective c
29
Exhibit 2c: Excel Solution Sheet for a Typical Case-let (this is available to students)
123456789
10111213141516171819202122232425262728293031323334353637383940414243444546474849505152535455565758596061626364656667
A B C D E F GTexas Bearing CompanyIllustration of breakeven analysis without and with profitworksheet created by: Dr. Gopala Ganesh, UNT, Denton, Texas
INPUTS SECTION
Information on Prices and Margins :
Retail Price of a typical TBC Bearing 32.00$ Average retailer % markup on selling price 40.00%Wholesale % distributor markup on cost 33.00%
Information on Variable Costs :
Labor and Material Cost of Each Bearing 9.48$ Sales Representative Commission % 5.00%
Information on Fixed Costs:
Production Setup 13,650.00$ Salesperson Salary 36,000.00$ Salesperson Travel Support 9,000.00$ Cost of Advertising and Sales Promotion 6,000.00$
Information : Profit Goal
Expected Contribution to Margin 37,000.00$
Information : Other
Number of Field Sales Representatives 2
OUTPUTS SECTION
Q1Retailer's selling price per bearing 32.00$ Retailer's cost price per bearing 19.20$ Wholesaler selling price per bearing 19.20$ Wholesaler Cost 14.44$ Hence, TBC (manufacturer) selling price per bearing 14.44$
Q2Labor and material per bearing 9.48$ Commission per bearing 0.72$ Hence, unit variable cost per bearing or UVC 10.20$
Q3Therefore $C or UVCM per bearing 4.23$ and %C or PVCM per bearing 29.33%
Q4Production run setup 13,650.00$ Salesforce salary 72,000.00$ Salesforce travel 18,000.00$ Advertising and promotion 6,000.00$ Total Direct Fixed Costs without profit objective 109,650.00$
Q5# BEP, without profit objective, rounded up 25,896 $ BEP, without profit objective 373,836.99$
Q6Total Direct Fixed costs, with profit objective 146,650.00$
Q7# RLS, with profit objective, rounded up 34,634 $ RLS, with profit objective 499,979.55$

30
Exhibit 2d: Excel Formula Sheet for a Typical Case-let (this is NOT available to students)
12345678910111213141516171819202122232425262728293031323334353637383940414243444546474849505152535455565758596061626364656667
A GTexas Bearing CompanyIllustration of breakeven analysis without and with profitworksheet created by: Dr. Gopala Ganesh, UNT, Denton, Texas
INPUTS SECTION
Information on Prices and Margins :
Retail Price of a typical TBC Bearing 32Average retailer % markup on selling price 0.4Wholesale % distributor markup on cost 0.33
Information on Variable Costs :
Labor and Material Cost of Each Bearing 9.48Sales Representative Commission % 0.05
Information on Fixed Costs:
Production Setup 13650Salesperson Salary 36000Salesperson Travel Support 9000Cost of Advertising and Sales Promotion 6000
Information : Profit Goal
Expected Contribution to Margin 37000
Information : Other
Number of Field Sales Representatives 2
OUTPUTS SECTION
Q1Retailer's selling price per bearing =G9Retailer's cost price per bearing =G36*(1-G10)Wholesaler selling price per bearing =G37Wholesaler Cost =G38/(1+G11)Hence, TBC (manufacturer) selling price per bearing =G39
Q2Labor and material per bearing =G15Commission per bearing =G16*G40Hence, unit variable cost per bearing or UVC =SUM(G43:G44)
Q3Therefore $C or UVCM per bearing =G40-G45and %C or PVCM per bearing =G48/G40
Q4Production run setup =G20Salesforce salary =G21*G31Salesforce travel =G22*G31Advertising and promotion =G23Total Direct Fixed Costs without profit objective =SUM(G52:G55)
Q5# BEP, without profit objective, rounded up =ROUNDUP(G56/G48,0)$ BEP, without profit objective =G59*G40
Q6Total Direct Fixed costs, with profit objective =G56+G27
Q7# RLS, with profit objective, rounded up =ROUNDUP(G63/G48,0)$ RLS, with profit objective =G66*G40