Embed Size (px)
Citation preview
Teaching primary school children about probability
Teacher Handbook
Project team
Peter Bryant, Terezinha Nunes
Deborah Evans, Laura Gottardis and Maria-Emmanouela Terlektsi
Department of Education, University of Oxford
With the participation of
New Hinksey Church of England Primary School
St. Andrew’s Church of England Primary School
St Nicholas Primary School
St Swithun’s Church of England Primary School
A project supported by the Nuffield Foundation
2
Table of contents
A research briefing and introduction to the teaching programme .................................... 3
General principles used during the Probability intervention ........................................... 13
The programme of activities ............................................................................................. 14
Unit 1: Randomness ......................................................................................................... 16
Session 1 ........................................................................................................................... 16
Session 2 ........................................................................................................................... 21
Session 3 ........................................................................................................................... 23
Session 4 ........................................................................................................................... 26
Session 5 ........................................................................................................................... 30
Unit 2: Sample Space........................................................................................................ 34
Session 1 ........................................................................................................................... 34
Session 2 ........................................................................................................................... 37
Session 3 ........................................................................................................................... 42
Session 4 ........................................................................................................................... 48
Session 5: .......................................................................................................................... 53
Unit 3: Quantification ...................................................................................................... 54
Session 1 ........................................................................................................................... 54
Session 2 ........................................................................................................................... 57
Session 3 ........................................................................................................................... 62
Session 4: .......................................................................................................................... 64
Session 5: .......................................................................................................................... 68
Appendix A ...................................................................................................................... 69
Appendix B ...................................................................................................................... 70
Teaching primary school children about probability
A research briefing and introduction to the teaching programme
1. Why introduce probabilistic reasoning in primary school
Many of the events and relations in people’s lives are well understood and entirely
predictable. If we knock a glass over, the liquid in it spills. If John is Michael’s father,
John must be older than Michael. But many events are not as predictable or certain.
They may happen randomly: winning a lottery is one example. But even events that do
not happen randomly may be less predictable than spilling water when you knock a
glass over: if you go on a diet, you are likely to lose weight but the amount of weight
you lose over time is not entirely predictable.
Although some kinds of event are not determined, we can still reason about them
logically. This reasoning allows us to work out the probability of particular outcomes,
and thus to understand the risks and the possible benefits of acting in one way rather
than another. This is one reason why understanding probability is considered a very
important aspect of education in citizenship as well as in science. Understanding
probabilities is also at the heart of statistical education, an important theme in
mathematics education.
Despite the central importance of randomness and probability in all our lives, it is
clear that children and many adults as well, often have great difficulty in thinking about
probability rationally and in quantifying probability. In fact, some people believe that
thinking logically is incompatible with randomness; as a child said to us, “if this weren’t
4
maths, I’d think it is just about luck”. This general difficulty with probabilistic reasoning
was the motivation for the development of a teaching programme to promote
children’s understanding of probability at a level compatible with the children’s
cognitive development in primary school.
2. The ideas that underpin the understanding of probability
Understanding probability is so challenging because it involves the coordination of
three different and difficult concepts.
a. One is the concept of randomness. Random events have certain features: they are
not predictable; in a series of random events, there is no pattern and the events are
independent of each other; but over a large number of events, it is possible to think
mathematically about the probabilities of each of the possible events. For example, if
you throw a coin in the air, you can’t predict whether you will get heads or tails. If you
throw it three times and happen to get three heads, this does not tell you what will
happen when you throw the coin in the air again, because the events are independent.
But if you throw the coin in the air a large enough number of times, you are likely to get
about as many heads as tails.
The teaching programme that we designed helps children think about these features
of random events. In order to think about the unpredictability of random events, the
children engage in contrasting games in which the outcomes are predictable with others
in which they are not. For example, they have the opportunity to play Happy Families
when the cards have been shuffled and also when they have not been shuffled, and are
5
in a predictable order. This experience allows the children to discuss processes that can
be used to randomise events.
They also play computer games in which they make a prediction and test its
correctness; in some games, they can discover a pattern in the sequence of events and
in others there is no overall pattern, although they might on small sequences of events
have the impression that they have discovered a pattern. This allows them to think
about the fact that local patterns, on a small number of trials, but which do not apply to
a larger number can happen even in random sequences. In order to promote their
thinking about the independence of events further, they are also asked to discuss
different sequences of heads and tails and attempt to identify random versus non-
random sequences.
Finally, in order to recognise the possibility of thinking logically about random
events, the children observe what happens over a larger series of events and attempt to
describe the frequencies of the possible events. Over the course of these discussions,
they are invited to think about the difference between possible and impossible,
probable and improbable events. They are also invited to make connections with their
experiences of the use of randomisation outside the classroom in order to make games
fair, and identify practices that look fair but are actually not randomisation procedures.
b. The second concept is sample space. This is the technical term for all the
outcomes that are possible in a particular context. For example, if two babies are born
one night in a hospital’s maternity wing, there are four possible ways in which this could
6
happen and thus the sample space consists of four possible outcomes: (1) both babies
are girls (2) both are boys (3) the first baby born is a girl and the second a boy, or (4) the
first is a boy and the second a girl. Defining the sample space is crucial to probabilistic
thinking because the sample space characterises what is possible and what is not
possible, and how often each event appears in the sample space. A sample space may
be very simple: if you throw one die, there are only six possible outcomes. However,
sample spaces are usually more complex than this: if you throw two dice, the number of
possible outcomes – the sample space – increases to 36 possible sequences. If you add
the two numbers in each of the 36 pairs, you will see that the totals vary from 2 to 12,
and you will also find that some totals are more frequent than others: only one of the
pairs (1,1) produces the lowest total – 2, but the numbers in three different pairs
(1,3: 2,2: 3,1) add up to 4.
In this last problem, working out the sample space means more than just counting
up the number of possible outcomes. It also means organising these outcomes into
categories: how many possible pairs add up to 2? How many add up to 5? The technical
term used for categorising the sample space is ‘aggregation’, and we shall be using this
term throughout the handbook.
Identifying all the combinations of a number of possible events, such as the result of
throwing two dice at the same time, is not simple for primary school children, but
research shows that they find it easier to understand the systematic combinations of
features to define an object. In this teaching programme, the work that leads to
understanding sample space starts from understanding how two features can be
7
combined to define different objects: for example, if you combine two colours, silver
and black, with two makes of car, Mini and Audi, you can have a silver Mini, a silver
Audi, a black Mini and a black Audi. Children can get this idea quite easily, particularly
when the features are presented in tables and they have to predict what object would
fit in each cell of the table. The programme offers the children lots of practice for
thinking about combination of features in the context of computer work. The children
then move on to more complex combinations of features – such as three features with
three values – and this helps them to realise the need to become systematic. At this
point, they learn about tree diagrams as a solution to the challenge of making
combinations of three features.
Finally, the children use the tree diagram to define and analyse different sorts of
sample space. These activities are carried out in the context of familiar situations
(identifying dance partners and matches in a tournament) as well as in more
mathematical contexts, such as predicting the number of pieces that form a domino set
and identifying the best number to bet on when predicting the total of two dice. The
careful inspection of the sample space in these activities leads them to start thinking
about the third concept that is crucial for understanding probability, the quantification
of probability. In the two dice problem, for example, the children realise that certain
totals (6, 7 and 8) appear more often than others (1 and 6). This is a first step towards
realising that the probability of observing these numbers is higher than the probability
of observing other numbers because the total number of possible events – i.e. the
sample space – is the same.
8
c. The third concept is the quantification of probabilities, using proportional
reasoning when simple frequencies cannot be used because the total number of
possible events in a comparison is not the same. For example, if you need to compare
the probability of drawing a green card in two bags that contain green and white cards,
and the total number of cards in the two bags is not the same, you can’t just consider
the number of green cards in each bag. Research shows that children understand such
comparisons between quantities better if they represent the quantities in ratios. In this
example, if there are 6 green and 3 white cards in one bag and 18 green and 9 white in
the other bag, the children find it easier to compare the ratios of green to white cards –
in this case, 2 to 1 – than to use other mathematical representations, such as fractions
(2/3 green) or percentages (approximately 67% green). The programme starts by
supporting the children’s thinking in terms of ratio using visual comparisons: the
children are encouraged to move the counters or blocks around in order to look for a
simple ratio. They quickly learn to move from these visual to symbolic representations
and use these to make comparisons. Finally, the children have the opportunity to use
the same reasoning working with ratios as well as fractions.
Research suggests that children as well as adults have strong intuitive ideas about
probability, which often interfere with their learning to think about probability
mathematically. On some occasions during the programme, the children are asked to
guess the answer first and then examine the sample space in order to quantify the
probabilities. The aim of contrasting a guess “off the top of their heads” with a
9
considerate analysis is to discourage such guesses, which often lead to inappropriate
conclusions even when the person is in principle able to find the best analytical answer.
3. How our programme was carried out
The programme described here was carried out in 15 lessons of approximately one
hour, which took place over three terms. The first term focused on randomness; the
second on sample space, starting to move on to quantification of probability; the third
and final term focused on the quantification of probability in different contexts.
A researcher worked as teacher for a small group of children (approximately 8)
randomly assigned to this group; another group of children was randomly assigned to a
control group and stayed in the classroom, where the teachers carried out a variety of
activities, including mathematical tasks. A second researcher observed the sessions in
order to take notes about the children’s responses; these notes are used in this
handbook to help teachers who use the programme anticipate what might happen in
their classroom.
Before the programme started, all the children participated in an assessment of
their understanding of probability. At different points during the programme, all the
children participated in further assessments of their understanding of probability, which
helped us monitor their progress. At the end of the programme, they were all assessed
one more time. The first two assessments during the time the programme was being
implemented focused on the understanding of randomness and sample space. The final
assessment focused on sample space and quantification of probability.
10
4. The outcomes of the programme
All the analyses that we have made so far of the effectiveness of our programme
take the same simple pattern. The analyses compared the children who took part in the
programme on probability (the experimental group) with those who did not (the control
groups). We looked at their scores in the assessments given to them just before the
programme began and again after the sessions in which the children in the experimental
group learned about each of the three aspects of probability described in the previous
section. We expected that the two groups would manage roughly equally well in the
first set of assessments, but that after learning about randomness, sample space and
quantitative comparison the children in the experimental group would do better than
the children who did not take part in the programme when the same assessments were
given to all the children later on.
These expectations turned out to be correct, and thus the programme was
successful. In the analysis of the children’s answers to questions about randomness we
looked at two kinds of measure. One was how often they gave us the correct answer to
these questions, and the other was how well they justified their answers. On both
counts the children who took part in the programme made a great deal more progress
than those who did not. The beneficial effects of the programme lasted. The children
who took part in the programme continued to outperform the others in their answers to
questions about randomness in assessments given to them several months after the
part of the programme that dealt with randomness was completed.
11
The organisation of the description in the subsequent sections
The remaining part of this handbook presents somewhat detailed descriptions of
the activities and some samples of the children’s work, with comments about the
challenges and successes experienced by the children. The first section presents general
principles used in the design and carrying out of the activities. The children should be
active the whole time; the teacher’s role in these activities is to explain the activities,
raise questions, make sure that all the children are engaged in solving problems and
have opportunities to explain their answers at some point, and summarise with the
children’s participation what they have accomplished. The teacher plays a major role in
helping the children to become aware of the connections between the activities, to
summarise what they have learned, and to identify ways of solving problems that the
children come up with which other children could learn. This intellectual leadership
from the teacher will be best accomplished if the teacher has given much thought to the
activities and the children’s possible reactions to them. We learned a lot during the
running of the programme each time we ran it and we are confident that the teachers
using these materials will do too. Our attempt to anticipate what might happen in your
class based on our experience will have to be complemented by your observations of
what did happen. We learned that, at the end of each session, it was a good idea to look
at what each child had produced and what seemed to need some revision at the start of
the next session.
12
5. Final words
We hope that this summary of the three main intellectual demands involved in
thinking about probability shows you how interesting this topic is and also how
important it is that everyone is able to think about uncertain events rationally. We
ourselves know now, because of our research, that children as young as 9-years are
genuinely interested in thinking about and discussing probability and that they are able
to learn a great deal about it. In our research we taught children separately about the
three main aspects of probability that we have just described (randomness, sample
space and quantification of probabilities), and we studied how effective this teaching
was. The results were very encouraging, and it seems to us that the children really did
learn some worthwhile and useful concepts very effectively. In the rest of this handbook
we shall be describing how we set about this teaching, and how the methods that we
developed with small groups of children could be adapted to classroom teaching. We
want to find out now whether our teaching programme is also effective when it is
carried out in school classrooms. That is our next step.
We very much hope that you will find the subject of probability as interesting and
important as we ourselves do, and of course we also hope that you will help us in the
next step in our research project by deciding to adopt our teaching programme in your
own school.
13
General principles used during the Probability intervention
Children should always be actively solving problems. Each of them should produce an
answer for every problem. They only discuss the answers after each one has answered
the questions.
Children’s reasoning is always supported either by the use of manipulative objects such
as counters or representational materials, or by the use of drawings and diagrams. The
emphasis is always on the reasoning and not on their calculation abilities.
Discussion is a key element in this project. All children, whether they have made the
right or wrong answers, need regular opportunities to demonstrate their thinking
through discussion with a partner, in a small group or through being part of a class
based discussion.
If children make mistakes, we do not tell them the answer but instead start a
solution with the materials and then see whether they can continue it. Or we can pose
another question to encourage them to think about the problem from a different
starting point.
Most activities are designed to be carried out in pairs after whole class introduction at
the start of a session. In this way, children have regular opportunities to help each other
think through problems and explain their reasoning together before presenting their
solutions in front of the whole group.
Ideas and concepts are introduced through practical activities and in contexts that are
as familiar to children’s experiences as possible; e.g. through card and counter games,
playground rhymes, school meal choices or the possible connection between I-pod
volume and hearing loss. Children may then more readily connect the relevance of
probability to their everyday lives.
14
Teaching primary school children about probability
The programme of activities
Overview
The intervention runs over 15 sessions, and is composed of 3 units: Unit 1: Randomness – 5 taught sessions Unit 2: Sample Space – 5 taught sessions Unit 3: Sample Space and quantification of probabilities – 5 taught sessions Unit 1: Randomness The aim of this unit of work is to increase children’s awareness that it is possible to think logically about random events. The different activities should help children to develop further their understanding of: 1. Unpredictable as opposed to predictable events 2. Random sequence and the lack of patterns over long sequences 3. Independence of events in a random sequence 4. The connection between randomness and fairness when resources are scarce 5. Impossible, improbable and possible events 6. Unpredictable but more or less likely outcomes 7. Law of large numbers
15
Unit 2: Sample Space The aim of this unit of work is to increase children’s awareness of the importance of being systematic in order to generate the sample space and promote their understanding of: 1. Exploring the different events that can happen in a sample space
2. Analysing the composition of sample space 3. Generating objects by combining properties using matrices 4. Experiencing the need to be systematic and the advantages of the tree diagram 5. Using the idea of sample space in varied contexts 6. Aggregation in sample space 7. Sample space and the quantification of probabilities Unit 3: Quantification The aim of this unit of work is to help children connect the notion of sample space with the proportional quantification of probabilities. They are expected to further develop their understanding of: 1. Exploring the role of ratios in comparing probabilities with manipulatives 2. Quantifying and comparing ratios 3. Aggregating cases to describe the probability of events 4. Eliminating cases to describe a sample space 5. Using a 2x2 table to compare probabilities and think about correlations 6. Interpreting ratios in the context of correlations
16
Unit 1: Randomness
Session 1
Aim: to differentiate between unpredictable events and predictable events which have a pattern for what will happen next. To introduce the term ‘random’ and explore its meaning in the context of the activities. Start by asking children whether they know the word random and what it means. The word ‘random’ is now commonly used by children to mean weird, unexpected. Ask the children to give examples of the use of random. Tell them that the word has a specific sense in mathematics and that they are going to learn about it by playing games. Materials:
2 sets of ‘Happy Families’ type cards
Dice
Counters
Child Booklet from printable resources
What to do: 1) Card Game: (Predictable or unpredictable) With whole class
Using two packs of ‘Happy Family’ cards, show the class that pack A is arranged in family sets, e.g. with the 4 cards for the Grocers family on the top and the 4 cards for the teacher family on the bottom of the pack. Then shuffle pack B in front of them several times so they do not know where particular cards are placed.
Ask a series of questions such as: 1.“Which pack do you want to pick from if you want to be sure to get a Grocer family card? What about if you wanted to be sure to pick a Teacher family card? “ 2. “Where do you want to take the card from in the pack? Which pack is more certain than the other? Why” Ask children to make a choice each time and write the reason for their choice, then discuss this with their partner.
Now with pack A, the teacher sorts the cards into 2 piles, females and males, or children and adults, then places one pile on top of the other. With pack B, teacher shuffles the cards. All of this is done so the children can see the shuffling.
Ask a series of questions as before and ask children to record their reasons: 3.“From which pack should you pick a card to be sure to get a female/child? From where in the pack do you want to pick?”
17
Discuss: With the whole class ask children to explain their reasons and develop the discussion about predictability and unpredictability of these packs. “Which of the packs did you choose for question 1, 2 and 3? Why did you choose to make predictions from one pack rather than the other? What word can we use to describe pack A (predictable) and pack B (unpredictable)
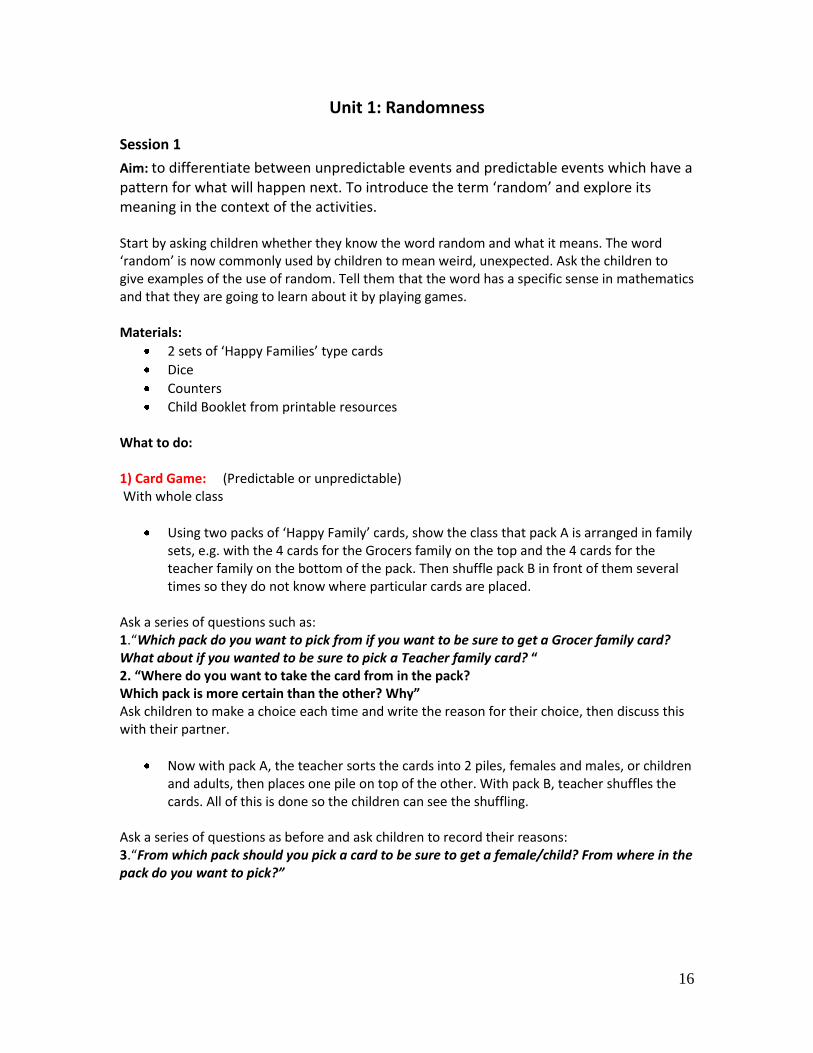
Can you discuss with your partner reasons why cards have to be shuffled at the beginning of many games and then write an explanation for someone younger than you who may not know why?” Discuss how predictability makes this type of game like ‘Happy Families’ unfair, so why shuffling is necessary. The example in Figure 1 shows a good explanation by a boy in Year 5. Not all children are willing or ready to write full sentences. They can be asked to write down the most important information. In the discussion, explanations like if the cards are in order it is easier to predict, or if there is a pattern you know what comes next are picked up because they help the children reflect about the connection between the fact that if the events are in some order they are not independent.
Figure 1: An example of explanation provided by a boy in Year 5
18
Playing the game in groups of 4 Children play a game of ‘Happy families’ with Pack A organised into families (Father, Mother, Son and Daughter) and then with Pack B which is shuffled as normal. (If enough packs of Happy families are not available, ordinary playing cards can be used instead.)
How to play:
The object of the game is to collect all 4 in the family, and complete as many family sets as you can before your cards run out. The winner is the child with the most complete sets of 4 when the game finishes.
All cards are dealt evenly between the 4 children and firstly they look to see if they have any complete sets of 4 which they put aside.
Then the child to the left of the dealer starts the game. The player whose turn it is says to a child e.g. ‘Have you got the father of the Bun family?’ and the other pair has to give them the card or say ‘no’, in which case the turn passes to the next child.
First play the game with pack A With Pack A, the children should be able to predict who has the other cards of the family they want because this pack has been organised into family groups before dealing. The child who has the first turn should be able to win the game and no one else would have a turn. Ask the children to say what happened in this game.
Repeat game with Pack B, which is shuffled and should be unpredictable. Discuss afterwards the differences between the two games. Why was one game easier for some children to win? Although this may seem like going over the same idea too many times (predictable vs unpredictable events, ordered vs. unordered, patterned or without pattern), we noted that some children think that somehow a lucky person can influence what happens even in random events. The connection between being lucky and succeeding in games of chance is strong in our culture and the use of games in this unit aims to challenge this notion. 2) Counters game: (Predictable or unpredictable) The game is played by two children, one against the other. Each child has 2 counters. Each player puts the hands behind their backs, takes one or two counters in the right hand and puts the right hand forward. When both players have done this, the first player makes a call to say whether the total of counters in their two hands will be an odd or an even number. Both children reveal the counters they have chosen to put in their right hands. The player scores if the guess, odd or even, was correct. The other child has a turn next. The children should keep track of their scores over the number of turns. The game continues for 10 calls and the winner is the one who has the most correct predictions. To demonstrate: The teacher is player 1 and a child is player 2. The teacher demonstrates the game with this child to make sure that the children understand how the game is played. The teacher gets the first turn, the child the second turn.
19
The interest of this game is that strictly speaking the result should be unpredictable because no player controls the total. However, some children tend to alternate, put 1 then 2 then 1 then 2 counters in their hands. Other children put an odd number in their hands if the preceding result was even and vice versa. If the other player catches on to this, the total becomes predictable. This offers an interesting opportunity for discussion and the game does not take long to play.
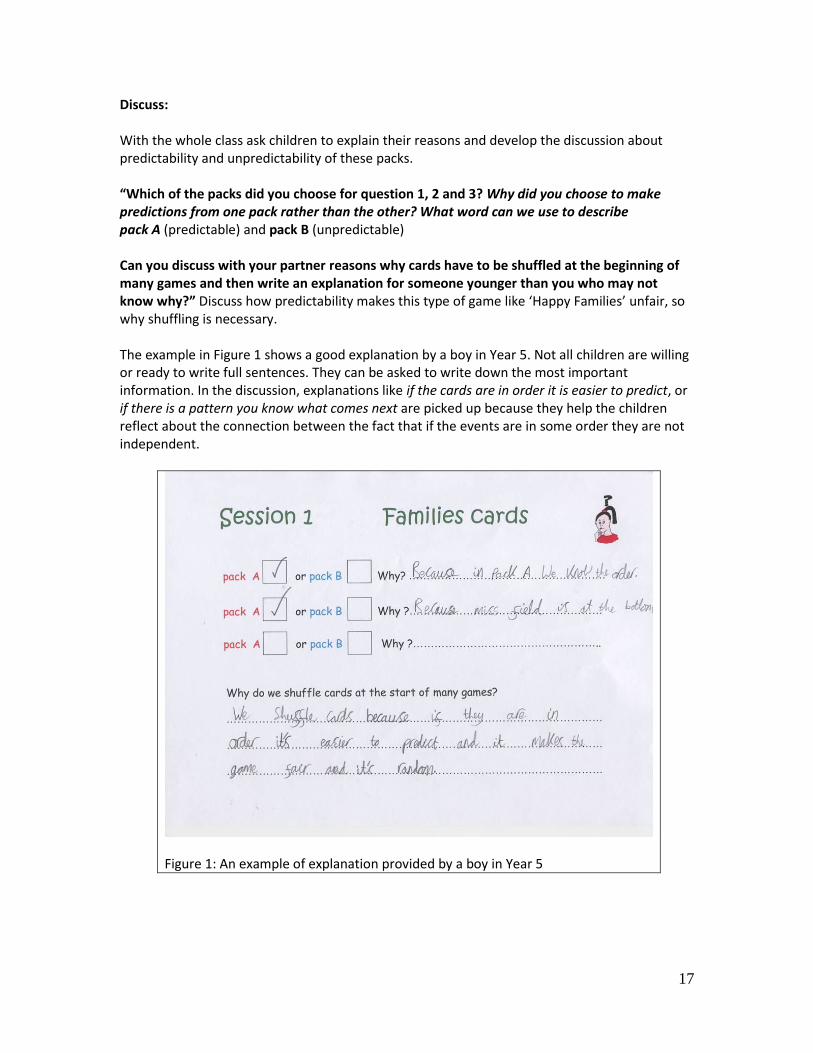
After the game, discuss whether it was predictable or not. Are each player’s chances of winning the same? Was there anything unfair about it? Figure 2 shows the work by a girl in Year 5 who worked with a partner who did not have a pattern in the choices.
Figure 2: Outcome of a game played in pairs in which no one controls the total, so the result is unpredictable. If a child produces tokens in a predictable pattern, the opponent can identify it and win.
3) Starting a game: (Are all ways fair?)
Choosing the starting player by using a rhyme or picking procedure. Ask children to think of some methods that they have used for deciding who starts a game and write down as many as they recall. They should then discuss with their partner whether these different procedures are fair and why. Pairs of children take turns to explain one of their ways to the class group.
Looking at methods which are similar to the rhyme ‘One potato, two potatoes, three potatoes,
20
four. Five potatoes, six potatoes, seven potatoes more.’ The person who is ‘more’ is then out of the next round of picking. Is this fair, or can we predict who will be out each time we say ‘more’? Ask children to try it in groups to see if it is fair or if there is a predictable pattern to the ‘out’. (Always the eighth tap is the one ‘out’ so it can be predicted.) Were any of those which children wrote down predictable like this one? Ask them to try them out.
Choosing the starting player using dice In pairs, children make 24 throws of the dice and record the result each time. Looking at the results in pairs, if a player needed the number 6 to start a game, would this be a fair way to start? Does each player have a fair chance of rolling a 6? Do all numbers have the same chance of coming up? Discuss with partner. Discuss: What is predictable and what is unpredictable? Is rolling dice a fair way of getting a random choice of numbers? Is it unpredictable? Will you have the same chance of throwing a 6 or a 1? Collate frequencies for each number on the board and discuss spread of results. If any mention has been made of blowing on the dice, or rolling it in a certain way to affect the outcome, discuss what people feel about this. Return to this discussion and to the idea of a person being lucky on other occasions when random games are being played. Raise the question of what we mean by ‘random’ in a mathematical sense if it has not been mentioned? (If we cannot be sure which number will come up next on the dice, though we know it must be a number between 1-6, we say that the outcome is random because it is unpredictable exactly which number will be thrown at any one time.) When we play games, how do we ensure fairness? Children write down some rules (e.g. Each player has same number of cards, which must be shuffled, same number of turns?) Discuss their ‘rules’ as a class group. Watch out! 1. Many children seem to use ‘random’ with its current popular meaning of ‘weird’. After the children have completed the activities with the dice and have had the opportunity to make decisions from this experience about what is predictable and unpredictable, the term ‘random’ can be discussed in this context and they can try to explain its meaning in mathematics. 2. Are some of you luckier than others? (Question the assumption) Ask children to keep track in their booklets of who wins the games they play over the next few weeks and see if they change their minds. (Show them where they can record their wins and losses).
21
Session 2
Aim: To identify predictable and random patterns in the computer games. The children can learn from this experience that thinking about sequences of events (in this case, sequences of correct answers) is a useful way of trying to see whether something is random or not. But if a pattern appears to be identified, and then it turns out that it does not apply to the whole series, they need to question the existence of a pattern. Materials:
Computer games (loaded from resources CD) Game 1: (Alphabetical seq. predictable) Game 1b: (Inverse alphabet, seq. predictable) Game 2: (Numbers, random.) Game 3: (ABC random.) Game 4: (Numbers, odd first, then evens small to large seq. predictable) Game 4b: (Numbers, evens first then odds small to large seq. predictable)
Child Booklet
Sheet with correct answers for discussion after games (printable resource from CD and in Appendix A Teacher Handbook.)
What to do: If done as a class in a computer suite, adjacent pairs of children can be given different games to start, so they are not influenced by hearing other children’s reasoning
Two children per computer: the first game can be put on screen for them to ensure they start with a different game from a neighbouring pair, but for subsequent games, children can open the next game themselves if they are confident.
There are 6 different games, each game has 20 plays. Some are concept games in which they can discover the key that will allow them to get the correct answer because there is logic behind it that should help them predict. In other games, there isn’t a key. There is no logic in the sequence, which has been generated randomly by a computer, and so they cannot predict the right answer, even if they get some answers correct.
Children have to enter what they think is the correct answer for the pattern. The correct answer will come up if they are wrong. Each pair must write down in their booklets what the correct answer was after each play, so that they can see if there is any pattern emerging and use this to help them with the next answer. Pairs discuss and write down anything they notice about the sequences. If they decide that this was not a correct idea about the sequence, they should write down why that did not work.
Some pairs may need a little prompting to try out the patterns used in the games. Sometimes the children do not know the alphabetical order well. If you notice that they have the idea that there is a connection to alphabetical order in the letter-sequence games but are making mistakes, they may benefit from a reference sheet for alphabetical order. In the game with digits, they need to use the concept of odd and even number and may need prompting to think about this. But do let them try first: they love to discover the keys by themselves!
22
There is a sheet in the printable resources on the CD with correct answers for all 6 games, which can be used during discussion and on which children can write their reasons for deciding what makes the game predictable or not.
After each pair has played all the games, discuss their answers as a larger group. Using the sheet showing correct answers: during the final discussion all children can try to spot the sequences, even if some children didn’t get to try a particular game.
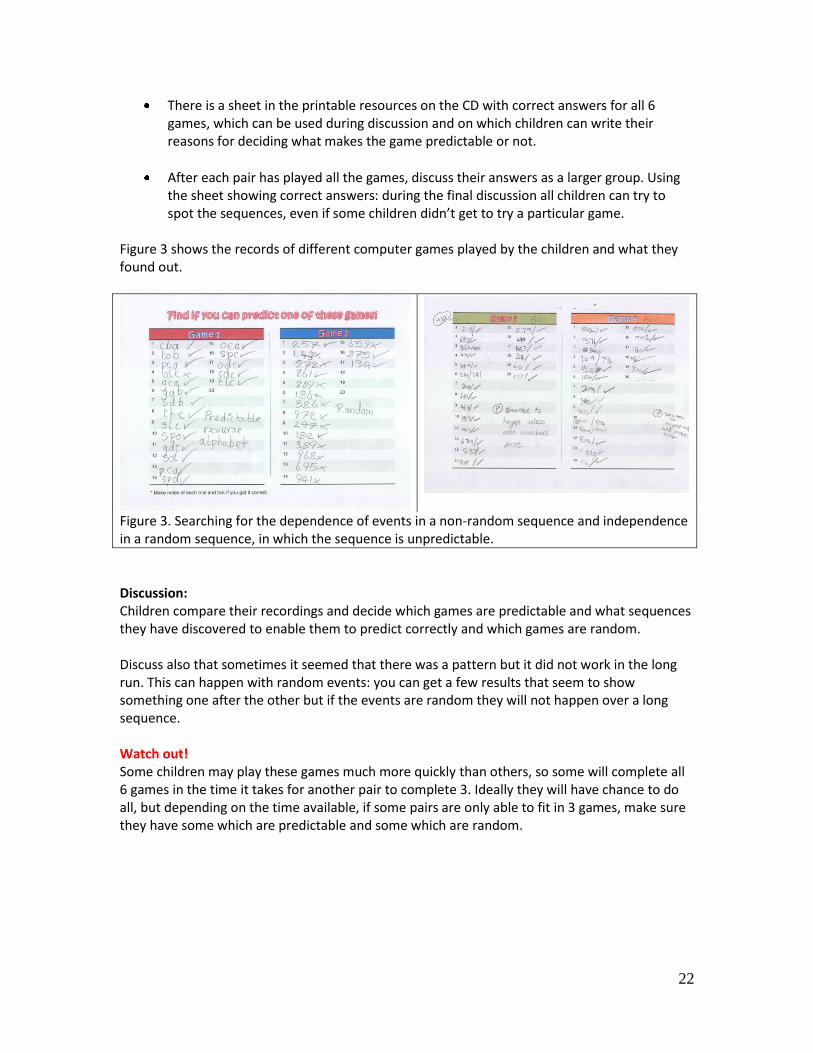
Figure 3 shows the records of different computer games played by the children and what they found out.
Figure 3. Searching for the dependence of events in a non-random sequence and independence in a random sequence, in which the sequence is unpredictable.
Discussion: Children compare their recordings and decide which games are predictable and what sequences they have discovered to enable them to predict correctly and which games are random. Discuss also that sometimes it seemed that there was a pattern but it did not work in the long run. This can happen with random events: you can get a few results that seem to show something one after the other but if the events are random they will not happen over a long sequence. Watch out! Some children may play these games much more quickly than others, so some will complete all 6 games in the time it takes for another pair to complete 3. Ideally they will have chance to do all, but depending on the time available, if some pairs are only able to fit in 3 games, make sure they have some which are predictable and some which are random.
23
Session 3
Aim: To encourage children to question the idea of randomness as entirely associated with a particular apparatus. Dice produce random results only if they are not biased. If a bias is identified, the outcomes cannot be seen as random. In order to identify a bias, a large enough number of throws is necessary as it could happen by chance that one number comes up more often or another less often in a relatively small number of throws. Materials:
Dice (one of which is the ‘loaded’ dice)
Child Booklet
Coins (1 per pair of children) What to do: In order to motivate the children to throw the dice a large number of times, we ask them to guess whether there will be more odds or even numbers when they throw the die 36 times. One child in the pair wins if there were more odds and the other if there were more even numbers and the difference is greater than 5. If the difference is 5 or smaller, it is a tie. Because they will keep falling behind and then overtaking each other in this series of throws, they keep their motivation to continue if they have normal dice. The children with the loaded dice become fascinated with the bias and keep throwing to see how many times the same number comes up. 1) Dice frequencies
Working in pairs, each child in the pair is asked to choose either odd or even numbers. They are then asked to throw the dice 36 times and keep a tally of their throws in their booklets. Then they need to work out the total throws for each number between 1 and 6 and look at the frequencies of odd and even numbers. Did the child with the odd numbers get more or less than the child with the even numbers?
Compare results as a class group. What do they notice? Is there a fair distribution of frequencies for each number between 1 and 6? Did the odd and even numbers have the same chance of being thrown?
The teacher now throws a loaded die, first choosing odd numbers or even (check before- hand which number the die is loaded for and choose the one that will make you win). Tell the children you are very lucky and make a bit of a theatre about your lucky day. Throw a number of times in front of the class (without telling the children it is a loaded die) and react to each time you win as “I am really lucky”. A child records the result of each throw on the whiteboard and so the result is clear to the whole class. As the results start to build, see how the children explain the numbers and how they question the randomness of this die. The teacher will most often throw an odd number (or even, check your die), so will win with a higher frequency of odd numbers, more than any child managed to get, either odd or even.
24
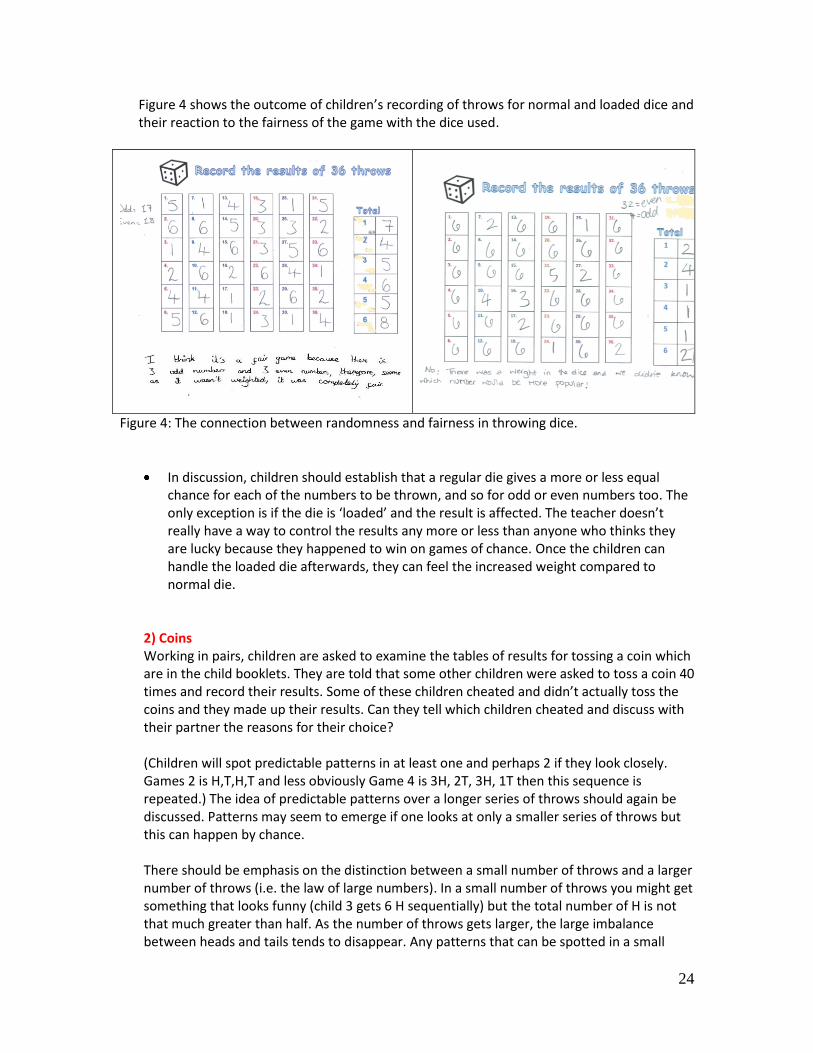
Figure 4 shows the outcome of children’s recording of throws for normal and loaded dice and their reaction to the fairness of the game with the dice used.
Figure 4: The connection between randomness and fairness in throwing dice.
In discussion, children should establish that a regular die gives a more or less equal chance for each of the numbers to be thrown, and so for odd or even numbers too. The only exception is if the die is ‘loaded’ and the result is affected. The teacher doesn’t really have a way to control the results any more or less than anyone who thinks they are lucky because they happened to win on games of chance. Once the children can handle the loaded die afterwards, they can feel the increased weight compared to normal die.
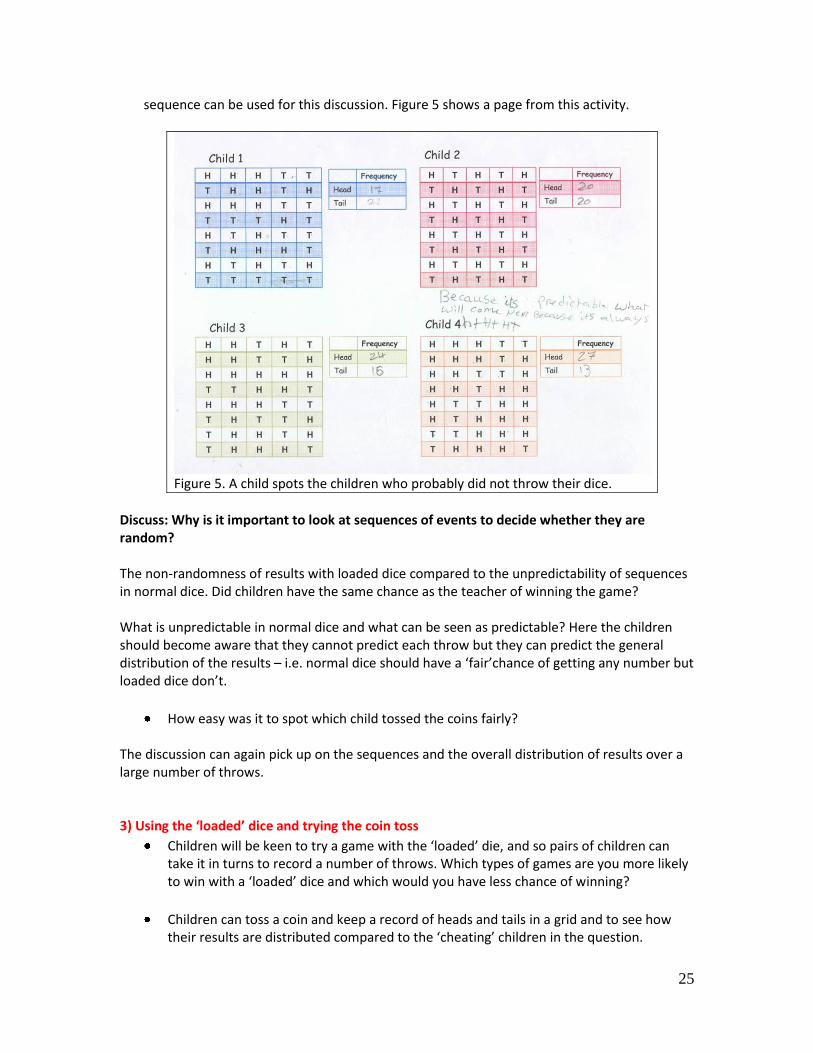
2) Coins Working in pairs, children are asked to examine the tables of results for tossing a coin which are in the child booklets. They are told that some other children were asked to toss a coin 40 times and record their results. Some of these children cheated and didn’t actually toss the coins and they made up their results. Can they tell which children cheated and discuss with their partner the reasons for their choice? (Children will spot predictable patterns in at least one and perhaps 2 if they look closely. Games 2 is H,T,H,T and less obviously Game 4 is 3H, 2T, 3H, 1T then this sequence is repeated.) The idea of predictable patterns over a longer series of throws should again be discussed. Patterns may seem to emerge if one looks at only a smaller series of throws but this can happen by chance. There should be emphasis on the distinction between a small number of throws and a larger number of throws (i.e. the law of large numbers). In a small number of throws you might get something that looks funny (child 3 gets 6 H sequentially) but the total number of H is not that much greater than half. As the number of throws gets larger, the large imbalance between heads and tails tends to disappear. Any patterns that can be spotted in a small
25
sequence can be used for this discussion. Figure 5 shows a page from this activity.
Figure 5. A child spots the children who probably did not throw their dice.
Discuss: Why is it important to look at sequences of events to decide whether they are random? The non-randomness of results with loaded dice compared to the unpredictability of sequences in normal dice. Did children have the same chance as the teacher of winning the game? What is unpredictable in normal dice and what can be seen as predictable? Here the children should become aware that they cannot predict each throw but they can predict the general distribution of the results – i.e. normal dice should have a ‘fair’chance of getting any number but loaded dice don’t.
How easy was it to spot which child tossed the coins fairly? The discussion can again pick up on the sequences and the overall distribution of results over a large number of throws. 3) Using the ‘loaded’ dice and trying the coin toss
Children will be keen to try a game with the ‘loaded’ die, and so pairs of children can take it in turns to record a number of throws. Which types of games are you more likely to win with a ‘loaded’ dice and which would you have less chance of winning?
Children can toss a coin and keep a record of heads and tails in a grid and to see how their results are distributed compared to the ‘cheating’ children in the question.
26
Session 4
Aim: To explore the difference between ‘impossible’ and improbable’ events and to discriminate between games which are ‘possible’ or ‘improbable’ to win and to justify and explain their reasoning. The reason for focusing on this difference is that even adults tend to treat improbable events as impossible and make mistakes that could have been avoided if they had considered something that is improbable as possible. Materials:
3 sheets of impossible/improbable sentences (printed resource on CD)
Child Booklet
Digits 0 – 9
Bag/envelope What to do: 1) ‘Impossible or Improbable’ sentences task
As a class group, discuss what the terms ‘improbable’ and ‘impossible’ mean. Use the first two questions as examples for this discussion. The teacher reads out the phrases and children discuss in pairs whether these situations are ‘impossible’ or ‘improbable’ and then they justify their choices to the whole group.
For the remaining questions, working in pairs, for each pair of phrases which are presented to children on the sheet, they have to decide which of them is `impossible’ or ‘improbable’ by ticking the relevant box. When all of the pairs have finished the first sheet, discuss with the whole class their reasons for making their choices.
Sheet 1 Phrases 1. Making an umbrella out of glass. Making an umbrella out of air. 2. Growing from an adult back to an infant. Growing hair down to one’s toes. 3. Counting all the hairs on a dog’s tail. Counting stars on an overcast night. 4. Catching a shadow. Catching a fly with chopsticks. 5. Not eating for 10 days. Not eating for 10 months. 6. Reading someone’s thoughts. Reading someone’s lips.
27
Sheet 2 Phrases Children discuss in pairs whether these situations are impossible or improbable and then they justify their choices to their partner first and at the end to the whole group. 1. Walking on a telephone wire. Walking on water. 2. Living without a functional heart. Living without a functional nose. 3. Never forgetting anyone’s name. Knowing someone’s name by sight. 4. Unlocking a door with one’s mind. Unlocking a door with a paperclip. 5. Living for 120 years. Living for a thousand years. 6. Hearing a sound before its made. Identifying a dog’s breed by its bark. Sheet 3 Phrases 1. Gluing a broken eggshell back into an egg. Unscrambling a scrambled egg. 2. A woman giving birth to a kangaroo. A woman giving birth to 20 children in a lifetime. 3. Speaking without moving one’s lips. Speaking two languages simultaneously. 4. Walking through a wall. Walking through a fire. 5. Staying awake for 5 days. Staying awake for 5 months. 6. Reading a book without opening its cover. Reading a book that’s upside down.
28
Watch out! Some children use examples of fantasy such as with question 2, sheet 1, the film ‘Benjamin Button’ where the character is born old and grows younger throughout his life time. Through discussion, children decided that these types of examples were fiction or fantasy, so they had to disregard them when they were making their decisions about impossible or improbable events in real life. See how your children deal with this issue and how they decide to resolve it. After the first examples, pairs can work at their own speed, which allows for differentiation but also means that adjacent pairs are not discussing the same question at the same time, so their decisions are more independent. Some pairs will complete all 3 sheets in the time, others not, but class discussions at certain points are needed to allow children to exchange ideas and discuss more widely. 2) Number strip bingo game with digits 0 – 9, without replacement
What to do:
Each child selects from the teacher a strip containing 6 numbers which they then write in the first of the 6 empty boxes in their booklet for this game. (Number strips in the printable resources on the CD).
To play: The teacher draws a digit from the bag and children are asked to cross out on their number boxes any numbers which will now be impossible to make without this digit. They justify this to their partner to ensure no mistakes. The digit is not replaced in the bag. Then the teacher draws a second digit and children cross out any numbers which will now be impossible to make. (Again, justify to their partner to make sure all agree and nobody is crossing unfairly). The teacher keeps drawing the next digit until arriving at the winner who is the first person to cross out all their numbers and explain why they are out. (Play this game twice using the same children numbers if the game is very fast, so children have chance to see how the game unfolds.) Discuss: Why did the winner win? What was different about his/her numbers? (Children should discuss the significance of a repeated digit on their sheet and reason through how this affected their chances of crossing all their numbers first.) 3) Bingo with 0 to 9 digits played with replacement As before but this game is played with replacement, that is, the teacher returns the digits to the bag. But the outcome is not independent from the first digit that was pulled out because the order in which the digits are pulled out influences which digit can be formed. The discussion should focus on what remains possible after the first digit was pulled out for that particular outcome and the fact that the replacement allows numbers like 22, 33 etc. with the same digit repeated to come out. To play: The teacher draws a first digit from the bag of 0 – 9 digits. This will be the first digit of a 2 digit
29
number. This is written on the board and the digit is replaced in the bag. Children now are asked to say which numbers it is possible to form when a second is pulled out. For example, if the first digit was a 3, then the numbers which can be formed after that would be 30, 31, 32, up to 39. The teacher then draws the second digit from the bag to see which number has been formed when put together with the first digit. Children cross off this number on their card if they have it. They are encouraged to explain for example, why a number like 33 was possible with this replacement game and why it wasn’t in the first non-replacement game. They need to reason through that the first digit when replaced in the bag has no influence over which digit will be drawn second, they are independent of each other. The winner is the first child to cross all their numbers. Discuss: Why was it quicker to get to the end in the first game? (Because some numbers with a particular digit in them became impossible when the teacher drew a digit and did not put it back, so the children were able to cross out several numbers at once.)
What was different with the second game compared to the first? (Each digit was independent of the one drawn out before, because they were replaced in the bag, so it was possible for numbers with double digits to be drawn but this was not possible the first time around.)
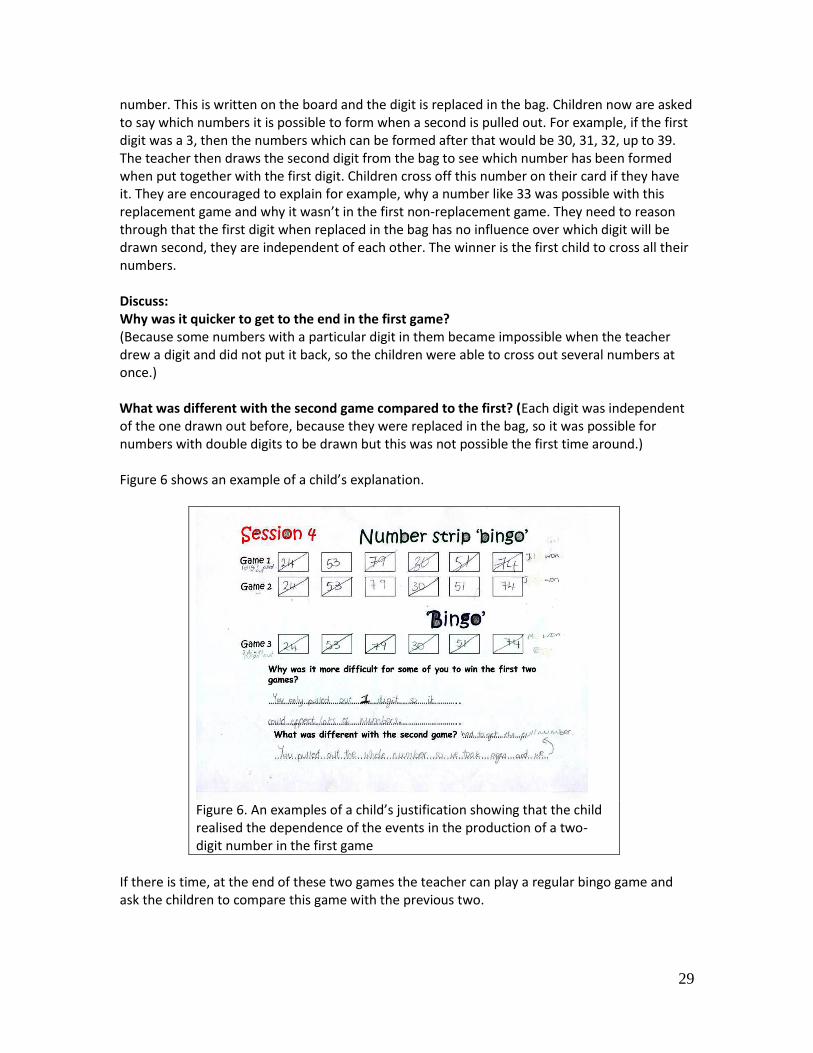
Figure 6 shows an example of a child’s explanation.
Figure 6. An examples of a child’s justification showing that the child realised the dependence of the events in the production of a two-digit number in the first game
If there is time, at the end of these two games the teacher can play a regular bingo game and ask the children to compare this game with the previous two.
30
Session 5
Aim: Children have opportunity to further develop their reasoning about events which are more likely or less likely to happen. They should realise that: (1) it is possible to make some global predictions although one cannot tell what will happen for each event; (2) that when things are random, it does not necessarily mean that all outcomes are equally likely, as some may be more likely than others; (3) more importantly, at the end they should realise that it is possible to think logically about random events. Materials:
Bag of counters, 2 colours
Dice (2 per pair)
Child Booklet
What to do:
1) ‘Bag of counters’ Games: In this game, children have to make predictions about which colours will be pulled out from a bag of counters. The teacher pulls out the counters to show the whole class. For each game, the teacher says how many of each colour counter there are in the bag at the start and children have to predict which colour counter is more likely be drawn out next. They must write down their prediction each time. For the first 2 `non-replacement’ games, drawn counters are left out of the bag. For the third ‘replacement game, counters are replaced each time after drawing. Game 1: (Non-replacement)
10 counters are in the bag, 6 are red and 4 are green. Children are asked to write down in their booklets which colour counter they think is most likely to be drawn out first, ’r’ if they think it is red, ‘g’ if they think green or ‘j’ if they think they are just as likely. (Arrange it, without informing the children, to draw a red. Show the class the first colour drawn)
Now there are 5 red and 4 green in the bag, do they want to stay with their colour prediction for the next draw, or do they want to change it? Write down your prediction for the next colour of counter to be drawn out. What did they decide to do, stay or change? Why?
Children are encouraged to reason through and tell their partner each time why one colour has a better chance of being pulled out than the other.
Now arrange to pull out another red, so now there are 4 red/4 green. Do children want to stay with your colour prediction for the next draw, or do they want to change it? Write down their prediction for the next colour of counter to be drawn out. What did they decide to do, stay or change? Why?
31
Continue to pull out counters fairly and get the children to write down their prediction, and to say to the group why they stick with their previous prediction or shift their prediction. Encourage children to work out how many chances there are for each colour and make a comparison before making their prediction. Game 2: (Non-replacement)
In this game there are 4 red and 4 green counters in the bag to start. Children are asked to write down which colour counter they think will be drawn out first, r, g or j if they think they are just as likely. Make the draw and look at first colour drawn.
Discuss why they made the predictions they did and why they might have been correct or not.
Now, do they want to stick with their colour prediction for the next draw, or do they want to change it? Write down their prediction for the next colour of counter to be drawn out. Discuss what they decided to do, stay or change? Why?
Continue to pull out counters and get the children to write down their prediction each time, and justify to the group why they stick with or shift their prediction. When there is only one colour left or only one marble left, they should be certain about the outcome and explain the change from uncertainty to certainty.
Game 3: (Replacement)
In this game there are 5 red and 6 green counters in the bag. Ask children to write down which colour counter they think will be drawn out first. Look at first colour drawn. Was their prediction correct?
Tell them you are going to replace the counter you have just drawn back in the bag.
Do they want to stay with your colour prediction for the next draw, or do they want to change it? Ask them to write down their prediction for the next colour of counter to be drawn out. What did they decide to do, stay or change? Why?
Make a few draws until children start to reason about the difference replacement makes compared to the non-replacement games.
Discuss: What made them change their predictions in the first two games? How was this different in the last game? They should reason about changing probabilities for each colour in the first two games, whereas in the third game the probabilities are always the same because the drawn counter is replaced.
32
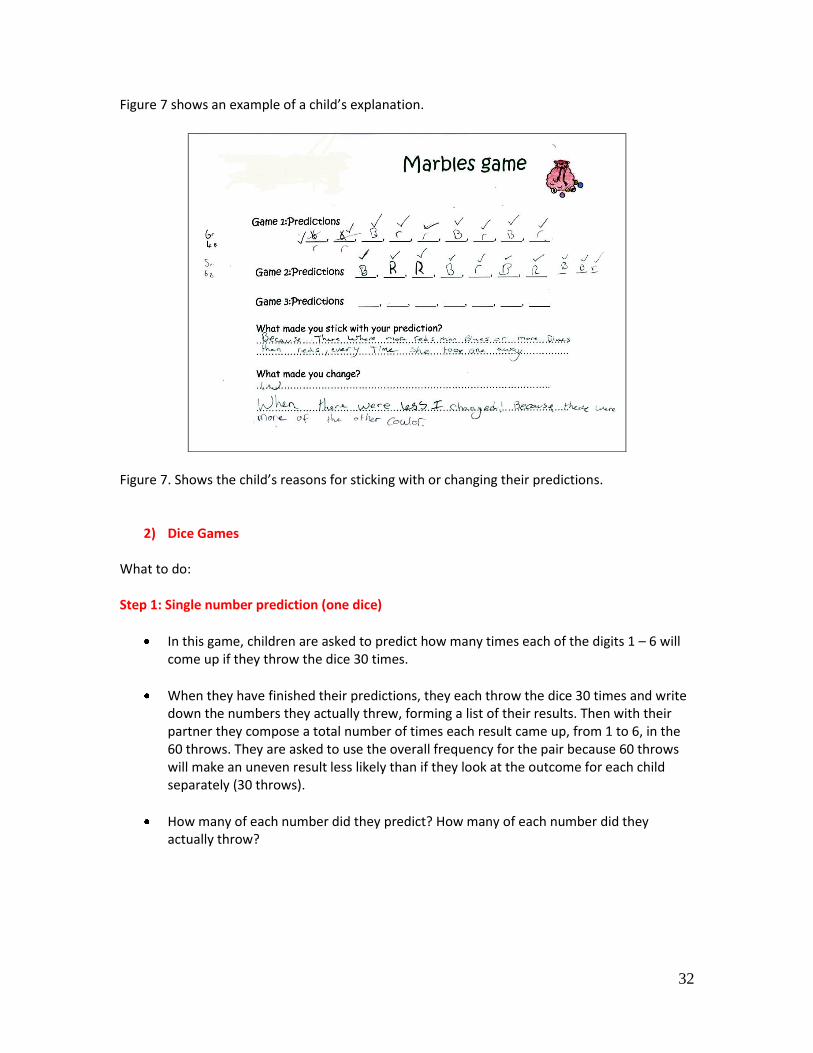
Figure 7 shows an example of a child’s explanation. Figure 7. Shows the child’s reasons for sticking with or changing their predictions.
2) Dice Games What to do:
Step 1: Single number prediction (one dice)
In this game, children are asked to predict how many times each of the digits 1 – 6 will come up if they throw the dice 30 times.
When they have finished their predictions, they each throw the dice 30 times and write down the numbers they actually threw, forming a list of their results. Then with their partner they compose a total number of times each result came up, from 1 to 6, in the 60 throws. They are asked to use the overall frequency for the pair because 60 throws will make an uneven result less likely than if they look at the outcome for each child separately (30 throws).
How many of each number did they predict? How many of each number did they actually throw?
33
Discuss: Do they notice anything about the numbers they threw? Did all numbers come up as often as each other? Compare results of the different pairs in a whole class discussion. How did they make their predictions? (You want to see whether they were considering equal likelihoods of each number being thrown. If there is time, ask them to find the results for the whole class – adding what each pair threw – and compare the results with children’s individual results. The frequencies for the whole class should be more even than the frequencies for individual children’s results.)
Step 2: Sum prediction (two dice)
This time children try to predict some sums of numbers that they will throw. In pairs, they are asked to write down three totals that they predict for the sum of two dice thrown at the same time.
When they have finished their list of three predictions, they take turns to throw the 2 dice and add them together and record their throws. They do this 30 times and each time write down the totals from the thrown scores.
Discuss:
Start by discussing what results are possible and what results are not possible. List the possible results on the board. Write the frequencies for the pairs on the board and add them. Looking at the results, can they think of reasons to explain why there are some totals that are more likely to get thrown and some which are less likely than others to get thrown (e.g.: 2 and 12 are the most unlikely, can they reason why this is? How many ways are there for making this total?) Compare this with the throw of single dice. (They should realise that for a single die the digits are equally likely but for the sum the probabilities differ.)
Watch out! 1. With the counters in a bag games, it is necessary for the teacher to ‘rig’ the colour of marble pulled out on a couple of occasions to promote the type of discussion necessary. This needs to be practiced in order to be convincing, or the children become very suspicious and this can be problematic. 2. Children often use the expression `fifty-fifty` to refer to random situations. They should become aware that this expression does not apply always. In some situations, some outcomes are more likely than others. This is the motivation for the next set of activities, in which they will learn how to set out the sample space systematically and quantify probabilities later on in the teaching programme.
34
Unit 2: Sample Space
Session 1
Aim: To enable children to identify properties and make combinations using computer matrices game and manipulative materials to map all possible outcomes. Materials:
Matrices problems to be loaded onto computers, levels 1-5
‘Matrices choices’ booklet (1 per pair of children)
1 computer for each pair of children
Child booklet
Manipulative materials to cut out (hats/glasses/lips) (printable resource on CD)
What to do: 1) Computer matrices:
Use the first game as examples with the whole class together on the white board before they split into paired work. (If you do not have the resources for photocopying the matrices choices booklet, which needs to be in colour, children could still play the other 4 games in pairs over a day or two, taking turns on one laptop in the classroom. Each pair of children would need 20 minutes approximately.)
Demonstrate that for each question they will see a grid in which one of the cells is empty.
Show that with game 1, there are clues on the outside of the matrix in the grey area which help them identify the properties of this missing item, e.g. colour, type of transport for first question.
They need to say what the 2 (sometimes 3) properties are of the missing image in the cell. The player in the pair seeking the solution must state each of the properties of the missing image and say to their partner
e.g. “I am looking for a car which is yellow”, or “I am looking for a black elephant facing left ” This way, the player should not be making lucky/wild guesses, but has to think about, and tell their partner the properties.
They each have a ‘matrices choices’ booklet. For the demonstration game with the whole class, one child could show to the class the booklet whilst the teacher explains the game. Each question has a page showing 6 images labelled A to F from which they can choose each time for the missing cell. They look to see which picture matches the description given by the player and the letter which is written underneath that image is written down on the scoring sheet by ticking the corresponding box, then the player clicks the corresponding letter on the screen. In the paired games (2-5) afterwards, one child makes the prediction and the other person in the pair looks for the corresponding
35
picture and writes the answer in the booklet while the child looking for the solution clicks the letter in the computer.
If they identify the properties correctly and click on the correct letter, they get a tick appear on screen. If they are incorrect with their choice a cross appears and they can have another choice. They score 2 points if they get it correct first go, or one point if they get it on the second attempt. They can continue to look for the right answer but if they get it on the third attempt they get no point; after the third attempt, they lose a point.
Partners take turns remembering to swap jobs after question 5 in each game.
The players will get a total score after each game. It is the person with the highest total after 5 games who wins.
Watch out! Three of the grids in game 1 have 2 cells blank (question A2, A6 and A8) and one grid in game 2 (question B5). This means that the children have to identify 2 cells for each of these questions and it is always the cell in the centre column of the grid which has to be identified first. You should expect huge variation between children in these games. These computer games were used in a research project on their own, and were effective in improving children’s spatial and visual reasoning when the children were assessed by means of a non-verbal intelligence test. Some of the initial games may be very easy for some children and they move through them quite quickly but quite a few children will have difficulty. If the children can move at their own pace, those who need more time can continue to play the games while the ones who complete earlier on can write explanations for how they solved the last few games. The cost of printing enough matrices choices booklets for each pair in the class to use one is high, but the booklets are used again when other children play the game in the future as no writing is done on the matrices choice booklet. 2) Masks Matrices (to be done after all children have had opportunity to do the matrices computer games) What to do:
Children each have a sheet of 9 images to be cut out (3 hats/3 pairs of glasses/3 mouths).
They need to think of and write a short code of their own on to each cut out image (e.g. Ph for Police Helmet). These codes must not be too complicated, so they should stick to 2 or 3 letters.
Tell them they are going to look at some matrices which are similar to the matrices on the computer games but this time all of the cells are empty. Children need to work out what the combined missing images are, and then fill in the codes for them on the sheet.
36
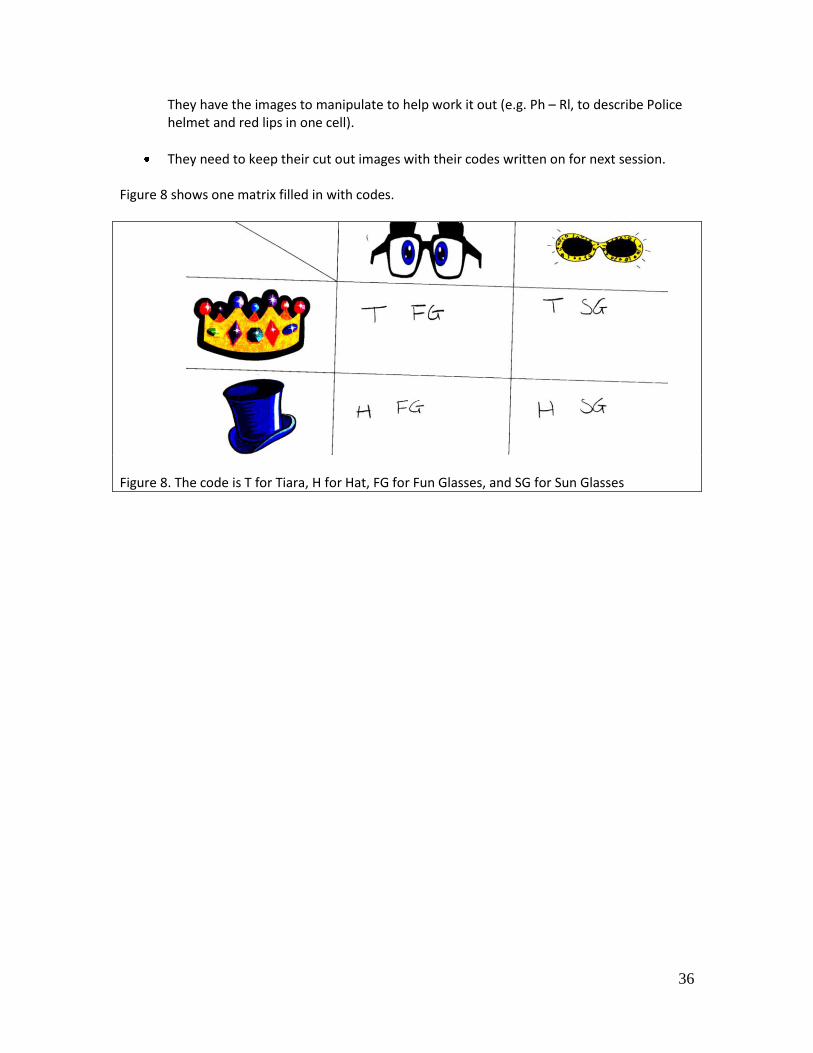
They have the images to manipulate to help work it out (e.g. Ph – Rl, to describe Police helmet and red lips in one cell).
They need to keep their cut out images with their codes written on for next session.
Figure 8 shows one matrix filled in with codes.
Figure 8. The code is T for Tiara, H for Hat, FG for Fun Glasses, and SG for Sun Glasses
37
Session 2
Aim: Children learn how to map all combinations which form the sample space, developing further their skills with diagrammatic representations as a method of documenting all combinations. They first attempt to list all the masks and find a method of their own. After they experience the difficulty, the teacher shows a method that helps her when she needs to do this. Materials:
Cut out images from session 1 (glasses etc.) and cut out images for cars (in the printable resources on the CD)
Large sheets of paper and marker pens
Child booklet
1) Mapping the sample space for masks What to do:
Using the 9 images children have for the masks (3 hats/3 glasses/3 mouths), they need to write down all the possible combinations of masks they can make, without repeating any or missing out any possible combinations.
They can manipulate the pictures to help them work out the combinations for the different masks, each time using one hat, one mouth and one pair of glasses. How might they write down the combinations? They need to come up with a complete list of all the possible combinations they think they could make.
This can be done on larger paper with marker pens so that children can show to the class their different methods of constructing a comprehensive list of all the combinations they found.
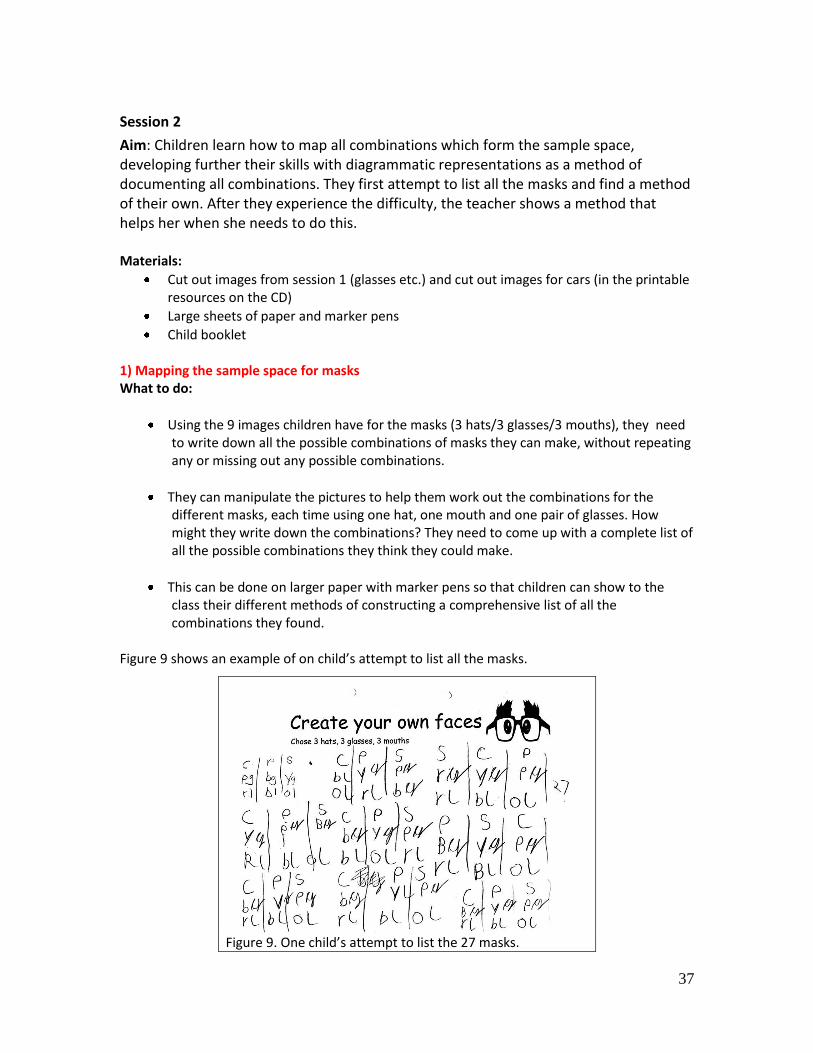
Figure 9 shows an example of on child’s attempt to list all the masks.
Figure 9. One child’s attempt to list the 27 masks.
38
Discuss:
Which type of lists/drawings did children use? They can show and explain if they did something different to other children, show how systematic they were able to be.
What were their total numbers of combinations? Does everyone agree with this number? What is this number representing? (Size of the sample space).
Did they find it easy with their method to be sure they hadn’t missed out any combinations? How can they prove they have written down all the possible combinations in the sample space?
Was it a long/repetitive method? Can we use a method which is quicker and which makes it easier to list all the possible combinations without repeating?
2) Tree diagram for Masks What to do:
Construct a tree diagram on the board, asking children to come up and fill in the necessary information on the board.
Start by asking the class what the 3 properties of the mask were which were being combined each time (hats, glasses, mouths), just as they did for the matrices computer games.
Start on the left, ask a child to come and write down their 3 codes for the hats, making sure they are well spaced out.
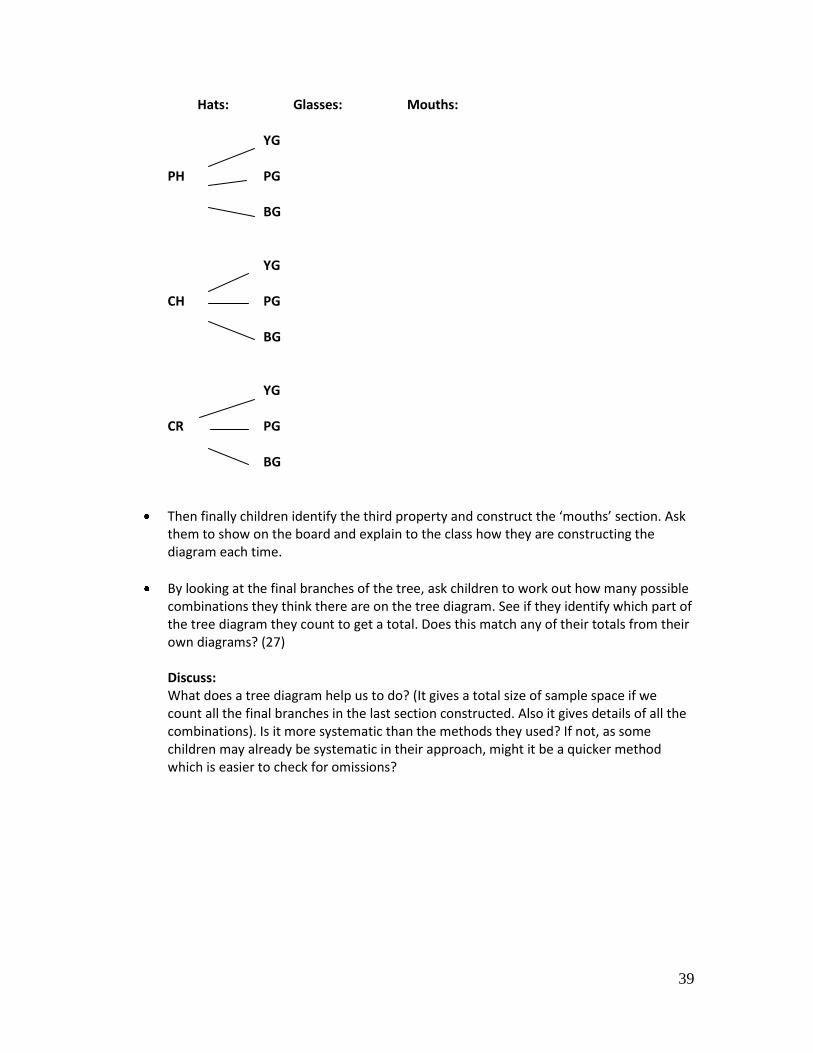
Now draw in the first 3 lines from the first hat and see if they can identify the second property of the image they will construct. See if they can explain that each hat has a possible combination with the 3 pairs of glasses. Ask a child to come and write their codes for the glasses next to the 3 lines. Then to complete the ‘glasses’ combinations for the next branches with CH (Chef’s hat) and C (Crown) on the tree diagram.
39
Hats: Glasses: Mouths:
YG
PH PG BG
YG CH PG BG
YG CR PG BG
Then finally children identify the third property and construct the ‘mouths’ section. Ask them to show on the board and explain to the class how they are constructing the diagram each time.
By looking at the final branches of the tree, ask children to work out how many possible combinations they think there are on the tree diagram. See if they identify which part of the tree diagram they count to get a total. Does this match any of their totals from their own diagrams? (27)
Discuss: What does a tree diagram help us to do? (It gives a total size of sample space if we count all the final branches in the last section constructed. Also it gives details of all the combinations). Is it more systematic than the methods they used? If not, as some children may already be systematic in their approach, might it be a quicker method which is easier to check for omissions?
40
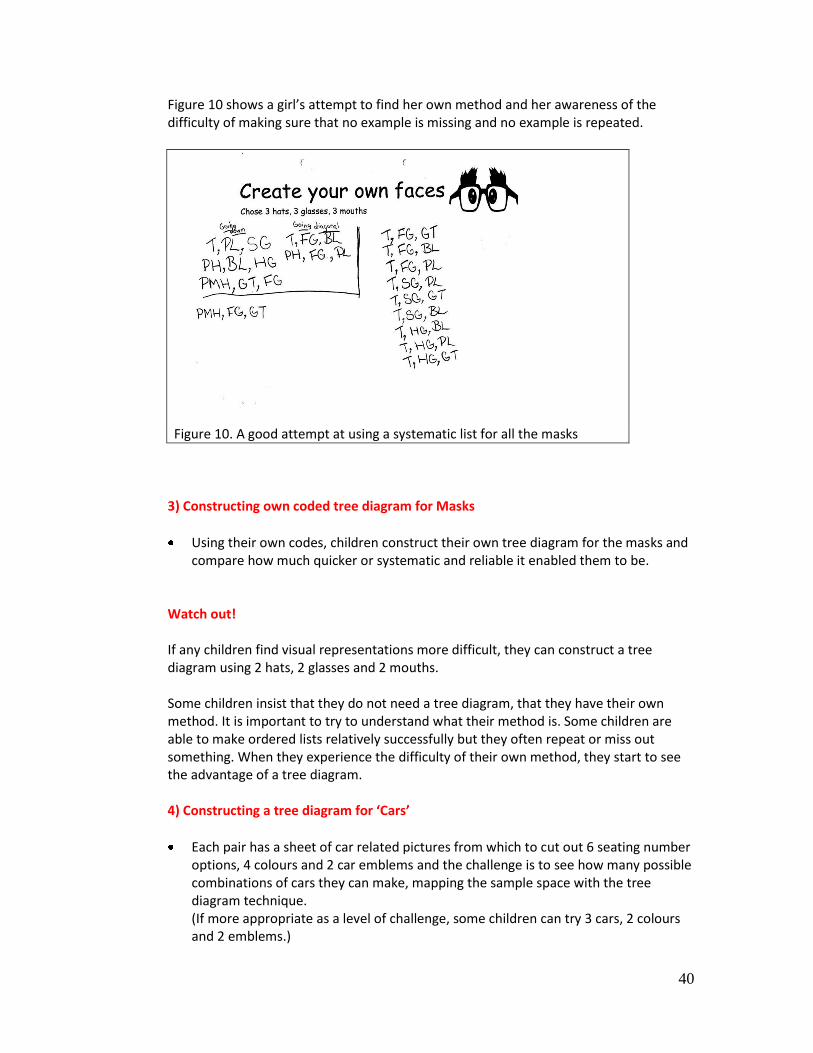
Figure 10 shows a girl’s attempt to find her own method and her awareness of the difficulty of making sure that no example is missing and no example is repeated.
Figure 10. A good attempt at using a systematic list for all the masks
3) Constructing own coded tree diagram for Masks
Using their own codes, children construct their own tree diagram for the masks and compare how much quicker or systematic and reliable it enabled them to be.
Watch out! If any children find visual representations more difficult, they can construct a tree diagram using 2 hats, 2 glasses and 2 mouths. Some children insist that they do not need a tree diagram, that they have their own method. It is important to try to understand what their method is. Some children are able to make ordered lists relatively successfully but they often repeat or miss out something. When they experience the difficulty of their own method, they start to see the advantage of a tree diagram.
4) Constructing a tree diagram for ‘Cars’
Each pair has a sheet of car related pictures from which to cut out 6 seating number options, 4 colours and 2 car emblems and the challenge is to see how many possible combinations of cars they can make, mapping the sample space with the tree diagram technique. (If more appropriate as a level of challenge, some children can try 3 cars, 2 colours and 2 emblems.)
41
As before, children can use the materials to help them work out each combination. Before they start, children are asked to estimate the number of combinations they think there might be for their given task.
Children in pairs can draw their tree diagram in their booklets or on large paper and use marker pens to enable them to show and discuss with the class.
How near to their estimate were they for the size of the sample space?
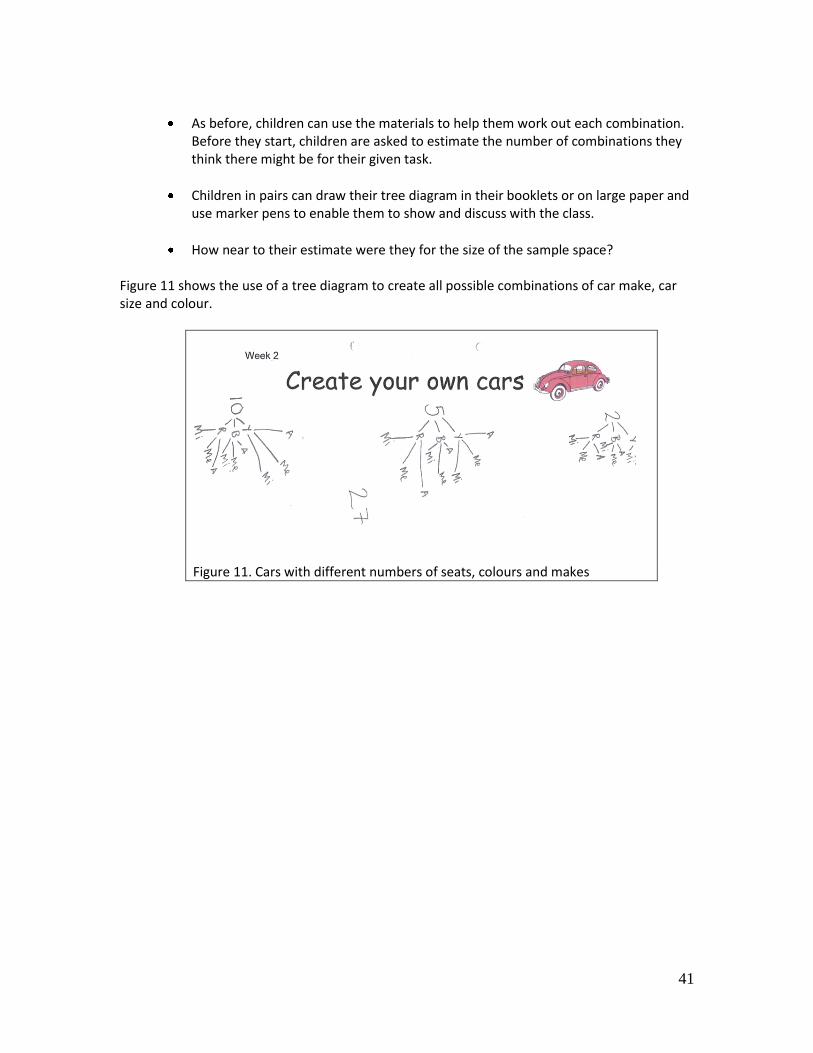
Figure 11 shows the use of a tree diagram to create all possible combinations of car make, car size and colour.
Figure 11. Cars with different numbers of seats, colours and makes
42
Session 3
Aim: Children apply their knowledge of how to construct a tree diagram when expanding a matrix. In the computer games, not all possible combinations appear in a matrix. They are asked to find out which ones are missing. After two sessions in which they do not work with probabilities, they return to probabilities and have now developed the skills to utilize the tree diagram when aggregating scores to look at most likely and least likely outcomes in a sample space. They can use a grid as an alternative method to map the sample space and to begin to eliminate cases. Materials:
Copies of matrix problems to expand
2 dice of different colours for each pair of children
Set of 28 dominoes
Child booklet What to do: 1) Expanding the sample space:
Working in pairs, children have copies of 3 matrix problems from the computer game and they have to work out the details of the rest of the sample and try to draw a tree diagram.
Working through the first example (C2 faces) with the whole class, ask them firstly to identify the properties (size, colour, expression), how they might code them and then draw out the tree diagram with them on the board, getting them to suggest which property is recorded where.
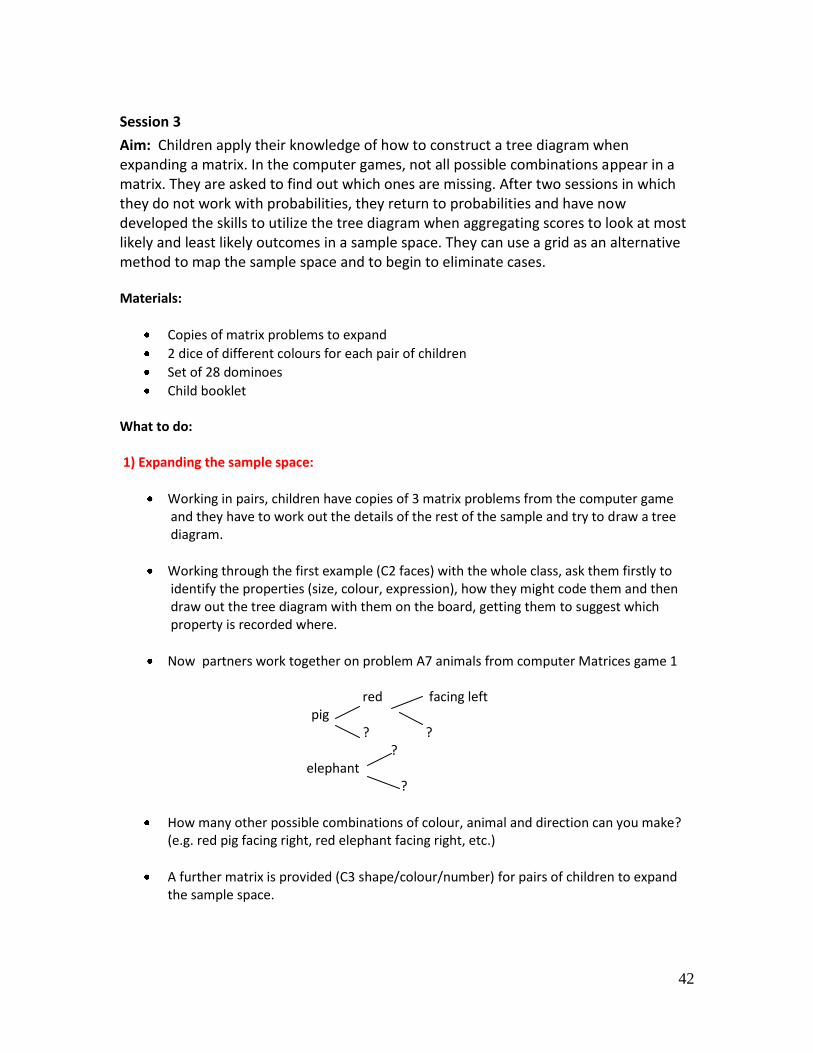
Now partners work together on problem A7 animals from computer Matrices game 1 red facing left pig ? ? ? elephant ?
How many other possible combinations of colour, animal and direction can you make? (e.g. red pig facing right, red elephant facing right, etc.)
A further matrix is provided (C3 shape/colour/number) for pairs of children to expand the sample space.
43
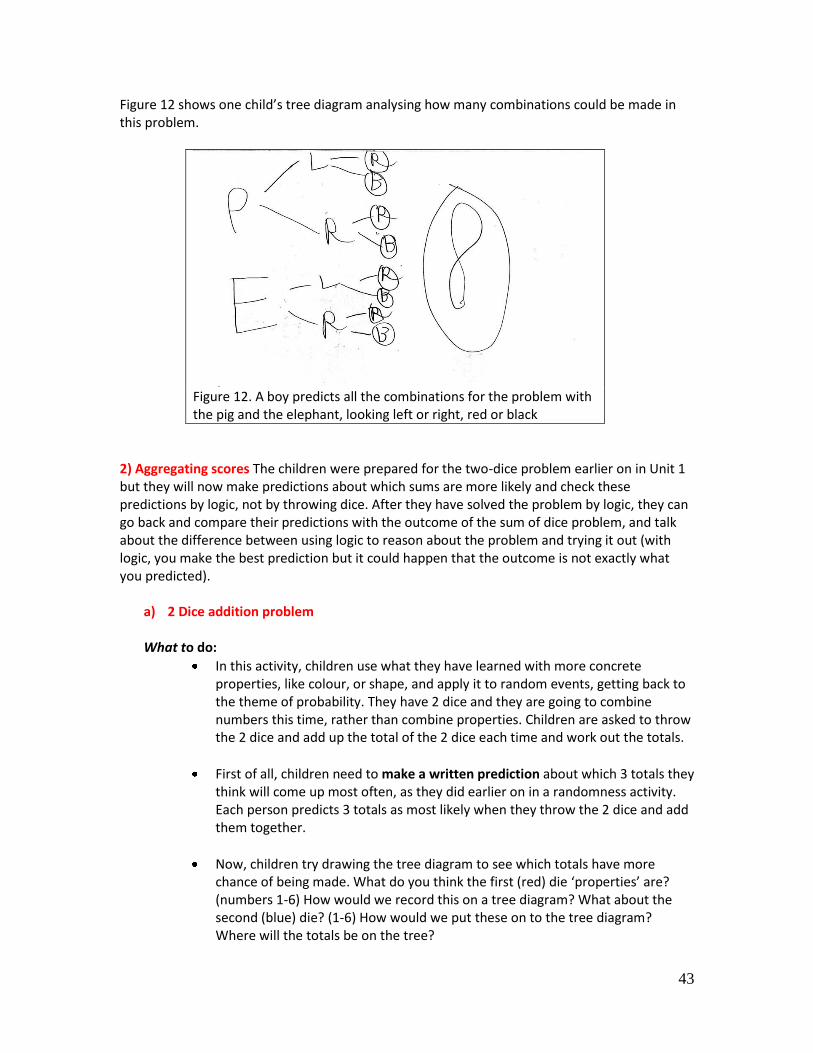
Figure 12 shows one child’s tree diagram analysing how many combinations could be made in this problem.
Figure 12. A boy predicts all the combinations for the problem with the pig and the elephant, looking left or right, red or black
2) Aggregating scores The children were prepared for the two-dice problem earlier on in Unit 1 but they will now make predictions about which sums are more likely and check these predictions by logic, not by throwing dice. After they have solved the problem by logic, they can go back and compare their predictions with the outcome of the sum of dice problem, and talk about the difference between using logic to reason about the problem and trying it out (with logic, you make the best prediction but it could happen that the outcome is not exactly what you predicted).
a) 2 Dice addition problem What to do:
In this activity, children use what they have learned with more concrete properties, like colour, or shape, and apply it to random events, getting back to the theme of probability. They have 2 dice and they are going to combine numbers this time, rather than combine properties. Children are asked to throw the 2 dice and add up the total of the 2 dice each time and work out the totals.
First of all, children need to make a written prediction about which 3 totals they think will come up most often, as they did earlier on in a randomness activity. Each person predicts 3 totals as most likely when they throw the 2 dice and add them together.
Now, children try drawing the tree diagram to see which totals have more chance of being made. What do you think the first (red) die ‘properties’ are? (numbers 1-6) How would we record this on a tree diagram? What about the second (blue) die? (1-6) How would we put these on to the tree diagram? Where will the totals be on the tree?
44
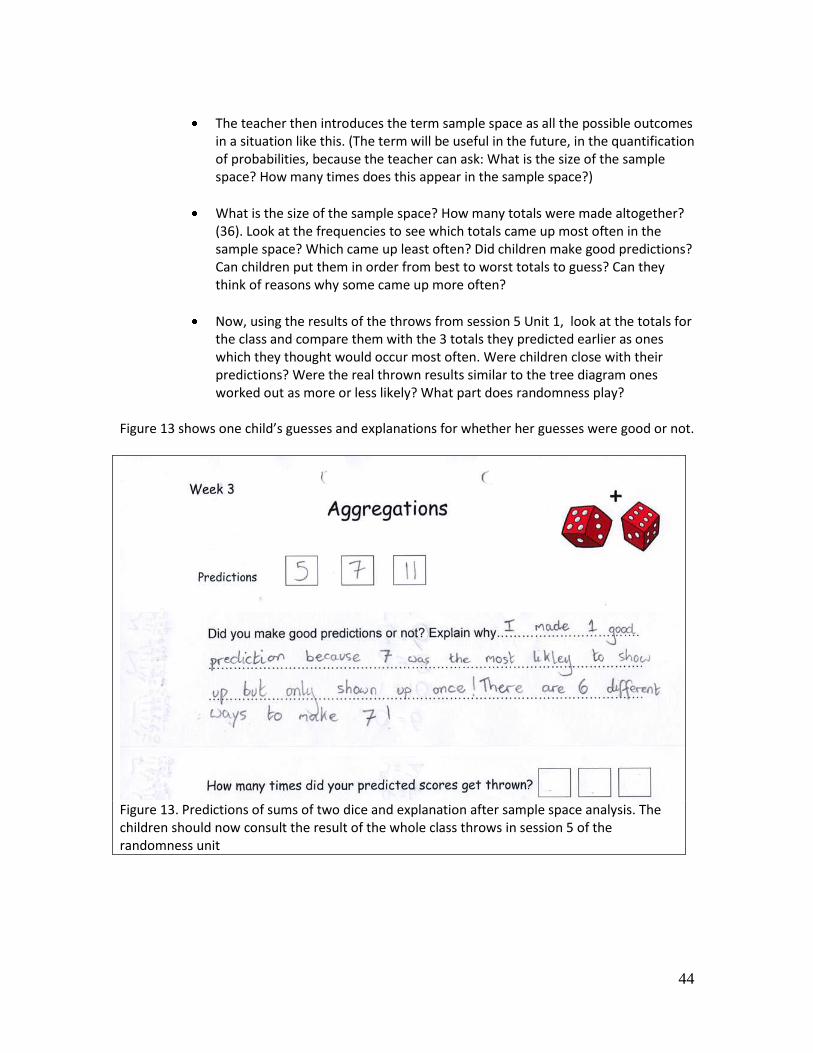
The teacher then introduces the term sample space as all the possible outcomes in a situation like this. (The term will be useful in the future, in the quantification of probabilities, because the teacher can ask: What is the size of the sample space? How many times does this appear in the sample space?)
What is the size of the sample space? How many totals were made altogether? (36). Look at the frequencies to see which totals came up most often in the sample space? Which came up least often? Did children make good predictions? Can children put them in order from best to worst totals to guess? Can they think of reasons why some came up more often?
Now, using the results of the throws from session 5 Unit 1, look at the totals for the class and compare them with the 3 totals they predicted earlier as ones which they thought would occur most often. Were children close with their predictions? Were the real thrown results similar to the tree diagram ones worked out as more or less likely? What part does randomness play?
Figure 13 shows one child’s guesses and explanations for whether her guesses were good or not.
Figure 13. Predictions of sums of two dice and explanation after sample space analysis. The children should now consult the result of the whole class throws in session 5 of the randomness unit
45
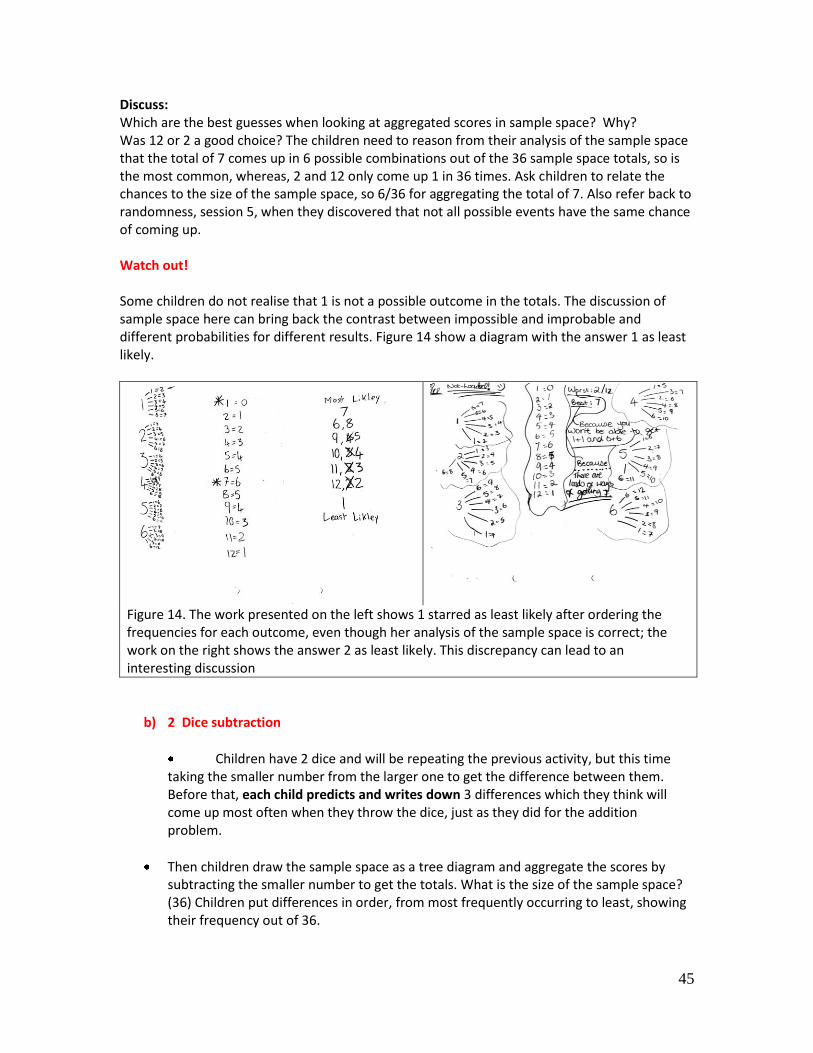
Discuss: Which are the best guesses when looking at aggregated scores in sample space? Why? Was 12 or 2 a good choice? The children need to reason from their analysis of the sample space that the total of 7 comes up in 6 possible combinations out of the 36 sample space totals, so is the most common, whereas, 2 and 12 only come up 1 in 36 times. Ask children to relate the chances to the size of the sample space, so 6/36 for aggregating the total of 7. Also refer back to randomness, session 5, when they discovered that not all possible events have the same chance of coming up. Watch out! Some children do not realise that 1 is not a possible outcome in the totals. The discussion of sample space here can bring back the contrast between impossible and improbable and different probabilities for different results. Figure 14 show a diagram with the answer 1 as least likely.
Figure 14. The work presented on the left shows 1 starred as least likely after ordering the frequencies for each outcome, even though her analysis of the sample space is correct; the work on the right shows the answer 2 as least likely. This discrepancy can lead to an interesting discussion
b) 2 Dice subtraction
Children have 2 dice and will be repeating the previous activity, but this time taking the smaller number from the larger one to get the difference between them. Before that, each child predicts and writes down 3 differences which they think will come up most often when they throw the dice, just as they did for the addition problem.
Then children draw the sample space as a tree diagram and aggregate the scores by subtracting the smaller number to get the totals. What is the size of the sample space? (36) Children put differences in order, from most frequently occurring to least, showing their frequency out of 36.
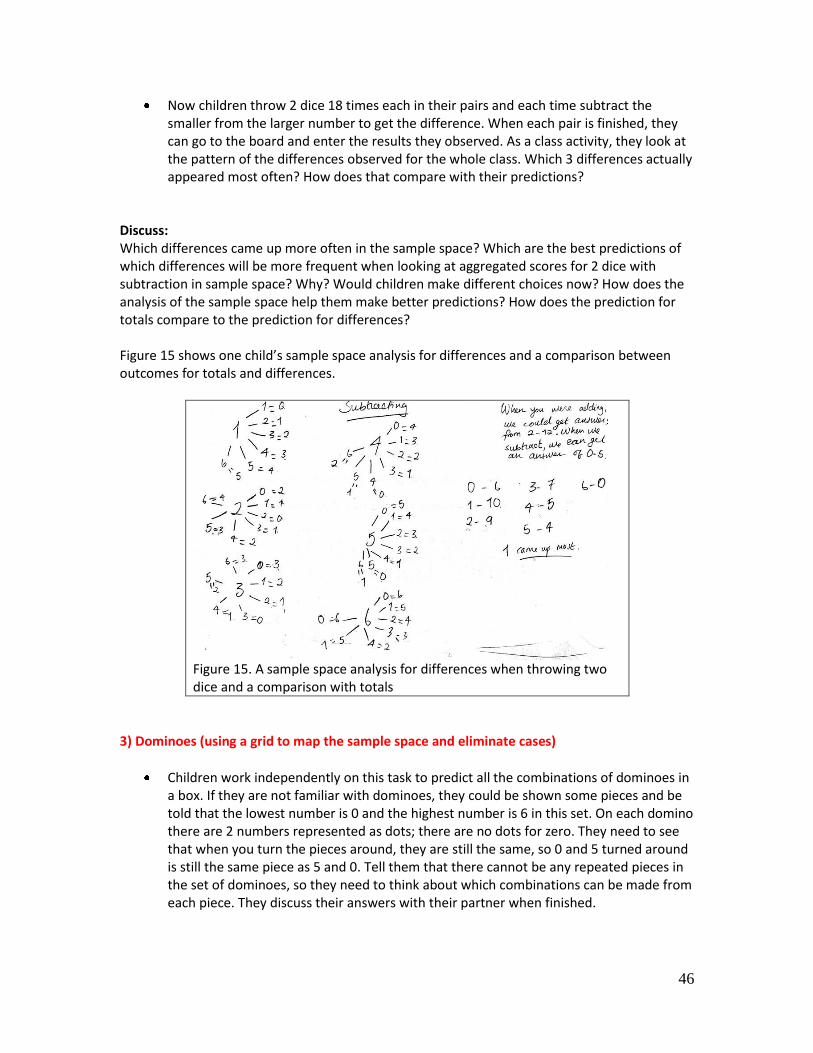
46
Now children throw 2 dice 18 times each in their pairs and each time subtract the smaller from the larger number to get the difference. When each pair is finished, they can go to the board and enter the results they observed. As a class activity, they look at the pattern of the differences observed for the whole class. Which 3 differences actually appeared most often? How does that compare with their predictions?
Discuss: Which differences came up more often in the sample space? Which are the best predictions of which differences will be more frequent when looking at aggregated scores for 2 dice with subtraction in sample space? Why? Would children make different choices now? How does the analysis of the sample space help them make better predictions? How does the prediction for totals compare to the prediction for differences? Figure 15 shows one child’s sample space analysis for differences and a comparison between outcomes for totals and differences.
Figure 15. A sample space analysis for differences when throwing two dice and a comparison with totals
3) Dominoes (using a grid to map the sample space and eliminate cases)
Children work independently on this task to predict all the combinations of dominoes in a box. If they are not familiar with dominoes, they could be shown some pieces and be told that the lowest number is 0 and the highest number is 6 in this set. On each domino there are 2 numbers represented as dots; there are no dots for zero. They need to see that when you turn the pieces around, they are still the same, so 0 and 5 turned around is still the same piece as 5 and 0. Tell them that there cannot be any repeated pieces in the set of dominoes, so they need to think about which combinations can be made from each piece. They discuss their answers with their partner when finished.
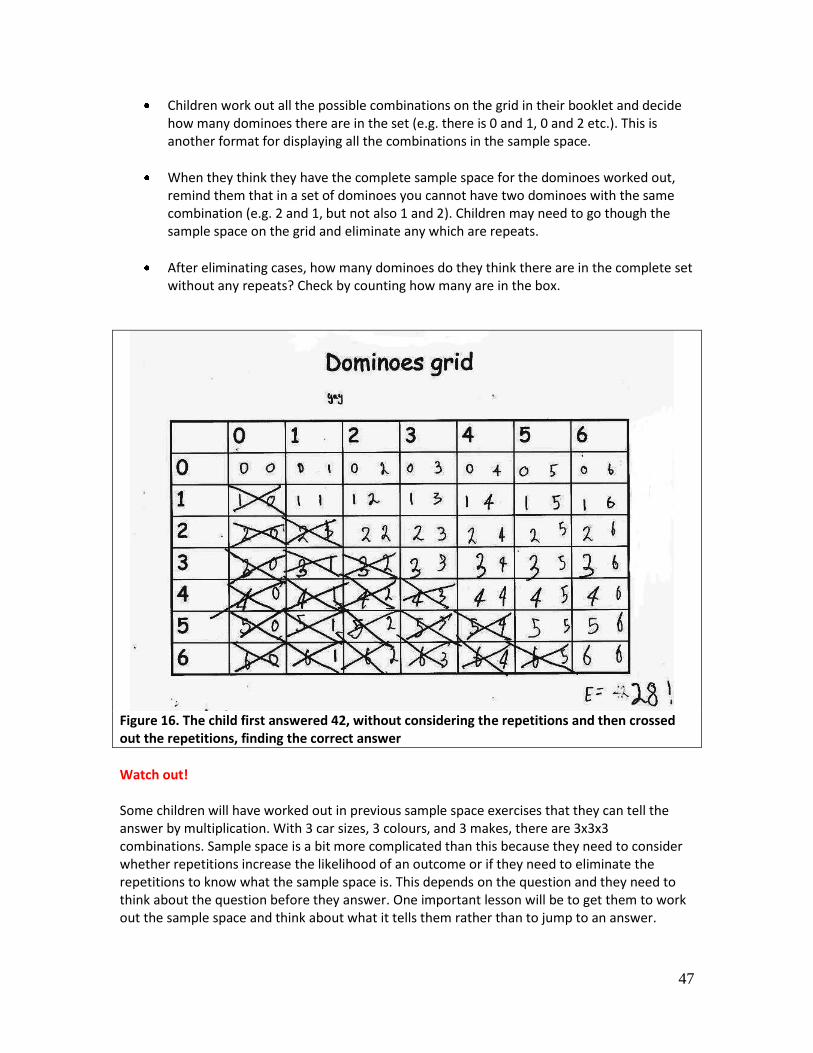
47
Children work out all the possible combinations on the grid in their booklet and decide how many dominoes there are in the set (e.g. there is 0 and 1, 0 and 2 etc.). This is another format for displaying all the combinations in the sample space.
When they think they have the complete sample space for the dominoes worked out, remind them that in a set of dominoes you cannot have two dominoes with the same combination (e.g. 2 and 1, but not also 1 and 2). Children may need to go though the sample space on the grid and eliminate any which are repeats.
After eliminating cases, how many dominoes do they think there are in the complete set without any repeats? Check by counting how many are in the box.
Figure 16. The child first answered 42, without considering the repetitions and then crossed out the repetitions, finding the correct answer
Watch out! Some children will have worked out in previous sample space exercises that they can tell the answer by multiplication. With 3 car sizes, 3 colours, and 3 makes, there are 3x3x3 combinations. Sample space is a bit more complicated than this because they need to consider whether repetitions increase the likelihood of an outcome or if they need to eliminate the repetitions to know what the sample space is. This depends on the question and they need to think about the question before they answer. One important lesson will be to get them to work out the sample space and think about what it tells them rather than to jump to an answer.
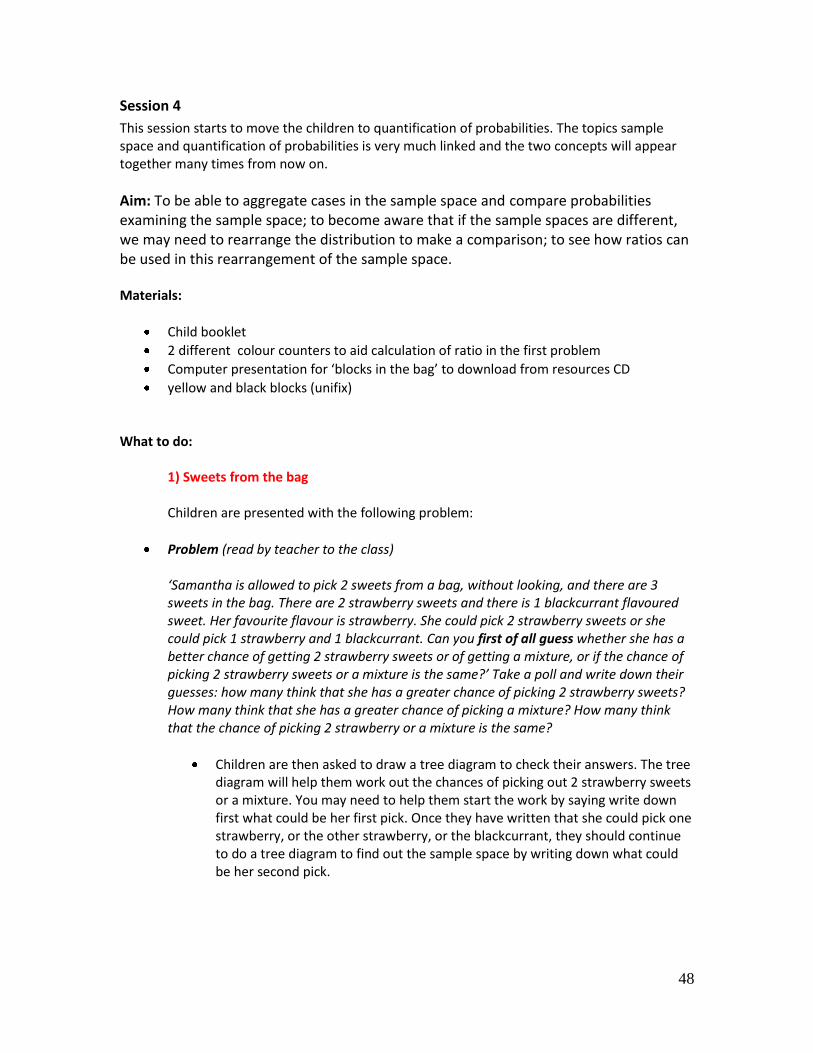
48
Session 4
This session starts to move the children to quantification of probabilities. The topics sample space and quantification of probabilities is very much linked and the two concepts will appear together many times from now on.
Aim: To be able to aggregate cases in the sample space and compare probabilities examining the sample space; to become aware that if the sample spaces are different, we may need to rearrange the distribution to make a comparison; to see how ratios can be used in this rearrangement of the sample space. Materials:
Child booklet
2 different colour counters to aid calculation of ratio in the first problem
Computer presentation for ‘blocks in the bag’ to download from resources CD
yellow and black blocks (unifix) What to do:
1) Sweets from the bag Children are presented with the following problem:
Problem (read by teacher to the class) ‘Samantha is allowed to pick 2 sweets from a bag, without looking, and there are 3 sweets in the bag. There are 2 strawberry sweets and there is 1 blackcurrant flavoured sweet. Her favourite flavour is strawberry. She could pick 2 strawberry sweets or she could pick 1 strawberry and 1 blackcurrant. Can you first of all guess whether she has a better chance of getting 2 strawberry sweets or of getting a mixture, or if the chance of picking 2 strawberry sweets or a mixture is the same?’ Take a poll and write down their guesses: how many think that she has a greater chance of picking 2 strawberry sweets? How many think that she has a greater chance of picking a mixture? How many think that the chance of picking 2 strawberry or a mixture is the same?
Children are then asked to draw a tree diagram to check their answers. The tree diagram will help them work out the chances of picking out 2 strawberry sweets or a mixture. You may need to help them start the work by saying write down first what could be her first pick. Once they have written that she could pick one strawberry, or the other strawberry, or the blackcurrant, they should continue to do a tree diagram to find out the sample space by writing down what could be her second pick.
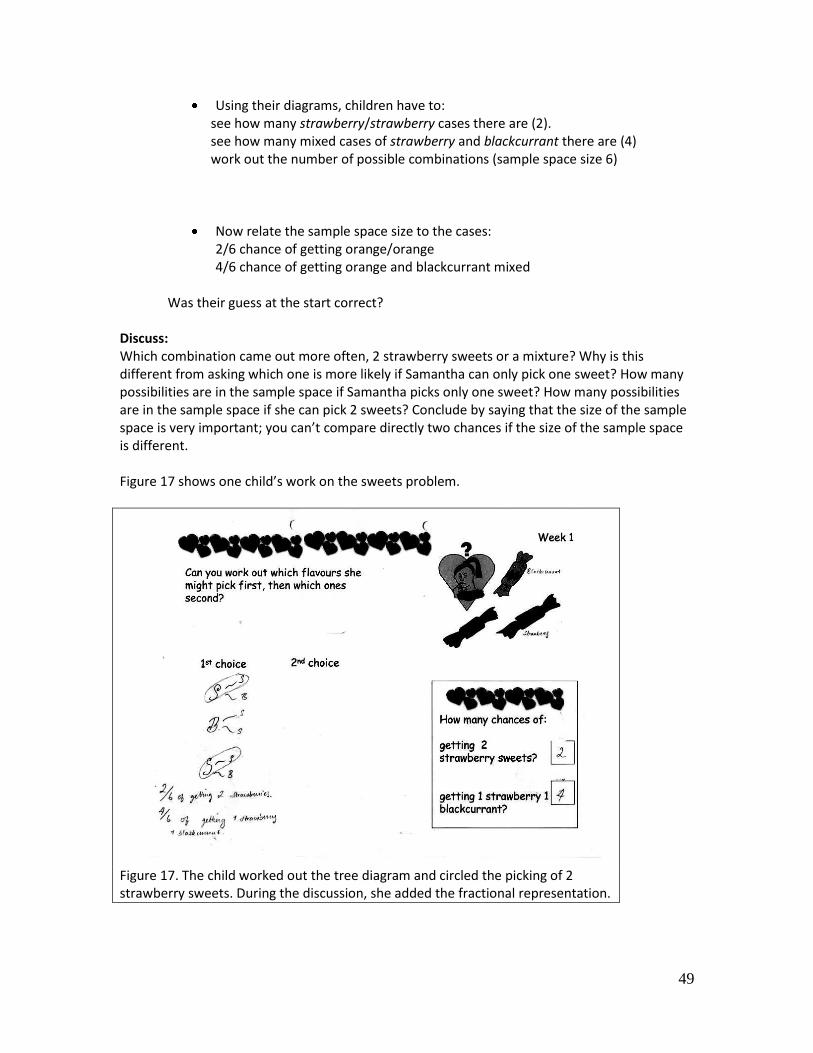
49
Using their diagrams, children have to: see how many strawberry/strawberry cases there are (2). see how many mixed cases of strawberry and blackcurrant there are (4) work out the number of possible combinations (sample space size 6)
Now relate the sample space size to the cases: 2/6 chance of getting orange/orange 4/6 chance of getting orange and blackcurrant mixed
Was their guess at the start correct?
Discuss: Which combination came out more often, 2 strawberry sweets or a mixture? Why is this different from asking which one is more likely if Samantha can only pick one sweet? How many possibilities are in the sample space if Samantha picks only one sweet? How many possibilities are in the sample space if she can pick 2 sweets? Conclude by saying that the size of the sample space is very important; you can’t compare directly two chances if the size of the sample space is different. Figure 17 shows one child’s work on the sweets problem.
Figure 17. The child worked out the tree diagram and circled the picking of 2 strawberry sweets. During the discussion, she added the fractional representation.
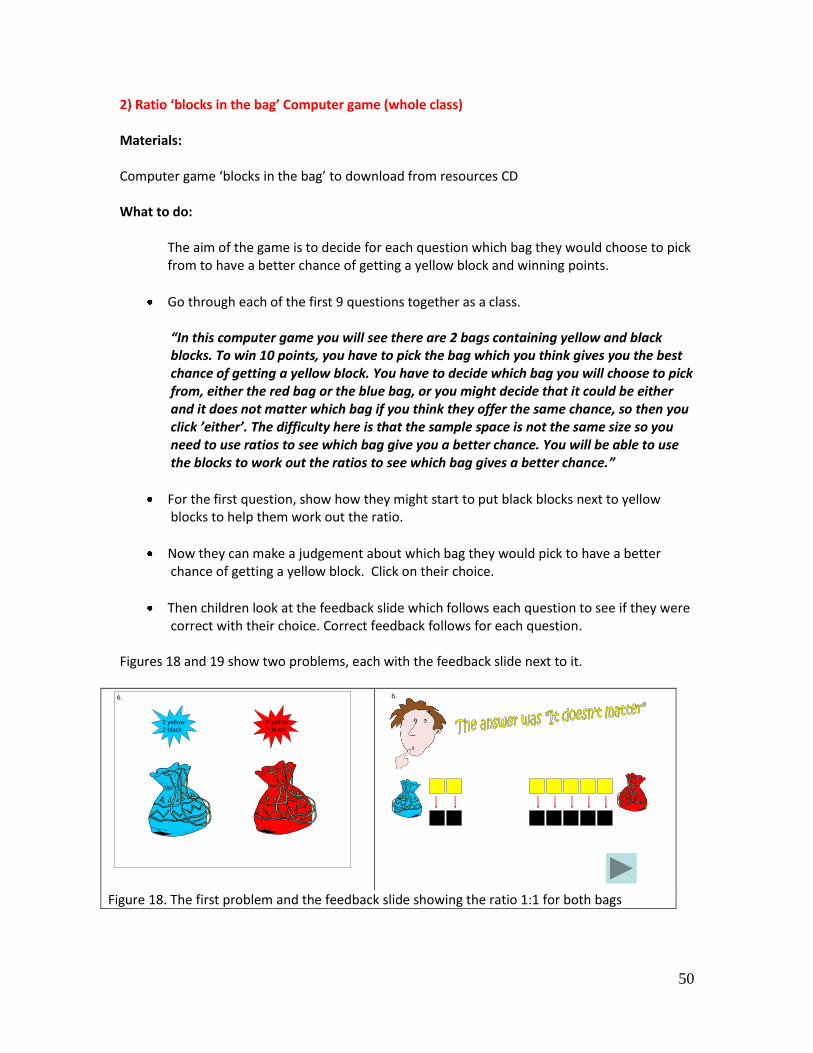
50
2) Ratio ‘blocks in the bag’ Computer game (whole class) Materials: Computer game ‘blocks in the bag’ to download from resources CD What to do:
The aim of the game is to decide for each question which bag they would choose to pick from to have a better chance of getting a yellow block and winning points.
Go through each of the first 9 questions together as a class. “In this computer game you will see there are 2 bags containing yellow and black blocks. To win 10 points, you have to pick the bag which you think gives you the best chance of getting a yellow block. You have to decide which bag you will choose to pick from, either the red bag or the blue bag, or you might decide that it could be either and it does not matter which bag if you think they offer the same chance, so then you click ’either’. The difficulty here is that the sample space is not the same size so you need to use ratios to see which bag give you a better chance. You will be able to use the blocks to work out the ratios to see which bag gives a better chance.”
For the first question, show how they might start to put black blocks next to yellow blocks to help them work out the ratio.
Now they can make a judgement about which bag they would pick to have a better chance of getting a yellow block. Click on their choice.
Then children look at the feedback slide which follows each question to see if they were correct with their choice. Correct feedback follows for each question.
Figures 18 and 19 show two problems, each with the feedback slide next to it.
6.
2 yellow
2 black
5 yellow
5 black
6.
Figure 18. The first problem and the feedback slide showing the ratio 1:1 for both bags
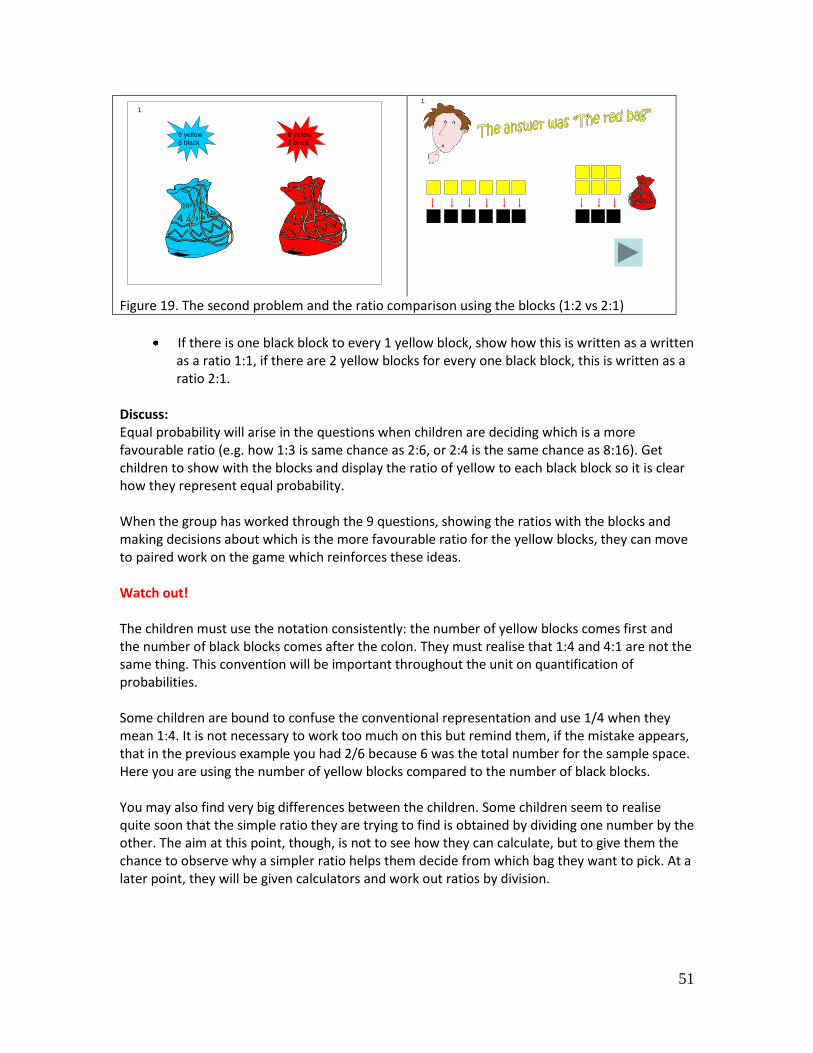
51
6 yellow
6 black
6 yellow
3 black
1.
1.
Figure 19. The second problem and the ratio comparison using the blocks (1:2 vs 2:1)
If there is one black block to every 1 yellow block, show how this is written as a written as a ratio 1:1, if there are 2 yellow blocks for every one black block, this is written as a ratio 2:1.
Discuss: Equal probability will arise in the questions when children are deciding which is a more favourable ratio (e.g. how 1:3 is same chance as 2:6, or 2:4 is the same chance as 8:16). Get children to show with the blocks and display the ratio of yellow to each black block so it is clear how they represent equal probability. When the group has worked through the 9 questions, showing the ratios with the blocks and making decisions about which is the more favourable ratio for the yellow blocks, they can move to paired work on the game which reinforces these ideas. Watch out! The children must use the notation consistently: the number of yellow blocks comes first and the number of black blocks comes after the colon. They must realise that 1:4 and 4:1 are not the same thing. This convention will be important throughout the unit on quantification of probabilities. Some children are bound to confuse the conventional representation and use 1/4 when they mean 1:4. It is not necessary to work too much on this but remind them, if the mistake appears, that in the previous example you had 2/6 because 6 was the total number for the sample space. Here you are using the number of yellow blocks compared to the number of black blocks. You may also find very big differences between the children. Some children seem to realise quite soon that the simple ratio they are trying to find is obtained by dividing one number by the other. The aim at this point, though, is not to see how they can calculate, but to give them the chance to observe why a simpler ratio helps them decide from which bag they want to pick. At a later point, they will be given calculators and work out ratios by division.
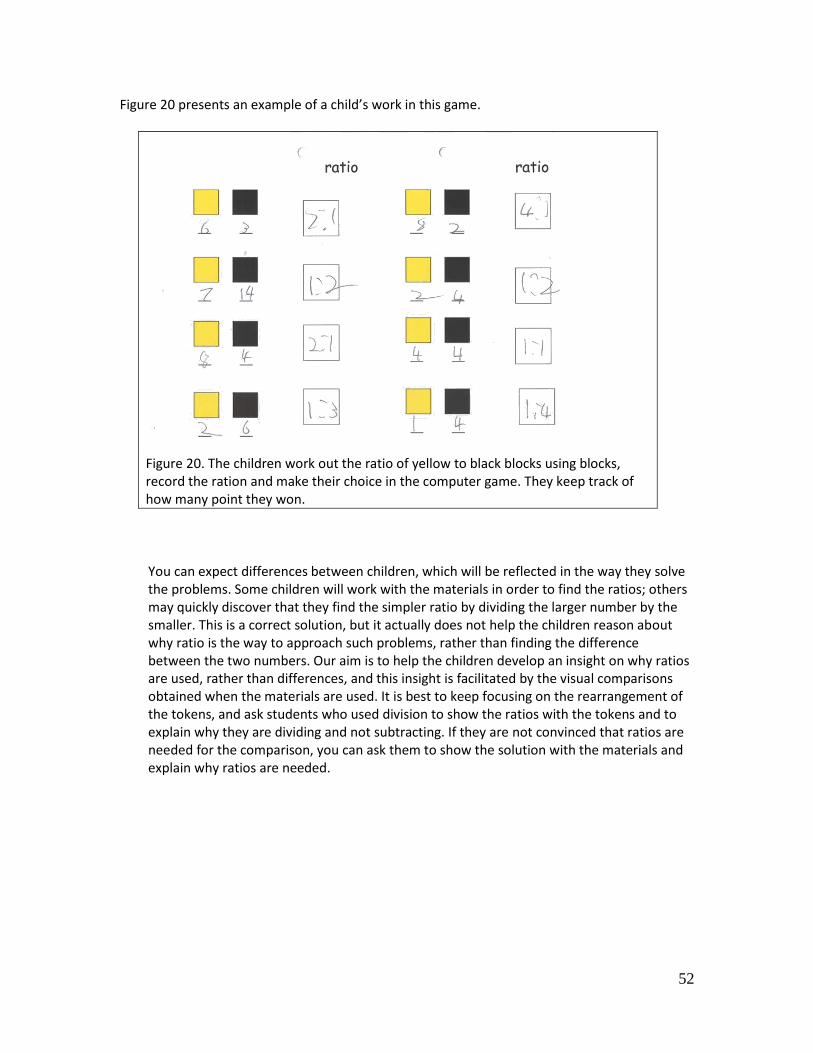
52
Figure 20 presents an example of a child’s work in this game.
Figure 20. The children work out the ratio of yellow to black blocks using blocks, record the ration and make their choice in the computer game. They keep track of how many point they won.
You can expect differences between children, which will be reflected in the way they solve the problems. Some children will work with the materials in order to find the ratios; others may quickly discover that they find the simpler ratio by dividing the larger number by the smaller. This is a correct solution, but it actually does not help the children reason about why ratio is the way to approach such problems, rather than finding the difference between the two numbers. Our aim is to help the children develop an insight on why ratios are used, rather than differences, and this insight is facilitated by the visual comparisons obtained when the materials are used. It is best to keep focusing on the rearrangement of the tokens, and ask students who used division to show the ratios with the tokens and to explain why they are dividing and not subtracting. If they are not convinced that ratios are needed for the comparison, you can ask them to show the solution with the materials and explain why ratios are needed.
53
Session 5:
Aim: To be able to aggregate cases in the sample space and compare probabilities examining the sample space; to become aware that if the sample spaces are different, we may need to rearrange the distribution to make a comparison; to see how ratios can be used in this rearrangement of the sample space. To use ratios for comparison between groups and for deciding on which offers the best chance for a particular outcome. Materials:
Computer per pair loaded with paired game from resources CD
Yellow and black blocks (unifix)
Child booklet
What to do:
1) Ratio ‘blocks in the bag’ Computer game (paired work) This is a continuation from the previous session, but the previous one was done as a group and now the children can move at their own pace working in pairs. Repeat instructions from the class game and some extra instructions for scoring and clicking:
In this computer game you will see there are 2 bags containing yellow and black blocks. To win 10 points, you have to pick the bag which you think gives the best chance of getting a yellow.
You have to decide which bag you will choose to pick from, either the red bag or the blue bag, or you might decide that it could be either and it does not matter which bag if you think they offer the same chance. Use the blocks to work out the ratios to see which bag gives a better chance. Write this down on the sheet.
Use the blocks you have in front of you to show your partner how you worked it out. When you have decided which bag you will choose, explain to your partner why you chose that one. Show them with the blocks how you know this.
You can then click on the colour you have chosen and see if you get it correct and win 10 points. If you do, your partner writes this down on the score sheet in your booklet. If you get it wrong, the correct answer will come on to the screen but you do not score. Compare correct feedback with your blocks to see where your answer is different.
Take it in turns to answer questions, so you each do 5. At the end of the game, add up your total score. There are 3 games and you need to add up your score for all 3 games.
Discuss: With the whole class, ask children to show with the blocks any equal probabilities they noticed in the questions (e.g. how 2:12 offers the same chance as 1:6), they can explain and demonstrate.
54
Unit 3: Quantification
Session 1
Aim: To continue to reason about why ratios are a good way to compare probabilities when the size of the sample space differs; to be able to regroup the cases in the sample space in order to find simple ratios that can be compared; to extend the reasoning from randomly picking objects out of a bag to other situations. Using the computer game and manipulative materials children are able to quantify and compare ratios. Materials:
Game ‘Which class would you chose?’ download from resources CD
Child booklet
2 different colour counters to aid the search for the ratio
List of answers for teacher use (printable resource from CD and in Appendix B Teacher Handbook)
b) Which class would you choose? This is a set of ratio problems presented on screen to the class.
Game 1:
6 questions about favourite films, TV. programmes, sports, food and football teams. Two classes have been asked for their favourites and their answers have to be worked out as ratios.
The first game of 6 questions is shown on screen to the class and read out by the teacher.
Children work in pairs to figure out both ratios, which they record in their booklets, and then use these to answer ‘Which is the best class to choose?’ to have a better chance for the required result.
They use counters to help them reason and to show their reasoning to their partner or to the class later, just as they did with the blocks in sessions 4 and 5 in unit 2.
e.g. ‘One class has 16 children who like Manchester United best and 4 children who like Oxford United best. The other class has 12 children who like Manchester United best and 3 who like Oxford United best. Which class would be best to choose from to have a better chance of finding a child who liked Manchester United?’
Children use counters to work out the 2 ratios, 1:4 for each in this case, and reason that there is exactly the same chance with both classes for this question.
55
Discuss why the numbers may look different but by working out the ratio for each, we can see they offer the same chance.
After each question, the group listens to a pair explain how they worked out their answer. Any pair having a different way of working, or a different answer, will also be asked to explain. They get a point for each of the 2 ratios and one more point for the correct choice of class. There is a maximum of 3 points for each question. It is the pair with the most points at the end who wins.
There are 6 questions in game 1, each of which is presented to the class group to work through at the same time and then discuss and each time the children have to decide on the ratio and their choice of class.
It helps to encourage students to use a full ratio explanation, using language like “for every 1 with this preference, there are 3 with this preference” or “here there is 1 with this preference against 3 with this preference”. The explicit reference to what in probabilities language is “favourable cases” versus “non-favourable cases” should help the students reason about ratios more explicitly too.
Watch out! Because of the aim of helping the children understand why the use of ratios makes sense in these comparisons; this is a restricted set of items in which the ratios always involve whole numbers. The children do not have to consider what any extra counters might mean when comparing different ratios if the simplification of the ratio were not an exact division. When we tried items like the comparison between 19:3 and 25:4, the children reorganised the tokens and came up with the solution 6:1 remainder 1 for both groups. They then concluded that the ratios were the same. They did not realise that 1 item in a total of 22 and 1 item in a total of 29 mean different things for the probability. We thus decided to leave items such as these, for a later exercise, in which they will be using calculators. In session 4, they will be able to explore extra items using a calculator and consider situations in which numbers do not divide exactly. The use of calculators will allow them to work out the exact ratio to 2 decimal places.
Game 2 and Game 3
Each have 6 similar questions, but were separated into different games to allow for different paces of work, after game 1, when children are confident to use the counters to work out and then record ratios. Children could work in pairs in the IT suite at their own PC.
The class must come back together at the end of the session to look at the 12 questions on screen one at a time and hear different pairs’ explanations about which class gives the best chance and why. Children can show their reasoning with counters.
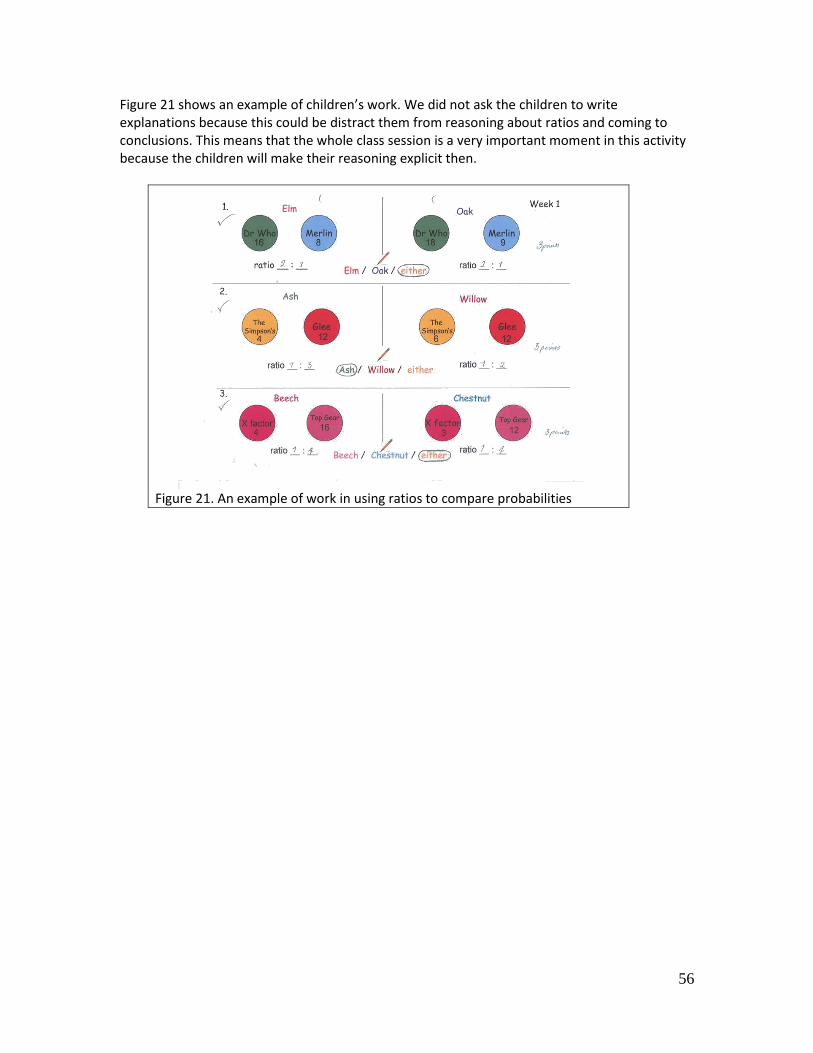
56
Figure 21 shows an example of children’s work. We did not ask the children to write explanations because this could be distract them from reasoning about ratios and coming to conclusions. This means that the whole class session is a very important moment in this activity because the children will make their reasoning explicit then.
Figure 21. An example of work in using ratios to compare probabilities
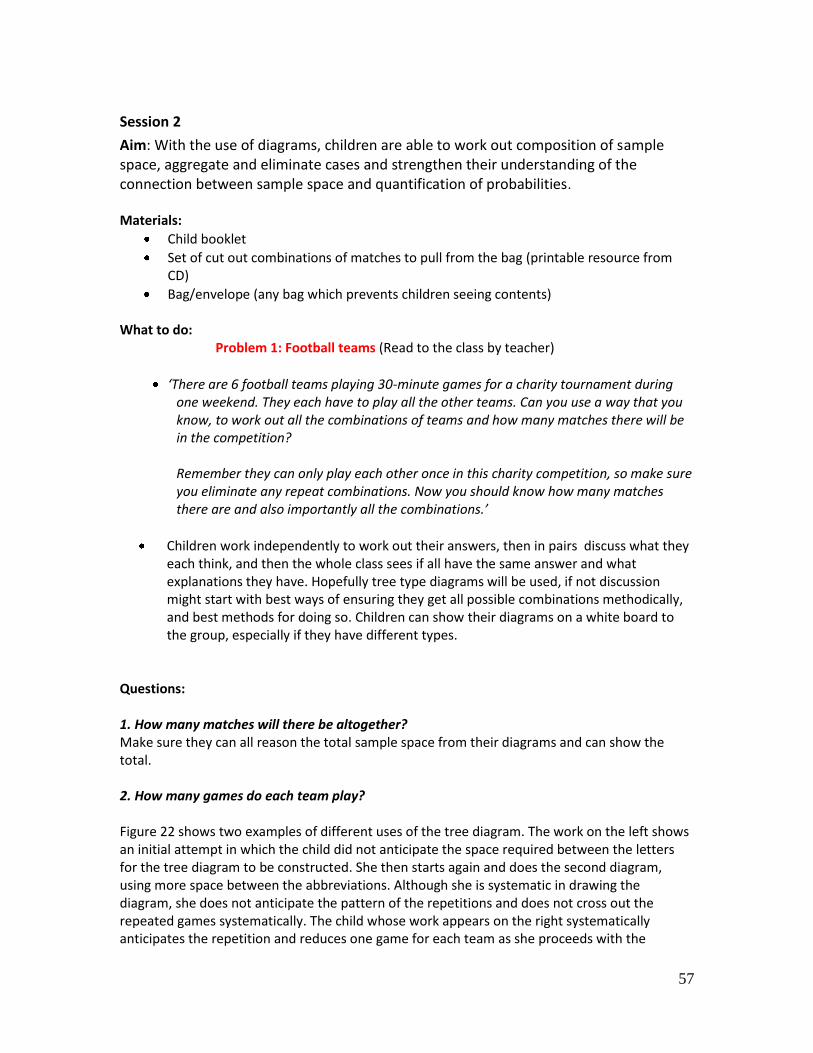
57
Session 2
Aim: With the use of diagrams, children are able to work out composition of sample space, aggregate and eliminate cases and strengthen their understanding of the connection between sample space and quantification of probabilities. Materials:
Child booklet
Set of cut out combinations of matches to pull from the bag (printable resource from CD)
Bag/envelope (any bag which prevents children seeing contents) What to do:
Problem 1: Football teams (Read to the class by teacher)
‘There are 6 football teams playing 30-minute games for a charity tournament during one weekend. They each have to play all the other teams. Can you use a way that you know, to work out all the combinations of teams and how many matches there will be in the competition?
Remember they can only play each other once in this charity competition, so make sure you eliminate any repeat combinations. Now you should know how many matches there are and also importantly all the combinations.’
Children work independently to work out their answers, then in pairs discuss what they each think, and then the whole class sees if all have the same answer and what explanations they have. Hopefully tree type diagrams will be used, if not discussion might start with best ways of ensuring they get all possible combinations methodically, and best methods for doing so. Children can show their diagrams on a white board to the group, especially if they have different types.
Questions: 1. How many matches will there be altogether? Make sure they can all reason the total sample space from their diagrams and can show the total.
2. How many games do each team play? Figure 22 shows two examples of different uses of the tree diagram. The work on the left shows an initial attempt in which the child did not anticipate the space required between the letters for the tree diagram to be constructed. She then starts again and does the second diagram, using more space between the abbreviations. Although she is systematic in drawing the diagram, she does not anticipate the pattern of the repetitions and does not cross out the repeated games systematically. The child whose work appears on the right systematically anticipates the repetition and reduces one game for each team as she proceeds with the
58
diagram. The comparison between diagrams helps children to see that different drawings lead to the same answer and also that they can be more systematic when crossing out the repeated games.
2) Teams from the bag
As it is a charity event, explain that the order of the matches is going to be decided by drawing the matches out of a bag, not as they are done in the football league.
I have all the match combinations in the bag and we are going to work out some probabilities of which will be drawn out. What is the probability of Chelsea playing in the first game? Write down your answer. Ask them to explain how many chances the team has out of how many total chances. Refer to their diagrams (5 chances out of 15).
When they have written their answer, make the draw from the bag to see which teams are playing the first match. This can be recorded on the whiteboard for all children to see.
Now ask the children to write down the probability of one of the teams that has just been drawn (e.g. if Chelsea was one of the teams, ask about Chelsea) playing in the second game. Discuss with the group and see if they can explain why the probability changes from 5/15 to 4/14 and why they should adjust their answer according to the reduced probability. Some children will notice that a team that was just drawn is now in fewer matches in the bag but they will forget that now there no longer are 15 strips in the bag but there are now 14. (If the children want to know whether the probability of the team being drawn has decreased, because there are now fewer matches in which it plays, or increased, because the number of matches in the bag is smaller, they can carry out the divisions: 5/15, which is 0.33, is a tiny bit more than 4/14, which is
Figure 22. The child on the right uses all the combinations and then crosses out the repetitions; the child on the left anticipates the repetitions and eliminates them during the production of the diagram
59
0.29. This is not necessary, but it is possible that a child will ask the question.)
Continue to ask questions about the probability of teams being chosen, and construct these questions according to which teams get pulled out each time. The children must remember that the number of matches which the team is still going to play and the number of matches in the bag change.
Continue with several questions until all children have had a turn to offer an answer and can discuss how the probabilities alter according to each draw.
Problem 2: Cake factory mix up (Read to the class by teacher)
”You work in the cake factory which is making cakes for the end of term parties which all the schools in Oxford are planning”.
“The factory has: 3 flavours: orange, lemon, strawberry. 3 fillings: vanilla, butter-cream, jam 3 toppings: nuts, choc drops, cherries”.
“You need to make boxes for each different combination of cake.1 cake per box. How many different boxes must you make? (27) How can you make sure that
you don’t repeat any or leave any out? This is the number of boxes you deliver to each school so make sure that you have the right number of boxes”. Once they have worked out their answer, read the following:
“There is a problem! You have loaded the delivery van and separated the boxes for the different schools but now the schools’ secretaries have called in and have said they don’t like some combinations:
School A doesn’t want nuts on the lemon cake. School B doesn’t want jam filling with cherry topping. School C doesn’t want butter-cream with the choc drops”.
“Can you work out how many boxes will have to be taken out of the van for each school because they contain the cakes with combinations of flavours that the schools don’t want? ” Encourage them to use their diagrams for eliminating cases.
“Can you work out what is the ratio of unwanted boxes compared to correct boxes? (9:18, i.e. in each school 3 boxes will be unwanted, so 9 altogether for 3 schools, and 18 will be right; if the children think more about this, they will realise that combining 3 fillings with 3 toppings gives the same number of combinations as combining 3 toppings with 3 flavours of cake.) Some children will simplify this to 1:2, i.e. there is one box with unwanted cakes for each group
60
of 2 boxes with wanted cakes)”.
“There is another problem! You have not written the cake combinations on the boxes and you don’t have time to open all the boxes and look inside; so you have to just pick some boxes and take them out”.
“Do you think you are more likely to take out a box that you actually want to take out or do you think you are more likely to take out a box that you actually wanted to leave in the van? Explain why”.
They need to work out: What is the probability for each school of taking out of the van a box with unwanted cakes? (3 out of 27). Then for all 3 schools (9 out 27; if the children simplify this, 1 out 3) What is the probability of taking out of the van a box with cakes that the schools actually wanted to have? (18 out of 27; if the children simplify this, 2 out of 3).
Discuss: Once children have worked out their answers and discussed with their partners, discuss as a class how they worked out the total number of boxes and how they can eliminate from their diagram the unwanted boxes. Also how they worked out the ratios of unwanted boxes for removal, compared to correct boxes to keep on the van. Why the answers are the same for each school? (this is a difficult question!) Also how they worked out the probability 9/27 (or 1/3) of taking out a box that they do want to take out and 18/27 (or 2/3) as the probability of taking out a box that you actually wanted to leave in the van (they should refer to the number of boxes of each type, 9 and 18, and the total sample space, 27). Encourage the children to refer to their diagrams for the unwanted cakes and for the total sample space.
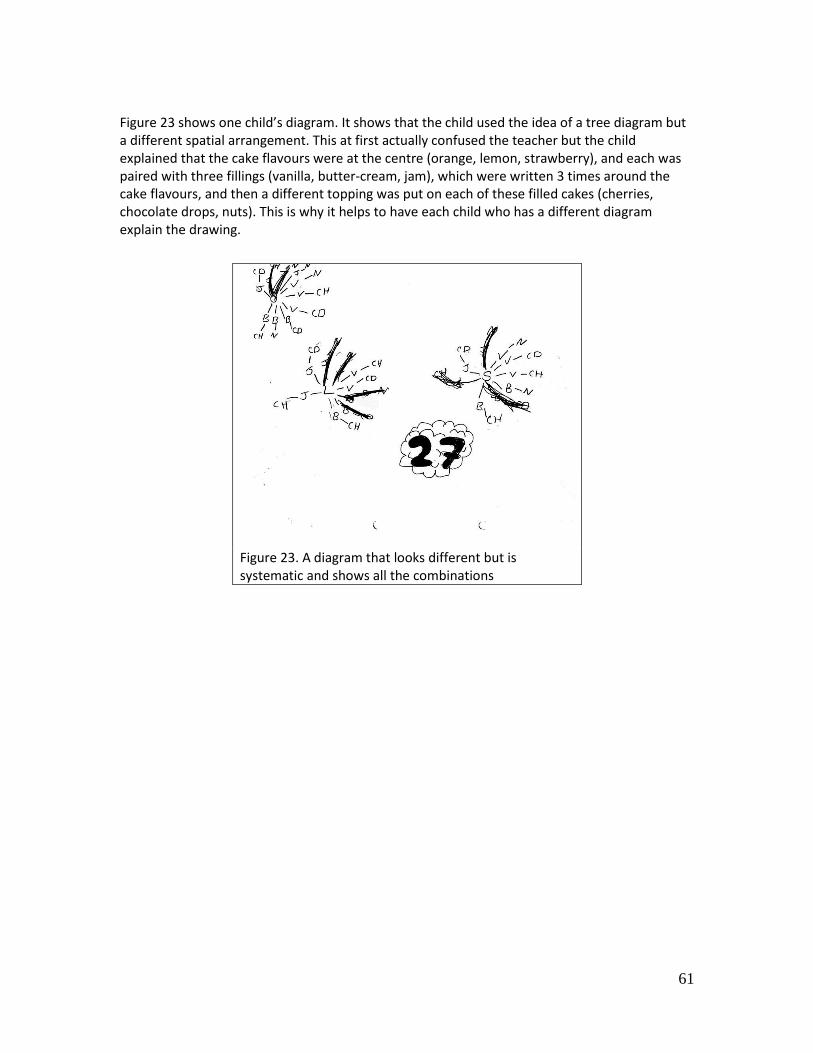
61
Figure 23 shows one child’s diagram. It shows that the child used the idea of a tree diagram but a different spatial arrangement. This at first actually confused the teacher but the child explained that the cake flavours were at the centre (orange, lemon, strawberry), and each was paired with three fillings (vanilla, butter-cream, jam), which were written 3 times around the cake flavours, and then a different topping was put on each of these filled cakes (cherries, chocolate drops, nuts). This is why it helps to have each child who has a different diagram explain the drawing.
Figure 23. A diagram that looks different but is systematic and shows all the combinations
62
Session 3
Aim: Children are able to quantify using ratios and evaluate chances of an event. Children are able to begin interpreting cells on a Cartesian table. Materials:
Child booklet
Calculators
School dinner survey
Children are presented with problems in their booklets about ratios in the context of a school dinner survey.
For each question they are asked to consider which school has the best ratio for finding a particular food preference on a particular day, which is marked with an asterisk (*). Not all children have school lunches every day, so the total numbers of children using the school cafeteria differ day to day. Also, different year groups are surveyed on different days so the total numbers vary.
Unlike questions in session 1, the ratios will require use of a calculator in order to be more exact. If children cannot remember ratios from session 1, have some counters available to show the first few problems with counters and how to divide counters to obtain the ratio.
What to do:
Explain that there are some schools which have answered the survey for the school meals service about which of 2 particular dishes they prefer, which lets them know where certain meals should be delivered each day to please the most children.
The children have to look at the numbers from the survey for each class/school and work out the ratio using a calculator by dividing the larger number by the smaller.
Explain that this information about the dinner preferences has been put into tables to make it easier for the school cook to work out where to deliver.
There are 6 tables for the children to work on and each time they work horizontally across the table when working out the preference ratios and write their results at the side.
63
When they have worked out the ratios for each school, they then have to make a decision about which gives the best ratio for a particular food which is marked by an asterisk (*).
For the first 5 questions, the teacher reads out the numbers from the tables and checks that children are clear on how to read the information. Children then work in pairs to work out the 2 ratios and then for each question, go through as a class to compare the 2 ratios and ask the children to explain how this affects their decision for where to deliver which food.
For the subsequent 12 problems, children can work at their own pace with a partner working out the ratios and the choice of school showing the best ratio for the particular food targeted.
They can discuss with a partner first, then at the end of the game, the class must discuss their answers to give children an opportunity to discuss their choices, correct or incorrect and explain their reasoning.
Discuss It is important that children discuss as a class what significance the number to two decimal places has and how they interpret this information (e.g. when comparing 1:3 to 1:3.2). The decision making process when they are deciding which ratio offers the best chances is important to talk through repeatedly to be sure children are reasoning correctly. Watch out! Some children may need help at first with writing the ratio in the correct order (e.g. it may be written 1:4 or 4:1), depending on how the survey numbers are placed. Discuss the importance of getting the numbers on the correct side of the ratio sign.
This session prepares them for sessions 5, when information will be presented in similar tables but they will need to work out ratios horizontally and vertically to compare the 4 cells.
64
Session 4:
Aim: Children are able to work out the composition of sample space, aggregate and eliminate cases in problem solving situations and quantify probabilities of events. Children also use ratio calculations to start to make decisions about correlations. Materials:
Child booklets
Bag/envelope with dance pair combinations cut out (printable resource from CD)
Larger paper and marker pens
Calculators Aggregating and eliminating cases What to do:
Problem 1: Dance show (Read by teacher to class)
‘There are 10 people in the dance show, 5 men and 5 women. They have to be in mixed pairs for the dancing, so men cannot dance with men, or women with women.’
Using the large paper and pens, in pairs children can work out using a systematic method: i) The number of dances that will be performed
ii) How many times each person will dance
(Ask children to circle the chosen dance pairs and cross through on their diagrams the eliminated dance pairs using different coloured pens for the following questions.) iii) What is the probability that a dance will be danced by couples whose names both start with the same letter? iv) What is the probability that a dance will be danced by both dancers wearing red costumes?
2) Pulling dance pairs from the bag The Teacher puts pairs of dancer names into the bag and does a draw:
i) What is the probability of pulling out the first pair of dancers with Billy in the pair?
Ask children to explain how they use their diagrams to work out the total number of combinations, then the number of pairings which contain Billy.
65
Pull a dance pair out of the bag and note down the pair on the board.
Continue asking the class 5 probability questions, depending on which dancers are pulled out of the bag, so the children reason to the class how the changing probability happens for each pair pulled from the bag. (Similar to the football teams question session 2, different contexts are used with the same reasoning to give the children the opportunity to attain generalisation across contexts.)
3) Association between variables in 2x2 tables – using ratio to make decisions about correlations Preparation for this activity started with the use of tables in the school dinner survey. In order to interpret correlation information in 2x2 tables, children need to have some experience in reading tables. The school dinner survey also involved comparison of ratios but in this activity the children must think what the ratios mean and attempt to draw conclusions. The numbers that we use in the correlation activities are small but we didn’t want the children’s reasoning to be hampered by calculation difficulties, so the numbers are simple in order to allow the children to focus on reasoning rather than calculation. Normally, larger numbers are used in 2x2 tables in order for an association to be inferred but sampling issues and reasoning about 2x2 tables can be treated independently in primary school. What to do: Explain to the class that by working out ratios as they have done in earlier questions with the school dinner survey, it is possible to compare ratios and discover if there is a connection between any two given things. Problem 1 Is there a connection between eating oat cereal for breakfast and levels of cholesterol? Ask if anyone can explain what cholesterol is and if not, give a brief and simple explanation along the lines of how cholesterol occurs in our bodies but that cholesterol can form fatty deposits which can block the arteries if levels are too high. The use of this context will help the children realise that the analysis of ratios can be useful in contexts that are relevant for life outside school.
Ask the children to make a guess first if they think eating oat cereal for breakfast has any connection with cholesterol levels before they look at the table in their booklet.
Once they have made their predictions, they have two pages of tables to look at for each question.
Ask them to work out the 4 ratios: eating oat cereal and having high cholesterol eating oat cereal and having normal cholesterol not eating oat cereal and having high cholesterol not eating oat cereal and not having high cholesterol
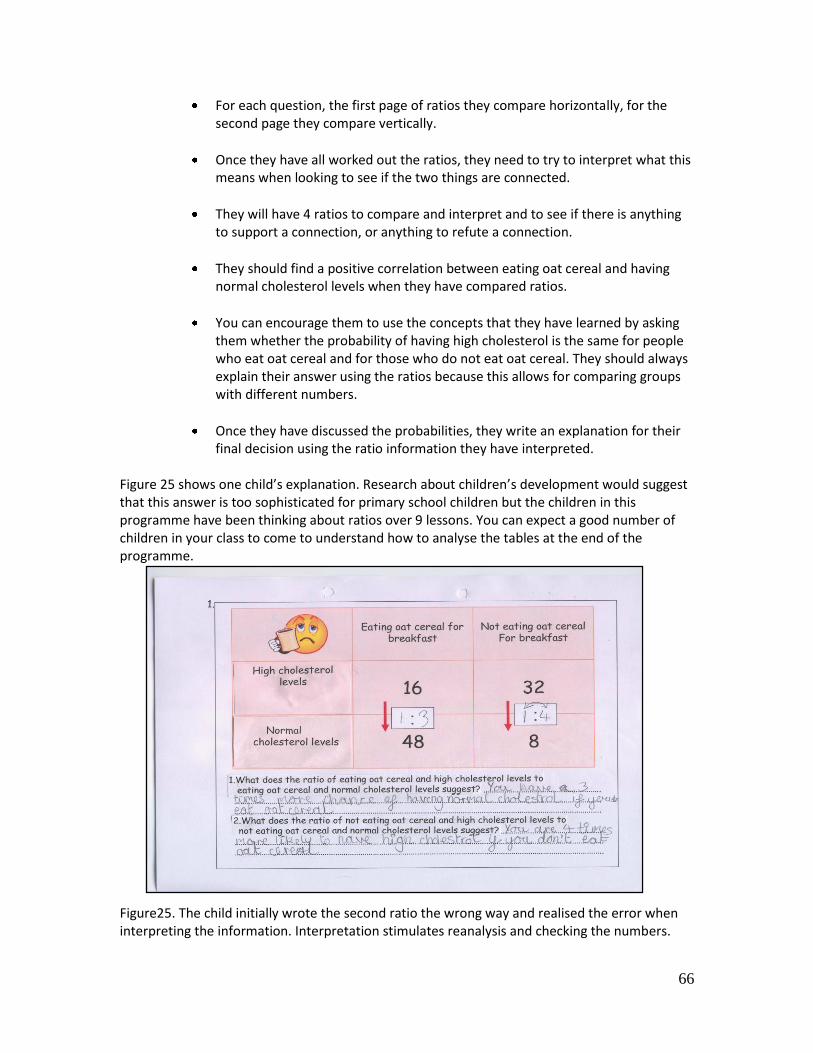
66
For each question, the first page of ratios they compare horizontally, for the second page they compare vertically.
Once they have all worked out the ratios, they need to try to interpret what this means when looking to see if the two things are connected.
They will have 4 ratios to compare and interpret and to see if there is anything to support a connection, or anything to refute a connection.
They should find a positive correlation between eating oat cereal and having normal cholesterol levels when they have compared ratios.
You can encourage them to use the concepts that they have learned by asking them whether the probability of having high cholesterol is the same for people who eat oat cereal and for those who do not eat oat cereal. They should always explain their answer using the ratios because this allows for comparing groups with different numbers.
Once they have discussed the probabilities, they write an explanation for their final decision using the ratio information they have interpreted.
Figure 25 shows one child’s explanation. Research about children’s development would suggest that this answer is too sophisticated for primary school children but the children in this programme have been thinking about ratios over 9 lessons. You can expect a good number of children in your class to come to understand how to analyse the tables at the end of the programme.
Figure25. The child initially wrote the second ratio the wrong way and realised the error when interpreting the information. Interpretation stimulates reanalysis and checking the numbers.
67
Discuss: Now there are 4 ratios to consider for each question, it is important that children are given lots of opportunity to talk in their pairs and in the larger class setting to explain their reasoning and to listen to that of others. They should see some evidence that will confirm e.g. that eating oat cereal shows lower cholesterol levels, but also that not eating it shows higher cholesterol levels. Get children to look for all evidence presented in the 4 cells. It is important that they also realise that not everyone who eats oat cereals ends up with normal cholesterol levels and not everyone who doesn’t eat oat cereals ends up with high cholesterol levels. The point of studying probabilities is that they should think ‘it is more likely that A happens if B happens’ but that they understand that this is about probabilities, and not about certainty. Watch out! As in many lessons before, some children will get the idea of using ratios to think about the tables quite easily and some will not. They will be able to move at their own pace in the next set of activities. But here it is very important that they explain the reasons for the conclusions that they reach. Associations between variables can be positive – that is, the more in one, the more in the other - but they can also be negative – the more in one, the less in the other. Negative associations are much more difficult to grasp so we have not included any examples in this programme. Among the children who examined the ratios in the tables, some found it difficult to conclude that there was no association between the variables when the ratios were actually the same. They did not realise that no association means that it doesn’t matter if you do x or not, the result is the same. This should be picked up in the discussion: ‘no association’ here is like ‘it doesn’t matter’ in the ratio comparisons that they did before. In the justifications, the children tend to look just at one pair of ratios. It is worth asking them to consider the other pair and see whether it leads to the same conclusion because sometimes it is easier to look at one pair of ratios than the other. This is the reason we asked the children to consider all the four ratios, interpret each pair, and the come to an overall decision about the association between the variables.
68
Session 5:
Aim: Children are able to use ratio calculations to help make decisions about possible correlations. For each question, start out by explaining the meaning of any words that the children might not know (e.g. eczema, decibel). It is important to ask the children to make a prediction because research shows that people are less willing to take into account evidence that goes against their beliefs. At the start of each question, we tell them to look at the evidence, not to think about people that they know who … (have eczema; listen to I-Pod all the time etc.). Part of the difficulty in the understanding of associations between variables is that people have their own beliefs and are not willing to take evidence into account. The choice of information in this programme was aimed at helping children think about evidence but also informing them about things that they may believe (e.g. that eczema is contagious, which is not correct) or should find out about (e.g. listening to the I-Pod at very high volume). Materials:
Child booklets
Calculators There are 3 more problems to be worked out in the same way as the cholesterol problem. Is there a correlation between? Problem 2: ‘Musical’ parents and the ability of the child to play an instrument (no correlation) Problem 3: Decibel level of I-Pod and hearing loss (correlation) Problem 4: Having contact with eczema sufferer and then developing eczema (no correlation)
As before, for each question, the children are asked to first of all make a prediction about whether there is a relationship between the two things in question.
Then they work out the ratios and try to interpret what this means for the question. They try to see if there is anything to support it, or anything to refute it.
They then write an explanation for their final decision using the ratio information they have interpreted.
Were they correct with their initial prediction about a connection between the two things?
Discussion: For each question, children put the case for their decision about whether there is or is not a relationship between two given things, and they are encouraged to use the ratios, show them on the whiteboard, convince other class members why they might be correct.
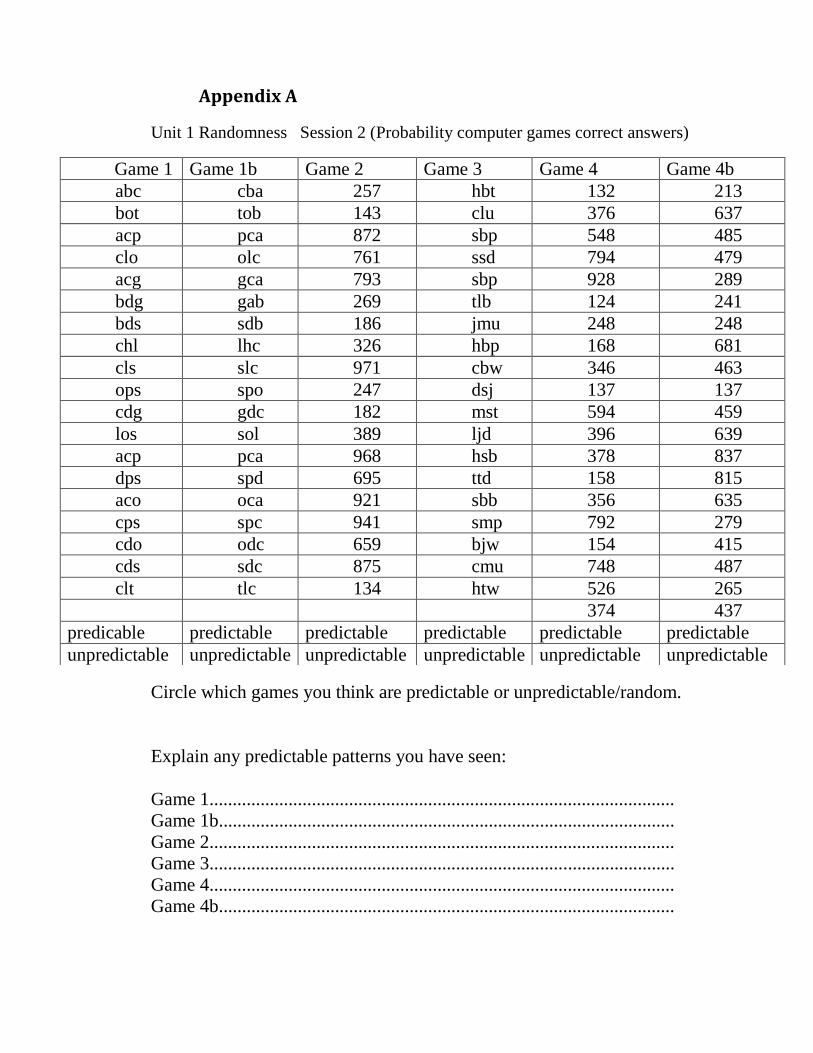
Appendix A
Unit 1 Randomness Session 2 (Probability computer games correct answers)
Circle which games you think are predictable or unpredictable/random.
Explain any predictable patterns you have seen:
Game 1....................................................................................................
Game 1b..................................................................................................
Game 2....................................................................................................
Game 3....................................................................................................
Game 4....................................................................................................
Game 4b..................................................................................................
Game 1 Game 1b Game 2 Game 3 Game 4 Game 4b
abc cba 257 hbt 132 213
bot tob 143 clu 376 637
acp pca 872 sbp 548 485
clo olc 761 ssd 794 479
acg gca 793 sbp 928 289
bdg gab 269 tlb 124 241
bds sdb 186 jmu 248 248
chl lhc 326 hbp 168 681
cls slc 971 cbw 346 463
ops spo 247 dsj 137 137
cdg gdc 182 mst 594 459
los sol 389 ljd 396 639
acp pca 968 hsb 378 837
dps spd 695 ttd 158 815
aco oca 921 sbb 356 635
cps spc 941 smp 792 279
cdo odc 659 bjw 154 415
cds sdc 875 cmu 748 487
clt tlc 134 htw 526 265
374 437
predicable predictable predictable predictable predictable predictable
unpredictable unpredictable unpredictable unpredictable unpredictable unpredictable
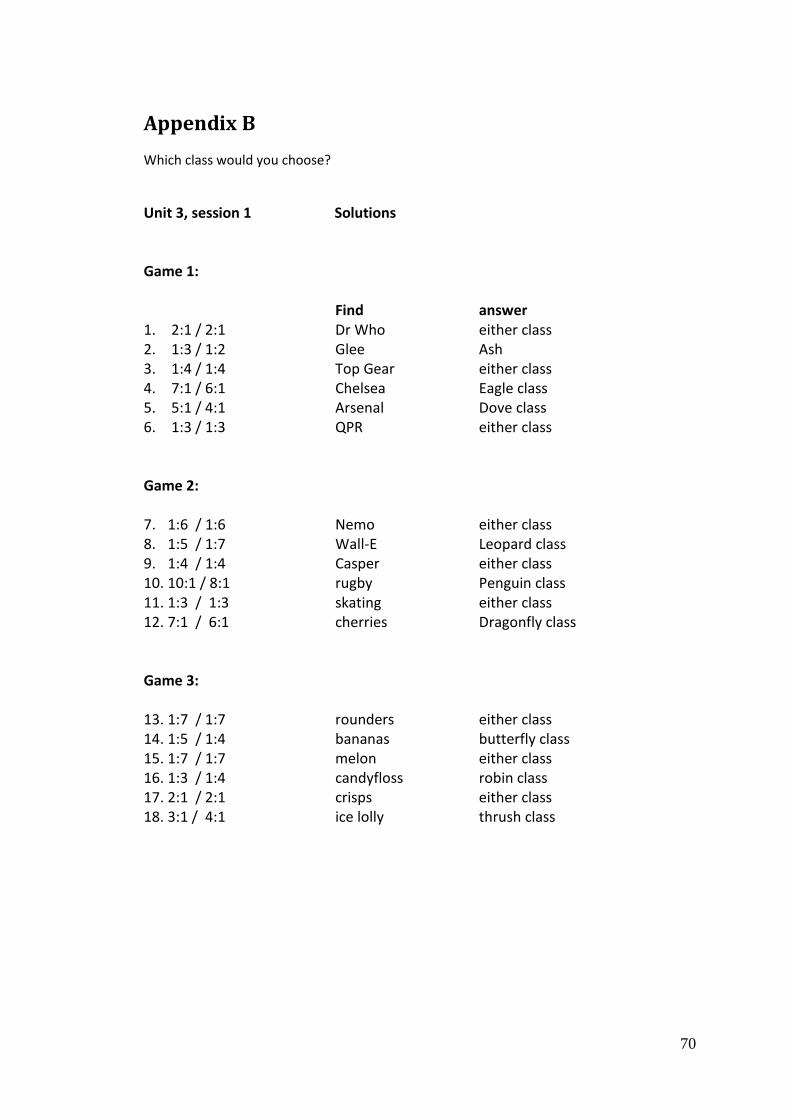
70
Appendix B
Which class would you choose?
Unit 3, session 1 Solutions Game 1: Find answer 1. 2:1 / 2:1 Dr Who either class 2. 1:3 / 1:2 Glee Ash 3. 1:4 / 1:4 Top Gear either class 4. 7:1 / 6:1 Chelsea Eagle class 5. 5:1 / 4:1 Arsenal Dove class 6. 1:3 / 1:3 QPR either class
Game 2: 7. 1:6 / 1:6 Nemo either class 8. 1:5 / 1:7 Wall-E Leopard class 9. 1:4 / 1:4 Casper either class 10. 10:1 / 8:1 rugby Penguin class 11. 1:3 / 1:3 skating either class 12. 7:1 / 6:1 cherries Dragonfly class
Game 3: 13. 1:7 / 1:7 rounders either class 14. 1:5 / 1:4 bananas butterfly class 15. 1:7 / 1:7 melon either class 16. 1:3 / 1:4 candyfloss robin class 17. 2:1 / 2:1 crisps either class 18. 3:1 / 4:1 ice lolly thrush class