Embed Size (px)
Citation preview
08-019
Copyright © 2007, 2008 by Robert S. Huckman, Bradley R. Staats, and David M. Upton
Working papers are in draft form. This working paper is distributed for purposes of comment and discussion only. It may not be reproduced without permission of the copyright holder. Copies of working papers are available from the author.
Team Familiarity, Role Experience, and Performance: Evidence from Indian Software Services Robert S. Huckman Bradley R. Staats David M. Upton
Team Familiarity, Role Experience, and Performance: Evidence from Indian Software Services
Robert S. Huckman Harvard Business School
Morgan 435 Boston, MA 02163 Tel: 617 495-6649 Fax: 617 496-4059
Bradley R. Staats* Harvard Business School
Morgan 428B Boston, MA 02163 Tel: 617 496-1462 Fax: 617 496-4066 [email protected]
David M. Upton
Harvard Business School Morgan 415
Boston, MA 02163 Tel: 617 496-6636 Fax: 617 496-4066 [email protected]
July 3, 2008 * Corresponding Author
Team Familiarity, Role Experience, and Performance: Evidence from Indian Software Services
Abstract
Much of the literature on team learning views experience as a unidimensional concept captured by the cumulative
production volume of, or the number of projects completed by, a team. Implicit in this approach is the assumption
that teams are stable in their membership and internal organization. In practice, however, such stability is rare, as
the composition and structure of teams often changes over time or between projects. In this paper, we use detailed
data from an Indian software services firm to examine how such changes may affect the accumulation of experience
within, and the performance of, teams. We find that the level of team familiarity (i.e., the average number of times
that each member has worked with every other member of the team) has a significant positive effect on
performance, but we observe that conventional measures of the experience of individual team members (e.g., years
at the firm) are not consistently related to performance. We do find, however, that the role experience of individuals
in a team (i.e., years in a given role within a team) is associated with better team performance. Our results offer an
approach for capturing the experience held by fluid teams and highlight the need to study context-specific measures
of experience, including role experience. In addition, our findings provide insight into how the interactions of team
members may contribute to the development of broader firm capabilities.
Team Familiarity, Role Experience, and Performance Confidential Draft: July 3, 2008
- 2 -
1. Introduction
In many contexts, ranging from product development to service delivery, a significant amount of an
organization’s work is conducted by fluid teams that aim to create innovative output (Edmondson and
Nembhard 2007). Fluid teams exist only for the duration of a single project and are composed of
members who may join or leave a team during the course of that project. In settings characterized by
such fluidity, simple measures of cumulative output may not accurately capture team experience,
particularly when changes in team composition are substantial over time.
In this study, we consider an approach for capturing the experience held by fluid teams. In doing
so, we extend the concept of team fluidity to allow not only for changes in overall composition but also
for changes in a team’s internal structure over time as junior members assume more-senior roles. This
broader approach for capturing team fluidity allows for greater granularity in the measurement of team
experience and a finer understanding of the determinants of team performance.
Scholars studying organizational learning have focused on understanding differences in rates of
learning across firms and teams for some time (Dutton and Thomas 1984; Argote et al. 1990; Pisano et al.
2001). Explanations for this phenomenon include variation in resources devoted to improvement
(Sinclair et al. 2000), team structure e, team beliefs (Edmondson 1999), and task experience (Schilling et
al. 2003). Further, teams and firms may differ on aspects such as the degree to which members observe
others in the use environment and the extent to which the experience of individuals is specific to the
context of a given team or firm (Huckman and Pisano 2006).
Though the concept of team fluidity is recognized in some work on learning (e.g. Arrow and
McGrath 1995; Cohen and Bailey 1997; Hackman 2002; Edmondson and Nembhard 2007) there have
been relatively few field-based empirical studies of the phenomena (Arrow and McGrath 1995). We
focus on two factors that impact the accumulation of team experience: (1) the familiarity of team
members with one another and (2) changes in the roles played by individual team members. Each of
these factors gains increasing theoretical interest once one assumes that teams are not stable over time.
While the latter factor is not widely considered in existing literature, there is a longer stream of work on
Team Familiarity, Role Experience, and Performance Confidential Draft: July 3, 2008
- 3 -
familiarity within teams as discussed in detail in the next section. Katz (1982) uses cross sectional
analysis to identify the relationship of familiarity with communication patterns. Edmondson et al. (2001)
use detailed case studies to provide theoretical support for the importance of familiarity in teams and
Reagans et al. (2005) go further still, using longitudinal data to provide empirical support for familiarity
in teams of surgeons.
Building upon this prior work, we aim to shed light on the degree to which changes in team
composition may affect performance. First, we are able to combine project data from one firm with
information about each member of each team in order to observe longitudinally how individuals move
across teams over time. As highlighted by others, it is useful to examine team leadership when
attempting to explain team performance, but even more beneficial to include all members of the team
(Edmondson et al. 2001; Huckman and Pisano 2006). We examine a measure of team familiarity that
accounts for the degree to which each member of a team has worked with every other member of that
team on previous projects. This measure allows us to consider the fluid nature of teams explicitly.
Second, we examine the impact of what we term role experience —the experience that individuals have
operating in their current roles of either team member or team manager— on team performance. We thus
do not need to make the restrictive assumption that each team member gains the same experience from a
given project and are able to explore the degree to which the buildup of experience may be affected by
changes in a team’s internal structure.
The setting for our empirical analysis is Wipro Technologies, a large firm in the Indian software
services industry. The attention devoted to this industry has increased in recent years due to its rapid
growth and central role in globalization. Beyond its current relevance, the Indian software services
industry is an appropriate setting for our analysis for several reasons. First, the business is based around
the completion of projects, which allows multiple observations of the dimensions of team experience that
are central to our study. Second, the technological sophistication of Wipro—and other firms in this
industry—yields a wealth of internal data not only about the composition and performance of teams but
also about the characteristics of individual team members and the specific roles (i.e., management versus
Team Familiarity, Role Experience, and Performance Confidential Draft: July 3, 2008
- 4 -
team member) they play on a given project. Similar to previous studies, we use project-level data.
However, we are also able to link project data to that for individual team members, thereby allowing us to
analyze teams, team members, and outcomes for which the teams are responsible. With this clear linkage
between a team’s composition and its performance, we are able to shed light on the relationship between
different measures of team experience and operational outcomes.
We find that team familiarity (i.e., the average number of times that each team member has
worked with every other member of the team) is positively related with team performance, but do not find
that various measures of individual experience—measured by the average years of either total experience
or firm experience across team members—have a consistent effect on performance after controlling for
team familiarity. When we substitute role experience for individual experience, we find evidence of
positive, though somewhat different, effects for both managers and team members.
In the following section, we examine the impact of experience on performance and build our
hypotheses. Next we describe the setting for our study and our data. We then discuss our empirical
approach and results and, finally, offer concluding remarks.
2. Impact of Experience on Performance
In his seminal paper extolling the performance benefits of a focused factory, Skinner (1974) argues that,
“Repetition breed[s] competence (p. 115).” The idea of repetition plays a major role in both
organizational learning and in the creation of routines and capabilities in general (Nelson and Winter
1982). While the strategy of “copy exactly” has worked well for Intel’s fabrication facilities (McDonald
1998), repetition in most settings is a more nuanced phenomenon, which we explore further below.
The learning curve, or the finding that cumulative production experience is associated with an
increase in performance, plays a central role in the study of organizational learning (Wright 1936; Dutton
and Thomas 1984; Adler 1990; Argote et al. 1990). While most studies focus on the organization or team
level, the learning curve is also seen at an individual level (Newell and Rosenbloom 1981; Delaney et al.
1998). Further work finds that organizations may learn at different rates (Dutton and Thomas 1984;
Pisano et al. 2001) and that they may forget (Argote et al. 1990; Benkard 2000; Thompson 2007).
Team Familiarity, Role Experience, and Performance Confidential Draft: July 3, 2008
- 5 -
The finding of the majority of these works is that the key driver of improved performance is
increasing cumulative experience. Organizations, teams, and individuals each develop routines for
solving problems. Learning then consists of the process of exploring, selecting and replicating new
routines for performance improvement (Nelson and Winter 1982; Zollo and Winter 2002). Thus, with
increasing experience one may get better at executing existing routines and developing new ones.
Other work within organizational learning suggests a more qualified and in some cases,
pessimistic, view of the impact of experience on performance (Sinclair et al. 2000). Building on the
underlying state of the knowledge being used and the user’s understanding of cause-and-effect
relationships, Pisano explores the idea of learning-by-doing versus learning-before-doing (Pisano 1994;
1996). He proposes that if a user understands a problem’s cause-and-effect relationship then it is possible
to reach a solution without going to the actual use environment. This suggests that the link between
experience and performance might be weak in environments where learning-before-doing is possible. In
a similar vein, Upton and Kim (1998) identify the risk of lock-in with different learning modes, and
Edmondson et al. (2003) link the state of knowledge to differential learning performance.
The value of experience is also called into question by the idea of competency traps or core
rigidities (Levitt and March 1988; Leonard-Barton 1992). These suggest that groups may become fixed
in their way of doing things and that as conditions change, the group will not respond. This implies that
experience may have a decreasing, or even negative, return when change enters a model. Staw (1980)
also highlights the potential negative impact of experience as he suggests that skill increases with tenure,
but effort and drive decrease over time, generating an inverted U-shaped relationship to performance.
2.1 Team Familiarity
Beyond the cumulative experience of a team or its members, we are interested in the impact of team
familiarity—the degree to which team members have worked with one another in the past—on
performance. In settings where teams are stable over time in terms of composition or structure, a team’s
level of familiarity can simply be measured by its cumulative experience. This is often referred to as team
tenure (Cohen and Bailey 1997; Hackman 2002). When teams are not stable, as in our study, familiarity
Team Familiarity, Role Experience, and Performance Confidential Draft: July 3, 2008
- 6 -
and cumulative experience of a team are, in general, distinct concepts. In particular, certain team members
may have worked with one another on past projects that did not involve all members of the current team.
As a starting point, it is important to consider why familiarity might yield superior performance.
The explanations can be broken down into two classes: (1) coordination and (2) willingness to engage in a
relationship (Reagans et al. 2005). With respect to the former, if a team is involved in a task that requires
joint activity and the knowledge to be shared is tacit (Polanyi 1967), familiarity may improve the ability
of the group to act in a coordinated manner (Moreland et al. 1998). For example, the literature on
technology transfer suggests that the transmission of technical knowledge between two parties is often a
social and costly process (Arrow 1969; Teece 1981). Repeated experience with each other may provide a
means to “unstick” some of this vital, but difficult to transfer information as the dialogue around potential
solutions becomes more structured (von Hippel 1994; Monteverde 1995).
Due to shared experiences, individuals may develop team human capital (Chillemi and Gui 1997)
or network-specific human capital (Mailath and Postlewaite 1990) which aids performance. For example,
to explain the near flawless operation of an aircraft carrier’s flight deck, Weick and Roberts (1993) claim
that familiarity leads to “heedful interrelating” which provides the team with a common platform for
learning and action.
A similar argument with respect to coordination can be found in the literature on transactive
memory systems. In particular, a transactive memory system—the combination of knowledge and an
accurate representation of who knows what—can have a positive impact on performance (Wegner 1987).
This idea of knowing where key expertise resides may prove important if positions in a team are not pre-
defined and judgment is used to assign individuals to tasks (Liang et al. 1995; Faraj and Sproull 2000).
The second class of explanations for a positive relationship between team familiarity and
performance revolves around the willingness of individuals to engage in a relationship. For example,
team beliefs—in particular, team “psychological safety”—can impact both learning and performance,
especially if team members do not feel comfortable taking risks. Edmondson (1999) shows that team
familiarity (among other things) can contribute to psychological safety. Additional work has shown that
Team Familiarity, Role Experience, and Performance Confidential Draft: July 3, 2008
- 7 -
shared experience can lead to trust, thereby increasing the amount and quality of information shared by
individuals (Granovetter 1985; Uzzi 1997; McEvily et al. 2003).
As with individual and organizational experience, some question whether the benefits of team
familiarity are always positive. Katz (1982) examines team longevity and finds that teams that stay
together become more isolated from information sources and that this tendency counteracts the benefits of
familiarity and internal communication. Therefore, the relationship between tenure and performance
exhibits a curvilinear or inverted-U-shaped relationship. Using data from professional sports, Berman,
Down and Hill (2002) also find support for a curvilinear relationship. Both of these studies examine
longstanding teams. The inflection point at which performance degrades in Katz’s study does not occur
until after greater than five years together as a team (Katz 1982). This suggests that project teams whose
lifetimes are measured in months rather than years may be less likely to see a negative effect.
Therefore, we predict:
HYPOTHESIS 1. Team familiarity is positively related to team operational performance.
2.2 Team Structure and Roles
Changes in the internal structure of teams (i.e., roles of individual members) represent another aspect of
team experience that becomes relevant once one assumes that teams are not perfectly stable entities. Our
interest in this case is not in socially constructed roles and the conflict or confusion that may arise from
changes in them, but rather in individuals’ formal roles within teams. For example, in product
development, a team made up of individuals with diverse backgrounds may maintain consistent
membership but choose a different leader for subsequent projects based on which member has the most
industry-specific experience relevant to a project (Sutton and Hargadon 1996). Alternatively, a team may
consist of a project manager, middle managers, and team members. After completion of a project, the
project manager may leave the team, and one of the middle managers may be promoted to project
manager. Here both membership and structure change. In each of the cases described, the change in
structure or roles may impact performance.
Team Familiarity, Role Experience, and Performance Confidential Draft: July 3, 2008
- 8 -
To capture these distinctions we introduce the concept of role experience – the experience that
individuals have operating in their current role on the team. Our concept is related, but not identical to
the idea of task-specific human capital (Gibbons and Waldman 2004; 2006). Much of the human capital
amassed in a job may be specifically related to the task repeated as opposed to being general or firm-
specific. When examining task experience it is common to measure it as the total time someone has been
generating a particular output. This measure ignores the fact that an individual will gain different
knowledge and experience based on the role that she holds within the focal production unit. For example,
in a software team, the skills a manager needs to motivate individuals and interact with customers are
likely not entirely the same as those she needed when writing code. In our measure of role experience,
we capture the bundle of tasks that make up each hierarchical role within a firm and create a measure
useful for studying fluid teams, in particular, and evaluating experience accumulation more generally.
If changes in roles are more than just changes in titles, and require learning and using different
skills, then a change in role may reset—or at least set backwards—the experience “clock”. We predict:
HYPOTHESIS 2. Role experience is positively related to team operational performance.
Further insight may be gained in studying the impact of role changes by separately examining
managers and team members. Due to the different skill requirements for each role, the magnitude, and
perhaps even the existence, of a relationship between experience and performance may differ between
managers and team members. Theoretically, however, we expect a positive relationship between role
experience and performance for both managers and team members. Therefore we predict:
HYPOTHESIS 3A. Manager role experience is positively related to team operational performance.
HYPOTHESIS 3B. Team member role experience is positively related to team operational
performance.
3. Setting, Data, and Empirical Strategy
3.1 Setting
Wipro Technologies is a leading supplier of outsourced software services headquartered in
Bangalore, India. Wipro provides customized services throughout the world in areas including:
Team Familiarity, Role Experience, and Performance Confidential Draft: July 3, 2008
- 9 -
application development, engineering services, IT infrastructure management, maintenance, and testing.
Wipro offers these services across multiple industries, software languages, and technologies. At the end
of 2006, Wipro had annual revenues greater than three billion dollars and more than 66,000 employees.
Between 2001 and 2005, the Indian software services industry grew 29% annually – from $8
billion to $22 billion (NASSCOM 2005). In this context of rapid growth, adding new employees while
retaining qualified employees is a challenge. While the size and complexity of deals are increasing,
pricing is not keeping pace with wage inflation because of gains in supplier efficiency and competition in
the marketplace (Moore 2007). Allocating existing experience and building new expertise is vital
because of these conditions of growth, turnover, and pressure on cost and price.
We focus on software development projects, as they offer the opportunity to use numerous
controls across projects. Development involves capturing customer requirements, designing a solution,
writing code to meet these objectives and testing the final output. Capturing the lines of new code, effort
used and software language (amongst other factors) allows us to control for complexity across projects.
The median development project at Wipro during our sample period lasted six months and had a
team size of 12 people. When a project is completed, the team typically breaks up and is distributed to
new projects as opportunities arise. Some team members might shift to a project to fix bugs and add
enhancements to the previous project and some might end up working together again, but development
project teams typically do not stay together in their entirety over multiple projects.
Organizationally, Wipro is divided into multiple business units, each of which contains subunits.
Both marketing and staffing typically take place within the subunit. Wipro’s utilization rate is close to the
maximum sustainable utilization when time for vacation, training, and transitions is considered. Given
the firm’s growth rate, involuntary employee turnover is low at Wipro. Within a project team, there are
both middle managers and project engineers in addition to one or more project managers (PMs). Project
engineers write software code, while middle managers are typically “player-coaches” who manage
portions of projects and write code. PMs manage overall projects and typically do not write code.
Team Familiarity, Role Experience, and Performance Confidential Draft: July 3, 2008
- 10 -
3.2 Data
Our sample begins with the universe of 1,004 development projects completed at Wipro from January
2004 to September 2006. We have human capital data for each of the 11,376 individual employees on
these project teams. In addition, we have historical data on Wipro employees back to the year 2000 for
all types of projects (development, maintenance, etc.), yielding a total of approximately 350,000 project-
person records. The additional historical data does not include project outcome data, but does provide us
with employees’ previous project experience. Using this information, we create individual work-
experience histories and track the other individuals who worked on project teams with a given employee
over time. After removing small projects with less than five team members and those with missing data,
we are left with 543 projects for our analysis.1 The sub-sample on which we conduct our analyses is
therefore, effectively all development projects completed by teams which use kilolines of code as their
unit of measurement. Comparing projects missing data to those not missing data on observable criteria
revealed no meaningful differences in our variables of interest.
Like other leading firms in the Indian software services industry, Wipro has achieved Capability
Maturity Model Integrated (CMMI) Level Five status (SEI 2001). As part of reaching this status, an
organization must accurately track its operational performance. Project and employee information at
Wipro is recorded using an internally developed web-based system. The system not only contains project
performance information but also provides lifecycle models, project documentation, and reference tools.
Project managers enter data in monthly, quarterly, and end-of-project reports. Employees record which
projects they are working on each week, and these reports undergo rigorous quality assurance and are
subject to random audits. Typically employees work on one project at a time. Employee demographic
information, such as birth date and start date at Wipro, is drawn from the firm’s multiple HR systems.
1 411 projects are missing the variable kilolines of code (KLOC). Many projects do not track KLOC and instead use another unit of measurement. Also, some projects do not include a coding component and are naturally excluded from our analysis. Thirteen other projects are missing one of the variables of interest.
Team Familiarity, Role Experience, and Performance Confidential Draft: July 3, 2008
- 11 -
Dependent Variables
Identifying objective measures of performance in information technology has proven difficult (Banker
and Kemerer 1989), forcing researchers to rely appropriately on survey data (e.g. Faraj and Sproull 2000).
We focus on two objective, customer-facing measures of operational performance: (1) output quality and
(2) adherence to schedule and effort estimates. We choose these measures, as they are used for internal
performance measurement, are important to Wipro’s customers, and are outcomes over which the team
has substantial control. For example, when Wipro administers its customer satisfaction survey, it includes
separate questions related to quality and adherence.
Output quality. Our first dependent variable measures the quality of Wipro’s output through a count of
post-delivery defects. Customer acceptance testing occurs as a final step in most development projects
and is the point at which code is tested against the project’s predetermined objectives. The customer (or a
third party representing the customer) performs the testing, so the results are not open to manipulation by
Wipro. In software engineering, the number of defects in acceptance testing is a common measure of
quality (Boehm 1981; Jones 1986). The Wipro audit group checks all projects showing no defects to
confirm that customer acceptance testing took place.
Adherence. A measure of team performance, or efficiency, is whether the team delivers the project on
time and on budget (Boehm 1981; Faraj and Sproull 2000). Sales personnel estimate both the schedule
and effort required for a project prior to its start2. These estimates are confirmed with the customer and
formally recorded. Wipro operates in a competitive marketplace, so the company is not able to build
significant slack into these estimates, as customers could move their business to other firms. During a
project, either estimate may be modified, primarily because of scope changes by the customer. Any
revisions must be justified by a customer-approved change request. Prior to changing the estimate, both
business and quality managers at Wipro must also approve the request to make sure that no manipulation
is taking place. The revision process is not an opportunity for a project manager (PM) to game the
2 An important question is whether there is any bias in the creation of estimates. Including customer controls in the models accounts for circumstances unique to specific customers. Additionally, the data does not show clear signs of bias as, for example, estimated effort is not correlated with the deviation between actual and estimated effort.
Team Familiarity, Role Experience, and Performance Confidential Draft: July 3, 2008
- 12 -
system, and a PM cannot revise estimates because a project is not making adequate progress. We use the
revised estimate in our analysis, as it more fully incorporates a project’s final objectives.
As we have estimates and actual values for both schedule and effort, it is possible to construct
continuous variables to measure performance. For effort we create the variable, effort deviation, by
subtracting estimated effort from actual effort and dividing by estimated effort. We normalize the
measure, as we would expect larger absolute differences for larger projects. We do not analyze schedule
deviation as the data suggests that it is not, in fact, a continuous measure – over 70% of the projects in our
data deliver on the day the project is due3. This suggests that, at least in some cases, teams may finish
before the delivery date, but wait to deliver the code, perhaps because the client is not ready for delivery.
Discussions with project personnel at Wipro suggest that there is a discontinuous jump between
delivering a project on time (or on budget) versus failing to do so. All things being equal, earlier delivery
or less effort is better, though delivering as expected is the most important criterion. A project manager at
Wipro notes, “The target is what we’re really looking at. My job is to make sure that there isn’t slippage
[in schedule] or overrun [in effort].” To capture the importance of meeting these targets, we create
dichotomous variables, effort adherence and schedule adherence, each of which equals one if a project
delivers at or better than the estimate and zero otherwise.
Finally, we consider the impact of adhering to both the effort and schedule estimates. Though the
measures can be evaluated separately, our fieldwork suggests that Wipro personnel view them jointly
with a team being either on plan or not on plan. A Wipro manager notes, “A project must have no
schedule deviation and no effort deviation. If you fail there then the customer thinks you are a criminal.”
These areas are included jointly in the delivery section of Wipro’s project customer satisfaction surveys.
To address this issue, we construct a joint variable, adherence, which equals one if a project delivers at or
better than its schedule and effort estimates and zero otherwise.
3 While 76% of projects finish at or below their effort budget, only 2% of projects finish with zero effort deviation.
Team Familiarity, Role Experience, and Performance Confidential Draft: July 3, 2008
- 13 -
Independent Variables
Team familiarity. Similar to Reagans et al. (2005), we measure team familiarity by first calculating the
number of times each pairing of team members i and j has worked together on a project at Wipro within
the two years4 prior to the current project. We sum this value, PWij, over every pair on a team to capture
team-specific experience, 2/)1(/1 1
−∑ ∑= =NNPW
ij
N
i
N
j, where N is team size.
Role experience. We calculate the average role experience—measured in years—across individuals on
each team. For project managers, we identify the first day that the individual appears in the Wipro dataset
as a project manager and subtract that date from the project’s start date. For this calculation, we look at
all types of Wipro projects (e.g., maintenance, development, conversion, testing) to identify the role
experience for a project manager. We repeat the same process for middle managers, identifying when
they first became middle managers. Role experience for project engineers is the same as Wipro or firm
experience because project engineer is the most junior role at the firm. We then calculate an overall
project variable—role experience—as the weighted average of role experience across all team members.
We weight by the number of days each individual spends on the project.
Fewer than 5% of the PMs in our data are left censored for role experience, as they were
promoted to their managerial positions prior to the start of our historical data (none of the middle
managers are left censored). To correct for this censoring, we calculate a revised value for role
experience. In particular, we examine first-time PMs in our data to identify the distribution of time at
Wipro prior to promotion. We then add the median value of this distribution to the censored individual’s
start date at Wipro to determine the estimated date of promotion to manager. This estimated date is then
4 Establishing the time period over which familiarity is calculated is an important issue. Similar to the decay of learning (Argote et al. 1990; Benkard 2000) it is likely that the impact of team familiarity also decreases over time. Given that the average project lasts six months, we use a two-year window. We run all models with familiarity calculated over three years and get similar results. We also conduct sensitivity analyses at higher values and obtain qualitatively similar results, although for these higher values we lose projects from our sample due to censoring because our historical data starts in 2000.
Team Familiarity, Role Experience, and Performance Confidential Draft: July 3, 2008
- 14 -
used to calculate revised role experience. As a robustness check, we also use the 25th and 75th percentile
values of time at Wipro prior to promotion and find no meaningful differences in the results.5
In addition to the overall role experience measure, we calculate separate weighted-average role
experience variables for all PMs on a team and for all project engineers on a team, but not for middle
managers on a team. We focus on just PMs and project engineers for two reasons. First, the split is
theoretically “clean”, as it allows us to consider pure managers and pure team members. As noted above,
middle managers (e.g., a module lead) hold a “player/coach” role in that they both oversee portions of the
project (as managers) and write code (as team members). Second, if we add role experience for middle
managers, we lose observations, as many projects do not have middle managers.
Though we have discussed team familiarity and role experience as conceptually distinct
components of experience, it is important to note that they are also practically separable. Individuals can
gain role experience without increasing team familiarity by continuously changing the team members
with whom they work. Similarly, an increase in team familiarity may occur as individuals are shifting
across roles, thereby resulting in low role experience.
Control Variables
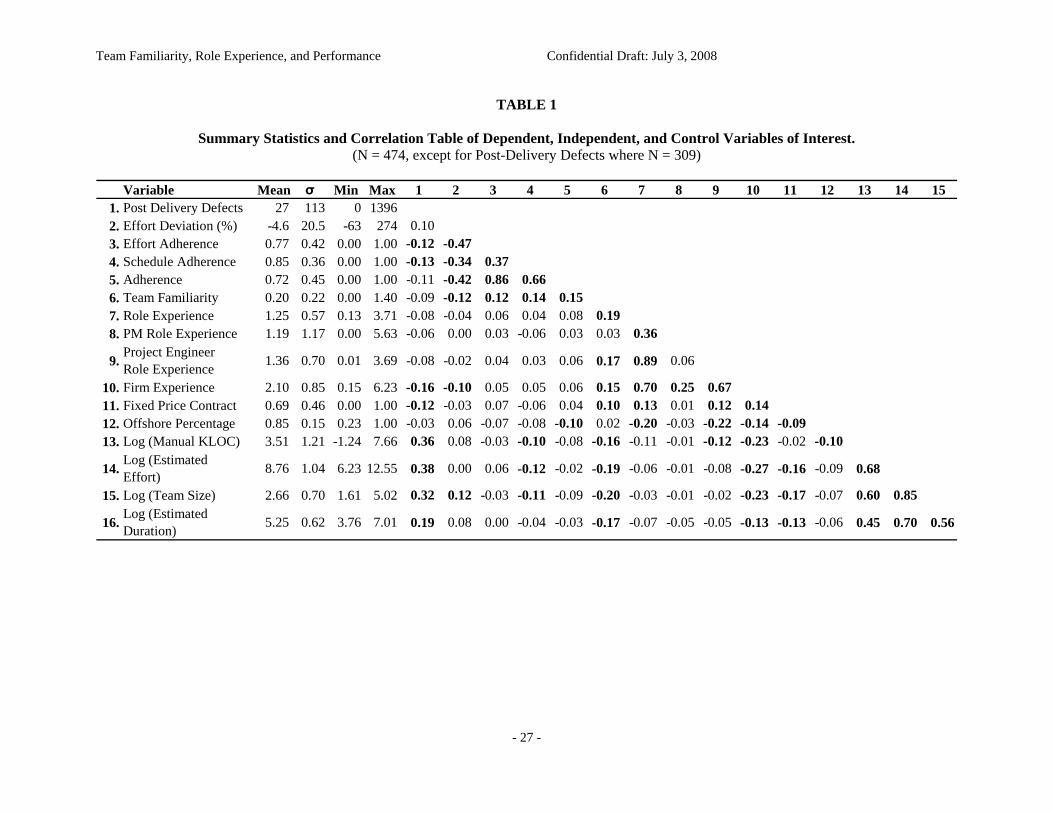
We control for numerous variables that could impact operational performance. Table 1 provides
summary statistics and correlations for the key variables in our analysis.
*******************************Insert Table 1 about here******************************* Firm experience. For each team, we calculate firm experience as the weighted average of the Wipro
work experience across all team members. We weight each individual’s experience by the number of
days spent on the project. We use firm experience instead of general experience because the data
available for analysis is more complete. Our database includes the firm start date as well as previous
experience for Wipro employees. However, approximately 10% of Wipro projects use outside
contractors as team members, and for these individuals we have only the contractor’s Wipro start date. If
we were to use general experience, we would need to exclude each of these projects due to missing data. 5 We run two further robustness checks on all models. First, we remove all projects with a censored PM. Second, we add an indicator set to one if a project has a censored PM. Both approaches generate the same pattern of results.
Team Familiarity, Role Experience, and Performance Confidential Draft: July 3, 2008
- 15 -
We expect firm experience and total experience to have a similar impact on performance, as over 47% of
Wipro’s employees in our sample have no previous work experience upon joining the firm and more than
65% have less than two years of prior experience.
Fixed price contract. Typical of the industry, most contracts at Wipro take one of two forms: time and
materials (T&M) or fixed price (FPP) (Banerjee and Duflo 2000). With a T&M contract (known
elsewhere as cost-plus), the customer pays a negotiated rate for the hours that Wipro engineers spend on
the project. For an FPP contract, the customer and Wipro agree on the requirements and a flat payment.
With a T&M contract, the customer traditionally bears the risk of effort overage and benefits of underage,
while with an FPP contract, Wipro bears the risks and benefits. In our analysis, we use an indicator
variable, fixed price contract, set to one if a project has a FPP contract and zero if it has a T&M contract.
Offshore percentage. Using employee data, we determine the percentage of work completed in Wipro’s
Indian locations (offshore) versus that completed at the customer’s location (onsite). We construct a
measure of the offshore hours as a percentage of the total hours on a project. Increasing offshore hours
could improve performance if Wipro operated more efficiently at its India locations than at customer
locations. Alternatively, increasing offshore hours could negatively impact operational performance if it
created a disconnect from the customer, making it more difficult for Wipro to obtain client feedback.
Complexity. Our primary measure of project complexity is kilolines of new source code (KLOC). This
measure is not without its flaws, but it is the most common measure of size and complexity in software
engineering (Boehm 1981; Scacchi 1995). Many of the traditional drawbacks of KLOC – such as
defining what qualifies as a line of code and how to count thousands of lines of code – are mitigated in
our case, as we consider only one organization that uses a consistent counting methodology (Jones 1986;
Low and Jeffery 1990). Software development has been shown to exhibit scale effects, so we use the
logarithm of KLOC (Banker and Kemerer 1989). We also add indicators for seven groups of software
languages that appear in the data6 to address the potential for systematic differences in adherence or
quality across different languages. We also include an additional control for whether the project used one 6 C, C++, Java, C#, query (e.g. SQL), markup (e.g. HTML), BASIC and other is the ‘excluded’ category.
Team Familiarity, Role Experience, and Performance Confidential Draft: July 3, 2008
- 16 -
or more than one software language (70% and 30% of projects, respectively), as a project using multiple
languages could be more complex than one of the same size involving only one language.
Team size. Increasing a team’s size at low levels may improve performance due to the capacity and
experience of the additional member. However, increasing team size above a context-specific maximum,
may increase coordination challenges resulting in decreased performance (Brooks 1975; Hackman 2002).
Team scale-up varies at Wipro, as some teams staff up at once while others do so more gradually. We
thus measure team size as the log of the total people who participated in the team over its existence.7
Effort. To capture the size of a project, we use the log of the estimated total person-hours dedicated to
the project. We use the estimate rather than the realized value to avoid potential endogeneity as a project
that misses its estimate would by definition use more effort than an identical project which does not miss
its estimate. Similar to KLOC and team size, we would expect projects with more effort to be more
difficult to manage. We thus expect increasing effort to have a negative impact on performance.
Duration of project. We include the estimated duration of a project (measured in log days), as longer
projects may perform worse given the challenges already discussed or because they risk additional
employee attrition (Ethiraj et al. 2005). We use the estimated value to avoid concerns of endogeneity.
Start year. To control for potential learning and environmental conditions (such as changes in employee
attrition) at the firm level, we include indicators for the year the project started. Substituting indicators
for the year the project ended does not meaningfully change our results.
3.3 Empirical Strategy
Output quality. With our dependent variable bounded by zero, linear regression may yield results that are
inconsistent, biased or inefficient (Long 1997). Additionally our database has multiple projects per
customer, so we need to control for time-invariant characteristics of customers that may impact quality.
Models for count data can address both of these issues and, because our data exhibit overdispersion, we
use a conditional fixed effects negative binomial model (Hausman et al. 1984; Cameron and Trivedi
1998). This model conditions on the total count within a given sub-group (e.g., customer). The model 7 We log team size, effort and duration to control for outliers. Our results do not change with unlogged variables.
Team Familiarity, Role Experience, and Performance Confidential Draft: July 3, 2008
- 17 -
eliminates all instances with one observation per group and those groups where the dependent variable
does not vary from zero. Since not all projects complete acceptance testing, we are left with a sample of
309 projects for analysis.
Effort Deviation. For effort deviation, we control for customer attributes using a GLS random effects
regression model.8 After eliminating projects from customers with only one project in the database, we
are left with 474 projects for our analysis.
Adherence. Given that effort, schedule, and overall adherence are each dichotomous variables, we use a
logistic regression model. We cannot simply add customer indicators to the logistic regression model, as
the unconditional maximum-likelihood estimator is inconsistent when the number of units (in our case,
projects per customer) is small (Greene 2003). While the bias has been found to be small in unit values as
low as eight, our data include unit values as low as two (Heckman 1981; Katz 2001),9 so we use the
conditional logit. When using the conditional logit, we lose not only projects from customers with only
one project in the database but also those from customers for whom the outcome of interest does not vary.
This restriction leaves us with a sample of 393 projects from which our estimates are generated.
4. Results and Discussion
We now examine our models for each of the two classes of dependent variables.
4.1 Output Quality
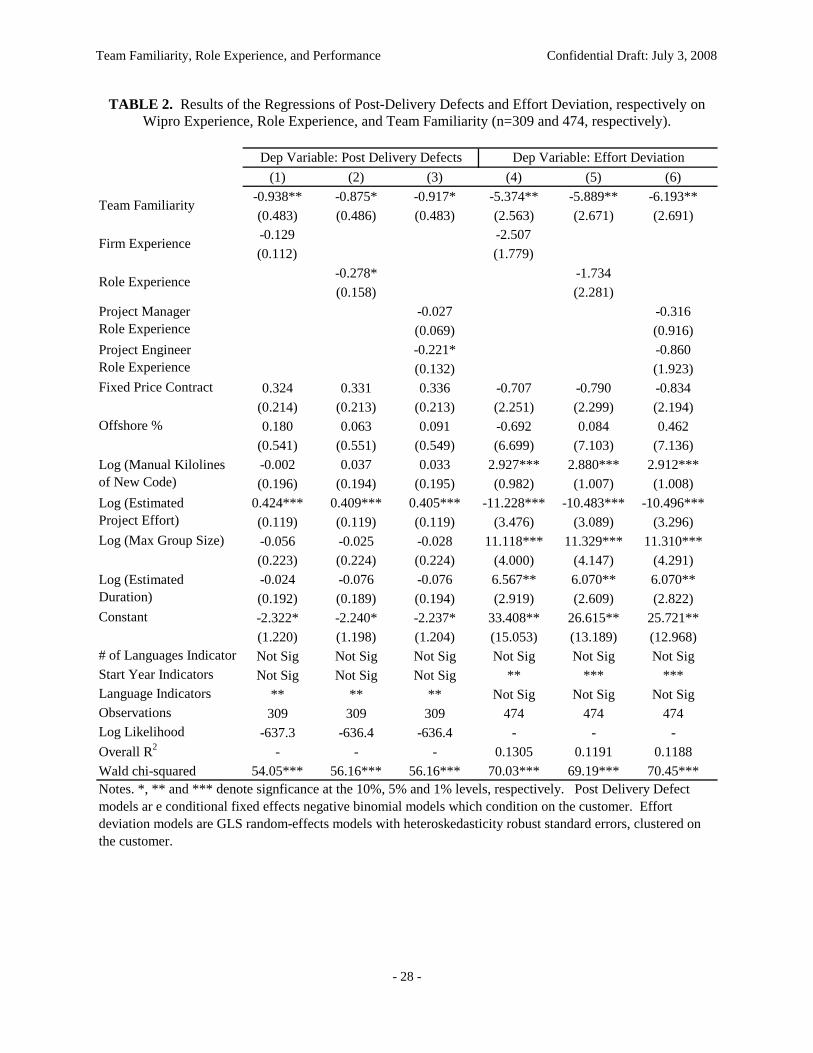
Table 2 shows the results of our conditional negative binomial regression models testing the relationship
between experience and post-delivery defects.
*******************************Insert Table 2 about here*******************************
In Column 1 we run a model with controls, firm experience, and team familiarity and find that the
coefficient on firm experience is negative (implying a positive relationship with quality), but not
8 Hausman’s specification test fails to reject the null hypothesis that the random effects model is consistent. 9 We test our model specification using Hausman’s specification test. In particular, if there are no customer effects then the estimators from the logit (unconditional maximum likelihood) and conditional logit (conditional maximum likelihood) are consistent, but the conditional maximum likelihood estimator is inefficient. Our alternative hypothesis is that the conditional maximum likelihood estimator is consistent and efficient and the maximum likelihood estimator is inconsistent (Greene 2003, pg. 699). The test rejects the null hypothesis at p<0.05.
Team Familiarity, Role Experience, and Performance Confidential Draft: July 3, 2008
- 18 -
significant at conventional levels. The coefficient on team familiarity is negative and significant,
providing support for Hypothesis 1. An increase of one standard deviation in overall team familiarity
results in an 18.6% decrease in expected defects. In Column 2, we again find that the coefficient for team
familiarity is negative and significant at the 10% level. When we substitute role experience for firm
experience, the coefficient for role experience is negative and significant at the 10% level, providing
support for Hypothesis 2. An increase of one standard deviation in overall average role experience yields
a 14.7% decrease in expected defects. In Column 3, the coefficient on team familiarity remains negative
and significant at the 10% level. The coefficient on PM role experience is effectively zero, while that on
project engineer role experience is negative and significant at the 10% level. An increase of one standard
deviation in project engineer role experience results in a 14.3% decrease in expected defects. These
results provide support for Hypothesis 3b, but not Hypothesis 3a.
4.2 Deviation and Adherence
As discussed above, we have multiple measures to evaluate the efficiency with which a project is
delivered. Columns 4 through 6 in Table 2 show the results from regressions with effort deviation as the
dependent variable. The independent and control variables in the three models are the same as those in
the quality analysis. We find that familiarity is a significant predictor of superior performance for effort
deviation. A one standard deviation change in team familiarity is related to an 18%, 30%, and 36%
decrease in effort deviation for Columns 4, 5 and 6, respectively. While familiarity is significant in each
of the models, providing support for our second hypothesis, firm experience, overall team role experience,
PM role experience, and project engineer role experience have their expected signs but are not significant.
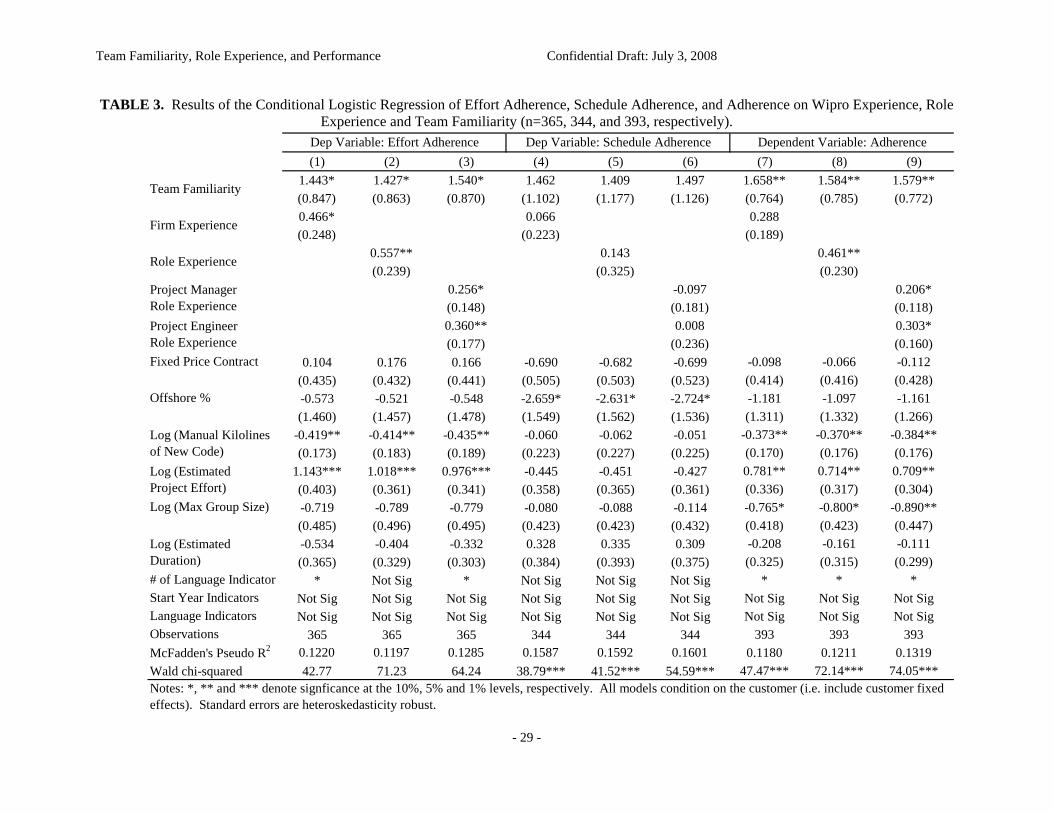
We next examine effort adherence instead of effort deviation. Table 3 presents the results from
each of the conditional logistic regressions. Column 1 presents a model with all of the controls, firm
experience, and team familiarity. The coefficient on team familiarity is positive and significant at the 10%
level, and a one standard deviation change in familiarity increases the odds of effort adherence by 37%.
Also, the coefficient on firm experience is positive and significant at the 10% level, and a one standard
deviation change in familiarity increases the odds of effort adherence by 49%. We note that this is the
Team Familiarity, Role Experience, and Performance Confidential Draft: July 3, 2008
- 19 -
only model where the coefficient on firm experience is significant at less than 10%. In Columns 2 and 3,
we run the same model first substituting overall role experience and then substituting PM role experience
and project engineer role experience for firm experience. In each model, the coefficient on team
familiarity is positive and significant at the 10% level. In Column 2, role experience is significant, and an
increase of one standard deviation in role experience yields a fitted odds ratio of 1.38. In Column 3, the
coefficients on both PM and project engineer role experience are positive and significant at the 10% level.
*******************************Insert Table 3 about here*******************************
Columns 4 through 6 in Table 3 show the models for schedule adherence. In each model, the
coefficient on team familiarity is positive and close to the values in the corresponding models for effort
adherence, although they are not significant at conventional levels. The coefficients on firm experience
(Column 4) and overall team role experience (Column 5) are positive, but not significant. While the
coefficient for project engineer experience is positive (Column 6), the coefficient for project manager role
experience is negative, though neither is statistically significant.
Finally, we examine the relationship between our predictors and overall adherence (whether a
project meets both its effort and schedule estimate). In Column 7, our model includes controls and both
firm experience and familiarity. The coefficient on firm experience is positive, though not significant at
conventional levels. The coefficient on team familiarity is positive and significant, providing support for
Hypothesis 1. Interpreting this latter coefficient, we note that an increase of one standard deviation in
team familiarity increases the odds of adherence by 44%.10
Column 8 substitutes overall role experience for firm experience. The coefficient for team
familiarity remains positive and significant, while that for role experience is also positive and significant,
providing support for Hypothesis 2. An increase of one standard deviation in overall role experience
yields a fitted odds ratio of 1.30. When we divide role experience into separate components for PMs and
project engineers, we find support for Hypotheses 3a and 3b (Column 9). The coefficient on team
10 Given the work of Katz (1982) and others we test for curvilinearity for all independent variables in all models. We find no evidence of a curvilinear effect in our data (results not shown). Given that project teams do not stay together over long periods of time this result is not surprising.
Team Familiarity, Role Experience, and Performance Confidential Draft: July 3, 2008
- 20 -
familiarity is positive and significant and an increase of one standard deviation yields a fitted odds ratio of
1.42. In this model the coefficients on both PM role experience and project engineer role experience are
positive and significant at the 10% level. An increase of one standard deviation in each variable yields
odds ratios of 1.27 and 1.24, respectively.
4.3 Alternative Explanations
We now examine alternative explanations for our findings on team familiarity and role experience. In a
study that examines the relationship between the frequency with which individuals work together and
performance, selection of team members is an important concern. Typically, Wipro’s presales personnel
are responsible for estimating the effort and schedule requirements for a project with a customer. Once
the estimates for a project are frozen, the PM—sometimes multiple PMs for large projects—is assigned.
The estimates are used to staff the project team. In general, PMs cannot select specific individuals for
their teams. PMs receive potential team members from a subunit’s HR function, and, if resources are not
available within the subunit, the search is expanded first across the firm and then outside of it. The PM
can exert control by rejecting potential team members, but he or she does not select the pool from which
potential team members are chosen. This ability to reject team members could be problematic if
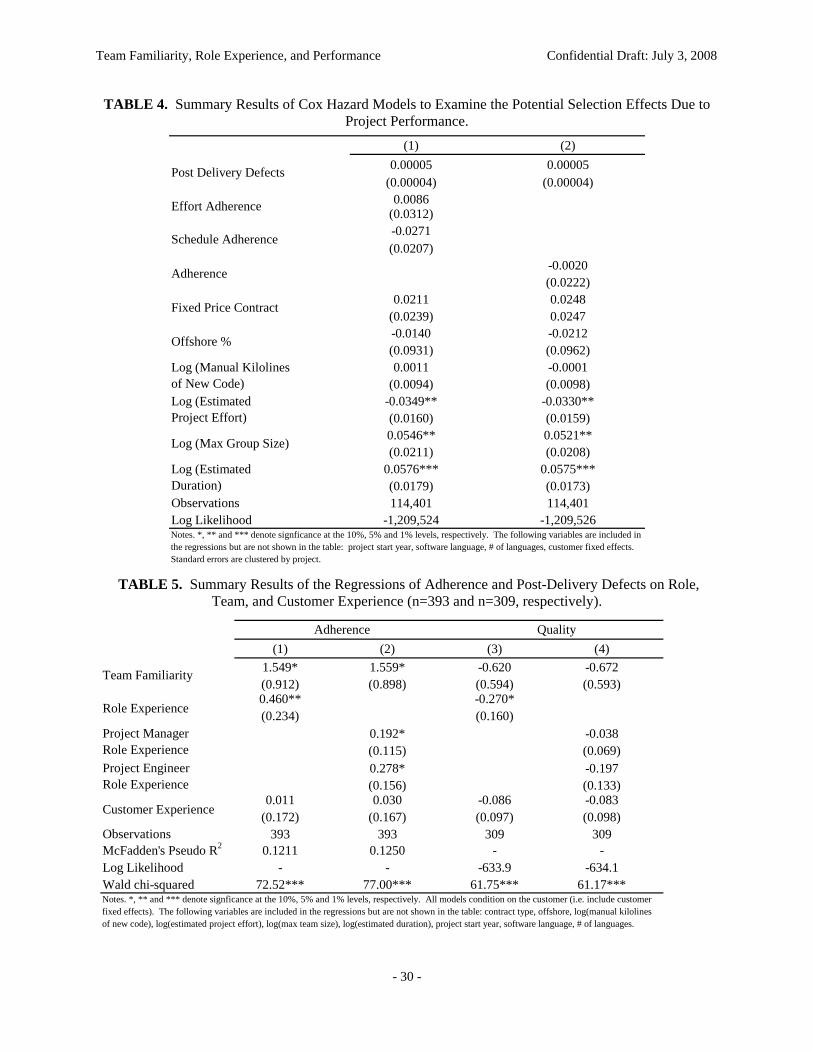
exercised often. To examine this question empirically we use a Cox proportional hazards model to
analyze every dyad of individuals who worked together in our sample (Cleves et al. 2004). We define
failure as the pair not working together on their next project and we examine whether poor team
performance increased the hazard rate.
As seen in Table 4, neither adherence nor quality performance is a significant predictor of the
likelihood of a dyad not staying together. Further, the signs of these variables are not all consistent with
the selection story (e.g. effort adherence in Column 1) increasing our confidence that selection is not
driving our results.
*******************************Insert Table 4 about here******************************* We now turn to alternative explanations of our findings with respect to role experience. The first
is that, with increasing role experience, a PM is better able to build slack into initial project estimates,
Team Familiarity, Role Experience, and Performance Confidential Draft: July 3, 2008
- 21 -
thereby improving the chances of adherence. Because a PM is not responsible for her project’s estimates,
this manipulation is not possible. The second alternative explanation is that, with increasing role
experience, a team is able to manipulate the revision process, thereby “tricking” the customer into a
revision.11 While Wipro has mechanisms to prevent this from occurring, we still test whether such
behavior occurs. Specifically, we find no relationship between any of our measures of role experience
and changes in effort or schedule estimates. We also consider only positive revisions—those revisions
where additional effort or schedule is added to a project—and again find no relationship. These results
give us confidence that increased role experience is not related to increased manipulation in this setting.
Another alternative explanation could be that our measures of experience and familiarity capture
repeated interaction with a given customer. Increased experience with a customer could lead to improved
understanding of project requirements or an exchange of tacit knowledge resulting in better performance.
As such, we repeat the models in Columns 2 and 3 of Table 2 and Columns 8 and 9 of Table 3 including a
measure of the team’s customer experience (i.e., the average number of times that each team member has
previously worked with the focal customer). We do not include this measure in our base models as it is
highly correlated with team familiarity (0.68). We only show the results with overall adherence as it is
the most comprehensive measure of delivery performance, although other measures show similar results.
*******************************Insert Table 5 about here*******************************
Comparing the adherence results from the first two columns of Table 5 to the analogous models
in Table 3 we see that the coefficients on both team familiarity and role experience are changed only
slightly and that the coefficient on customer experience is not significantly different from zero. The story
is slightly different with respect to quality. The coefficient for team familiarity in each model has
decreased and is no longer significant. The values for the overall team role experience and project
engineer role experience coefficients are similar to Table 2, although the project engineer role experience
coefficient is no longer significant at conventional levels. The coefficient on customer experience is
11 Since there are not original and revised estimates for acceptance testing, we do not have to consider manipulation by managers as the cause of our quality findings.
Team Familiarity, Role Experience, and Performance Confidential Draft: July 3, 2008
- 22 -
negative, but not significant in either case. This robustness check supports our role experience findings,
although it does suggest that, in the case of quality, we cannot conclusively distinguish the effects of team
familiarity and customer experience because of their collinearity. Separating these effects represents an
area for potential future research.
4.4 Discussion
Consistent with Hypothesis 1, we find that familiarity among team members is positively and
significantly related to both quality and adherence (with the exception of schedule adherence on its own).
Wipro software-development teams tend to be hierarchical in nature, with PMs being responsible for the
assignment of work. It is possible that, as the PM gains experience with a team, she is better able to
allocate responsibilities amongst team members and manage interdependencies. Also, a project
engineer’s experience with other project engineers may prove helpful for identifying and managing
interdependencies. These coordination benefits likely impact both quality and adherence. The potential
for an increasing willingness to engage in a relationship with an increase in team familiarity may be
particularly helpful for improving quality. Given the difficulty in making in-process quality visible,
familiarity among project engineers may be valuable as they build informal-advice seeking networks
(Leonardi 2007). With growing familiarity, project engineers also might be increasingly willing to put
their reputations at risk by asking questions and sharing errors earlier in the process (Edmondson 1999).
We find partial support for Hypothesis 2. While the average firm experience of team members is
not significantly related to quality or project efficiency in all but one of our models, overall role
experience is associated with better performance in terms of quality and two of the four measures of
project efficiency. Changes in roles at Wipro are more than just changes in titles and necessitate learning
and the use of different skills. For example, the PM is responsible for allocating project work, interacting
with the customer, and monitoring progress but is rarely directly involved in writing code. Therefore, a
change in role may reset, or at least set backwards, the experience “clock” of a new PM in some cases.
Reagans et al. (2005) find a curvilinear relationship between an individual surgeon’s experience
and her performance; increases in experience are first negatively related to performance, before
Team Familiarity, Role Experience, and Performance Confidential Draft: July 3, 2008
- 23 -
eventually shifting over to a positive relationship. Among their potential explanations is that roles could
be changing within teams of surgeons. While our work cannot conclusively say that role changes were
the causal mechanism in their study, our findings provide support for that hypothesis.
We further explore the impact of role experience by introducing separate measures for project
managers and project engineers. We find evidence of differential effects of PM role experience and
project engineer role experience on project efficiency and quality. While both measures are positively
and significantly related to effort adherence and overall adherence, only project engineer role experience
is positively and significantly related to quality. With respect to engineer experience, this result is likely
due to a traditional learning-curve story—with repetition, project engineers become more effective coders
and are able to monitor their own progress, manage their own interdependencies, and deal more
effectively with the inevitable changes that most projects encounter.
Given that the PM role is different from that of a project engineer, it is not surprising that PM role
experience is differentially related to these measures of project performance. After follow-up discussions
with Wipro personnel, we think that an important distinction may be one of observability. Because the
overall effort and the elapsed days for a project are both metrics that are easily and routinely monitored
while a project is in progress, PMs are able to follow performance and adjust in response. To the extent
that greater PM role experience provides more know-how in dealing with uncertainty and problems as
they arise, we would expect—and find—PM role experience to be positively related with adherence.
On the other hand, our quality variable is an end-state measure, which is difficult to track in-
process. It is hard to know the quality of a project until it nears its end. For a PM, additional role
experience may help in structuring work more effectively, but given the difficulty in monitoring progress
and making mid-course corrections, the overall benefit of experience for a PM may be more muted with
respect to quality as opposed to adherence. Our findings thus suggest that experience as a manager is
positively related to performance measures that can, in fact, be more easily managed in process.
Team Familiarity, Role Experience, and Performance Confidential Draft: July 3, 2008
- 24 -
4.5 Limitations
Like any study, ours has limitations, and one should be careful in applying its results. First, it is possible
that any non-random assignment of individuals to teams might bias our results. The approach used by
Wipro to determine project teams and conversations with Wipro personnel indicate that, typically, project
managers are not able to choose specific team members. Our hazard analysis suggests that members of
unsuccessful teams are not less likely to work together in the future as compared to members of more
successful teams. Nevertheless, we cannot categorically rule out the possibility of bias. Second, there is
the possibility that teams with more team familiarity or role experience are assigned to projects with a
higher priority with respect to adherence or quality. Assuming we are adequately controlling for project
complexity and any other characteristics of higher priority projects that are correlated with experience,
this effect should be diminished. Table 1 supports this view, as neither role experience nor PM role
experience is significantly correlated with measures of size and complexity (KLOC, effort, team size and
duration). Further, interviews suggest that this is not how Wipro generally assigns projects.12
Third, our results are from one firm in one industry, and it is possible that they will not generalize
to other settings. Compensating for this drawback is the detailed information we have about team
composition and quantitative performance measures. In this context, we are able to combine deep
knowledge of a single firm with large-scale empirical tests of our hypotheses.
5. Conclusion
Our study begins by setting aside the assumption that teams are stable over time and uses unique data to
examine how familiarity and role experience impact team performance. Our setting is a useful backdrop
for exploring this question, as we can link data on team members to verifiable team outcomes.
We shed light on how changes in team composition affect performance. First, we examine a
measure of team familiarity that accounts for the degree to which each individual member of a team has
worked with every other team member on previous projects. This measure allows us to avoid the
12 In a discussion with a senior manager on this topic, he said that when he examined PM experience and project value in his business he found that his vertical had not assigned its most senior PMs to its most valuable projects.
Team Familiarity, Role Experience, and Performance Confidential Draft: July 3, 2008
- 25 -
assumption that team membership remains constant from one project to the next. We find that overall
team familiarity is positively related to both of our measures of operational performance. Second, we
examine the impact of what we term role experience—the experience that individuals have operating in
their current roles of team member or team manager—on team performance. We find partial support for
this hypothesis, as role experience is positively related to some, but not all of our measures of operational
performance. Looking more closely at role experience, we find a differential relationship between project
manager and project engineer role experience and our measures of operational performance.
Our work has implications for the academic study of teams and organizations. First, our findings
underscore the need to use caution in assuming that team membership is constant from one project to the
next. Second, our results build on previous work on team familiarity by considering longitudinal data on
the individual members of teams. We, therefore, are able to view team familiarity as a continuous, rather
than dichotomous, measure. We do not simply measure whether a team has familiarity or not but rather
capture the difference between a team where 75% of team members have previously worked with other
team members and a team where only 25% of team members have done the same. Future work should
explore further decompositions of team familiarity. For example, it is possible that the team familiarity of
specific sub-groups (e.g. PMs and middle managers) may be related to different measures of performance.
Third, our findings suggest the importance of considering role experience. Further work should
both evaluate this effect in different empirical settings and explore additional questions, such as when a
role is different enough to reset the experience “clock”. Fourth, our results highlight the value of studying
multiple measures of experience at different levels (Reagans et al. 2004). By getting into the black box
linking experience and operational performance, we see that task characteristics may play a key role in
determining the value of different types of experience. In our case, PM role experience is positively
related to some measures of project efficiency, but not quality, perhaps due to differences in observability.
Future work should explore these linkages further. Both of these points suggest that there may be
something special about managerial roles. Many writers have noted that not all individual contributors
are good managers (e.g. Charan et al. 2000). Some of this could be innate, but these results suggest
Team Familiarity, Role Experience, and Performance Confidential Draft: July 3, 2008
- 26 -
experience within a given role and the characteristics of the task itself may significantly impact a
manger’s ability to do her job effectively.
While prior work (e.g. Reagans et al. 2005) has hypothesized about the value of having
knowledge about how to carry out a role (role experience) and the value of coordinating across and
amongst roles (team familiarity), these two constructs are often confounded empirically. Separating the
two, as we have done in our analyses, is important both empirically and theoretically. By identifying and
separating further the theoretical constructs that make up the experience of fluid teams, we are able to
understand in more detail how each impacts team performance.
Our work also has important implications for managers. In many industries, fluid project teams
are the rule rather than the exception (Edmondson and Nembhard 2007). In contexts such as product
development, consulting, investment banking, and service delivery, project teams are formed to produce a
definable output and then are disbanded with members being assigned to new teams. Our findings
suggest that managers should adopt a more nuanced view of experience in which they explicitly consider
both experience within a given role as well as experience with other team members when making staffing
decisions. For example, rather than just assigning a programmer with three years of experience to a given
project, a manager may want to assign a programmer with three years of experience (with at least one
year as a project manager) who has worked with at least 25% of the other project team members on
previous projects. Though it may require firms to track additional data, this approach places new, and
potentially important, levers of control in the hands of the manager.
Acknowledgments
We would like to thank Alexis Samuel, Vidya Sridhar, Sambuddha Deb, and many others at Wipro for
their commitment of time and effort to this project. We also thank Amy Edmondson, Lee Fleming,
Ananth Raman, Mike Toffel, Anita Tucker, Olav Sorenson, the Associate Editor and three anonymous
reviewers for valuable suggestions. We are grateful to the Division of Research of Harvard Business
School for generous funding. All errors remain our own.
Team Familiarity, Role Experience, and Performance Confidential Draft: July 3, 2008
- 27 -
TABLE 1
Summary Statistics and Correlation Table of Dependent, Independent, and Control Variables of Interest. (N = 474, except for Post-Delivery Defects where N = 309)
Variable Mean σ Min Max 1 2 3 4 5 6 7 8 9 10 11 12 13 14 15
1. Post Delivery Defects 27 113 0 13962. Effort Deviation (%) -4.6 20.5 -63 274 0.103. Effort Adherence 0.77 0.42 0.00 1.00 -0.12 -0.474. Schedule Adherence 0.85 0.36 0.00 1.00 -0.13 -0.34 0.375. Adherence 0.72 0.45 0.00 1.00 -0.11 -0.42 0.86 0.666. Team Familiarity 0.20 0.22 0.00 1.40 -0.09 -0.12 0.12 0.14 0.157. Role Experience 1.25 0.57 0.13 3.71 -0.08 -0.04 0.06 0.04 0.08 0.198. PM Role Experience 1.19 1.17 0.00 5.63 -0.06 0.00 0.03 -0.06 0.03 0.03 0.36
9. Project Engineer Role Experience 1.36 0.70 0.01 3.69 -0.08 -0.02 0.04 0.03 0.06 0.17 0.89 0.06
10. Firm Experience 2.10 0.85 0.15 6.23 -0.16 -0.10 0.05 0.05 0.06 0.15 0.70 0.25 0.6711. Fixed Price Contract 0.69 0.46 0.00 1.00 -0.12 -0.03 0.07 -0.06 0.04 0.10 0.13 0.01 0.12 0.1412. Offshore Percentage 0.85 0.15 0.23 1.00 -0.03 0.06 -0.07 -0.08 -0.10 0.02 -0.20 -0.03 -0.22 -0.14 -0.0913. Log (Manual KLOC) 3.51 1.21 -1.24 7.66 0.36 0.08 -0.03 -0.10 -0.08 -0.16 -0.11 -0.01 -0.12 -0.23 -0.02 -0.10
14. Log (Estimated Effort) 8.76 1.04 6.23 12.55 0.38 0.00 0.06 -0.12 -0.02 -0.19 -0.06 -0.01 -0.08 -0.27 -0.16 -0.09 0.68
15. Log (Team Size) 2.66 0.70 1.61 5.02 0.32 0.12 -0.03 -0.11 -0.09 -0.20 -0.03 -0.01 -0.02 -0.23 -0.17 -0.07 0.60 0.85
16. Log (Estimated Duration) 5.25 0.62 3.76 7.01 0.19 0.08 0.00 -0.04 -0.03 -0.17 -0.07 -0.05 -0.05 -0.13 -0.13 -0.06 0.45 0.70 0.56
Team Familiarity, Role Experience, and Performance Confidential Draft: July 3, 2008
- 28 -
TABLE 2. Results of the Regressions of Post-Delivery Defects and Effort Deviation, respectively on Wipro Experience, Role Experience, and Team Familiarity (n=309 and 474, respectively).
(1) (2) (3) (4) (5) (6)-0.938** -0.875* -0.917* -5.374** -5.889** -6.193**(0.483) (0.486) (0.483) (2.563) (2.671) (2.691)-0.129 -2.507(0.112) (1.779)
-0.278* -1.734(0.158) (2.281)
-0.027 -0.316(0.069) (0.916)-0.221* -0.860(0.132) (1.923)
0.324 0.331 0.336 -0.707 -0.790 -0.834(0.214) (0.213) (0.213) (2.251) (2.299) (2.194)0.180 0.063 0.091 -0.692 0.084 0.462
(0.541) (0.551) (0.549) (6.699) (7.103) (7.136)-0.002 0.037 0.033 2.927*** 2.880*** 2.912***(0.196) (0.194) (0.195) (0.982) (1.007) (1.008)
0.424*** 0.409*** 0.405*** -11.228*** -10.483*** -10.496***(0.119) (0.119) (0.119) (3.476) (3.089) (3.296)-0.056 -0.025 -0.028 11.118*** 11.329*** 11.310***(0.223) (0.224) (0.224) (4.000) (4.147) (4.291)-0.024 -0.076 -0.076 6.567** 6.070** 6.070**(0.192) (0.189) (0.194) (2.919) (2.609) (2.822)-2.322* -2.240* -2.237* 33.408** 26.615** 25.721**(1.220) (1.198) (1.204) (15.053) (13.189) (12.968)Not Sig Not Sig Not Sig Not Sig Not Sig Not SigNot Sig Not Sig Not Sig ** *** ***
** ** ** Not Sig Not Sig Not Sig309 309 309 474 474 474
-637.3 -636.4 -636.4 - - -- - - 0.1305 0.1191 0.1188
Wald chi-squared 54.05*** 56.16*** 56.16*** 70.03*** 69.19*** 70.45***
Project Manager Role ExperienceProject Engineer Role ExperienceFixed Price Contract
Log (Estimated Project Effort)
Dep Variable: Effort Deviation
Overall R2
Offshore %
Start Year Indicators
Log (Estimated Duration)
Dep Variable: Post Delivery Defects
Team Familiarity
Log (Max Group Size)
Firm Experience
Role Experience
Notes. *, ** and *** denote signficance at the 10%, 5% and 1% levels, respectively. Post Delivery Defect models ar e conditional fixed effects negative binomial models which condition on the customer. Effort deviation models are GLS random-effects models with heteroskedasticity robust standard errors, clustered on the customer.
Language Indicators
Constant
Log (Manual Kilolines of New Code)
Log LikelihoodObservations
# of Languages Indicator
Team Familiarity, Role Experience, and Performance Confidential Draft: July 3, 2008
- 29 -
TABLE 3. Results of the Conditional Logistic Regression of Effort Adherence, Schedule Adherence, and Adherence on Wipro Experience, Role Experience and Team Familiarity (n=365, 344, and 393, respectively).
(1) (2) (3) (4) (5) (6) (7) (8) (9)1.443* 1.427* 1.540* 1.462 1.409 1.497 1.658** 1.584** 1.579**(0.847) (0.863) (0.870) (1.102) (1.177) (1.126) (0.764) (0.785) (0.772)0.466* 0.066 0.288(0.248) (0.223) (0.189)
0.557** 0.143 0.461**(0.239) (0.325) (0.230)
0.256* -0.097 0.206*(0.148) (0.181) (0.118)0.360** 0.008 0.303*(0.177) (0.236) (0.160)
0.104 0.176 0.166 -0.690 -0.682 -0.699 -0.098 -0.066 -0.112(0.435) (0.432) (0.441) (0.505) (0.503) (0.523) (0.414) (0.416) (0.428)-0.573 -0.521 -0.548 -2.659* -2.631* -2.724* -1.181 -1.097 -1.161(1.460) (1.457) (1.478) (1.549) (1.562) (1.536) (1.311) (1.332) (1.266)
-0.419** -0.414** -0.435** -0.060 -0.062 -0.051 -0.373** -0.370** -0.384**(0.173) (0.183) (0.189) (0.223) (0.227) (0.225) (0.170) (0.176) (0.176)
1.143*** 1.018*** 0.976*** -0.445 -0.451 -0.427 0.781** 0.714** 0.709**(0.403) (0.361) (0.341) (0.358) (0.365) (0.361) (0.336) (0.317) (0.304)-0.719 -0.789 -0.779 -0.080 -0.088 -0.114 -0.765* -0.800* -0.890**(0.485) (0.496) (0.495) (0.423) (0.423) (0.432) (0.418) (0.423) (0.447)-0.534 -0.404 -0.332 0.328 0.335 0.309 -0.208 -0.161 -0.111(0.365) (0.329) (0.303) (0.384) (0.393) (0.375) (0.325) (0.315) (0.299)
* Not Sig * Not Sig Not Sig Not Sig * * *Not Sig Not Sig Not Sig Not Sig Not Sig Not Sig Not Sig Not Sig Not SigNot Sig Not Sig Not Sig Not Sig Not Sig Not Sig Not Sig Not Sig Not Sig
365 365 365 344 344 344 393 393 3930.1220 0.1197 0.1285 0.1587 0.1592 0.1601 0.1180 0.1211 0.1319
Wald chi-squared 42.77 71.23 64.24 38.79*** 41.52*** 54.59*** 47.47*** 72.14*** 74.05***Notes: *, ** and *** denote signficance at the 10%, 5% and 1% levels, respectively. All models condition on the customer (i.e. include customer fixed effects). Standard errors are heteroskedasticity robust.
Project Manager Role ExperienceProject Engineer Role Experience
Team Familiarity
Firm Experience
Role Experience
Start Year IndicatorsLanguage Indicators
McFadden's Pseudo R2Observations
Dependent Variable: AdherenceDep Variable: Effort Adherence
Fixed Price Contract
Offshore %
# of Language Indicator
Dep Variable: Schedule Adherence
Log (Estimated Project Effort)
Log (Estimated Duration)
Log (Manual Kilolines of New Code)
Log (Max Group Size)
Team Familiarity, Role Experience, and Performance Confidential Draft: July 3, 2008
- 30 -
TABLE 4. Summary Results of Cox Hazard Models to Examine the Potential Selection Effects Due to Project Performance.
(1) (2)0.00005 0.00005
(0.00004) (0.00004)0.0086
(0.0312)-0.0271(0.0207)
-0.0020(0.0222)
0.0211 0.0248(0.0239) 0.0247-0.0140 -0.0212(0.0931) (0.0962)0.0011 -0.0001
(0.0094) (0.0098)-0.0349** -0.0330**(0.0160) (0.0159)0.0546** 0.0521**(0.0211) (0.0208)
0.0576*** 0.0575***(0.0179) (0.0173)114,401 114,401
Log Likelihood -1,209,524 -1,209,526
Post Delivery Defects
Effort Adherence
Schedule Adherence
Adherence
Fixed Price Contract
Observations
Offshore %
Log (Manual Kilolines of New Code)Log (Estimated Project Effort)
Log (Max Group Size)
Log (Estimated Duration)
Notes. *, ** and *** denote signficance at the 10%, 5% and 1% levels, respectively. The following variables are included in the regressions but are not shown in the table: project start year, software language, # of languages, customer fixed effects. Standard errors are clustered by project.
TABLE 5. Summary Results of the Regressions of Adherence and Post-Delivery Defects on Role, Team, and Customer Experience (n=393 and n=309, respectively).
(1) (2) (3) (4)1.549* 1.559* -0.620 -0.672(0.912) (0.898) (0.594) (0.593)0.460** -0.270*(0.234) (0.160)
0.192* -0.038(0.115) (0.069)0.278* -0.197(0.156) (0.133)
0.011 0.030 -0.086 -0.083(0.172) (0.167) (0.097) (0.098)
393 393 309 3090.1211 0.1250 - -
Log Likelihood - - -633.9 -634.1Wald chi-squared 72.52*** 77.00*** 61.75*** 61.17***
Quality
Observations
Notes. *, ** and *** denote signficance at the 10%, 5% and 1% levels, respectively. All models condition on the customer (i.e. include customer fixed effects). The following variables are included in the regressions but are not shown in the table: contract type, offshore, log(manual kilolines of new code), log(estimated project effort), log(max team size), log(estimated duration), project start year, software language, # of languages.
Customer Experience
Adherence
Team Familiarity
Role Experience
Project Manager Role ExperienceProject Engineer Role Experience
McFadden's Pseudo R2
Team Familiarity, Role Experience, and Performance Confidential Draft: July 3, 2008
- 31 -
References Adler, P. S. (1990). "Shared learning." Management Science 36(8): 938-957. Argote, L., S. L. Beckman and D. Epple (1990). "The persistence and transfer of learning in industrial settings." Management
Science 36(2): 140-154. Arrow, H. and J. E. McGrath (1995). Membership dynamics in groups at work: A theoretical framework. in Research in
Organizational Behavior. Eds. B. M. Staw and L. L. Cummings. Greenwich, CT, JAI. 17: 373-411. Arrow, K. J. (1969). "Classificatory notes on the production and transmission of technological knowledge." The American
Economic Review 59(2): 29-35. Banerjee, A. V. and E. Duflo (2000). "Reputation effects and the limits of contracting: A study of the Indian software industry."
The Quarterly Journal of Economics 115(3): 989-1017. Banker, R. D. and C. F. Kemerer (1989). "Scale economies in new software development." IEEE Transactions on Software
Engineering 15(10): 1199-1206. Benkard, C. L. (2000). "Learning and forgetting: The dynamics of aircraft production." The American Economic Review 90(4):
1034-1054. Berman, S. L., J. Down and C. W. L. Hill (2002). "Tacit knowledge as a source of competitive advantage in the National
Basketball Association." Academy of Management Journal 45(1): 13-31. Boehm, B. (1981). Software Engineering Economics. New York, Prentice Hall. Brooks, F. (1975). The Mythical Man-Month: Essays on Software Engineering. New York, Addison-Wesley. Cameron, A. C. and P. K. Trivedi (1998). Regression Analysis of Count Data. New York, Cambridge University Press. Charan, R., S. Drotter and J. Noel (2000). The Leadership Pipeline. San Francisco, Jossey-Bass. Chillemi, O. and B. Gui (1997). "Team human capital and worker mobility." Journal of Labor Economics 15(4): 567-585. Cleves, M. A., W. W. Gould and R. G. Guiterrez (2004). An Introduction to Survival Analysis Using Stata. College Station, TX,
Stata Press. Cohen, S. G. and D. E. Bailey (1997). "What makes teams work: Group effectiveness research from the shop floor to the
executive suite." Journal of Management 23(3): 239-290. Delaney, P. F., L. M. Reder, J. J. Staszewski and F. E. Ritter (1998). "The strategy-specific nature of improvement: The power
law applies by strategy within task." Psychological Science 9(1): 1-7. Dutton, J. M. and A. Thomas (1984). "Treating progress functions as a managerial opportunity." Academy of Management
Review 9(2): 235-247. Edmondson, A. (1999). "Psychological safety and learning behavior in work teams." Administrative Science Quarterly 44(2):
350-383. Edmondson, A. C., R. M. Bohmer and G. P. Pisano (2001). "Disrupted routines: Team learning and new technology
implementation in hospitals." Administrative Science Quarterly 46(4): 685-716. Edmondson, A. C. and I. A. Nembhard (Forthcoming). "Product development and learning in project teams: The challenges are
the benefits." Journal of Product Innovation Management. Edmondson, A. C., A. Winslow, R. Bohmer and G. P. Pisano (2003). "Learning how and learning what: Effects of tacit and
codified knowledge on performance improvement following technology adoption." Decision Sciences 34(2): 197-223. Ethiraj, S. K., P. Kale, M. S. Krishnan and J. V. Singh (2005). "Where do capabilities come from and how do they matter? A
study in the software services industry." Strategic Management Journal 26(1): 25-45. Faraj, S. and L. Sproull (2000). "Coordinating expertise in software development teams." Management Science 46(12): 1554-
1568. Gibbons, R. and M. Waldman (2004). "Task-specific human capital." AEA Papers and Proceedings 94(2): 203-207. Gibbons, R. and M. Waldman (2006). "Enriching a theory of wage and promotion dynamics inside firms." Journal of Labor
Economics 24(1): 59-107. Granovetter, M. (1985). "Economic action and social structure: The problem of embeddedness." American Journal of Sociology
91(3): 481-510. Greene, W. H. (2003). Econometric Analysis. Upper Saddle River, N.J., Prentice Hall. Hackman, J. R. (2002). Leading Teams: Setting the Stage for Great Performances. Boston, Mass., HBS Press. Hausman, J., B. H. Hall and Z. Griliches (1984). "Econometric models for count data with an application to the patents-R & D
relationship." Econometrica 52(4): 909-938. Heckman, J. (1981). The incidental parameters problem and the problem of initial conditions in estimating a discrete time-
discrete data stochastic process. in Structural Analysis of Discrete Data. Eds. C. F. Manski and D. McFadden. Cambridge, MA, MIT Press.
Huckman, R. S. and G. P. Pisano (2006). "The firm specificity of individual performance: Evidence from cardiac surgery." Management Science 52(4): 473-488.
Jones, C. (1986). Programming Productivity. New York, McGraw-Hill. Katz, E. (2001). "Bias in conditional and unconditional fixed effects logit estimation." Political Analysis 9(4): 379-384. Katz, R. (1982). "The effects of group longevity on project communication and performance." Administrative Science Quarterly
27(1): 81-104. Leonard-Barton, D. (1992). "Core capabilities and core rigidities: A paradox in managing new product development." Strategic
Management Journal 13: 111-125.
Team Familiarity, Role Experience, and Performance Confidential Draft: July 3, 2008
- 32 -
Leonardi, P. M. (2007). "Activating the informational capabilities of information technology for organizational change." Organization Science 18(5): 813-831.
Levitt, B. and J. G. March (1988). "Organizational learning." Annual Review of Sociology 14: 319-340. Liang, D. W., R. Moreland and L. Argote (1995). "Group versus individual training and group performance: the mediating role of
transactive memory." Personality and Social Psychology Bulletin 21(4): 384-393. Long, J. S. (1997). Regression Models for Categorical and Limited Dependent Variables. Thousand Oaks, Sage Publications. Low, G. C. and D. R. Jeffery (1990). "Function points in the estimation and evaluation of the software process." Software
Engineering, IEEE Transactions on 16(1): 64-71. Mailath, G. J. and A. Postlewaite (1990). "Workers versus firms: Bargaining over a firm's value." The Review of Economic
Studies 57(3): 369-380. McDonald, C. J. (1998). "The evolution of Intel's copy EXACTLY! technology transfer method." Intel Technology Journal Q4. McEvily, B., V. Perrone and A. Zaheer (2003). "Trust as an organizing principle." Organization Science 14(1): 91-103. Monteverde, K. (1995). "Technical dialog as an incentive for vertical integration in the semiconductor industry." Management
Science 41(10): 1624-1638. Moore, S. (2007). "Trends in IT Services pricing." Forrester Research, Inc. Retrieved July 16, 2007. Moreland, R., L. Argote and R. Krishnan (1998). Training people to work in groups. in Theory and Research on Small Groups:
Social Psychological Applications to Social Issues. Eds. R. Tindale and L. Heath. New York, Plenum Press: 37-60. NASSCOM (2005). NASSCOM-McKinsey report 2005. Nelson, R. R. and S. G. Winter (1982). An Evolutionary Theory of Economic Change. Cambridge, MA, Belknap Press. Newell, A. and P. Rosenbloom (1981). Mechanisms of skill acquisition & the power law of practice. in Cognitive Skills & Their
Acquisition. Eds. J. Anderson. Hillsdale, NJ, Erlbaum: 1-55. Pisano, G. P. (1994). "Knowledge, integration, and the locus of learning: An empirical analysis of process development."
Strategic Management Journal 15(S1): 85-100. Pisano, G. P. (1996). "Learning-before-doing in the development of new process technology." Research Policy 25(7): 1097-1119. Pisano, G. P., R. M. J. Bohmer and A. C. Edmondson (2001). "Organizational differences in rates of learning: Evidence from the
adoption of minimally invasive cardiac surgery." Management Science 47(6): 752-768. Polanyi, M. (1967). The Tacit Dimension. Garden City, NY, Doubleday. Reagans, R., L. Argote and D. Brooks (2005). "Individual experience and experience working together: Predicting learning rates
from knowing who knows what and knowing how to work together." Management Science 51(6): 869-881. Reagans, R., E. Zuckerman and B. McEvily (2004). "How to make the team: Social networks vs. demography as criteria for
designing effective teams." Administrative Science Quarterly 49(1): 101-133. Scacchi, W. (1995). Understanding software productivity. in Software Engineering and Knowledge Engineering: Trends for the
Next Decade. Eds. D. Hurley. Singapore, World Scientific Publishing Company. 4: 273-316. Schilling, M. A., P. Vidal, R. E. Ployhart and A. Marangoni (2003). "Learning by doing something else: Variation, relatedness,
and the learning curve." Management Science 49(1): 39-56. SEI (2001). Capability Maturity Model Integration (CMMI), Version 1.1. Pittsburgh, PA, Software Engineering Institute,
Carnegie Mellon University. Sinclair, G., S. Klepper and W. Cohen (2000). "What's experience got to do with it? Sources of cost reduction in a large specialty
chemicals producer." Management Science 46(1): 28-45. Skinner, W. (1974). "The focused factory." Harvard Business Review 52(3): 113. Staw, B. M. (1980). "The consequences of turnover." Journal of Occupational Behaviour 1(4): 253-273. Sutton, R. I. and A. Hargadon (1996). "Brainstorming groups in context: Effectiveness in a product design firm." Administrative
Science Quarterly 41: 685-718. Teece, D. J. (1981). "The market for know-how and the efficient international transfer of technology." The Annals of the
American Academy of Political and Social Science 458: 81-96. Thompson, P. (2007). "How much did the Liberty shipbuilders forget?" Management Science 53(6): 908-918. Upton, D. M. and B. Kim (1998). "Alternative methods of learning and process improvement in manufacturing." Journal of
Operations Management 16(1): 1-20. Uzzi, B. (1997). "Social structure and competition in interfirm networks: The paradox of embeddedness." Administrative Science
Quarterly 42(1): 35-67. von Hippel, E. (1994). ""Sticky information" and the locus of problem solving: Implications for innovation." Management
Science 40(4): 429-439. Wegner, D. M. (1987). Transactive memory: A contemporary analysis of the group mind. in Theories of Group Behavior. Eds. G.
Mullen and G. Goethals. New York, Springer-Verlag: 185-208. Weick, K. E. and K. H. Roberts (1993). "Collective Mind in Organizations: Heedful Interrelating on Flight Decks."
Administrative Science Quarterly 38(3): 357-381. Wright, T. P. (1936). "Factors affecting the cost of airplanes." Journal of Aeronautical Science 3: 122-128. Zollo, M. and S. G. Winter (2002). "Deliberate learning and the evolution of dynamic capabilities." Organization Science 13(3):
339 - 351.