Embed Size (px)
Citation preview
Tear-down and testing of individual O-Cube blue cells Greg DaigleJune 26, 2017
This report describes the tear-down and initial testing of the “blue cells” of an Orbo O-Cube.
Summary of the known issues of the O-Cube to date. 2Images of the steps in the tear-down: 3Testing the Steorn Blue Cells 6
Equipment 6Software 6Methods 6
Other voltage readings 9Composition of blue cells 10Results 10
Discharge profiles 11Further elimination of environmental influences 12Discharging the cells over hours 15
Discussion 17Conclusions 19
� of �1 20 ver 2.
Summary of the known issues of the O-Cube to date.
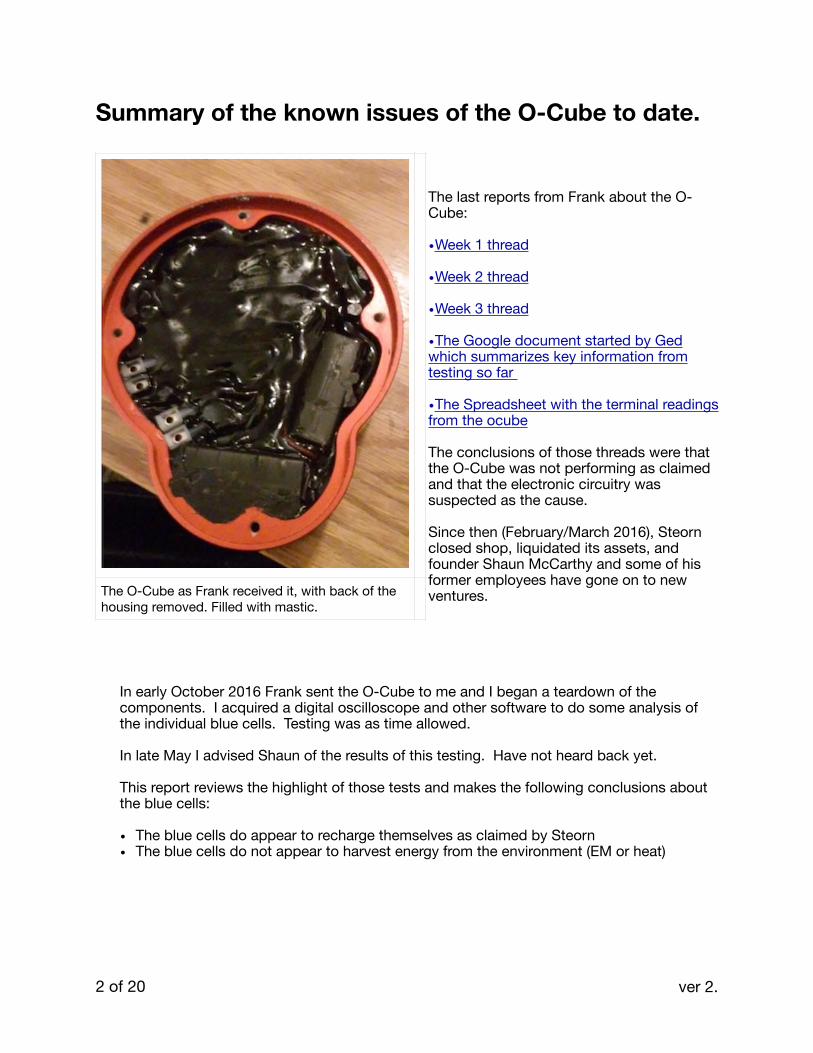
The last reports from Frank about the O-Cube:
•Week 1 thread
•Week 2 thread
•Week 3 thread
•The Google document started by Ged which summarizes key information from testing so far
•The Spreadsheet with the terminal readings from the ocube
The conclusions of those threads were that the O-Cube was not performing as claimed and that the electronic circuitry was suspected as the cause.
Since then (February/March 2016), Steorn closed shop, liquidated its assets, and founder Shaun McCarthy and some of his former employees have gone on to new ventures.
In early October 2016 Frank sent the O-Cube to me and I began a teardown of the components. I acquired a digital oscilloscope and other software to do some analysis of the individual blue cells. Testing was as time allowed.
In late May I advised Shaun of the results of this testing. Have not heard back yet.
This report reviews the highlight of those tests and makes the following conclusions about the blue cells:
• The blue cells do appear to recharge themselves as claimed by Steorn• The blue cells do not appear to harvest energy from the environment (EM or heat)
� of �2 20 ver 2.
The O-Cube as Frank received it, with back of the housing removed. Filled with mastic.
�
Images of the steps in the tear-down:
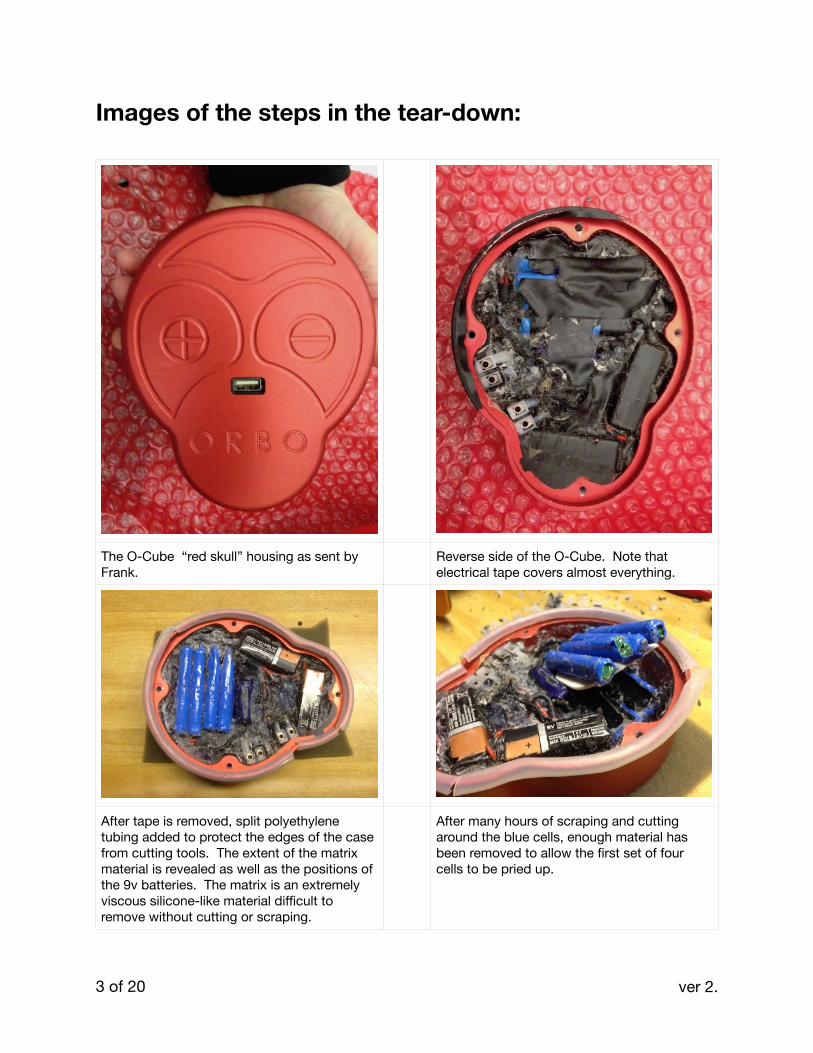
The O-Cube “red skull” housing as sent by Frank.
Reverse side of the O-Cube. Note that electrical tape covers almost everything.
After tape is removed, split polyethylene tubing added to protect the edges of the case from cutting tools. The extent of the matrix material is revealed as well as the positions of the 9v batteries. The matrix is an extremely viscous silicone-like material difficult to remove without cutting or scraping.
After many hours of scraping and cutting around the blue cells, enough material has been removed to allow the first set of four cells to be pried up.
�
�
�
�
� of �3 20 ver 2.
This concluded the extraction of the blue cells. I did not excavate the circuitry further since there was already consensus that the circuitry was not working properly. Today the matrix still completely covers the USB port and associated circuitry that regulates the charging.
The cells look in good shape though some clearly have had some minor damage inflicted to either the blue plastic covers or to the metal cladding covering the half cells composing each blue cell.
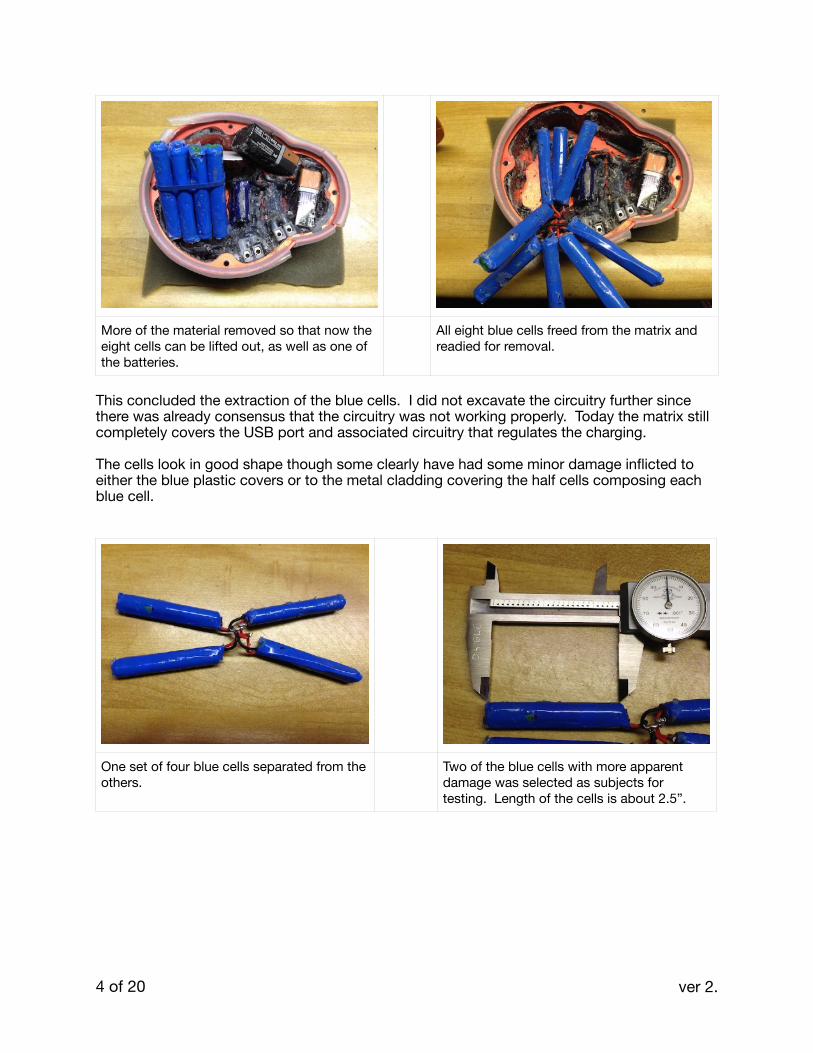
More of the material removed so that now the eight cells can be lifted out, as well as one of the batteries.
All eight blue cells freed from the matrix and readied for removal.
��
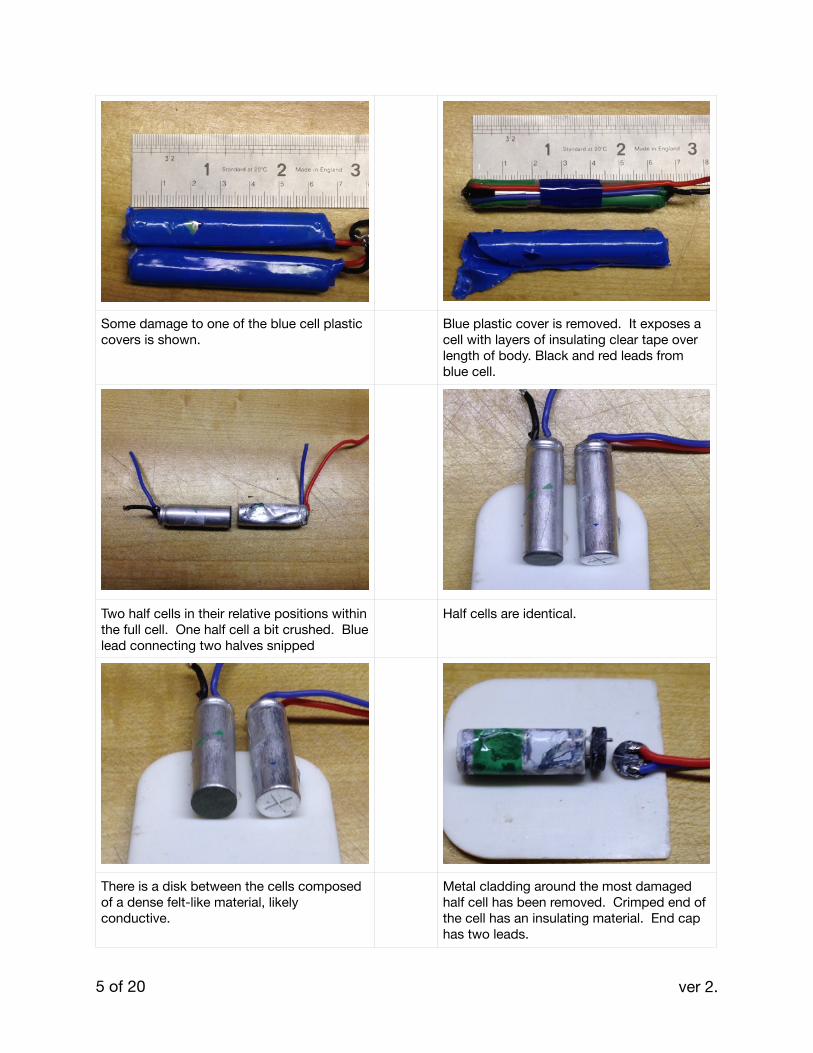
One set of four blue cells separated from the others.
Two of the blue cells with more apparent damage was selected as subjects for testing. Length of the cells is about 2.5”.
� �
� of �4 20 ver 2.
Some damage to one of the blue cell plastic covers is shown.
Blue plastic cover is removed. It exposes a cell with layers of insulating clear tape over length of body. Black and red leads from blue cell.
Two half cells in their relative positions within the full cell. One half cell a bit crushed. Blue lead connecting two halves snipped
Half cells are identical.
There is a disk between the cells composed of a dense felt-like material, likely conductive.
Metal cladding around the most damaged half cell has been removed. Crimped end of the cell has an insulating material. End cap has two leads.
�
�
�
�
�
�
� of �5 20 ver 2.
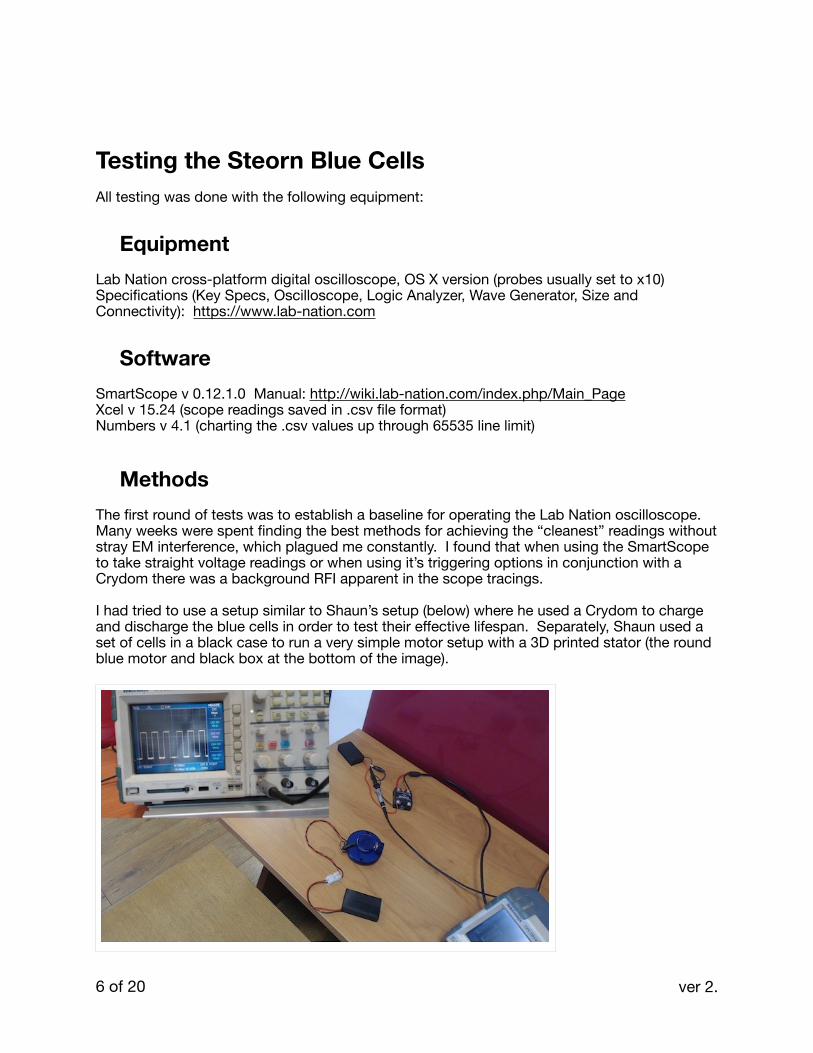
Testing the Steorn Blue Cells All testing was done with the following equipment:
Equipment Lab Nation cross-platform digital oscilloscope, OS X version (probes usually set to x10)Specifications (Key Specs, Oscilloscope, Logic Analyzer, Wave Generator, Size and Connectivity): https://www.lab-nation.com
Software SmartScope v 0.12.1.0 Manual: http://wiki.lab-nation.com/index.php/Main_PageXcel v 15.24 (scope readings saved in .csv file format)Numbers v 4.1 (charting the .csv values up through 65535 line limit)
Methods The first round of tests was to establish a baseline for operating the Lab Nation oscilloscope. Many weeks were spent finding the best methods for achieving the “cleanest” readings without stray EM interference, which plagued me constantly. I found that when using the SmartScope to take straight voltage readings or when using it’s triggering options in conjunction with a Crydom there was a background RFI apparent in the scope tracings.
I had tried to use a setup similar to Shaun’s setup (below) where he used a Crydom to charge and discharge the blue cells in order to test their effective lifespan. Separately, Shaun used a set of cells in a black case to run a very simple motor setup with a 3D printed stator (the round blue motor and black box at the bottom of the image).
�
� of �6 20 ver 2.
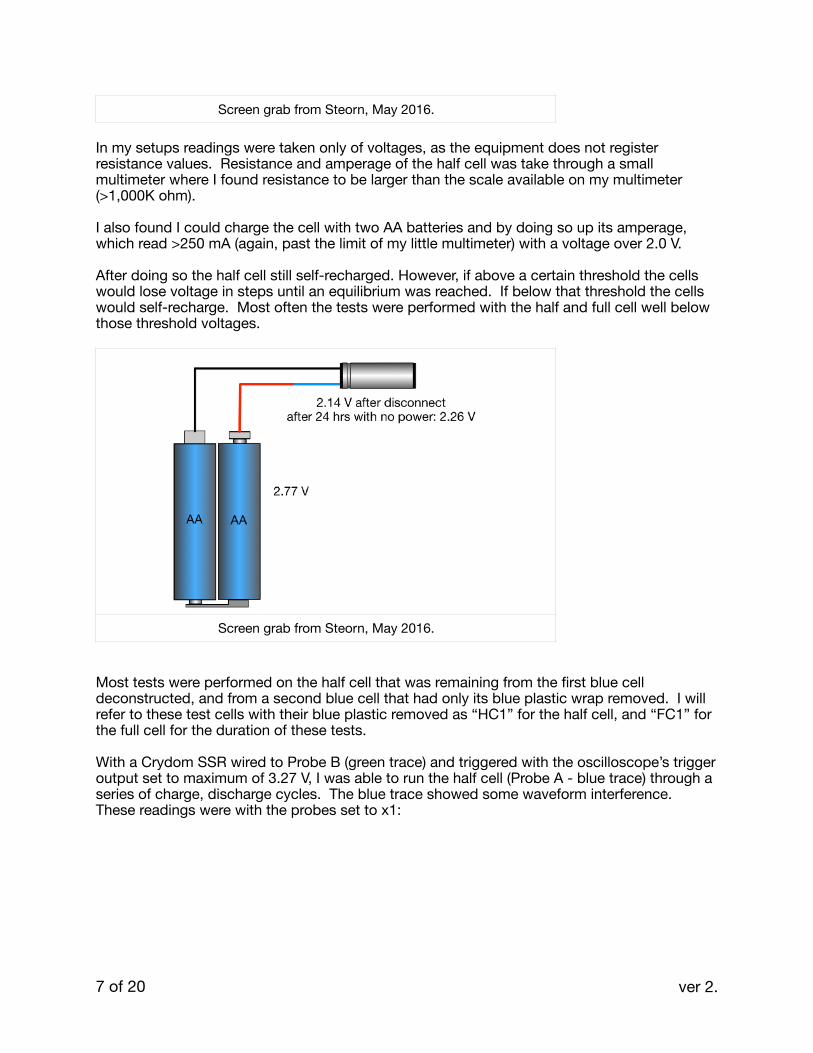
In my setups readings were taken only of voltages, as the equipment does not register resistance values. Resistance and amperage of the half cell was take through a small multimeter where I found resistance to be larger than the scale available on my multimeter (>1,000K ohm).
I also found I could charge the cell with two AA batteries and by doing so up its amperage, which read >250 mA (again, past the limit of my little multimeter) with a voltage over 2.0 V.
After doing so the half cell still self-recharged. However, if above a certain threshold the cells would lose voltage in steps until an equilibrium was reached. If below that threshold the cells would self-recharge. Most often the tests were performed with the half and full cell well below those threshold voltages.
Most tests were performed on the half cell that was remaining from the first blue cell deconstructed, and from a second blue cell that had only its blue plastic wrap removed. I will refer to these test cells with their blue plastic removed as “HC1” for the half cell, and “FC1” for the full cell for the duration of these tests.
With a Crydom SSR wired to Probe B (green trace) and triggered with the oscilloscope’s trigger output set to maximum of 3.27 V, I was able to run the half cell (Probe A - blue trace) through a series of charge, discharge cycles. The blue trace showed some waveform interference. These readings were with the probes set to x1:
Screen grab from Steorn, May 2016.
Screen grab from Steorn, May 2016.
� of �7 20 ver 2.
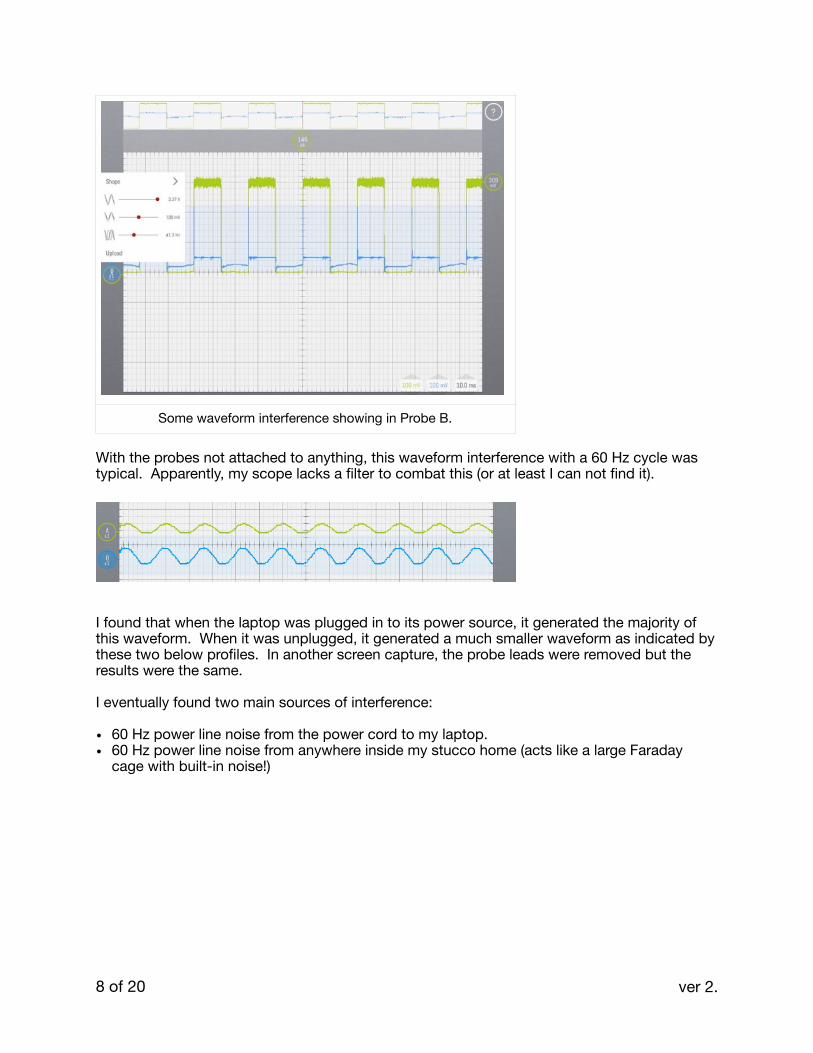
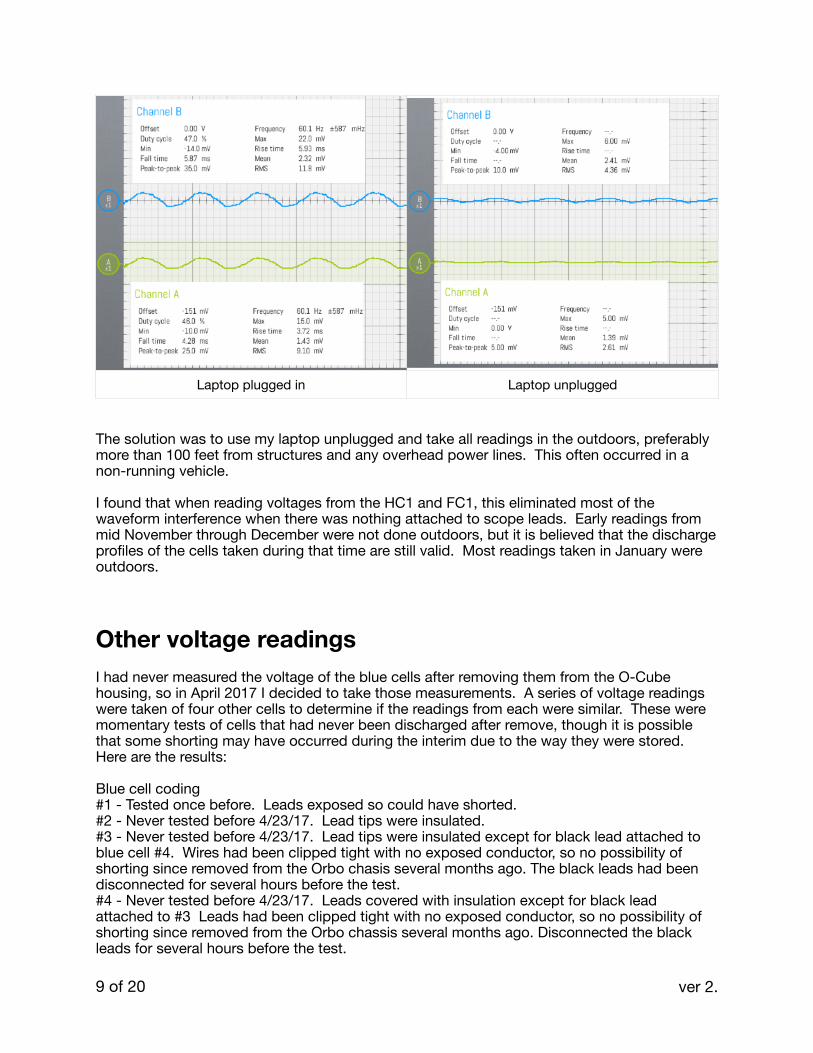
With the probes not attached to anything, this waveform interference with a 60 Hz cycle was typical. Apparently, my scope lacks a filter to combat this (or at least I can not find it).
I found that when the laptop was plugged in to its power source, it generated the majority of this waveform. When it was unplugged, it generated a much smaller waveform as indicated by these two below profiles. In another screen capture, the probe leads were removed but the results were the same.
I eventually found two main sources of interference:
• 60 Hz power line noise from the power cord to my laptop.• 60 Hz power line noise from anywhere inside my stucco home (acts like a large Faraday
cage with built-in noise!)
Some waveform interference showing in Probe B.
�
� of �8 20 ver 2.
The solution was to use my laptop unplugged and take all readings in the outdoors, preferably more than 100 feet from structures and any overhead power lines. This often occurred in a non-running vehicle.
I found that when reading voltages from the HC1 and FC1, this eliminated most of the waveform interference when there was nothing attached to scope leads. Early readings from mid November through December were not done outdoors, but it is believed that the discharge profiles of the cells taken during that time are still valid. Most readings taken in January were outdoors.
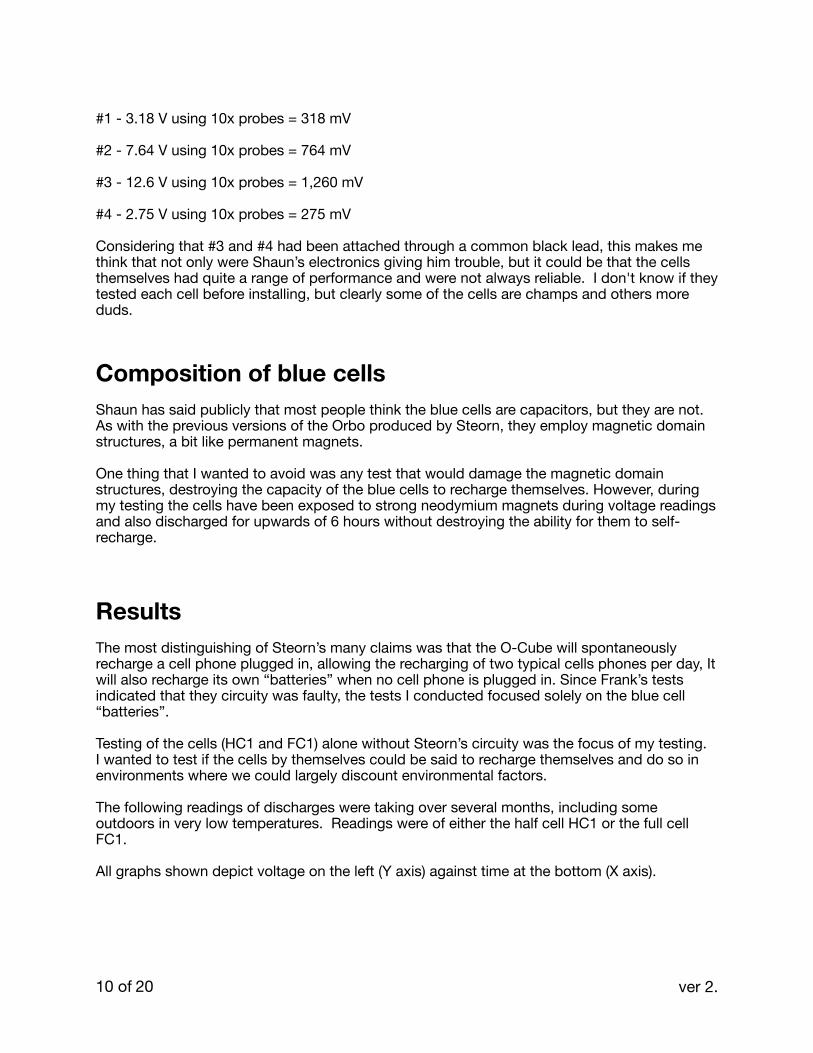
Other voltage readings I had never measured the voltage of the blue cells after removing them from the O-Cube housing, so in April 2017 I decided to take those measurements. A series of voltage readings were taken of four other cells to determine if the readings from each were similar. These were momentary tests of cells that had never been discharged after remove, though it is possible that some shorting may have occurred during the interim due to the way they were stored. Here are the results:
Blue cell coding#1 - Tested once before. Leads exposed so could have shorted.#2 - Never tested before 4/23/17. Lead tips were insulated.#3 - Never tested before 4/23/17. Lead tips were insulated except for black lead attached to blue cell #4. Wires had been clipped tight with no exposed conductor, so no possibility of shorting since removed from the Orbo chasis several months ago. The black leads had been disconnected for several hours before the test.#4 - Never tested before 4/23/17. Leads covered with insulation except for black lead attached to #3 Leads had been clipped tight with no exposed conductor, so no possibility of shorting since removed from the Orbo chassis several months ago. Disconnected the black leads for several hours before the test.
Laptop plugged in Laptop unplugged
� of �9 20 ver 2.
#1 - 3.18 V using 10x probes = 318 mV
#2 - 7.64 V using 10x probes = 764 mV
#3 - 12.6 V using 10x probes = 1,260 mV
#4 - 2.75 V using 10x probes = 275 mV
Considering that #3 and #4 had been attached through a common black lead, this makes me think that not only were Shaun’s electronics giving him trouble, but it could be that the cells themselves had quite a range of performance and were not always reliable. I don't know if they tested each cell before installing, but clearly some of the cells are champs and others more duds.
Composition of blue cells Shaun has said publicly that most people think the blue cells are capacitors, but they are not. As with the previous versions of the Orbo produced by Steorn, they employ magnetic domain structures, a bit like permanent magnets.
One thing that I wanted to avoid was any test that would damage the magnetic domain structures, destroying the capacity of the blue cells to recharge themselves. However, during my testing the cells have been exposed to strong neodymium magnets during voltage readings and also discharged for upwards of 6 hours without destroying the ability for them to self-recharge.
Results The most distinguishing of Steorn’s many claims was that the O-Cube will spontaneously recharge a cell phone plugged in, allowing the recharging of two typical cells phones per day, It will also recharge its own “batteries” when no cell phone is plugged in. Since Frank’s tests indicated that they circuity was faulty, the tests I conducted focused solely on the blue cell “batteries”.
Testing of the cells (HC1 and FC1) alone without Steorn’s circuity was the focus of my testing. I wanted to test if the cells by themselves could be said to recharge themselves and do so in environments where we could largely discount environmental factors.
The following readings of discharges were taking over several months, including some outdoors in very low temperatures. Readings were of either the half cell HC1 or the full cell FC1.
All graphs shown depict voltage on the left (Y axis) against time at the bottom (X axis).
� of �10 20 ver 2.
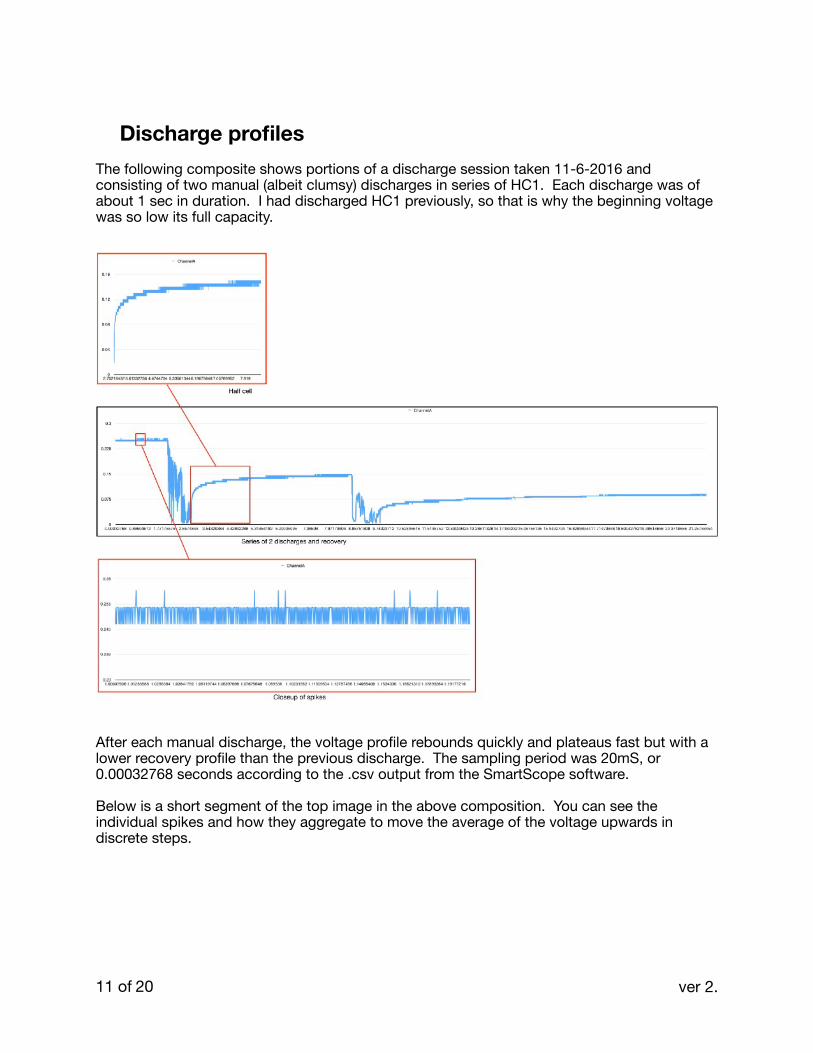
Discharge profiles The following composite shows portions of a discharge session taken 11-6-2016 and consisting of two manual (albeit clumsy) discharges in series of HC1. Each discharge was of about 1 sec in duration. I had discharged HC1 previously, so that is why the beginning voltage was so low its full capacity.
After each manual discharge, the voltage profile rebounds quickly and plateaus fast but with a lower recovery profile than the previous discharge. The sampling period was 20mS, or 0.00032768 seconds according to the .csv output from the SmartScope software.
Below is a short segment of the top image in the above composition. You can see the individual spikes and how they aggregate to move the average of the voltage upwards in discrete steps.
� of �11 20 ver 2.
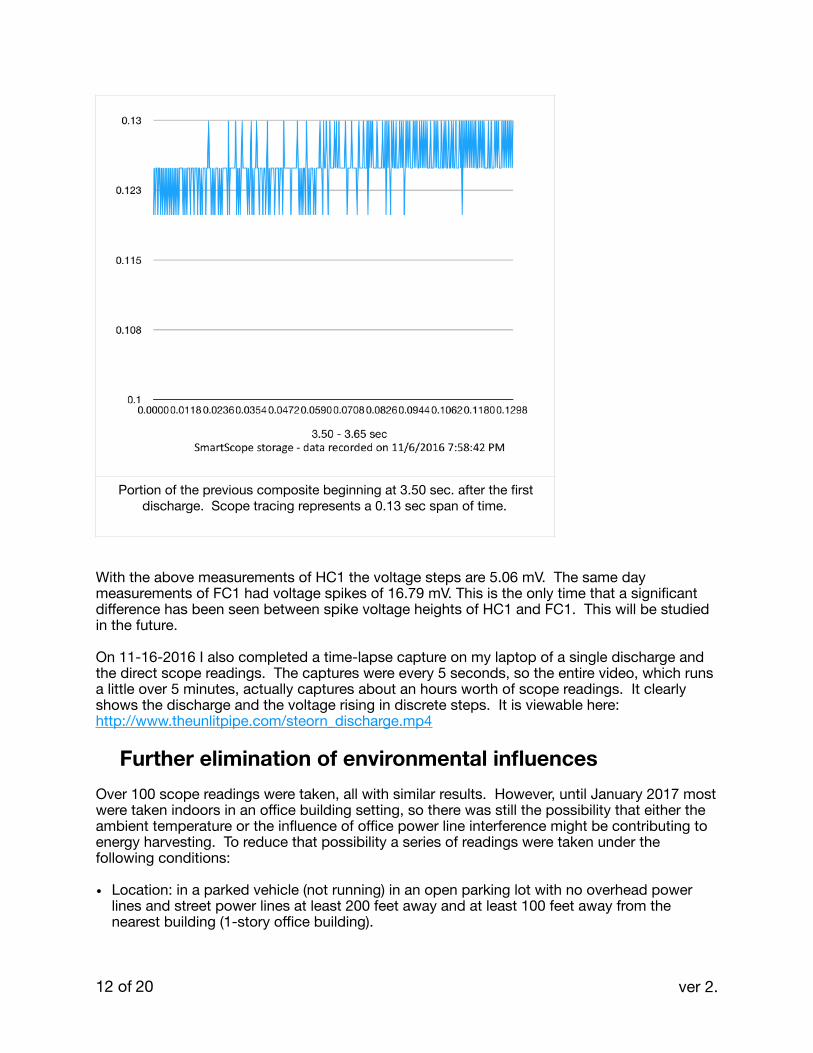
With the above measurements of HC1 the voltage steps are 5.06 mV. The same day measurements of FC1 had voltage spikes of 16.79 mV. This is the only time that a significant difference has been seen between spike voltage heights of HC1 and FC1. This will be studied in the future.
On 11-16-2016 I also completed a time-lapse capture on my laptop of a single discharge and the direct scope readings. The captures were every 5 seconds, so the entire video, which runs a little over 5 minutes, actually captures about an hours worth of scope readings. It clearly shows the discharge and the voltage rising in discrete steps. It is viewable here: http://www.theunlitpipe.com/steorn_discharge.mp4
Further elimination of environmental influences Over 100 scope readings were taken, all with similar results. However, until January 2017 most were taken indoors in an office building setting, so there was still the possibility that either the ambient temperature or the influence of office power line interference might be contributing to energy harvesting. To reduce that possibility a series of readings were taken under the following conditions:
• Location: in a parked vehicle (not running) in an open parking lot with no overhead power lines and street power lines at least 200 feet away and at least 100 feet away from the nearest building (1-story office building).
Portion of the previous composite beginning at 3.50 sec. after the first discharge. Scope tracing represents a 0.13 sec span of time.
�
� of �12 20 ver 2.
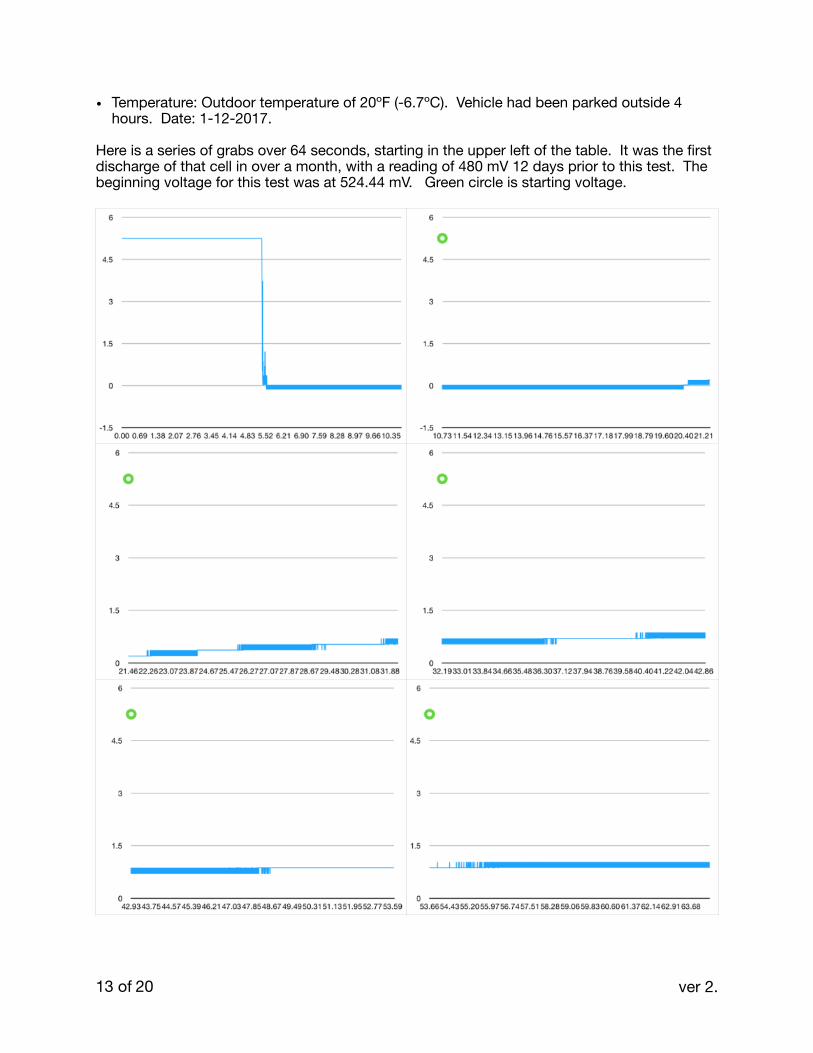
• Temperature: Outdoor temperature of 20ºF (-6.7ºC). Vehicle had been parked outside 4 hours. Date: 1-12-2017.
Here is a series of grabs over 64 seconds, starting in the upper left of the table. It was the first discharge of that cell in over a month, with a reading of 480 mV 12 days prior to this test. The beginning voltage for this test was at 524.44 mV. Green circle is starting voltage.
� of �13 20 ver 2.
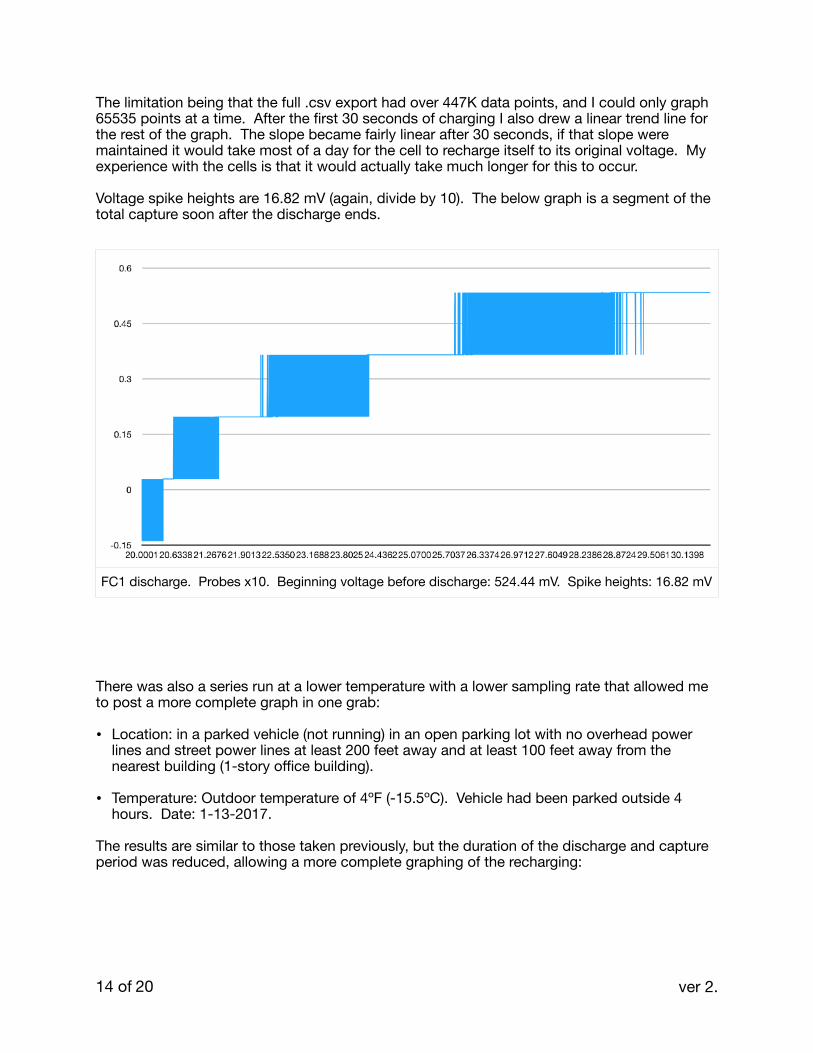
The limitation being that the full .csv export had over 447K data points, and I could only graph 65535 points at a time. After the first 30 seconds of charging I also drew a linear trend line for the rest of the graph. The slope became fairly linear after 30 seconds, if that slope were maintained it would take most of a day for the cell to recharge itself to its original voltage. My experience with the cells is that it would actually take much longer for this to occur.
Voltage spike heights are 16.82 mV (again, divide by 10). The below graph is a segment of the total capture soon after the discharge ends.
There was also a series run at a lower temperature with a lower sampling rate that allowed me to post a more complete graph in one grab:
• Location: in a parked vehicle (not running) in an open parking lot with no overhead power lines and street power lines at least 200 feet away and at least 100 feet away from the nearest building (1-story office building).
• Temperature: Outdoor temperature of 4ºF (-15.5ºC). Vehicle had been parked outside 4 hours. Date: 1-13-2017.
The results are similar to those taken previously, but the duration of the discharge and capture period was reduced, allowing a more complete graphing of the recharging:
FC1 discharge. Probes x10. Beginning voltage before discharge: 524.44 mV. Spike heights: 16.82 mV
� of �14 20 ver 2.
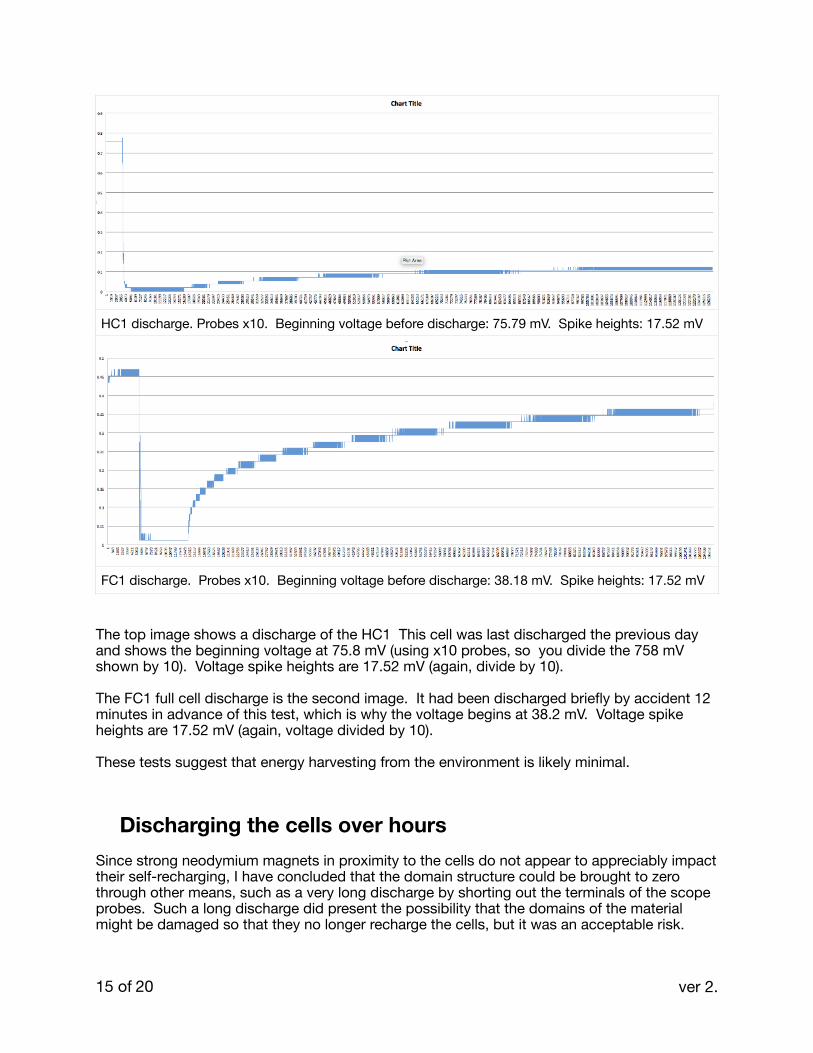
The top image shows a discharge of the HC1 This cell was last discharged the previous day and shows the beginning voltage at 75.8 mV (using x10 probes, so you divide the 758 mV shown by 10). Voltage spike heights are 17.52 mV (again, divide by 10).
The FC1 full cell discharge is the second image. It had been discharged briefly by accident 12 minutes in advance of this test, which is why the voltage begins at 38.2 mV. Voltage spike heights are 17.52 mV (again, voltage divided by 10).
These tests suggest that energy harvesting from the environment is likely minimal.
Discharging the cells over hours Since strong neodymium magnets in proximity to the cells do not appear to appreciably impact their self-recharging, I have concluded that the domain structure could be brought to zero through other means, such as a very long discharge by shorting out the terminals of the scope probes. Such a long discharge did present the possibility that the domains of the material might be damaged so that they no longer recharge the cells, but it was an acceptable risk.
HC1 discharge. Probes x10. Beginning voltage before discharge: 75.79 mV. Spike heights: 17.52 mV
FC1 discharge. Probes x10. Beginning voltage before discharge: 38.18 mV. Spike heights: 17.52 mV
� of �15 20 ver 2.
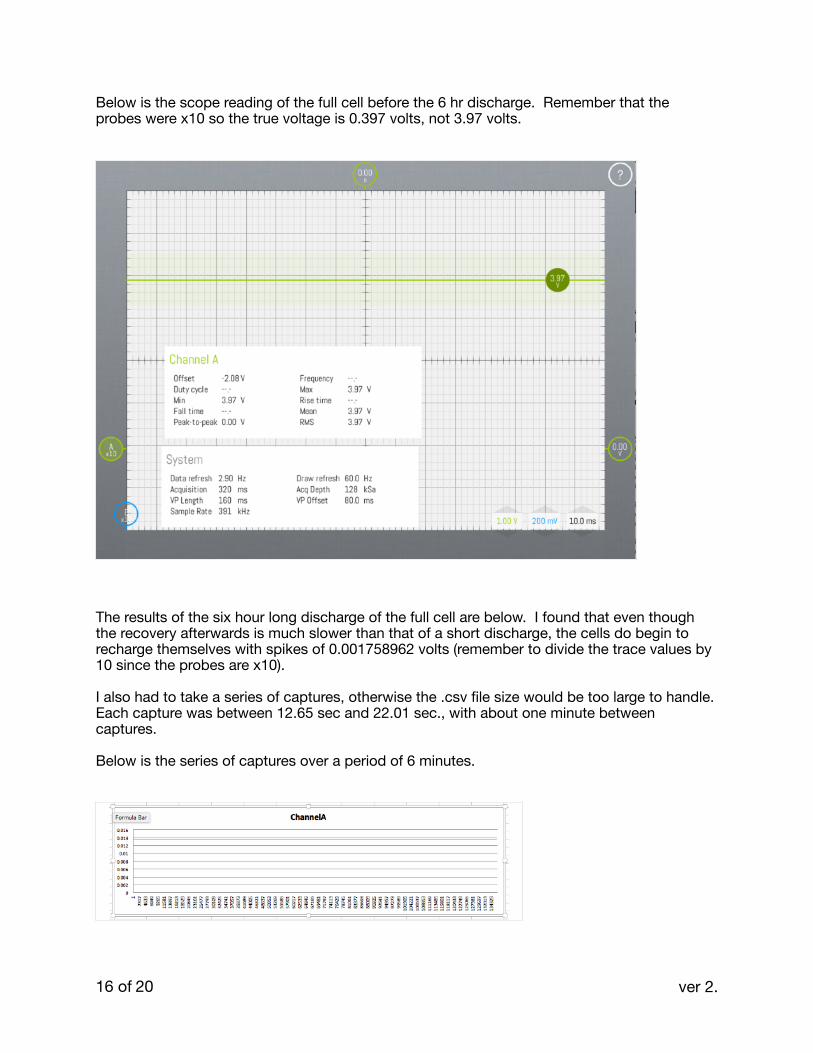
Below is the scope reading of the full cell before the 6 hr discharge. Remember that the probes were x10 so the true voltage is 0.397 volts, not 3.97 volts.
The results of the six hour long discharge of the full cell are below. I found that even though the recovery afterwards is much slower than that of a short discharge, the cells do begin to recharge themselves with spikes of 0.001758962 volts (remember to divide the trace values by 10 since the probes are x10).
I also had to take a series of captures, otherwise the .csv file size would be too large to handle. Each capture was between 12.65 sec and 22.01 sec., with about one minute between captures.
Below is the series of captures over a period of 6 minutes.
� of �16 20 ver 2.
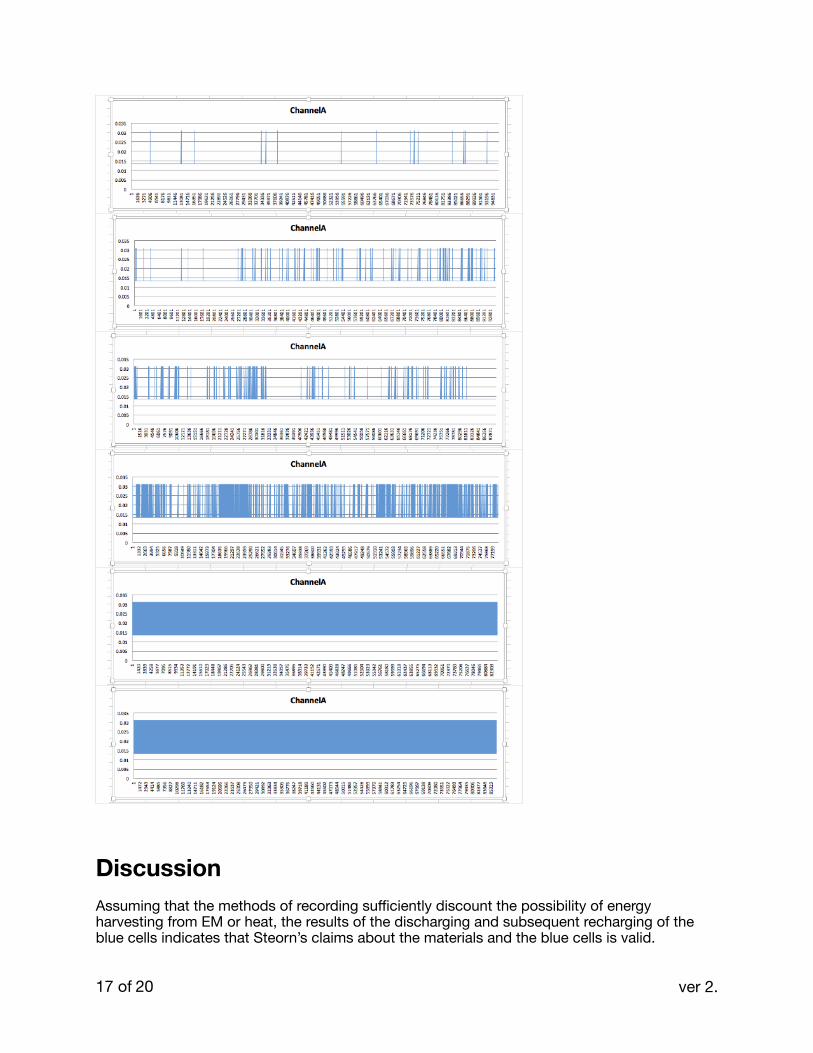
Discussion Assuming that the methods of recording sufficiently discount the possibility of energy harvesting from EM or heat, the results of the discharging and subsequent recharging of the blue cells indicates that Steorn’s claims about the materials and the blue cells is valid.
� of �17 20 ver 2.
So the cells themselves appear to function as advertised by Steorn. However, it was apparently the quality control, fabrication or design of the circuity of the O-Cube that led to its downfall and that of Steorn. Some of the readings of blue cells 1-4 also suggest that the reliability of some of those cells may also have contributed to the unreliability of the O-Cube.
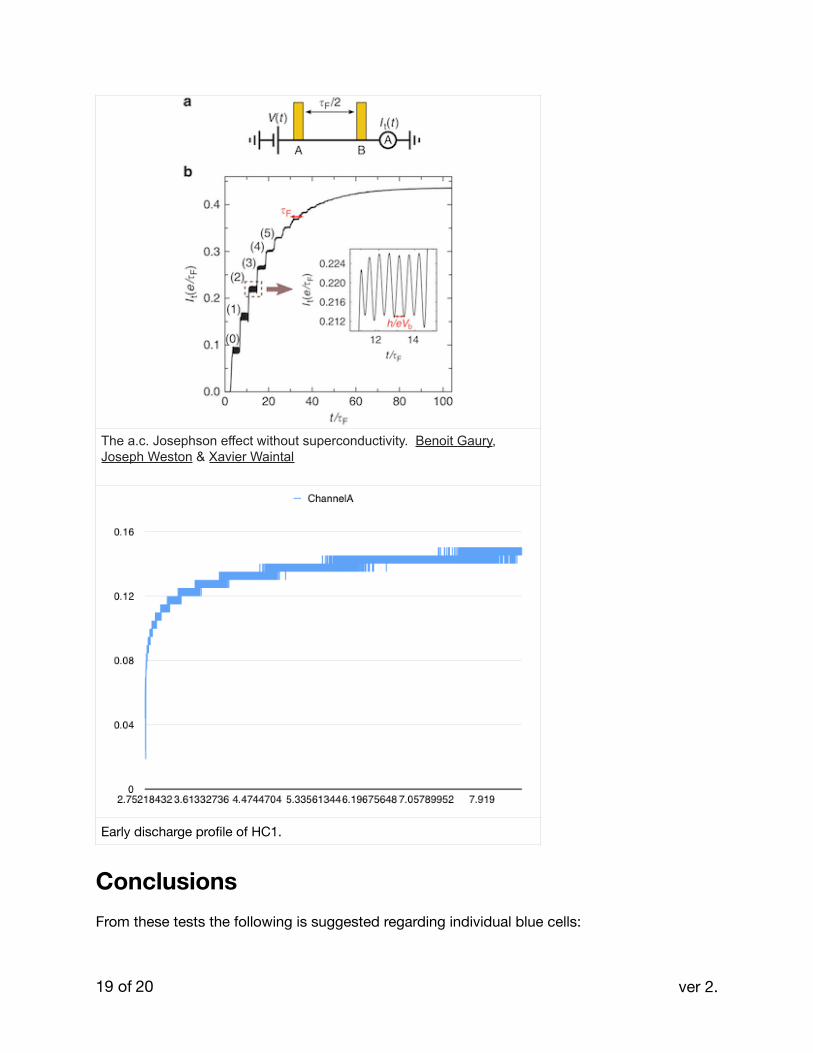
The recharge profile of the cells is quite unique. I attempted to find any other recharge profile that might be similar in the literature. I am not an engineer or scientist, so I may have missed somethings, but I did find this interesting similarity with materials demonstrating a Quantum Hall Effect. Here is the link to the paper: https://www.nature.com/articles/ncomms7524
The paper discusses unique voltage profiles exhibited by materials showing the integer and fractional Quantum Hall Effects (QHE). Such materials display the same (or very similar) trace as the ac-Josephson effect in superconducting materials. These effects appear to have some similarities with the spikes and steps that we see in the Orbo’s magic film material and which had previously been mentioned by Shaun.
The stepping that I have seen reported in papers on the QHE (see illustration below) show not only the regular steps (possibly Landau levels) but also some of the spiking before each jump. The illustrated plot below is current over time, not voltage over current or voltage over time, but the spikes and steps are clear. Below that illustration is a trace I took of the output from a full blue cell after discharge, shown as voltage over time. Both spikes and steps are clear and regular, but why so many spikes?
Shaun had previously mentioned “spikes” and “steps” in his postings. Now that we can see the spikes and steps there appears to be at least a superficial similarity with responses in QHE materials. However, there are differences.
Each step up in voltage in the Orbo’s material always appears to be the same amount. The same can be said for the spikes. The delta voltage changes only between measures of the half cell vs the full cell. The change does not diminish over time as with the QHE material.
The other difference is that our material’s spikes are the height of the steps, whereas in the paper the QHE material the spikes are only a fraction of the height of the steps.
The film of the Orbo cells may not be as ultra thin as those in the cited paper, the individual voltage spikes generated may represent an averaging of the tunneling of the electrons and a build up of charge. This repeats for many spikes until all of the material becomes charged to the next level and the next Landau level is reached. Once sufficient spikes have charged the material in aggregate, it reaches that next quantum level and after a period of time the charge again builds up with spikes of the same change in voltage going up to the next level. In this way the stepping may represent an aggregate of charge, or at least that’s my interpretation.
One thing I’m also unclear about is how these QHE effects (if they are) can they be triggered without the application of an oscillating magnetic field, as mentioned in the paper. Or does the domain strength change on its own by moving up and down the BH curve of the material? Lots of questions remain.
� of �18 20 ver 2.
Conclusions From these tests the following is suggested regarding individual blue cells:
The a.c. Josephson effect without superconductivity. Benoit Gaury, Joseph Weston & Xavier Waintal
Early discharge profile of HC1.
� of �19 20 ver 2.
1. They do recharge themselves as claimed by Steorn2. They do not harvest energy from the environment
Questions remain, such as what parameters impact the voltage height of the spikes? It does not appear to be impacted by whether a half cell is being measured or a full cell. Why were the spike height in my first measurement about a third of the value of later measurements? Perhaps it was a change in methods used. It’s unclear.
� of �20 20 ver 2.