Embed Size (px)
DESCRIPTION
macd
Citation preview

www.plindia.com | www.majorgainz.com KNOWLEDGECENTRE
Technical Analysis - MACD
What is technical analysis?Technical analysis is a method of forecasting the future movement of share prices by studying past
market activity like prices and volumes, using charts and other financial tools. Technical analysis follows
the philosophy that past market activity indicates future market activity. There are several benefits of using
technical analysis. The most important is that it focuses on price movement, so the necessary data is
easily available. Trends and patterns are easily identifiable. The Relative Strength Index (RSI), the Moving
Average Convergence Divergence (MACD) and the Stochastic Oscillator are popular tools of technical
analysis.
What is MACD?MACD is Technical Analysis indicator that was developed by Gerald Appel in 1970 to spot changes in
stock movement and the underlying trend. It is a collection of three signals that are calculated from the
historical prices of the stock – namely the MACD line, the Signal Line and the Divergence. It is broadly a
momentum indicator that shows the relationship between two moving averages of price i.e MACD is
calculated taking into account the difference between a short term Exponential Moving Average (12 days)
of a stock and longer term Exponential Moving Average (26 days) of the stock against the Signal Line
which shows the 9 day Exponential Moving Average.
How is MACD calculated?An MACD chart consists of a two coloured lines –the MACD line and the MACD Signal line. The MACD
line is calculated by by following this process -
1. Calculate a 12 day EMA of closing prices
2. Calculate a 26 day EMA of closing prices
3. Subtract the longer EMA in (2) from the shorter EMA in (1)
The the MACD Signal line is calculated by taking the 9 day exponential moving average of the stock.
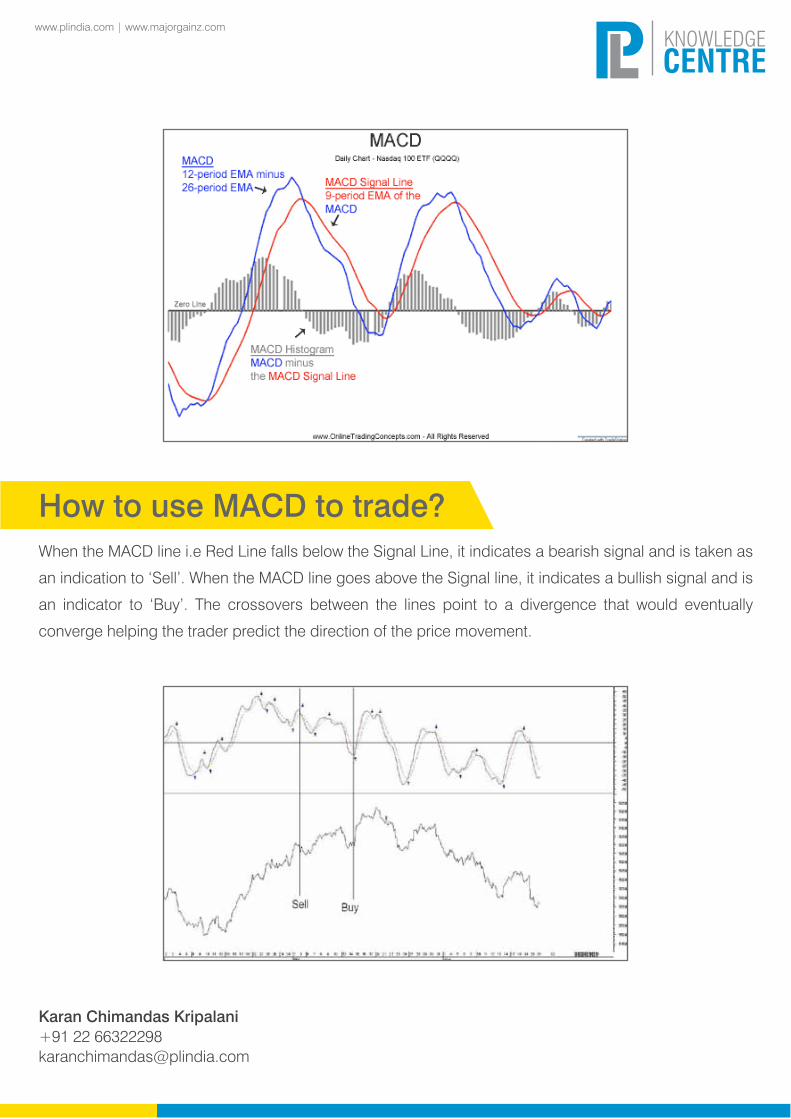
How to use MACD to trade?When the MACD line i.e Red Line falls below the Signal Line, it indicates a bearish signal and is taken as
an indication to ‘Sell’. When the MACD line goes above the Signal line, it indicates a bullish signal and is
an indicator to ‘Buy’. The crossovers between the lines point to a divergence that would eventually
converge helping the trader predict the direction of the price movement.
www.plindia.com | www.majorgainz.com KNOWLEDGECENTRE
Karan Chimandas Kripalani+91 22 [email protected]