Embed Size (px)
Citation preview
84
Journal of Social and Development Sciences Vol. 4, No. 2, pp. 84-99, Feb 2013 (ISSN 2221-1152)
Technical Efficiency Analysis of Maize Farmers in the Eastern Region of Ghana
John K. M. Kuwornu*, Emmanuel Amoah, Wayo Seini University of Ghana, Legon, Ghana
*[email protected] Abstract: This study assesses the technical efficiency and its determinants of maize farmers in the Eastern Region of Ghana. A multi stage random sampling procedure was employed to select 226 maize farmers from the four main geographical areas of the region for the study. A well-structured questionnaire and field observations were employed to collect relevant information from the respondents. Data collected was analyzed using relevant econometric techniques. The results indicate that elasticities of mean output for agrochemicals, hired labor, other inputs are positive while those of seed, fertilizer and family labor are negative. The computed return to scale on the other hand reveals that, on average, the maize farms exhibit decreasing returns to scale. The joint effect of operational and farm-specific factors influence technical efficiency but individual effects of some variables are not significant. Mean technical efficiency level of the farmers is estimated to be 51%, indicating that the possibility of increasing maize production in the region given the current state of technology and inputs level can be achieved in the short run by increasing the technical efficiency level of the farmers by 49% through the adoption of practices of the best maize farmer. Further, the empirical results from the inefficiency model show that extension visit, FBO membership, frequency of meeting by members of FBOs, formal training in maize farming, cash and in-kind credits are the major determinants of the farmers’ technical efficiency level. Finally, the resource use efficiency results revealed that agro-chemicals and hired labor are under-utilized whereas seed, fertilizer and family labor are over-utilized by maize farmers in the region. These results have implications for management of small and medium scale food crop farms in developing countries. Keywords: Maize, Technical Efficiency, Resource Use Efficiency, Returns to scale, Ghana
1. Introduction Agriculture sector contributes 25.6% to Ghana’s GDP after the Services and Industrial sectors, and is the most important sector driving Ghana’s economic growth. Agriculture accounts for the greatest proportion of Ghana’s export earnings with principal Agricultural exports being cocoa, timber, horticultural products, fish/sea foods, game and wildlife. It is solely responsible for providing food security for both the rural and urban population. Agriculture supplies raw materials to feed industries and a major source of revenue yet Ghana’s agriculture remains predominantly small scale and the majority of farmers are food crop farmers producing mainly for home consumption (MOFA, 2009 and GSS, 2012). Maize in particular is the first among the main crops contributing to Ghana’s food security and also increases farmers’ disposable income through their investment in its production in areas such as improved seeds, fertilizer and machinery use. As the production base becomes larger, the income again becomes incrementally larger and the farmers can lift themselves up to a far more commercial level and out of poverty. The farmer then spends a very small part of the income from maize on the household and therefore is able to improve his or her knowledge base. This all starts from the farmer receiving enough advice and exposure to the benefits of using improved inputs (WABS Consulting Ltd., 2008). However, in Ghana, the maximum yield obtained by staple crop farmers has been estimated to be 200% lower than the maximum attainable level (frontier) of their output whereas the minimum yield obtained by them is also estimated as 300% below the maximum attainable output level (Al-hassan and Diao, 2007). Also, projected figures for household consumption depicts that there is considerable unfulfilled demand for processed maize for human uses and for the growing animal feed sector within Ghana (MoFA, 2010) so if policies are strengthened to improve trade in the sub region, maize could be exported to other countries within the sub Saharan region. Between 1979 and 1997, the government of Ghana and the Canadian government undertook a project which was aimed at improving maize with the objective of increasing maize yield, resistance to disease and pest, nutritional quality of maize and developing varieties to
brought to you by COREView metadata, citation and similar papers at core.ac.uk
provided by AMH International (E-Journals)

85
suit different agro-ecological zones in Ghana. The project developed and promoted the use of twelve improved varieties of maize, fertilizer recommendations and plant configurations. However, the impact of these recommendations has not been felt due to low performance of the cultivated varieties as a result of the physical environment, socioeconomic characteristics of the farmers and poor rural environment conditions (WABS Consulting Ltd., 2008). In the Eastern Region of Ghana, yield of maize from the farms ranges from 0.8 to 3.6 tons per hectare which are far below the maximum yield of 5.5 to 6 tons per hectare (Kwarteng and Towler, 1995; MoFA, 2006). Thus, the maize productivity remaining low raises questions about the efficiency with which resources are used by farmers in Ghana even in periods when the country experiences favorable weather conditions. As noted by Abdulai and Teitje (2007) findings from the study of technical efficiency have far-reaching policy implications so the study of technical efficiency has drawn a lot of attention from researchers over the past 30 years in West Africa (Hallam and Machado, 1995). Despite the fact that Eastern Region ranks as the third largest maize producing region in the country, studies bordering on technical efficiency differentials in the region are scanty or none existing. For instance, WABS Consulting Limited (2008) and Al-Hassan et al., (2007) made some attempts but could not ascertain the differentials of technical efficiency of maize farms in the region. Also, even though these studies considered credit in their analysis, they mostly looked at the farmers’ access to formal financial institutions’ credit aspect only. They therefore did not to consider the individual effects of cash credit or in-kind credit use by farmers on technical efficiency. Therefore, there is the need for a study that will analyze the technical efficiency and its determinants for the four categories of farmers (Non-credit users, cash credit users, in-kind credit users and those farmers who use both cash credit and in-kind credit) in the region to provide the basis for the formulation of specific policies for boosting the efficiency of maize production in the study area based on the research findings. The objective of this study are four fold: To estimate the productivity of maize farms in the Region with respect to the input factors; estimate the technical efficiency level of maize farmers in the Region; examine the determinants of technical efficiency of maize crop farmers; and analyze the resources use efficiency of maize farms in the Region. The rest of the study is structured as follows. Section 2 provides the literature review, section 3 outlines the methodology employed; section 4 presents the empirical results; and section 5 provides the conclusions. 2. Literature Review Production and Farm Efficiency: Case et al., (2009) defined efficiency as the condition in which the economy is producing what people want at least possible cost. Thus, the concept of efficiency is primarily concerned with the relative performance of the processes used in transforming given inputs into outputs. Economic theory propounded by Farrell (1957) identifies at least three types of efficiency. These are allocative, technical and economic efficiencies. Allocative efficiency refers to the choice of the best combination of inputs consistent with the relative factor prices. That is, allocative efficiency is the ability of a firm to use inputs in optimal proportions, given their respective prices. Technical efficiency shows the ability of firms to employ the ‘best practice’ in an industry, so that no more than the necessary amount of a given sets of inputs is used in producing the best level of output (Carlson, 1968). The product of technical and allocative efficiencies yields economic efficiency. The manager or the farmer is thus concerned with producing higher levels of output at the lowest possible cost. Therefore, the firms or farms make efforts to either reduce the cost of a certain level of output or to increase the output with a certain level of costs. These two optimization problems provide the same rule for the allocation of inputs and selection of technology. Because there are alternative means of achieving the production goals, the production theory gives the theoretical and empirical framework which helps in best selection among alternatives for anyone or a combination of the farmer’s objectives to be achieved. Agricultural productivity is a measure of efficiency since the aggregate productivity of an economic system is proportional to the efficiency of production of the components within the systems (Olayide and Heady, 1982). Further, potential resource productivity means getting the maximum output from the minimum possible set of inputs. Thus, optimal productivity of resources demands an efficient usage of resources in the production process. Agricultural productivity can therefore be defined as a measure of efficiency with which the agricultural system utilizes land, labor, capital and other resources. Technical Efficiency: Technical efficiency is defined as the physical ratio of product output to the factor inputs. The greater the ratio, the greater the size of the technical efficiency. This implies the existence of
86
variation in technical efficiency among firms or farms. The production function pre-supposes technical efficiency, whereby maximum output is obtained from a given level of inputs combination; hence it is a factor-product relationship. Generally, technical efficiency is the ability to minimize input use in the production of an output vector, or the ability to obtain maximum output from an input vector (Kumbhakar et al., 2000). An important assumption underlying efficiency concept is that firms operate on the outer bound of production function (i.e., on their efficiency frontier). Developments in cost and production frontiers are attempts to measure productive efficiency. The frontier defines the limit or boundary to a range of possible observed production (cost) levels and identifies the extent to which the firm lies below (above) the frontier (Farrell, 1957). It means that firms or farms become technically inefficient when they fail to operate on the outer bound of their production function. Such firms can improve their technical efficiency by three ways: (a) improved production techniques, which implies a change in factor proportions through factor substitution under a given technology, thus representing a change along the given production function; (b) an improvement in production technology, which represents a change in the production function itself in a way that the same amount of resources produce more output, or the same amount of output is derived from smaller quantities of resources than before, and (c) a simultaneous improvement in both production techniques and technology (Amaza et al., 2001). The technical efficiency of individual farmers according to Ogundari and Ojo (2007) refers to the ratio of observed output to the corresponding frontier’s output, conditional on the level of input used by the farmers. Olayide and Heady (1982) however, defined technical efficiency as the ability of a firm to produce a given level of output with minimum quantity of inputs under a given technology. Efficiency can as such be seen as a vital determining factor of productivity growth of an individual farmer. For efficient production, non-physical inputs, such as experience, information and supervision, might influence the ability of a producer to use the available technology efficiently. Each type of inefficiency is costly to a firm or production unit (e.g., a farm household) because it causes a reduction in profit below the maximum value attainable under full efficiency. Farell (1957) used an input-oriented scheme while Fare et al., (1985) employed an output-oriented scheme to measure efficiency. However, Coelli and Perelman (1996) showed that the choice of an orientation rarely has an influence on the reported efficiency scores. Parametric and non-parametric approaches are other common measuring tools of technical efficiency. Basically, non-parametric frontier technique has been fused into the Data Envelopment Analysis (DEA). Non-parametric frontiers do not impose a functional form on the production frontiers and do not make assumptions about the error term. These have used linear programming models to estimate firms’ level of efficiency. Parametric frontier approaches impose a functional form on the production function and make assumptions about the data. The most common functional forms include the Cobb-Douglas, constant elasticity of substitution and translog production functions. Cross-Sectional Production Frontier Models: Four methods are proposed for the estimation of Technical Efficiency (TE) using this type of data: Goal Programming, Corrected Ordinary Least Squares (COLS), Modified Ordinary Least Squares (MOLS), and Composed Error Model or Stochastic Production Frontier. We provide a brief description of each of these methodologies in turn as follows: Goal Programming: with this method, the deterministic production frontier is converted to any of a pair of mathematical programming models. A linear programming model is used to calculate the parameter vectors as well as to minimize the sum of proportionate deviations of the observed output of each producer below the maximum feasible output. These results are then converted to measures of technical efficiency of the producers. Thus,
0min , subject to [ ln ] ln , =1,..., .i n ni i
i n
u x y i I
The other model is a quadratic programming model which calculates the parameter vector β and minimizes the sum of the squared proportionate deviations of the observed output of each producer. That is,
2
0min , subject to [ ln ] ln , =1,..., .i n ni i
i n
u x y i I
Technical efficiency is then calculated from the deviation as
0{ }, where [ ln ] ln , 1,...,i i i n ni i
n
TE e u u x y i I (Aigner and Chu, 1968).

87
Since parameter vectors are not estimated using regression models, statistical inference about their values are complicated. The log likelihood estimates of these do not come with standard errors attached and also cannot be determined by traditional methods (Schmidt, 1976; Greene, 1980). Corrected Ordinary Least Squares (COLS): OLS is used to estimate the parameter vectors and the intercept value concurrently. These estimated parameter vectors are consistent and unbiased but the estimated intercept is also consistent but biased. The biased intercept is corrected to make the estimated frontier bound
the data from above (second step). That is *
0 0ˆ ˆ ˆmax{ }i
iu . ˆ
iU are residuals of the OLS, which are
corrected in the opposite direction. That is, *ˆ ˆ ˆmax{ }.i i ii
u u u Technical efficiency is estimated from the
residuals as follows*ˆ{ }i iTE e u . Even though this method is relatively simple and easy to use, the
estimated variables in natural logs of the production are parallel to OLS regression. This means that the structure of the “best practice production technology” is the same as the structure of “central tendency production technology” yet the structure of the “best practice production technology” is expected to change from that of central tendency production technology down in the middle of the data where the other producers are less efficient than the best practice producers (Winsten, 1957). Modified Ordinary Least Squares (MOLS): The deterministic production frontier model is estimated by OLS under assumption that the error term follows a one-sided distribution like exponential and half-normal distributions. The estimated intercept is then modified by the mean of the assumed one-sided distribution.
That is,**
0 0ˆ ˆ ˆ( )E u where
**ˆ ˆ ˆ{ }i i iu u E u .
Technical efficiency is estimated in the same way as the COLS (Afrait, 1972; Richmond, 1974). This procedure is also simple and easy to implement but has it’s limitations: it is possible to obtain a technical efficiency score
greater than 1. MOLS also shifts 0 so far that no producer is technically efficient and as well MOLS
production frontier is parallel to OLS regression.
Composed Error Model or Stochastic Production Frontier: It assumes that ( ; )if x takes log linear Cobb-
Douglass form and so becomes 0ln lni n ni i i
n
y x v u where vi is the two sided noise component
and iu is the nonnegative technical inefficiency component of the error term. iv is assumed to be ~N (0, 𝛔2v)
(i.e. it has a technical inefficiency modal value of zero) and symmetric, distributed independently of iu and iu
assumed to be ~N+ (0, 𝛔2u) (i.e. it has technical inefficiency modal value of zero with less likely increasing technical inefficiency values). Thereafter, technical efficiency was defined as the ratio of observed output to
maximum feasible output in an environment characterized by exp{ }iv . Thus, y,
( ; ).exp{ }
ii
i i
TEf x v
where the denominator on the right hand side is the stochastic frontier consisting of the deterministic part that is common to all producers and exp{ }iv which is the producer-specific portion capturing effects of
random shocks on each producer. The stochastic frontier method would be employed in this study because it makes it possible to determine the efficiency levels for policy formulation purposes as well as being useful for identifying the sources of the inefficiencies in the system. The single step estimation approach proposed by (Coelli, 1995) would be used to compute the relationship between the farm/farmer characteristics and the technical efficiency index:
ii uv
ii exfY
);( (1)
Where, Yi is output, ix a vector of inputs, β a vector of parameters to be estimated and e represent exponent.
The error vi is ~N(0, σv2) and captures random variation in output due to the factors beyond the control of

88
the farmers, such as variation in weather, measurement error and other statistical noise. The error term iu
captures technical inefficiency in production, assumed to be farm-specific with non-negative random
variables, ~ N+(μi, σu2). This means that the iu
is distributed as truncation (i.e. at zero) of the normal
distribution with mean, µi, and variance σu2. The µi (mean) is defined as:
ii Z (2)
where, Zi is a (Þ×1) vector of independent variables associated with the technical inefficiency effects which could capture socio-economic farm management features. Þ is a (1×Þ) vector of unknown parameter to be
estimated. A higher value for iu implies an increase in technical inefficiency. If iu is zero, the farm is perfectly
technically efficient. This implies the boundary of the production defined by the “best practice” farm. Thus, it
indicates the maximum potential output for a given set of inputs, ix .The maximum potential output is given
as follows;
iv
ii exfY );(* (3)
Technical efficiency can thus be measured as:
i
i
iiu
v
i
uv
ii e
exf
exfTE
);(
);(
(4)
The difference between the maximum potential output and the actual output is embodied in the u. If 0iu
then *
i
i
Y
Yproduction lies on the frontier and hence technically efficient, but if 0iu then production lies
below the frontier and the farm is said to be inefficient (Battese and Coelli, 1995). Estimation Procedure for the Stochastic Frontier Function: The stochastic frontier model involves estimating the parameters first and then the estimation of the technical efficiency follows. The estimation
methods must follow the assumptions underlying the noise error term ( iv ) as stated above and the
inefficiency error term. The inefficiency component represents a variety of features that reflect inefficiency such as farm-specific knowledge; the will, skills, and effort of management and employees; work stoppages, material difficulties, and other disruptions to production (Aigner et al., 1977; Lee and Tyler, 1978; Page,
1980). Meeusen and van den Broeck (1977) and Aigner et al., (1977) assume that iu has an exponential and a
half-normal distribution, respectively. Both distributions have a mode of zero. Other proposed specifications
of the distribution of iu include a truncated normal distribution ~ N (μ, σ2) (Stevenson, 1980) and the gamma
density (Greene, 1980). This study employs the model developed by Battese and Coelli (1995) which assumes
that iu is normally distributed with mean zero and a constant variance [i.e. ~ N+ (0,σu2)]. It is significant to
separate the composed error term for efficiency measurement. That is,
( )i i iv u . If iu = 0, then, ( | )i iE u is the expected value of iu conditioned on the error term (Jondrow et
al., 1982). When the conditional estimate of iu is obtained, then the technical efficiency level of an individual
farmer is estimated as { ( | )}i i iTE e E u . The correct estimator ( { }| )i i iTE E e u is the formula
employed in this research (Coelli, 1995). Depending on the assumption of the random errors, the maximum likelihood single stage estimation procedure for estimating the parameters of the frontier model, inefficiency model and the farm-specific TEi defined by the measure of efficiency of technical efficiency model are
89
obtained by the parameterization: σ2 = σv2+σu
2 and = σu2 / σ2 = σu
2 / (σv2+σu
2) (Battese and Corra, 1977),
where σ2= total variation, σv2= variation resulting from noise, σu
2= variation arising from inefficiency and =
1 implies variance from the frontier is wholly due to inefficiency while = 0 implies variance from the
frontier totally comes from noise effects. That is, for 0 < < 1, output variation is attributed to both stochastic
errors and technical inefficiency. 3. Methodology The Study Area: The Eastern region of Ghana is made up of 21 districts that has been categorized into four main geographical areas: the Kwahu scarp that has an elevation of 2,586 feet above sea level; the Atiwa-Atwaredu Ranges near Kibi with an elevation of 2,400 feet; the Akuapem highland which has an elevation of 1,530 feet and is the continuation of the southern portion of the Togo-Atakora mountain ranges; and the isolated hills or mountains dotting the relatively low-lying plains to the south. The Krobo and the Yogaga mountains are the prominent ones among these hills or mountains (http//www."Eastern Region"GhanaNation.com (accessed 11thDecember, 2010). The forest and savannah type of soils are suitable for the cultivation of different kinds of crops such as cocoa, cola-nuts, citrus, oil palm and staple food crops such as cassava, yam, cocoyam, maize, rice and vegetables. Some exotic crops like black and sweet pepper, ginger, cashew nuts, Irish potatoes, rubber and mangoes also thrive well in the region. These exotic crops are also gaining importance as export commodities (http//www."Eastern Region"GhanaNation.com). The region lies within the wet semi-equatorial zone which has a double maxima rainfall that occurs in June and October. The first rainy season starts from May and ends in July, with the heaviest rainfall occurring in June. The second rainy season starts from September and ends in November. However, there are variations in the distribution of this bimodal rainfall among the districts. Temperatures in the region are high and range between 260C and 300C. The relative humidity is also high throughout the year and varies between 70-80% (http//www"Eastern Region"GhanaNation.com (accessed 11thDecember, 2010). Type and Sources of Data: A well-structured questionnaire was administered in 2010 to obtain the relevant primary qualitative and quantitative data from 226 maize farmers in the Eastern Region of Ghana. The Secondary data sources were from research offices of agriculture, MiDA statistical department, Ghana Statistical Service, text books, on-line materials and published Agricultural Journals which assisted us to check the reliability, conformity and consistency of the results obtained from the study. Sampling Method and Sample Size: A multistage sampling technique was used to select 226 respondent farmers. Thus, purposive sampling technique was employed to select the Eastern Region from the 10 regions of the country as well as the five districts; then simple random sampling procedure was employed to select 63 communities from which the 226 maize farmers were selected using the same procedure. Methods of Analysis, Translog Production: As the first step in the estimation procedure of technical efficiency of a production process, the computer software, Frontier Version 4.1 was employed to estimate the coefficients of the inputs variables using the translog functional form. The function is expressed as:
)(lnln5.0lnln6
1
6
1
6
1
0 qqrqpq
p r
prpq
p
pq uvxxxY
(5)
Where, Y is the total quantity or volume of maize produced, ln = natural logarithm, q =qth maize farmer for q
= 1, 2, 3… 226, pqx amount of input p used by q-th maize farmer with an assumption that there is symmetry
in input cross effects by considering pr rp but if 0pr then the translog stochastic frontier model will
be reduced to the Cobb Douglas Production Function. Where, 1x seed (kg)/Ha; 2x fertilizer (kg)/Ha;
90
3x agro-chemicals (kg/Ha or L/Ha); 4x other inputs (GH¢)1; 5x family labor (man-days)/Ha; 6x
hired labor (man-days)/Ha; q parameter to be estimated;
qv random errors from the stochastic
frontier production and qu a vector of non-negative technical inefficiency component of the error term.
Mention Elasticities: According to Onumah et al. (2010), the estimated parameters β1, β2…β6 are output elasticities of the corresponding inputs in the Cobb-Douglas stochastic frontier production function (6). However, the elasticities of output based on different inputs are functions of the level of inputs employed in the translog stochastic production function. It is expressed as:
pr
rqpqpp
pq
pxx
x
YElnln
ln
)(ln (6)
Moreover, when the output and input variables have been normalized by their respective sample means, the first order coefficient can be interpreted as elasticities of output in relation to the different inputs. The summation of the output elasticities is the estimated scale elasticity ( ). It is defined as the percentage
change in output from 1% change in all input factors. It is a measure of returns to scale for a farm or industry. Returns to scale decision rule ( ) 1 implies increasing returns to scale (IRS)
( ) 1 implies decreasing returns to scale (DRS)
( ) =1 implies constant returns to scale (CRS).
Estimating the technical efficiency level of the maize farmers: Using an output orientation of the frontier, the farmers’ maize production frontier was formulated as a stochastic maize production frontier in a cross-
sectional context following: y ( ; ) e qv
q i qf x TE where, ( ; )e qv
qf x is the stochastic production
frontier consisting of the deterministic part ( ; )qf x common to all maize producers in the sample and a
producer-specific part( )
e qvcapturing the effects of random shocks on each individual maize farmer.
Technical efficiency is then simply defined byv
y
( ; )e q
q
q
i
TEf x
i.e. the ratio of observed maize output to
maximum feasible maize output in an environment characterized by ( )
e qv(Tchale and Sauer, 2007). The one-
step maximum likelihood estimation procedure developed by Coelli (1995) was used to estimate the technical efficiency level of the farmers after the estimation of the input parameters. This was accomplished
by first estimating the expected value of the qu conditioned on the error term (i.e. { | }q qE u ) as proposed
by Jondrow et al., (1982). The next step was the determination of the technical efficiency level of the individual farmers which was done by the use of the Frontier Version 4.1 software. The model employed was
( { }| )q q qTE E e u . The final step was the estimation of the mean technical efficiency level of the maize
farmers in the study area which was also carried out by the use of the same Frontier Version 4.1 software. The meanings of the variables in the models as well as the assumptions underlying them are the same as explained in the estimation procedure. Examining the determinants of technical efficiency of maize crop farmers: The various farm-specific variables hypothesized to influence technical inefficiencies in maize farms in the region are defined by the model:
1 Please note that the farmer’s use of other inputs (aside the inputs stated above), would lead to “other costs”.
91
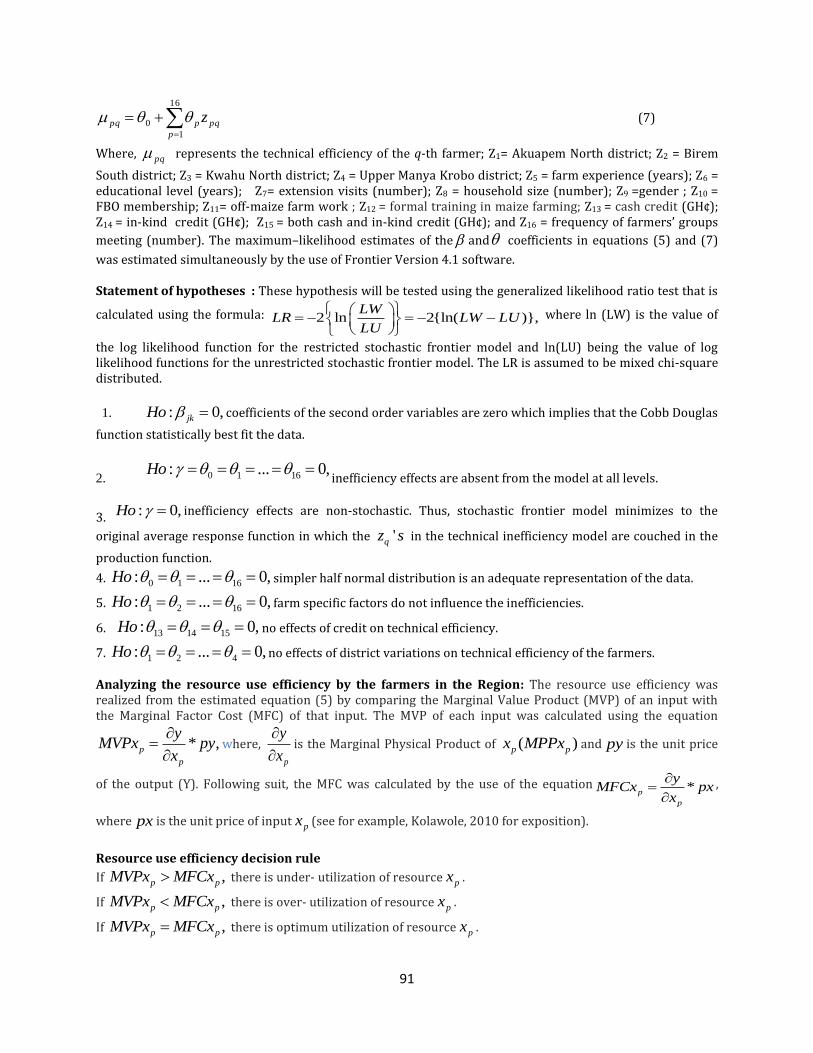
pq
p
ppq z
16
1
0 (7)
Where, pq represents the technical efficiency of the q-th farmer; Z1= Akuapem North district; Z2 = Birem
South district; Z3 = Kwahu North district; Z4 = Upper Manya Krobo district; Z5 = farm experience (years); Z6 = educational level (years); Z7= extension visits (number); Z8 = household size (number); Z9 =gender ; Z10 = FBO membership; Z11= off-maize farm work ; Z12 = formal training in maize farming; Z13 = cash credit (GH¢); Z14 = in-kind credit (GH¢); Z15 = both cash and in-kind credit (GH¢); and Z16 = frequency of farmers’ groups
meeting (number). The maximum–likelihood estimates of the and coefficients in equations (5) and (7)
was estimated simultaneously by the use of Frontier Version 4.1 software. Statement of hypotheses : These hypothesis will be tested using the generalized likelihood ratio test that is
calculated using the formula: 2 ln 2{ln( )},LW
LR LW LULU
where ln (LW) is the value of
the log likelihood function for the restricted stochastic frontier model and ln(LU) being the value of log likelihood functions for the unrestricted stochastic frontier model. The LR is assumed to be mixed chi-square distributed.
1. : 0,jkHo coefficients of the second order variables are zero which implies that the Cobb Douglas
function statistically best fit the data.
2. 0 1 16: ... 0,Ho inefficiency effects are absent from the model at all levels.
3. : 0,Ho inefficiency effects are non-stochastic. Thus, stochastic frontier model minimizes to the
original average response function in which the 'qz s in the technical inefficiency model are couched in the
production function.
4. 0 1 16: ... 0,Ho simpler half normal distribution is an adequate representation of the data.
5. 1 2 16: ... 0,Ho farm specific factors do not influence the inefficiencies.
6. 13 14 15: 0,Ho no effects of credit on technical efficiency.
7. 1 2 4: ... 0,Ho no effects of district variations on technical efficiency of the farmers.
Analyzing the resource use efficiency by the farmers in the Region: The resource use efficiency was realized from the estimated equation (5) by comparing the Marginal Value Product (MVP) of an input with the Marginal Factor Cost (MFC) of that input. The MVP of each input was calculated using the equation
* ,p
p
yMVPx py
x
where,
p
y
x
is the Marginal Physical Product of ( )p px MPPx and py is the unit price
of the output (Y). Following suit, the MFC was calculated by the use of the equation *p
p
yMFCx px
x
,
where px is the unit price of input px (see for example, Kolawole, 2010 for exposition).
Resource use efficiency decision rule
If ,p pMVPx MFCx there is under- utilization of resource px .
If ,p pMVPx MFCx there is over- utilization of resource px .
If ,p pMVPx MFCx there is optimum utilization of resource px .
92
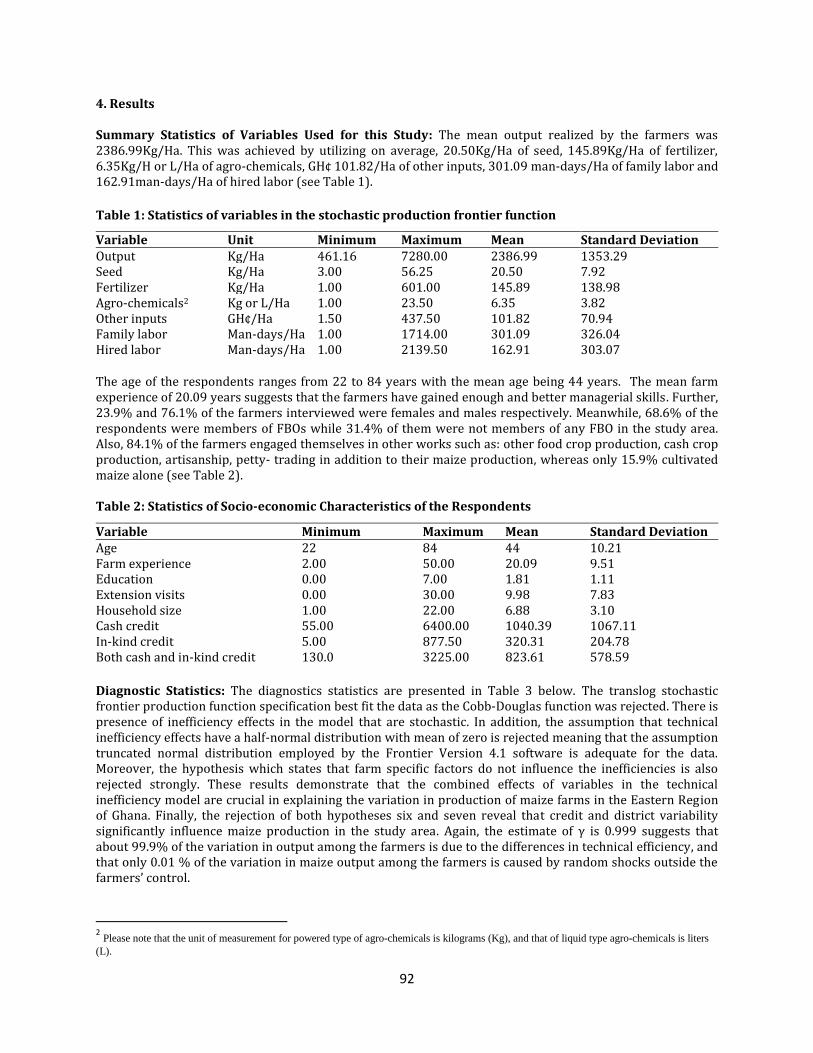
4. Results Summary Statistics of Variables Used for this Study: The mean output realized by the farmers was 2386.99Kg/Ha. This was achieved by utilizing on average, 20.50Kg/Ha of seed, 145.89Kg/Ha of fertilizer, 6.35Kg/H or L/Ha of agro-chemicals, GH¢ 101.82/Ha of other inputs, 301.09 man-days/Ha of family labor and 162.91man-days/Ha of hired labor (see Table 1).
Table 1: Statistics of variables in the stochastic production frontier function
The age of the respondents ranges from 22 to 84 years with the mean age being 44 years. The mean farm experience of 20.09 years suggests that the farmers have gained enough and better managerial skills. Further, 23.9% and 76.1% of the farmers interviewed were females and males respectively. Meanwhile, 68.6% of the respondents were members of FBOs while 31.4% of them were not members of any FBO in the study area. Also, 84.1% of the farmers engaged themselves in other works such as: other food crop production, cash crop production, artisanship, petty- trading in addition to their maize production, whereas only 15.9% cultivated maize alone (see Table 2). Table 2: Statistics of Socio-economic Characteristics of the Respondents
Diagnostic Statistics: The diagnostics statistics are presented in Table 3 below. The translog stochastic frontier production function specification best fit the data as the Cobb-Douglas function was rejected. There is presence of inefficiency effects in the model that are stochastic. In addition, the assumption that technical inefficiency effects have a half-normal distribution with mean of zero is rejected meaning that the assumption truncated normal distribution employed by the Frontier Version 4.1 software is adequate for the data. Moreover, the hypothesis which states that farm specific factors do not influence the inefficiencies is also rejected strongly. These results demonstrate that the combined effects of variables in the technical inefficiency model are crucial in explaining the variation in production of maize farms in the Eastern Region of Ghana. Finally, the rejection of both hypotheses six and seven reveal that credit and district variability significantly influence maize production in the study area. Again, the estimate of γ is 0.999 suggests that about 99.9% of the variation in output among the farmers is due to the differences in technical efficiency, and that only 0.01 % of the variation in maize output among the farmers is caused by random shocks outside the farmers’ control.
2 Please note that the unit of measurement for powered type of agro-chemicals is kilograms (Kg), and that of liquid type agro-chemicals is liters
(L).
Variable Unit Minimum Maximum Mean Standard Deviation Output Kg/Ha 461.16 7280.00 2386.99 1353.29 Seed Kg/Ha 3.00 56.25 20.50 7.92 Fertilizer Kg/Ha 1.00 601.00 145.89 138.98 Agro-chemicals2 Kg or L/Ha 1.00 23.50 6.35 3.82 Other inputs GH¢/Ha 1.50 437.50 101.82 70.94 Family labor Man-days/Ha 1.00 1714.00 301.09 326.04 Hired labor Man-days/Ha 1.00 2139.50 162.91 303.07
Variable Minimum Maximum Mean Standard Deviation Age Farm experience
22 2.00
84 50.00
44 20.09
10.21 9.51
Education 0.00 7.00 1.81 1.11 Extension visits 0.00 30.00 9.98 7.83 Household size Cash credit In-kind credit Both cash and in-kind credit
1.00 55.00 5.00 130.0
22.00 6400.00 877.50 3225.00
6.88 1040.39 320.31 823.61
3.10 1067.11 204.78 578.59

93
Table 3: Validation of Hypotheses
Null hypothesis Log-likelihood value
Test statistics(λ)
Critical value (λ2 0.05)
Decision
: 0jkHo -76.34 40.46 32.671 Reject Ho
0 1 16: ... 0Ho 118.60 118.60 28.268 Reject Ho
: 0Ho 118.60 118.60 2.706 Reject Ho
0 1 16: ... 0Ho -115.16 118.10 27.587 Reject Ho
1 2 16: ... 0Ho -115.54 118.86 26.296 Reject Ho
13 14 15: 0Ho -76.29 40.36 7.815 Reject Ho
1 2 4: ... 0Ho -72.71 33.20 9.488 Reject Ho
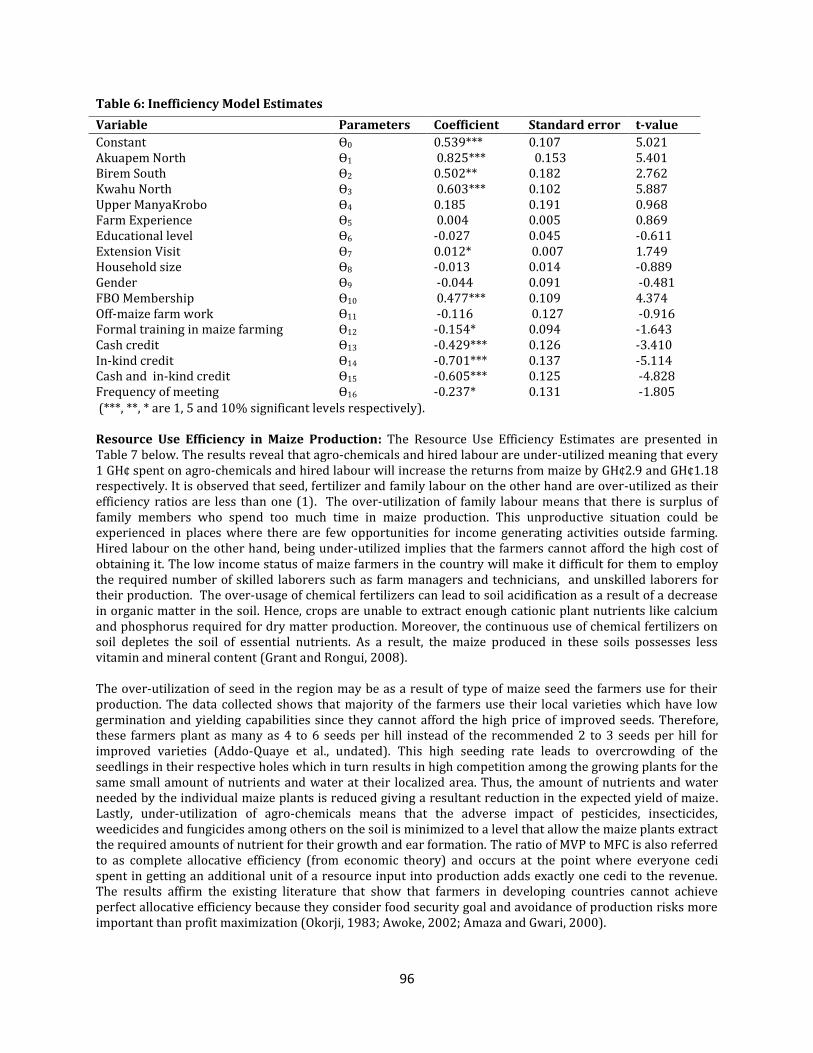
The Maximum Likelihood Estimates: The maximum likelihood estimates are presented in Table 4 below. Out of the six variables in the translog stochastic frontier model, three were found to be statistically significant. These are agro-chemicals, other inputs and hired labour. Agro-chemicals in the form of pesticides, fungicides and weedicides among others impacted positively on the output of maize. This shows that application of these chemicals will protect the maize from the destruction of pests, insects and fungi among others. Activities of these organisms on crops such as maize lead to lower levels of output as they can destroy large size of farm crops. This result are consistent with Kwarteng and Towler (1995) who contend that weeds and fungi attacks on maize plant reduce its ability to photosynthesize leading to drastic yield reduction. The coefficient of hired labour indicates that maize output will rise by 0.14% if hired labour use is increased by 1%. This implies that if a maize farmer has money for additional labour, he/she can increase the size of his/her farm leading to the expansion of output. This is because food crop production such as maize is labour intensive and therefore will require more labour especially for weeding and harvesting operations. This result is also consistent with Amaza et al., (2001) who reveal that farmers who had the main objective of income maximization in food crop production will tend to allocate hired labour more efficiently. The other costs which refer to the cost of ploughing the land, transaction cost (in the form of phone calls and transportation) and the cost of capital items such as hoes, cutlass and spraying machine was significant at 10%. Its coefficient shows that an increase in the use of other inputs by 1% will lead to 0.1% increase in maize output. These findings confirm those of (Gbigbi, 2011; Kibaara, 2005; Barnes, 2008). Productivity Analysis: For a production process within which all resources vary in the same proportion, the summation of the partial elasticity of production with regards to each input stands for returns to scale or total output elasticity (a measure of productivity). This was estimated to be 0.47 for maize production in the Eastern Region of Ghana implying a decreasing return to scale. That is, if the maize farmers in the region increase all resources by 1%, maize output also rise by 0.47%. This estimate is consistent with Gbigbi (2011) who also obtained a value of 0.86, but contrary to Essilfie et al. (2011) who obtained a value of 1.49 depicting increasing returns to scale. Technical Efficiency of Maize Farmers: The Technical Efficiency of Maize Farmers is presented Table 5. The predicted technical efficiencies vary greatly among the maize farmers in the region. The results reveal that 32.3% of the farmers have technical efficiency ranging from 21 to 40%, followed by 16.8% of them also getting efficiency range between 41 to 50%. Further, the results show that few of the farmers (19%) operated between 71 to 100% efficiency levels. Additionally, the results indicate that majority of farmers (about 55%) are producing maize on a lower level of efficiency while only 6.2% among them are either producing on the frontier or closely to the frontier. These results are consistent with Essilfie et al. (2011) who reveal that only 12.1% of maize farmers in the Central Region of Ghana have technical efficiency of above 0.8. The predicted mean technical efficiency of the farmers is 0.51 in the 2010 production year in the region. This indicates that the maize farmers in the study area produced 51% of the potential stochastic frontier output based on the present state of technology as well as the level of input. The implication is that the 49% of potential output is

94
not realized. Possibly, the adoption of the practice of the “best farm” will increase maize production in the region by an average of 49% to enable these maize farmers to attain the potential stochastic frontier output level. Technical Inefficiency Model Estimates: The positive coefficients of the Akuapen North, Kwahu North and Birem South districts bring to light that maize farmers in these districts are far less technically efficient compared to those maize farmers in Fanteakwa district and vice versa. This finding is consistent with that of Onoja et al., (2008) who ascribed variations among zones (in this case, the districts) to either the differences in farm management practices or heterogeneous nature of edaphic and climatic factors. Interestingly, the estimated coefficient for extension visit is positive. This leads to the implication that either extension agents did not offer enough productive advice to the farmers or the farmers are conservative and therefore did not imbibe and apply innovations of farm management practices taught them, and that increments of this sort of contacts will raise the farmers’ inefficiency in maize production. There is a disagreement between this finding and earlier studies such as Msuya et al., (2008) yet consistent with Chirwa (2007) and Essilfie et al., (2011). A surprising result worth noting is that of FBO membership has positive coefficient. This suggests that farmers who are members of farmer-based organizations are less technically efficient than their counterparts who are not members of any farmer based group in maize production. This occurrence may be as a result of members in their respective groups spending so much time in planning and bargaining for inputs acquisition from government and non-governmental institutions, higher producer prices and favourable market outlets at the expense of them learning enhanced agronomic practices during their meetings. The estimated coefficient for their frequency of meeting indicates that the one month interval for the farmers meeting ensures that issues raised and ideas shared in previous meetings are constantly fresh in the farmers’ minds. Applications of these ideas to their maize farming technology augment the efficiency at which they produce maize than their colleagues who due to the long intervals between their meetings forget ideas shared among them. The impact of training farmers formally on improved ways of cultivating maize is very paramount as shown by the 10% significant level of the coefficient estimate (Table 6). The coefficient estimate of -0.154 reveals that farmers who were taught scientific ways of cultivating maize from at least the Junior Secondary School level minimize their level of production inefficiency by 15.4%. This is because the formal training offers them the opportunity to search for and apply innovations in crop farming as well as increasing their technical know-how in maize cultivation among others. The least is the estimated coefficients for cash credit, in-kind credit and those farmers using both types of credit which are significant at 1% level respectively (see Table 6). These estimates imply that the famers who use cash credit, in-kind credit or both in maize production reduce their technical inefficiency levels by 42.9%, 70.1% and 60.5% respectively. These results are consistent with a number of research findings as follows: Ahmad et al., (2006) found that in-kind input credit in the form of fertilizer and seed increase crop output massively; Waqar et al., (2008) also revealed that institutional credit (cash credit), seed, fertilizers and irrigation significantly boost agricultural production; Olagunju (2007) showed that the farmers with credit are resourcefully efficient than their counterparts producing without credit; and Binam et al., (2004) revealed that access to credit permits a farmer to improve efficiency by overcoming liquidity constraints which may affect their ability to apply inputs and implement farm management decisions on time. Table 4: Maximum Likelihood Estimates for the parameters of the stochastic frontier model
Variable Parameters Coefficient Standard error t-value Constant β0 0.936*** 0.051 18.283
LnSeed β1 -0.0006 0.136 -0.005
LnFertilizer β2 -0.065 0.061 -1.073
LnAgrochemicals β3 0.309*** 0.028 10.901
LnOtherinputs β4 0.099* 0.055 1.807
LnFamilylabour β5 -0.009 0.039 -0.22
LnHiredlabour β6 0.143*** 0.018 7.826
0.5(Lnseed)2 β7 -0.300* 0.177 -1.695

95
0.5(Lnfertilizer)2 β8 -0.050* 0.028 -1.813
0.5(LnAgrochemicals)2 β9 0.292*** 0.041 7.111
0.5(LnOtherinputs)2 β10 -0.0513 0.0807 -0.635
0.5(LnFamilylabour)2 β11 -0.008 0.017 -0.469
0.5(LnHiredlabour)2 β12 0.048*** 0.012 4.039
LnSeed.LnFertilzer β13 -0.017 0.039 -0.425
LnSeed.LnAgrochemicals β14 -0.124 0.112 -1.11
LnSeed.lnOtherinputs β15 0.04 0.117 0.344
LnSeed.LnFamilylabour β16 -0.024 0.035 -0.675
LnSeed.LnHiredlabour β17 0.032 0.041 0.783
LnFertilizer.LnAgrochemicals β18 -0.013 0.013 -0.953
LnFertilizer.LnOtherinputs β19 -0.011 0.018 -0.61
LnFertilizer.LnFamilylabour β20 0.007 0.009 0.79
LnFertilizer.LnHiredlabour β21 0.012** 0.006 1.984
LnAgrochemicals.LnOtherinputs β22 0.111*** 0.035 3.212
LnAgrochemicals.LnFamilylabour β23 0.009 0.024 0.388
LnAgrochemicals.LnHiredlabour β24 -0.021 0.023 -0.913
LnOthercosts.LnFamilylabour β25 0.019 0.034 0.56
LnOThercosts.LnHiredlabour β26 0.013 0.015 0.516
LnFamilylabour.LnHiredlabour β27 -0.013 0.015 -0.819
Sigma-squared 2 0.134*** 0.00004 8.667
Gamma [ VAR(u)/VAR(Total)] γ 0.999*** 23563.393
Log-likelihood Value -56.11 (***, **, * are 1, 5 and 10% significant levels respectively). Table 5: Frequency Distribution of Technical Efficiency of the Maize Farmers Efficiency class Number of farmers Percentage 0-0.2 13 5.8
0.21-0.4 73 32.3 0.41-0.5 38 16.8 0.51-0.6 32 14.2 0.61-0.7 27 11.9 0.71-0.8 15 6.6 0.-0.981 14 6.2 0.9-1.0 14 6.2
Total 226 100.0
96
Table 6: Inefficiency Model Estimates
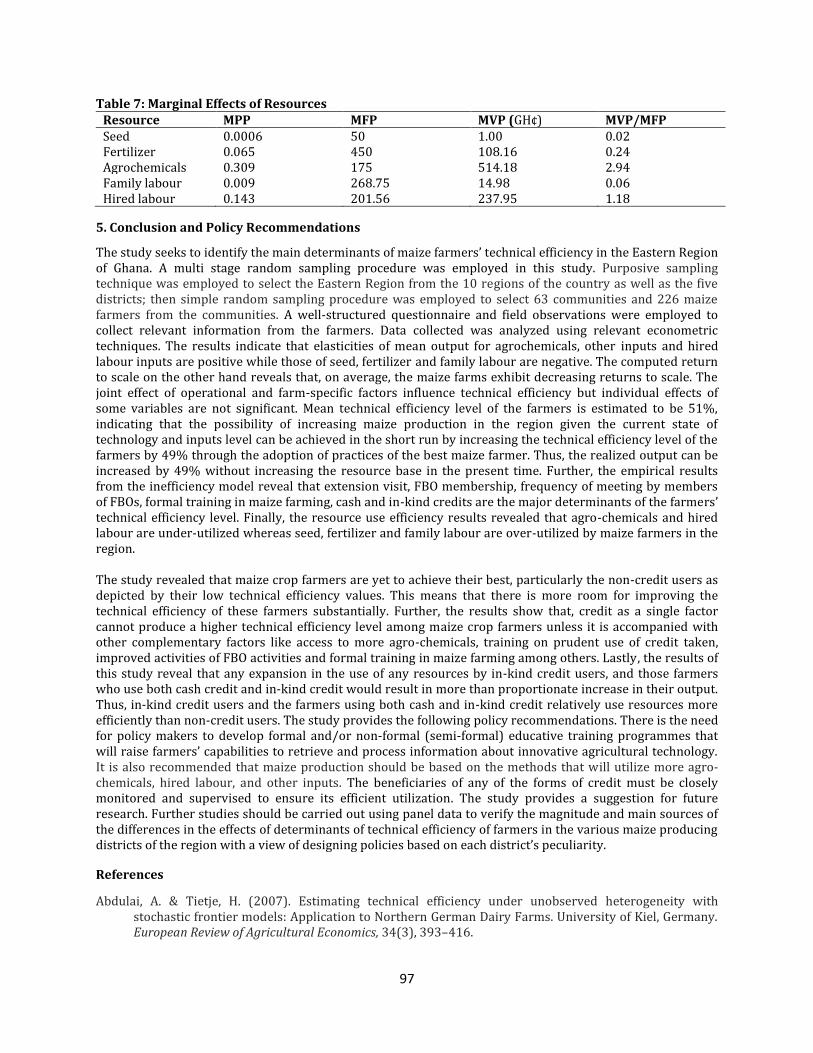
(***, **, * are 1, 5 and 10% significant levels respectively). Resource Use Efficiency in Maize Production: The Resource Use Efficiency Estimates are presented in Table 7 below. The results reveal that agro-chemicals and hired labour are under-utilized meaning that every 1 GH¢ spent on agro-chemicals and hired labour will increase the returns from maize by GH¢2.9 and GH¢1.18 respectively. It is observed that seed, fertilizer and family labour on the other hand are over-utilized as their efficiency ratios are less than one (1). The over-utilization of family labour means that there is surplus of family members who spend too much time in maize production. This unproductive situation could be experienced in places where there are few opportunities for income generating activities outside farming. Hired labour on the other hand, being under-utilized implies that the farmers cannot afford the high cost of obtaining it. The low income status of maize farmers in the country will make it difficult for them to employ the required number of skilled laborers such as farm managers and technicians, and unskilled laborers for their production. The over-usage of chemical fertilizers can lead to soil acidification as a result of a decrease in organic matter in the soil. Hence, crops are unable to extract enough cationic plant nutrients like calcium and phosphorus required for dry matter production. Moreover, the continuous use of chemical fertilizers on soil depletes the soil of essential nutrients. As a result, the maize produced in these soils possesses less vitamin and mineral content (Grant and Rongui, 2008). The over-utilization of seed in the region may be as a result of type of maize seed the farmers use for their production. The data collected shows that majority of the farmers use their local varieties which have low germination and yielding capabilities since they cannot afford the high price of improved seeds. Therefore, these farmers plant as many as 4 to 6 seeds per hill instead of the recommended 2 to 3 seeds per hill for improved varieties (Addo-Quaye et al., undated). This high seeding rate leads to overcrowding of the seedlings in their respective holes which in turn results in high competition among the growing plants for the same small amount of nutrients and water at their localized area. Thus, the amount of nutrients and water needed by the individual maize plants is reduced giving a resultant reduction in the expected yield of maize. Lastly, under-utilization of agro-chemicals means that the adverse impact of pesticides, insecticides, weedicides and fungicides among others on the soil is minimized to a level that allow the maize plants extract the required amounts of nutrient for their growth and ear formation. The ratio of MVP to MFC is also referred to as complete allocative efficiency (from economic theory) and occurs at the point where everyone cedi spent in getting an additional unit of a resource input into production adds exactly one cedi to the revenue. The results affirm the existing literature that show that farmers in developing countries cannot achieve perfect allocative efficiency because they consider food security goal and avoidance of production risks more important than profit maximization (Okorji, 1983; Awoke, 2002; Amaza and Gwari, 2000).
Variable Parameters Coefficient Standard error t-value
Constant Akuapem North Birem South Kwahu North Upper ManyaKrobo Farm Experience Educational level Extension Visit Household size Gender FBO Membership Off-maize farm work Formal training in maize farming Cash credit In-kind credit Cash and in-kind credit Frequency of meeting
Ө0 Ө1 Ө2 Ө3 Ө4 Ө5 Ө6 Ө7 Ө8 Ө9 Ө10 Ө11 Ө12 Ө13 Ө14 Ө15 Ө16
0.539*** 0.825*** 0.502** 0.603*** 0.185 0.004 -0.027 0.012* -0.013 -0.044 0.477*** -0.116 -0.154* -0.429*** -0.701*** -0.605*** -0.237*
0.107 0.153 0.182 0.102 0.191 0.005 0.045 0.007 0.014 0.091 0.109 0.127 0.094 0.126 0.137 0.125 0.131
5.021 5.401 2.762 5.887 0.968 0.869 -0.611 1.749 -0.889 -0.481 4.374 -0.916 -1.643 -3.410 -5.114 -4.828 -1.805
97
Table 7: Marginal Effects of Resources Resource MPP MFP MVP (GH¢) MVP/MFP Seed 0.0006 50 1.00 0.02 Fertilizer 0.065 450 108.16 0.24 Agrochemicals 0.309 175 514.18 2.94 Family labour 0.009 268.75 14.98 0.06 Hired labour 0.143 201.56 237.95 1.18
5. Conclusion and Policy Recommendations
The study seeks to identify the main determinants of maize farmers’ technical efficiency in the Eastern Region of Ghana. A multi stage random sampling procedure was employed in this study. Purposive sampling technique was employed to select the Eastern Region from the 10 regions of the country as well as the five districts; then simple random sampling procedure was employed to select 63 communities and 226 maize farmers from the communities. A well-structured questionnaire and field observations were employed to collect relevant information from the farmers. Data collected was analyzed using relevant econometric techniques. The results indicate that elasticities of mean output for agrochemicals, other inputs and hired labour inputs are positive while those of seed, fertilizer and family labour are negative. The computed return to scale on the other hand reveals that, on average, the maize farms exhibit decreasing returns to scale. The joint effect of operational and farm-specific factors influence technical efficiency but individual effects of some variables are not significant. Mean technical efficiency level of the farmers is estimated to be 51%, indicating that the possibility of increasing maize production in the region given the current state of technology and inputs level can be achieved in the short run by increasing the technical efficiency level of the farmers by 49% through the adoption of practices of the best maize farmer. Thus, the realized output can be increased by 49% without increasing the resource base in the present time. Further, the empirical results from the inefficiency model reveal that extension visit, FBO membership, frequency of meeting by members of FBOs, formal training in maize farming, cash and in-kind credits are the major determinants of the farmers’ technical efficiency level. Finally, the resource use efficiency results revealed that agro-chemicals and hired labour are under-utilized whereas seed, fertilizer and family labour are over-utilized by maize farmers in the region. The study revealed that maize crop farmers are yet to achieve their best, particularly the non-credit users as depicted by their low technical efficiency values. This means that there is more room for improving the technical efficiency of these farmers substantially. Further, the results show that, credit as a single factor cannot produce a higher technical efficiency level among maize crop farmers unless it is accompanied with other complementary factors like access to more agro-chemicals, training on prudent use of credit taken, improved activities of FBO activities and formal training in maize farming among others. Lastly, the results of this study reveal that any expansion in the use of any resources by in-kind credit users, and those farmers who use both cash credit and in-kind credit would result in more than proportionate increase in their output. Thus, in-kind credit users and the farmers using both cash and in-kind credit relatively use resources more efficiently than non-credit users. The study provides the following policy recommendations. There is the need for policy makers to develop formal and/or non-formal (semi-formal) educative training programmes that will raise farmers’ capabilities to retrieve and process information about innovative agricultural technology. It is also recommended that maize production should be based on the methods that will utilize more agro-chemicals, hired labour, and other inputs. The beneficiaries of any of the forms of credit must be closely monitored and supervised to ensure its efficient utilization. The study provides a suggestion for future research. Further studies should be carried out using panel data to verify the magnitude and main sources of the differences in the effects of determinants of technical efficiency of farmers in the various maize producing districts of the region with a view of designing policies based on each district’s peculiarity.
References
Abdulai, A. & Tietje, H. (2007). Estimating technical efficiency under unobserved heterogeneity with stochastic frontier models: Application to Northern German Dairy Farms. University of Kiel, Germany. European Review of Agricultural Economics, 34(3), 393–416.
98
Addo-Quaye, A. A., Saah, M. K., Tachie-Menson, C. K. B., Adam, I., Tetteh, J. P., Rockson-Akorly, V. K. & Kitson, J. K. (undated). General Agriculture for Senior High Secondary Schools. Bossah Company Ltd, Ghana, 173-178.
Afrait, S. N. (1972). Efficiency Estimation of Production Functions. International Economic Review, 13(3), 568-98.
Ahmad-Mohamed, M., Preckel, P. V. & Ehui, S. (2006). Modelling the Impact of credit on intensification in mixed crop-livestock systems: A Case study from Ethiopia. Poster Paper prepared for presentation at the International Association of Agricultural Economists (IAAE) Conference, Gold Coast, Australia.
Aigner, D. J. & Chu, S. (1968). Estimating the Industry Production Function. American Economic Review, (58), 826-839.
Aigner, D., Lovell, C. A. K. & Schmidt, P. (1977). Formulation and Estimation of Stochastic Frontier Production Function Models. Journal of Econometrics, 6(1977) 21-37.
Al-Hassan, R. M. & Diao, X. (2007). Reducing regional disparities in growth and poverty reduction in Ghana: Policy options and public investment implications. IFPRI discussion paper no. 693. Washington, DC: IFPRI.
Al-Hassan, R., Jatoe, J. D. B. & Awere, A. D. (2007). Productivity Impact of Improved Maize Varieties in the Eastern Region of Ghana. The IUP Journal of Agricultural Economics, 4(2), 7-22.
Amaza, P. S. & Gwari, D. M. (2000).The effect of Ecological change in farming Systems in Borno State. Journal of Arid Agriculture, 10, 125-129.
Amaza, P. S., Onu, J. I. & Okunmadewa, F. Y. (2001). Identification of factors that influence the technical efficiency of cotton farmers in Nigeria. Nigerian Agricultural Development Studies, 2(1), 133-145.
Awoke, M. U. (2002).Resource Use Efficiency in multiple cropping system by smallholder farmers in Ebonyi State in Nigeria. Ph. D Thesis, Department of Agricultural Economics and Extension, ESUT, Enugu.
Barnes, A. (2008). Technical Efficiency Estimates of Scottish Agriculture: A Note. Journal of Agricultural Economics, 59(2), 370–376.
Battese, G. E. & Coelli, T. J. (1995).A model for Technical Inefficiency Effects in Stochastic Frontier Production Function for Panel Data. Empirical Economics, 20, 325-332.
Binam, J. N., Tonye, J., Wandji N. & Akoa, M. (2004). Factors Affecting the Technical Efficiency among Smallholder Farmers in the Slash and Burn Agriculture Zone of Cameroon. Food Policy, 29, 531-545.
Carlson, B. (1968). The measurements of efficiency in production. An application to Swedish manufacturing industries. Swedish Journal of Economics, 74, 468–485.
Case, K. E., Fair, R. C. & Oster, S. M. (2009). Principles of Economics, 9th edition. Pearson Education Inc., Upper Saddle River, New Jersey.
Chirwa, E. W. (2007). Sources of Technical Efficiency among Smallholder Maize Farmers in Southern Malawi. AERC Research Paper, 172.
Coelli, T. J. (1995). Recent Developments in Frontier Modelling and Efficiency Measurement. Australian Journal of Agricultural Economics, 39(3), 219-24.
Coelli, T. J. & Perelman, S. (1996). A Comparison of Parametric and Non-Parametric Distance Functions: With Application to European Railways. CREPP Discussion Paper, University of Liege, Liege.
Essilfie F. L., Asiamah, M. T. & Nimoh, F. (2011). Estimation of farm level technical efficiency in small scale maize production in the Mfantseman Municipality in the Central Region of Ghana: A stochastic frontier approach. Journal of Development and Agricultural Economics, 3(14), 645-654.
Fare, R., Grosskopf, S. & Lovell, C. A. K. (1985).The Measurement of efficiency of production. Kluwer-Nijhoff Publishing, Boston.
Farrell, M. J. (1957). The measurement of productive efficiency. Journal of the Royal Statistic Society, 120, 253–281.
Gbigbi, M. T. (2011). Economic Efficiency of Smallholder Sweet Potato Producers in Delta State, Nigeria: A Case Study of Ughelli South Local Government Area. Department of Agricultural Services, Ministry of Agriculture and Natural Resources, Asaba, Delta State, Nigeria.
Ghana Statistical Service. (2012). National Accounts and Economic Indicators Division Accra, Ghana. Grant, C. & Ronggui, W. (2008). Enhanced-efficiency fertilizers for use on the Canadian Prairies. Crop
Management, 10, 1094. Greene, W. M. (1980). Maximum Likelihood Estimation of Econometric Frontier Functions. Journal of
Econometrics, 13(1), 27-56.

99
Hallam, D. & Machado, F. (1995). Efficiency analysis with panel data: A study of Portuguese Dairy Farms. European Review of Agricultural Economics, 23, 79–93.
Jondrow, J., Lovell, C. A., Materov, V. & Smith, P. (1982). On the Estimation of Technical Efficiency in the Stochastic Frontier Production Function Model. Journal of Econometrics, 19(3), 233-238.
Kibaara, B. W. (2005). Technical Efficiency in Kenya’s Maize Production: An Application of the Stochastic Frontier Approach. Master’s Thesis, Colorado State University, USA.
Kolawole, O. (2010), A Comparative Analysis of Technical and Input-Specific Allocative Efficiencies of Aquaculture Farms in South Western Nigeria, Agriltura Tropica Et Subtropica, 171-175.
Kumbhakar, S. C. & Lovell, C. A. K. (2000). Stochastic Frontier Analysis. Cambridge University Press, Cambridge, UK. 42-130.
Kwarteng, J. A. & Towler, M. J. (1995). West African Agriculture: A textbook for Schools and Colleges. Maccmillan Ltd, London, 95-104.
Lee, L. F. & Tyler, W.G. (1978). The stochastic production function and average efficiency: An empirical analysis. Journal of Econometrics, 7, 385–89.
Meeusen, W. & Van den Broeck J. (1977). Efficiency estimation from Cobb- Douglas production functions with composed error. International Economic Review, 18, 435–444.
Ministry of Food and Agriculture. (2006). Statistics, Research and Information Directorate (SRID). Accra, Ghana.
Ministry of Food and Agriculture. (2009). Statistics, Research and Information Directorate (SRID). Accra, Ghana.
Ministry of Food and Agriculture. (2010). Statistics, Research and Information Directorate (SRID). Accra, Ghana.
Msuya, E., Hisano, S. & Nariu, T. (2008). Explaining Productivity Variation among Smallholder Maize Farmers in Tanzania. Graduate School of Economics, Faculty of Economics, Kyoto University, Japan Elibariki.
Ogundari, K. & Ojo, S. O. (2007). Economic Efficiency of small scale food crop production in Nigeria: A stochastic frontier approach. Journal of Social Sciences (JSS), 14(2), 123-130.
Okorji, E. C. (1983). Consequences on Agricultural Productivity of crops stereotyping along sex line. A case study of four villages inAbakaliki Area of Ebonyi State. M.Sc. Thesis, Department of Agricultural Economics, University of Nigeria, Nsuka.
Olagunju F. I. (2007). Impact of Credit Use on Resource Productivity of Sweet Potatoes Farmers in Osun-State, Nigeria.Department of Agricultural Economics and Extension, LadokeAkintola University of Technology, Nigeria.
Olayide, S. O. & Heady, E. O. (1982). Introduction to agricultural production economics. Ibadan University Press, Ibadan.
Onoja, A., Ibrahim, M. K. & Achike, A. I. (2008). Econometric Analysis of Credit and Farm Resource Technical Efficiencies’ Determinants in Cassava Farms in Kogi State, Nigeria: A Diagnostic and Stochastic Frontier Approach. Dept. of Agricultural Economics and Extension, Kogi State University, Anyigba, Nigeria.
Onumah, E. E., Brummer, B. & Horstgen-Schwark, G. (2010). Elements Which Delimitate Technical Efficiency of Fish Farms in Ghana. Department of Agricultural Economics and Rural Development, Georg-August University, Platz der G¨ottingerSieben 5, D-37073 G¨ottingen, Germany.
Page, J. M. (1980). Technical efficiency and economic performance: Some evidence from Ghana. Oxford Economic Papers, 32, 319–39.
Richmond, J. (1974). Estimating Efficiency of Production. International Economic Review, 15(2), 515-21. Schmidt, P. (1976). On the Statistical Estimation of Parametric Frontier Production Functions. Review of
Economics and Statistics, 58(2), 238-29. Stevenson, R. E. (1980). Likelihood functions for generalized stochastic frontier estimation. Journal of
Econometrics, 13, 57–66. Tchale, H. & Sauer, J. (2007). The efficiency of maize farming in Malawi: A bootstrapped translog frontier.
Cahiers d’économieetsociologierurales, n°82-83. WABS Consulting Ltd. (2008). Maize Value Chain Study in Ghana: Enhancing Efficiency and Competitiveness.
Draft Report, Accra, Ghana. Waqar, A., Zakir, H., Hazoor, M. S. & Ijaz, H. (2008).The impact of Agricultural Credit on growth and poverty in
Pakistan (Time Series Analysis through Error Correction Model). European Journal of Scientific Research, 23(2), 243-251.
Winsten, C. (1957). Discussion on Farrell’s Paper. Journal of Royal Statistical Society, 120, 282–284.