Embed Size (px)
Citation preview

1
(c) 2007-10 T. F. Collura, Ph.D.
Technical Foundations of
Quantitative EEG (QEEG) for
Neurofeedback Practitioners
Thomas F. Collura, Ph.D, QEEG-T
BrainMaster Technologies, Inc.
January, 2010
(c) 2007-10 T. F. Collura, Ph.D.
EEG
Electroencephalography (EEG) is a technique by which the
brain’s electrical activity is recorded by the use of sensors
placed on the scalp, and sensitive amplifiers. The EEG was
first recorded by the German psychiatrist Hans Berger in 1932,
and has become an accepted clinical tool for neurologists and
psychiatrists. Generally, EEG is analyzed by visually
inspecting the waveforms, often using a variety of montages.
Neurologists are able to identify abnormalities including
epilepsy, head injuries, stroke, and other disease conditions
using the EEG. A clinical EEG practitioner in the medical
profession must be a neurologist or psychiatrist, and complete
an additional 2 year residency and board certification, to be
eligible to read and interpret conventional EEG’s

2
(c) 2007-10 T. F. Collura, Ph.D.
Neurofeedback
Neurofeedback is a form of biofeedback training that uses the
EEG (Electroencephalogram), also known as the “brain wave”
as the signal used to control feedback. Sensors applied to the
trainee’s scalp record the brainwaves, which are converted into
feedback signals by a human/machine interface using a
computer and software. By using visual, sound, or tactile
feedback to produce learning in the brain, it can be used to
induce brain relaxation through increasing alpha waves. A
variety of additional benefits, derived from the improved ability
of the CNS (central nervous system) to modulate the
concentration/relaxation cycle and brain connectivity, may also
be obtained.
(c) 2007-10 T. F. Collura, Ph.D.
Quantitative EEG (QEEG)
Quantitative EEG (QEEG) is a technique in which EEG recordings are computer analyzed to produce metrics (e.g. amplitude or power, ratios, coherence, phase, etc) used to guide decision-making and theraputic planning. QEEG can also be used to monitor and assess treatment progress. QEEG data typically consist of raw numbers, z-scores, and/or topographic or connectivity maps. QEEG systems currently lack strong standardization, and a wide range of methods and achievable results exist in the field. Although QEEG uses computer software to produce results, an understanding of basic EEG, and the ability to read and understand raw EEG waveforms, is required in order to competently practice QEEG. Generally, a specialist (e.g. a board certified MD, PhD, QEEG-T or QEEG-D) is consulted to read and interpret QEEG data and produce reports and treatment recommendations, unless the practitioner has appropriate experience and credentials.

3
(c) 2007-10 T. F. Collura, Ph.D.
Outline
• Electrophysiology
• Instrumentation
• Computerization
• Signal Processing
• User Interfacing
• System Overview
(c) 2007-10 T. F. Collura, Ph.D.
First Human EEG Studies - 1924
4
(c) 2007-10 T. F. Collura, Ph.D.
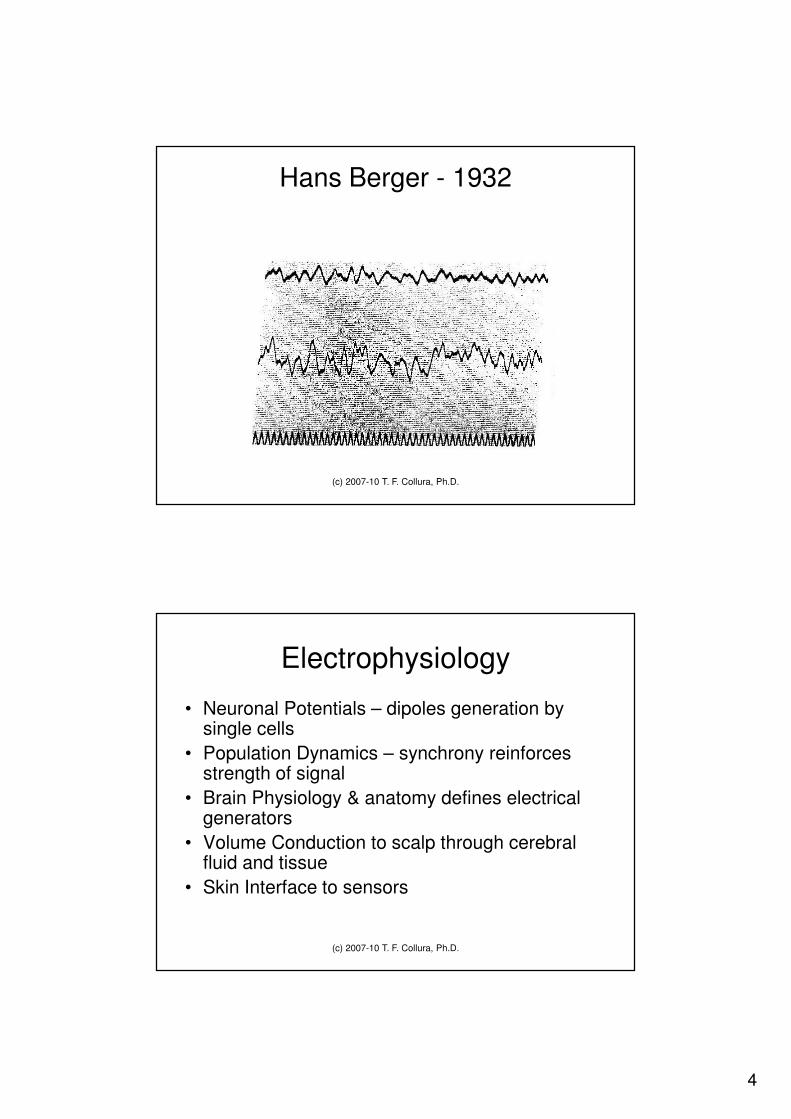
Hans Berger - 1932
(c) 2007-10 T. F. Collura, Ph.D.
Electrophysiology
• Neuronal Potentials – dipoles generation by single cells
• Population Dynamics – synchrony reinforces strength of signal
• Brain Physiology & anatomy defines electrical generators
• Volume Conduction to scalp through cerebral fluid and tissue
• Skin Interface to sensors

5
(c) 2007-10 T. F. Collura, Ph.D.
Realistic Head Dipole Source
(c) 2007-10 T. F. Collura, Ph.D.
Dipoles - summary
• All brain dipoles have:
– Location – can “move”
– Magnitude – can oscillate and vary in size
– Orientation – can change as sources move among sulci and gyri
• It is the population behavior that is “seen” in the EEG

6
(c) 2007-10 T. F. Collura, Ph.D.
EEG Generation Mechanisms
• Primary mechanism of brain is inhibition
• Rhythms generated when inhibition is relaxed
• Allows thalamocortical reverberation
• Relaxation at cortical level, and at thalamic level
• Allows populations to oscillate in synchrony
(c) 2007-10 T. F. Collura, Ph.D.
Sensor Issues
• Sensor Type – gold, silver, silver-chloride,
tin, etc.
• Sensor location – at least one sensor
placed on scalp
• Sensor attachment – requires electrolyte
paste, gel, or solution
• Maintain an electrically secure connection

7
(c) 2007-10 T. F. Collura, Ph.D.
Sensor Types
• Disposable (gel-less and pre-gelled)
• Reusable disc sensors (gold or silver)
• Reusable sensor assemblies
• Headbands, hats, etc.
• Saline based electrodes – sodium chloride
or potassium chloride
(c) 2007-10 T. F. Collura, Ph.D.
EEG Instrumentation
• Sensors pick up skin potential
• Amplifiers create difference signal from
each pair of sensors
• Cannot measure “one” sensor, only pair
• 3 leads per channel – active, reference,
grnd
• Each channel yields a signal consisting of
microvolts varying in time

8
(c) 2007-10 T. F. Collura, Ph.D.
Cortical EEG Sources
(c) 2007-10 T. F. Collura, Ph.D.
Cortical Layers

9
(c) 2007-10 T. F. Collura, Ph.D.
EEG Current Flow
(c) 2007-10 T. F. Collura, Ph.D.
Effect of EEG “blurring”

10
(c) 2007-10 T. F. Collura, Ph.D.
EEG Electrophysiology
• “Forward problem” – given sources and
anatomy, predict surface potentials
– Solved & deterministic – 1 solution exists for any set of sources and anatomy
• “Inverse problem” given surface potentials,
find sources and anatomy
– Non-deterministic - many solutions exist for any surface potential distribution
(c) 2007-10 T. F. Collura, Ph.D.
EEG Amplification
• Picks up difference between active & reference via. subtraction
• CMRR – common-mode rejection ratio measures quality of subtraction
• High CMRR rejects 60 Hz, other common-mode signals, amplifies difference
• Sensor pair picks up dipoles near sensors, between sensors, and parallel to sensor

11
(c) 2007-10 T. F. Collura, Ph.D.
Model for Differential Amplifier
(c) 2007-10 T. F. Collura, Ph.D.
Model for Differential Amplifier & EEG Generators
12
(c) 2007-10 T. F. Collura, Ph.D.
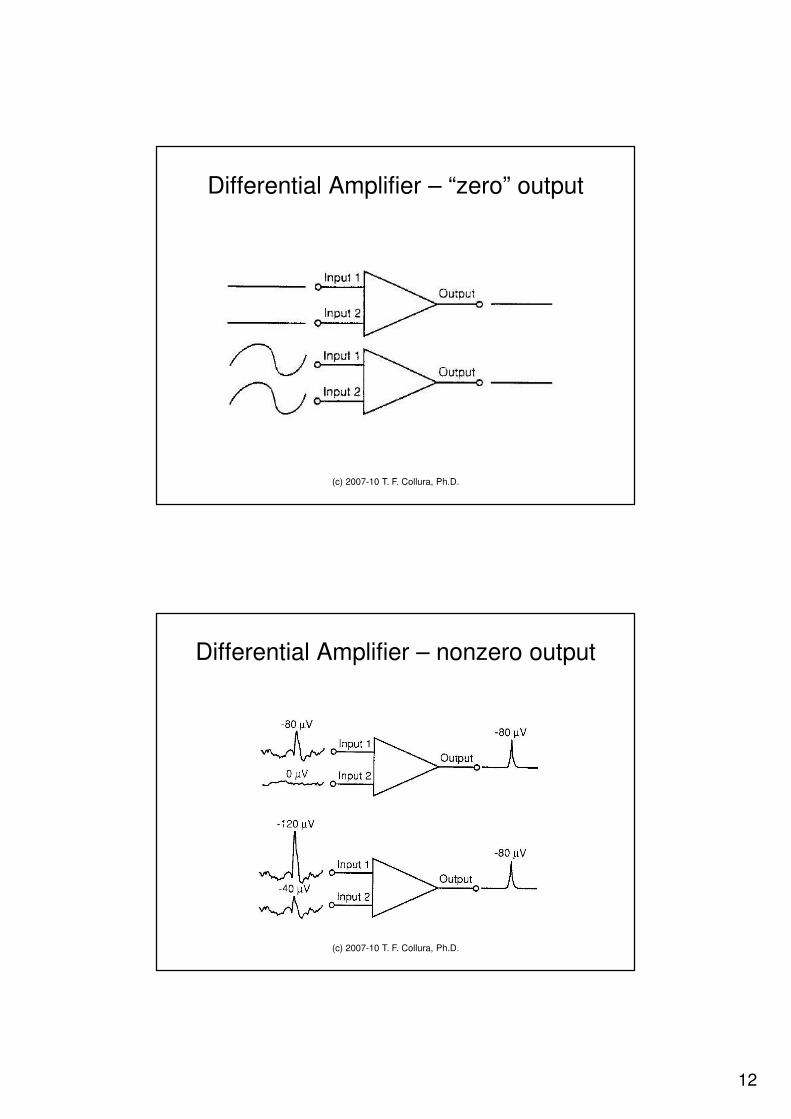
Differential Amplifier – “zero” output
(c) 2007-10 T. F. Collura, Ph.D.
Differential Amplifier – nonzero output

13
(c) 2007-10 T. F. Collura, Ph.D.
Sample EEG Computation
(c) 2007-10 T. F. Collura, Ph.D.
Effect of Reference Placement

14
(c) 2007-10 T. F. Collura, Ph.D.
Scalp EEG vs. Invasive EEG (1 cm spacing)
(c) 2007-10 T. F. Collura, Ph.D.
General Rule
• For a typical sensor location:
• 50% of the recorded EEG energy is from
“beneath” the site
• 50% of the recorded EEG energy is from
neighboring sites
• Simply due to volume conduction
(“smearing”)

15
(c) 2007-10 T. F. Collura, Ph.D.
Paradoxical Lateralization
(c) 2007-10 T. F. Collura, Ph.D.
Oblique EEG Generators

16
(c) 2007-10 T. F. Collura, Ph.D.
Dipole Sensing
• Sensor pair with differential amplifier picks
up:
– Sources near either sensor
– Sources between both sensors
– Sources aligned parallel to sensor axis
(c) 2007-10 T. F. Collura, Ph.D.
Ipsilateral Reference

17
(c) 2007-10 T. F. Collura, Ph.D.
Contralateral Reference
(c) 2007-10 T. F. Collura, Ph.D.
Linked Ears Reference
18
(c) 2007-10 T. F. Collura, Ph.D.
QEEG References
• QEEG Generally acquired referenced to Linked Ears
(LE)
• Preferred – acquire to a single reference and reformat in
software
• Discovery 24E acquires referenced to A1
• Discovery SW reformats to LE = (A2 + A1) / 2
• OR: can physically tie A1 and A2 together to avoid EKG
artifact.
(c) 2007-10 T. F. Collura, Ph.D.
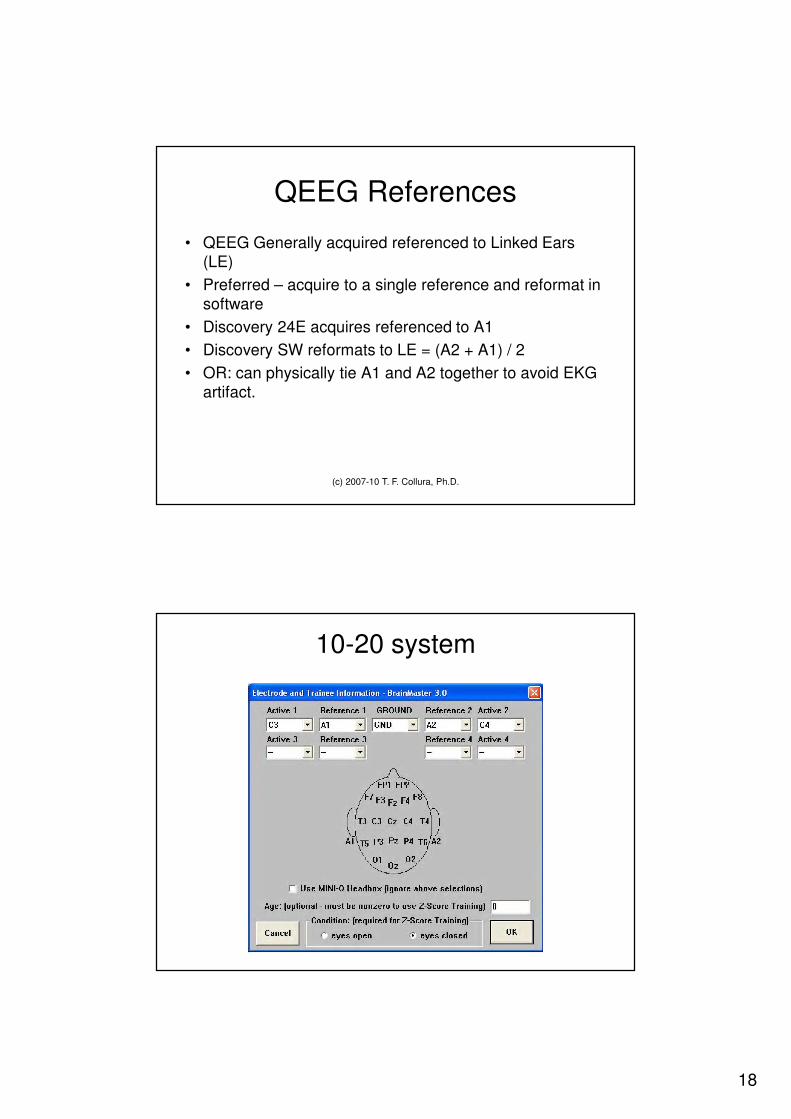
10-20 system

19
(c) 2007-10 T. F. Collura, Ph.D.
Engineering Diagram of the Brain
From interstitiality.net
(c) 2007-10 T. F. Collura, Ph.D.
EEG montages
• Referential – e.g. ear reference
• Reference is assumed inactive
• Linked ears commonly used as reference
• Bipolar – e.g. T3 active T4 reference
• Measures difference between two sites
• Laplacian – uses neighbors as reference
• Average – uses all others as reference

20
(c) 2007-10 T. F. Collura, Ph.D.
Thalamo-Cortical Cycles
(c) 2007-10 T. F. Collura, Ph.D.
Concentration/Relaxation Cycle
• Discovered by Dr. Barry Sterman in pilots
• “good” pilots preceded each task item with high-frequency, low-amplitude EEG
• Also followed task item with low-frequency, high-amplitude EEG (“PRS”)
• Poorer pilots did not exhibit control of the concentration/relaxation cycle
• Slower reaction time, more fatigue

21
(c) 2007-10 T. F. Collura, Ph.D.
Concentration/Relaxation Cycle
(c) 2007-10 T. F. Collura, Ph.D.
Connectivity(coherence & phase)
• Coherence: Amount of shared information
• Phase: Speed of shared information
• Thalamocortical
– Theta, Alpha, SMR
• Corticortical
– Beta, Gamma
• Intrahemispheric – e.g. language
• Interhemispheric
• Fronto-frontal – attention, control
• occipito-parietal – sensory integration, aging
(c) 2008 Thomas F. Collura, Ph.D.

22
(c) 2007-10 T. F. Collura, Ph.D.
EEG Analysis Methods
• Digital Filtering (“IIR” or “FIR”)
– Fast response, uses predefined bands
– Like using a colored lens
– Fast, useful for training or assessment
• Fast Fourier Transform (“FFT”)
– Analyzes all frequencies in an “epoch”
– Like a prism
– Response is slower, useful for assessment
(c) 2007-10 T. F. Collura, Ph.D.
Typical EEG Component Bands
• Delta (1 – 4 Hz)
• Theta (4 – 7 Hz)
• Alpha (8 – 12 Hz)
• Low Beta (12 – 15 Hz)
• Beta (15 – 20 Hz)
• High Beta (20 – 30 Hz)
• Gamma (40 Hz and above)
• Ranges are typical, not definitive

23
(c) 2007-10 T. F. Collura, Ph.D.
Typical EEG metrics
• Amplitude (microvolts)
• Frequency (Hz, peak or modal)
• Percent energy
• Variability
• Coherence between 2 channels (percent)
• Phase between 2 channels (degrees or percent)
• Asymmetry between 2 channels (ratio or percent)
(c) 2007-10 T. F. Collura, Ph.D.
Concepts of z scores
• Measure a large population
• Determine population statistics
• Mean
• Standard deviation
• Convert any single measurement into a z
score
• Standard measure of “how normal”

24
(c) 2007-10 T. F. Collura, Ph.D.(c) 2008 Thomas F. Collura, Ph.D.
Normal Distributionmales vs. females
Photo by Gregory S. Pryor, Francis Marion University, Florence, SC.
From: (C. Starr and R. Taggart. 2003. The Unity and Diversity of Life. 10th Ed. Page 189.)
(c) 2007-10 T. F. Collura, Ph.D.
Normal Distribution

25
(c) 2007-10 T. F. Collura, Ph.D.
What is a z score
• A metric based on any measurement and the associated population statistics
• Tells “how many standard deviations away from the mean”
• Defined as:
stdev
meantmeasuremenzscore
−
=
(c) 2007-10 T. F. Collura, Ph.D.
Live versus Static z scores
• LZ-scores measure instantaneous deviation
• LZ-scores typically smaller in magnitude
• Sustained LZ-score results in larger static Z-score
• “Score on a hole” versus “Score for the game”
• No standard to convert between
• Typical target is 0 for either

26
(c) 2007-10 T. F. Collura, Ph.D.
Z score ranges
• +/- 1 sigma:
– Includes middle 68% of population
– From 16% to 84% points
• +/- 2 sigma:
– Includes middle 95% of population
– From 2% to 98% points
• +/- 3 sigma:
– Includes middle 99.8% of population
– From .1% to 99.9% points
• +/- 4 sigma:– Suggests a different population
(c) 2007-10 T. F. Collura, Ph.D.
Z score exampleAdult height
• Mean height = 6 feet
• Standard deviation = 3 inches = .25 ft.
• Height 6 feet 6 inches
– Compute Z = 6.5 – 6.0 / .25 = 2.0
• Height 5 feet 9 inches
– Compute Z = 5.75 – 6.0 / .25 = -1.0
• Height 5 feet
– Compute z = 5.0 – 6.0 / .25 = -4.0

27
(c) 2007-10 T. F. Collura, Ph.D.
Z scores used for EEG
• Absolute power
• Relative power
• Power ratios
• Asymmetry
• Coherence
• Phase
(c) 2007-10 T. F. Collura, Ph.D.
Component bands in NeuroGuide (and ANI Z DLL)
• Delta (1 - 4 Hz)
• Theta (4 - 8 Hz)
• Alpha (8 – 12.5 Hz)
• Beta (12.5 – 25.5 Hz)
• Beta1 (12.0 – 15.5 Hz)
• Beta2 (15.0 – 18.0 Hz)
• Beta3 (18.0 – 25.5 Hz)
• Gamma (25.5 – 30.5 Hz)

28
(c) 2007-10 T. F. Collura, Ph.D.
Phenotypes and Live Z-Scores• Most Phenotypes “map” to live z-scores
– Diffuse Slow
– Focal Abnormalities, not epileptiform
– Mixed Fast & Slow
– Frontal Lobe Disturbances – excess slow
– Frontal Asymmetries
– Excess Temporal Lobe Alpha
– Spindling Excessive Beta
– Generally Low Magnitudes
– Persistent Alpha
– + Diffuse Alpha deficit
• Exceptions:– “Epileptiform” (requires visual inspection of EEG waveforms)
– Faster Alpha Variants, not Low Voltage (requires live z-score for peak frequency)
• Many phenotypes can be addressed via. LZT Training– Inhibits, rewards referenced to normal population or biased for enhance/inhibit
• Phenotypes do not (currently) consider connectivity deviations– Hypocoherent Intrahemispheric (L or R)
– Hypercoherent Interhemispheric (e.g. frontal)
– Diffuse Coherence / Phase Abnormalities
(c) 2008 Thomas F. Collura, Ph.D.
(c) 2007-10 T. F. Collura, Ph.D.
Live Z Scores – 2 channels (76 targets)
26 x 2 + 24 = 76 (52 power, 24 connectivity)

29
(c) 2007-10 T. F. Collura, Ph.D.
Z scores – 4 channels
• For each site ( 4 sites)
– 8 absolute power
– 8 relative power
– 10 power ratios
• For the connection (6 pathways)
– 8 asymmetry
– 8 coherence
– 8 phase
(c) 2007-10 T. F. Collura, Ph.D.
Live Z Scores – 4 channels (248 targets)
26 x 4 + 24 x 6 = 248 (104 power, 144 connectivity)

30
(c) 2007-10 T. F. Collura, Ph.D.
Z-Score Targeting Options
• Train Z Score(s) up or down– Simple directional training
• Train Z Score(s) using Rng()– Set size and location of target(s)
• Train Z Score(s) using PercentZOK()– Set Width of Z Window via. PercentZOK(range)
– Set Percent Floor as a threshold
• Combine the above with other, e.g. power training
(c) 2007-10 T. F. Collura, Ph.D.
Z-score Coherence Range Training(feedback when Z-score is in desired range)

31
(c) 2007-10 T. F. Collura, Ph.D.
Range Function
• Rng(VAR, RANGE, CENTER)
• = 1 if VAR is within RANGE of CENTER
• = 0 else
• Rng(BCOH, 10, 30)
– 1 if Beta coherence is within +/-10 of 30
• Rng(ZCOB, 2, 0)
– 1 if Beta coherence z score is within +/-2 of 0
(c) 2007-10 T. F. Collura, Ph.D.
Range training with multiple ranges
• X = Rng(ZCOD, 2,0) + Rng(ZCOT, 2, 0), +
Rng(ZCOA, 2, 0) + Rng(ZCOB, 2, 0)• = 0 if no coherences are in range
• = 1 if 1 coherence is in range
• = 2 if 2 coherences are in range
• = 3 if 3 coherences are in range
• = 4 if all 4 coherences are in range
• Creates new training variable, target = 4

32
(c) 2007-10 T. F. Collura, Ph.D.
Coherence ranges training with Z Scores
(4 coherences in range)
(c) 2007-10 T. F. Collura, Ph.D.
Combined Amplitude and Coherence-based protocol
If (point awarded for amplitudes) AND (coherence is normal) THEN (play video for 1 second)

33
(c) 2007-10 T. F. Collura, Ph.D.
PercentZOK() function
• PercentZOK(RANGE)
– Gives percent of Z Scores within RANGE of 0
– 1 channel: 26 Z Scores total
– 2 channels: 76 Z Scores total
– 4 channels: 248 Z Scores total
• Value = 0 to 100
• Measure of “How Normal?”
• All targets have a specified size “bulls-eye”
(c) 2007-10 T. F. Collura, Ph.D.
Z Score “percent” Targeting Strategy
• Feedback contingency based upon:
– Size of target bulls-eyes (“range”)
– Number of targets required (‘target percent hits”)
– Possibility of biasing targets up or down
– Targets may be enhances and/or inhibits
• Wide targets will automatically select most deviant scores
• Training automatically combines and/or alternates between amplitude & connectivity

34
(c) 2007-10 T. F. Collura, Ph.D.(c) 2008 Thomas F. Collura, Ph.D.
Z Score training using Multivariate Proportional (MVP) Feedback
Size of range window (UTHR - currently 1.4 standard deviations)
Threshold % for Reward (CT: between 70% and 80%)
%Z Scores in range (between 50 and 90%)
% Time criterion is met (between 30% and 40%)
(c) 2007-10 T. F. Collura, Ph.D.
Effect of changing %Z thresholdReduce threshold -> percent time meeting criteria increases

35
(c) 2007-10 T. F. Collura, Ph.D.
Effect of widening Z target windowWiden window -> higher % achievable, selects most deviant scores
(c) 2007-10 T. F. Collura, Ph.D.
Z-score based targeting
• Threshold replaced with target size
• Feedback contingency determined by target size and % hits required
• Eliminates need for “autothresholding”
• Integrates QEEG analysis with training in real time
• Protocol automatically and dynamically adapts to what is most needed
• Consistent with established QEEG-based procedures with demonstrated efficacy

36
(c) 2007-10 T. F. Collura, Ph.D.
Progress of Live Z-Score Training
(c) 2008 Thomas F. Collura, Ph.D.
(c) 2007-10 T. F. Collura, Ph.D.
Progress of MVP Variable
(c) 2008 Thomas F. Collura, Ph.D.

37
(c) 2007-10 T. F. Collura, Ph.D.
Live Z-Score Selection
(c) 2008 Thomas F. Collura, Ph.D.
(c) 2007-10 T. F. Collura, Ph.D.
Live Z-Score Training Policy
• EEG deviation(s) should be consistent
with clinical presentation(s)
• EEG normalization should be reasonable
• Consider coping, compensatory traits
• Consider “peak performance” traits
• Consider phenotypes & recommendations
• Monitor subjective and clinical changes
(c) 2008 Thomas F. Collura, Ph.D.

38
(c) 2007-10 T. F. Collura, Ph.D.
Typical QEEG Sequence
• Perform intake assessment
• Record EEG– Eyes open
– Eyes closed
– Task, etc
• (Can send to consultant at this point)
• Review and Artifact EEG
• Perform Computations
• Review maps, z-scores, etc
• Make report and recommendations
(c) 2007-10 T. F. Collura, Ph.D.
QEEG Basics
• Check equipment and supplies
• Apply sensors (generally a cap)
• Check sensor & EEG quality
• Record EEG
• Check files on PC
• Check quality of EEG Recording
• Send files off or perform QEEG Analysis

39
(c) 2007-10 T. F. Collura, Ph.D.
QEEG - Advanced Topics
• Topographic Maps
• Normative Databases
• Phenotypes, other approaches
• Advanced Computations – connectivity, etc.
• Loreta (Low Resolution Electrical Tomographic Analysis)
• QEEG guided (conventional) Neurofeedback
• Live Z-score training,etc.
• Evoked Potentials
• DC / Slow Cortical Potentials
(c) 2007-10 T. F. Collura, Ph.D.
Typical EEG (EC)

40
(c) 2007-10 T. F. Collura, Ph.D.
What is different?
(c) 2007-10 T. F. Collura, Ph.D.
Typical EEG (LE Reference)

41
(c) 2007-10 T. F. Collura, Ph.D.
Muscle (EMG) Artifact
(c) 2007-10 T. F. Collura, Ph.D.
Eye Artifact

42
(c) 2007-10 T. F. Collura, Ph.D.
Good Sample or Bad Sample?
(c) 2007-10 T. F. Collura, Ph.D.
Good Sample or Bad Sample?
43
(c) 2007-10 T. F. Collura, Ph.D.
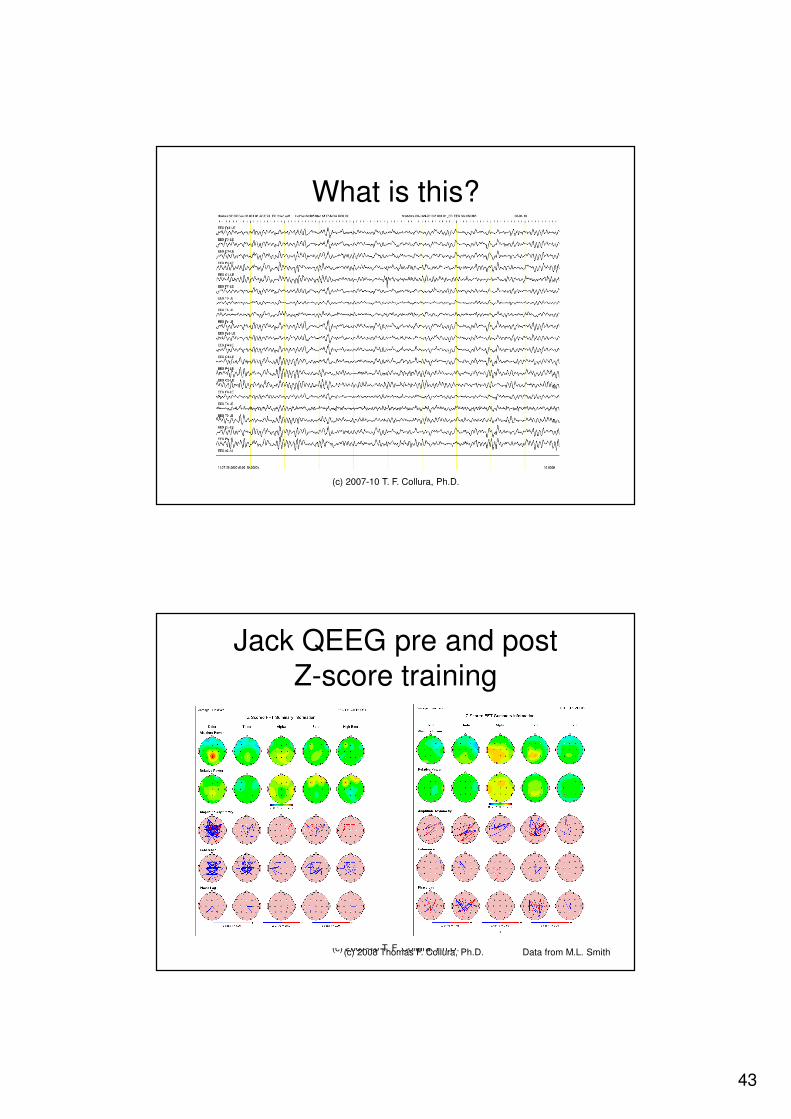
What is this?
(c) 2007-10 T. F. Collura, Ph.D.
Jack QEEG pre and post
Z-score training
(c) 2008 Thomas F. Collura, Ph.D. Data from M.L. Smith

44
(c) 2007-10 T. F. Collura, Ph.D.
SL - EO Pre and Post
(c) 2007-10 T. F. Collura, Ph.D.
SL - EO Loreta Pre and Post
45
(c) 2007-10 T. F. Collura, Ph.D.
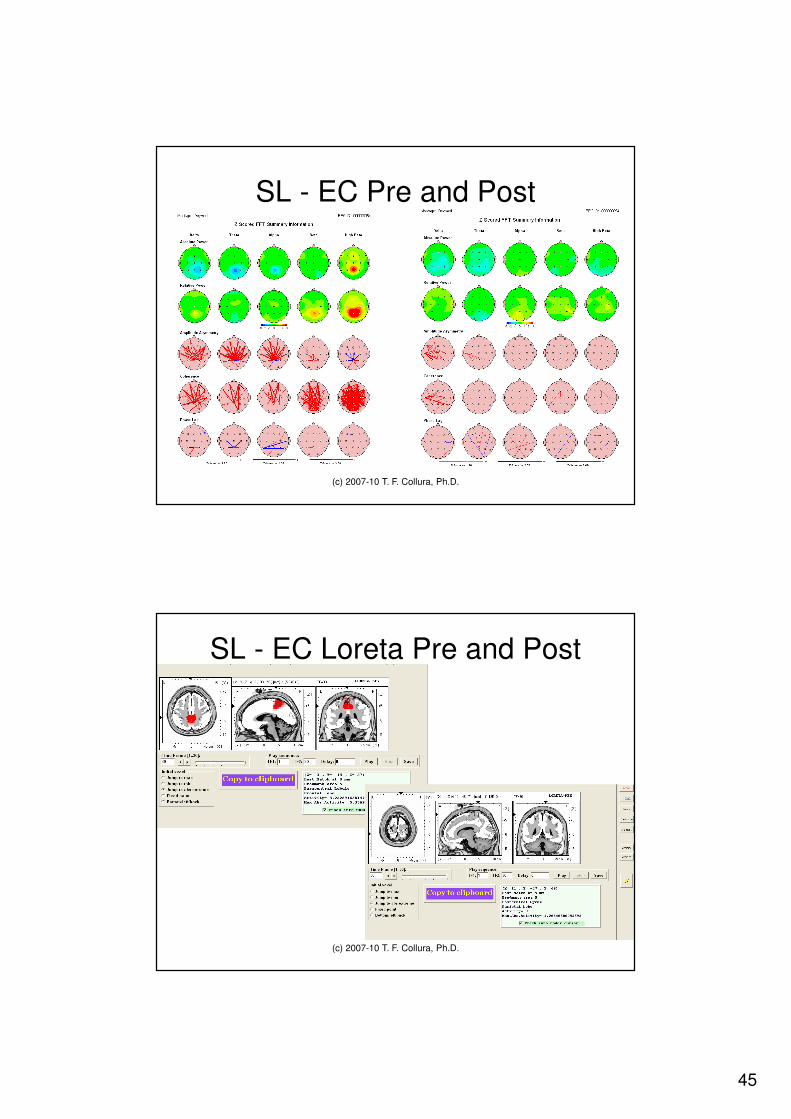
SL - EC Pre and Post
(c) 2007-10 T. F. Collura, Ph.D.
SL - EC Loreta Pre and Post

46
(c) 2007-10 T. F. Collura, Ph.D.
Summary
• New methods using standard EEG data + computer
• Comprehensive whole-head approach
• Analyzes both activation & connectivity
• Consistent with Conventional EEG
• Other e.g. Phenotype approaches
• Provides practitioner with complex information
• Useful for assessment & treatment planning
(c) 2007-10 T. F. Collura, Ph.D.
References
• Thatcher, R.W., Walker, R.A. and Guidice, S. Human cerebral hemispheres develop at different rates and ages. Science, 236: 1110-1113, 1987. (This was our first publication with N = 577).
• Thatcher, R.W. EEG normative databases and EEG biofeedback. Journal of Neurotherapy, 2(4): 8-39, 1998. (N = 577 with many details).
• Thatcher, R.W. EEG database guided neurotherapy. In: J.R. Evans and A. Abarbanel Editors, Introduction to Quantitative EEG and Neurofeedback, Academic Press, San Diego, 1999. (N = 577 with many details).
• Thatcher, R.W., Walker, R.A., Biver, C., North, D., Curtin, R., Quantitative EEG Normative databases: Validation and Clinical Correlation, J. Neurotherapy, 7 (No. ¾): 87 - 122, 2003. (61 adult subjects were added so that the N = 625. This is the number currently in use in the database).
• POSITION PAPER Standards for the Use of Quantitative Electroencephalography (QEEG) in Neurofeedback: A Position Paper of the International Society for Neuronal RegulationJournal of Neurotherapy vol. 8 no. 1 p. 5-27 2004 Contributors: D. Corydon Hammond PhD, Professor, Physical Medicine and Rehabilitation, University of Utah, School of Medicine, Salt Lake City, UT Jonathan Walker MD, Clinical Professor of Neurology, Texas Southwestern Medical School, Dallas, TX Daniel Hoffman MD, Medical Director and Neuropsychiatrist, Neuro-Therapy Clinic, Englewood, CO Joel F. Lubar PhD, Professor of Psychology, University of Tennessee, Knoxville, TN David Trudeau MD, Adjunct Associate Professor, Family Practice and Community Health, University of Minnesota, Department of Psychiatry, Minneapolis, VAMC, Minneapolis, MN Robert Gurnee MSW, Director, Scottsdale Neurofeedback Institute/ADD Clinic, Scottsdale, AZJoseph Horvat PhD, Private Practice, Corpus Christi, TX

47
(c) 2007-10 T. F. Collura, Ph.D.
References II• Collura, T.F. (2008) Whole-Head Normalization Using Live Z-Scores for Connectivity Training. NeuroConnections, April, 2008 and July,
2008
• Collura, T.F., Thatcher, R., Smith, M., Lambos, W., and Stark, C. (2008) Real-Time EEG Z-Score Training – Realities and Prospects, in Evans, J.,Budzynsky, T., Budzynsky, H., and Arbanel, Quantitative EEG and Neurofeedback, 2nd Edition: Elsevier.
• Kerson, C., Gunkelman, J., and Collura, T., (2008) Neurofeedback using the Phenotype and Z-Score Modalities, NeuroConnections, July, 2008.
• Johnstone, J., Gunkelman, J., and Lunt, J. (2005) Clinical Database Development: Characterization of EEG Phenotypes, Clinical EEG and Neuroscience, 36(2); 99-107.
• Sterman, M.B., Mann, C.A., Kaiser, D.A. and Suyenobu, B.Y. Multiband topographic EEG analysis of a simulated visuomotor aviationtask. Int. J. Psychophysiol., 16: 49-56, 1994.
• Sterman, M.B. Physiological origins and functional correlates of EEG rhythmic activities: Implications for self-regulation. Biofeedback and Self-Regulation, 21:3-33,1996.
• Silberstein, R.B., (2006) Dynamic Sculpting of Brain Functional Connectivity and Mental Rotation Aptitude, Progress in Brain Research, Vol. 159, 63-88.
• Smith, M. L., (2008) Case Study – Jack, NeuroConnections, April, 2008.
• Stark, C. (2008) Consistent Dynamic Z-Score Patterns, NeuroConnections, April, 2008
• Thatcher, R.W. (2008) Z-Score EEG Biofeedback: Conceptual Foundations, NeuroConnections, April 2008
• Walker, J.E., Kozlowski, G.P., and Lawson, R. (2007) A Modular Activation / Coherence Approach to Evaluating Clinical /QEEG Correlations and for Guiding Neurofeedback Training Journal of Neurotherapy 11(1) 25-44.
(c) 2008 Thomas F. Collura, Ph.D.
(c) 2007-10 T. F. Collura, Ph.D.
Questions
• 1. If you reverse the active and reference leads of an EEG amplifier, which of the following would result?
– A. The frequency content would shift up or down
– B. The waveforms would be displayed upside down
– C. The amplitude of the waveform could change
– D. There would be no change in the signals at all

48
(c) 2007-10 T. F. Collura, Ph.D.
Questions
• 2. CMRR or “common-mode rejection
ratio” should be high in order to:
– A. Reduce the effects of 60 Hz interference
– B. Reduce the effects of motion artifact
– C. Reduce the effects of electrode imbalance
– D. All of the above
(c) 2007-10 T. F. Collura, Ph.D.
Questions
• 3. What is a “Z-Score”?
– A. A measure of how large a value is
– B. A measure of how much a value is different from a
population mean
– C. A measure of how healthy an individual is
– D. None of the above

49
(c) 2007-10 T. F. Collura, Ph.D.
Questions
• 4. Which of the following are true of z-scores?
– A. They depend on a database
– B. They can address brain connectivity
– C. They can be used for mapping
– D. All of the above
(c) 2007-10 T. F. Collura, Ph.D.
Questions
• 5. In QEEG work, reviewing the raw EEG is:
– A. Important to ensure quality
– B. Unimportant
– C. Easy for anyone to do
– D. Tedious and boring