Embed Size (px)
Citation preview

Technical Memorandum-TM UCB PRC 99-3
Overlay Design for Cracked and Seated Portland Cement Concrete
(PCC) Pavement—Interstate Route 710
Prepared for: Long Life Pavement Task Force
Prepared by: C. L. Monismith and F. LongPavement Research CenterInstitute for Transportation StudiesUniversity of California, Berkeley
Date: September 1999

ii
TABLE OF CONTENTS
Table of Contents ............................................................................................................................ii
List of Figures ................................................................................................................................iii
List of Tables................................................................................................................................... v
1.0 Introduction ............................................................................................................................. 1
1.1 Pavement Section ................................................................................................................ 1
1.2 Analyses/Design Considerations......................................................................................... 2
1.3 Finite Element Analyses...................................................................................................... 5
2.0 Results of Finite Element Analysis ....................................................................................... 10
2.1 Cases 1 and 2–Effects of Joint Spacing and Joint Stiffness.............................................. 10
2.2 Case 3–Effect of Overlay Mix Stiffness ........................................................................... 15
2.3 Case 4–Effect of Surface Layer Thickness, Mix with PBA-6A Binder............................ 16
2.4 Case 5–Surface Layer Composed of Two Mixes, One with AR-8000 and the Other with
PBA-6A Binder ......................................................................................................................... 18
2.5 Case 6–Composite Overlay Analysis................................................................................ 20
3.0 Summary and Recommendations.......................................................................................... 27
4.0 References ............................................................................................................................. 29
Appendix A ................................................................................................................................... 30

iii
LIST OF FIGURES
Figure 1 Pavement Representation for First Analysis Series ........................................................ 3
Figure 2 Pavement Systems Considered for Final Design ............................................................ 5
Figure 3. Pavement and Loading Configurations Used for Finite Element Analyses ................... 7
Figure 4. Finite Element Mesh used for Nike 2D Analyses; a Total of about 12,000 elements.... 8
Figure 5. Close-up of Finite Element Mesh in the Vicinity of Crack. ........................................... 9
Figure 6. Pavement Representation Showing Locations at which Tensile and Shear Strains were
Determined. ........................................................................................................................... 11
Figure 7. Tensile Strains Occurring in the Asphalt Concrete Layer in the Vicinity of
Joints/Cracks Just Above (1mm) the Surface of the Concrete and Fabric Interlayer. .......... 12
Figure 8. Fringes of Maximum Principal Strain in the Asphalt Concrete Layer for the Load
Condition Shown in Figure 3. ............................................................................................... 13
Figure 9. Distribution of Tensile Strains in Asphalt Concrete just above the Fabric Interlayer for
Joint/Crack Spacings of 3 feet (0.914 m) and 15 feet (4.572 m) .......................................... 14
Figure 10. Strain Distributions for Joint Stiffnesses of 10 Percent and 1 Percent of the PCC
Pavement Modulus................................................................................................................ 14
Figure 11. Influence of Overlay Stiffness on Strains in Layer Immediately Above Fabric
Interlayer. .............................................................................................................................. 15
Figure 12. Effect of Surface Layer Thickness on Strains in Mix just above the Fabric Interlayer.
............................................................................................................................................... 17
Figure 13. Effect of Layer Thickness on Strains in Mix just above Joints/Cracks in PCC. ........ 17
Figure 14. Comparison of Strains in Mix Immediately Above Fabric Layer for Single Layer
(PBA-6A mix) and Composite Layer (PBA-6A mix and AR-8000 mix)............................. 19

iv
Figure 15. Comparison of Strains in Mix Just Above Joints/Cracks in PCC Layer for Single
Layer (PBA-6A mix) and Composite Layer (PBA-6A mix and AR-8000 mix). ................. 19
Figure 16. Comparison of Strains at Underside of the Mix just above the Fabric Interlayer for a
PBA-6A Mix and Two Thickness Combinations of the PBA-6A and AR-8000 Mixes....... 22
Figure 17. Comparison of Strains at Underside of Mix Just Above the Fabric Interlayer for
Three Thickness Combinations of the PBA-6A and AR-8000 Mixes. ................................. 22
Figure 18. Comparison of Bending Strains in Mix just above PCC Joints/Cracks for Three
Thicknesses Combinations of the PBA-6A and AR-8000 Mixes. ........................................ 23
Figure 19. Comparison of Bending Strains in Bottom of Top Layer for Three Thickness
Combinations of the PBA-6A and AR-8000 Mixes.............................................................. 23
Figure 20. Comparison of Shear Strains in the Underside of the Mix Adjacent to the Fabric
Interlayer for Three Thickness Combinations of PBA-6A and AR-8000 Mixes.................. 24
Figure 21. Comparison of Shear Strains in Mix just above Joints/Cracks in PCC Layer for Three
Thickness Combinations of the PBA-6A and AR-8000 Mixes. ........................................... 24
Figure 22. Comparison of Shear Strains near the Underside of the PBA-6A Mix for Three
Thickness Combinations of the PBA-6A and AR-8000 Mixes. ........................................... 26
Figure 23. Comparison of Shear Strains near the Surface of PBA-6A Mix for Three
Combinations of PBA-6A and AR-8000 Mixes. .................................................................. 26
Figure A-1. Typical Spring Week (4/1-4/7), Los Angeles........................................................... 31
Figure A-2. Typical Fall Week (11/26-12/2), Los Angeles. ........................................................ 32

v
LIST OF TABLES
Table 1 Material Properties, First Analysis Series ...................................................................... 3
Table 2 Material Characteristics, Second Analyses Series.......................................................... 4
Table 3 Summary of Cases Analyzed using NIKE 2D Finite Element Program ...................... 11

1
1.0 INTRODUCTION
This technical memorandum summarizes the analyses performed and the design
recommended for the overlay thickness for a portion of Interstate 710 in Southern California.
This design is a part of the “Long Life Pavement” system under consideration for this heavily
trafficked freeway which serves the Port of Long Beach, California.
The analyses consist of a series of finite element simulations performed on idealized
representations of an asphalt concrete overlay on an existing plain, jointed, portland cement
concrete (PCC) pavement in which the 8 inch thick existing slabs will be broken and seated prior
to placement of the overlay. All of the finite element analyses were performed by Dr. Jeffrey
Simons of Applied Research Associates (ARA) located in Sunnyvale, California.1
This report is complementary to the Technical Memorandum dated June 1999 which
details the mix design and analysis and thickness design for the full-depth asphalt concrete
section which will be placed in excavated sections under and adjacent to the bridge structures
used as overcrossings for the freeway.
1.1 Pavement Section
The existing pavement section consists of 200 mm of portland cement concrete (PCC),
100 mm of cement treated subbase, 100 mm of aggregate base, and 200 mm of imported subbase
material. For the design discussed herein, the PCC slabs will be cracked and seated and an
asphalt concrete overlay will then be placed on the section.

2
Caltrans practice for this type of overlay has consisted of the placement of 30 mm (0.1ft.)
of an asphalt concrete leveling course, a non-woven fabric saturated with an AR-4000 asphalt
cement which serves as an interlayer, 92 mm (0.3ft.) of dense graded asphalt concrete, and 25
mm (0.08 ft.) of an open-graded asphalt concrete surface course. The total thickness of the
overlay is approximately 150 mm (0.5 ft.) and is expected to provide satisfactory performance
for a period of about 10 years.
The design for the I-710 project is expected to perform for a period of 30 years with
relatively little maintenance and/or rehabilitation. Traffic for this period is estimated to be of the
order of 200×106 ESALS. Since this traffic exceeds that associated with the conventional
overlay design described above, the problem becomes one of selecting an overlay thickness
which will meet the stipulated requirements. It is for this reason that the finite element
simulations to be described in the following sections were conducted.
1.2 Analyses/Design Considerations
Based on previous Caltrans experience it was decided to evaluate a range in thicknesses
of the asphalt concrete overlay from 152 to 254 mm (6.0 to 10.0 in.). The configuration for the
structure used in the first series of analyses is illustrated in Figure 1. It will be seen that the
untreated granular layer has been combined with the subgrade soil rather than treating it as a
separate layer. Table 1 lists the stiffness characteristics used in the analyses and considered to be
representative of the various layers in the pavement structure shown in Figure 1. Stiffness values
1 The contract to perform these analyses was initiated while Dr. Simons was employed by Stanford ResearchInstitute (SRI) in Menlo Park, California.

3
for the asphalt concrete layer represent average values for mixes which had been evaluated in the
mix design process. These included a mix containing an AR-8000 asphalt cement and one with a
PBA-6A binder.
Subgrade
Cement Treated Base
Jointed PCC
Leveling Course
Fabric
Asphalt Concrete
1.2 inches
6 - 10 inches
8 inches
6 inches
Figure 1 Pavement Representation for First Analysis Series
Table 1 Material Properties, First Analysis Series
Layer Material Thickness(inches)
Young’s Modulus(×103 psi) Poisson’s Ratio
1 Asphalt concrete 6 – 10 150 or 400 0.4
2 Fabric 0.1 1.5 0.45
3 Leveling course 1.2 400 0.4
4 Jointed PCC 8 4000 0.21
5 Cement treated base 6 20 0.35
6 Subgrade 8 0.35

4
For the full depth design to be used as the replacement pavements in the vicinity of the
overcrossings, it was recommended in Technical Memorandum-TM-UCB 99-2 (1) that the top
3.0 in. (75 mm) of the structural section be constructed with a mix containing the PBA-6A binder
and that the rest of the section contain the mix with the AR-8000 cement. This recommendation
was based on the fact that the mix with the PBA-6A binder was more rut resistant than that
containing the AR-8000 material. Thus when considering pavement construction, some
additional analyses were performed in which the upper layer was subdivided into two layers, one
with an average stiffness representing that of the PBA-6A mix and the other with a stiffness
reflecting that of AR-8000 mix. This section is shown schematically in Figure 2 and the material
stiffness characteristics are summarized in Table 2.
Table 2 Material Characteristics, Second Analyses Series
Layer Material Thickness (in.) Young Modulus×××× 103psi Poisson’s Ratio
1 Open-graded mix 1.0* 150 0.4
2 Asphalt concrete (PBA-6Abinder) 3.0-4.0 150 0.4
3 Asphalt concrete (AR-8000binder) 3.0-5.0** 900 0.4
4 Fabric 0.1 1.5 0.45
5 Leveling course (AR-8000binder) 1.2*** 900 0.4
6 Jointed PCC 8.0 4000 0.21
7 CTB 6.0 20.0 0.35
8 Subgrade — 8.0 0.35* For analysis purposes, considered as a part of AC with PBA-6A binder.** Thickness includes leveling course.*** Same material as Layer 3.

5
1.3 Finite Element Analyses
To analyze the pavement systems shown in Figures 1 and 2, a finite element solution was
selected as the most feasible approach because of the joints/cracks in the PCC layer. (N.B.
Caltrans practice is to crack and seat this layer prior to construction of the overlay.) An
assumption was made that the crack spacing obtained by the pavement cracking procedure would
average about 3 feet (0.91 m). During discussions with Caltrans personnel (District 7), they
requested that some analyses also be done with a joint spacing of 15 ft. (4.57 m), the joint
spacing used at the time of the original construction.
In designing the overlay on a cracked PCC pavement both the effects of traffic loading
and environmentally induced stresses must be considered, the latter resulting from length
changes caused primarily by temperature changes. By breaking the concrete slabs into smaller
sections, the relative movements at the cracks/joints are reduced from this latter effect.
Asphalt Concrete (PBA-6A binder)
Asphalt Concrete (AR-8000 binder)
Open-graded Porous Friction Course
Subgrade
Cement Treated Base
Jointed PCC
Leveling Course1.2 inches
3 - 5 inches
8 inches
6 inches
3 - 5 inches
1 inch
Fabric
Figure 2 Pavement Systems Considered for Final Design

6
In this study the decision was made to neglect the effects of temperature induced
deformations/stresses. This decision was based on a consideration of temperature changes which
were estimated to occur at depth of 9 in. (229 mm) using the Federal Highway Administration
(FHWA) Integrated Climatic Model version 2.0 (2) and the average of 30 years of temperature
data for the Los Angeles (Long Beach) area. Results indicated that the temperature change at
this depth would be about 7°F (3.9°C) for average summer temperature fluctuations and about
5°F (2.8°C) for average winter conditions. Appendix A contains a brief summary of the results
of these computations.
To analyze the effects of loading, the NIKE 2D program (3) was utilized. The pavement
configuration selected for calculation is shown in Figure 3. It will be noted that three 3-foot
(0.91-m) sections are included.2
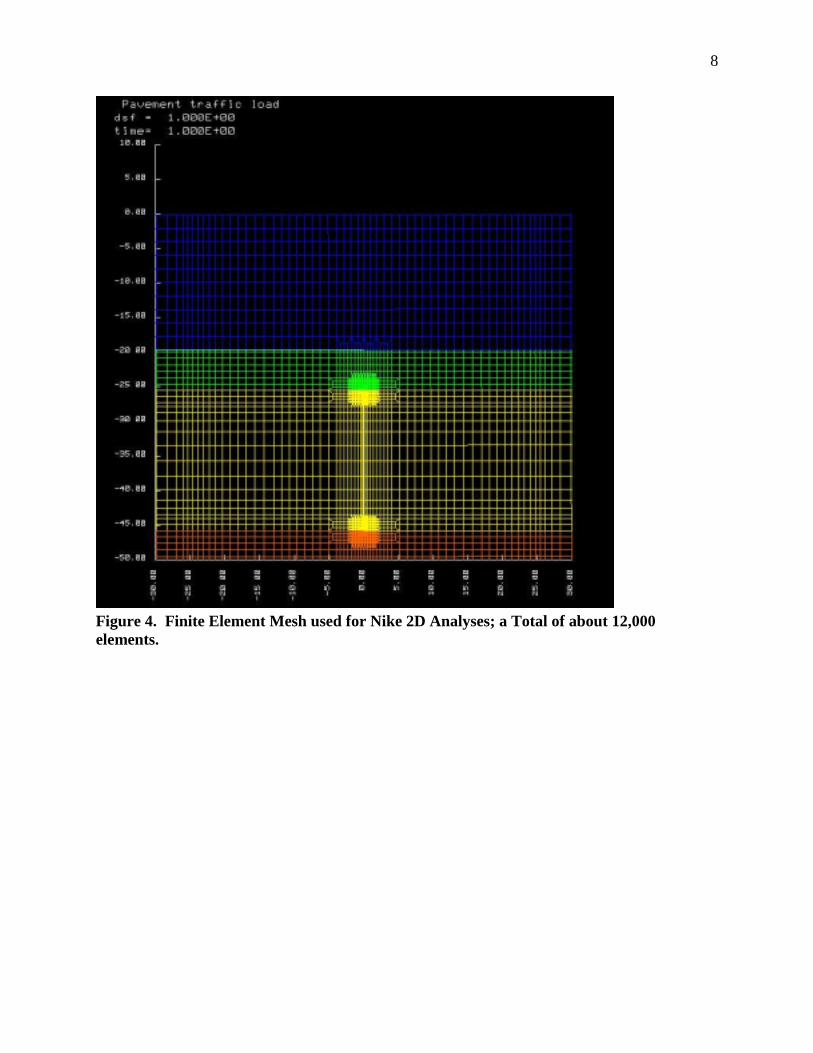
The finite element mesh generated is shown in Figure 4 and contains a total of about
12,000 elements. Figure 5 shows a close-up of the mesh in the vicinity of the crack. The
analyses are run in a plane strain configuration, this assumes the configurations shown in Figures
4 and 5 are infinitely long in the third dimension, into the page. In these type of analyses, the
loading is therefore applied as a strip load in the third dimension. The 2D plane strain analyses
has advantages over a full 3D analysis in that the computational time is considerably reduced.
The vertical boundaries on either side of the mesh shown in Figure 3 are symmetry
boundaries which implies the geometry is repeated on either side of the mesh in a mirror image.
2 Initially only two sections were included; the deformation patterns did not appear to pass “the test ofreasonableness”; hence the use of the configuration shown in Figure 3.

7
This configuration gives a more realistic representation of the cracked pavement, and is not a
conservative assumption since the load is also repeated on either side of the symmetry boundary.
The joint/crack was assumed to be 0.1 in. (2.5 mm) wide and some load transfer was
assumed. This was accomplished by assuming the elements representing the crack had a
stiffness of either 10 percent or 1 percent of the stiffness modulus of the PCC.
Traffic loading was applied statically as shown in Figure 3. A contact pressure of 105 psi
and length of tire in contact with the pavement of 10 in. (254 mm) were assumed.
Results of the computations for the various cases analyzed are summarized in the next
section.
10 inches
p =105 psi
Asphalt Concrete
Unbound Layers
Jointed PCC Cracks @3 feet
Fabric
Figure 3. Pavement and Loading Configurations Used for Finite Element Analyses
8
Figure 4. Finite Element Mesh used for Nike 2D Analyses; a Total of about 12,000elements.

9
0.1 inches
Figure 5. Close-up of Finite Element Mesh in the Vicinity of Crack.

10
2.0 RESULTS OF FINITE ELEMENT ANALYSIS
The finite element analyses were performed on a series of idealizations of the pavement
structures illustrated in Figures 1 and 2. Results of all of the analyses are presented in the
sequence in which they were accomplished to illustrate the process used to arrive at the
recommended thickness for the overlay pavement structure. Table 3 summarizes the simulations
performed and Figure 6 shows the locations at which critical strains, principal tensile and
maximum shear, were determined.
2.1 Cases 1 and 2–Effects of Joint Spacing and Joint Stiffness
The first system which was analyzed considered a single layer with a stiffness of 2760
MPa (400 ksi). This stiffness was assumed to be representative of an average year-round
stiffness for the mix containing the AR-8000 binder.
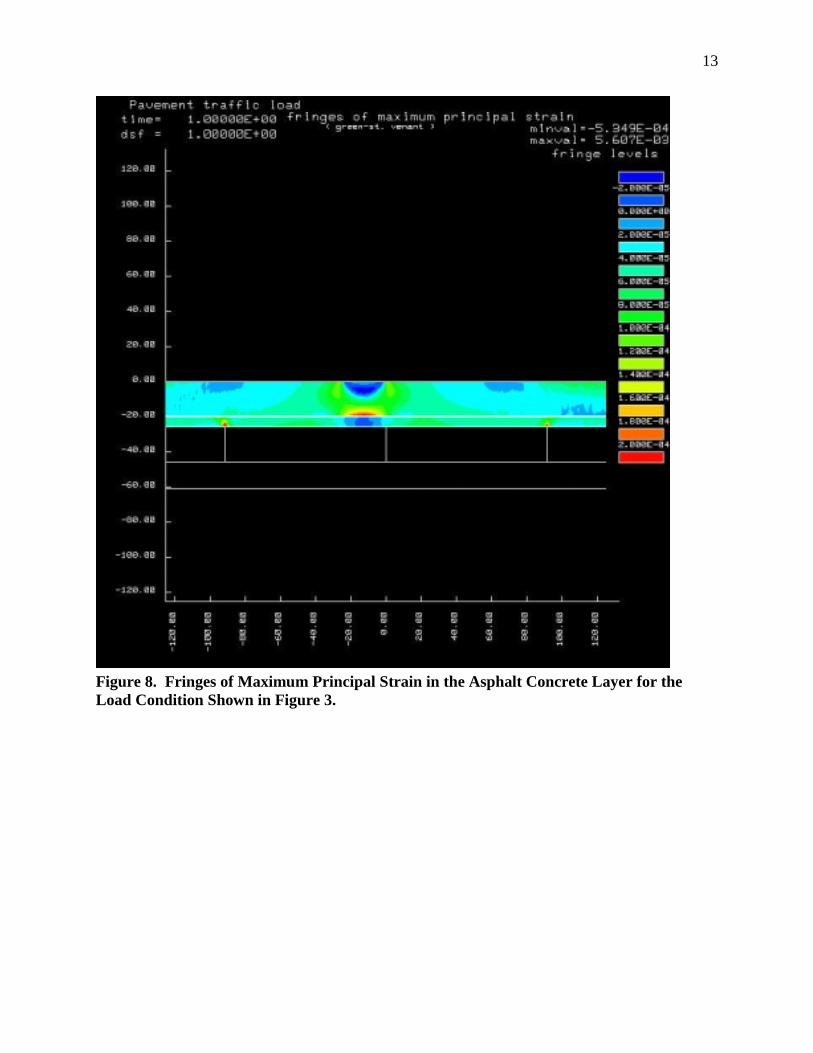
Results of Case 1 are shown in Figures 7 and 8. For this case, Figure 7 illustrates the
principal strains at two locations: 1) the underside of the asphalt concrete just above the fabric
interlayer; and 2) the underside of the portion of the asphalt concrete layer (leveling course)
adjacent to the concrete slab. The peak values in both locations occur directly above the
joints/cracks.
The maximum principle tensile strain just above the fabric interlayer is about 220×10 6
in./in., Figure 7. This figure also includes the tensile strains occurring in the asphalt concrete at
the adjacent joints/cracks just above the concrete surface. These strains are quite high and
indicate that the leveling course will crack early on the bottom of the fabric interlayer when
subjected to traffic loading.

11
Table 3 Summary of Cases Analyzed using NIKE 2D Finite Element Program
Parameters determined
Tensile Strain Shear StrainCaseLayerThickness(in.)
LayerStiffness(es)(ksi)
Binder(s)
1** 2 3 1 2 3 4
1 10 400 AR8000
2* 10 400 AR8000
3 10 400150
AR8000PBA-6A
41086
150150150
PBA-6APBA-6APBA-6A
563,33,5
150150, 900150, 900
PBA-6APBA-6A, AR8000PBA-6A, AR8000
65,43,53,3
150, 900150, 900150, 900
PBA-6A, AR8000PBA-6A, AR8000PBA-6A, AR8000
*Joint spacing–15 ft.** Location as shown in Figure 6
Figure 6. Pavement Representation Showing Locations at which Tensile and Shear Strainswere Determined.
Asphalt Concrete (PBA-6A binder)
Asphalt Concrete (AR-8000 binder)
Open-graded Porous Friction Course
Subgrade
Cement Treated Base
Jointed PCC
Leveling Course
Fabric
Strain Locations
4: 1 mm below surface
3: Top layer lower surface
2: 1 mm above PCC
1: 1 mm above fabric

12
-1000
100200300400500600700800900
-6 -4 -2 0 2 4 6Distance from Center Crack (ft)
Max
imum
Prin
cipa
l Stra
in
( µst
rain
)Surface LayerLeveling Course
Figure 7. Tensile Strains Occurring in the Asphalt Concrete Layer in the Vicinity ofJoints/Cracks Just Above (1mm) the Surface of the Concrete and Fabric Interlayer.
Figure 8 illustrates the distribution of maximum principal tensile strains in the asphalt
concrete later with the load applied as shown in Figure 3. It is from this type of plot that the
plots of tensile strains shown in Figure 7 were obtained.
The influence of joint spacing on the bending strains in the asphalt concrete just above
the fabric interlayer are shown in Figure 9. Two spacings were utilized, 3 ft. (0.91 m ) and 15 ft.
(4.57 m). The 3-ft. (0.91-m) distance represents the cracked and seated condition while the 15-ft.
(4.57-m) is representative of the lanes closest to the median, some of which remain in the
uncracked condition and may not be broken and seated prior to the placement of the overlay. It
will be observed that the strains in the asphalt concrete with the 15-ft. (4.57-m) joint spacing are
only about 10 percent less than the strains in the case with 15-ft. (0.91-m) joint/crack spacing.
The influence of joint stiffness is illustrated in Figure 10 by the fringe patterns for
principal strains shown for two different joint stiffnesses. For both cases, the joint/crack was
represented by a single “stack” of elements. In one case the elements were assumed to have a
13
Figure 8. Fringes of Maximum Principal Strain in the Asphalt Concrete Layer for theLoad Condition Shown in Figure 3.

14
-100
-50
0
50
100
150
200
250
-20 -10 0 10 20Distance from Centerline (feet)
Bend
ing
Stra
in ( µ
s)3 ft spacing15 ft spacing
Figure 9. Distribution of Tensile Strains in Asphalt Concrete just above the FabricInterlayer for Joint/Crack Spacings of 3 feet (0.914 m) and 15 feet (4.572 m)
10% 1%
Figure 10. Strain Distributions for Joint Stiffnesses of 10 Percent and 1 Percent of the PCCPavement Modulus.

15
-200
-100
0
100
200
300
400
-6 -4 -2 0 2 4 6DISTANCE FROM CENTERLINE (ft)
BEN
DIN
G S
TRAI
N (
µs)
. E = 150 ksi
E = 400 ksi
Figure 11. Influence of Overlay Stiffness on Strains in Layer Immediately Above FabricInterlayer.
stiffness of 10 percent of the modulus of the concrete, while in the other, one percent of the
concrete stiffness; 2760 MPa (400,000 psi) and 276 MPa (40,000 psi), respectively. Comparison
of the two cases indicates that the influence of joint stiffness is minimal.
2.2 Case 3–Effect of Overlay Mix Stiffness
To compare the performance of an overlay containing the PBA-6A binder and the one
containing the conventional AR-8000 asphalt cement, analysis was performed with the overlay
stiffness representing the PBA-6A mix equal to 103.5 MPa (150,000 psi). Comparison of the
strains developed in the two overlays is shown in Figure 11. It will be noted that tensile strain in
the PBA-6A mix is about 50 percent larger than that in the mix with the AR-8000 binder. From
fatigue data contained in Reference (1), at these strain levels the relative fatigue life of the

16
PBA-6A mix is about three times that of the AR-8000 mix; considering the shift factor to relate
laboratory to field performance reduces the difference to a factor of about 1.8.
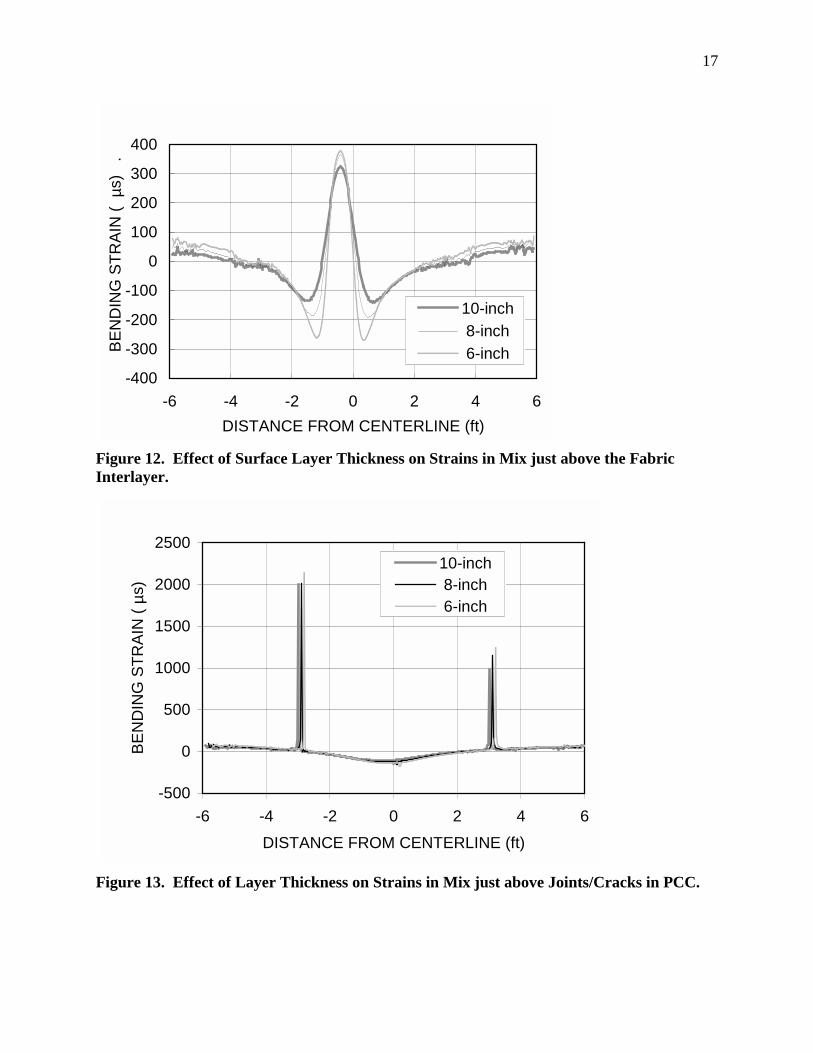
2.3 Case 4–Effect of Surface Layer Thickness, Mix with PBA-6A Binder
The effect of thickness of the overlay containing the PBA-6A Binder on the tensile strain
just above the fabric layer and adjacent to the concrete was examined for three thicknesses, 10
in., 8 in., and 6 in. Results of the analyses are shown in Figures 12 and 13.
Figure 12 indicates that there is an increase of about 10 percent when the thickness is
reduced from 10 in. to 8 in. With further reduction in thickness to 6 in. there is slight increase as
seen in Figure 12. It is interesting to note, however, that the compressive strain is increased
significantly. While not investigated herein, for many materials, when the ratio of the minimum
strain in compression increases relative to the maximum strain in tension (increased stress
reversal), the fatigue life is less. That is, as the ratio max
min
εε
=R increases in the negative direction
(assuming compression has a negative sign), the fatigue life decreases. Thus it would be
anticipated that the effects of traffic on the 6 in. overlay would result in a shorter fatigue life as
compared to the 8 in. and 10 in. overlays.
Figure 13 illustrates the tensile strains determined at the adjacent joints in the leveling
course just above the concrete pavements. It will be noted, as before, that these strains are quite
large suggesting that cracking, at least in the leveling course will likely occur with relatively few
repetitions (< 105 repetitions). In addition, it will be observed that the magnitude of these strains
is little influenced by overlay thickness.
17
-400
-300
-200
-100
0
100
200
300
400
-6 -4 -2 0 2 4 6DISTANCE FROM CENTERLINE (ft)
BEN
DIN
G S
TRAI
N (
µs)
.
10-inch 8-inch 6-inch
Figure 12. Effect of Surface Layer Thickness on Strains in Mix just above the FabricInterlayer.
-500
0
500
1000
1500
2000
2500
-6 -4 -2 0 2 4 6DISTANCE FROM CENTERLINE (ft)
BEN
DIN
G S
TRAI
N (
µs)
10-inch 8-inch 6-inch
Figure 13. Effect of Layer Thickness on Strains in Mix just above Joints/Cracks in PCC.

18
2.4 Case 5–Surface Layer Composed of Two Mixes, One with AR-8000 and the Otherwith PBA-6A Binder
For the full depth pavement to be placed under the bridge structures, the recommended
design consists of 3 in. of a mix with the PBA-6A binder and the remainder of the structural
section an AR-8000 asphalt cement mix. The bottom 3 in. of the layer containing the AR-8000
material was designed with a higher binder content (+0.5 percent)3.
From a constructability standpoint it would seem reasonable to consider a similar
combination of materials in the overlay. Accordingly an analysis was conducted of an overlay
containing 3 in. of the PBA-6A mix underlain by 3 in. of the mix containing the AR-8000 binder.
Since the mix with AR-8000 material is located 3 in. below the surface, the decision was made to
use a higher stiffness for the mix than used in the earlier analyses since the average temperature
would be lower; that is, a value of 6,210 MPa (900,000 psi) versus the 2,760 MPa (400,000 psi)
used earlier.
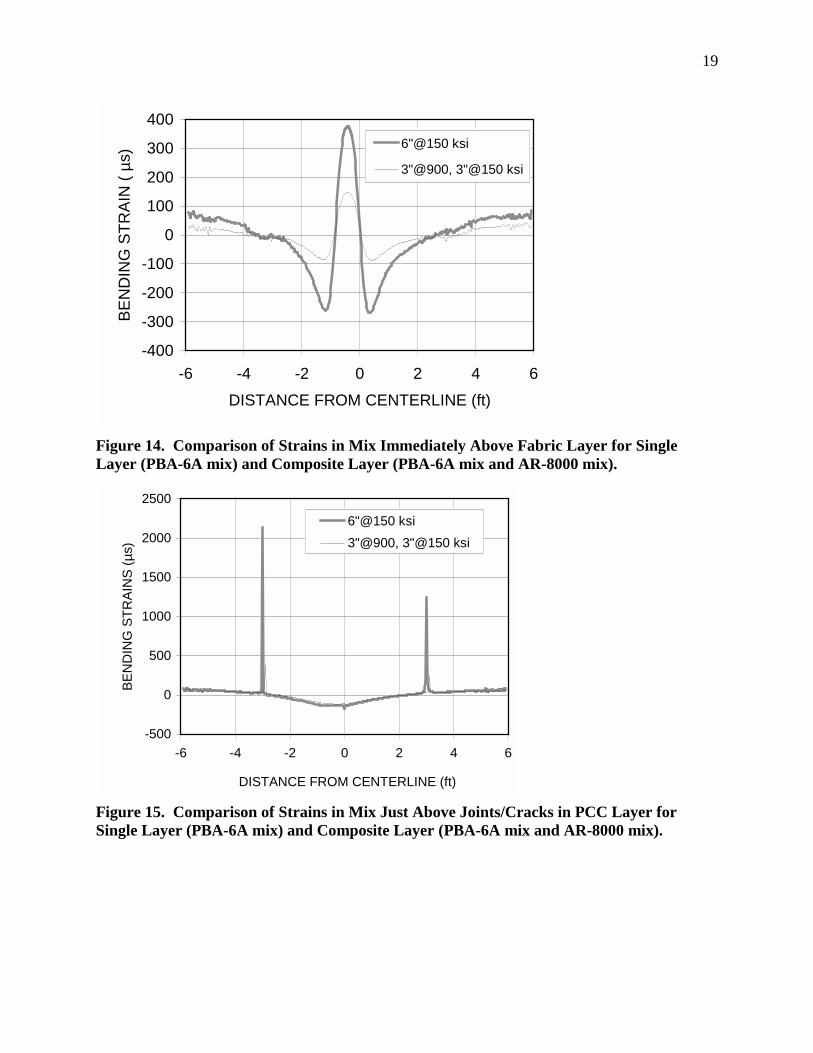
Results of the analyses for the tensile strain at the underside of the overlay just above the
fabric interlayer are shown in Figure 14. It will be noted that there is a substantial reduction in
strain for the composite layer as compared to the case for the overlay containing only the PBA-
6A material (145×10-6 in./in. versus 375×10-6 in./in.).
Strains at the bottom of the leveling course just above the joints/cracks in the concrete are
shown in Figure 15. The strains in the composite layer at these locations are substantially less
(400×10-6 in./in. versus 2130×10-6 in./in.).
3 This has been termed a "rich" bottom pavement structure.
19
-400
-300
-200
-100
0
100
200
300
400
-6 -4 -2 0 2 4 6DISTANCE FROM CENTERLINE (ft)
BEN
DIN
G S
TRAI
N (
µs) 6"@150 ksi
3"@900, 3"@150 ksi
Figure 14. Comparison of Strains in Mix Immediately Above Fabric Layer for SingleLayer (PBA-6A mix) and Composite Layer (PBA-6A mix and AR-8000 mix).
-500
0
500
1000
1500
2000
2500
-6 -4 -2 0 2 4 6
DISTANCE FROM CENTERLINE (ft)
BEN
DIN
G S
TRAI
NS
( µs)
6"@150 ksi3"@900, 3"@150 ksi
Figure 15. Comparison of Strains in Mix Just Above Joints/Cracks in PCC Layer forSingle Layer (PBA-6A mix) and Composite Layer (PBA-6A mix and AR-8000 mix).

20
As a part of this phase, one additional thickness combination was calculated, a composite
layer consisting of 5 in. of mix with the PBA-6A binder underlain by 3 in. of mix with the
AR-8000 asphalt cement. Results of this analysis are shown in Figure 16. For this combination
of thickness, the peak tensile strain in the composite layer is the same as that for the 3 in./3 in.
layer. However, it will be noted that compressive strain in the 5 in./3 in. system, and hence the R
value, is less than that for the 3 in./3 in. system.
Based on these analyses as well as constructability considerations, it was decided to use a
composite overlay consisting of the mix with the PBA-6A material in the upper 3 in. and the mix
with the AR-8000 in the lower portions including the leveling course. Case 6, described in the
next section describes the analyses leading to the final overlay thickness selection.
2.5 Case 6–Composite Overlay Analysis
From the previous analyses, and recognizing the desirability of constructing the layer
containing the PBA-6A mix continuously, an additional analysis was conducted in which the
layer containing the AR-8000 asphalt cement was increased in thickness from 3 in. to 5 in. In
addition, committee discussions had indicated that a one inch thick porous friction course would
likely be placed and that the binder would be an asphalt rubber. Earlier studies, e.g., Reference
(4) have shown that the stiffness of this type of mix is similar to that of the PBA-6A mix. Thus,
as seen in Table 3, the section used for analysis consisted of 5 in. of material with a stiffness of
900,000 psi and 4 in. of material with a stiffness of 150,000 psi. For information purposes an
analysis was also conducted in which the lower course was maintained at 3 in. and the upper

21
course with the less stiff binder(s) was increased to 5 in. The results of these analyses are
summarized in this section.
Figure 17 illustrates the variation of tensile strain just above the fabric layer for these
thickness combinations, the 3 in./3 in. section examined in Case 4 and the 5 in./4 in. and 3 in./5
in. combinations described above. It will be noted that maximum tensile strain is about the same
for the three conditions. However, the compressive strain in the 5 in./4 in. combination is less
than one-half of that for the 3 in./3 in. combination. Thus the “R” value for the 5 in./4 in.
combination is less (i.e. less negative) than for either the 3 in./3 in. or 3 in./5 in. combination;
hence its fatigue life is expected to be longer.
Bending strains just above the cracks in the PCC layer are almost the same for the three
conditions, Figure 18. Since these strains are larger than those at the underside of the layer
adjacent to the fabric, cracking is anticipated at these locations at fewer repetitions than in the
mix above the fabric interlayer.
Figure 19 illustrates the initial bending strain distribution at the underside of the top layer
(PBA-6A mix). For the cases examined, the distribution of strain for the 5 in./4 in. combination
remains compressive while that for the 3 in./3 in. exhibits some strain reversal. This suggests
that if cracking does progress above the interlayer it is likely to take substantially longer to reach
the mix containing the PBA-6A binder.
Shear strains have also been determined in the mixes at various locations. Figure 20
shows the variation of shear strains in the AR-8000 mix just above the interlayer. It will be
noted that the magnitude of the maximum shear strain is about the same for the three cases;
however, the patterns of distribution are different. The 5 in./4 in. combination exhibits smaller

22
-400
-300
-200
-100
0
100
200
300
400
-6 -4 -2 0 2 4 6 8DISTANCE FROM CENTERLINE (ft)
BEN
DIN
G S
TRAI
N (
µs)
6"@150 ksi3"@900, 3"@150 ksi3"@900, 5"@150 ksi
Figure 16. Comparison of Strains at Underside of the Mix just above the Fabric Interlayerfor a PBA-6A Mix and Two Thickness Combinations of the PBA-6A and AR-8000 Mixes.
-120
-80
-40
0
40
80
120
160
-4 -2 0 2 4 6DISTANCE FROM CENTER (ft)
BEN
DIN
G S
TRAI
N (u
s)
5"@900, 4"@150 ksi3"@900, 5"@150 ksi3"@900, 3"@150 ksi
Figure 17. Comparison of Strains at Underside of Mix Just Above the Fabric Interlayerfor Three Thickness Combinations of the PBA-6A and AR-8000 Mixes.

23
-200
-100
0
100
200
300
400
-4 -2 0 2 4DISTANCE FROM CENTER (ft)
BEN
DIN
G S
TRAI
N (u
s)
5"@900, 4"@150 ksi3"@900, 5"@150 ksi3"@900, 3"@150 ksi
Figure 18. Comparison of Bending Strains in Mix just above PCC Joints/Cracks for ThreeThicknesses Combinations of the PBA-6A and AR-8000 Mixes.
-120
-90
-60
-30
0
30
60
-4 -2 0 2 4DISTANCE FROM CENTER (ft)
BEN
DIN
G S
TRAI
N (u
s)
5"@900, 4"@150 ksi3"@900, 5"@150 ksi3"@900, 3"@150 ksi
Figure 19. Comparison of Bending Strains in Bottom of Top Layer for Three ThicknessCombinations of the PBA-6A and AR-8000 Mixes.

24
0
40
80
120
160
-4 -2 0 2 4 6DISTANCE FROM CENTER (ft)
SHEA
R S
TRAI
N (u
s)
5"@900, 4"@150 ksi3"@900, 5"@150 ksi3"@900, 3"@150 ksi
Figure 20. Comparison of Shear Strains in the Underside of the Mix Adjacent to theFabric Interlayer for Three Thickness Combinations of PBA-6A and AR-8000 Mixes.
0
100
200
300
400
-4 -2 0 2 4DISTANCE FROM CENTER (ft)
SHEA
R S
TRAI
N (u
s)
5"@900, 4"@150 ksi3"@900, 5"@150 ksi3"@900, 3"@150 ksi
Figure 21. Comparison of Shear Strains in Mix just above Joints/Cracks in PCC Layer forThree Thickness Combinations of the PBA-6A and AR-8000 Mixes.

25
secondary peak values than the 3 in./3 in. combination. The level of peak shear strain is about
140×10-6 in./in. for the 5 in./4 in. combination. In the shear test used to evaluate the permanent
deformation characteristics of the mix, the shear strain repeatedly applied was about 850×10-6
in./in. at 50ºC. It is unlikely that the pavement temperature at the depth of the interlayer will
reach this temperature. Since the strain determined from this analysis is substantially less than
that used in the shear test and would be even lower at a lower temperature it is unlikely that shear
deformations contributing to permanent deformation of the mix will result.
Figure 21 shows the shear strains in the leveling course adjacent to the PCC. These
strains are of the same order as the tensile strains. Their contribution to permanent deformation
of the AR-8000 mix is expected to be minimal. However, it is difficult to define the contribution
to cracking at this time because of the lack of information on the contribution of shear strains to
fatigue damage.
Shear strains in the top layer have also been investigated. For the 5 in./4 in. combination,
strains at the bottom of the layer containing the PBA-6A binder are about 250×10-6 in./in., Figure
22. Near the surface the shear strains are slightly higher; for the 5 in./4 in. combination they are
on the order of 270×10-6 in./in. as seen in Figure 23.
Generally, the results of the computations shown in Figures 22 and 23 show the
beneficial effects of the stiffer lower layer in controlling the shear strains in the PBA-6A mix and
suggest that the 5 in./4 in. combination is a reasonable thickness combination relative to
consideration of permanent deformation in the overlay.

26
0
100
200
300
400
-4 -2 0 2 4
DISTANCE FROM CENTER (ft)
SHEA
R S
TRAI
N (u
s)
3"@900, 5"@150 ksi3"@900, 3"@150 ksi5"@900, 4"@150 ksi
Figure 22. Comparison of Shear Strains near the Underside of the PBA-6A Mix for ThreeThickness Combinations of the PBA-6A and AR-8000 Mixes.
0
50
100
150
200
250
300
350
-4 -2 0 2 4 6DISTANCE FROM CENTER (ft)
SHEA
R S
TRAI
N (u
s)
5"@900,4"@1503"@900,5"@1503"@900,3"@150
Figure 23. Comparison of Shear Strains near the Surface of PBA-6A Mix for ThreeCombinations of PBA-6A and AR-8000 Mixes.
27
3.0 SUMMARY AND RECOMMENDATIONS
The results of a series of finite element analyses as idealized representations of an asphalt
concrete overlay on a cracked and seated, plain, jointed PCC pavement have been presented
herein. The purpose of the analyses was to provide guidance for the selection of the thickness of
overlay pavement to by placed on the I-710 freeway. It must be emphasized that the analyses
has been limited due both to time and budgetary constraints. Moreover, it must be emphasized
that the loading conditions and pavement structure are idealized to obtain a tractable solution
subject to the constraints noted above. Nevertheless it is believed that the resulting solutions
provide a reasonable basis for the overlay thickness and composition recommended herein.
Caltrans experience has suggested that a pavement consisting of a 1.2 in. leveling course,
an asphalt impregnated non-woven fabric, 3.6 in. of asphalt concrete above the fabric interlayer,
and an open-graded asphalt concrete course 1.2 in thickness resting on a cracked and seated
plain, jointed PCC pavement has performed satisfactorily for 10 years on average4 under current
freeway traffic loading. The thickness overlay recommended for 200 million ESALs based on
the analyses conducted herein, is as follows:
• 1.2 in. leveling course-DGAC with AR-8000 asphalt cement
• asphalt saturated fabric as an interlayer
• 3.8 in. asphalt concrete course–DGAC with AR-8000 asphalt cement (same mix as
leveling course)
• 3 in. asphalt concrete course–DGAC with PBA-6A binder

28
• 1 in. open-graded asphalt concrete with asphalt rubber binder
(N.B. The mix with the AR-8000 asphalt and that with the PBA-6A binder are the same materials
and thickness as in the full depth asphalt concrete to be used as replacement pavement structures
under the overcrossings.)
This thickness, including the open-graded porous friction course is 3 in. thicker than the
current Caltrans design. This design has the advantage that the 3 in. PBA-6A mix and the 1-in.
open-graded later can be placed continuously. Moreover, at the junction of the replacement
section and the overlay, the thickness of the replacement section will be 17 in. of asphalt mix,
since the 8 in. concrete slab will have to be removed. With such a thickness the “bump” which
might result at the juncture of the two pavements should be minimized so long as “proper”
compaction is achieved in the asphalt concrete layer.
4 This period of performance is associated with traffic volumes of up to 20 million ESALs.

29
4.0 REFERENCES
1. Monismith, C. L., and F. Long. “Mix Design and Analysis and Structural Section Designfor Interstate Route 710.” Technical Memorandum No. TM-UCB-99-2, prepared for LongLife Pavements Task Force. June 1999.
2. Federal Highway Administration, Integrated Climate Model (ICM Release version 2.0.0),prepared for FHWA by University of Illinois. October 1997.
3. Hallquist, J. O. NIKE 2D, An Implicit Finite-Deformation, Finite-Element Code forAnalyzing the Static and Dynamic Response of Two-Dimensional Solids. Livermore, CA,Department of Energy, Lawrence Livermore Laboratory [Springfield, VA. for sale by theNational Technical Information Service. 1979. iv, 104 p.
4. Monismith, C. L., and K. Wallace. “Pavement Design Considerations for Two-LayerPavements Containing Open-Graded Asphalt Mixtures.” Proceedings of the Association ofAsphalt Paving Technologists, Vol. 51. 1982, pp. 1-34.

30
APPENDIX A
Temperature Change Estimates at Asphalt Concrete/ Portland Cement Concrete Interface
To estimate the temperature change at the asphalt concrete/PCC pavement interface in the
pavement structure for the design overlay condition, the FHWA Integrated Climatic Model
(ICM, version 2.0.0, dated 10/30/97) was utilized.
The Long Beach area's climate was represented by 30 years of temperature data for the
Los Angeles area. Two 30-year averaged days that experienced the greatest temperature
fluctuation were selected, April 4 and November 29. To determine the average temperature
fluctuations at the asphalt concrete/ PCC interface, temperatures for 3 days before and after these
dates were utilized. The simulations for both periods are shown in Figures A1 and A2.
From the information presented in these figures the average temperature fluctuations at
the asphalt concrete/ PCC interface are:
• average spring temperature fluctuation: 7°F
• average fall temperature fluctuation: 5°F
Based on these two values the decision was made not to consider thermal stress effects in the
computations.

Figure A-1. Typical Spring Week (4/1-4/7), Los Angeles.
31

Figure A-2. Typical Fall Week (11/26-12/2), Los Angeles.
32