Embed Size (px)
Citation preview
Bethesda Towers4350 East West Highway
Suite 200Bethesda, MD 20814 USA
Tel: 1 (301) 656-5900Fax: 1 (301) 986-0296
E-mail: [email protected] site: www.pda.org
Technical Report No. 13 (Revised)
Fundamentals of an Environmental Monitoring Program
PDA Fundamentals of an Environmental Monitoring Program Technical Report Team
Authors
Jeanne E. Moldenhauer, Excellent Pharma Consulting, Inc., (Chair)
James E. Akers, Ph.D., Akers Kennedy & Associates
Dilip R. Ashtekar, Ph.D., Parexel
Jette Christensen, Novo Nordisk A/S
Anthony M. Cundell, Ph.D., Consultant
Phil DeSantis, DeSantis Consulting Associates
Michael B. Dolan, Merck & Co., Inc.
Robert A. Fry, Baxter Healthcare Corporation
Maitry Ganatra, Ph.D., Pall Lifesciences
Jennifer L. Gaudet, Olympus Biotech
Josephus M. Jordan, Baxter Healthcare
Amy Jo Karren, Nelson Laboratories, Inc.
Pamela Martinez, Sanofi Pasteur
Jeanne Mateffy, Amgen
William R. McCullers, Merck & Co., Inc.
Jeffrey A. Nakamatsu, Cardinal Health
Peter J. Noverini, Azbil BioVigilant, Inc.
Sean J. O’Brien, AstraZeneca
Dona B. Reber, Pfizer
Miriam S. Rozo, J&J Corporate
Gerry Seixas, AstraZeneca
George Tin, Allergan, Inc.
Nancy E. Tomoney, Q Pharma
Frank van der Zanden, Bactimm BV
Arthur L. Vellutato Jr., Veltek Associates
Robert B. White, Pharmaceutical Sourcing Group Americas ( J&J)
Disclaimer: The task force for this report consisted of members representing global companies to ensure that the methods, terminology, and practices reflect international and not just U.S., procedures. Technical peer reviews were completed by prominent environmental monitoring scientists.
The content and views expressed in this technical report are the result of a consensus achieved by the authoring task force and are not necessarily views of the organizations they represent.
Fundamentals of an Environmental Monitoring Program Technical Report No. 13 (Revised)
ISBN: 978-0-939459-67-4
© 2014 Parenteral Drug Association, Inc.
All rights reserved.
Bethesda Towers4350 East West Highway
Suite 200Bethesda, MD 20814 USA
Tel: 1 (301) 656-5900Fax: 1 (301) 986-0296
E-mail: [email protected] site: www.pda.org
1.0 INTRODUCTION ..................................................1
1.1 Purpose .......................................................... 11.2 Scope .............................................................. 1
1.2.1 Exclusions ................................................ 11.2.1.1 Bioburden Monitoring .......................... 11.2.1.2 Other Environmental Control
Support Activities ................................ 1
2.0 GLOSSARY OF TERMS ........................................3
2.1 Acronyms ........................................................ 5
3.0 ENVIRONMENTAL CLASSIFICATIONS: REGULATORY EXPECTATIONS.............................6
4.0 ENVIRONMENTAL MONITORING ......................10
4.1 Cleaning and Sanitization or Disinfection ....... 104.2 Sample Site Selection ................................... 124.3 Sampling Frequency ...................................... 134.4 Alert and Action Levels ................................. 144.5 Data Management (Data Collection,
Analysis, Approach, and Interpretation) ........ 154.5.1 Collection ................................................ 154.5.2 Analysis .................................................. 164.5.3 Interpretation .......................................... 16
4.6 Characterization and Identification of Isolates .174.7 Investigations and Corrective Actions ........... 184.8 Documentation .............................................. 20
5.0 ENVIRONMENTAL MONITORING BY APPLICATION ....................................................21
5.1 Terminal Sterilization ..................................... 215.2 Aseptic Processing ........................................ 21
5.3 Isolation Technology ...................................... 215.4 Water ............................................................ 22
5.4.1 Sample Site Selection and Frequency of Monitoring ........................ 22
5.4.2 Sample Collection and Testing ................ 225.5 Air ................................................................ 23
5.5.1 Nonviable Monitoring ............................ 235.5.2 Viable Particulates .................................. 24
5.5.2.1 Sampling Sites .................................. 245.5.2.2 Methods ............................................ 245.5.2.3 Equipment ......................................... 24
5.6 Compressed Gas Monitoring ......................... 255.7 Surface Monitoring ........................................ 25
5.7.1 Test Methods .......................................... 255.7.1.1 Contact Plates ................................... 255.7.1.2 Flexible Films ..................................... 265.7.1.3 Swabs ............................................... 265.7.1.4 Surface Rinse Method ....................... 26
5.8 Personnel ....................................................... 265.8.1 Introduction ............................................ 265.8.2 Training and Certification of Personnel
for Aseptic Manufacturing Areas ............ 275.8.3 Causes for Requalification or Retraining .. 27
5.9 Environmental Monitoring During Product Sterility Testing ................................ 27
6.0 REFERENCES ......................................................28
7.0 BIBLIOGRAPHY ..................................................30
8.0 APPENDIX A: CURRENT GUIDELINES FOR TYPICAL ENVIRONMENTAL MONITORING FREQUENCIES AND LEVELS—WATER .............32
FIGURES AND TABLES INDEX
Table 3.0-1 Cleanroom Standards— Airborne Particulate Limits ....................... 8
Table 3.0-2 Environmental Monitoring Requirements/Guidance ............................ 9
Table 4.2-1 Examples of Sampling Sites ................... 13
Table 4.5.4-1 USP Chapter <1116> Suggested Contamination Recovery Rates ........... 17
Table 4.6-2 Recommended Scheme for Microbial Identification ........................... 18
Table 4.7-1 Examples of Investigation Elements for Different Systems .............................. 19
Table of Contents
1Technical Report No. 13 © 2014 Parenteral Drug Association, Inc.
Environmental monitoring is adjunct to a sterility assurance program and is used to evaluate the ef-fectiveness of microbial controls used in the manufacture of sterile pharmaceutical products.
PDA first published guidance on environmental monitoring in the form of Technical Report No. 13 in 1990, and revised the guidance in 2001. This is the second revision of that guidance.
The task force chose to reference the ISO cleanroom classifications as benchmark recommendations throughout the Technical Report. However, cleanroom classifications expectations are different per region. Regulatory and compendial classifications have been identified in Tables 3.0-1 and 3.0-2 for the United States of America, the European Union, and Japan.
1.1 Purpose This document was created to aid in the establishment of an environmental control and monitoring program that is meaningful, manageable, and defendable. This revision updates microbiological and particulate control concepts and principles as they relate to facilities involved in the manufacture of sterile pharmaceutical products and other designated controlled environments. It expands on PDA’s 2001 revision of Technical Report No. 13 to reflect substantial changes to regulatory guidelines, inter-national standards, and scientific advances in environmental monitoring procedures and equipment.
This document should be viewed as technical guidance; it is not intended to establish any voluntary or mandatory standards.
1.2 ScopeThis document serves as a resource on controlled environmental test methods, and although some nonviable particulate information is included, the report’s primary focus is microbiological control for sterile product manufacturing.
This document addresses international standards and regulatory guidances, elements of an environ-mental monitoring program, and environmental monitoring by application. Current guidelines for typical environmental monitoring frequencies and levels for pharmaceutical water are covered in the appendix.
1.2.1 Exclusions1.2.1.1 Bioburden MonitoringProduct or component bioburden monitoring is not considered part of all environmental monitor-ing programs and is therefore outside of the scope of this technical report. Incubation media, times, and conditions are also not addressed in this document, as individual monitoring circumstances and requirements will vary and most regulatory expectations are that the sampling conditions should be justified and validated.
1.2.1.2 Other Environmental Control Support ActivitiesIn order to ensure a consistently acceptable controlled environment, a comprehensive environmental control program should be supported by:
• Sound facility design and maintenance
• Established documentation systems
• Validated/qualified sanitization/disinfection procedures
• Reliable process controls
1.0 Introduction
2 © 2014 Parenteral Drug Association, Inc. Technical Report No. 13
• Good housekeeping practices
• Effective area access controls
• Consistent sample collection and analysis
• Effective training, certification/qualification, and evaluation programs
• Quality assurance of materials, facilities, and equipment
These support elements are not covered in this technical report.
3Technical Report No. 13 © 2014 Parenteral Drug Association, Inc.
Action LevelAn established microbial or airborne particle level that, when exceeded, indicates a process is outside of its normal operating range. A re-sponse to such an excursion should involve a documented investigation and corrective actions based on the results of that investigation.
Alert LevelAn established microbial or nonviable particle level giving early warning of potential drift from normal operating conditions; not necessarily grounds for definitive corrective action but typi-cally requires follow-up investigation (1).
Airborne Particulate Count (Total Particulate Count)The total number of particles of a specific size per unit volume of air.
Airborne Viable Particulate Count (Total Airborne Aerobic Microbial Count)The recovered number of colony-forming units per unit volume of air.
Aseptic FillingPart of aseptic processing in which a presteril-ized bulk product is filled and/or packaged into sterile containers and closed in a cleanroom.
Aseptic ProcessingHandling of sterile product, containers, and/or devices in a controlled environment in which the air supply, materials, equipment, and person-nel are regulated to maintain (product) sterility.
BioburdenThe total number of microorganisms per unit of material prior to sterilization.
CampaignA series of consecutive production batches manufac-tured without intervening cleaning and sterilization.
Colony-Forming Unit (CFU)A single macroscopic colony formed after the successful growth of one or more microorgan-isms to a solid microbiological growth medium.
CleaningChemical or physical means used to remove soil and/or microorganisms from surfaces.
Cleanroom A room designed, maintained, and controlled to prevent particle and microbiological contami-nation of a drug product or medical device. A cleanroom is assigned and reproducibly meets an appropriate air cleanliness classification.
Continuous MonitoringA process of data collection in which conditions are monitored continuously throughout the op-eration. In most U.S. applications, this definition implies “during production.”
Controlled AreaAn area constructed and operated in such a manner that some attempt is made to control the introduction of potential contamination (an air supply approximating to Grade D may be ap-propriate), and the consequences of accidental release of living organisms. The level of control exercised should reflect the nature of the organ-ism employed in the process. At a minimum, the area should be maintained at a pressure positive to the immediate external environment and al-low for the efficient removal of small quantities of airborne contaminants.
Corrective ActionA response taken to remediate the effect of an excursion or product failure.
Critical Area/Critical ZoneAn area designed to maintain sterility of mate-rials where sterilized product, containers, clo-sures, and equipment may be exposed to the environment.
Critical SurfaceA surface within a critical area that may come in direct contact with sterilized products, contain-ers, or closures.
DisinfectionThe chemical or physical inactivation of a bio-burden on inanimate surfaces. Typically this re-quires a minimum three-log (3-log) reduction of vegetative microorganisms and two-log (2-log) reduction for bacterial spore be achieved in vali-dation (2).
2.0 Glossary of Terms
4 © 2014 Parenteral Drug Association, Inc. Technical Report No. 13
D-valueThe time in minutes at a specific temperature re-quired to reduce the population of a specific micro-organism by 90% [or one (1) log] in defined condi-tions [e.g., method of sterilization (dry heat versus steam), solute, or carrier].
Dynamic MonitoringMonitoring of an environment during normal operations, that is, when the usual equipment is operating and personnel are present, and the process or simulated process is ongoing. Per the EU and ISO documents this is synonymous with operational condition (including the equipment operating and personnel present).
Environmental Control ParametersConditions and corresponding measurements as associated with facilities and equipment used in the control of a manufacturing area that may im-pact the identity, strength, quality, or purity of a product. Among such parameters are airflow rates and patterns, pressure differentials, materials and personnel flow, temperature and relative humid-ity, as well as nonviable and viable particulates.
Frequent MonitoringA process of collecting data in which conditions are monitored at a defined frequency not exceed-ing sixty minutes during operation. In most U.S. applications, this means “during production.”
Grid ProfilingA process of dividing areas of equivalent classifica-tions into grids for the purpose of uniformly as-sessing contamination characteristics in that area. This process is usually confined to the validation of new facilities and not routine monitoring.
Isolator Isolator, ClosedA decontaminated unit meeting ISO 5 con-ditions that provides uncompromised, con-tinuous, isolation of its interior from the sur-rounding environment. Any air exchange with the surrounding environment takes place only through microbially retentive filters.
Isolator, OpenA decontaminated unit meeting ISO 5 condi-tions that provides uncompromised, continu-
ous isolation of its interior from the surround-ing environment. It may transfer air directly to the surrounding environment through open-ings (e.g., “mouseholes”) that preclude the in-gress of microbial contamination.
Microbial CharacterizationThe description of microorganisms based on their cellular morphology, Gram reaction, and key diagnostic tests (e.g., Gram-positive coagu-lase-negative cocci).
Microbial ClassificationThe arrangement of microorganisms into taxo-nomic groups based on their similarities and re-lationships.
Microbial IdentificationThe determination of the genus, and species when possible, to which a laboratory or manu-facturing isolate belongs.
NonviableA term used in reference to particulates that are not capable of living, growing, or developing and functioning successfully (“unable to divide” or “not capable of reproducing”).
Parametric ReleaseA sterility release program based on effective control, monitoring, and documentation of a validated sterile-product manufacturing process where sterility release is based on demonstrated achievement of critical operational parameters in lieu of end-product sterility testing (3).
Process Control ParametersConditions and corresponding measurements associated with the manufacturing process that may affect the identity, strength, quality, potency, and purity of a product. Examples of parame-ters of concern include bioburden, process rate, weight, volume, temperature, and pressure.
Restricted Access Barrier System (RABS)Aseptic processing systems (ISO 5) intended to substantially reduce human-borne contamination within the aseptic environment where sterile prod-uct, containers, closures, and equipment are ex-posed by the use of separative devices and defined mechanical features and operating procedures (4).
5Technical Report No. 13 © 2014 Parenteral Drug Association, Inc.
Risk AnalysisThe estimation of the risk associated with the identified hazards (5,6).
SanitizationReduction of microbial contaminants to safe lev-els as judged by public health requirements for the specific country.
SporeA bacterial dormant form that is highly resis-tant to adverse conditions. Fungal spores are not highly resistant; their susceptibilities are closer to vegetative microorganisms.
Static MonitoringMonitoring of the environment in the absence of normal operations. This includes having the equipment installed and operational when no personnel are present. Per the EU and ISO stan-dards, this is synonymous with “at rest.”
SterilizationValidated process used to render product free from viable microorganisms (7).
StrainA specific isolate of a species that is maintained in pure culture and is serotypically, genotypical-ly, or chemotaxonomically characterized to dif-ferentiate it from other strains of the same spe-cies. The strain is representative of the species and provides a reference for the species based on its historic isolation, characterization, and depo-sition in recognized culture collections.
Terminal SterilizationThe application of a lethal agent to sealed, fin-ished drug products for the purpose of achiev-ing a predetermined sterility assurance level (SAL) of usually less than 10-6 (i.e., a probabil-ity of a nonsterile unit of less than one in a million). A process where the material is steril-ized in its final packaged configuration.
Trend AnalysisA review performed in response to an alert or action condition. This review provides an analy-sis of specific environmental monitoring data to identify adverse trends.
Vegetative CellCells in an actively growing state. Some micro-organisms can only be vegetative, while others are sporeformers and can be in a vegetative or spore (dormant) state.
2.1 AcronymsAPI — Active pharmaceutical ingredient
HEPA Filter — High-efficiency particulate air filter
VBNC — Viable but not culturable
6 © 2014 Parenteral Drug Association, Inc. Technical Report No. 13
3.0 Environmental Classifications: Regulatory Expectations
An environmental monitoring program should be designed and implemented in conformance with the re-quirements of the government agencies regulating (mandatory requirements) the manufacturing site and in-ternational standard-setting organizations (e.g., some mandatory or legally enforceable and some voluntary).
If the intent is to serve the international markets, the most stringent requirements should be evalu-ated as the basis of an environmental monitoring program.
This section compares regulations instituted for environmental monitoring by these authorities and standards setting organizations:• ISO (voluntary)• U.S. FDA• U.S. Pharmacopiea (mandatory)• European Pharmacopoiea (mandatory)
• European Commission• MHLW ( Japan)• Japan Pharmacopiea (mandatory)• World Health Organization
Although the regulations and guidelines are similar to each other in many respects, there are impor-tant differences among them in terms of the information each provides, particularly with respect to cleanroom classifications.
The most commonly accepted international cleanroom standard is ISO 14644-1, Cleanrooms and As-sociated Controlled Environments—Part 1: Classification of Air Cleanliness, 1999 (8). ISO class desig-nations are based on the number of particles greater than a specified size (0.1–5 μm) per cubic meter of air sampled. ISO 14644-1 defines classes from 1 to 9, with ISO 1 being the cleanest. ISO classes 5 through 8 are used in the pharmaceutical industry for sterile-product manufacture and other areas where airborne particulate control is required.
Some international and national bodies have based their cleanroom requirements for sterile manu-facturing on the ISO standard, thus its use here as the benchmark for other regulations and standards. The USP has adopted the ISO cleanliness classes in USP <1116> Microbial Control and Monitoring of Aseptic Processing Environments (9).
No international regulation or consensus standard except for the People’s Republic of China requires ISO-class cleanrooms for the manufacture of all types of nonsterile products. China requires ISO 8 tested at rest for areas where nonsterile product is exposed during manufacture. However, the EU GMP regulations require ISO 8 classification for the manufacture only for inhalants. In other jurisdic-tions, firms are free to apply the ISO classes to nonsterile manufacturing or to specify equivalent or modified conditions based on their product requirements.
It is important to note that ISO does not specify the operating state of the area being classified (i.e., as built, at rest, or in operation), nor does it specify the particle size thresholds to be employed. In addi-tion, the ISO standard deals only with total particulate count and does not discern between viable and nonviable particles. These decisions are left to the regulating or advisory body to specify. Therefore, each regulatory or standard-setting body has comparable but somewhat different applications of the ISO standard. In general, however, the international pharmaceutical community has provided guid-ance according to the following scheme (in operation):• ISO 5: Aseptic processing zone; sterile product and/or packaging component is exposed. Unidirectional
airflow required• ISO 7: Area immediately surrounding the aseptic processing zone (ISO 6 may be employed but is
neither required nor recommended)• ISO 8: Nonsterile formulation, materials, and component preparation; filling area for terminally
sterilized product
7Technical Report No. 13 © 2014 Parenteral Drug Association, Inc.
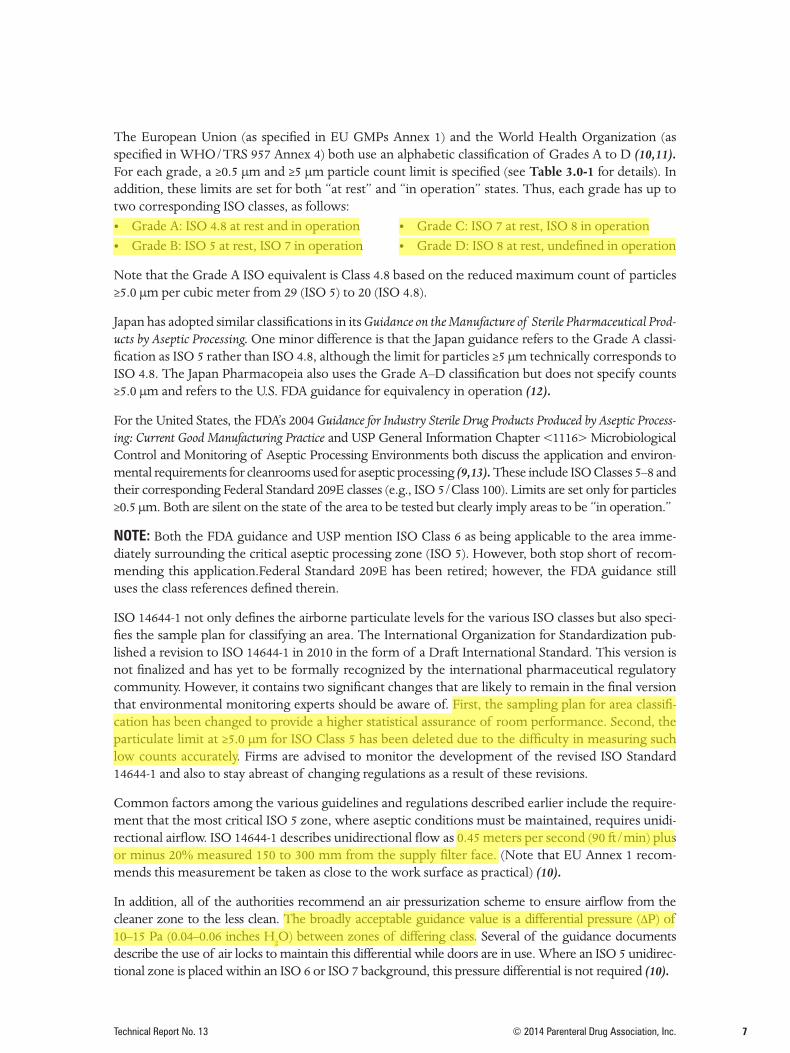
The European Union (as specified in EU GMPs Annex 1) and the World Health Organization (as specified in WHO/TRS 957 Annex 4) both use an alphabetic classification of Grades A to D (10,11). For each grade, a ≥0.5 µm and ≥5 µm particle count limit is specified (see Table 3.0-1 for details). In addition, these limits are set for both “at rest” and “in operation” states. Thus, each grade has up to two corresponding ISO classes, as follows: • Grade A: ISO 4.8 at rest and in operation• Grade B: ISO 5 at rest, ISO 7 in operation
• Grade C: ISO 7 at rest, ISO 8 in operation• Grade D: ISO 8 at rest, undefined in operation
Note that the Grade A ISO equivalent is Class 4.8 based on the reduced maximum count of particles ≥5.0 μm per cubic meter from 29 (ISO 5) to 20 (ISO 4.8).
Japan has adopted similar classifications in its Guidance on the Manufacture of Sterile Pharmaceutical Prod-ucts by Aseptic Processing. One minor difference is that the Japan guidance refers to the Grade A classi-fication as ISO 5 rather than ISO 4.8, although the limit for particles ≥5 µm technically corresponds to ISO 4.8. The Japan Pharmacopeia also uses the Grade A–D classification but does not specify counts ≥5.0 µm and refers to the U.S. FDA guidance for equivalency in operation (12).
For the United States, the FDA’s 2004 Guidance for Industry Sterile Drug Products Produced by Aseptic Process-ing: Current Good Manufacturing Practice and USP General Information Chapter <1116> Microbiological Control and Monitoring of Aseptic Processing Environments both discuss the application and environ-mental requirements for cleanrooms used for aseptic processing (9,13). These include ISO Classes 5–8 and their corresponding Federal Standard 209E classes (e.g., ISO 5/Class 100). Limits are set only for particles ≥0.5 µm. Both are silent on the state of the area to be tested but clearly imply areas to be “in operation.”
NOTE: Both the FDA guidance and USP mention ISO Class 6 as being applicable to the area imme-diately surrounding the critical aseptic processing zone (ISO 5). However, both stop short of recom-mending this application.Federal Standard 209E has been retired; however, the FDA guidance still uses the class references defined therein.
ISO 14644-1 not only defines the airborne particulate levels for the various ISO classes but also speci-fies the sample plan for classifying an area. The International Organization for Standardization pub-lished a revision to ISO 14644-1 in 2010 in the form of a Draft International Standard. This version is not finalized and has yet to be formally recognized by the international pharmaceutical regulatory community. However, it contains two significant changes that are likely to remain in the final version that environmental monitoring experts should be aware of. First, the sampling plan for area classifi-cation has been changed to provide a higher statistical assurance of room performance. Second, the particulate limit at ≥5.0 µm for ISO Class 5 has been deleted due to the difficulty in measuring such low counts accurately. Firms are advised to monitor the development of the revised ISO Standard 14644-1 and also to stay abreast of changing regulations as a result of these revisions.
Common factors among the various guidelines and regulations described earlier include the require-ment that the most critical ISO 5 zone, where aseptic conditions must be maintained, requires unidi-rectional airflow. ISO 14644-1 describes unidirectional flow as 0.45 meters per second (90 ft/min) plus or minus 20% measured 150 to 300 mm from the supply filter face. (Note that EU Annex 1 recom-mends this measurement be taken as close to the work surface as practical) (10).
In addition, all of the authorities recommend an air pressurization scheme to ensure airflow from the cleaner zone to the less clean. The broadly acceptable guidance value is a differential pressure (ΔP) of 10–15 Pa (0.04–0.06 inches H2O) between zones of differing class. Several of the guidance documents describe the use of air locks to maintain this differential while doors are in use. Where an ISO 5 unidirec-tional zone is placed within an ISO 6 or ISO 7 background, this pressure differential is not required (10).
8 © 2014 Parenteral Drug Association, Inc. Technical Report No. 13
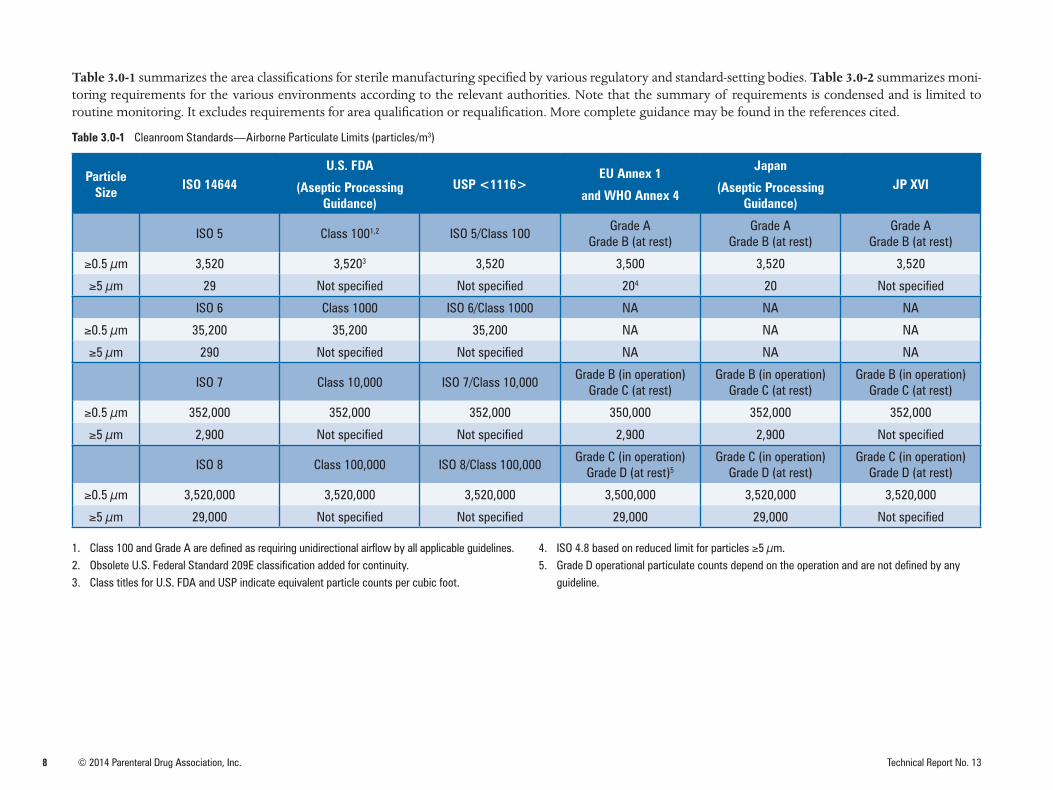
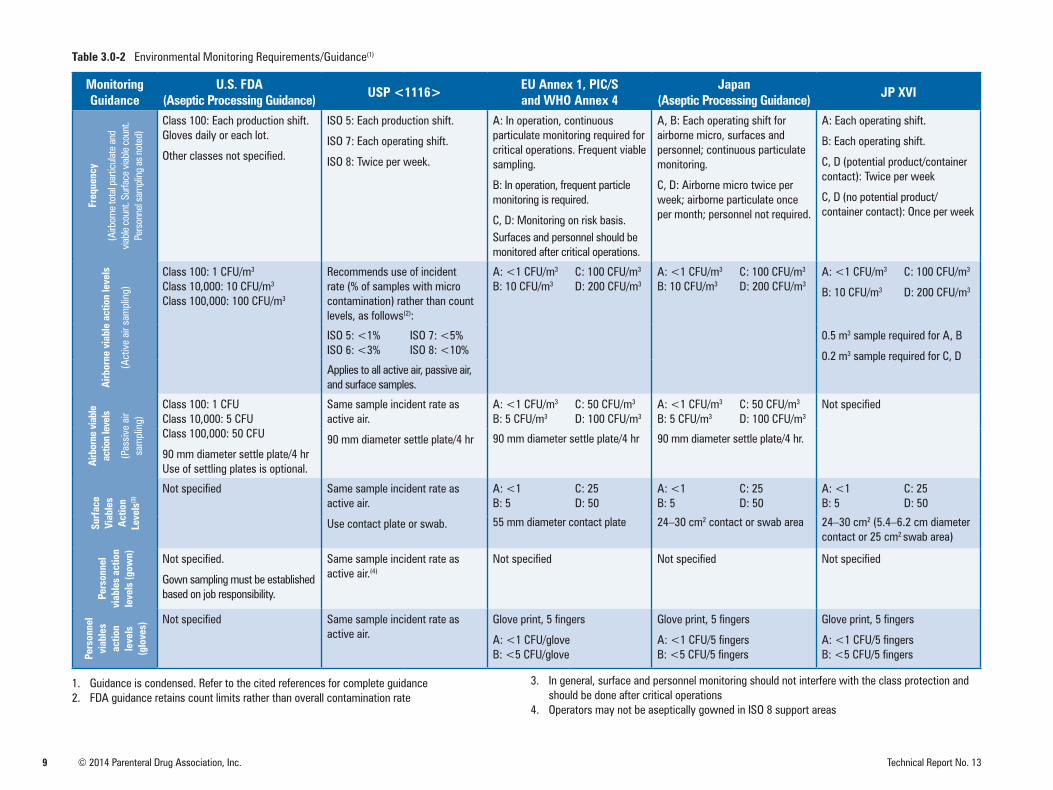
Table 3.0-1 summarizes the area classifications for sterile manufacturing specified by various regulatory and standard-setting bodies. Table 3.0-2 summarizes moni-toring requirements for the various environments according to the relevant authorities. Note that the summary of requirements is condensed and is limited to routine monitoring. It excludes requirements for area qualification or requalification. More complete guidance may be found in the references cited.
Table 3.0-1 Cleanroom Standards—Airborne Particulate Limits (particles/m3)
Particle Size ISO 14644
U.S. FDA
(Aseptic Processing Guidance)
USP <1116>EU Annex 1
and WHO Annex 4
Japan
(Aseptic Processing Guidance)
JP XVI
ISO 5 Class 1001,2 ISO 5/Class 100Grade A
Grade B (at rest)Grade A
Grade B (at rest)Grade A
Grade B (at rest)
≥0.5 µm 3,520 3,5203 3,520 3,500 3,520 3,520
≥5 µm 29 Not specified Not specified 204 20 Not specified
ISO 6 Class 1000 ISO 6/Class 1000 NA NA NA
≥0.5 µm 35,200 35,200 35,200 NA NA NA
≥5 µm 290 Not specified Not specified NA NA NA
ISO 7 Class 10,000 ISO 7/Class 10,000Grade B (in operation)
Grade C (at rest)Grade B (in operation)
Grade C (at rest)Grade B (in operation)
Grade C (at rest)
≥0.5 µm 352,000 352,000 352,000 350,000 352,000 352,000
≥5 µm 2,900 Not specified Not specified 2,900 2,900 Not specified
ISO 8 Class 100,000 ISO 8/Class 100,000Grade C (in operation)
Grade D (at rest)5Grade C (in operation)
Grade D (at rest)Grade C (in operation)
Grade D (at rest)
≥0.5 µm 3,520,000 3,520,000 3,520,000 3,500,000 3,520,000 3,520,000
≥5 µm 29,000 Not specified Not specified 29,000 29,000 Not specified
1. Class 100 and Grade A are defined as requiring unidirectional airflow by all applicable guidelines.2. Obsolete U.S. Federal Standard 209E classification added for continuity.3. Class titles for U.S. FDA and USP indicate equivalent particle counts per cubic foot.
4. ISO 4.8 based on reduced limit for particles ≥5 µm.5. Grade D operational particulate counts depend on the operation and are not defined by any
guideline.
9 © 2014 Parenteral Drug Association, Inc. Technical Report No. 13
Table 3.0-2 Environmental Monitoring Requirements/Guidance(1)
Monitoring Guidance
U.S. FDA(Aseptic Processing Guidance) USP <1116> EU Annex 1, PIC/S
and WHO Annex 4Japan
(Aseptic Processing Guidance) JP XVIFr
eque
ncy
(Airb
orne
tota
l par
ticula
te a
nd
viabl
e co
unt.
Surfa
ce v
iable
coun
t. Pe
rson
nel s
ampl
ing
as n
oted
)
Class 100: Each production shift. Gloves daily or each lot.
Other classes not specified.
ISO 5: Each production shift.
ISO 7: Each operating shift.
ISO 8: Twice per week.
A: In operation, continuous particulate monitoring required for critical operations. Frequent viable sampling.
B: In operation, frequent particle monitoring is required.
C, D: Monitoring on risk basis.Surfaces and personnel should be monitored after critical operations.
A, B: Each operating shift for airborne micro, surfaces and personnel; continuous particulate monitoring.
C, D: Airborne micro twice per week; airborne particulate once per month; personnel not required.
A: Each operating shift.
B: Each operating shift.
C, D (potential product/container contact): Twice per week
C, D (no potential product/container contact): Once per week
Airb
orne
via
ble
actio
n le
vels
(Act
ive
air s
ampl
ing)
Class 100: 1 CFU/m3
Class 10,000: 10 CFU/m3
Class 100,000: 100 CFU/m3
Recommends use of incident rate (% of samples with micro contamination) rather than count levels, as follows(2):
A: <1 CFU/m3
B: 10 CFU/m3
C: 100 CFU/m3
D: 200 CFU/m3
A: <1 CFU/m3
B: 10 CFU/m3
C: 100 CFU/m3
D: 200 CFU/m3
A: <1 CFU/m3
B: 10 CFU/m3
C: 100 CFU/m3
D: 200 CFU/m3
ISO 5: <1%ISO 6: <3%
ISO 7: <5%ISO 8: <10%
0.5 m3 sample required for A, B
0.2 m3 sample required for C, DApplies to all active air, passive air, and surface samples.
Airb
orne
via
ble
actio
n le
vels
(Pas
sive
air
sam
plin
g)
Class 100: 1 CFUClass 10,000: 5 CFUClass 100,000: 50 CFU
90 mm diameter settle plate/4 hrUse of settling plates is optional.
Same sample incident rate as active air.
90 mm diameter settle plate/4 hr
A: <1 CFU/m3
B: 5 CFU/m3
C: 50 CFU/m3
D: 100 CFU/m3
A: <1 CFU/m3
B: 5 CFU/m3
C: 50 CFU/m3
D: 100 CFU/m3
Not specified
90 mm diameter settle plate/4 hr 90 mm diameter settle plate/4 hr.
Surf
ace
Viab
les
Act
ion
Leve
ls(3
)
Not specified Same sample incident rate as active air.
Use contact plate or swab.
A: <1 B: 5
C: 25D: 50
A: <1 B: 5
C: 25D: 50
A: <1 B: 5
C: 25D: 50
55 mm diameter contact plate 24–30 cm2 contact or swab area 24–30 cm2 (5.4–6.2 cm diameter contact or 25 cm2 swab area)
Pers
onne
l vi
able
s ac
tion
leve
ls (g
own) Not specified.
Gown sampling must be established based on job responsibility.
Same sample incident rate as active air.(4)
Not specified Not specified Not specified
Pers
onne
l vi
able
s ac
tion
leve
ls
(glo
ves)
Not specified Same sample incident rate as active air.
Glove print, 5 fingers
A: <1 CFU/gloveB: <5 CFU/glove
Glove print, 5 fingers
A: <1 CFU/5 fingersB: <5 CFU/5 fingers
Glove print, 5 fingers
A: <1 CFU/5 fingersB: <5 CFU/5 fingers
1. Guidance is condensed. Refer to the cited references for complete guidance2. FDA guidance retains count limits rather than overall contamination rate
3. In general, surface and personnel monitoring should not interfere with the class protection andshould be done after critical operations
4. Operators may not be aseptically gowned in ISO 8 support areas
10 © 2014 Parenteral Drug Association, Inc. Technical Report No. 13
4.0 Environmental Monitoring
The data regarding environmental contaminants should be collected in conformance with current Good Manufacturing Practices (cGMP), which states that the personnel supervising the environmental monitor-ing program should be competent in the scientific discipline and have appropriate training and authority. Equipment used should be calibrated, systems should be appropriately validated, media should be properly qualified, prepared, and tested, and all operational procedures should be written and followed with appropri-ate controls to support their use. The methods selected should be justified for use as appropriate.
Procedures should include appropriate controls to support their use. Cleaning, sanitization or dis-infection, site selection, and frequency of testing are the key components to a good environmental monitoring program. Establishment of alert and action levels may be based on individual sample sites, groups of related sample sites, or the maximum number of excursions per area or system. Data obtained are subject to continual review, and alert and action decisions are made by designated, authorized personnel qualified to make such decisions. To effectively execute microbiological surveil-lance support systems, a documented system should be in place for identifying excursions and adverse trends; in addition, a feedback mechanism should be implemented for verification of effectiveness of any action taken in response to data. All data should be documented and trended.
[Publisher’s Note: Additional information can be found in many published works on environmental monitoring. This chapter draws heavily on information found in the Bibliography, specifically numbers 1-41; see 7.0 Bibliography.]
4.1 Cleaning and Sanitization or DisinfectionImplementation of cleaning and sanitization procedures is a critical component of overall contami-nation control within a facility. A common use of facility environmental monitoring data over time is determining the present and continued effectiveness of the cleaning and sanitization agents and procedures.
It is common knowledge that the ideal cleaning agent does not exist. Generally, the three categories of sanitizing agents are sanitizers, disinfectants, and sporicides, which are commonly referred to as either sanitizers or disinfectants. However, sanitizers, disinfectants, and sporicides, although similar, vary in their level of destruction of microorganisms. The ability of the agent to destroy specific levels of microorganisms is based on the strength of the agent and the contact time for which the surfaces remain wetted (dry time). However, normal wetted times on hard, nonporous surfaces in cleanroom operations typically range from two to ten minutes.
Sanitizers (low-level disinfectants) reduce some level of microbial contamination and are the least ef-fective agents (1). Common sanitizers include isopropyl alcohol (e.g., 70% IPA), ethyl alcohol or etha-nol (e.g., 62% EtOH), and low active levels of hydrogen peroxide (e.g., below 3% H2O2). Sanitizers are effective against some level of vegetative cells but are ineffective against bacterial spores.
Per USP <1072>, the order of resistance to disinfectants and sporicides from least to greatest is (2):
Vegetative cells g Fungal spores g Bacterial spores
Disinfectants reduce higher levels of vegetative microorganisms than sanitizers depending on the strength and contact time. Common disinfectants include phenols, quaternary ammonium com-pounds, and hydrogen peroxide (above 3% is used for disinfection; however, above 30% is also used as a sterilant). Disinfectants that are not also classified as sporicides have a very limited ability, if any, to destroy bacterial spores.
Sporicides are effective against all microorganisms provided the required wetted or vapor contact
11Technical Report No. 13 © 2014 Parenteral Drug Association, Inc.
time is achieved. This includes vegetative microorganisms and spores. Common sporicides include sodium hypochlorite, peracetic acid, and hydrogen peroxide (6% or greater). Sporicides may be cor-rosive to equipment (e.g., acidified bleach or peracetic acid and hydrogen peroxide on stainless steel) and should be used sparingly at a reduced frequency than sanitizers and disinfectants unless it is part of a validated process, for example, chamber surface decontamination with VHP. The negative effects of sporicides can be mitigated by subsequent rinse with a sterile solution such as isopropyl alcohol or water. Selection of sporicidal agents should incorporate an evaluation process that validates the required contact time, type of microorganisms that are to be eliminated, efficacy, type of surface to be treated, toxicity levels, residue, and means of application.
Qualification of established cleaning and disinfection procedures should demonstrate microbial re-duction and maintenance of a microbiological state of control and provide confidence in the proce-dures’ effectiveness. This typically includes laboratory carrier studies for contact time and reduction and is possibly supplemented by in-situ studies. An in-situ study validates the efficacy of the agent used, the appropriateness of the cleaning and sanitization SOP, and the effectiveness of training of personnel in actual use conditions.
In-situ studies encompass monitoring of an unclean and unsanitized area (dirty) and subsequent monitoring again after cleaning and sanitization of the area for a defined period. The dirtied area does not imply that microorganisms are specifically introduced into the controlled or classified en-vironment. Typically the dirty environment is achieved as a result of use of the room, either before cleaning or after major construction or facility maintenance. The goal is to demonstrate that routine cleaning and sanitization procedures performed by trained cleaning personnel consistently result in microbial control and prove that the cleaning procedure is suitable for the intended use of the area.
It is recommended to periodically review challenge testing of the selected sanitizers, disinfectants, and sporicides if representative new isolates are routinely recovered in the environmental monitoring pro-gram. This supports the effectiveness of the sanitizer, disinfectant, or sporicide on new contaminants discovered in operations. The periodic alternation of disinfectant and sporicidal agent application is a common industry practice. For example, a rotation of two disinfectants in the same classification (such as a high pH phenol to a low pH phenol) is not considered to be as effective as alternating a disinfectant with a sporicidal agent. However, the environmental monitoring data provide continuous verification of effectiveness of the cleaning and sanitizing agents pertaining to the specific environment.
USP <1072> recommends the criteria for the efficacy studies for general-purpose disinfectants must demonstrate at least a three-log reduction for all vegetative cells and a two-log reduction for spore-formers (2).
For a comprehensive report on cleaning and sanitization, please refer to PDA Technical Report No. 29: Points to Consider for Cleaning Validation (14).
12 © 2014 Parenteral Drug Association, Inc. Technical Report No. 13
4.2 Sample Site SelectionSuitable sample sites vary widely depending on the cleanroom design and manufacturing process. Careful evaluation of each process should be made in selecting sites. A documented risk assessment for the selection of the sites should be performed. Some examples of risk factors to consider in select-ing sites for routine surveillance are as follows:
1. Sites or processes in which microbial contamination would most likely have an adverse effect onproduct quality
2. Sites that would most likely demonstrate the heaviest microbial proliferation during actual production
3. Whether site selection should involve a statistical design or should be made on the basis of gridprofiling
4. Whether routine monitoring sites should be rotated
5. Sites that represent the most inaccessible or difficult areas to clean and disinfect
6. Modes of microbe dispersal in the environment
7. Sampling at a given site that may disturb the environment sufficiently to cause erroneous data tobe collected or to contaminate product
Additional considerations apply to specific types of monitoring, which are described in the individual monitoring sections of this document.
The primary purpose of sampling should be to provide meaningful interpretable data that can help identify actual or potential contamination problems associated with specific procedures, equipment, materials, and processes. However, selection of sampling locations should also take into consider-ation that the sampling process by itself should not cause product contamination. One should be able to sample those sites most likely to result in product contamination if they become contaminated. However, it may be prudent to identify indicator sites that are in proximity to the process where the product is exposed to the environment but not intrusive to the process in dynamic conditions or not in direct contact with product until production has been completed.
Facility design is a crucial component of a good environmental control. Documents like the ISPE Baseline Guide, Vol. 3: Sterile Product Manufacturing Facilities describes the design, construction, com-missioning, and qualification for sterile manufacturing facilities (15). Similar baseline guides are avail-able for other types of product manufacturing.
Grid profiling can be useful to demonstrate that a cleanroom meets its engineering design parameters for classification purposes (8). Grid profiling may not be sufficient to use in establishing sample sites and should be accompanied with risk assessment. It may be useful to perform some grid profiling on new or remodeled facilities to ensure that the assumptions made as part of the risk assessment proce-dure were valid. Changes to the room or area should include a reassessment of the area to determine the appropriateness of the sampling sites used or chosen.
To establish routine sample sites, action and alert levels, and testing frequency, one should take into consideration the needs of the process, the extent of contact or exposure and activity level that each element of the manufacturing environment has with the product, and the applicable regulatory guid-ance. Sites having greater opportunity for contributing bioburden to the product should be sampled and monitored. Elements that are likely to contact product include compressed gases, room air, man-ufacturing equipment, tools, critical surfaces, storage containers, conveyors, gloved hands of person-nel, aseptic connections, filtration aids, sterile garments, and water. Examples of non-product-contact
13Technical Report No. 13 © 2014 Parenteral Drug Association, Inc.
elements include walls, floors, ceilings, doors, benches, chairs, test instruments, and pass-throughs.
The number of samples selected will depend on the area classification, what processes are taking place in that area, process-material and personnel flow, level of activity, size of the area, and, lastly, the applicable regulatory guidance. Use of risk analysis provides an objective basis for the number of sites selected that demonstrates an overall state of control or helps in determining the potential contamination problems.
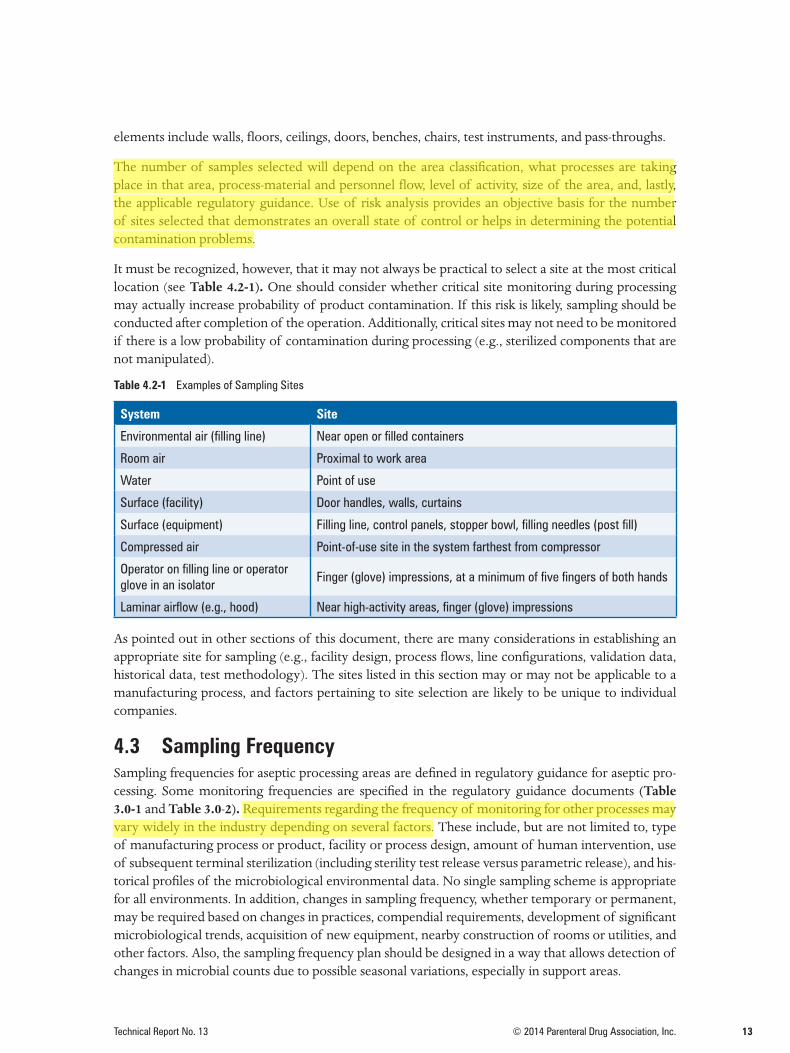
It must be recognized, however, that it may not always be practical to select a site at the most critical location (see Table 4.2-1). One should consider whether critical site monitoring during processing may actually increase probability of product contamination. If this risk is likely, sampling should be conducted after completion of the operation. Additionally, critical sites may not need to be monitored if there is a low probability of contamination during processing (e.g., sterilized components that are not manipulated).
Table 4.2-1 Examples of Sampling Sites
System Site
Environmental air (filling line) Near open or filled containers
Room air Proximal to work area
Water Point of use
Surface (facility) Door handles, walls, curtains
Surface (equipment) Filling line, control panels, stopper bowl, filling needles (post fill)
Compressed air Point-of-use site in the system farthest from compressor
Operator on filling line or operator glove in an isolator
Finger (glove) impressions, at a minimum of five fingers of both hands
Laminar airflow (e.g., hood) Near high-activity areas, finger (glove) impressions
As pointed out in other sections of this document, there are many considerations in establishing an appropriate site for sampling (e.g., facility design, process flows, line configurations, validation data, historical data, test methodology). The sites listed in this section may or may not be applicable to a manufacturing process, and factors pertaining to site selection are likely to be unique to individual companies.
4.3 Sampling FrequencySampling frequencies for aseptic processing areas are defined in regulatory guidance for aseptic pro-cessing. Some monitoring frequencies are specified in the regulatory guidance documents (Table 3.0-1 and Table 3.0-2). Requirements regarding the frequency of monitoring for other processes may vary widely in the industry depending on several factors. These include, but are not limited to, type of manufacturing process or product, facility or process design, amount of human intervention, use of subsequent terminal sterilization (including sterility test release versus parametric release), and his-torical profiles of the microbiological environmental data. No single sampling scheme is appropriate for all environments. In addition, changes in sampling frequency, whether temporary or permanent, may be required based on changes in practices, compendial requirements, development of significant microbiological trends, acquisition of new equipment, nearby construction of rooms or utilities, and other factors. Also, the sampling frequency plan should be designed in a way that allows detection of changes in microbial counts due to possible seasonal variations, especially in support areas.
14 © 2014 Parenteral Drug Association, Inc. Technical Report No. 13
A key goal is to select monitoring frequencies that can identify potential system deficiencies and that reflect the risk of product contamination. The test frequency per site may be less than the system or area frequency (e.g., one may choose to rotate sample sites).
Prior to reducing sampling frequency, a risk-based assessment should be conducted that includes a summary of historical data along with current and proposed sampling frequencies. The risk assess-ment should be reviewed and approved by the appropriate quality assurance personnel. After reduc-tion, data should be reviewed periodically to determine if the reduced sampling frequency is still appropriate.
4.4 Alert and Action LevelsEnvironmental monitoring programs require action levels to be established based on the applicable guidelines or requirements. These guidelines frequently recommend alert levels also be established. Some companies also choose to set levels for individual cleanrooms or sample sites. Typically, the action levels will be driven by the regulatory or industry guidelines. The alert levels will be driven by historical analysis of the environmental monitoring data.
Alert and action levels have been eliminated from USP <1116> with support from both regulatory and industry representatives. This may indicate a paradigm shift from alert and action levels to inci-dent rate. At this time, however, companies are advised to monitor both parameters because official regulatory guidance from the European Union and the United States still retain GMP requirements for alert and action levels, which are different from incident rates outlined in USP <1116> (9). In light of this, companies may need to monitor incident rates as well as alert and action levels. The incident rate is the rate at which environmental samples are found to have microbial contamination (e.g., an incident rate of 1% would mean that only 1% of the samples taken had contamination, regardless of colony numbers) (9). The incident rate approach may lend itself to wider applicability considering emerging environmental monitoring technologies, such as those not reliant on CFU measurement.
The application of alert or action levels should be written and employed in a consistent, nonarbitrary manner. To create consistency in treatment of alert and action levels, logical investigatory and correc-tive action steps should be specified in advance. Records should show that the excursion was recog-nized, appropriate follow-up occurred, and appropriate preventive actions were taken.
Once levels have been established, they should be periodically reviewed, as part of routine trend analysis. They may be revised to reflect improvements, advances in technology, changes in use pat-terns, or other changes.
When no regulatory or industry guidelines are provided, alert and action levels may be derived sta-tistically from historical data. Other considerations in adjusting levels include process capability, consistency of alert and action levels for similar room classifications, level of gowning, and product contamination risk. An occasional excursion from these levels is to be expected at frequencies charac-teristic for the specific mathematical model utilized in their derivation. In some situations, only one level may be employed, with any excursions triggering action. In other instances, a level may be used, with a single excursion eliciting an alert- or action-level response and multiple or sequential deviations requiring action.
The alert and action levels do not define product attributes such as sterility and therefore should not be considered as product specification or extension to the product specification. Rather, they are in-tended to indicate changes so that corrective action may be taken before product quality is adversely affected. Not all situations require use of both alert and action levels.
15Technical Report No. 13 © 2014 Parenteral Drug Association, Inc.
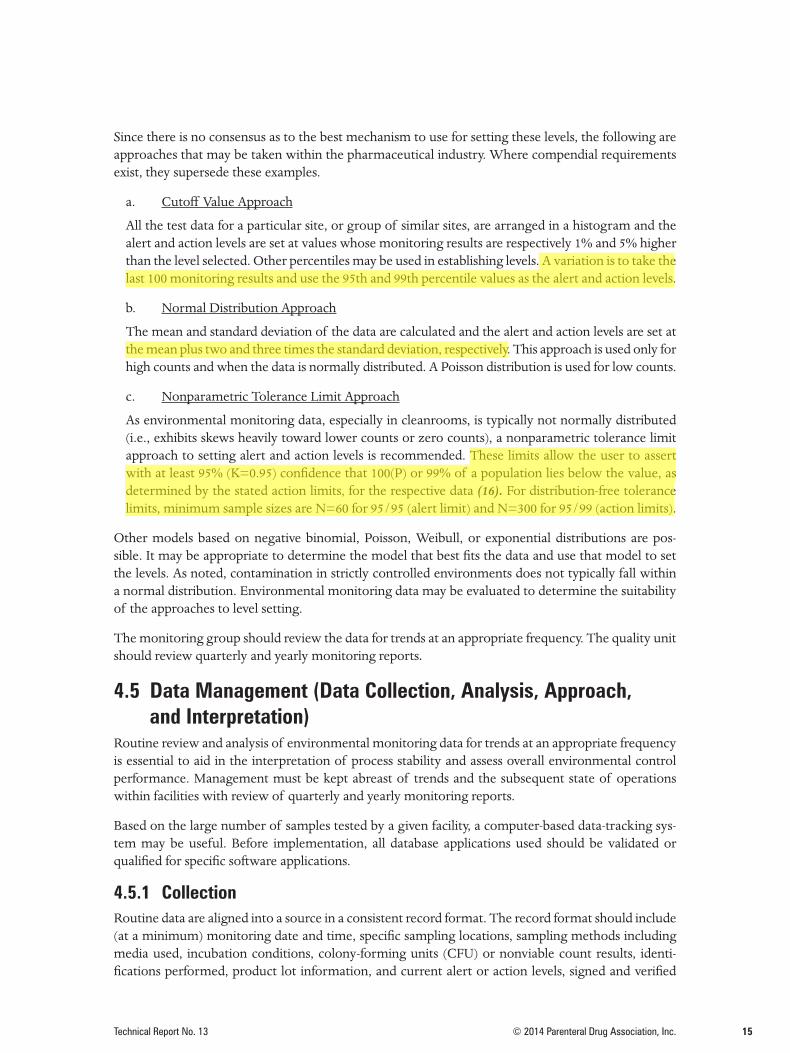
Since there is no consensus as to the best mechanism to use for setting these levels, the following are approaches that may be taken within the pharmaceutical industry. Where compendial requirements exist, they supersede these examples.
a. Cutoff Value Approach
All the test data for a particular site, or group of similar sites, are arranged in a histogram and the alert and action levels are set at values whose monitoring results are respectively 1% and 5% higher than the level selected. Other percentiles may be used in establishing levels. A variation is to take the last 100 monitoring results and use the 95th and 99th percentile values as the alert and action levels.
b. Normal Distribution Approach
The mean and standard deviation of the data are calculated and the alert and action levels are set at the mean plus two and three times the standard deviation, respectively. This approach is used only for high counts and when the data is normally distributed. A Poisson distribution is used for low counts.
c. Nonparametric Tolerance Limit Approach
As environmental monitoring data, especially in cleanrooms, is typically not normally distributed (i.e., exhibits skews heavily toward lower counts or zero counts), a nonparametric tolerance limit approach to setting alert and action levels is recommended. These limits allow the user to assert with at least 95% (K=0.95) confidence that 100(P) or 99% of a population lies below the value, as determined by the stated action limits, for the respective data (16). For distribution-free tolerance limits, minimum sample sizes are N=60 for 95/95 (alert limit) and N=300 for 95/99 (action limits).
Other models based on negative binomial, Poisson, Weibull, or exponential distributions are pos-sible. It may be appropriate to determine the model that best fits the data and use that model to set the levels. As noted, contamination in strictly controlled environments does not typically fall within a normal distribution. Environmental monitoring data may be evaluated to determine the suitability of the approaches to level setting.
The monitoring group should review the data for trends at an appropriate frequency. The quality unit should review quarterly and yearly monitoring reports.
4.5 Data Management (Data Collection, Analysis, Approach, and Interpretation)
Routine review and analysis of environmental monitoring data for trends at an appropriate frequency is essential to aid in the interpretation of process stability and assess overall environmental control performance. Management must be kept abreast of trends and the subsequent state of operations within facilities with review of quarterly and yearly monitoring reports.
Based on the large number of samples tested by a given facility, a computer-based data-tracking sys-tem may be useful. Before implementation, all database applications used should be validated or qualified for specific software applications.
4.5.1 CollectionRoutine data are aligned into a source in a consistent record format. The record format should include (at a minimum) monitoring date and time, specific sampling locations, sampling methods including media used, incubation conditions, colony-forming units (CFU) or nonviable count results, identi-fications performed, product lot information, and current alert or action levels, signed and verified
16 © 2014 Parenteral Drug Association, Inc. Technical Report No. 13
by the appropriate person, depending on the type of system used. Some alternative microbiological methods can use different measurements than CFUs, provided that they have been properly validated before use, for example, relative light units, cells, and so forth. A manual data entry or image scanner system with advantages of speed and accuracy can be used to populate tables. Regardless of the type of system used, data integrity must be verified prior to analysis.
4.5.2 Analysis Trending is expected by regulatory agencies. Histograms or tables characterized by a number of data points that fall within a common frequency are valuable tools. Different room classifications with defined require-ments will produce different histograms. For example, the CFU spread obtained across an ISO 8 data set will not be observed in a data set from an ISO 5 area. Therefore, each area (or area type) and accompanying data set must be viewed as distinct. A mathematical model could be applied with not only the objective but also the type of data to be analyzed in mind. Examples of statistical methods and control charts can be found in PDA Technical Report 59: Utilization of Statistical Methods for Production Monitoring and in the article by Hus-song and Madsen, Analysis of Environmental Microbiology Data from Cleanroom Samples (17,18).
4.5.3 InterpretationRoutine environmental microbial monitoring data should demonstrate that the classified area is op-erating in adequate microbial control for the needs of operations conducted in that area. Data gener-ated should be summarized and evaluated to determine whether the environmental monitoring pro-cess is in a state of control. A variety of methods are available to perform this analysis, for example, use of control charts, statistical analysis, and so forth.
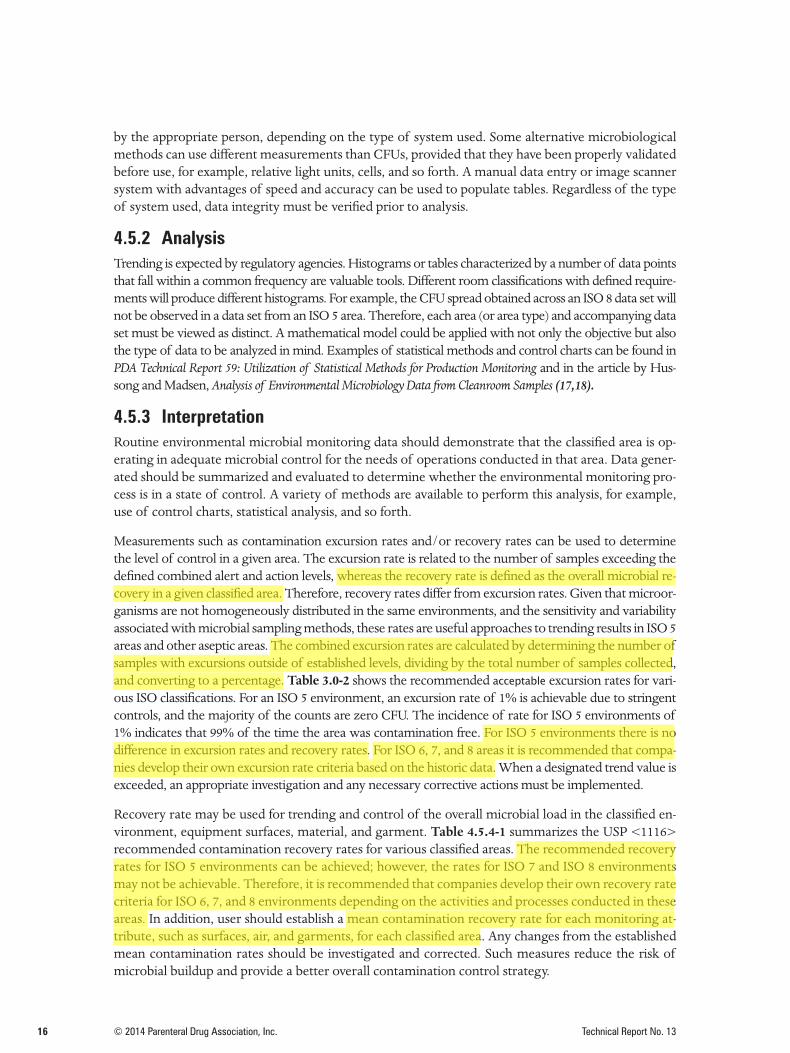
Measurements such as contamination excursion rates and/or recovery rates can be used to determine the level of control in a given area. The excursion rate is related to the number of samples exceeding the defined combined alert and action levels, whereas the recovery rate is defined as the overall microbial re-covery in a given classified area. Therefore, recovery rates differ from excursion rates. Given that microor-ganisms are not homogeneously distributed in the same environments, and the sensitivity and variability associated with microbial sampling methods, these rates are useful approaches to trending results in ISO 5 areas and other aseptic areas. The combined excursion rates are calculated by determining the number of samples with excursions outside of established levels, dividing by the total number of samples collected, and converting to a percentage. Table 3.0-2 shows the recommended acceptable excursion rates for vari-ous ISO classifications. For an ISO 5 environment, an excursion rate of 1% is achievable due to stringent controls, and the majority of the counts are zero CFU. The incidence of rate for ISO 5 environments of 1% indicates that 99% of the time the area was contamination free. For ISO 5 environments there is no difference in excursion rates and recovery rates. For ISO 6, 7, and 8 areas it is recommended that compa-nies develop their own excursion rate criteria based on the historic data. When a designated trend value is exceeded, an appropriate investigation and any necessary corrective actions must be implemented.
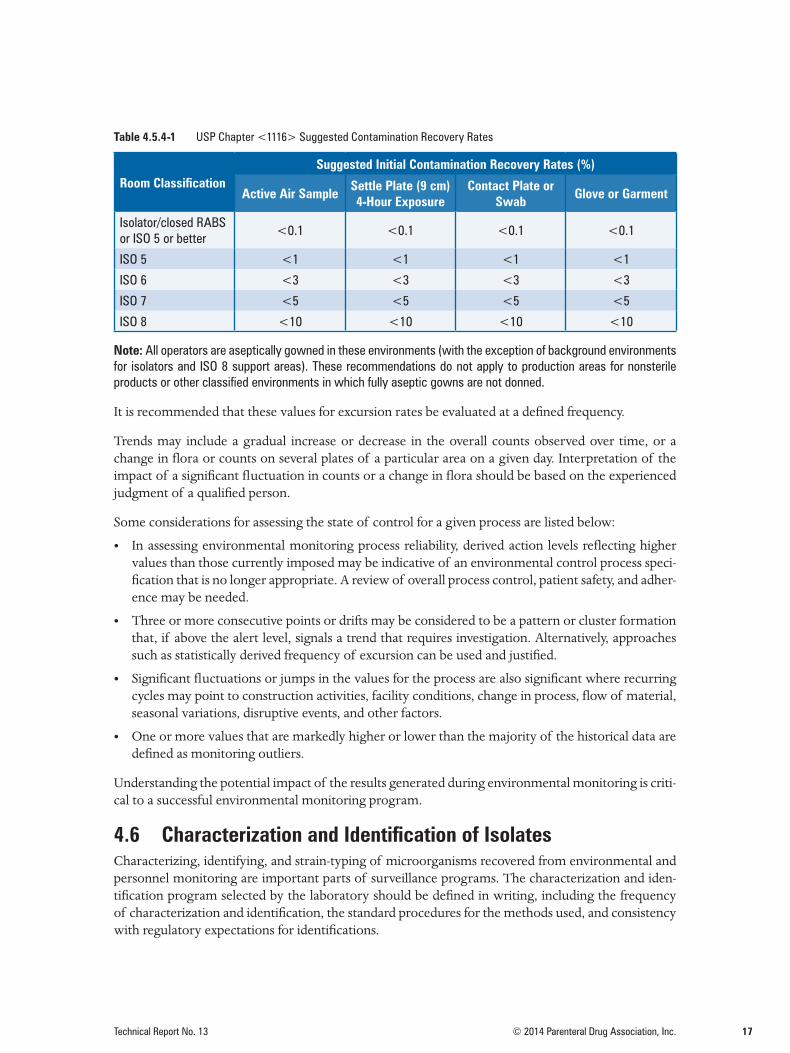
Recovery rate may be used for trending and control of the overall microbial load in the classified en-vironment, equipment surfaces, material, and garment. Table 4.5.4-1 summarizes the USP <1116> recommended contamination recovery rates for various classified areas. The recommended recovery rates for ISO 5 environments can be achieved; however, the rates for ISO 7 and ISO 8 environments may not be achievable. Therefore, it is recommended that companies develop their own recovery rate criteria for ISO 6, 7, and 8 environments depending on the activities and processes conducted in these areas. In addition, user should establish a mean contamination recovery rate for each monitoring at-tribute, such as surfaces, air, and garments, for each classified area. Any changes from the established mean contamination rates should be investigated and corrected. Such measures reduce the risk of microbial buildup and provide a better overall contamination control strategy.
17Technical Report No. 13 © 2014 Parenteral Drug Association, Inc.
Table 4.5.4-1 USP Chapter <1116> Suggested Contamination Recovery Rates
Room ClassificationSuggested Initial Contamination Recovery Rates (%)
Active Air Sample Settle Plate (9 cm) 4-Hour Exposure
Contact Plate or Swab Glove or Garment
Isolator/closed RABS or ISO 5 or better
<0.1 <0.1 <0.1 <0.1
ISO 5 <1 <1 <1 <1
ISO 6 <3 <3 <3 <3
ISO 7 <5 <5 <5 <5
ISO 8 <10 <10 <10 <10
Note: All operators are aseptically gowned in these environments (with the exception of background environments for isolators and ISO 8 support areas). These recommendations do not apply to production areas for nonsterile products or other classified environments in which fully aseptic gowns are not donned.
It is recommended that these values for excursion rates be evaluated at a defined frequency.
Trends may include a gradual increase or decrease in the overall counts observed over time, or a change in flora or counts on several plates of a particular area on a given day. Interpretation of the impact of a significant fluctuation in counts or a change in flora should be based on the experienced judgment of a qualified person.
Some considerations for assessing the state of control for a given process are listed below:
• In assessing environmental monitoring process reliability, derived action levels reflecting highervalues than those currently imposed may be indicative of an environmental control process speci-fication that is no longer appropriate. A review of overall process control, patient safety, and adher-ence may be needed.
• Three or more consecutive points or drifts may be considered to be a pattern or cluster formationthat, if above the alert level, signals a trend that requires investigation. Alternatively, approachessuch as statistically derived frequency of excursion can be used and justified.
• Significant fluctuations or jumps in the values for the process are also significant where recurringcycles may point to construction activities, facility conditions, change in process, flow of material,seasonal variations, disruptive events, and other factors.
• One or more values that are markedly higher or lower than the majority of the historical data aredefined as monitoring outliers.
Understanding the potential impact of the results generated during environmental monitoring is criti-cal to a successful environmental monitoring program.
4.6 Characterization and Identification of Isolates Characterizing, identifying, and strain-typing of microorganisms recovered from environmental and personnel monitoring are important parts of surveillance programs. The characterization and iden-tification program selected by the laboratory should be defined in writing, including the frequency of characterization and identification, the standard procedures for the methods used, and consistency with regulatory expectations for identifications.
18 © 2014 Parenteral Drug Association, Inc. Technical Report No. 13
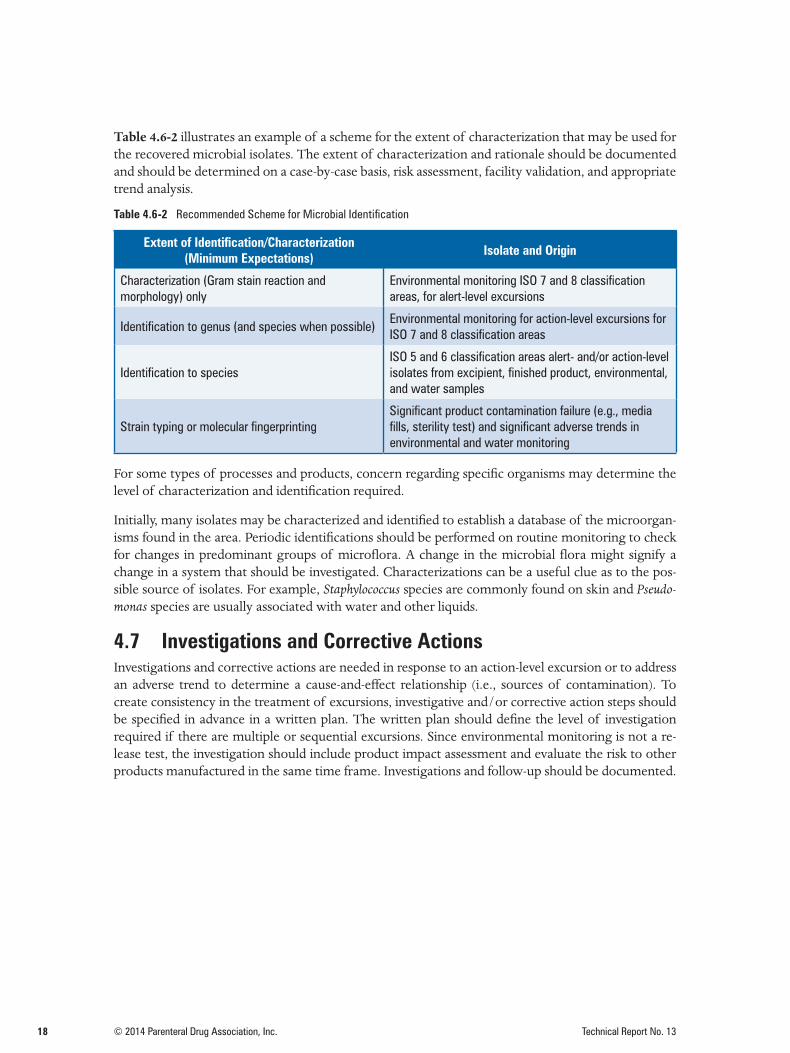
Table 4.6-2 illustrates an example of a scheme for the extent of characterization that may be used for the recovered microbial isolates. The extent of characterization and rationale should be documented and should be determined on a case-by-case basis, risk assessment, facility validation, and appropriate trend analysis.
Table 4.6-2 Recommended Scheme for Microbial Identification
Extent of Identification/Characterization (Minimum Expectations) Isolate and Origin
Characterization (Gram stain reaction and morphology) only
Environmental monitoring ISO 7 and 8 classification areas, for alert-level excursions
Identification to genus (and species when possible)Environmental monitoring for action-level excursions for ISO 7 and 8 classification areas
Identification to species ISO 5 and 6 classification areas alert- and/or action-level isolates from excipient, finished product, environmental, and water samples
Strain typing or molecular fingerprintingSignificant product contamination failure (e.g., media fills, sterility test) and significant adverse trends in environmental and water monitoring
For some types of processes and products, concern regarding specific organisms may determine the level of characterization and identification required.
Initially, many isolates may be characterized and identified to establish a database of the microorgan-isms found in the area. Periodic identifications should be performed on routine monitoring to check for changes in predominant groups of microflora. A change in the microbial flora might signify a change in a system that should be investigated. Characterizations can be a useful clue as to the pos-sible source of isolates. For example, Staphylococcus species are commonly found on skin and Pseudo-monas species are usually associated with water and other liquids.
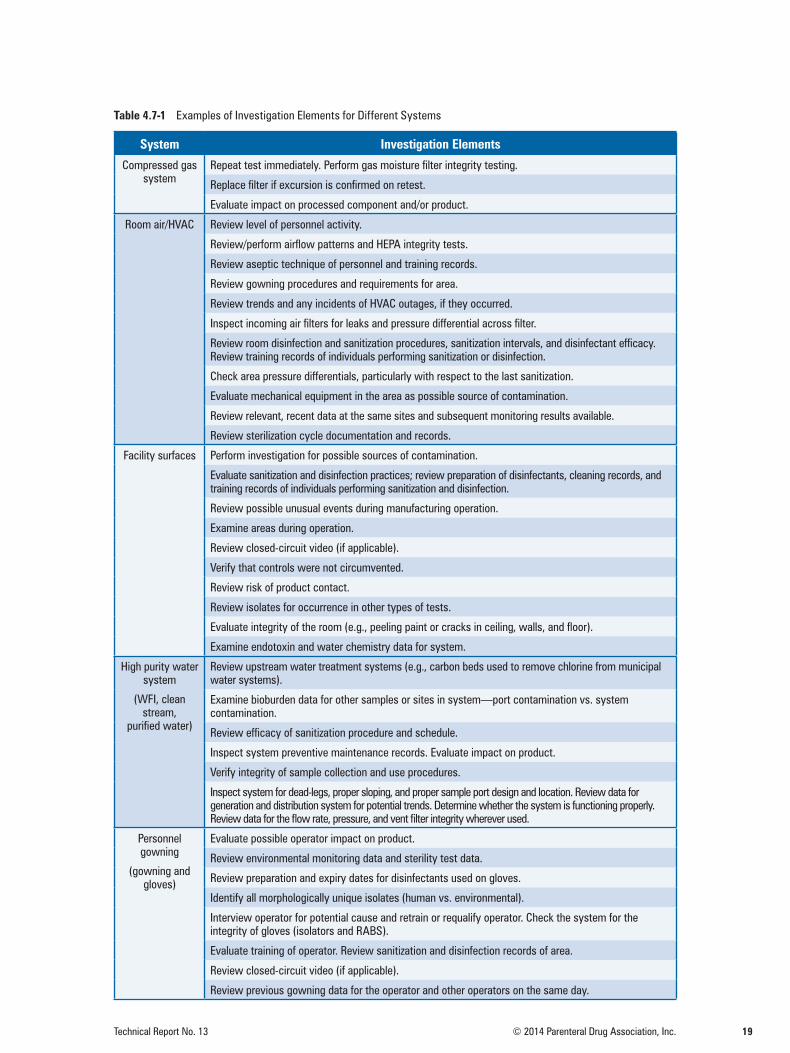
4.7 Investigations and Corrective ActionsInvestigations and corrective actions are needed in response to an action-level excursion or to address an adverse trend to determine a cause-and-effect relationship (i.e., sources of contamination). To create consistency in the treatment of excursions, investigative and/or corrective action steps should be specified in advance in a written plan. The written plan should define the level of investigation required if there are multiple or sequential excursions. Since environmental monitoring is not a re-lease test, the investigation should include product impact assessment and evaluate the risk to other products manufactured in the same time frame. Investigations and follow-up should be documented.
19Technical Report No. 13 © 2014 Parenteral Drug Association, Inc.
Table 4.7-1 Examples of Investigation Elements for Different Systems
System Investigation Elements
Compressed gas system
Repeat test immediately. Perform gas moisture filter integrity testing.
Replace filter if excursion is confirmed on retest.
Evaluate impact on processed component and/or product.
Room air/HVAC Review level of personnel activity.
Review/perform airflow patterns and HEPA integrity tests.
Review aseptic technique of personnel and training records.
Review gowning procedures and requirements for area.
Review trends and any incidents of HVAC outages, if they occurred.
Inspect incoming air filters for leaks and pressure differential across filter.
Review room disinfection and sanitization procedures, sanitization intervals, and disinfectant efficacy. Review training records of individuals performing sanitization or disinfection.
Check area pressure differentials, particularly with respect to the last sanitization.
Evaluate mechanical equipment in the area as possible source of contamination.
Review relevant, recent data at the same sites and subsequent monitoring results available.
Review sterilization cycle documentation and records.
Facility surfaces Perform investigation for possible sources of contamination.
Evaluate sanitization and disinfection practices; review preparation of disinfectants, cleaning records, and training records of individuals performing sanitization and disinfection.
Review possible unusual events during manufacturing operation.
Examine areas during operation.
Review closed-circuit video (if applicable).
Verify that controls were not circumvented.
Review risk of product contact.
Review isolates for occurrence in other types of tests.
Evaluate integrity of the room (e.g., peeling paint or cracks in ceiling, walls, and floor).
Examine endotoxin and water chemistry data for system.
High purity water system
(WFI, clean stream,
purified water)
Review upstream water treatment systems (e.g., carbon beds used to remove chlorine from municipal water systems).
Examine bioburden data for other samples or sites in system—port contamination vs. system contamination.
Review efficacy of sanitization procedure and schedule.
Inspect system preventive maintenance records. Evaluate impact on product.
Verify integrity of sample collection and use procedures.
Inspect system for dead-legs, proper sloping, and proper sample port design and location. Review data for generation and distribution system for potential trends. Determine whether the system is functioning properly. Review data for the flow rate, pressure, and vent filter integrity wherever used.
Personnel gowning
(gowning and gloves)
Evaluate possible operator impact on product.
Review environmental monitoring data and sterility test data.
Review preparation and expiry dates for disinfectants used on gloves.
Identify all morphologically unique isolates (human vs. environmental).
Interview operator for potential cause and retrain or requalify operator. Check the system for the integrity of gloves (isolators and RABS).
Evaluate training of operator. Review sanitization and disinfection records of area.
Review closed-circuit video (if applicable).
Review previous gowning data for the operator and other operators on the same day.
20 © 2014 Parenteral Drug Association, Inc. Technical Report No. 13
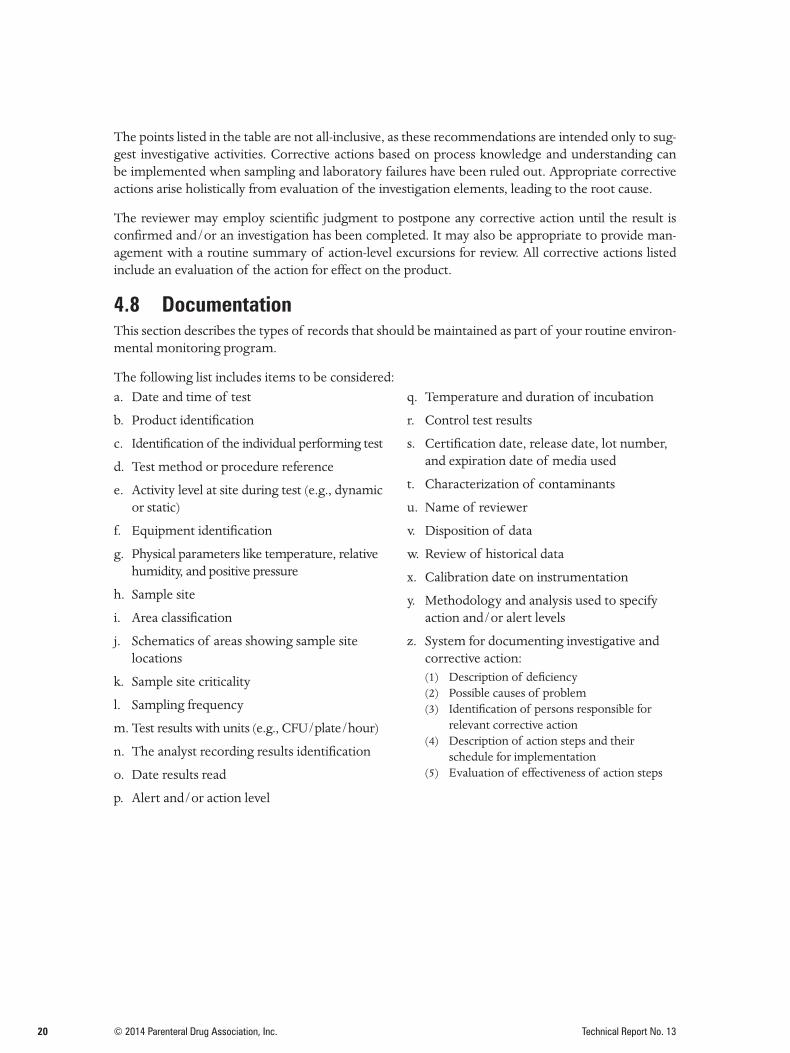
The points listed in the table are not all-inclusive, as these recommendations are intended only to sug-gest investigative activities. Corrective actions based on process knowledge and understanding can be implemented when sampling and laboratory failures have been ruled out. Appropriate corrective actions arise holistically from evaluation of the investigation elements, leading to the root cause.
The reviewer may employ scientific judgment to postpone any corrective action until the result is confirmed and/or an investigation has been completed. It may also be appropriate to provide man-agement with a routine summary of action-level excursions for review. All corrective actions listed include an evaluation of the action for effect on the product.
4.8 DocumentationThis section describes the types of records that should be maintained as part of your routine environ-mental monitoring program.
The following list includes items to be considered:a. Date and time of test
b. Product identification
c. Identification of the individual performing test
d. Test method or procedure reference
e. Activity level at site during test (e.g., dynamicor static)
f. Equipment identification
g. Physical parameters like temperature, relativehumidity, and positive pressure
h. Sample site
i. Area classification
j. Schematics of areas showing sample sitelocations
k. Sample site criticality
l. Sampling frequency
m. Test results with units (e.g., CFU/plate/hour)
n. The analyst recording results identification
o. Date results read
p. Alert and/or action level
q. Temperature and duration of incubation
r. Control test results
s. Certification date, release date, lot number,and expiration date of media used
t. Characterization of contaminants
u. Name of reviewer
v. Disposition of data
w. Review of historical data
x. Calibration date on instrumentation
y. Methodology and analysis used to specifyaction and/or alert levels
z. System for documenting investigative andcorrective action:(1) Description of deficiency(2) Possible causes of problem(3) Identification of persons responsible for
relevant corrective action(4) Description of action steps and their
schedule for implementation(5) Evaluation of effectiveness of action steps
21Technical Report No. 13 © 2014 Parenteral Drug Association, Inc.
This section describes the types of ongoing monitoring to be conducted once a system is established and controlled. The levels and types of monitoring conducted may vary based on the type of product being manufactured, the attributes of the product, and the manufacturing areas and processes used.
[Publisher’s Note: Additional information can be found in many published works on environmental monitoring. This chapter draws heavily on information found in the Bibliography; see 7.0 Bibliography.]
5.1 Terminal SterilizationThe terminal sterilization environmental control program includes the monitoring of microflora from all sources (e.g., components, containers, raw materials, the manufacturing environment, pro-cess gases, water used in product formulations, and sterilizer feed/cooling water) that have the po-tential to contribute to product bioburden or endotoxin. This includes testing of air, surfaces, purified water and water for injection, plus other grades of water if used in the sterilization process.
Microbial levels of incoming containers and closures may also be periodically monitored (e.g., if the product is not terminally sterilized using an overkill cycle). While control of the environment in which the products are prepared is important, the most critical aspect of the program is the biobur-den, including both the number and type of microorganisms found, of the product and components to be sterilized. Controlling this aspect of the manufacturing process ensures that the spore (heat-resistant) bioburden levels presented to the product sterilization cycle do not exceed the validated capabilities of the process and that the desired sterility assurance levels are achieved.
The microbial count of the presterilization bioburden represents a point in time in the trend of the bioburden; however, species identification may indicate a shift in the bioburden composition that could affect the sterility assurance of the product. Therefore, the sterilization process may need to be revalidated [e.g., irradiation, dry heat, ethylene oxide (EO), or moist heat], or it may contribute to endotoxin levels following sterilization.]
5.2 Aseptic ProcessingThe aseptic environmental control program is specifically designed to determine the number and type of microorganisms associated with direct assembly or preparation of product prior to sealing of the filled containers. The number of sample sites and frequency of monitoring are generally greater than those for established terminal sterilization programs. Air, water, personnel, compressed gases, machinery, and other surfaces within the filling room and associated support areas are routinely mon-itored. Microbial levels may be periodically checked on incoming containers and closures. Adequate environmental control is an integral part of the aseptic manufacturing process and is a critical factor in contributing to sterility assurance. Environmental monitoring data must be part of the review prior to product batch release. In cases where operator interventions are required in the cooling zones of a depyrogenation tunnel, environmental monitoring should also be conducted.
5.3 Isolation TechnologyThe EM program for isolators is different from conventional aseptic filling operations based on the risks associated with isolator technology (e.g., half suits and gloves, VHP ingress in traditionally pack-aged plates). In some cases, it may be appropriate to also collect surface samples. When periodic surface monitoring is performed, it should be done after the completion of the filling operation or campaign so as to not introduce any extraneous contamination or residual growth media during the filling activities. Monitoring of personnel (outside of the isolator environment) is not required; how-ever, monitoring of isolator gloves and half suits is required at the end of each filling operation to detect contamination that may have been derived from a pinhole leak or loss of integrity.
5.0 Environmental Monitoring by Application
22 © 2014 Parenteral Drug Association, Inc. Technical Report No. 13
5.4 Water Although water is used as a raw material in the production, processing, and formulation of products, this document addresses the process monitoring of the water for microbial attributes. Most countries have compendial requirements for evaluation of water quality (19-23).
The selection of the type of water used for manufacturing is based on the type of product and process being used. The water quality should be evaluated for microbial, bacterial endotoxin, and chemical at-tributes in accordance with the type of water and applicable compendial or regulatory requirements. Water quality is critical for the manufacturing of parenteral drugs and selected devices because it is used in product formulation as well as product-contact component and equipment washing and final rinsing of equipment and devices. When purified water or highly purified water is used for the manufacturing of other types of products or intermediates (e.g., solid dosage forms, API, small mol-ecules) the control of microbial quality is critical to minimize the buildup and spread of microbial contaminants in the facility as well as manufacturing equipment. The quality of the laboratory water should meet the needs of analytical methods and technologies; this may require compendial-quality laboratory water.
5.4.1 Sample Site Selection and Frequency of Monitoring The sampling and frequency of monitoring for the water systems should be sufficient to ensure that the water quality meets its intended use specifications and appropriate regulatory requirements.
The frequency of monitoring and sampling site selection depends on the type of water and manu-facturing process, system configuration, and facility design. The frequency of sampling should be designed to facilitate detection and analysis of trends in microbial flora and bacterial endotoxin.
High-purity water systems should be validated to demonstrate that design requirements are consis-tently met and maintain a state of control. The site selection and frequency determination should be justified by thorough review of the water system validation performed and, using risk-based ap-proaches, by type of product and manufacturing processes in concert with pharmacopeia and regula-tory requirements. Refer to Appendix A for suggested sites and sampling frequencies.
Once a water system is validated to be in a state of control, appropriate samples should be taken from the water source or generation system, holding and storage tanks, and distribution system to assess the microbiological quality for its intended use. Initial testing of water systems typically includes sam-pling after each process step. The testing of high-purity water systems should include the sampling of all point-of-use sites.
5.4.2 Sample Collection and TestingWater samples should be collected in a manner that is consistent with manufacturing practices. For example, if manufacturing flushes use points prior to use, it is appropriate for samples to be collected with the same flush cycle. On the other hand, if manufacturing does not flush use points, there should be no flush prior to sample collection. All sample sites should be in a good state of repair and fully functional to support the monitoring program. Carefully choose distribution-system sample loca-tions to demonstrate microbiological quality throughout the distribution system.
Microbiological examination of water should be initiated as soon as possible after collection of the sample. If immediate processing is not possible, refrigerate samples at 2°–8°C. Time elapsed between collection and examination typically should not exceed twelve hours, according to the USP (19).
23Technical Report No. 13 © 2014 Parenteral Drug Association, Inc.
5.5 Air Effectively designed air-handling units and usage of high-efficiency particulate air (HEPA) filters or ul-tralow particulate air (ULPA) filters bring air of appropriate quality to cleanrooms. Although the use of HEPA filters to remove particles from the air is a very effective way to reduce the particle load in an environment, especially under static conditions, normal activity levels of equipment and people in a room may greatly reduce this effectiveness. People are considered a major contributor of particulates to the environment in aseptic areas, while the product and equipment may be bigger contributors in areas where active pharmaceutical ingredients (APIs) are manufactured. The intent of an airborne environmental monitoring program is to determine if there are viable and/or nonviable airborne particulates in locations that would allow them to settle on product-contact surfaces and thereby find their way into process intermediates or final product. The analysis of trends and frequencies of viable and nonviable airborne particulates is also vital to the understanding of the environmental impact of personnel behavior and process activities.
Air-sampling methods and frequencies of monitoring may depend on manufacturing process needs. For further details, see Appendices A and B for sterile and nonsterile manufacturing, respectively.
5.5.1 Nonviable Monitoring Monitoring of nonviable airborne particulates is a necessary component of an environmental moni-toring program. Such monitoring demonstrates control of potential contaminants in the environ-ment to which the product, during the manufacturing process, is exposed. Classification of produc-tion areas can be made based on the level of nonviable particulates alone or in combination with viable particulates, depending on the application. Classified areas must consistently meet these par-ticulate levels (for further details, see Section 3).
ISO Standard 14644-1 describes, in detail, classification of air cleanliness for cleanrooms and clean zones based on specified concentrations of airborne particulates (8). It prescribes methods for veri-fying air cleanliness in the traditional particulate size range (i.e., 0.5 and 5 μm). For purposes other than classification, it is not necessary for the sample volume to be the same as that used for formal classification of cleanrooms.
For products marketed within the United States, the FDA requires that nonviable particles in the range of 0.5 μm or larger be monitored during routine manufacturing operations in a sample volume of 1 cubic meter for classification purposes and Grade A areas (13). Requirements outside of the United States (e.g., EU Annex 1) include monitoring greater than or equal to 5.0 μm particles, in addition to 0.5 μm particles in a sample volume of 1 cubic meter for classification purposes and in Grade A areas (10).
For aseptic processes, some regulatory guidance documents require monitoring in each production shift. Some regulators recommend remote counting systems and continuous monitoring. For remote systems, the distance from the sample collection port to the detection or quantification technology should be taken into account for the potential of particle loss. Continuous monitoring of particles is required for aseptic processing rooms of ISO 5 classification during operation.
The sites selected for monitoring of nonviable counts should be based on a risk assessment of the following:
• Classification and size of the area being monitored
• Criticality of operation
• Characterization of the area, such as qualification and smoke studies
24 © 2014 Parenteral Drug Association, Inc. Technical Report No. 13
Routine monitoring of nonviable particles should be performed approximately one foot (approxi-mately 0.3 m) away from the work site when possible. However, sampling should not be intrusive to the process.
5.5.2 Viable ParticulatesViable particulate determinations are critical in monitoring air quality in controlled environments. Current growth-based techniques for monitoring viable particulates in air are limited by:
• Type of equipment
• Incubation time
• Operator contamination of the capture media
5.5.2.1 Sampling SitesThe principles previously mentioned for site selection in Section 4.2 apply here as well.
5.5.2.2 MethodsMost regulatory agencies currently require active air sampling of environments on a routine basis to demonstrate control of possible viable airborne particulates. Additionally, some agencies find that passive sampling methods such as settling plates should be performed. Generally, active sampling methods are required, with operating levels being defined per unit volume of air. Both active and passive sampling methods may be used in concert to gain knowledge and understanding of changes and trends in the cleanroom environment. Active sampling methods have the benefit of sampling large homogeneous volumes of air in short amounts of time, but these methods may cause disrup-tions in the airflow of the environment being sampled. Alternatively, passive sampling methods can be used for longer durations of time, without modifying the airflow of the environment. However, these methods tend to be semiquantitative. In either case, it is important to use good science in the implementation of the sampling program.
5.5.2.3 EquipmentMicrobial air samplers are typically based on two principles for the capture detection of microor-ganisms: inertial impaction and centrifugation to capture and deposit the organisms on the media surface. No microbial air samplers currently manufactured are 100% efficient at detecting all of the viable particles present. The term used to describe this efficiency is cutoff size. Very good samplers may have efficiency values in the range of 80%. Most sampling devices are available as systems for sampling room air and compressed gases.
The requirements for validation of samplers are the responsibility of the manufacturer. Data present-ed by the manufacturer of the device should be sufficient to implement the sampling device. Users need to qualify the equipment. Typical user requirements are:
• Calibration of the instrument
• Verification of volume accuracy
• Commissioning
Alternative microbiological methods may require more extensive validation. For a discussion of this topic in greater detail, refer to PDA Technical Report No. 33 (Revised 2013): Evaluation, Validation and Implementation of Alternative and Rapid Microbiological Methods (24).
25Technical Report No. 13 © 2014 Parenteral Drug Association, Inc.
5.6 Compressed Gas Monitoring The use of compressed air and compressed gas in the aseptic ISO 5 environment may adversely affect the environmental conditions if appropriate precautions, routine testing, and critical assurances are not developed into a system. This section offers some points that should be considered.
Nitrogen gas, which is heavier than air, is frequently used as a blanket in some applications. Argon, which is lighter than air, may also be used. The flow rates on the sampling device should be adjusted to account for these differences. Elevation may also play a role in adjusting flow. Accurate sampling includes taking these variations into consideration.
It is common practice to use a 0.2 μm filter on the compressed gas line prior to entry into the cleanroom. Integrity testing of the filter may reduce the need for sampling. The sampling equipment must be compat-ible for use with compressed gases. A prefilter may be installed in the system to reduce the bioburden to the point-of-use filter that will extend its life and reduce the possibility of higher contamination reaching the area.
The particulate or bioburden level of any gas or air expelled into the environment should be equal to or better than the classification level of the room (10).
5.7 Surface MonitoringIn addition to conducting viable and nonviable air monitoring to determine the microbial contami-nants and particulates surrounding the manufacturing operations, surface monitoring is conducted to determine the microbial bioburden of surfaces within the manufacturing area as well as on equip-ment non-product- and product-contact surfaces. Routine microbiological monitoring of personnel garments and gloves should be completed to assess the ongoing practice of aseptic technique.
5.7.1 Test MethodsThe method of testing should be considered before and during the time that the sampling plan is established. The method needs to be suitable for the surface type and ability to sample. The methods can provide qualita-tive or quantitative information. The accuracy of the sampling is also affected by the collection and handling of samples. Proper training is essential to an effective monitoring program. The type of media used will de-termine the ability to detect the representative flora from the sample site. Neutralizers may be added in the media to inactivate chemical disinfectants on surfaces. The basic methods are contact plates, flexible films, swabs, and surface rinses. Each provides data that can be used to assess environmental quality.
Recovery levels of surface-monitoring methods are typically low, due to variability in sampling pro-cedure, analytical methods being employed (i.e., dilution), and the use of growth-based techniques. However, repeatable and consistent sampling techniques will yield quantitative data that are able to be trended and analyzed over periods of time. These trends and data provide key insights into the potential impact of activity in the environment being assessed.
The use of the following procedures should be validated to provide information that is useful to the ongoing environmental monitoring program within the cleanroom.
5.7.1.1 Contact PlatesContact plates are easy to use and provide quantitative results. The plates are filled with sufficient neu-tralizing media to provide a convex surface to support growth of the microorganisms. The contact plate is pressed against a flat surface by gently rolling the plate from front to back on the sample area. The sample plate is then placed in an incubator for the required period of time as determined during method validation. Colonies, if present, are counted at the end of the incubation.
26 © 2014 Parenteral Drug Association, Inc. Technical Report No. 13
Prior to use, the type of media and incubation conditions must be qualified. Such qualification may include laboratory studies using the compendial growth promotion organisms and/or representative organisms recovered from the facility environment. The use of irradiated plates in ISO 5 areas is rec-ommended. Contact plates should be brought to room temperature to minimize confluent organism growth due to condensation.
Contact plates are not suitable for sampling irregular surfaces, and they leave a media residual that must be removed from the sample site.
5.7.1.2 Flexible FilmsA flexible film containing media may be used in a similar manner to a contact plate. These films can also pro-vide a defined sampling area. The surface of the media film is pressed against a flat surface in a rolling motion to ensure full contact of the flexible film. The film is then placed in the incubator for the required period of time as determined during method validation. Colonies, if present, are counted at the end of the incubation. Like the contact plate, flexible films leave a media residual that must be removed from the sample site.
5.7.1.3 SwabsThis method is employed for equipment and irregular surfaces that are not suitable for contact plates. Swabbing can be used on flat surfaces provided a template is used to define the sample size—approxi-mately 2 inches by 2 inches (approximately 25 cm²).
The method employs swabs composed of materials such as Dacron, nylon, or calcium alginate and manufactured in a flocked or spun material format. Each requires an appropriate diluent in which the swab is vortexed prior to plating. Swabs may provide qualitative or quantitative results based on how they are processed after sampling. A direct swab method, in which a moistened swab is used to sample the defined area and is then rolled directly on an agar plate, may be used. With calcium algi-nate swabs, the swab fi ber is dissolved, thus releasing the organisms into the solution for plating. As with all methods, swab recovery should be qualified (25).
5.7.1.4 Surface Rinse MethodThis method is best used for a large surface area where the interior surface bioburden determination is needed. This includes kettles, equipment, trains, and tanks. Sterile water is usually the diluent that comes in contact with the interior surface and then is collected and tested. Membrane filtration is used to test the rinse water because of the large sample volume.
5.8 Personnel 5.8.1 IntroductionPersonnel are the primary source of contamination; therefore, it is essential that all cleanroom per-sonnel (including maintenance and others who enter periodically) be carefully selected, qualified, and monitored before entering an aseptic environment.
The qualification training should include the following topics:
• Attention to personal hygiene
• Basic microbiology education or background
• Aseptic techniques
• Appropriate cleanroom behavior
• Patient safety hazards posed by a contaminatedproduct
• Gowning certification
• Participation in aseptic-processing simulationactivities (media fills), where applicable
27Technical Report No. 13 © 2014 Parenteral Drug Association, Inc.
After initial training, personnel should participate regularly in an ongoing training and monitoring pro-gram. Supervisory personnel should routinely evaluate each operator’s conformance to written proce-dures during actual operations. Similarly, the quality control unit should provide regular oversight of adherence to established, written procedures and aseptic technique during manufacturing operations.
5.8.2 Training and Certification of Personnel for Aseptic Manufacturing Areas
A representative description of microbiological training programs is included in PDA Technical Report No. 35: A Proposed Training Model for the Microbiological Function in the Pharmaceutical Industry (26). All training and certification activities should be documented and kept as part of the employee file.
5.8.3 Causes for Requalification or Retraining Companies should have a policy stating when requalification or retraining is necessary. For example:
• Retraining on general aseptic practices and techniques should be provided at least annually.
• Recertification should be required after extended absences (e.g., for illness or family leave).
• Recertification and/or retraining should be considered as corrective action for trends in personnelmonitoring excursions.
5.9 Environmental Monitoring During Product Sterility TestingSterility-testing facilities should be monitored to demonstrate microbial contamination control (4,10,13). Routine types of monitoring that are conducted are as follows:
• Viable air monitoring
• Surface monitoring
• Personnel monitoring
28 © 2014 Parenteral Drug Association, Inc. Technical Report No. 13
1. Technical Report No. 22: Process Simulation Testing forAseptically Filled Products; Parenteral Drug Associa-tion: 1996. www.pda.org/bookstore.
2. General Chapter <1072> Disinfectants and Antiseptics. USP 32/NF 27; U.S. Pharmacopeia: 2009. www.usp.org.
3. Technical Report No. 30 (Revised 2012): Parametric Re-lease of Pharmaceutical and Medical Device ProductsTerminally Sterilized by Moist Heat; Parenteral DrugAssociation: 2012. www.pda.org/bookstore.
4. Technical Report No. 62: Recommended Practices forManual Aseptic Processes; Parenteral Drug Associa-tion: 2013. www.pda.org/bookstore (accessed De-cember 16, 2013).
5. Technical Report No. 44: Quality Risk Managementfor Aseptic Processes; Parenteral Drug Association:2008. www.pda.org/bookstore (accessed Novem-ber 27, 2013).
6. Quality Guideline Q9: Quality Risk Management;International Conference on Harmonisation: 2005. www.ich.org (accessed November 27, 2013).
7. ISO 14937:2009. Sterilization of health care products– General requirements for characterization of asterilizing agent and the development, validation and routine control of a sterilization process for medical devices: 2009. www.iso.org (accessed May 8, 2014).
8. ISO 14644-1:1999. Cleanrooms and Associated Con-trolled Environments—Part 1: Classification of AirCleanliness; International Organization for Standardiza-tion: 1999. www.iso.org (accessed November 27, 2013).
9. General Chapter <1116> Microbiological Controland Monitoring of Aseptic Processing Environ-ments. USP 36/NF 31; U.S. Pharmacopeia: 2012.www.usp.org.
10. EudraLex, The Rules Governing Medicinal Products in theEuropean Union: Volume 4, EU Guidelines to Good Manu-facturing Practices for Medicinal Products for Human andVeterinary Use—Annex 1, Manufacture of Sterile Medici-nal Products; European Commission: 2008. ec.europa.eu/health/files/eudralex/vol-4/2008_11_25_gmp-an1_en.pdf (accessed November 27, 2013).
11. WHO Technical Report Series 957: Annex 4, WHOGood Manufacturing Practices for Sterile Pharma-ceutical Products; World Health Organization: 2010.whqlibdoc.who.int/trs/WHO_TRS_957_eng.pdf(accessed April 22, 2014).
12. Japanese Pharmacopeia 15—Supplement 1, Chapter4.05: General Tests, Processes and Apparatus—Mi-crobial Examination of Non-sterile Products; Japa-nese Pharmacopeia: 2004. www.pmda.go.jp/eng-lish/pharmacopoeia/pdf/jpdata/jp15sp1_en.pdf(accessed November 27, 2013).
13. Guidance for Industry: Sterile Drug Products Producedby Aseptic Processing—Current Good Manufactur-ing Practice; U.S. Food and Drug Administration:2004. www.fda.gov/downloads/Drugs/Guidance-ComplianceRegulatoryInformation/Guidances/UCM070342.pdf (accessed November 27, 2013).
14. Technical Report No. 29: Points to Consider for CleaningValidation; Parenteral Drug Association: 1998. www.pda.org/bookstore (accessed November 27, 2013).
15. Baseline Guide, Vol. 3: Sterile Product Manufactur-ing Facilities; ISPE: 2011. www.ispe.org/baseline-guides/sterile-manufacturing#sthash.brLCwTXs.dpuf (accessed November 27, 2013).
16. Gaison, E. Controlling Microbiological Contami-nation: Standards, Techniques, and a Case Study.Med. Dev. Diag. Ind. 1988, 10 (2), 34–39, 66.
17. Technical Report No. 59: Utilization of StatisticalMethods for Production Monitoring; Parenteral DrugAssociation: 2012. www.pda.org/bookstore (ac-cessed February 19, 2014).
18. Hussong, D.; Madsen, R. Analysis of Environmen-tal Microbiology Data from Cleanroom Samples.In Aseptic Processing, special issue, Pharm. Technol. 2004, 10–15.
19. General Chapter <1231> Water for Pharmaceuti-cal Purposes. USP 29/NF 25; U.S. Pharmacopeia:2009. www.usp.org.
20. General Chapter <643> Total Organic Carbon. USP36/NF 31; U.S. Pharmacopeia: 2012. www.usp.org.
21. EP 5.0 Purified Water Monograph 2.2.44 Total OrganicCarbon in Water for Pharmaceutical Use; EuropeanPharmacopoeia: 2005. lib.njutcm.edu.cn/yaodian/ep/EP5.0/02_methods_of_analysis/2.2.__physical_and_physicochemical_methods/2.2.45.%20Supercritical%20fluid%20chromatography.pdf (accessed May 5, 2014).
22. Japanese Pharmacopeia 16—General InformationChapter G8: Water. Japanese Pharmacopeia: 2012.jpdb.nihs.go.jp/jp16supp1e/jp16e-1.pdf (accessedJanuary 13, 2014).
6.0 References
29Technical Report No. 13 © 2014 Parenteral Drug Association, Inc.
23. Rice, E.W.; Baird, R.B.; Eaton, A.D.; Clesceri, L.S.,Eds. Standard Methods for the Examination of Waterand Wastewater, 22nd ed.; American Public HealthAssociation Publications, 2012.
24. Technical Report No. 33 (Revised 2013): Evaluation,Validation and Implementation of Alternative andRapid Microbiological Methods; Parenteral Drug As-sociation: 2013. www.pda.org/bookstore (accessed December 16, 2013).
25. Dalmaso, G., et al. Qualification of High-Recovery,Flocked Swabs as Compared to Traditional RayonSwabs for Microbiological Environmental Moni-toring of Surfaces. PDA J. Pharm. Sci. Technol. 2008,62, 191–199.
26. Technical Report No. 35: A Proposed Training Modelfor the Microbiological Function in the PharmaceuticalIndustry; Parenteral Drug Association: 2001. www.pda.org/bookstore (accessed June 10, 2014).
30 © 2014 Parenteral Drug Association, Inc. Technical Report No. 13
7.0 Bibliography
1. Abdou, M.A.F. Determination of Airborne Microorganisms in a Pharmaceutical Plant Using Standard, Electiveand Selective Culture Media. Pharm. Tech. 1980, 4, 93–100.
2. Akers, J. Interview with James Akers on Revised USP <1116>. PDA Letter, 2012, March, 28–30.
3. Avallone, H. Cleanroom Design, Control, and Characterization. Pharm. Eng. 1982, 46, 33–34.
4. Avallone, H. Control Aspects of Aseptically Produced Products. J. Parenter. Sci. Tech. 1985, 39, 75–79.
5. Bacteriological Analytical Manual (BAM) for Foods, Chapter IV, Aerobic Plate Count; U.S. Food and Drug Ad-ministration: 1978.
6. Bond, R. et al. Development of a Method for Microbiological Sampling of Surfaces, with Special Reference toReliability; Final report under contract PH-86-182, Division of Hospital and Medical Facilities, Bureau of StateServices, Public Health Service; U.S. Department of Health, Education and Welfare: Washington, DC, 1963.
7. Cannon, R.Y., et al. Microbiological Tests for Equipment, Supplies and Water. In Standard Methods for the Ex-amination of Dairy Products, 13th ed. J. Hausler, Ed. American Public Health Association:, Washington, DC,1965; pp. 188–194.
8. Committee on Microbial Contamination of Surfaces of the Laboratory Section of the American Public HealthAssociation: A Cooperative Microbiological Evaluation of Floor-Cleaning Procedures in Hospital PatientRooms. Health Lab. Sci. 1970, 7, 256–264.
9. Conover, W.J., Ed. Practical Nonparametric Statistics, 3rd ed.; J. Wiley & Sons: New York, 1999; pp.150–155.
10. Contamination Control Requirements Manual, JPG 5322.1; NASA, Washington, DC, 2000. paso.esa.int/5_training_materials/training_07_contam%20control.pdf (accessed February 19, 2014).
11. Cox, C. The Aerobiological Parkway of Microorganisms; John Wiley and Sons, Inc.: New York, 1987.
12. Dell, L. Aspects of Microbiological Monitoring for Nonsterile and Sterile Manufacturing Environments. Pharm. Technol. 1979, 3, 47–51.
13. Deschenes, P. Environmental Monitoring of Viables: Surface Testing the Program and Applications; PDA/IESJoint Conference on Controlled/Classified and Microenvironments, February 1992.
14. Detection and Analysis of Contamination. Millipore: ADM-30, 1965; ADM-40, 1965.
15. Eaton, A.D.; Clesceri, L.S.; Greenberg, A.E., Eds. Standard Procedures for the Microbial Examination of SpaceHardware; NASA Planetary Quarantine Office, June 1966. archive.org/details/nasa_techdoc_19800011468 (ac-cessed February 19, 2014).
16. Favero et al. Environmental Microbiology and the Control of Microbial Contamination. Spacecraft Sterilization Technology, NASA, SP-108, 1965, 51–86.
17. FDA Compliance Program Guidance Manual—Chapter 56: Drug Quality Assurance: Sterile Drug Process In-spections. Program 7356.002A; U.S. Food and Drug Administration: 2012. www.fda.gov/downloads/ICECI/ComplianceManuals/ComplianceProgramManual/ucm125409.pdf (accessed January 13, 2014).
18. Fifield, C.; Leahy, T. Disinfection, Sterilization and Preservation, 3rd ed.; Lea and Febiger: Philadelphia, 1983;pp. 125–153.
19. Frieben, W. Control of the Aseptic Processing Environment. Am. J. Hosp. Pharm. 1983, 40, 1928–1935.
20. General Chapter <1113> Microbial Characterization, Identification, and Strain Typing. USP 35/NF 30; U.S.Pharmacopeia: 2012. www.usp.org.
21. General Chapter <1208> Sterility Testing—Validation of Isolator Systems. USP 29/NF 24 ; U.S. Pharmacopeia:2012. www.usp.org.
22. Hall, L.B.; Hartnett, M.J. Measurement of the Bacterial Contamination on Surfaces in Hospitals. Pub. HealthRep. 1964, 79, 1021–1024.
23. ISO 13408-1:2011. Aseptic Processing of Health Care Products—Part 1, General Requirements; InternationalOrganization for Standardization: 2011. www.iso.org (accessed November 27, 2013).
31Technical Report No. 13 © 2014 Parenteral Drug Association, Inc.
24. ISO 14644-2:2005. Cleanrooms and Associated Controlled Environments—Part 2, Specifications for Testing and Monitoring to Prove Continued Compliance with ISO 14644-1; International Organization for Standardization:2005. www.iso.org (accessed November 27, 2013).
25. ISO 14644-3:2005. Cleanrooms and Associated Controlled Environments—Part 3, Test Methods; InternationalOrganization for Standardization: 2005. www.iso.org (accessed November 27, 2013).
26. ISO 14644-4:2001. Cleanrooms and Associated Controlled Environments—Part 4, Design, Construction andStart-up; International Organization for Standardization: 2001. www.iso.org (accessed November 27, 2013).
27. ISO 14644-5:2004. Cleanrooms and Associated Controlled Environments—Part 5, Operations; InternationalOrganization for Standardization: 2004. www.iso.org (accessed November 27, 2013).
28. ISO 14644-6:2007. Cleanrooms and Associated Controlled Environments—Part 6, Vocabulary; InternationalOrganization for Standardization: 2007. www.iso.org (accessed November 27, 2013).
29. ISO 14644-7:2004. Cleanrooms and Associated Controlled Environments—Part 7, Separative Devices (Clean Air Hoods, Gloveboxes, Isolators and Mini-environments); International Organization for Standardization: 2004.www.iso.org (accessed November 27, 2013).
30. ISO 14644-8:2006. Cleanrooms and Associated Controlled Environments—Part 8, Classification of AirborneMolecular Contamination; International Organization for Standardization: 2006. www.iso.org (accessed No-vember 27, 2013).
31. ISPE Definition: Restricted Access Barrier Systems (RABS) for Aseptic Processing. Pharm. Eng. 2005, 25, 6.
32. Kraidman, G. The Microbiology of Airborne Contamination and Air Sampling. Drug and Cosmetic Industry1975, 116, 40–45.
33. Lord, T. Microbes and cGMP. Pharm. Technol. 1989, 13, 36–38.
34. McCullough, K.Z. Environmental Factors Influencing Aseptic Areas. Pharm. Eng. 1987, 7, 17–20.
35. McDade, J., et al. Control of Microbial Contamination, NASA National Conference on Spacecraft SterilizationTechnology, Pasadena, California, 1965.
36. Michaelsen, G., et al. The Bacteriology of Cleanrooms. NASA, CR-890, 1967.
37. Michaelsen, G.S., et al. The Bacteriology of Cleanrooms, NASA, CR-890, 1967.
38. Quison, R. et al. A Neutralizing Medium for Evaluating the Germicidal Potency of the Quaternary Ammonium Salts. Am. J. Pharm. 1946, 118, 320–323.
39. Recommended Practice for Testing Cleanrooms, RP-CC-006.2; Institute of Environmental Sciences: MountProspect, IL, 1997.
40. Sorenson, R. Contamination Control in Pharmaceutical Manufacturing. In Proceedings of the 32nd AnnualTechnical Meeting of the Institute of Environmental Sciences. 1986, 565–567.
41. Sykes, I. Microbial Aspects of Environmental Control in the Manufacture of Pharmaceuticals, Part 2. Br. J.Pharm. Pract. 1983, 5, 7–13.
42. Technical Monograph No. 15: Restricted Access Barrier Systems (RABs); Pharmaceutical and Healthcare Sci-ences Society: 2011. http://phss.site-ym.com/ (accessed January 13, 2014).
43. Technical Report No. 1(Revised 2007): Validation of Moist Heat Sterilization Processes: Cycle Design, Develop-ment, Qualification and Ongoing Control; Parenteral Drug Association: 2007. www.pda.org/bookstore (ac-cessed May 8, 2014).
44. Tetzlaff, R., Regulatory Aspects of Aseptic Processing. Pharm. Technol. 1984, 8, 39–44.
45. Tsuji, K. Evaluation of Environmental Monitoring for Sterile Pharmaceutical Production. Automat. Microbiol.Immuno. 1975, 157–167.
46. Waldheim, B.J. Microbiological Control of Cleanrooms. Pharm. Eng. 1988, 8, 21–23.
47. Whyte, W., et al. Monitoring the Causes of Cleanroom Contamination. Man. Chem. Aer. News. 1979, 65–81.
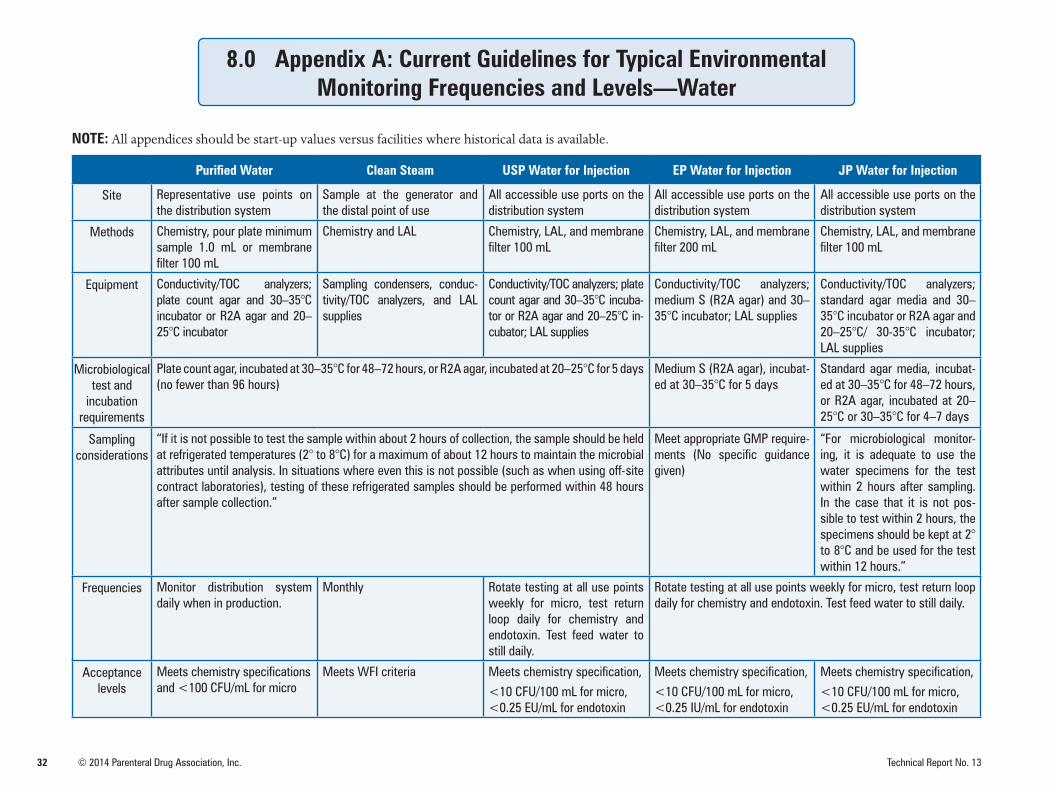
32 © 2014 Parenteral Drug Association, Inc. Technical Report No. 13
8.0 Appendix A: Current Guidelines for Typical Environmental Monitoring Frequencies and Levels—Water
NOTE: All appendices should be start-up values versus facilities where historical data is available.
Purified Water Clean Steam USP Water for Injection EP Water for Injection JP Water for Injection
Site Representative use points on the distribution system
Sample at the generator and the distal point of use
All accessible use ports on the distribution system
All accessible use ports on the distribution system
All accessible use ports on the distribution system
Methods Chemistry, pour plate minimum sample 1.0 mL or membrane filter 100 mL
Chemistry and LAL Chemistry, LAL, and membrane filter 100 mL
Chemistry, LAL, and membrane filter 200 mL
Chemistry, LAL, and membrane filter 100 mL
Equipment Conductivity/TOC analyzers; plate count agar and 30–35°C incubator or R2A agar and 20–25°C incubator
Sampling condensers, conduc-tivity/TOC analyzers, and LAL supplies
Conductivity/TOC analyzers; plate count agar and 30–35°C incuba-tor or R2A agar and 20–25°C in-cubator; LAL supplies
Conductivity/TOC analyzers; medium S (R2A agar) and 30–35°C incubator; LAL supplies
Conductivity/TOC analyzers; standard agar media and 30–35°C incubator or R2A agar and 20–25°C/ 30-35°C incubator; LAL supplies
Microbiological test and
incubation requirements
Plate count agar, incubated at 30–35°C for 48–72 hours, or R2A agar, incubated at 20–25°C for 5 days (no fewer than 96 hours)
Medium S (R2A agar), incubat-ed at 30–35°C for 5 days
Standard agar media, incubat-ed at 30–35°C for 48–72 hours, or R2A agar, incubated at 20–25°C or 30–35°C for 4–7 days
Sampling considerations
“If it is not possible to test the sample within about 2 hours of collection, the sample should be held at refrigerated temperatures (2° to 8°C) for a maximum of about 12 hours to maintain the microbial attributes until analysis. In situations where even this is not possible (such as when using off-site contract laboratories), testing of these refrigerated samples should be performed within 48 hours after sample collection.”
Meet appropriate GMP require-ments (No specific guidance given)
“For microbiological monitor-ing, it is adequate to use the water specimens for the test within 2 hours after sampling. In the case that it is not pos-sible to test within 2 hours, the specimens should be kept at 2° to 8°C and be used for the test within 12 hours.”
Frequencies Monitor distribution system daily when in production.
Monthly Rotate testing at all use points weekly for micro, test return loop daily for chemistry and endotoxin. Test feed water to still daily.
Rotate testing at all use points weekly for micro, test return loop daily for chemistry and endotoxin. Test feed water to still daily.
Acceptance levels
Meets chemistry specifications and <100 CFU/mL for micro
Meets WFI criteria Meets chemistry specification,
<10 CFU/100 mL for micro, <0.25 EU/mL for endotoxin
Meets chemistry specification,
<10 CFU/100 mL for micro, <0.25 IU/mL for endotoxin
Meets chemistry specification,
<10 CFU/100 mL for micro, <0.25 EU/mL for endotoxin
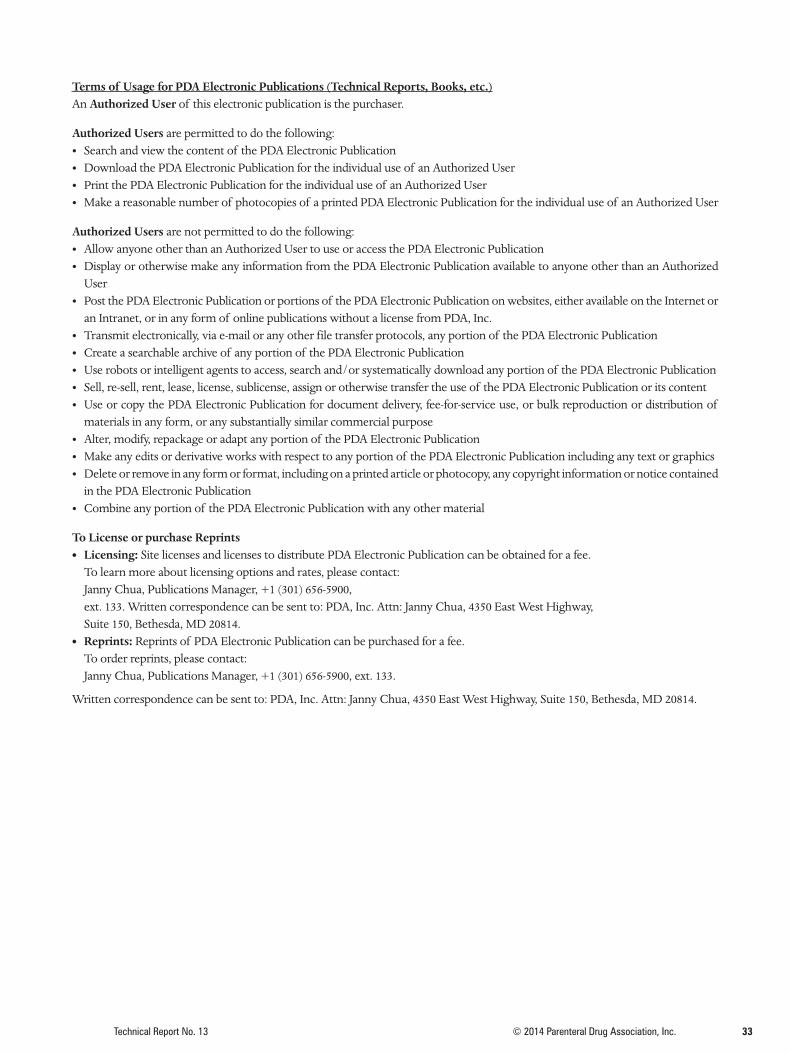
33Technical Report No. 13 © 2014 Parenteral Drug Association, Inc.
Terms of Usage for PDA Electronic Publications (Technical Reports, Books, etc.)An Authorized User of this electronic publication is the purchaser.
Authorized Users are permitted to do the following:• Search and view the content of the PDA Electronic Publication• Download the PDA Electronic Publication for the individual use of an Authorized User• Print the PDA Electronic Publication for the individual use of an Authorized User• Make a reasonable number of photocopies of a printed PDA Electronic Publication for the individual use of an Authorized User
Authorized Users are not permitted to do the following:• Allow anyone other than an Authorized User to use or access the PDA Electronic Publication• Display or otherwise make any information from the PDA Electronic Publication available to anyone other than an Authorized
User• Post the PDA Electronic Publication or portions of the PDA Electronic Publication on websites, either available on the Internet or
an Intranet, or in any form of online publications without a license from PDA, Inc.• Transmit electronically, via e-mail or any other file transfer protocols, any portion of the PDA Electronic Publication• Create a searchable archive of any portion of the PDA Electronic Publication• Use robots or intelligent agents to access, search and/or systematically download any portion of the PDA Electronic Publication• Sell, re-sell, rent, lease, license, sublicense, assign or otherwise transfer the use of the PDA Electronic Publication or its content• Use or copy the PDA Electronic Publication for document delivery, fee-for-service use, or bulk reproduction or distribution of
materials in any form, or any substantially similar commercial purpose• Alter, modify, repackage or adapt any portion of the PDA Electronic Publication• Make any edits or derivative works with respect to any portion of the PDA Electronic Publication including any text or graphics• Delete or remove in any form or format, including on a printed article or photocopy, any copyright information or notice contained
in the PDA Electronic Publication• Combine any portion of the PDA Electronic Publication with any other material
To License or purchase Reprints• Licensing: Site licenses and licenses to distribute PDA Electronic Publication can be obtained for a fee.
To learn more about licensing options and rates, please contact:Janny Chua, Publications Manager, +1 (301) 656-5900,ext. 133. Written correspondence can be sent to: PDA, Inc. Attn: Janny Chua, 4350 East West Highway,Suite 150, Bethesda, MD 20814.
• Reprints: Reprints of PDA Electronic Publication can be purchased for a fee.To order reprints, please contact:Janny Chua, Publications Manager, +1 (301) 656-5900, ext. 133.
Written correspondence can be sent to: PDA, Inc. Attn: Janny Chua, 4350 East West Highway, Suite 150, Bethesda, MD 20814.
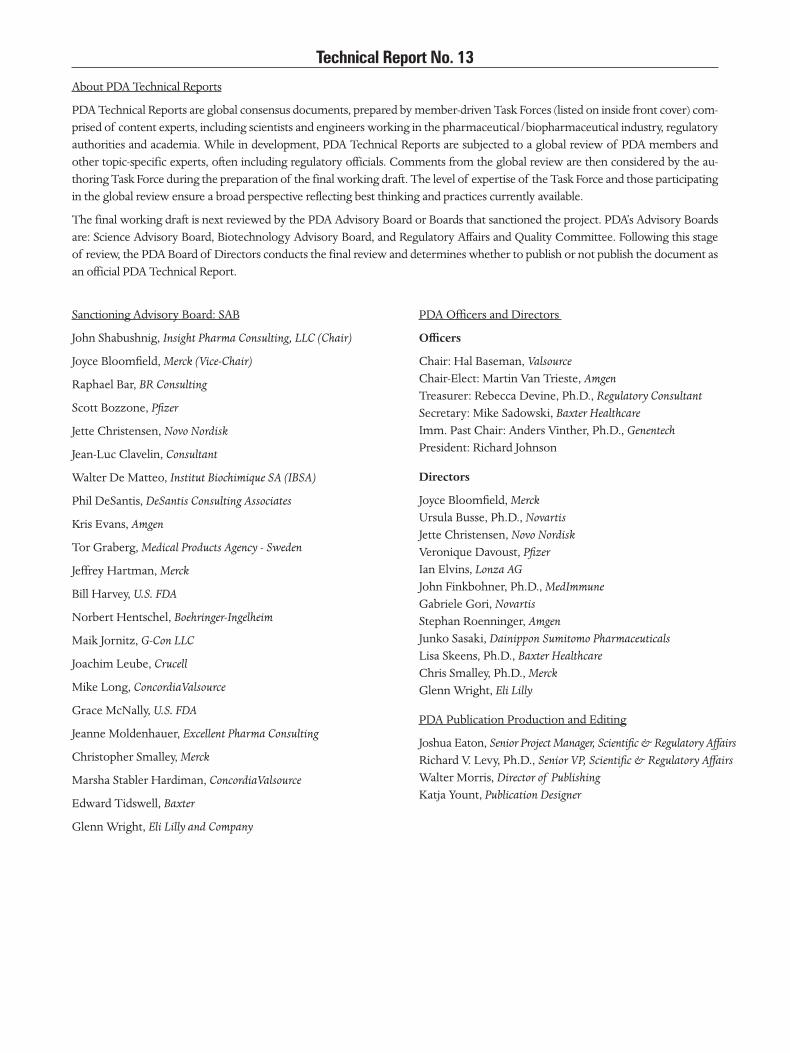
Technical Report No. 13
About PDA Technical Reports
PDA Technical Reports are global consensus documents, prepared by member-driven Task Forces (listed on inside front cover) com-prised of content experts, including scientists and engineers working in the pharmaceutical/biopharmaceutical industry, regulatory authorities and academia. While in development, PDA Technical Reports are subjected to a global review of PDA members and other topic-specific experts, often including regulatory officials. Comments from the global review are then considered by the au-thoring Task Force during the preparation of the final working draft. The level of expertise of the Task Force and those participating in the global review ensure a broad perspective reflecting best thinking and practices currently available.
The final working draft is next reviewed by the PDA Advisory Board or Boards that sanctioned the project. PDA’s Advisory Boards are: Science Advisory Board, Biotechnology Advisory Board, and Regulatory Affairs and Quality Committee. Following this stage of review, the PDA Board of Directors conducts the final review and determines whether to publish or not publish the document as an official PDA Technical Report.
PDA Officers and Directors
Officers
Chair: Hal Baseman, ValsourceChair-Elect: Martin Van Trieste, AmgenTreasurer: Rebecca Devine, Ph.D., Regulatory ConsultantSecretary: Mike Sadowski, Baxter HealthcareImm. Past Chair: Anders Vinther, Ph.D., GenentechPresident: Richard Johnson
Directors
Joyce Bloomfield, MerckUrsula Busse, Ph.D., NovartisJette Christensen, Novo NordiskVeronique Davoust, PfizerIan Elvins, Lonza AGJohn Finkbohner, Ph.D., MedImmuneGabriele Gori, NovartisStephan Roenninger, AmgenJunko Sasaki, Dainippon Sumitomo PharmaceuticalsLisa Skeens, Ph.D., Baxter HealthcareChris Smalley, Ph.D., MerckGlenn Wright, Eli Lilly
PDA Publication Production and Editing
Joshua Eaton, Senior Project Manager, Scientific & Regulatory AffairsRichard V. Levy, Ph.D., Senior VP, Scientific & Regulatory AffairsWalter Morris, Director of PublishingKatja Yount, Publication Designer
Sanctioning Advisory Board: SAB
John Shabushnig, Insight Pharma Consulting, LLC (Chair)
Joyce Bloomfield, Merck (Vice-Chair)
Raphael Bar, BR Consulting
Scott Bozzone, Pfizer
Jette Christensen, Novo Nordisk
Jean-Luc Clavelin, Consultant
Walter De Matteo, Institut Biochimique SA (IBSA)
Phil DeSantis, DeSantis Consulting Associates
Kris Evans, Amgen
Tor Graberg, Medical Products Agency - Sweden
Jeffrey Hartman, Merck
Bill Harvey, U.S. FDA
Norbert Hentschel, Boehringer-Ingelheim
Maik Jornitz, G-Con LLC
Joachim Leube, Crucell
Mike Long, ConcordiaValsource
Grace McNally, U.S. FDA
Jeanne Moldenhauer, Excellent Pharma Consulting
Christopher Smalley, Merck
Marsha Stabler Hardiman, ConcordiaValsource
Edward Tidswell, Baxter
Glenn Wright, Eli Lilly and Company
Bethesda Towers4350 East West Highway
Suite 200Bethesda, MD 20814 USA
Tel: 1 (301) 656-5900Fax: 1 (301) 986-0296
E-mail: [email protected] site: www.pda.org